US7152003B2 - Method and apparatus for determining a quality metric of a measurement of a fluid parameter - Google Patents
Method and apparatus for determining a quality metric of a measurement of a fluid parameterDownload PDFInfo
- Publication number
- US7152003B2 US7152003B2US11/011,453US1145304AUS7152003B2US 7152003 B2US7152003 B2US 7152003B2US 1145304 AUS1145304 AUS 1145304AUS 7152003 B2US7152003 B2US 7152003B2
- Authority
- US
- United States
- Prior art keywords
- velocity
- ridge
- indicative
- accumulated energy
- pairs along
- Prior art date
- Legal status (The legal status is an assumption and is not a legal conclusion. Google has not performed a legal analysis and makes no representation as to the accuracy of the status listed.)
- Expired - Lifetime
Links
- 239000012530fluidSubstances0.000titleclaimsabstractdescription88
- 238000013442quality metricsMethods0.000titleclaimsabstractdescription51
- 238000000034methodMethods0.000titleclaimsdescription92
- 238000005259measurementMethods0.000titleclaimsdescription15
- 239000006185dispersionSubstances0.000claimsdescription9
- 230000004044responseEffects0.000claimsdescription7
- 238000004590computer programMethods0.000claimsdescription6
- 239000002033PVDF binderSubstances0.000claimsdescription5
- 229920002981polyvinylidene fluoridePolymers0.000claimsdescription5
- 238000006073displacement reactionMethods0.000claimsdescription2
- 230000003287optical effectEffects0.000claimsdescription2
- 239000000203mixtureSubstances0.000description43
- 230000008569processEffects0.000description41
- 239000002245particleSubstances0.000description37
- 238000012545processingMethods0.000description22
- 230000006870functionEffects0.000description21
- 239000007789gasSubstances0.000description18
- 230000001902propagating effectEffects0.000description15
- 239000012071phaseSubstances0.000description14
- 230000000875corresponding effectEffects0.000description13
- 239000007788liquidSubstances0.000description12
- 230000002123temporal effectEffects0.000description10
- 230000000694effectsEffects0.000description9
- 239000000446fuelSubstances0.000description9
- 239000003245coalSubstances0.000description7
- 238000005070samplingMethods0.000description7
- 230000003595spectral effectEffects0.000description5
- 230000003044adaptive effectEffects0.000description4
- 230000006399behaviorEffects0.000description4
- 230000006835compressionEffects0.000description4
- 238000007906compressionMethods0.000description4
- 238000005516engineering processMethods0.000description4
- 239000007787solidSubstances0.000description4
- 238000012935AveragingMethods0.000description3
- 230000002596correlated effectEffects0.000description3
- 238000001514detection methodMethods0.000description3
- 238000010586diagramMethods0.000description3
- 239000000463materialSubstances0.000description3
- 230000035945sensitivityEffects0.000description3
- 238000007792additionMethods0.000description2
- 238000013459approachMethods0.000description2
- 238000003491arrayMethods0.000description2
- 230000008901benefitEffects0.000description2
- 229920001577copolymerPolymers0.000description2
- 239000013078crystalSubstances0.000description2
- 238000000354decomposition reactionMethods0.000description2
- 230000001934delayEffects0.000description2
- 238000000605extractionMethods0.000description2
- 238000011068loading methodMethods0.000description2
- 238000004377microelectronicMethods0.000description2
- 238000012986modificationMethods0.000description2
- 230000004048modificationEffects0.000description2
- 239000013307optical fiberSubstances0.000description2
- 239000010453quartzSubstances0.000description2
- VYPSYNLAJGMNEJ-UHFFFAOYSA-Nsilicon dioxideInorganic materialsO=[Si]=OVYPSYNLAJGMNEJ-UHFFFAOYSA-N0.000description2
- 239000002002slurrySubstances0.000description2
- 239000004593EpoxySubstances0.000description1
- 229910000831SteelInorganic materials0.000description1
- 230000001133accelerationEffects0.000description1
- 230000005534acoustic noiseEffects0.000description1
- 239000000853adhesiveSubstances0.000description1
- 230000001070adhesive effectEffects0.000description1
- 239000012223aqueous fractionSubstances0.000description1
- 235000013361beverageNutrition0.000description1
- 230000005540biological transmissionEffects0.000description1
- 238000009530blood pressure measurementMethods0.000description1
- 230000003139buffering effectEffects0.000description1
- 230000015556catabolic processEffects0.000description1
- 230000008859changeEffects0.000description1
- 230000001427coherent effectEffects0.000description1
- 239000002131composite materialSubstances0.000description1
- 239000000356contaminantSubstances0.000description1
- 230000007423decreaseEffects0.000description1
- 238000006731degradation reactionMethods0.000description1
- 230000001419dependent effectEffects0.000description1
- -1e.g.Substances0.000description1
- 238000009429electrical wiringMethods0.000description1
- 230000005670electromagnetic radiationEffects0.000description1
- 230000005284excitationEffects0.000description1
- 239000000835fiberSubstances0.000description1
- 238000001914filtrationMethods0.000description1
- 229920002313fluoropolymerPolymers0.000description1
- 239000004811fluoropolymerSubstances0.000description1
- 239000003292glueSubstances0.000description1
- 238000009413insulationMethods0.000description1
- 230000003993interactionEffects0.000description1
- 239000007791liquid phaseSubstances0.000description1
- 238000000691measurement methodMethods0.000description1
- 238000002156mixingMethods0.000description1
- 238000005457optimizationMethods0.000description1
- 229920000642polymerPolymers0.000description1
- 238000010248power generationMethods0.000description1
- 238000007670refiningMethods0.000description1
- 230000003252repetitive effectEffects0.000description1
- 230000035939shockEffects0.000description1
- 238000010183spectrum analysisMethods0.000description1
- 230000003068static effectEffects0.000description1
- 239000010959steelSubstances0.000description1
- 239000000126substanceSubstances0.000description1
- 239000000725suspensionSubstances0.000description1
- 239000011032tourmalineSubstances0.000description1
- 229940070527tourmalineDrugs0.000description1
- 229910052613tourmalineInorganic materials0.000description1
- 238000012546transferMethods0.000description1
- 230000007704transitionEffects0.000description1
- 239000011800void materialSubstances0.000description1
- 238000004065wastewater treatmentMethods0.000description1
- XLYOFNOQVPJJNP-UHFFFAOYSA-NwaterSubstancesOXLYOFNOQVPJJNP-UHFFFAOYSA-N0.000description1
- 239000002023woodSubstances0.000description1
Images


Classifications
- G—PHYSICS
- G01—MEASURING; TESTING
- G01F—MEASURING VOLUME, VOLUME FLOW, MASS FLOW OR LIQUID LEVEL; METERING BY VOLUME
- G01F1/00—Measuring the volume flow or mass flow of fluid or fluent solid material wherein the fluid passes through a meter in a continuous flow
- G01F1/704—Measuring the volume flow or mass flow of fluid or fluent solid material wherein the fluid passes through a meter in a continuous flow using marked regions or existing inhomogeneities within the fluid stream, e.g. statistically occurring variations in a fluid parameter
- G01F1/708—Measuring the time taken to traverse a fixed distance
- G01F1/7082—Measuring the time taken to traverse a fixed distance using acoustic detecting arrangements
- G—PHYSICS
- G01—MEASURING; TESTING
- G01F—MEASURING VOLUME, VOLUME FLOW, MASS FLOW OR LIQUID LEVEL; METERING BY VOLUME
- G01F1/00—Measuring the volume flow or mass flow of fluid or fluent solid material wherein the fluid passes through a meter in a continuous flow
- G01F1/66—Measuring the volume flow or mass flow of fluid or fluent solid material wherein the fluid passes through a meter in a continuous flow by measuring frequency, phase shift or propagation time of electromagnetic or other waves, e.g. using ultrasonic flowmeters
- G01F1/666—Measuring the volume flow or mass flow of fluid or fluent solid material wherein the fluid passes through a meter in a continuous flow by measuring frequency, phase shift or propagation time of electromagnetic or other waves, e.g. using ultrasonic flowmeters by detecting noise and sounds generated by the flowing fluid
- G—PHYSICS
- G01—MEASURING; TESTING
- G01F—MEASURING VOLUME, VOLUME FLOW, MASS FLOW OR LIQUID LEVEL; METERING BY VOLUME
- G01F1/00—Measuring the volume flow or mass flow of fluid or fluent solid material wherein the fluid passes through a meter in a continuous flow
- G01F1/704—Measuring the volume flow or mass flow of fluid or fluent solid material wherein the fluid passes through a meter in a continuous flow using marked regions or existing inhomogeneities within the fluid stream, e.g. statistically occurring variations in a fluid parameter
- G01F1/708—Measuring the time taken to traverse a fixed distance
- G01F1/712—Measuring the time taken to traverse a fixed distance using auto-correlation or cross-correlation detection means
- G—PHYSICS
- G01—MEASURING; TESTING
- G01F—MEASURING VOLUME, VOLUME FLOW, MASS FLOW OR LIQUID LEVEL; METERING BY VOLUME
- G01F1/00—Measuring the volume flow or mass flow of fluid or fluent solid material wherein the fluid passes through a meter in a continuous flow
- G01F1/74—Devices for measuring flow of a fluid or flow of a fluent solid material in suspension in another fluid
- G—PHYSICS
- G01—MEASURING; TESTING
- G01F—MEASURING VOLUME, VOLUME FLOW, MASS FLOW OR LIQUID LEVEL; METERING BY VOLUME
- G01F15/00—Details of, or accessories for, apparatus of groups G01F1/00 - G01F13/00 insofar as such details or appliances are not adapted to particular types of such apparatus
- G01F15/02—Compensating or correcting for variations in pressure, density or temperature
- G01F15/022—Compensating or correcting for variations in pressure, density or temperature using electrical means
- G01F15/024—Compensating or correcting for variations in pressure, density or temperature using electrical means involving digital counting
Definitions
- This inventionrelates to a method and apparatus for measuring at least one parameter of a fluid flowing within a pipe. More specifically, this invention relates to a method and apparatus for determining a quality metric of the measurement of the fluid parameter.
- a fluid flow processincludes any process that involves the flow of fluid through pipes, ducts, or other conduits, as well as through fluid control devices such as pumps, valves, orifices, heat exchangers, and the like.
- Flow processesare found in many different industries such as the oil and gas industry, refining, food and beverage industry, chemical and petrochemical industry, pulp and paper industry, power generation, pharmaceutical industry, and water and wastewater treatment industry.
- the fluid within the flow processmay be a single phase fluid (e.g., gas, liquid or liquid/liquid mixture) and/or a multi-phase mixture (e.g. paper and pulp slurries or other-solid/liquid mixtures).
- the multi-phase mixturemay be a two-phase liquid/gas mixture, a solid/gas mixture or a solid/liquid mixture, gas entrained liquid or a three-phase mixture.
- Such physical parametersmay include, for example, volumetric flow rate, composition, gas volume fraction, consistency, density, and mass flow rate.
- the methodincludes the steps of: providing an array of at least two sensors disposed at predetermined locations along the elongated body, each sensor for sampling the pressure of the fluid at the position of the sensor at a predetermined sampling rate; accumulating the sampled data from each sensor at each of a number of instants of time spanning a predetermined sampling duration; and constructing from the accumulated sampled data at least a portion of a so called k- ⁇ plot, where the k- ⁇ plot is indicative of a dispersion relation for the propagation of acoustic pressures emanating from the vortical disturbances.
- the methodalso includes the steps of: identifying a convective ridge in the k- ⁇ plot; determining the orientation of the convective ridge in the k- ⁇ plot; and determining the flow velocity based on a predetermined correlation of the flow velocity with the slope of the convective ridge of the k- ⁇ plot.
- the '147 and '575 patentsdescribe a spatial array of acoustic pressure sensors placed at predetermined axial locations along a pipe.
- the pressure sensorsprovide acoustic pressure signals to signal processing logic which determines the speed of sound of the fluid (or mixture) in the pipe using any of a number of acoustic spatial array signal processing techniques with the direction of propagation of the acoustic signals along the longitudinal axis of the pipe.
- the speed of soundis provided to logic, which calculates the percent composition of the mixture, e.g., water fraction, or any other parameter of the mixture, or fluid, that is related to the sound speed.
- the logicmay also determine the Mach number of the fluid.
- a parameter of a fluid passing through a pipeis measured using a spatial array of at least two sensors disposed at different axial locations along the pipe.
- Each of the sensorsprovides a signal indicative of unsteady pressure within the pipe at a corresponding axial location of the pipe.
- At least a portion of a k- ⁇ plotis constructed from the signals, where the k- ⁇ plot is indicative of a dispersion relation for the unsteady pressure within the pipe.
- At least one ridge in the k- ⁇ plotis detected and an accumulated energy for k- ⁇ pairs along the at least one ridge is determined.
- a slope of the at least one ridgeis indicative of the parameter of the fluid.
- the accumulated energy for k- ⁇ pairs along the at least one ridgeis compared to an accumulated energy for k- ⁇ pairs along at least one ray extending in the k- ⁇ plot to determine a quality metric indicative of a quality of the at least one ridge.
- the quality metricmay be compared to a threshold value, and, in response to the quality metric exceeding the threshold value, a parameter of the fluid is determined using the slope of the at least one ridge.
- the parameter of the fluidmay include at least one of: velocity of the fluid and speed of sound of the fluid.
- the accumulated energy for k- ⁇ pairs along the at least one ridgemay be determined as a sum of the powers associated with the k- ⁇ pairs along the at least one ridge.
- the accumulated energy for k- ⁇ pairs along the at least one raymay be determined as a sum of the powers associated with the k- ⁇ pairs along the at least one ray.
- the accumulated energy for k- ⁇ pairs along the at least one raymay be determined as an average accumulated energy for k- ⁇ pairs along a plurality of rays.
- the at least one ridgeincludes a first acoustic ridge in a left plane of the k- ⁇ plot and a second acoustic ridge in the right plane of the k- ⁇ plot.
- the accumulated energy for k- ⁇ pairs along the at least one ridgeis a sum of the powers associated with the k- ⁇ pairs along the first and second acoustic ridges.
- the at least one rayhas a slope indicative of a reference velocity, and the slope of the at least one ridge is indicative of a best velocity.
- the reference velocitymay be determined as a function of the best velocity (e.g., a percentage of the best velocity) or may be independent of the best velocity (e.g., a maximum or minimum velocity).
- the quality metricmay be determined using the equation:
- QP BEST ⁇ ⁇ VELOCITY - P REFERNCE P BEST ⁇ ⁇ VELOCITY + P REFERNCE
- P best velocityis the accumulated energy for k- ⁇ pairs along the at least one ridge in a linear scale
- P referenceis the accumulated energy for k- ⁇ pairs along the at least one ray in a linear scale
- Qis the quality metric.
- accumulated energies for a plurality of rays in the k- ⁇ plotare determined, wherein the slopes of the plurality of rays indicate a plurality of trial velocities.
- the reference velocityis then selected from the trial velocities by comparing the accumulated energies for the plurality of rays.
- the trial velocitiesmay include: a trial velocity determined as a function of the best velocity (e.g., a percentage of the best velocity) and a trial velocity independent of the best velocity (e.g., a maximum or minimum trial velocity).
- the at least two pressure sensorsmay be selected from a group consisting of: piezoelectric, piezoresistive, strain gauge, PVDF, optical sensors, ported ac pressure sensors, accelerometers, velocity sensors, and displacement sensors.
- the at least two pressure sensorsare wrapped around at least a portion of the pipe and do not contact the fluid.
- FIG. 1is schematic diagram of an apparatus for determining at least one parameter associated with a fluid flowing in a pipe in accordance with various embodiments of the present invention.
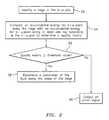
- FIG. 2is a flow chart depicting a method used in the apparatus of the present invention for determining the quality of a ridge identified in the k- ⁇ plane.
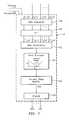
- FIG. 3is a block diagram of a first embodiment of a flow logic used in the apparatus of the present invention.
- FIG. 4is a cross-sectional view of a pipe having coherent structures therein.
- FIG. 5a k- ⁇ plot of data processed from an apparatus embodying the present invention that illustrates slope of the convective ridge, and a plot of the optimization function of the convective ridge.
- FIG. 6is a plot of accumulated energy (dB) for trial velocities ranging from about 4.5 ft/sec to about 30 ft/sec.
- FIG. 7is a block diagram of a second embodiment of a flow logic used in the apparatus of the present invention.
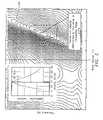
- FIG. 8a k- ⁇ plot of data processed from an apparatus embodying the present invention that illustrates slope of the acoustic ridges.
- FIG. 9is a plot of accumulated energy (dB) for trial velocities ranging from about 713 ft/sec to about 5000 ft/sec.
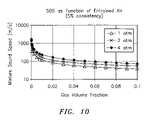
- FIG. 10is a plot of mixture sound speed as a function of gas volume fraction for a 5% consistency slurry over a range of process pressures.
- FIG. 11is a plot of sound speed as a function of frequency for air/particle mixtures with fixed particle size and varying air-to-particle mass ratio.
- FIG. 12is a plot of sound speed as a function of frequency for air/particle mixtures with fixed air-to-particle mass ration and fixed particle size.
- unsteady pressures along a pipeas may be caused by one or both of acoustic waves propagating through the fluid within the pipe and/or pressure disturbances that convect with the fluid flowing in the pipe (e.g., turbulent eddies and vortical disturbances), contain useful information regarding parameters of the fluid and the flow process.
- the parameter of the fluidmay include, for example, at least one of: velocity of the fluid 13 , speed of sound in the fluid 13 , density of the fluid 13 , volumetric flow rate of the fluid 13 , mass flow rate of the fluid 13 , composition of the fluid 13 , entrained air in the fluid 13 , consistency of the fluid 13 , and size of particles in the fluid 13 .
- the fluid 13may be a single or multiphase fluid flowing through a duct, conduit or other form of pipe 14 .
- the apparatus 10includes a spatial array 11 of at least two pressure sensors 15 disposed at different axial locations x 1 . . . x N along the pipe 14 .
- Each of the pressure sensors 15provides a pressure signal P(t) indicative of unsteady pressure within the pipe 14 at a corresponding axial location x 1 . . . x N of the pipe 14 .
- a signal processor 19receives the pressure signals P 1 (t) . . . P N (t) from the pressure sensors 15 in the array 11 , determines the parameter of the fluid 13 using pressure signals from selected ones of the pressure sensors 15 , and outputs the parameter as a signal 21 .
- the signal processor 19applies array-processing techniques to the pressure signals P 1 (t) . . .
- the signal processor 19constructs from the signals at least a portion of a k- ⁇ plot, where the k- ⁇ plot is indicative of a dispersion relation for the unsteady pressure within the pipe. The signal processor 19 then identifies a ridge in the k- ⁇ plot. The slope of the ridge is assumed to be the fluid 13 velocity or sound velocity or correlated to the fluid 13 velocity or sound velocity in a known way. Thus, using the slope of the ridge, the parameters of the fluid 13 can be determined.
- the present inventionprovides a quality metric that can be used to quantitatively evaluate the ridge identified in the k- ⁇ plot and, thus, evaluate the fluid 13 velocity or speed of sound measurement.
- FIG. 2depicts a method used in the apparatus 10 for determining the quality of a ridge identified in the k- ⁇ plane. Referring to FIG. 1 and FIG. 2 , this method can be described.
- the signal processor 19determines a quality metric by comparing an accumulated energy (power) of k- ⁇ pairs along the ridge with an accumulated energy (power) of k- ⁇ pairs along at least one ray extending in the k- ⁇ plot (block 54 ).
- the quality metricis then compared to a threshold value (block 56 ).
- the parameter of the fluidis determined using the slope of the ridge (block 58 ). Conversely, if the quality metric is less than the threshold value, indicating an indistinct ridge resulting from a low signal to noise ratio or improper operation of the device 10 , and an error signal is generated (block 60 ).
- the method of FIG. 2is described in further detail hereinafter.
- the processor 19can evaluate the quality of the measurement of the velocity of the fluid or the speed of sound.
- the quality metricis independent of the interpretation of the velocity or speed of sound, regardless of whether the velocity or speed of sound is used for determining density of the fluid 13 , volumetric flow rate of the fluid 13 , mass flow rate of the fluid 13 , composition of the fluid 13 , entrained air in the fluid 13 , consistency of the fluid 13 , and size of particles in the fluid 13 .
- the array 11 of pressure sensors 15includes two or more pressure sensors 15 , each providing a pressure signal P(t) indicative of unsteady pressure within the pipe 14 at a corresponding axial location X of the pipe 14 .
- the apparatusmay include 2, 3, 4, 5, 6, 7, 8, 9, 10, 11, 12, 13, 14, 15, 16, 17, 18, 19, 20, 21, 22, 23, or 24 pressure sensors 15 .
- the accuracy of the measurementimproves as the number of sensors in the array increases.
- the degree of accuracy provided by the greater number of sensorsis offset by the increase in complexity and time for computing the desired output parameter of the flow. Therefore, the number of sensors used is dependent at least on the degree of accuracy desired and the desire update rate of the output parameter provided by the apparatus 10 .
- the signals P 1 (t) . . . P N (t) provided by the pressure sensors 15 in the array 11are processed by the signal processor 19 , which may be part of a larger processing unit 20 .
- the signal processor 19may be a microprocessor and the processing unit 20 may be a personal computer or other general purpose computer. It is contemplated that the signal processor 19 may be any one or more analog or digital signal processing devices for executing programmed instructions, such as one or more microprocessors or application specific integrated circuits (ASICS), and may include memory for storing programmed instructions, set points, parameters, and for buffering or otherwise storing data.
- ASICSapplication specific integrated circuits
- the signal processor 19applies the data from the selected pressure sensors 15 to flow logic 36 executed by signal processor 19 .
- the flow logic 36is described in further detail hereinafter.
- the signal processor 19may output the one or more parameters 21 to a display 24 or another input/output (I/O) device 26 .
- the I/O device 26also accepts user input parameters 48 as may be necessary for the flow logic 36 and diagnostic logic 38 .
- the I/O device 26 , display 24 , and signal processor 19 unitmay be mounted in a common housing, which may be attached to the array 11 by a flexible cable, wireless connection, or the like. The flexible cable may also be used to provide operating power from the processing unit 20 to the array 11 if necessary.
- the pressure sensors 15may include electrical strain gages, optical fibers and/or gratings, ported sensors, ultrasonic sensors, among others as described herein, and may be attached to the pipe by adhesive, glue, epoxy, tape or other suitable attachment means to ensure suitable contact between the sensor and the pipe 14 .
- the sensors 15may alternatively be removable or permanently attached via known mechanical techniques such as mechanical fastener, spring loaded, clamped, clam shell arrangement, strapping or other equivalents.
- strain gages, including optical fibers and/or gratingsmay be embedded in a composite pipe 14 . If desired, for certain applications, gratings may be detached from (or strain or acoustically isolated from) the pipe 14 if desired. It is also within the scope of the present invention that any other strain sensing technique may be used to measure the variations in strain in the pipe 14 , such as highly sensitive piezoelectric, electronic or electric, strain gages attached to or embedded in the pipe 14 .
- a piezo-electronic pressure transducermay be used as one or more of the pressure sensors and it may measure the unsteady (or dynamic or ac) pressure variations inside the pipe 14 by measuring the pressure levels inside the pipe.
- the sensors 14comprise pressure sensors manufactured by PCB Piezotronics of Depew, N.Y.
- PCB Piezotronics of Depew, N.Yfor example, in one pressure sensor there are integrated circuit piezoelectric voltage mode-type sensors that feature built-in microelectronic amplifiers, and convert the high-impedance charge into a low-impedance voltage output.
- Model 106B manufactured by PCB Piezotronicswhich is a high sensitivity, acceleration compensated integrated circuit piezoelectric quartz pressure sensor suitable for measuring low pressure acoustic phenomena in hydraulic and pneumatic systems. It has the unique capability to measure small pressure changes of less than 0.001 psi under high static conditions.
- the 106Bhas a 300 mV/psi sensitivity and a resolution of 91 dB (0.0001 psi).
- the pressure sensors 15may incorporate a built-in MOSFET microelectronic amplifier to convert the high-impedance charge output into a low-impedance voltage signal.
- the sensors 15may be powered from a constant-current source and can operate over long coaxial or ribbon cable without signal degradation.
- the low-impedance voltage signalis not affected by triboelectric cable noise or insulation resistance-degrading contaminants. Power to operate integrated circuit piezoelectric sensors generally takes the form of a low-cost, 24 to 27 VDC, 2 to 20 mA constant-current supply.
- piezoelectric pressure sensorsare constructed with either compression mode quartz crystals preloaded in a rigid housing, or unconstrained tourmaline crystals. These designs give the sensors microsecond response times and resonant frequencies in the hundreds of kHz, with minimal overshoot or ringing. Small diaphragm diameters ensure spatial resolution of narrow shock waves.
- the output characteristic of piezoelectric pressure sensor systemsis that of an AC-coupled system, where repetitive signals decay until there is an equal area above and below the original base line. As magnitude levels of the monitored event fluctuate, the output remains stabilized around the base line with the positive and negative areas of the curve remaining equal.
- each of the pressure sensors 15may include a piezoelectric sensor that provides a piezoelectric material to measure the unsteady pressures of the fluid 13 .
- the piezoelectric materialsuch as the polymer, polarized fluoropolymer, PVDF, measures the strain induced within the process pipe 14 due to unsteady pressure variations within the fluid 13 . Strain within the pipe 14 is transduced to an output voltage or current by the attached piezoelectric sensors 15 .
- each piezoelectric sensor 15may be adhered to the outer surface of a steel strap that extends around and clamps onto the outer surface of the pipe 14 .
- the piezoelectric sensing elementis typically conformal to allow complete or nearly complete circumferential measurement of induced strain.
- the sensorscan be formed from PVDF films, co-polymer films, or flexible PZT sensors, similar to that described in “Piezo Film Sensors technical Manual” provided by Measurement Specialties, Inc. of Fairfield, N.J., which is incorporated herein by reference. The advantages of this technique are the following:
- Measurement techniquerequires no excitation source. Ambient flow noise is used as a source.
- Flexible piezoelectric sensorscan be mounted in a variety of configurations to enhance signal detection schemes. These configurations include a) co-located sensors, b) segmented sensors with opposing polarity configurations, c) wide sensors to enhance acoustic signal detection and minimize vortical noise detection, d) tailored sensor geometries to minimize sensitivity to pipe modes, e) differencing of sensors to eliminate acoustic noise from vortical signals.
- Each sensor 15provides a signal indicating an unsteady pressure at the location of each sensor 15 , at each instant in a series of sampling instants.
- the array 11may include more than two sensors 15 distributed at locations x 1 . . . x N .
- the pressure generated by the convective pressure disturbances(e.g., eddies 120 , see FIG. 4 ) may be measured through strained-based sensors 15 and/or pressure sensors 15 .
- the sensors 15provide analog pressure time-varying signals P 1 (t),P 2 (t),P 3 (t) . . . P N (t) to the signal processor 19 , which in turn applies selected ones of these signals P 1 (t),P 2 (t),P 3 (t), . . . P N (t) to the flow logic 36 .
- the flow logic 36processes the selected signals P 1 (t),P 2 (t),P 3 (t), . . . P N (t) to first provide output signals (parameters) 21 indicative of the pressure disturbances that convect with the fluid (process flow) 13 , and subsequently, provide output signals (parameters) 21 in response to pressure disturbances generated by convective waves propagating through the fluid 13 , such as velocity, Mach number and volumetric flow rate of the process flow 13 .
- the signal processor 19includes data acquisition unit 126 (e.g., A/D converter) that converts the analog signals P 1 (t) . . . P N (t) to respective digital signals and provides the digital signals P 1 (t) . . . P N (t) to FFT logic 128 .
- the FFT logic 128calculates the Fourier transform of the digitized time-based input signals P 1 (t) . . . P N (t) and provides complex frequency domain (or frequency based) signals P 1 ( ⁇ ),P 2 ( ⁇ ),P 3 ( ⁇ ), . . . P N ( ⁇ ) indicative of the frequency content of the input signals.
- any other technique for obtaining the frequency domain characteristics of the signals P 1 (t)–P N (t),may be used.
- the cross-spectral density and the power spectral densitymay be used to form a frequency domain transfer functions (or frequency response or ratios) discussed hereinafter.
- One technique of determining the convection velocity of the turbulent eddies 120 within the process flow 13is by characterizing a convective ridge of the resulting unsteady pressures using an array of sensors or other beam forming techniques, similar to that described in U.S. Pat. No. 6,691,584, filed on Jul. 2, 1999 and U.S. Pat. No. 6,609,069, filed on Dec. 4, 2000, which are incorporated herein by reference.
- a data accumulator 130accumulates the frequency signals P 1 ( ⁇ )–P N ( ⁇ ) over a sampling interval, and provides the data to an array processor 132 , which performs a spatial-temporal (two-dimensional) transform of the sensor data, from the xt domain to the k- ⁇ domain, and then calculates the power in the k- ⁇ plane, as represented by a k- ⁇ plot.
- the array processor 132uses standard so-called beam forming, array processing, or adaptive array-processing algorithms, i.e. algorithms for processing the sensor signals using various delays and weighting to create suitable phase relationships between the signals provided by the different sensors, thereby creating phased antenna array functionality.
- the prior artteaches many algorithms of use in spatially and temporally decomposing a signal from a phased array of sensors, and the present invention is not restricted to any particular algorithm.
- One particular adaptive array processing algorithmis the Capon method/algorithm. While the Capon method is described as one method, the present invention contemplates the use of other adaptive array processing algorithms, such as MUSIC algorithm.
- the present inventionrecognizes that such techniques can be used to determine flow rate, i.e. that the signals caused by a stochastic parameter convecting with a flow are time stationary and have a coherence length long enough that it is practical to locate sensor units apart from each other and yet still be within the coherence length.
- uis the convection velocity (flow velocity).
- a convective ridgeA plot of k- ⁇ pairs obtained from a spectral analysis of sensor samples associated with convective parameters portrayed so that the energy of the disturbance spectrally corresponding to pairings that might be described as a substantially straight ridge, a ridge that in turbulent boundary layer theory is called a convective ridge.
- What is being sensedare not discrete events of turbulent eddies, but rather a continuum of possibly overlapping events forming a temporally stationary, essentially white process over the frequency range of interest.
- the convective eddies 120is distributed over a range of length scales and hence temporal frequencies.
- the array processor 132determines the wavelength and so the (spatial) wavenumber k, and also the (temporal) frequency and so the angular frequency ⁇ , of various of the spectral components of the stochastic parameter.
- the array processor 132determines the wavelength and so the (spatial) wavenumber k, and also the (temporal) frequency and so the angular frequency ⁇ , of various of the spectral components of the stochastic parameter.
- the present inventionmay use temporal and spatial filtering to precondition the signals to effectively filter out the common mode characteristics Pcommon mode and other long wavelength (compared to the sensor spacing) characteristics in the pipe 14 by differencing adjacent sensors 15 and retain a substantial portion of the stochastic parameter associated with the flow field and any other short wavelength (compared to the sensor spacing) low frequency stochastic parameters.
- the power in the k- ⁇ plane shown in a k- ⁇ plot of FIG. 5shows a convective ridge 124 .
- the convective ridgerepresents the concentration of a stochastic parameter that convects with the flow and is a mathematical manifestation of the relationship between the spatial variations and temporal variations described above. Such a plot will indicate a tendency for k- ⁇ pairs to appear more or less along a line 124 with some slope, the slope indicating the flow velocity.
- a convective ridge identifier 134uses one or another feature extraction method to determine the location and orientation (slope) of any convective ridge 124 present in the k- ⁇ plane.
- the convective ridge identifier 134accumulates energy (power) of k- ⁇ pairs in the k- ⁇ plot along different rays emanating from the origin, each different ray being associated with a different trial velocity (in that the slope of a ray is assumed to be the fluid 13 velocity or correlated to the fluid 13 velocity in a known way).
- the convective ridge identifier 134may accumulate energy for each array by summing the energy of k- ⁇ pairs along the ray.
- convective ridge informationprovides information about the different trial velocities, information referred to generally as convective ridge information.
- FIG. 6depicts an example of a plot of accumulated energy for trial velocities ranging from about 4.5 ft/sec to about 30 ft/sec, where accumulated energy is indicated as power in decibels (dB) and the trial velocities are indicated in feet per second (ft/sec).
- the largest accumulated energyis approximately ⁇ 37 dB, so the best velocity (i.e., the velocity indicated by the convective ridge) is approximately 6 ft/sec.
- the convective ridge identifier 134may determine the best velocity using any known iterative routine, curve fit routine or other routine to identify the portion of the curve indicating the largest accumulated energy.
- the quality of this ridgecan be determined using the method of FIG. 2 .
- the signal processor 19determines a quality metric by comparing an accumulated energy (power) of k- ⁇ pairs along the ridge with an accumulated energy (power) of k- ⁇ pairs along at least one ray extending in the k- ⁇ plot (block 54 ).
- the quality metricis determined by comparing the accumulated energy at the best velocity (P best velocity ) to a reference accumulated energy (P reference ), which is determined as a function of one or more trial velocities.
- P referencemay be an average of accumulated energies for a range of trial velocities.
- P referencemay be determined as a function of a single trial velocity (a reference velocity).
- the reference velocitymay be a predetermined velocity, such as the maximum or minimum velocity, or may be determined as a function of the best velocity (e.g., 75% of the best velocity, 50% of the best velocity, etc.).
- the reference velocityis selected by determining the accumulated energy for a plurality of different velocities and selecting the reference velocity as that velocity providing the maximum accumulated energy.
- the quality metric algorithmmay use a reference velocity determined from the maximum of one of the following four values: 1) accumulated energy at 75% of best velocity, 2) accumulated energy at 125% of best velocity, 3) accumulated energy at minimum velocity and 4) accumulated energy at maximum velocity, although it is not necessarily limited to these.
- these velocitiesequate to 4.5, 7.5, 3 and 30 ft/sec, respectively, with the corresponding accumulated energies being ⁇ 51 dB, ⁇ 49 dB, ⁇ 48 dB and ⁇ 49.5 dB, respectively.
- the reference velocityis selected as 3 ft/sec (minimum velocity), with a corresponding accumulated energy being ⁇ 48 dB. While the present embodiment includes four points for determining the accumulated energy of the reference velocity, the invention contemplates that any number of points or point locations may be used.
- the quality metricmay then be calculated by dividing the difference of P best velocity and P reference by the sum of P best velocity and P reference , as shown by the equation below.
- the quality metricwill approach one. Conversely, if P best velocity and P reference are equal, indicating an indistinct convective ridge resulting from a low signal to noise ratio or improper operation of the device 10 , the quality metric will equal zero. Therefore, the processor can evaluate the quality of the convective ridge using the quality metric. If the quality metric is below a predetermined threshold, the apparatus 10 will provide an error (blocks 56 and 60 of FIG. 2 ). For example, a threshold of about 0.2 may be used, but this threshold may vary depending upon the environment in which the array 11 ( FIG. 1 ) is located.
- Some or all of the functions within the flow logic 36may be implemented in software (using a microprocessor or computer) and/or firmware, or may be implemented using analog and/or digital hardware, having sufficient memory, interfaces, and capacity to perform the functions described herein.
- FIG. 7another example of flow logic 36 is shown. While the examples of FIG. 3 and FIG. 7 are shown separately, it is contemplated that the flow logic 36 may perform all of the functions described with reference to FIG. 3 and FIG. 7 .
- the array 11 of at least two sensors 15 located at two at least two locations x 1 , x 2 axially along the pipe 14sense respective stochastic signals propagating between the sensors within the pipe at their respective locations.
- Each sensor 15provides a signal indicating an unsteady pressure at the location of each sensor 15 , at each instant in a series of sampling instants.
- the sensor array 11may include more than two pressure sensors 15 distributed at locations x 1 . . . X N .
- the pressure generated by the acoustic pressure disturbancesmay be measured through strained-based sensors and/or pressure sensors.
- the sensors 15provide analog pressure time-varying signals P 1 (t),P 2 (t),P 3 (t), . . . P N (t) to the flow logic 36 .
- the flow logic 36processes the signals P 1 (t),P 2 (t),P 3 (t), . . .
- P N (t) from the sensors 15to first provide output signals indicative of the speed of sound propagating through the fluid (process flow) 13 , and subsequently, provide output signals in response to pressure disturbances generated by acoustic waves propagating through the process flow 13 , such as velocity, Mach number and volumetric flow rate of the process flow 13 .
- the signal processor 19receives the pressure signals from the array 11 of sensors 15 .
- a data acquisition unit 138digitizes selected ones of the pressure signals P 1 (t) . . . P N (t) associated with the acoustic waves 122 propagating through the pipe 14 .
- an FFT logic 140calculates the Fourier transform of the selected digitized time-based input signals P 1 (t) . . . P N (t) and provides complex frequency domain (or frequency based) signals P 1 ( ⁇ ),P 2 ( ⁇ ),P 3 ( ⁇ ), . . . P N ( ⁇ ) indicative of the frequency content of the input signals.
- a data accumulator 142accumulates the frequency signals P 1 ( ⁇ ) . . . P N ( ⁇ ) over a sampling interval, and provides the data to an array processor 144 , which performs a spatial-temporal (two-dimensional) transform of the sensor data, from the xt domain to the k- ⁇ domain, and then calculates the power in the k- ⁇ plane, as represented by a k- ⁇ plot.
- the array processor 144determines the wavelength and so the (spatial) wavenumber k, and also the (temporal) frequency and so the angular frequency ⁇ , of various of the spectral components of the stochastic parameter.
- the array processor 144determines the wavelength and so the (spatial) wavenumber k, and also the (temporal) frequency and so the angular frequency ⁇ , of various of the spectral components of the stochastic parameter.
- the power in the k- ⁇ plane shown in a k- ⁇ plot of FIG. 8 so determinedwill exhibit a structure that is called an acoustic ridge 150 , 152 in both the left and right planes of the plot, wherein one of the acoustic ridges 150 is indicative of the speed of sound traveling in one axial direction and the other acoustic ridge 152 being indicative of the speed of sound traveling in the other axial direction.
- the acoustic ridgesrepresent the concentration of a stochastic parameter that propagates through the flow and is a mathematical manifestation of the relationship between the spatial variations and temporal variations described above. Such a plot will indicate a tendency for k- ⁇ pairs to appear more or less along a line 150 , 152 with some slope, the slope indicating the speed of sound.
- the power in the k- ⁇ plane so determinedis then provided to an acoustic ridge identifier 146 , which uses one or another feature extraction method to determine the location and orientation (slope) of any acoustic ridge present in the left and/or right k- ⁇ plane.
- the velocitymay be determined by using the slope of one of the two acoustic ridges 150 , 152 or averaging the slopes of the acoustic ridges 150 , 152 .
- the acoustic ridge identifier 146accumulates energy (power) of k- ⁇ pairs in the k- ⁇ plot along different rays emanating from the origin, each different ray being associated with a different trial velocity (in that the slope of a ray is assumed to be the sound velocity or correlated to the sound velocity in a known way).
- the acoustic ridge identifier 146may accumulate energy for each ray by summing the energies of k- ⁇ pairs along the ray. Alternatively, other methods of accumulating energy along the ray (e.g., averaging) may be used. In any case, accumulated energy is determined for a range of trial velocities between a predetermined minimum velocity and a predetermined maximum velocity.
- the convective ridges 150 , 152may be identified by the ray having the largest accumulated energy in the respective plane of the k- ⁇ plot.
- the acoustic ridge identifier 146provides information about the different trial velocities, information referred to generally as acoustic ridge information.
- FIG. 9depicts an example of a plot of accumulated energy for trial velocities ranging from about 713 ft/sec to about 5000 ft/sec, where accumulated energy is indicated as power in decibels (dB) and the trial velocities are indicated in feet per second (ft/sec).
- the accumulated energymay be a sum of the powers associated with k- ⁇ pairs along a single ray (e.g., a ray in the right plane or the left plane of the k- ⁇ plot) or may be a sum of the powers associated with k- ⁇ pairs along rays of corresponding slope in both the right and left planes of the k- ⁇ plot.
- the largest accumulated energyis approximately ⁇ 53 dB, so the best velocity (i.e., the velocity indicated by the acoustic ridges) is approximately 950 ft/sec.
- the acoustic ridge identifier 146may determine the best velocity using any known iterative routine, curve fit routine or other routine to identify the portion of the curve indicating the largest accumulated energy.
- the quality of the at least one ridgecan be determined using the method of FIG. 2 .
- the signal processor 19determines a quality metric by comparing an accumulated energy (power) of k- ⁇ pairs along the at least one ridge with an accumulated energy (power) of k- ⁇ pairs along at least one ray extending in the k- ⁇ plot (block 54 ).
- the quality of the measurementis determined by comparing the accumulated energy at the best velocity (P best velocity ) to a reference accumulated energy (P reference ), which is determined as a function of one or more trial velocities.
- P referencemay be an average of accumulated energies for a range of trial velocities or for corresponding trial velocities in the right and left planes of the k- ⁇ plot.
- P referencemay be determined as a function of a single trial velocity (a reference velocity).
- the reference velocitymay be a predetermined velocity, such as the maximum or minimum velocity, or may be determined as a function of the best velocity (e.g., 75% of the best velocity, 50% of the best velocity, etc.).
- the reference velocityis selected by determining the accumulated energy for a plurality of different velocities and selecting the reference velocity as that velocity providing the maximum accumulated energy.
- the quality metric algorithmmay use a reference velocity determined from the maximum of one of the following four values: 1) accumulated energy at 75% of best velocity, 2) accumulated energy at 125% of best velocity, 3) accumulated energy at minimum velocity and 4) accumulated energy at maximum velocity, although it is not necessarily limited to these.
- these velocitiesequate to 713, 1188, 100 and 5000 ft/sec, respectively, with the corresponding accumulated energies being ⁇ 57 dB, ⁇ 54 dB, ⁇ 78 dB and ⁇ 58 dB, respectively.
- the reference velocityis selected as 1188 ft/sec (125% of best velocity), with a corresponding accumulated energy being ⁇ 54 dB. While the present embodiment includes four points for determining the accumulated energy of the reference velocity, the invention contemplates that any number of points or point locations may be used.
- the quality metricmay then be calculated by dividing the difference of P best velocity and P reference by the sum of P best velocity and P reference , as shown by the equation below.
- the quality metricwill approach one. Conversely, if P best velocity and P reference are equal, indicating an indistinct acoustic ridge resulting from a low signal to noise ratio or improper operation of the device 10 , the quality metric will equal zero. Therefore, the processor can evaluate the quality of the acoustic ridge(s) using the quality metric. If the quality metric is below a predetermined threshold, the apparatus 10 will provide an error (blocks 56 and 60 of FIG. 2 ). For example, a threshold of about 0.2 may be used, but this threshold may vary depending upon the environment in which the array 11 ( FIG. 1 ) is located.
- the quality metricis greater than or equal to the threshold (block 56 of FIG. 2 )
- the speed of soundmay be determined using the slope of the acoustic ridge(s) (blocks 56 and 58 of FIG. 2 ).
- information including the acoustic ridge orientation (slope)is used by an analyzer 148 to determine the flow parameters relating to measured speed of sound, such as the consistency or composition of the flow, the density of the flow, the average size of particles in the flow, the air/mass ratio of the flow, gas volume fraction of the flow, the speed of sound propagating through the flow, and/or the percentage of entrained air within the flow.
- the array processor 144uses standard so-called beam forming, array processing, or adaptive array-processing algorithms, i.e. algorithms for processing the sensor signals using various delays and weighting to create suitable phase relationships between the signals provided by the different sensors, thereby creating phased antenna array functionality.
- One such technique of determining the speed of sound propagating through the process flow 13is using array processing techniques to define an acoustic ridge in the k- ⁇ plane as shown in FIG. 8 .
- the slope of the acoustic ridgeis indicative of the speed of sound propagating through the process flow 13 .
- the speed of sound (SOS)is determined by applying sonar arraying processing techniques to determine the speed at which the one dimensional acoustic waves propagate past the axial array of unsteady pressure measurements distributed along the pipe 14 .
- the flow logic 36 of the present embodimentmeasures the speed of sound (SOS) of one-dimensional sound waves propagating through the process flow 13 to determine the gas volume fraction of the process flow 13 .
- SOSspeed of sound
- the speed of sound propagating through the pipe 14 and process flow 13may be determined using a number of known techniques, such as those set forth in U.S. patent application Ser. No. 09/344,094, filed Jun. 25, 1999, now U.S. Pat. No. 6,354,147; U.S. patent application Ser. No. 10/795,111, filed Mar. 4, 2004; U.S. patent application Ser. No. 09/997,221, filed Nov. 28, 2001, now U.S. Pat. No.
- sonar-based flow meterusing an array of sensors 15 – 18 to measure the speed of sound of an acoustic wave propagating through the mixture is shown and described, one will appreciate that any means for measuring the speed of sound of the acoustic wave may used to determine the entrained gas volume fraction of the mixture/fluid or other characteristics of the flow described hereinbefore.
- the analyzer 148 of the flow logic 36provides output parameters 21 indicative of characteristics of the process flow 13 that are related to the measured speed of sound (SOS) propagating through the process flow 13 .
- SOSmeasured speed of sound
- the analyzer 148assumes a nearly isothermal condition for the process flow 13 .
- xis the speed of sound
- A1+rg/r1*(K eff /P ⁇ 1) ⁇ K eff /P
- BK eff /P ⁇ 2+rg/r1
- C1 ⁇ K eff /r1*a meas ⁇ 2)
- Rggas density
- r1liquid density
- K effeffective K (modulus of the liquid and pipewall)
- Ppressure
- a measmeasured speed of sound.
- the sound speed of a mixturecan be related to volumetric phase fraction ( ⁇ i ) of the components and the sound speed (a) and densities ( ⁇ ) of the component through the Wood equation.
- One dimensional compression waves propagating within a process flow 13 contained within a pipe 14exert an unsteady internal pressure loading on the pipe.
- the degree to which the pipe displaces as a result of the unsteady pressure loadinginfluences the speed of propagation of the compression wave.
- the relationship among the infinite domain speed of sound and density of a mixture; the elastic modulus (E), thickness (t), and radius (R) of a vacuum-backed cylindrical conduit; and the effective propagation velocity (aeff) for one dimensional compressionis given by the following expression:
- the mixing ruleessentially states that the compressibility of a process flow (1/( ⁇ a 2 )) is the volumetrically-weighted average of the compressibilities of the components.
- a process flow 13consisting of a gas/liquid mixture at pressure and temperatures typical of paper and pulp industry
- the compressibility of gas phaseis orders of magnitudes greater than that of the liquid.
- the compressibility of the gas phase and the density of the liquid phaseprimarily determine mixture sound speed, and as such, it is necessary to have a good estimate of process pressure to interpret mixture sound speed in terms of volumetric fraction of entrained gas.
- the effect of process pressure on the relationship between sound speed and entrained air volume fractionis shown in FIG. 10 .
- the flow logic 36 of the present embodimentincludes the ability to accurately determine the average particle size of a particle/air or droplet/air mixture within the pipe 14 and the air to particle ratio.
- the propagation of one dimensional sound wave through multiphase mixturesis influenced by the effective mass and the effective compressibility of the mixture.
- the degree to which the no-slip assumption appliesis a strong function of particle size and frequency. In the limit of small particles and low frequency, the no-slip assumption is valid. As the size of the particles increases and the frequency of the sound waves increase, the non-slip assumption becomes increasing less valid.
- the increase in slip with frequencycauses dispersion, or, in other words, the sound speed of the mixture to change with frequency.
- dispersive characteristic of a process flow 13will provide a measurement of the average particle size, as well as, the air to particle ratio (particle/fluid ratio) of the process flow 13 .
- the dispersive nature of the systemutilizes a first principles model of the interaction between the air and particles.
- This modelis viewed as being representative of a class of models that seek to account for dispersive effects.
- Other modelscould be used to account for dispersive effects without altering the intent of this disclosure (for example, see the paper titled “Viscous Attenuation of Acoustic Waves in Suspensions” by R. L. Gibson, Jr. and M. N. Toksöz), which is incorporated herein by reference.
- the modelallows for slip between the local velocity of the continuous fluid phase and that of the particles.
- the fluid SOS, density ( ⁇ ) and viscosity ( ⁇ )are those of the pure phase fluid, v p is the volume of individual particles and ⁇ p is the volumetric phase fraction of the particles in the mixture.
- FIG. 11 and FIG. 12show the dispersive behavior in relations to the speed of sound for coal/air mixtures with parameters typical of those used in pulverized coal deliver systems.
- FIG. 11shows the predicted behavior for nominally 50 micrometer size coal in air for a range of air-to-fuel ratios.
- the effect of air-to-fuel ratiois well defined in the low frequency limit.
- the effect of the air-to-fuel ratiobecomes indistinguishable at higher frequencies, approaching the sound speed of the pure air at high frequencies (above ⁇ 100 Hz).
- FIG. 12shows the predicted behavior for a coal/air mixture with an air-to-fuel ratio of 1.8 with varying particle size. This figure illustrates that particle size has no influence on either the low frequency limit (quasi-steady) sound speed, or on the high frequency limit of the sound speed. However, particle size does have a pronounced effect in the transition region.
- FIG. 11 and FIG. 12illustrate an important aspect of the present invention. Namely, that the dispersive properties of dilute mixtures of particles suspended in a continuous liquid can be broadly classified into three frequency regimes: low frequency range, high frequency range and a transitional frequency range. Although the effect of particle size and air-to-fuel ratio are inter-related, the predominant effect of air-to-fuel ratio is to determine the low frequency limit of the sound speed to be measured and the predominate effect of particle size is to determine the frequency range of the transitional regions. As particle size increases, the frequency at which the dispersive properties appear decreases. For typical pulverized coal applications, this transitional region begins at fairly low frequencies, ⁇ 2 Hz for 50 micrometer size particles.
- Some or all of the functions within the flow logic 36may be implemented in software (using a microprocessor or computer) and/or firmware, or may be implemented using analog and/or digital hardware, having sufficient memory, interfaces, and capacity to perform the functions described herein.
- FIG. 3 and FIG. 7depict two different embodiments of the flow logic 36 to measure various parameters of the flow process, the present invention contemplates that the functions of these two embodiments may be performed by a single flow logic 36 .
- the present inventioncan be embodied in the form of computer-implemented processes and apparatuses for practicing those processes.
- the present inventioncan also be embodied in the form of computer program code containing instructions embodied in tangible media, such as floppy diskettes, CD-ROMs, hard drives, or any other computer-readable storage medium, wherein, when the computer program code is loaded into and executed by a computer, the computer becomes an apparatus for practicing the invention.
- the present inventioncan also be embodied in the form of computer program code, for example, whether stored in a storage medium, loaded into and/or executed by a computer, or transmitted over some transmission medium, such as over electrical wiring or cabling, through fiber optics, or via electromagnetic radiation, wherein, when the computer program code is loaded into and executed by a computer, the computer becomes an apparatus for practicing the invention.
- computer program code segmentsconfigure the microprocessor to create specific logic circuits.
Landscapes
- Physics & Mathematics (AREA)
- Fluid Mechanics (AREA)
- General Physics & Mathematics (AREA)
- Acoustics & Sound (AREA)
- Electromagnetism (AREA)
- Investigating Or Analyzing Materials By The Use Of Ultrasonic Waves (AREA)
Abstract
Description
where Pbest velocityis the accumulated energy for k-ω pairs along the at least one ridge in a linear scale, Preferenceis the accumulated energy for k-ω pairs along the at least one ray in a linear scale, and Q is the quality metric.
k=ω/u,
Ax2+Bx+C=0
Gas Voulume Fraction (GVF)=(−B+sqrt(B^2−4*A*C))/(2*A)
Claims (33)
Priority Applications (2)
| Application Number | Priority Date | Filing Date | Title |
|---|---|---|---|
| US11/011,453US7152003B2 (en) | 2003-12-11 | 2004-12-13 | Method and apparatus for determining a quality metric of a measurement of a fluid parameter |
| US11/642,007US7379828B2 (en) | 2003-12-11 | 2006-12-19 | Method and apparatus for determining a quality metric of a measurement of a fluid parameter |
Applications Claiming Priority (2)
| Application Number | Priority Date | Filing Date | Title |
|---|---|---|---|
| US52873103P | 2003-12-11 | 2003-12-11 | |
| US11/011,453US7152003B2 (en) | 2003-12-11 | 2004-12-13 | Method and apparatus for determining a quality metric of a measurement of a fluid parameter |
Related Child Applications (1)
| Application Number | Title | Priority Date | Filing Date |
|---|---|---|---|
| US11/642,007ContinuationUS7379828B2 (en) | 2003-12-11 | 2006-12-19 | Method and apparatus for determining a quality metric of a measurement of a fluid parameter |
Publications (2)
| Publication Number | Publication Date |
|---|---|
| US20050159904A1 US20050159904A1 (en) | 2005-07-21 |
| US7152003B2true US7152003B2 (en) | 2006-12-19 |
Family
ID=34699895
Family Applications (2)
| Application Number | Title | Priority Date | Filing Date |
|---|---|---|---|
| US11/011,453Expired - LifetimeUS7152003B2 (en) | 2003-12-11 | 2004-12-13 | Method and apparatus for determining a quality metric of a measurement of a fluid parameter |
| US11/642,007Expired - LifetimeUS7379828B2 (en) | 2003-12-11 | 2006-12-19 | Method and apparatus for determining a quality metric of a measurement of a fluid parameter |
Family Applications After (1)
| Application Number | Title | Priority Date | Filing Date |
|---|---|---|---|
| US11/642,007Expired - LifetimeUS7379828B2 (en) | 2003-12-11 | 2006-12-19 | Method and apparatus for determining a quality metric of a measurement of a fluid parameter |
Country Status (2)
| Country | Link |
|---|---|
| US (2) | US7152003B2 (en) |
| WO (1) | WO2005059479A1 (en) |
Cited By (9)
| Publication number | Priority date | Publication date | Assignee | Title |
|---|---|---|---|---|
| US20070005272A1 (en)* | 2005-05-16 | 2007-01-04 | Gysling Daniel L | Method and apparatus for detecting and characterizing particles in a multiphase fluid |
| US20070006656A1 (en)* | 2005-07-11 | 2007-01-11 | General Electric Company | System and method for monitoring deposition within tubes of a heating system |
| US20110000281A1 (en)* | 2009-07-06 | 2011-01-06 | Thermo Diagnostics Company LLC | Method and System for Monitoring Steam Quality |
| US8816865B1 (en) | 2009-07-06 | 2014-08-26 | Walter T. Deacon | Method and system for measuring temperature and pressure in different regions to determine steam quality |
| US20150232288A1 (en)* | 2012-08-17 | 2015-08-20 | J.O.A. Technology Beheer B.V. | Method of, a control system, a device, a sensor and a computer program product for controlling transport of fibrous material in a transport line of a pneumatic conveying system |
| US9297733B2 (en) | 2010-03-09 | 2016-03-29 | Cidra Corporate Services Inc. | Dispersion compensation technique for differential sonar measurement—density meter |
| US9410422B2 (en) | 2013-09-13 | 2016-08-09 | Chevron U.S.A. Inc. | Alternative gauging system for production well testing and related methods |
| US20170030748A1 (en)* | 2015-07-28 | 2017-02-02 | Expro Meters, Inc. | Methodology and apparatus for distinguishing single phase fluid flows from multiphase fluid flows using a flow meter |
| US11486892B2 (en)* | 2016-10-25 | 2022-11-01 | Air Water Biodesign Inc. | Fluid measuring device |
Families Citing this family (26)
| Publication number | Priority date | Publication date | Assignee | Title |
|---|---|---|---|---|
| CA2530596C (en)* | 2003-06-24 | 2013-05-21 | Cidra Corporation | System and method for operating a flow process |
| US7150202B2 (en)* | 2003-07-08 | 2006-12-19 | Cidra Corporation | Method and apparatus for measuring characteristics of core-annular flow |
| US7295933B2 (en)* | 2003-07-15 | 2007-11-13 | Cidra Corporation | Configurable multi-function flow measurement apparatus having an array of sensors |
| US7330797B2 (en)* | 2004-03-10 | 2008-02-12 | Cidra Corporation | Apparatus and method for measuring settlement of solids in a multiphase flow |
| ATE484734T1 (en) | 2004-03-10 | 2010-10-15 | Cidra Corporate Services Inc | METHOD AND DEVICE FOR MEASURING PARAMETERS OF A COATED FLOW |
| US7426852B1 (en) | 2004-04-26 | 2008-09-23 | Expro Meters, Inc. | Submersible meter for measuring a parameter of gas hold-up of a fluid |
| US7725270B2 (en) | 2005-03-10 | 2010-05-25 | Expro Meters, Inc. | Industrial flow meter having an accessible digital interface |
| US7962293B2 (en) | 2005-03-10 | 2011-06-14 | Expro Meters, Inc. | Apparatus and method for providing a stratification metric of a multiphase fluid flowing within a pipe |
| US7440873B2 (en)* | 2005-03-17 | 2008-10-21 | Expro Meters, Inc. | Apparatus and method of processing data to improve the performance of a flow monitoring system |
| WO2006130499A2 (en) | 2005-05-27 | 2006-12-07 | Cidra Corporation | An apparatus and method for fiscal measuring of an aerated fluid |
| US7526966B2 (en) | 2005-05-27 | 2009-05-05 | Expro Meters, Inc. | Apparatus and method for measuring a parameter of a multiphase flow |
| ATE526562T1 (en)* | 2005-07-07 | 2011-10-15 | Cidra Corp | WET GAS MEASUREMENT USING A DIFFERENTIAL PRESSURE BASED FLOW METER WITH A SONAR BASED FLOW METER |
| US7603916B2 (en)* | 2005-07-07 | 2009-10-20 | Expro Meters, Inc. | Wet gas metering using a differential pressure and a sonar based flow meter |
| WO2007136788A2 (en)* | 2006-05-16 | 2007-11-29 | Cidra Corporation | Apparatus and method for determining a parameter in a wet gas flow |
| US7911469B1 (en)* | 2006-06-08 | 2011-03-22 | Pixar | Pose-based collision fly-papering: a method for simulating objects in computer animation |
| CA2619424C (en)* | 2007-02-06 | 2011-12-20 | Weatherford/Lamb, Inc. | Flowmeter array processing algorithm with wide dynamic range |
| US8346491B2 (en) | 2007-02-23 | 2013-01-01 | Expro Meters, Inc. | Sonar-based flow meter operable to provide product identification |
| US8229686B2 (en)* | 2007-06-28 | 2012-07-24 | Expro Meters, Inc. | Apparatus and method for measuring liquid and gas flow rates in a stratified multi-phase flow |
| AT510675B1 (en)* | 2012-02-23 | 2013-04-15 | Avl List Gmbh | Method for identifying the transmission behavior of a system, and ultrasonic transit time method for determining the flow rate in a medium |
| US20160108729A1 (en)* | 2013-07-24 | 2016-04-21 | Gao Li | Method and device for the concurrent determination of fluid density and viscosity in-situ |
| US11574091B2 (en) | 2017-10-06 | 2023-02-07 | Pixar | Techniques for recovering from intersections |
| CN103913203B (en)* | 2014-04-14 | 2017-01-25 | 姜跃炜 | Ultrasonic water meter coefficient processing method |
| CN107636427B (en)* | 2015-03-04 | 2021-04-02 | 高准公司 | Flow meter measurement confidence determining device and method |
| AU2015403469B2 (en)* | 2015-07-28 | 2021-02-04 | Expro Meters, Inc. | Methodology and apparatus for distinguishing single phase fluid flows from multiphase fluid flows using a flow meter |
| CN109540205B (en)* | 2018-11-13 | 2021-06-18 | 中广核核电运营有限公司 | Monitoring method and device for nuclear power plant pipeline, monitoring equipment and storage medium |
| CN115758221B (en)* | 2022-11-29 | 2025-06-24 | 中海石油(中国)有限公司 | A method and system for predicting phase fraction of oil-water two-phase flow based on image recognition |
Citations (55)
| Publication number | Priority date | Publication date | Assignee | Title |
|---|---|---|---|---|
| US4048853A (en) | 1974-12-11 | 1977-09-20 | Detectronic Limited | Method and apparatus for monitoring the flow of liquid and the like |
| US4080837A (en) | 1976-12-03 | 1978-03-28 | Continental Oil Company | Sonic measurement of flow rate and water content of oil-water streams |
| US4195517A (en) | 1978-12-18 | 1980-04-01 | The Foxboro Company | Ultrasonic flowmeter |
| US4445389A (en) | 1981-09-10 | 1984-05-01 | The United States Of America As Represented By The Secretary Of Commerce | Long wavelength acoustic flowmeter |
| US4896540A (en) | 1988-04-08 | 1990-01-30 | Parthasarathy Shakkottai | Aeroacoustic flowmeter |
| US5040415A (en) | 1990-06-15 | 1991-08-20 | Rockwell International Corporation | Nonintrusive flow sensing system |
| US5083452A (en) | 1987-12-18 | 1992-01-28 | Sensorteknikk A/S | Method for recording multi-phase flows through a transport system |
| WO1993014382A1 (en) | 1992-01-13 | 1993-07-22 | Jon Steinar Gudmundsson | Device and method for measuring multi phase flow |
| US5285675A (en) | 1992-06-05 | 1994-02-15 | University Of Florida Research Foundation, Inc. | Acoustic fluid flow monitoring |
| US5367911A (en) | 1991-03-21 | 1994-11-29 | Halliburton Logging Services, Inc. | Device for sensing fluid behavior |
| US5398542A (en) | 1992-10-16 | 1995-03-21 | Nkk Corporation | Method for determining direction of travel of a wave front and apparatus therefor |
| US5524475A (en) | 1994-11-10 | 1996-06-11 | Atlantic Richfield Company | Measuring vibration of a fluid stream to determine gas fraction |
| US5526844A (en) | 1986-03-04 | 1996-06-18 | Deka Products Limited Partnership | Flow conrol system |
| US5591922A (en) | 1994-05-27 | 1997-01-07 | Schlumberger Technology Corporation | Method and apparatus for measuring multiphase flows |
| US5741980A (en) | 1994-11-02 | 1998-04-21 | Foster-Miller, Inc. | Flow analysis system and method |
| US5770806A (en) | 1994-04-19 | 1998-06-23 | Valtion Teknillinen Tutkimuskeskus | Acoustic flow measurement method and measurement apparatus implementing the method |
| US5835884A (en) | 1996-10-04 | 1998-11-10 | Brown; Alvin E. | Method of determining a characteristic of a fluid |
| US5856622A (en) | 1995-03-20 | 1999-01-05 | Fuji Electric Co., Ltd. | Clamp-on type ultrasonic flow meter and a temperature and pressure compensation method therein |
| US5948959A (en) | 1997-05-29 | 1999-09-07 | The United States Of America As Represented By The Secretary Of The Navy | Calibration of the normal pressure transfer function of a compliant fluid-filled cylinder |
| WO1999067629A1 (en) | 1998-06-24 | 1999-12-29 | Lattice Intellectual Property Limited | Measuring the speed of sound of a gas |
| WO2000060317A1 (en) | 1999-04-01 | 2000-10-12 | Panametrics, Inc. | Clamp-on ultrasonic flow meter for low density fluids |
| US6151958A (en) | 1996-03-11 | 2000-11-28 | Daniel Industries, Inc. | Ultrasonic fraction and flow rate apparatus and method |
| WO2001002810A1 (en) | 1999-07-02 | 2001-01-11 | Cidra Corporation | Flow rate measurement using unsteady pressures |
| US6202494B1 (en) | 1997-05-28 | 2001-03-20 | Degussa-Huls Aktiengesellschaft | Process and apparatus for measuring density and mass flow |
| US6354147B1 (en) | 1998-06-26 | 2002-03-12 | Cidra Corporation | Fluid parameter measurement in pipes using acoustic pressures |
| US6378357B1 (en) | 2000-03-14 | 2002-04-30 | Halliburton Energy Services, Inc. | Method of fluid rheology characterization and apparatus therefor |
| US6397683B1 (en) | 1998-07-22 | 2002-06-04 | Flowtec Ag | Clamp-on ultrasonic flowmeter |
| US6435030B1 (en) | 1999-06-25 | 2002-08-20 | Weatherford/Lamb, Inc. | Measurement of propagating acoustic waves in compliant pipes |
| US6450037B1 (en) | 1998-06-26 | 2002-09-17 | Cidra Corporation | Non-intrusive fiber optic pressure sensor for measuring unsteady pressures within a pipe |
| US6463813B1 (en) | 1999-06-25 | 2002-10-15 | Weatherford/Lamb, Inc. | Displacement based pressure sensor measuring unsteady pressure in a pipe |
| US6532827B1 (en) | 2001-09-06 | 2003-03-18 | Kazumasa Ohnishi | Clamp-on ultrasonic flowmeter |
| US20030089161A1 (en) | 2001-11-07 | 2003-05-15 | Gysling Daniel L. | Fluid density measurement using acoustic pressures for industrial sensing applications |
| US6587798B2 (en) | 2000-12-04 | 2003-07-01 | Weatherford/Lamb, Inc. | Method and system for determining the speed of sound in a fluid within a conduit |
| US20030136186A1 (en) | 2001-11-07 | 2003-07-24 | Weatherford/Lamb, Inc. | Phase flow measurement in pipes using a density meter |
| US20030154036A1 (en) | 2002-01-23 | 2003-08-14 | Gysling Daniel L. | Apparatus and method for measuring parameters of a mixture having solid particles suspended in a fluid flowing in a pipe |
| US6609069B2 (en) | 2000-12-04 | 2003-08-19 | Weatherford/Lamb, Inc. | Method and apparatus for determining the flow velocity of a fluid within a pipe |
| US6691584B2 (en) | 1999-07-02 | 2004-02-17 | Weatherford/Lamb, Inc. | Flow rate measurement using unsteady pressures |
| US20040069069A1 (en) | 2002-01-23 | 2004-04-15 | Gysling Daniel L. | Probe for measuring parameters of a flowing fluid and/or multiphase mixture |
| US20040074312A1 (en) | 2002-08-08 | 2004-04-22 | Gysling Daniel L. | Apparatus and method for measuring multi-Phase flows in pulp and paper industry applications |
| US6732575B2 (en)* | 1998-06-26 | 2004-05-11 | Cidra Corporation | Fluid parameter measurement for industrial sensing applications using acoustic pressures |
| US20040144182A1 (en) | 2002-11-15 | 2004-07-29 | Gysling Daniel L | Apparatus and method for providing a flow measurement compensated for entrained gas |
| US6782150B2 (en) | 2000-11-29 | 2004-08-24 | Weatherford/Lamb, Inc. | Apparatus for sensing fluid in a pipe |
| US20040168523A1 (en) | 2002-11-12 | 2004-09-02 | Fernald Mark R. | Apparatus having an array of piezoelectric film sensors for measuring parameters of a process flow within a pipe |
| US20040199341A1 (en) | 2003-01-21 | 2004-10-07 | Gysling Daniel L. | Measurement of entrained and dissolved gases in process flow lines |
| US20040210404A1 (en) | 2003-01-21 | 2004-10-21 | Gysling Daniel L | Apparatus and method of measuring gas volume fraction of a fluid flowing within a pipe |
| US20040255695A1 (en) | 2002-11-15 | 2004-12-23 | Gysling Daniel L. | Apparatus and method for providing a flow measurement compensated for entrained gas |
| US20050005712A1 (en)* | 2003-06-05 | 2005-01-13 | Gysling Daniel L. | Apparatus for measuring velocity and flow rate of a fluid having a non-negligible axial mach number using an array of sensors |
| US20050039520A1 (en) | 2003-08-01 | 2005-02-24 | Davis Michael A. | Method and apparatus for measuring parameters of a fluid flowing within a pipe using a configurable array of sensors |
| US6898541B2 (en) | 2000-12-04 | 2005-05-24 | Weatherford/Lamb, Inc. | Method and apparatus for determining component flow rates for a multiphase flow |
| US20050125166A1 (en)* | 2003-10-09 | 2005-06-09 | Loose Douglas H. | Method and apparatus for measuring a parameter of a fluid flowing within a pipe using an array of sensors |
| US20050171710A1 (en) | 2002-01-23 | 2005-08-04 | Cidra Corporation | Apparatus and method for measuring parameters of a mixture having solid particles suspended in a fluid flowing in a pipe |
| US6945095B2 (en) | 2003-01-21 | 2005-09-20 | Weatherford/Lamb, Inc. | Non-intrusive multiphase flow meter |
| US6950760B2 (en) | 2002-03-29 | 2005-09-27 | Invensys Systems, Inc. | Startup and operational techniques for a digital flowmeter |
| US20050227538A1 (en) | 2004-03-23 | 2005-10-13 | Engel Thomas W | Piezocable based sensor for measuring unsteady pressures inside a pipe |
| US7032432B2 (en) | 2002-01-23 | 2006-04-25 | Cidra Corporation | Apparatus and method for measuring parameters of a mixture having liquid droplets suspended in a vapor flowing in a pipe |
Family Cites Families (3)
| Publication number | Priority date | Publication date | Assignee | Title |
|---|---|---|---|---|
| US5202494A (en)* | 1990-05-31 | 1993-04-13 | Phillips Petroleum Company | Continuous process for the production of disulfides |
| JP3175515B2 (en)* | 1994-12-26 | 2001-06-11 | キヤノン株式会社 | Exposure apparatus and device manufacturing method using the same |
| US6813962B2 (en)* | 2000-03-07 | 2004-11-09 | Weatherford/Lamb, Inc. | Distributed sound speed measurements for multiphase flow measurement |
- 2004
- 2004-12-13WOPCT/US2004/042037patent/WO2005059479A1/enactiveApplication Filing
- 2004-12-13USUS11/011,453patent/US7152003B2/ennot_activeExpired - Lifetime
- 2006
- 2006-12-19USUS11/642,007patent/US7379828B2/ennot_activeExpired - Lifetime
Patent Citations (57)
| Publication number | Priority date | Publication date | Assignee | Title |
|---|---|---|---|---|
| US4048853A (en) | 1974-12-11 | 1977-09-20 | Detectronic Limited | Method and apparatus for monitoring the flow of liquid and the like |
| US4080837A (en) | 1976-12-03 | 1978-03-28 | Continental Oil Company | Sonic measurement of flow rate and water content of oil-water streams |
| US4195517A (en) | 1978-12-18 | 1980-04-01 | The Foxboro Company | Ultrasonic flowmeter |
| US4445389A (en) | 1981-09-10 | 1984-05-01 | The United States Of America As Represented By The Secretary Of Commerce | Long wavelength acoustic flowmeter |
| US5526844A (en) | 1986-03-04 | 1996-06-18 | Deka Products Limited Partnership | Flow conrol system |
| US5083452A (en) | 1987-12-18 | 1992-01-28 | Sensorteknikk A/S | Method for recording multi-phase flows through a transport system |
| US4896540A (en) | 1988-04-08 | 1990-01-30 | Parthasarathy Shakkottai | Aeroacoustic flowmeter |
| US5040415A (en) | 1990-06-15 | 1991-08-20 | Rockwell International Corporation | Nonintrusive flow sensing system |
| US5367911A (en) | 1991-03-21 | 1994-11-29 | Halliburton Logging Services, Inc. | Device for sensing fluid behavior |
| WO1993014382A1 (en) | 1992-01-13 | 1993-07-22 | Jon Steinar Gudmundsson | Device and method for measuring multi phase flow |
| US5285675A (en) | 1992-06-05 | 1994-02-15 | University Of Florida Research Foundation, Inc. | Acoustic fluid flow monitoring |
| US5398542A (en) | 1992-10-16 | 1995-03-21 | Nkk Corporation | Method for determining direction of travel of a wave front and apparatus therefor |
| US5770806A (en) | 1994-04-19 | 1998-06-23 | Valtion Teknillinen Tutkimuskeskus | Acoustic flow measurement method and measurement apparatus implementing the method |
| US5591922A (en) | 1994-05-27 | 1997-01-07 | Schlumberger Technology Corporation | Method and apparatus for measuring multiphase flows |
| US5741980A (en) | 1994-11-02 | 1998-04-21 | Foster-Miller, Inc. | Flow analysis system and method |
| US5524475A (en) | 1994-11-10 | 1996-06-11 | Atlantic Richfield Company | Measuring vibration of a fluid stream to determine gas fraction |
| US5856622A (en) | 1995-03-20 | 1999-01-05 | Fuji Electric Co., Ltd. | Clamp-on type ultrasonic flow meter and a temperature and pressure compensation method therein |
| US6151958A (en) | 1996-03-11 | 2000-11-28 | Daniel Industries, Inc. | Ultrasonic fraction and flow rate apparatus and method |
| US5835884A (en) | 1996-10-04 | 1998-11-10 | Brown; Alvin E. | Method of determining a characteristic of a fluid |
| US6202494B1 (en) | 1997-05-28 | 2001-03-20 | Degussa-Huls Aktiengesellschaft | Process and apparatus for measuring density and mass flow |
| US5948959A (en) | 1997-05-29 | 1999-09-07 | The United States Of America As Represented By The Secretary Of The Navy | Calibration of the normal pressure transfer function of a compliant fluid-filled cylinder |
| WO1999067629A1 (en) | 1998-06-24 | 1999-12-29 | Lattice Intellectual Property Limited | Measuring the speed of sound of a gas |
| US6862920B2 (en) | 1998-06-26 | 2005-03-08 | Weatherford/Lamb, Inc. | Fluid parameter measurement in pipes using acoustic pressures |
| US6354147B1 (en) | 1998-06-26 | 2002-03-12 | Cidra Corporation | Fluid parameter measurement in pipes using acoustic pressures |
| US6732575B2 (en)* | 1998-06-26 | 2004-05-11 | Cidra Corporation | Fluid parameter measurement for industrial sensing applications using acoustic pressures |
| US6450037B1 (en) | 1998-06-26 | 2002-09-17 | Cidra Corporation | Non-intrusive fiber optic pressure sensor for measuring unsteady pressures within a pipe |
| US6397683B1 (en) | 1998-07-22 | 2002-06-04 | Flowtec Ag | Clamp-on ultrasonic flowmeter |
| WO2000060317A1 (en) | 1999-04-01 | 2000-10-12 | Panametrics, Inc. | Clamp-on ultrasonic flow meter for low density fluids |
| US6435030B1 (en) | 1999-06-25 | 2002-08-20 | Weatherford/Lamb, Inc. | Measurement of propagating acoustic waves in compliant pipes |
| US6463813B1 (en) | 1999-06-25 | 2002-10-15 | Weatherford/Lamb, Inc. | Displacement based pressure sensor measuring unsteady pressure in a pipe |
| US6691584B2 (en) | 1999-07-02 | 2004-02-17 | Weatherford/Lamb, Inc. | Flow rate measurement using unsteady pressures |
| US6889562B2 (en) | 1999-07-02 | 2005-05-10 | Cidra Corporation | Flow rate measurement for industrial sensing applications using unsteady pressures |
| WO2001002810A1 (en) | 1999-07-02 | 2001-01-11 | Cidra Corporation | Flow rate measurement using unsteady pressures |
| US6378357B1 (en) | 2000-03-14 | 2002-04-30 | Halliburton Energy Services, Inc. | Method of fluid rheology characterization and apparatus therefor |
| US6782150B2 (en) | 2000-11-29 | 2004-08-24 | Weatherford/Lamb, Inc. | Apparatus for sensing fluid in a pipe |
| US6898541B2 (en) | 2000-12-04 | 2005-05-24 | Weatherford/Lamb, Inc. | Method and apparatus for determining component flow rates for a multiphase flow |
| US6587798B2 (en) | 2000-12-04 | 2003-07-01 | Weatherford/Lamb, Inc. | Method and system for determining the speed of sound in a fluid within a conduit |
| US6609069B2 (en) | 2000-12-04 | 2003-08-19 | Weatherford/Lamb, Inc. | Method and apparatus for determining the flow velocity of a fluid within a pipe |
| US6532827B1 (en) | 2001-09-06 | 2003-03-18 | Kazumasa Ohnishi | Clamp-on ultrasonic flowmeter |
| US20030136186A1 (en) | 2001-11-07 | 2003-07-24 | Weatherford/Lamb, Inc. | Phase flow measurement in pipes using a density meter |
| US20030089161A1 (en) | 2001-11-07 | 2003-05-15 | Gysling Daniel L. | Fluid density measurement using acoustic pressures for industrial sensing applications |
| US20040069069A1 (en) | 2002-01-23 | 2004-04-15 | Gysling Daniel L. | Probe for measuring parameters of a flowing fluid and/or multiphase mixture |
| US20030154036A1 (en) | 2002-01-23 | 2003-08-14 | Gysling Daniel L. | Apparatus and method for measuring parameters of a mixture having solid particles suspended in a fluid flowing in a pipe |
| US20050171710A1 (en) | 2002-01-23 | 2005-08-04 | Cidra Corporation | Apparatus and method for measuring parameters of a mixture having solid particles suspended in a fluid flowing in a pipe |
| US7032432B2 (en) | 2002-01-23 | 2006-04-25 | Cidra Corporation | Apparatus and method for measuring parameters of a mixture having liquid droplets suspended in a vapor flowing in a pipe |
| US6950760B2 (en) | 2002-03-29 | 2005-09-27 | Invensys Systems, Inc. | Startup and operational techniques for a digital flowmeter |
| US20040074312A1 (en) | 2002-08-08 | 2004-04-22 | Gysling Daniel L. | Apparatus and method for measuring multi-Phase flows in pulp and paper industry applications |
| US20040168523A1 (en) | 2002-11-12 | 2004-09-02 | Fernald Mark R. | Apparatus having an array of piezoelectric film sensors for measuring parameters of a process flow within a pipe |
| US20040144182A1 (en) | 2002-11-15 | 2004-07-29 | Gysling Daniel L | Apparatus and method for providing a flow measurement compensated for entrained gas |
| US20040255695A1 (en) | 2002-11-15 | 2004-12-23 | Gysling Daniel L. | Apparatus and method for providing a flow measurement compensated for entrained gas |
| US20040210404A1 (en) | 2003-01-21 | 2004-10-21 | Gysling Daniel L | Apparatus and method of measuring gas volume fraction of a fluid flowing within a pipe |
| US20040199341A1 (en) | 2003-01-21 | 2004-10-07 | Gysling Daniel L. | Measurement of entrained and dissolved gases in process flow lines |
| US6945095B2 (en) | 2003-01-21 | 2005-09-20 | Weatherford/Lamb, Inc. | Non-intrusive multiphase flow meter |
| US20050005712A1 (en)* | 2003-06-05 | 2005-01-13 | Gysling Daniel L. | Apparatus for measuring velocity and flow rate of a fluid having a non-negligible axial mach number using an array of sensors |
| US20050039520A1 (en) | 2003-08-01 | 2005-02-24 | Davis Michael A. | Method and apparatus for measuring parameters of a fluid flowing within a pipe using a configurable array of sensors |
| US20050125166A1 (en)* | 2003-10-09 | 2005-06-09 | Loose Douglas H. | Method and apparatus for measuring a parameter of a fluid flowing within a pipe using an array of sensors |
| US20050227538A1 (en) | 2004-03-23 | 2005-10-13 | Engel Thomas W | Piezocable based sensor for measuring unsteady pressures inside a pipe |
Non-Patent Citations (8)
| Title |
|---|
| "Development of an array of pressure sensors with PVDF film, Experiments in Fluids 26", Jan. 8, 1999, Springer-Verlag, 9 pages. |
| "New Flowmeter Principle"-By: Walt Boyes-Published in Flow Control Magazine-Oct. 2003 Issue, 1 page. |
| "Noise and Vibration Control Engineering Principles and Applications", Leo L. Beranek and Istvan L. Ver, A. Wiley Interscience Publication, pp. 537-541, Aug. 1992. |
| "Piezoelectric Polymers"-By: J.S. Harrison and Z. Ounaies-ICASE Report, 2001- 27 pages. |
| "Two Decades of Array Signal Processing Research", The Parametric Approach, H. Krim and M. Viberg, IEEE Signal Processing Magazine, Jul. 1996, pp. 67-94. |
| Sonar Based Volumetric Flow and Entrained Air Measurement for Pulp and Paper Applications-By: Daniel L. Gysling & Douglas H. Loose-Jan. 24, 2003, 5 pages. |
| Sonar Based Volumetric Flow Meter for Chemical and Petrochemical Applications-By: Daniel L. Gysling & Douglas H. Loose-Feb. 14, 2003, 8 pages. |
| Sonar-Based Volumetric Flow Meter for Pulp and Paper Applications-By: Daniel L. Gysling & Douglas H. Loose-Dec. 3, 2002, 5 pages. |
Cited By (13)
| Publication number | Priority date | Publication date | Assignee | Title |
|---|---|---|---|---|
| US7657392B2 (en)* | 2005-05-16 | 2010-02-02 | Cidra Corporate Services, Inc. | Method and apparatus for detecting and characterizing particles in a multiphase fluid |
| US20070005272A1 (en)* | 2005-05-16 | 2007-01-04 | Gysling Daniel L | Method and apparatus for detecting and characterizing particles in a multiphase fluid |
| US20070006656A1 (en)* | 2005-07-11 | 2007-01-11 | General Electric Company | System and method for monitoring deposition within tubes of a heating system |
| US20110000281A1 (en)* | 2009-07-06 | 2011-01-06 | Thermo Diagnostics Company LLC | Method and System for Monitoring Steam Quality |
| US8325049B2 (en) | 2009-07-06 | 2012-12-04 | Thermo Diagnostics Company LLC | Method and system for measuring temperature and pressure in different regions to determine steam quality |
| US8816865B1 (en) | 2009-07-06 | 2014-08-26 | Walter T. Deacon | Method and system for measuring temperature and pressure in different regions to determine steam quality |
| US9297733B2 (en) | 2010-03-09 | 2016-03-29 | Cidra Corporate Services Inc. | Dispersion compensation technique for differential sonar measurement—density meter |
| US20150232288A1 (en)* | 2012-08-17 | 2015-08-20 | J.O.A. Technology Beheer B.V. | Method of, a control system, a device, a sensor and a computer program product for controlling transport of fibrous material in a transport line of a pneumatic conveying system |
| US10227186B2 (en)* | 2012-08-17 | 2019-03-12 | J.O.A. Technology Beheer B.V. | Method of, a control system, a device, a sensor and a computer program product for controlling transport of fibrous material in a transport line of a pneumatic conveying system |
| US9410422B2 (en) | 2013-09-13 | 2016-08-09 | Chevron U.S.A. Inc. | Alternative gauging system for production well testing and related methods |
| US20170030748A1 (en)* | 2015-07-28 | 2017-02-02 | Expro Meters, Inc. | Methodology and apparatus for distinguishing single phase fluid flows from multiphase fluid flows using a flow meter |
| US10704939B2 (en)* | 2015-07-28 | 2020-07-07 | Expro Meters, Inc. | Methodology and apparatus for distinguishing single phase fluid flows from multiphase fluid flows using a flow meter |
| US11486892B2 (en)* | 2016-10-25 | 2022-11-01 | Air Water Biodesign Inc. | Fluid measuring device |
Also Published As
| Publication number | Publication date |
|---|---|
| US20050159904A1 (en) | 2005-07-21 |
| US20070118304A1 (en) | 2007-05-24 |
| WO2005059479A1 (en) | 2005-06-30 |
| US7379828B2 (en) | 2008-05-27 |
Similar Documents
| Publication | Publication Date | Title |
|---|---|---|
| US7379828B2 (en) | Method and apparatus for determining a quality metric of a measurement of a fluid parameter | |
| US7171315B2 (en) | Method and apparatus for measuring a parameter of a fluid flowing within a pipe using sub-array processing | |
| US7503227B2 (en) | Method and apparatus for measuring parameters of a fluid flow using an array of sensors | |
| US7253742B2 (en) | Method and apparatus for measuring parameters of a fluid flowing within a pipe using a configurable array of sensors | |
| US7418877B2 (en) | Wet gas metering using a differential pressure based flow meter with a sonar based flow meter | |
| US7673524B2 (en) | Method and apparatus for measuring a parameter of a fluid flowing within a pipe having a sensing device with multiple sensor segments | |
| EP1735597B1 (en) | Method and apparatus for measuring parameters of a stratified flow | |
| US7127360B2 (en) | Dual function flow measurement apparatus having an array of sensors | |
| US7603916B2 (en) | Wet gas metering using a differential pressure and a sonar based flow meter | |
| US7237440B2 (en) | Flow measurement apparatus having strain-based sensors and ultrasonic sensors | |
| US7295933B2 (en) | Configurable multi-function flow measurement apparatus having an array of sensors | |
| US7437946B2 (en) | Apparatus and method for measuring a parameter of a multiphase flow | |
| US7454981B2 (en) | Apparatus and method for determining a parameter in a wet gas flow | |
| US7197938B2 (en) | Contact-based transducers for characterizing unsteady pressures in pipes | |
| US7249525B1 (en) | Apparatus for measuring parameters of a fluid in a lined pipe | |
| US7440873B2 (en) | Apparatus and method of processing data to improve the performance of a flow monitoring system | |
| US20040210404A1 (en) | Apparatus and method of measuring gas volume fraction of a fluid flowing within a pipe | |
| US20050050956A1 (en) | Contact-based transducers for characterizing unsteady pressures in pipes | |
| CA2612625A1 (en) | Wet gas metering using a differential pressure based flow meter with a sonar based flow meter | |
| US9995609B2 (en) | Single wrapped sensor flow meter |
Legal Events
| Date | Code | Title | Description |
|---|---|---|---|
| AS | Assignment | Owner name:CIDRA CORPORATION, CONNECTICUT Free format text:ASSIGNMENT OF ASSIGNORS INTEREST;ASSIGNORS:LOOSE, DOUGLAS H.;DAVIS, MICHAEL A.;REEL/FRAME:016414/0617;SIGNING DATES FROM 20050218 TO 20050222 | |
| STCF | Information on status: patent grant | Free format text:PATENTED CASE | |
| AS | Assignment | Owner name:EXPRO METERS, INC., CONNECTICUT Free format text:MERGER;ASSIGNOR:CIDRA CORPORATION;REEL/FRAME:021561/0100 Effective date:20080623 Owner name:EXPRO METERS, INC.,CONNECTICUT Free format text:MERGER;ASSIGNOR:CIDRA CORPORATION;REEL/FRAME:021561/0100 Effective date:20080623 | |
| FPAY | Fee payment | Year of fee payment:4 | |
| AS | Assignment | Owner name:HSBC CORPORATE TRUSTEE COMAPNY (UK) LIMITED, UNITE Free format text:SECURITY AGREEMENT;ASSIGNOR:EXPRO METERS, INC.;REEL/FRAME:027630/0109 Effective date:20111209 Owner name:HSBC CORPORATE TRUSTEE COMPANY (UK) LIMITED, UNITE Free format text:SECURITY AGREEMENT;ASSIGNOR:EXPRO METERS, INC.;REEL/FRAME:027630/0109 Effective date:20111209 | |
| FPAY | Fee payment | Year of fee payment:8 | |
| AS | Assignment | Owner name:HSBC CORPORATE TRUSTEE COMPANY (UK) LIMITED, AS CO Free format text:INTELLECTUAL PROPERTY SECURITY AGREEMENT;ASSIGNOR:EXPRO METERS, INC.;REEL/FRAME:033687/0078 Effective date:20140902 | |
| AS | Assignment | Owner name:WEBSTER BANK, NATIONAL ASSOCIATION, CONNECTICUT Free format text:PATENT COLLATERAL ASSIGNMENT AND SECURITY AGREEMENT;ASSIGNOR:CIDRA CORPORATE SERVICES, INC.;REEL/FRAME:036818/0469 Effective date:20150902 | |
| AS | Assignment | Owner name:CIDRA CORPORATE SERVICES, INC., CONNECTICUT Free format text:RELEASE AND REASSIGNMENT OF PATENTS;ASSIGNOR:WEBSTER BANK, NATIONAL ASSOCIATION;REEL/FRAME:044097/0723 Effective date:20170929 | |
| AS | Assignment | Owner name:EXPRO METERS, INC., TEXAS Free format text:RELEASE BY SECURED PARTY;ASSIGNOR:HSBC CORPORATE TRUSTEE COMPANY (UK) LIMITED, AS COLLATERAL AGENT;REEL/FRAME:045271/0842 Effective date:20180205 | |
| MAFP | Maintenance fee payment | Free format text:PAYMENT OF MAINTENANCE FEE, 12TH YR, SMALL ENTITY (ORIGINAL EVENT CODE: M2553) Year of fee payment:12 |