US6989100B2 - Methods for time-alignment of liquid chromatography-mass spectrometry data - Google Patents
Methods for time-alignment of liquid chromatography-mass spectrometry dataDownload PDFInfo
- Publication number
- US6989100B2 US6989100B2US10/435,581US43558103AUS6989100B2US 6989100 B2US6989100 B2US 6989100B2US 43558103 AUS43558103 AUS 43558103AUS 6989100 B2US6989100 B2US 6989100B2
- Authority
- US
- United States
- Prior art keywords
- data sets
- data set
- peaks
- aligned
- mass
- Prior art date
- Legal status (The legal status is an assumption and is not a legal conclusion. Google has not performed a legal analysis and makes no representation as to the accuracy of the status listed.)
- Expired - Lifetime, expires
Links
Images


Classifications
- H—ELECTRICITY
- H01—ELECTRIC ELEMENTS
- H01J—ELECTRIC DISCHARGE TUBES OR DISCHARGE LAMPS
- H01J49/00—Particle spectrometers or separator tubes
- H01J49/0027—Methods for using particle spectrometers
- H01J49/0036—Step by step routines describing the handling of the data generated during a measurement
- G—PHYSICS
- G01—MEASURING; TESTING
- G01N—INVESTIGATING OR ANALYSING MATERIALS BY DETERMINING THEIR CHEMICAL OR PHYSICAL PROPERTIES
- G01N30/00—Investigating or analysing materials by separation into components using adsorption, absorption or similar phenomena or using ion-exchange, e.g. chromatography or field flow fractionation
- G01N30/02—Column chromatography
- G01N30/86—Signal analysis
- G01N30/8624—Detection of slopes or peaks; baseline correction
- G—PHYSICS
- G01—MEASURING; TESTING
- G01N—INVESTIGATING OR ANALYSING MATERIALS BY DETERMINING THEIR CHEMICAL OR PHYSICAL PROPERTIES
- G01N30/00—Investigating or analysing materials by separation into components using adsorption, absorption or similar phenomena or using ion-exchange, e.g. chromatography or field flow fractionation
- G01N30/02—Column chromatography
- G01N30/86—Signal analysis
- G01N30/8665—Signal analysis for calibrating the measuring apparatus
- G01N30/8668—Signal analysis for calibrating the measuring apparatus using retention times
- G—PHYSICS
- G01—MEASURING; TESTING
- G01N—INVESTIGATING OR ANALYSING MATERIALS BY DETERMINING THEIR CHEMICAL OR PHYSICAL PROPERTIES
- G01N30/00—Investigating or analysing materials by separation into components using adsorption, absorption or similar phenomena or using ion-exchange, e.g. chromatography or field flow fractionation
- G01N30/02—Column chromatography
- G01N30/62—Detectors specially adapted therefor
- G01N30/72—Mass spectrometers
- G01N30/7233—Mass spectrometers interfaced to liquid or supercritical fluid chromatograph
- G—PHYSICS
- G01—MEASURING; TESTING
- G01N—INVESTIGATING OR ANALYSING MATERIALS BY DETERMINING THEIR CHEMICAL OR PHYSICAL PROPERTIES
- G01N30/00—Investigating or analysing materials by separation into components using adsorption, absorption or similar phenomena or using ion-exchange, e.g. chromatography or field flow fractionation
- G01N30/02—Column chromatography
- G01N30/86—Signal analysis
- G01N30/8624—Detection of slopes or peaks; baseline correction
- G01N30/8631—Peaks
- G—PHYSICS
- G01—MEASURING; TESTING
- G01N—INVESTIGATING OR ANALYSING MATERIALS BY DETERMINING THEIR CHEMICAL OR PHYSICAL PROPERTIES
- G01N30/00—Investigating or analysing materials by separation into components using adsorption, absorption or similar phenomena or using ion-exchange, e.g. chromatography or field flow fractionation
- G01N30/02—Column chromatography
- G01N30/86—Signal analysis
- G01N30/8624—Detection of slopes or peaks; baseline correction
- G01N30/8644—Data segmentation, e.g. time windows
- G—PHYSICS
- G06—COMPUTING OR CALCULATING; COUNTING
- G06F—ELECTRIC DIGITAL DATA PROCESSING
- G06F2218/00—Aspects of pattern recognition specially adapted for signal processing
- G06F2218/12—Classification; Matching
Definitions
- the present inventionrelates generally to analysis of data collected by analytical techniques such as chromatography and spectrometry. More particularly, it relates to methods for time-aligning multi-dimensional chromatograms of different samples to enable automated comparison among sample data.
- LC-MSliquid chromatography-mass spectrometry
- LC-MS dataare reported as intensity or abundance of ions of varying mass-to-charge ratio (m/z) at varying chromatographic retention times.
- a two-dimensional spectrum of LC-MS data from a single sampleis shown in FIG. 1 , in which the darkness of points corresponds to signal intensity.
- a horizontal slice of the spectrumyields a mass chromatogram, the abundance of ions in a particular m/z range as a function of retention time.
- a vertical sliceis a mass spectrum, a plot of abundance of ions of varying m/z at a particular retention time interval.
- the two-dimensional dataare acquired by performing a mass scan at regular intervals of retention time.
- TICtotal ion chromatogram
- a time warping algorithmis applied to gas chromatography/Fourier transform infrared (FT-IR)/mass spectrometry data from a gasoline sample in C. P. Wang and T. L. Isenhour, “Time-warping algorithm applied to chromatographic peak matching gas chromatography/Fourier transform infrared/mass spectrometry,” Anal. Chem. 59: 649–654, 1987.
- FT-IRgas chromatography/Fourier transform infrared
- FIG. 1shows a sample two-dimensional liquid chromatography-mass spectrometry (LC-MS) data set.
- FIG. 2is a schematic diagram of portions of total ion chromatograms of two different samples, illustrating the difficulties in properly time-aligning spectra.
- FIG. 3is a flow diagram of one embodiment of the present invention, a method for comparing samples.
- FIGS. 4A–4Billustrate aspects of a dynamic time warping (DTW) method according to one embodiment of the present invention.
- DTWdynamic time warping
- FIG. 5shows a grid of chromatographic time points, used in DTW, with an optimal route through the grid indicated.
- FIGS. 6A–6Billustrate two constraints on a DTW method according to one embodiment of the present invention.
- FIGS. 7A–7Cillustrate aspects of a locally-weighted regression smoothing method according to one embodiment of the present invention.
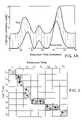
- FIGS. 8A–8Bshow corresponding peaks of one reference and three test LC-MS data sets before and after time-alignment by DTW.
- FIG. 9is a plot showing results of alignment of LC-MS data sets by robust LOESS and DTW.
- Various embodiments of the present inventionprovide methods for time-aligning two-dimensional chromatography-mass spectrometry data sets, such as liquid chromatography-mass spectrometry (LC-MS) data sets, also referred to as spectra.
- LC-MSliquid chromatography-mass spectrometry
- spectrachromatography-mass spectrometry
- LC-MSliquid chromatography-mass spectrometry
- Additional embodimentsprovide methods for comparing samples and data sets, methods for identifying biological markers (biomarkers), aligned spectra produced according to these methods, samples compared according to these methods, biomarkers identified according to these methods, and methods for using the identified biomarkers for diagnostic and therapeutic applications.
- the methodsare effective at aligning two-dimensional data sets obtained from both simple and complex samples.
- complex and simpleare relative terms and are not intended to limit the scope of the present invention in any way, complex samples typically have many more and more densely spaced spectral peaks than do simple samples.
- complex samplessuch as biological samples may have upwards of hundreds or thousands of peaks in sixty minutes of retention time, such that the total ion chromatogram (TIC) is too complex to allow resolution of individual features.
- the methods in embodiments of the present inventionuse data from individual mass chromatograms, i.e., data representing abundances or intensities of ions in particular m/z ranges at particular retention times.
- the m/z range included within a single mass chromatogrammay reflect the instrument precision or may be the result of preprocessing (e.g., binning) of the raw data, and is typically on the order of between about 0.1 and 1.0 atomic mass unit (amu). Mass scans typically occur at intervals of between about one and about three seconds.
- computationsare referred to as being performed “in dependence on at least two mass chromatograms from each data set.” This phrase is to be understood as referring to computations on individual data from a mass chromatogram, rather than to data summed over a number of chromatograms.
- the second dimensionmay be any type of electromagnetic spectroscopy such as microwave, far infrared, infrared, Raman or resonance Raman, visible, ultraviolet, far ultraviolet, vacuum ultraviolet, x-ray, or ultraviolet fluorescence or phosphorescence; any magnetic resonance spectroscopy, such as nuclear magnetic resonance (WR) or electron paramagnetic resonance (EPR); and any type of mass spectrometry, including ionization methods such as electron impact, chemical, thermospray, electrospray, matrix assisted laser desorption, and inductively coupled plasma ionization, and any detection methods, including sector, quadrupole, ion trap, time of flight, and Fourier transform detection.
- electromagnetic spectroscopysuch as microwave, far infrared, infrared, Raman or resonance Raman, visible, ultraviolet, far ultraviolet, vacuum ultraviolet, x-ray, or ultraviolet fluorescence or phosphorescence
- any magnetic resonance spectroscopysuch as nuclear magnetic resonance (WR) or electron paramagnetic resonance (EPR)
- EPRelectron par
- Time-alignment methodsare applied to data sets acquired by performing chromatographic and spectrometric or spectroscopic methods on chemical or biological samples.
- the samplescan be in any homogeneous or heterogeneous form that is compatible with the chromatographic instrument, for example, one or more of a gas, liquid, solid, gel, or liquid crystal.
- Biological samples that can be analyzed by embodiments of the present inventioninclude, without limitation, whole organisms; parts of organisms (e.g., tissue samples); tissue homogenates, extracts, infusions, suspensions, excretions, secretions, or emissions; administered and recovered material; and culture supernatants.
- biological fluidsinclude, without limitation, whole blood, blood plasma, blood serum, urine, bile, cerebrospinal fluid, milk, saliva, mucus, sweat, gastric juice, pancreatic juice, seminal fluid, prostatic fluid, sputum, broncheoalveolar lavage, and synovial fluid, and any cell suspensions, extracts, or concentrates of these fluids.
- Non-biological samplesinclude air, water, liquids from manufacturing wastes or processes, foods, and the like. Samples may be correlated with particular subjects, cohorts, conditions, time points, or any other suitable descriptor or category.
- FIG. 3is a flow diagram of a general method 20 according to one embodiment of the present invention.
- the methodis typically implemented in software by a computer system in communication with an analytical instrument such as a liquid chromatography-mass spectrometry (LC-MS) instrument.
- LC-MSliquid chromatography-mass spectrometry
- a first step 22raw data sets are obtained, e.g., from the instrument, from a different computer system, or from a data storage device.
- the data setswhich are also referred to as spectra or two-dimensional data sets or spectra, contain intensity values for discrete values (or ranges of values) of chromatographic retention time (or scan index) and mass-to-charge ratio (m/z).
- the data setsare preprocessed using conventional algorithms.
- preprocessing techniques appliedinclude, without limitation, baseline subtraction, smoothing, noise reduction, de-isotoping, normalization, and peak list creation.
- the datacan be binned into defined m/z intervals to create mass chromatograms. Data are collected at discrete scan times, but m/z values in the mass spectra are typically of very high mass precision. In order to create mass chromatograms, data falling within a specified m/z interval (e.g., 0.5 amu) are combined into a composite value for that interval. Any suitable binning algorithm may be employed; as is known in the art, the selection of a binning algorithm and its parameters may have implications for data smoothness, fidelity, and quality.
- a time-aligning algorithmis applied to one or more pair of data sets.
- One data setcan be chosen (arbitrarily or according to a criterion) to serve as a reference spectrum and all other data sets time-aligned to this spectrum.
- the reference data setcan correspond to the sample analyzed in the middle of the process.
- a feedback methodcan be implemented in which the degree of time shift is measured for each data set, potentially with respect to one or more of the data sets chosen arbitrarily as a reference data set, and the one with a median time shift, according to some metric, selected as the reference data set.
- Data setscan also be evaluated by a perceived or actual quality metric to determine which to select as the reference data set.
- the aligned data setscan be compared automatically in step 28 to locate features that differentiate the spectra. For example, a peak that occurs in only certain spectra or at significantly different intensity levels in different spectra may represent a biological marker or a component of a biological marker that is indicative of or diagnostic for a characteristic of the relevant samples (e.g., disease, response to therapy, patient group, disease progression). If desired, the identity of the ions responsible for the distinguishing features can be identified. Biological markers may also be more complex combinations of spectral features or sample components with or without other clinical or biological factors. Identifying spectral differences and biological markers is a multi-step process and will not be described in detail herein.
- Step 26time-aligning pairs of spectra, can be implemented in many different ways.
- spectraare aligned using a variation of a dynamic time warping (DTW) method.
- DTWis a dynamic programming technique that was developed in the field of speech recognition for time-aligning speech patterns and is described in H. Sakoe and S. Chiba, “Dynamic programming algorithm optimization for spoken word recognition,” IEEE Trans. Acoust., Speech, Signal Process. ASSP-26: 43–49, 1978, which is incorporated herein by reference.
- DTWaligns two data sets by nonlinearly stretching and contracting (“warping”) the time component of the data sets to synchronize spectral features and yield a minimum distance between the two spectra.
- warpingnonlinearly stretching and contracting
- a test data setis warped to align with a reference data set.
- both data setsare adjusted to fit a common time index. The following description is of asymmetric warping, but it will be apparent to one of ordinary skill in the art, upon reading this description, how to perform the analogous symmetric warping.
- FIG. 4Ais a plot of two chromatograms, labeled test and reference, whose time scales are nonlinearly related. That is, peaks representing identical analytes, referred to as corresponding peaks (and the corresponding points that make up these peaks), occur at different retention times, and there is no linear transformation of time components that will map corresponding peaks to the same retention times.
- peaks representing identical analytesreferred to as corresponding peaks (and the corresponding points that make up these peaks)
- time componentsthat will map corresponding peaks to the same retention times.
- each data setconsists of discrete values (an entire mass spectrum) at a sequence of time indices; for clarity, only a single intensity value, rather than an entire mass spectrum, is shown at each time point.
- corresponding pointsare connected by dashed lines, which represent a mapping of time points in the reference data set to time points in the test data set.
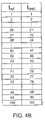
- This mappingis shown more explicitly in the table of FIG. 4B .
- the object of a DTW algorithmis to identify this time point mapping, from which an aligned reference data set may be constructed. Note that DTW aligns the entire data set, and not just peaks of the data set, and that DTW yields a discrete time point mapping, rather-than a function that transforms the original time points into aligned time points. As a result, some points (reference and test) do not get mapped, and unmapped points can be handled as described below.
- the DTW methodconsiders a set of possible time point mappings and identifies the mapping that minimizes an accumulated distance function between the reference and test data sets.
- the routewould be a diagonal beginning in the upper left cell and proceeding to the lower right cell of the grid.
- the selected routerepresents the optimal time point mapping.
- the set of possible routesis limited by three types of constraints: endpoint constraints; a local continuity constraint, which defines local features of the path; and a global constraint, which defines the allowable search space for the path.
- the endpoint constraintequates the first and last time point in each data set.
- the optimal path through the gridis one that minimizes the accumulated distance function between the test and reference data sets over the route.
- Each cell [i, j]has an associated distance function between data sets at the particular i and j time indices.
- a routeis chosen through the matrix that minimizes the accumulated distance function obtained by summing the values in each cell traversed, subject to the above-described constraints. Note that the two terms distance and route are not related; the distance refers to a metric of the dissimilarity between data sets, while the route refers to a path through the grid and has no relevant distance.
- the route-finding problemcan be addressed using a dynamic programming approach, in which the larger optimization problem is reduced to a series of local problems.
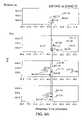
- the optimal one of the three ( FIG. 6A ) single-step pathsis identified.
- a globally optimal routeis reconstructed by stepping backwards through the grid from the last cell.
- D i,j (1)D i ⁇ 2,j ⁇ 1 +2 d i ⁇ 1,j +d i,j
- D i,j (2)D i ⁇ 1,j ⁇ 1 +2 d i,j
- D i,j (3)D i ⁇ 1,j ⁇ 2 +2 d i,j ⁇ 1 +d i,j (3)
- D i,j (p)represents the accumulated distance from [1, 1] to [i, j] when path p is traversed
- d i,jis computed from equation (2)
- D i ⁇ 1,j ⁇ 1 , D i ⁇ 2, j ⁇ 1 , and D i ⁇ 1,j ⁇ 2are evaluated in previous steps.
- the coefficient 2is a weighting factor that inclines the path to follow the diagonal. It may take on other values as desired.
- the dynamic programming algorithmproceeds by stepping through each cell and finding and storing the minimum accumulated distances and optimal indices. Typically the process begins at the top left cell of the grid and moves down through all allowed cells before moving to the next column, with the allowable cells in each column defined by the global search space. After the final cell has been computed, the optimal route is found by traversing the grid backwards to the starting cell [1, 1] based on optimal paths stored in the index matrix. Note that the route cannot be constructed in the forward direction, because it is not known until subsequent calculations whether the current cell will lie on the optimal route. Once the optimal route has been determined, an aligned test data set can be constructed.
- test and reference data setsare perfectly aligned, there are points in both sets that do not get mapped.
- test time scaleis compressed, some intermediate test points do not get mapped. These points are discarded.
- test time scaleis expanded, there are reference time points for which no corresponding test point exists. Values of the points can be estimated, e.g., by linearly interpolating between intensity values of surrounding points that have been mapped to reference points.
- the above-described methods and stepscan be varied in many ways without departing from the scope of the invention.
- alternative constraintscan be applied to the route (e.g., different allowable local slopes, end points not fixed but rather constrained to allowable regions, different global search space), and alternative distance functions can be employed.
- the weighting factors for local pathscan be varied from the value 2 used in equations (3).
- a normalization factorcan be included in the distance function.
- the distance function aboveis based on intensity, but, depending on how the data set is represented, can be based on any other coefficient of features of the data set.
- the functioncan be computed from coefficients of wavelets, peaks, or derivatives by which the data set is represented. In this case, the distance is a measure of the degree of alignment of these features.
- the distance functionis computed based on data from M individual mass chromatograms. Any value of M is within the scope of the present invention, as are any selection criteria by which chromatograms are selected for inclusion. Reducing the number of chromatograms from the total number in the data set (e.g., 2000) to M can decrease the computation time substantially. Additionally, excluding noisy chromatograms or those without peaks can improve the alignment accuracy. There is generally an optimal range of M that balances alignment accuracy and computation time, and it is beneficial to choose a value of M in the lower end of the range, i.e., a value that minimizes computation time without sacrificing substantially the accuracy of time-alignment.
- chromatograms containing peaksthroughout the range of retention time; this is particularly important near the beginning and end of the chromatographic run, when there are fewer peaks.
- between about 200 and about 400 chromatogramsare used.
- between about 200 and about 300 chromatogramsare used.
- Mis about 200.
- selection criteriacan be applied individually or jointly to select the chromatograms with which the distance function is computed.
- the selection criteria or their parameterse.g., intensity thresholds
- Mcan be a selected value (manually or automatically) or the result of applying the criterion or criteria (i.e., M chromatograms happen to fit the criteria).
- One selection criterionis that a mass chromatogram have peaks in both the reference and test data sets, as determined by a manual or automated peak selection algorithm. Peak selection algorithms typically apply an intensity threshold and identify local maxima exceeding the threshold as peaks. The peaks may or may not be required to be corresponding (in m/z and retention time) for the chromatogram to meet the criterion. If corresponding peaks are required, a relatively large window in retention time is applied to account for the to-be-corrected retention time shifts.
- Another selection criterionis that maximum, median, or average intensity values in a mass chromatogram exceed a specified intensity threshold, or that a single peak intensity or maximum, median, or average peak intensity values in the chromatogram exceed an intensity threshold. Alternatively, at least one individual peak intensity or the maximum, median, or average peak intensity can be required to fall between upper and lower intensity level thresholds.
- Another selection criterionis that the number of peaks in a mass chromatogram exceed a threshold value.
- the thresholdcan be constant or vary with retention time to accommodate variations in mean or median signal intensity throughout a chromatographic run. Often, the beginning and end of the run yields fewer and lower intensity peaks than occur in the middle of the run, and lower thresholds may be suitable for these regions.
- a set of the most orthogonal chromatogramsis selected, i.e., the set that provides the most information.
- these chromatogramsmay be redundant, providing no more information than is provided by a single chromatogram.
- Standard correlation methodscan be applied to select orthogonal chromatograms.
- the orthogonal chromatogramsare selected to span the elution time range, so that just enough information is provided to align the data sets accurately throughout the entire range.
- the selection criterioncontains an orthogonality metric and a retention time range.
- peaksare first selected in the reference and test data sets using any suitable manual or automatic peak selection method.
- a filteris applied separately to the two data sets to yield two subsets of peaks.
- This filtercan be a single threshold or two (upper and lower) thresholds.
- a lower thresholdensures that peaks are above the noise level, while an upper threshold excludes falsely elevated values reflecting a saturated instrument detector.
- Corresponding peaksare then selected that appear in both the test and reference peak subsets. Chromatograms corresponding to these peaks are included in computing the distance function. Alternatively, from the list of corresponding peaks, M chromatograms are chosen randomly.
- the chromatograms corresponding to every N/M th m/z valueare selected.
- the M chromatogramscan be selected from the corresponding peaks based on an intensity threshold or some other criterion.
- each pairwise alignmentcan be computed based on a different set of independently-selected chromatograms.
- a weighting factor Wkis included in the distance function, causing different chromatograms to contribute unequally. As a result, certain chromatograms tend to dominate the sum and dictate the alignment.
- the functional form or value of the weighting factorcan be determined a priori based on user knowledge of the most relevant mass ranges. Alternatively, the weighting factor can be computed based on characteristics of the data.
- the weighting factorcan be a function of one or more of the following variables: the number of peaks per chromatogram (peak number), selected by any manual or automatic method; the signal-to-noise ratio in a chromatogram; and peak threshold or intensities. Chromatograms having more peaks, higher signal-to-noise ratio, or higher peak intensities are typically weighted more than other chromatograms. Any additional variables can be included in the weighting factor.
- the factorcan also depend on a combination of user knowledge and data values.
- the time-aligning step 26employs locally-weighted regression smoothing. Rather than act on the raw (or preprocessed) data, this method time-aligns selected peaks in test and reference data sets. Peaks, defined by m/z and retention time values, are first selected from each data set by manual or automatic means. Potentially corresponding peaks are identified from the lists as peaks that fall within a specified range of m/z and retention time values.
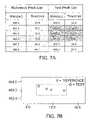
- FIG. 7Ashows an excerpt of a reference peak list and test peak list with potentially corresponding peaks shaded. These peaks are plotted in FIG. 7B , which shows the window surrounding the reference peak that defines a region of potentially corresponding test peaks. Because the nonlinear time variations have not yet been corrected, the window has a relatively large retention time range, accounting for the maximum retention time variation throughout the chromatographic run (e.g., five minutes).
- a smoothing algorithmis applied to the transformed variables to yield a set of discrete values (t avg , ⁇ t), which can be transformed back to (t ref , t test ). Because the smoothing is applied to data points representing peaks, and because the result is a discrete mapping of points rather than a function, adjusted time values of data points between the peaks are then computed, e.g., by interpolation. After all points have been mapped, aligned data sets can be constructed. Typically, time points of the reference data set are fixed and the test data set modified. This process can be repeated to align all data sets to the reference data set.
- LOESSlocally weighted scatterplot smooth
- a LOESS function(sometimes called LOWESS) is available in many commercial mathematics and statistics software packages such as S-PLUS®, SAS, Mathematica, and MATLAB®.
- the LOESS methodfits a polynomial locally to points in a window centered on a given point to be smoothed. Both the window size (“span”) and polynomial degree must be selected. The span is typically specified as a percentage of the total number of points.
- a polynomialis fit to the span by weighting points in the window based on their distance from the point to be smoothed. After fitting the polynomial, the smoothed point is replaced by the computed point, and the method proceeds to the next point, recalculating weights and fitting a new polynomial. Each time, even though the entire span is fit by the polynomial, only the center point is adjusted. Because the method operates locally, it is quite effective at representing the fine nonlinear variations in chromatographic retention time.
- a robust version of LOESSwhich is more resistant to outliers, computes the smoothed points in an iterative fashion by continuing to modify the weights until convergence (or based on a selected number of iterations).
- the iterative correctionsare based on the residuals between the polynomial fit and the raw data points. After the points are fit using initial weights, subsequent weights are computed as the products of the initial weights and the new weights. Upon convergence, the span is moved by one point and the entire process repeated.
- the polynomial regression weightsare based on both the distance from the point to be smoothed (distance in abscissa value) and the distance between the point and the curve fit (distance in ordinal value), yielding a very robust fit.
- each discrete (t avg i , ⁇ t i ) pointis represented in the formulae below as (x i , y i ).
- the approximated value of y i computed from the polynomial fitis represented as ⁇ i .
- a window sizeis chosen and centered on the point to be smoothed, x. Suitable window sizes are between about 10% and about 50% (e.g., about 30%) of the total span of x i values.
- the resultsmay be sensitive to the span, and the optimal span depends on a number of factors, including the threshold by which peaks are selected. For example, if the peak selection threshold is low, yielding a large number of densely located points, the optimal span size may be larger than if the peak selection threshold were to yield fewer, less dense points.
- the spancan also be selected by performing the smoothing using a few different spans and selecting the one that yields the best alignment according to a fit metric, a measure of how well the smoothed values fit the apparent alignment function or of how much the ⁇ t value varies locally or globally across the retention time range.
- the smoothingcan also be evaluated based on knowledge of the expected result.
- the weightsvary smoothly from 0 for the point farthest from the smoothed point to 1 for the smoothed point. All weights are zero for points outside the span.
- the regression merit function in equation (5)is minimized to determine the polynomial coefficients a k .
- the smoothed value ⁇is computed from the polynomial, and the span is moved one point to the right to smooth the next point.
- ⁇ i valuesare obtained, a mapping from t ref to t test is determined, and values for intermediate points are computed by interpolation. The retention time values of mapped test points are then adjusted to align the complete data sets. The process is repeated for all test data sets. Note that if the goal of the method is to align corresponding peaks only, it is not necessary to find aligned time point values for the intermediate points.
- the present inventionis typically implemented in software by a system containing a computer that obtains data sets from an analytical instrument (e.g., LC-MS instrument) or other source.
- the LC-MS instrumentincludes a liquid chromatography instrument connected to a mass spectrometer by an interface.
- the computer implementing the inventiontypically contains a processor, memory, data storage medium, display, and input device (e.g., keyboard and mouse). Methods of the invention are executed by the processor under the direction of computer program code stored in the computer.
- Such codeis tangibly embodied within a computer program storage device accessible by the processor, e.g., within system memory or on a computer-readable storage medium such as a hard disk or CD-ROM.
- the methodsmay be implemented by any means known in the art. For example, any number of computer programming languages, such as JavaTM, C++, or Perl, may be used. Furthermore, various programming approaches such as procedural or object oriented may be employed. It is to be understood that the steps described above are highly simplified versions of the actual processing performed by the computer, and that methods containing additional steps or rearrangement of the steps described are within the scope of the present invention.
- PicoFritTM fused-silica capillary columns(5 ⁇ m BioBasic C 18 , 75 ⁇ m ⁇ 10 cm, New Objective, Woburn, Mass.) were run at a flow rate of 300 nL/min after flow splitting.
- An on-line trapping cartridge(Peptide CapTrap, Michrom Bioresources, Auburn, Calif.) allowed fast loading onto the capillary column. Injection volume was 20 ⁇ L. Gradient elution was achieved using 100% solvent A (0.1% formic acid in water) to 40% solvent B (0.1% formic acid in acetonitrile) over 100 min.
- FIGS. 8A–8Bshow a small region of data sets corresponding to four different samples, before and after alignment of the bottom three data sets (test) to the top (reference) data set using DTW. Corresponding peaks are indicated. In all cases, the aligned peaks are much closer (in retention time) to the reference peaks than they were before alignment.
- PicoFritTM fused-silica capillary columns(5 ⁇ m BioBasic C 18 , 75 ⁇ m ⁇ 10 cm, New Objective, Woburn, Mass.) were run at a flow rate of 300 nL/min after flow splitting.
- An on-line trapping cartridge(Peptide CapTrap, Michrom Bioresources, Auburn, Calif.) allowed fast loading onto the capillary column. Injection volume was 20 ⁇ L. Gradient elution was achieved using 100% solvent A (0.1% formic acid in water) to 40% solvent B (0.1% formic acid in acetonitrile) over 100 min.
- Spectrawere aligned using both dynamic time warping (DTW) and robust LOESS. Algorithms were implemented in MATLAB® (The MathWorks, Cambridge, Mass.). Robust LOESS smoothing was performed using a prepackaged routine in the MATLAB® Curve Fitting Toolbox. DTW was implemented with custom MATLAB® code following the algorithms described above.
- FIG. 9is a plot of transformed data set variables ⁇ t vs. t avg showing alignment by robust LOESS and DTW. Inverted triangles represent potentially corresponding automatically-selected peaks, filled circles are points smoothed by robust LOESS, and the thin solid line is the data set corrected by DTW. The DTW points are much more densely spaced, because they are taken from the entire data set, rather than selected peaks only. In this example, both robust LOESS and DTW accurately track the time shift, with LOESS following the local variations more closely.
Landscapes
- Chemical & Material Sciences (AREA)
- Analytical Chemistry (AREA)
- Physics & Mathematics (AREA)
- Health & Medical Sciences (AREA)
- Life Sciences & Earth Sciences (AREA)
- Biochemistry (AREA)
- General Health & Medical Sciences (AREA)
- General Physics & Mathematics (AREA)
- Immunology (AREA)
- Pathology (AREA)
- Other Investigation Or Analysis Of Materials By Electrical Means (AREA)
Abstract
Description
di,j=(Ijref−Iitest)2 (1)
where Ijrefis the jthintensity value of the reference spectrum and Iitestis the ithintensity value of the test spectrum. In embodiments of the present invention, however, M mass chromatograms of each data set are considered in computing the distance function, where M≧2, and so, in one embodiment, the distance function is:
where Ikjrefis the jthintensity value of the kthreference chromatogram and Ikitestis the ithintensity value of the kthtest chromatogram. Both kthchromatograms are for a single m/z range. Each cell of the grid in
Di,j(1)=Di−2,j−1+2di−1,j+di,j
Di,j(2)=Di−1,j−1+2di,j,
Di,j(3)=Di−1,j−2+2di,j−1+di,j (3)
where Di,j(p)represents the accumulated distance from [1, 1] to [i, j] when path p is traversed, di,jis computed from equation (2), and Di−1,j−1, Di−2, j−1, and Di−1,j−2are evaluated in previous steps. The
This value is stored in an accumulated distance matrix for use in subsequent calculations, and the selected value of p is stored in an index matrix.
where Wkis the chromatogram-dependent weighting factor. The functional form or value of the weighting factor can be determined a priori based on user knowledge of the most relevant mass ranges. Alternatively, the weighting factor can be computed based on characteristics of the data. For example, the weighting factor can be a function of one or more of the following variables: the number of peaks per chromatogram (peak number), selected by any manual or automatic method; the signal-to-noise ratio in a chromatogram; and peak threshold or intensities. Chromatograms having more peaks, higher signal-to-noise ratio, or higher peak intensities are typically weighted more than other chromatograms. Any additional variables can be included in the weighting factor. The factor can also depend on a combination of user knowledge and data values.
where akare the polynomial coefficients to be solved for and wiare the regression weights for each point xiin the span. Initially, the weights wiare given by a tricubic function:
where x is the point being smoothed, xiare the individual points within the span, and xmaxis the point farthest from x. The weights vary smoothly from 0 for the point farthest from the smoothed point to 1 for the smoothed point. All weights are zero for points outside the span. The regression merit function in equation (5) is minimized to determine the polynomial coefficients ak. For standard LOESS, the smoothed value ŷ is computed from the polynomial, and the span is moved one point to the right to smooth the next point.
ri=yi−ŷi, (7)
and on the median absolute deviation MAD:
MAD═median(|ri|). (8)
From these, the robust weights wirobustare computed:
The regression is performed again for the span (from equation (5)) using newly computed weights wi=wiinitial* wirubustto obtain a new curve fit, a new set of points ŷi, and new residuals ri. This procedure (computing robust weights and fitting the polynomial) is repeated until the curve fit converges to a desired precision or for a predetermined number of iterations, e.g., about 5. Upon convergence, the y value of the point being smoothed, x, is replaced with the curve fit value. Only that point is replaced—all other points in the span remain the same. The span is then shifted one point to the right and the entire procedure repeated to smooth the point in the center of the span. Each time the curve fit is performed, the yivalues used are the raw data values, not the smoothed ones. End points are treated as is commonly done in smoothing.
Claims (39)
Priority Applications (2)
| Application Number | Priority Date | Filing Date | Title |
|---|---|---|---|
| US10/435,581US6989100B2 (en) | 2002-05-09 | 2003-05-09 | Methods for time-alignment of liquid chromatography-mass spectrometry data |
| US11/339,235US7628914B2 (en) | 2002-05-09 | 2006-01-24 | Methods for time-alignment of liquid chromatography-mass spectrometry data |
Applications Claiming Priority (2)
| Application Number | Priority Date | Filing Date | Title |
|---|---|---|---|
| US37900302P | 2002-05-09 | 2002-05-09 | |
| US10/435,581US6989100B2 (en) | 2002-05-09 | 2003-05-09 | Methods for time-alignment of liquid chromatography-mass spectrometry data |
Related Child Applications (2)
| Application Number | Title | Priority Date | Filing Date |
|---|---|---|---|
| US11/339,235DivisionUS7628914B2 (en) | 2002-05-09 | 2006-01-24 | Methods for time-alignment of liquid chromatography-mass spectrometry data |
| US11/339,235ContinuationUS7628914B2 (en) | 2002-05-09 | 2006-01-24 | Methods for time-alignment of liquid chromatography-mass spectrometry data |
Publications (2)
| Publication Number | Publication Date |
|---|---|
| US20040113062A1 US20040113062A1 (en) | 2004-06-17 |
| US6989100B2true US6989100B2 (en) | 2006-01-24 |
Family
ID=29420473
Family Applications (2)
| Application Number | Title | Priority Date | Filing Date |
|---|---|---|---|
| US10/435,581Expired - LifetimeUS6989100B2 (en) | 2002-05-09 | 2003-05-09 | Methods for time-alignment of liquid chromatography-mass spectrometry data |
| US11/339,235Expired - Fee RelatedUS7628914B2 (en) | 2002-05-09 | 2006-01-24 | Methods for time-alignment of liquid chromatography-mass spectrometry data |
Family Applications After (1)
| Application Number | Title | Priority Date | Filing Date |
|---|---|---|---|
| US11/339,235Expired - Fee RelatedUS7628914B2 (en) | 2002-05-09 | 2006-01-24 | Methods for time-alignment of liquid chromatography-mass spectrometry data |
Country Status (4)
| Country | Link |
|---|---|
| US (2) | US6989100B2 (en) |
| AU (1) | AU2003239409A1 (en) |
| CA (1) | CA2484625A1 (en) |
| WO (1) | WO2003095978A2 (en) |
Cited By (56)
| Publication number | Priority date | Publication date | Assignee | Title |
|---|---|---|---|---|
| US20060131222A1 (en)* | 2002-05-09 | 2006-06-22 | Ppd Biomarker Discovery Sciences, Llc | Methods for time-alignment of liquid chromatography-mass spectrometry data |
| WO2005079261A3 (en)* | 2004-02-13 | 2006-07-06 | Waters Investments Ltd | System and method for tracking and quatitating chemical entites |
| US20060255258A1 (en)* | 2005-04-11 | 2006-11-16 | Yongdong Wang | Chromatographic and mass spectral date analysis |
| US20070045190A1 (en)* | 2005-08-26 | 2007-03-01 | Xiangdong Don Li | System and method for feature allignment |
| US20080046447A1 (en)* | 2006-02-08 | 2008-02-21 | Sadygov Rovshan G | Two-step method to align three dimensional LC-MS chromatographic surfaces |
| US20090082728A1 (en)* | 2006-08-23 | 2009-03-26 | Medtronic Minimed, Inc. | Infusion medium delivery system, device and method with needle inserter and needle inserter device and method |
| US20090297527A1 (en)* | 2005-09-30 | 2009-12-03 | Muller Bernhard K | Binding Domains of Proteins of the Repulsive Guidance Molecule (RGM) Protein Family and Functional Fragments Thereof, and Their Use |
| US20100028340A1 (en)* | 2008-02-29 | 2010-02-04 | Abbott Gmbh & Co. Kg | Antibodies against the rgm a protein and uses thereof |
| US20100322948A1 (en)* | 2007-09-06 | 2010-12-23 | Abbott Gmbh & Co. Kg | Bone morphogenetic protein (BMP)-binding domains of proteins of the repulsive guidance molecule (RGM) protein family and functional fragments thereof, and use of same |
| US20110055301A1 (en)* | 2009-08-25 | 2011-03-03 | International Business Machines Corporation | Alignment of multiple liquid chromatography-mass spectrometry runs |
| US20110215237A1 (en)* | 2002-07-24 | 2011-09-08 | Micromass Uk Limited | Mass Analysis Using Alternating Fragmentation Modes |
| WO2011133175A1 (en) | 2009-09-23 | 2011-10-27 | Celmatix, Inc. | Methods and devices for assessing infertility and/or egg quality |
| WO2013090635A2 (en) | 2011-12-14 | 2013-06-20 | AbbVie Deutschland GmbH & Co. KG | Composition and method for the diagnosis and treatment of iron-related disorders |
| WO2013090633A2 (en) | 2011-12-14 | 2013-06-20 | AbbVie Deutschland GmbH & Co. KG | Composition and method for the diagnosis and treatment of iron-related disorders |
| WO2013112922A1 (en) | 2012-01-27 | 2013-08-01 | AbbVie Deutschland GmbH & Co. KG | Composition and method for diagnosis and treatment of diseases associated with neurite degeneration |
| WO2013135769A1 (en) | 2012-03-13 | 2013-09-19 | Abbvie Inc. | Method for selecting or identifying a subject for v1b antagonist therapy |
| US20130297230A1 (en)* | 2012-05-07 | 2013-11-07 | Shimadzu Corporation | Data-Processing System For Chromatographic Mass Spectrometry |
| WO2013166217A2 (en) | 2012-05-01 | 2013-11-07 | Synapdx Corporation | Systems and methods for normalizing gene expression profiles of biological samples having a mixed cell population |
| WO2013166444A2 (en) | 2012-05-04 | 2013-11-07 | Boreal Genomics Corp. | Biomarker analysis using scodaphoresis |
| US8680239B2 (en) | 2000-12-22 | 2014-03-25 | Max-Planck-Gesellschaft Zur Foerderung Der Wissenschaften E.V. | Use of RGM and its modulators |
| WO2015048753A1 (en) | 2013-09-30 | 2015-04-02 | Seven Bridges Genomics Inc. | Methods and system for detecting sequence variants |
| WO2015058097A1 (en) | 2013-10-18 | 2015-04-23 | Seven Bridges Genomics Inc. | Methods and systems for identifying disease-induced mutations |
| US9116866B2 (en) | 2013-08-21 | 2015-08-25 | Seven Bridges Genomics Inc. | Methods and systems for detecting sequence variants |
| US9177098B2 (en) | 2012-10-17 | 2015-11-03 | Celmatix Inc. | Systems and methods for determining the probability of a pregnancy at a selected point in time |
| US9175075B2 (en) | 2009-12-08 | 2015-11-03 | AbbVie Deutschland GmbH & Co. KG | Methods of treating retinal nerve fiber layer degeneration with monoclonal antibodies against a retinal guidance molecule (RGM) protein |
| US9239319B2 (en) | 2011-03-23 | 2016-01-19 | Regents Of The University Of Minnesota | Valve and splitting system for multi-dimensional liquid analysis |
| US20160033313A1 (en)* | 2014-07-30 | 2016-02-04 | International Business Machines Corporation | Measuring velocity using substance characteristics |
| US9528998B2 (en) | 2010-04-16 | 2016-12-27 | Abbott Laboratories | Methods and reagents for diagnosing rheumatoid arthrtis |
| US9558321B2 (en) | 2014-10-14 | 2017-01-31 | Seven Bridges Genomics Inc. | Systems and methods for smart tools in sequence pipelines |
| US9817944B2 (en) | 2014-02-11 | 2017-11-14 | Seven Bridges Genomics Inc. | Systems and methods for analyzing sequence data |
| US9836577B2 (en) | 2012-12-14 | 2017-12-05 | Celmatix, Inc. | Methods and devices for assessing risk of female infertility |
| US9898575B2 (en) | 2013-08-21 | 2018-02-20 | Seven Bridges Genomics Inc. | Methods and systems for aligning sequences |
| WO2018067730A1 (en) | 2016-10-04 | 2018-04-12 | University Of Maryland, Baltimore | Methods of treating sepsis using anti-sepsis lipid a (asla) based therapeutics |
| EP3323897A1 (en) | 2011-10-03 | 2018-05-23 | Celmatix, Inc. | Methods and devices for assessing risk to a putative offspring of developing a condition |
| US10055539B2 (en) | 2013-10-21 | 2018-08-21 | Seven Bridges Genomics Inc. | Systems and methods for using paired-end data in directed acyclic structure |
| WO2018164580A1 (en) | 2017-03-09 | 2018-09-13 | Rijksuniversiteit Groningen | Biomarkers for cellular senescence |
| US10078724B2 (en) | 2013-10-18 | 2018-09-18 | Seven Bridges Genomics Inc. | Methods and systems for genotyping genetic samples |
| US10162800B2 (en) | 2012-10-17 | 2018-12-25 | Celmatix Inc. | Systems and methods for determining the probability of a pregnancy at a selected point in time |
| US10192026B2 (en) | 2015-03-05 | 2019-01-29 | Seven Bridges Genomics Inc. | Systems and methods for genomic pattern analysis |
| US10208350B2 (en) | 2014-07-17 | 2019-02-19 | Celmatix Inc. | Methods and systems for assessing infertility and related pathologies |
| US10262102B2 (en) | 2016-02-24 | 2019-04-16 | Seven Bridges Genomics Inc. | Systems and methods for genotyping with graph reference |
| US10275567B2 (en) | 2015-05-22 | 2019-04-30 | Seven Bridges Genomics Inc. | Systems and methods for haplotyping |
| US10364468B2 (en) | 2016-01-13 | 2019-07-30 | Seven Bridges Genomics Inc. | Systems and methods for analyzing circulating tumor DNA |
| US10460829B2 (en) | 2016-01-26 | 2019-10-29 | Seven Bridges Genomics Inc. | Systems and methods for encoding genetic variation for a population |
| US10584380B2 (en) | 2015-09-01 | 2020-03-10 | Seven Bridges Genomics Inc. | Systems and methods for mitochondrial analysis |
| US10724110B2 (en) | 2015-09-01 | 2020-07-28 | Seven Bridges Genomics Inc. | Systems and methods for analyzing viral nucleic acids |
| US10793895B2 (en) | 2015-08-24 | 2020-10-06 | Seven Bridges Genomics Inc. | Systems and methods for epigenetic analysis |
| US10832797B2 (en) | 2013-10-18 | 2020-11-10 | Seven Bridges Genomics Inc. | Method and system for quantifying sequence alignment |
| US10867693B2 (en) | 2014-01-10 | 2020-12-15 | Seven Bridges Genomics Inc. | Systems and methods for use of known alleles in read mapping |
| US11049587B2 (en) | 2013-10-18 | 2021-06-29 | Seven Bridges Genomics Inc. | Methods and systems for aligning sequences in the presence of repeating elements |
| US11250931B2 (en) | 2016-09-01 | 2022-02-15 | Seven Bridges Genomics Inc. | Systems and methods for detecting recombination |
| US11347704B2 (en) | 2015-10-16 | 2022-05-31 | Seven Bridges Genomics Inc. | Biological graph or sequence serialization |
| US11454617B2 (en) | 2019-01-31 | 2022-09-27 | Thermo Finnigan Llc | Methods and systems for performing chromatographic alignment |
| US11810648B2 (en) | 2016-01-07 | 2023-11-07 | Seven Bridges Genomics Inc. | Systems and methods for adaptive local alignment for graph genomes |
| US12365729B2 (en) | 2020-05-13 | 2025-07-22 | Disc Medicine, Inc. | Anti-hemojuvelin (HJV) antibodies for treating myelofibrosis |
| US12399162B2 (en) | 2020-10-06 | 2025-08-26 | Shimadzu Corporation | Waveform processing device for chromatogram and waveform processing method for chromatogram |
Families Citing this family (43)
| Publication number | Priority date | Publication date | Assignee | Title |
|---|---|---|---|---|
| US6787761B2 (en)* | 2000-11-27 | 2004-09-07 | Surromed, Inc. | Median filter for liquid chromatography-mass spectrometry data |
| US20020115056A1 (en) | 2000-12-26 | 2002-08-22 | Goodlett David R. | Rapid and quantitative proteome analysis and related methods |
| JP2005500543A (en)* | 2001-08-13 | 2005-01-06 | ビヨンド ジェノミクス, インコーポレイテッド | Methods and systems for profiling biological systems |
| EP1446667A2 (en)* | 2001-11-13 | 2004-08-18 | Caprion Pharmaceuticals, Inc. | Mass intensity profiling system and uses thereof |
| EP1586107A2 (en)* | 2002-11-22 | 2005-10-19 | Caprion Pharmaceuticals, Inc. | Constellation mapping and uses thereof |
| CA2521108A1 (en)* | 2003-03-31 | 2004-10-21 | Medical Proteoscope Co., Ltd. | Sample analyzing method and sample analyzing program |
| WO2005020125A2 (en)* | 2003-08-20 | 2005-03-03 | Bg Medicine, Inc. | Methods and systems for profiling biological systems |
| EP1745499B1 (en)* | 2004-04-30 | 2015-10-21 | Micromass UK Limited | Mass spectrometer |
| GB0409676D0 (en) | 2004-04-30 | 2004-06-02 | Micromass Ltd | Mass spectrometer |
| EP1766394B1 (en)* | 2004-05-20 | 2020-09-09 | Waters Technologies Corporation | System and method for grouping precursor and fragment ions using selected ion chromatograms |
| US20060020401A1 (en)* | 2004-07-20 | 2006-01-26 | Charles Stark Draper Laboratory, Inc. | Alignment and autoregressive modeling of analytical sensor data from complex chemical mixtures |
| JP2006184275A (en)* | 2004-11-30 | 2006-07-13 | Jeol Ltd | Mass spectrometry method and mass spectrometer |
| FI20055253A7 (en)* | 2005-05-26 | 2006-11-27 | Valtion Teknillinen Tutkimuskeskus | Analytical techniques for liquid chromatography/mass spectrometry |
| FI20055252L (en)* | 2005-05-26 | 2006-11-27 | Valtion Teknillinen | Analytical techniques for liquid chromatography/mass spectrometry |
| FI20055254L (en)* | 2005-05-26 | 2006-11-27 | Valtion Teknillinen | Analytical techniques for liquid chromatography/mass spectrometry |
| US8190375B2 (en)* | 2005-07-08 | 2012-05-29 | Metanomics Gmbh | System and method for characterizing a chemical sample |
| US7365311B1 (en)* | 2005-09-08 | 2008-04-29 | The Mathworks, Inc. | Alignment of mass spectrometry data |
| EP1958006B1 (en)* | 2005-11-10 | 2011-05-11 | Microsoft Corporation | Discover biological features using composite images |
| GB2432712B (en) | 2005-11-23 | 2007-12-27 | Micromass Ltd | Mass spectrometer |
| GB0609253D0 (en) | 2006-05-10 | 2006-06-21 | Micromass Ltd | Mass spectrometer |
| US9063162B2 (en)* | 2006-05-26 | 2015-06-23 | Waters Technologies Corporation | Apparatus and method for performing mass spectroscopy |
| EP2021789A4 (en)* | 2006-05-26 | 2010-10-20 | Waters Technologies Corp | Apparatus and method for performing mass spectroscopy |
| AU2008308663B2 (en)* | 2007-10-02 | 2014-01-16 | Iroa Technologies Llc | Generation and use of isotopic patterns in mass spectral phenotypic comparison of organisms |
| US8110797B2 (en)* | 2009-02-06 | 2012-02-07 | Florida State University Research Foundation, Inc. | Electrospray ionization mass spectrometry methodology |
| DE102009035587B3 (en)* | 2009-07-31 | 2011-03-24 | Siemens Aktiengesellschaft | Method for filtering a chromatogram |
| US20130030759A1 (en)* | 2011-07-26 | 2013-01-31 | Hao Ming C | Smoothing a time series data set while preserving peak and/or trough data points |
| US20150032383A1 (en)* | 2012-03-29 | 2015-01-29 | Koninklijke Philips N.V. | Method and system for filtering gas chromatography-mass spectrometry data |
| EP2781916A1 (en)* | 2013-03-22 | 2014-09-24 | Biotage AB | Coupling module |
| JP6020314B2 (en)* | 2013-04-04 | 2016-11-02 | 株式会社島津製作所 | Chromatographic mass spectrometry data processor |
| GB2532430B (en) | 2014-11-18 | 2019-03-20 | Thermo Fisher Scient Bremen Gmbh | Method for time-alignment of chromatography-mass spectrometry data sets |
| EP3285190B1 (en)* | 2016-05-23 | 2025-07-23 | Thermo Finnigan LLC | Systems and methods for sample comparison and classification |
| GB201621434D0 (en) | 2016-12-16 | 2017-02-01 | Palantir Technologies Inc | Processing sensor logs |
| GB2561378B (en)* | 2017-04-12 | 2022-10-12 | Micromass Ltd | Optimised targeted analysis |
| WO2020044161A1 (en)* | 2018-08-31 | 2020-03-05 | Dh Technologies Development Pte. Ltd. | Identification and scoring of related compounds in complex samples |
| US11841352B2 (en)* | 2019-07-31 | 2023-12-12 | Thermo Finnigan Llc | Determination and correction of retention time and mass/charge shifts in LC-MS experiments |
| US20230213489A1 (en)* | 2020-05-25 | 2023-07-06 | Shimadzu Corporation | Chromatograph mass spectrometry data processing method, chromatograph mass spectrometer, and chromatograph mass spectrometry data processing program |
| CN112395983B (en)* | 2020-11-18 | 2022-03-18 | 深圳市步锐生物科技有限公司 | Mass spectrum data peak position alignment method and device |
| CN113237985B (en)* | 2021-03-24 | 2023-10-20 | 迈克医疗电子有限公司 | Method and device for determining component type in hemoglobin and computer equipment |
| CN114527266B (en)* | 2021-12-31 | 2024-12-03 | 攸太科技(台州)有限公司 | Urine electrochemical detection method |
| CN115060631B (en)* | 2022-07-14 | 2023-07-25 | 长光辰英(杭州)科学仪器有限公司 | Self-adaptive particulate matter Raman similarity judging method |
| IL318909A (en)* | 2022-08-12 | 2025-04-01 | Inficon Inc | Method of auto tuning one or more sensors |
| WO2024075058A1 (en)* | 2022-10-06 | 2024-04-11 | Dh Technologies Development Pte. Ltd. | Reducing data complexity for subsequent rt alignment |
| GB202310312D0 (en)* | 2023-07-05 | 2023-08-16 | Thermo Fisher Scient Bremen Gmbh | Selection of peak detection parameters for isotope-ratio mass spectrometry |
Citations (16)
| Publication number | Priority date | Publication date | Assignee | Title |
|---|---|---|---|---|
| US3997298A (en) | 1975-02-27 | 1976-12-14 | Cornell Research Foundation, Inc. | Liquid chromatography-mass spectrometry system and method |
| WO1998016661A2 (en) | 1996-10-17 | 1998-04-23 | Morphagen | Morphatides: novel shape and structure libraries |
| US6008490A (en) | 1997-03-31 | 1999-12-28 | Hitachi, Ltd. | Method and apparatus for measuring and analyzing mass spectrum |
| EP0969283A1 (en) | 1998-06-25 | 2000-01-05 | Hewlett-Packard Company | A method for processing measuring values |
| US6091492A (en) | 1994-04-15 | 2000-07-18 | Micromeritics Instrument Corporation | Apparatus and method for determining the size distribution of particles by light scattering |
| WO2000067017A1 (en) | 1999-05-04 | 2000-11-09 | The Rockefeller University | Method for the comparative quantitative analysis of proteins and other biological material by isotopic labeling and mass spectroscopy |
| US6147344A (en) | 1998-10-15 | 2000-11-14 | Neogenesis, Inc | Method for identifying compounds in a chemical mixture |
| US6207955B1 (en) | 1998-09-28 | 2001-03-27 | Varian, Inc. | Pneumatically assisted electrospray device with alternating pressure gradients for mass spectrometry |
| WO2001035266A2 (en) | 1999-11-08 | 2001-05-17 | Université de Montréal | Measurement signal processing method |
| US6253162B1 (en) | 1999-04-07 | 2001-06-26 | Battelle Memorial Institute | Method of identifying features in indexed data |
| US20010019829A1 (en) | 1995-05-23 | 2001-09-06 | Nelson Randall W. | Mass spectrometric immunoassay |
| US20020053545A1 (en) | 2000-08-03 | 2002-05-09 | Greef Jan Van Der | Method and system for identifying and quantifying chemical components of a mixture |
| US6421612B1 (en) | 1996-11-04 | 2002-07-16 | 3-Dimensional Pharmaceuticals Inc. | System, method and computer program product for identifying chemical compounds having desired properties |
| US20020102610A1 (en) | 2000-09-08 | 2002-08-01 | Townsend Robert Reid | Automated identification of peptides |
| US6526299B2 (en) | 2001-02-07 | 2003-02-25 | University College London | Spectrum processing and processor |
| US6753966B2 (en) | 2000-03-10 | 2004-06-22 | Textron Systems Corporation | Optical probes and methods for spectral analysis |
Family Cites Families (115)
| Publication number | Priority date | Publication date | Assignee | Title |
|---|---|---|---|---|
| DE1617732C2 (en) | 1966-03-01 | 1972-12-21 | Promoveo-Sobioda & Cie, Seyssinet (Frankreich) | Device for examining living cells of microorganisms |
| US3552865A (en) | 1968-04-01 | 1971-01-05 | Beckman Instruments Inc | High pressure flow-through cuvette |
| CH542437A (en) | 1971-08-27 | 1973-09-30 | Micromedic Systems Inc | Optical cuvette and method for its manufacture |
| US3999047A (en) | 1972-09-05 | 1976-12-21 | Green James E | Method and apparatus utilizing color algebra for analyzing scene regions |
| US4426451A (en) | 1981-01-28 | 1984-01-17 | Eastman Kodak Company | Multi-zoned reaction vessel having pressure-actuatable control means between zones |
| US4405235A (en) | 1981-03-19 | 1983-09-20 | Rossiter Val J | Liquid cell for spectroscopic analysis |
| DE3414260A1 (en) | 1984-04-14 | 1985-10-24 | Fa. Carl Zeiss, 7920 Heidenheim | FLOW-CUE WITH NL VOLUME |
| SE455646B (en) | 1984-10-22 | 1988-07-25 | Radians Innova Ab | FLUORESCENT DEVICE |
| JPS61145457A (en) | 1984-12-19 | 1986-07-03 | Hitachi Ltd | Data processing apparatus for chromatograph |
| US4963498A (en) | 1985-08-05 | 1990-10-16 | Biotrack | Capillary flow device |
| US4761381A (en) | 1985-09-18 | 1988-08-02 | Miles Inc. | Volume metering capillary gap device for applying a liquid sample onto a reactive surface |
| SE458968B (en) | 1987-06-16 | 1989-05-22 | Wallac Oy | BIOSPECIFIC ANALYTICAL PROCEDURE FOR MULTIPLE ANALYTICS WHICH DO NOT INCLUDE PARTICULAR COATING AND LABELING WITH FLUORESCING LABEL SUBSTANCES |
| US4844617A (en) | 1988-01-20 | 1989-07-04 | Tencor Instruments | Confocal measuring microscope with automatic focusing |
| US5119315A (en) | 1989-04-28 | 1992-06-02 | Amoco Corporation | Method of correlating a record of sample data with a record of reference data |
| US5107422A (en) | 1989-10-02 | 1992-04-21 | Kamentsky Louis A | Method and apparatus for measuring multiple optical properties of biological specimens |
| US5072382A (en) | 1989-10-02 | 1991-12-10 | Kamentsky Louis A | Methods and apparatus for measuring multiple optical properties of biological specimens |
| US5274240A (en) | 1990-01-12 | 1993-12-28 | The Regents Of The University Of California | Capillary array confocal fluorescence scanner and method |
| US5091652A (en) | 1990-01-12 | 1992-02-25 | The Regents Of The University Of California | Laser excited confocal microscope fluorescence scanner and method |
| GB9014263D0 (en) | 1990-06-27 | 1990-08-15 | Dixon Arthur E | Apparatus and method for spatially- and spectrally- resolvedmeasurements |
| GB9015793D0 (en) | 1990-07-18 | 1990-09-05 | Medical Res Council | Confocal scanning optical microscope |
| US5127730A (en) | 1990-08-10 | 1992-07-07 | Regents Of The University Of Minnesota | Multi-color laser scanning confocal imaging system |
| US5239178A (en) | 1990-11-10 | 1993-08-24 | Carl Zeiss | Optical device with an illuminating grid and detector grid arranged confocally to an object |
| DE69124199T2 (en) | 1990-11-16 | 1997-04-30 | Shimadzu Corp | Fraction purity measuring device for chromatogram peak |
| US5739000A (en) | 1991-08-28 | 1998-04-14 | Becton Dickinson And Company | Algorithmic engine for automated N-dimensional subset analysis |
| GB9218482D0 (en) | 1992-09-01 | 1992-10-14 | Dixon Arthur E | Apparatus and method for scanning laser imaging of macroscopic samples |
| JPH07504056A (en) | 1992-02-18 | 1995-04-27 | ネオパス,インク. | Methods for identifying objects using data processing techniques |
| US5377003A (en) | 1992-03-06 | 1994-12-27 | The United States Of America As Represented By The Department Of Health And Human Services | Spectroscopic imaging device employing imaging quality spectral filters |
| US5430542A (en) | 1992-04-10 | 1995-07-04 | Avox Systems, Inc. | Disposable optical cuvette |
| WO1993021592A1 (en) | 1992-04-16 | 1993-10-28 | The Dow Chemical Company | Improved method for interpreting complex data and detecting abnormal instrument or process behavior |
| JPH05340865A (en) | 1992-06-09 | 1993-12-24 | Canon Inc | measuring device |
| US5736410A (en) | 1992-09-14 | 1998-04-07 | Sri International | Up-converting reporters for biological and other assays using laser excitation techniques |
| US5889881A (en) | 1992-10-14 | 1999-03-30 | Oncometrics Imaging Corp. | Method and apparatus for automatically detecting malignancy-associated changes |
| US5556764A (en) | 1993-02-17 | 1996-09-17 | Biometric Imaging, Inc. | Method and apparatus for cell counting and cell classification |
| US5585246A (en) | 1993-02-17 | 1996-12-17 | Biometric Imaging, Inc. | Method for preparing a sample in a scan capillary for immunofluorescent interrogation |
| US5547849A (en) | 1993-02-17 | 1996-08-20 | Biometric Imaging, Inc. | Apparatus and method for volumetric capillary cytometry |
| WO1994027146A1 (en) | 1993-05-14 | 1994-11-24 | Coulter Corporation | Reticulocyte analyzing method and apparatus utilizing light scatter techniques |
| US5692220A (en) | 1993-09-02 | 1997-11-25 | Coulter Corporation | Decision support system and method for diagnosis consultation in laboratory hematopathology |
| US5532873A (en) | 1993-09-08 | 1996-07-02 | Dixon; Arthur E. | Scanning beam laser microscope with wide range of magnification |
| US5456252A (en) | 1993-09-30 | 1995-10-10 | Cedars-Sinai Medical Center | Induced fluorescence spectroscopy blood perfusion and pH monitor and method |
| US5412208A (en) | 1994-01-13 | 1995-05-02 | Mds Health Group Limited | Ion spray with intersecting flow |
| FI96452C (en) | 1994-01-26 | 1996-06-25 | Pekka Haenninen | Method for excitation of dyes |
| US5578832A (en) | 1994-09-02 | 1996-11-26 | Affymetrix, Inc. | Method and apparatus for imaging a sample on a device |
| US6017693A (en) | 1994-03-14 | 2000-01-25 | University Of Washington | Identification of nucleotides, amino acids, or carbohydrates by mass spectrometry |
| US5453505A (en) | 1994-06-30 | 1995-09-26 | Biometric Imaging, Inc. | N-heteroaromatic ion and iminium ion substituted cyanine dyes for use as fluorescence labels |
| DE4427448B4 (en) | 1994-08-03 | 2008-07-31 | Heidelberger Druckmaschinen Ag | Device for non-contact guiding sheet material |
| US5627041A (en) | 1994-09-02 | 1997-05-06 | Biometric Imaging, Inc. | Disposable cartridge for an assay of a biological sample |
| AU702267B2 (en) | 1994-09-02 | 1999-02-18 | Biometric Imaging, Inc. | Calibration method and apparatus for optical scanner |
| USD366938S (en) | 1994-09-02 | 1996-02-06 | Biometric Imaging, Inc. | Cartridge for processing laboratory samples |
| US5710713A (en) | 1995-03-20 | 1998-01-20 | The Dow Chemical Company | Method of creating standardized spectral libraries for enhanced library searching |
| US5682038A (en) | 1995-04-06 | 1997-10-28 | Becton Dickinson And Company | Fluorescent-particle analyzer with timing alignment for analog pulse subtraction of fluorescent pulses arising from different excitation locations |
| US6017434A (en) | 1995-05-09 | 2000-01-25 | Curagen Corporation | Apparatus and method for the generation, separation, detection, and recognition of biopolymer fragments |
| US5871946A (en) | 1995-05-18 | 1999-02-16 | Coulter Corporation | Method for determining activity of enzymes in metabolically active whole cells |
| US5582705A (en) | 1995-05-19 | 1996-12-10 | Iowa State University Research Foundation, Inc. | Multiplexed capillary electrophoresis system |
| US6104945A (en) | 1995-08-01 | 2000-08-15 | Medispectra, Inc. | Spectral volume microprobe arrays |
| US5713364A (en) | 1995-08-01 | 1998-02-03 | Medispectra, Inc. | Spectral volume microprobe analysis of materials |
| US5726751A (en) | 1995-09-27 | 1998-03-10 | University Of Washington | Silicon microchannel optical flow cytometer |
| US5981180A (en) | 1995-10-11 | 1999-11-09 | Luminex Corporation | Multiplexed analysis of clinical specimens apparatus and methods |
| USD383852S (en) | 1995-11-02 | 1997-09-16 | Biometric Imaging, Inc. | Cartridge for aphoresis analysis |
| US5734058A (en) | 1995-11-09 | 1998-03-31 | Biometric Imaging, Inc. | Fluorescent DNA-Intercalating cyanine dyes including a positively charged benzothiazole substituent |
| US5658735A (en) | 1995-11-09 | 1997-08-19 | Biometric Imaging, Inc. | Cyclized fluorescent nucleic acid intercalating cyanine dyes and nucleic acid detection methods |
| EP1300713A3 (en) | 1995-11-30 | 2004-11-03 | Chromavision Medical Systems, Inc. | Method and apparatus for automated image analysis of biological specimens |
| DE19547546A1 (en) | 1995-12-20 | 1997-07-03 | Heidelberger Druckmasch Ag | Device for acting on sheets in a sheet delivery |
| US5795729A (en) | 1996-02-05 | 1998-08-18 | Biometric Imaging, Inc. | Reductive, energy-transfer fluorogenic probes |
| US5814820A (en) | 1996-02-09 | 1998-09-29 | The Board Of Trustees Of The University Of Illinois | Pump probe cross correlation fluorescence frequency domain microscope and microscopy |
| US5672869A (en) | 1996-04-03 | 1997-09-30 | Eastman Kodak Company | Noise and background reduction method for component detection in chromatography/spectrometry |
| USD382648S (en) | 1996-04-04 | 1997-08-19 | Biometric Imaging, Inc. | Holder for receiving two cuvettes |
| USD391373S (en) | 1996-04-04 | 1998-02-24 | Biometric Imaging, Inc. | Cuvette for laboratory sample |
| USD395708S (en) | 1996-04-04 | 1998-06-30 | Biometric Imaging, Inc. | Holder for receiving one covette |
| US5989835A (en) | 1997-02-27 | 1999-11-23 | Cellomics, Inc. | System for cell-based screening |
| US5885841A (en) | 1996-09-11 | 1999-03-23 | Eli Lilly And Company | System and methods for qualitatively and quantitatively comparing complex admixtures using single ion chromatograms derived from spectroscopic analysis of such admixtures |
| GB9624927D0 (en) | 1996-11-29 | 1997-01-15 | Oxford Glycosciences Uk Ltd | Gels and their use |
| FR2757948B1 (en) | 1996-12-30 | 1999-01-22 | Commissariat Energie Atomique | MICROSYSTEMS FOR BIOLOGICAL ANALYSIS, THEIR USE FOR DETECTION OF ANALYTES AND THEIR PROCESS |
| US6059724A (en) | 1997-02-14 | 2000-05-09 | Biosignal, Inc. | System for predicting future health |
| DE19707227A1 (en) | 1997-02-24 | 1998-08-27 | Bodenseewerk Perkin Elmer Co | Light scanner |
| US5910287A (en) | 1997-06-03 | 1999-06-08 | Aurora Biosciences Corporation | Low background multi-well plates with greater than 864 wells for fluorescence measurements of biological and biochemical samples |
| US6229603B1 (en) | 1997-06-02 | 2001-05-08 | Aurora Biosciences Corporation | Low background multi-well plates with greater than 864 wells for spectroscopic measurements |
| US6063338A (en) | 1997-06-02 | 2000-05-16 | Aurora Biosciences Corporation | Low background multi-well plates and platforms for spectroscopic measurements |
| US6093573A (en) | 1997-06-20 | 2000-07-25 | Xoma | Three-dimensional structure of bactericidal/permeability-increasing protein (BPI) |
| US6112161A (en) | 1997-09-17 | 2000-08-29 | Hewlett-Packard | Method, apparatus, and article of manufacture for enhanced intergration of signals |
| US6388788B1 (en) | 1998-03-16 | 2002-05-14 | Praelux, Inc. | Method and apparatus for screening chemical compounds |
| US5995989A (en) | 1998-04-24 | 1999-11-30 | Eg&G Instruments, Inc. | Method and apparatus for compression and filtering of data associated with spectrometry |
| US6138117A (en) | 1998-04-29 | 2000-10-24 | International Business Machines Corporation | Method and system for mining long patterns from databases |
| DE19829094C2 (en) | 1998-06-30 | 2002-10-24 | Roland Man Druckmasch | Guide device for sheet-shaped substrates in a printing machine |
| US6008896A (en) | 1998-07-01 | 1999-12-28 | National Research Council Of Canada | Method and apparatus for spectroscopic analysis of heterogeneous materials |
| US6366924B1 (en) | 1998-07-27 | 2002-04-02 | Caliper Technologies Corp. | Distributed database for analytical instruments |
| CA2341359A1 (en) | 1998-08-21 | 2000-03-02 | Ian Walton | Novel optical architectures for microvolume laser-scanning cytometers |
| AU755334C (en) | 1998-08-25 | 2004-02-26 | University Of Washington | Rapid quantitative analysis of proteins or protein function in complex mixtures |
| US6377842B1 (en) | 1998-09-22 | 2002-04-23 | Aurora Optics, Inc. | Method for quantitative measurement of fluorescent and phosphorescent drugs within tissue utilizing a fiber optic probe |
| US6200532B1 (en) | 1998-11-20 | 2001-03-13 | Akzo Nobel Nv | Devices and method for performing blood coagulation assays by piezoelectric sensing |
| US6134002A (en) | 1999-01-14 | 2000-10-17 | Duke University | Apparatus and method for the rapid spectral resolution of confocal images |
| US6066216A (en) | 1999-02-05 | 2000-05-23 | Biometric Imaging, Inc. | Mesa forming weld depth limitation feature for use with energy director in ultrasonic welding |
| US6937330B2 (en) | 1999-04-23 | 2005-08-30 | Ppd Biomarker Discovery Sciences, Llc | Disposable optical cuvette cartridge with low fluorescence material |
| AU4366100A (en) | 1999-04-23 | 2000-11-10 | Surromed, Inc. | Disposable optical cuvette cartridge |
| US6376843B1 (en) | 1999-06-23 | 2002-04-23 | Evotec Oai Ag | Method of characterizing fluorescent molecules or other particles using generating functions |
| WO2000070340A2 (en) | 1999-05-14 | 2000-11-23 | Karolinska Innovations Ab | Materials and methods relating to disease diagnosis |
| US6334099B1 (en) | 1999-05-25 | 2001-12-25 | Digital Gene Technologies, Inc. | Methods for normalization of experimental data |
| US6687395B1 (en) | 1999-07-21 | 2004-02-03 | Surromed, Inc. | System for microvolume laser scanning cytometry |
| FR2797495B1 (en) | 1999-08-11 | 2003-01-31 | Dilor | SPECTROMETRIC IMAGING APPARATUS |
| ES2584553T3 (en) | 1999-10-06 | 2016-09-28 | Becton Dickinson And Company | Spectroscopically active surface-enhanced compound nanoparticles |
| WO2001044269A2 (en) | 1999-12-17 | 2001-06-21 | Large Scale Proteomics Corporation | Brain protein markers |
| AU2001234779A1 (en) | 2000-02-03 | 2001-08-14 | Nanoscale Combinatorial Synthesis, Inc. | Structure identification methods using mass measurements |
| CA2307399C (en) | 2000-05-02 | 2006-10-03 | Mds Inc., Doing Business As Mds Sciex | Method for reducing chemical background in mass spectra |
| WO2001098458A2 (en) | 2000-06-19 | 2001-12-27 | Zyomyx, Inc. | Methods for immobilizing polypeptides |
| US6947133B2 (en) | 2000-08-08 | 2005-09-20 | Carl Zeiss Jena Gmbh | Method for increasing the spectral and spatial resolution of detectors |
| AU2001285063A1 (en) | 2000-08-25 | 2002-03-13 | Genencor International, Inc. | Mass spectrometric analysis of biopolymers |
| EP1325322A2 (en) | 2000-10-03 | 2003-07-09 | Dionex Corporation | Method and system for peak parking in liquid chromatography-mass spectrometer (lc-ms) analysis |
| US6962818B2 (en) | 2000-10-19 | 2005-11-08 | Target Discovery | Mass defect labeling for the determination of oligomer sequences |
| US6787761B2 (en) | 2000-11-27 | 2004-09-07 | Surromed, Inc. | Median filter for liquid chromatography-mass spectrometry data |
| US20020095260A1 (en) | 2000-11-28 | 2002-07-18 | Surromed, Inc. | Methods for efficiently mining broad data sets for biological markers |
| JP3663125B2 (en) | 2000-11-28 | 2005-06-22 | 日立ソフトウエアエンジニアリング株式会社 | Fluorescence reading method and fluorescence reading apparatus |
| US6856457B2 (en) | 2001-03-27 | 2005-02-15 | Prairie Technologies, Inc. | Single and multi-aperture, translationally-coupled confocal microscope |
| DE10121064A1 (en) | 2001-04-28 | 2002-10-31 | Evotec Ag | Device and method for the optical measurement of chemical and / or biological samples |
| US6873915B2 (en) | 2001-08-24 | 2005-03-29 | Surromed, Inc. | Peak selection in multidimensional data |
| US6835927B2 (en) | 2001-10-15 | 2004-12-28 | Surromed, Inc. | Mass spectrometric quantification of chemical mixture components |
| WO2003095978A2 (en) | 2002-05-09 | 2003-11-20 | Surromed, Inc. | Methods for time-alignment of liquid chromatography-mass spectrometry data |
- 2003
- 2003-05-09WOPCT/US2003/014729patent/WO2003095978A2/ennot_activeApplication Discontinuation
- 2003-05-09AUAU2003239409Apatent/AU2003239409A1/ennot_activeAbandoned
- 2003-05-09USUS10/435,581patent/US6989100B2/ennot_activeExpired - Lifetime
- 2003-05-09CACA002484625Apatent/CA2484625A1/ennot_activeAbandoned
- 2006
- 2006-01-24USUS11/339,235patent/US7628914B2/ennot_activeExpired - Fee Related
Patent Citations (19)
| Publication number | Priority date | Publication date | Assignee | Title |
|---|---|---|---|---|
| US3997298A (en) | 1975-02-27 | 1976-12-14 | Cornell Research Foundation, Inc. | Liquid chromatography-mass spectrometry system and method |
| US6091492A (en) | 1994-04-15 | 2000-07-18 | Micromeritics Instrument Corporation | Apparatus and method for determining the size distribution of particles by light scattering |
| US20010019829A1 (en) | 1995-05-23 | 2001-09-06 | Nelson Randall W. | Mass spectrometric immunoassay |
| WO1998016661A2 (en) | 1996-10-17 | 1998-04-23 | Morphagen | Morphatides: novel shape and structure libraries |
| US6421612B1 (en) | 1996-11-04 | 2002-07-16 | 3-Dimensional Pharmaceuticals Inc. | System, method and computer program product for identifying chemical compounds having desired properties |
| US6008490A (en) | 1997-03-31 | 1999-12-28 | Hitachi, Ltd. | Method and apparatus for measuring and analyzing mass spectrum |
| EP0969283A1 (en) | 1998-06-25 | 2000-01-05 | Hewlett-Packard Company | A method for processing measuring values |
| US6207955B1 (en) | 1998-09-28 | 2001-03-27 | Varian, Inc. | Pneumatically assisted electrospray device with alternating pressure gradients for mass spectrometry |
| US6147344A (en) | 1998-10-15 | 2000-11-14 | Neogenesis, Inc | Method for identifying compounds in a chemical mixture |
| US6253162B1 (en) | 1999-04-07 | 2001-06-26 | Battelle Memorial Institute | Method of identifying features in indexed data |
| US6391649B1 (en) | 1999-05-04 | 2002-05-21 | The Rockefeller University | Method for the comparative quantitative analysis of proteins and other biological material by isotopic labeling and mass spectroscopy |
| WO2000067017A1 (en) | 1999-05-04 | 2000-11-09 | The Rockefeller University | Method for the comparative quantitative analysis of proteins and other biological material by isotopic labeling and mass spectroscopy |
| US6642059B2 (en) | 1999-05-04 | 2003-11-04 | The Rockefeller University | Method for the comparative quantitative analysis of proteins and other biological material by isotopic labeling and mass spectroscopy |
| WO2001035266A2 (en) | 1999-11-08 | 2001-05-17 | Université de Montréal | Measurement signal processing method |
| US6449584B1 (en) | 1999-11-08 | 2002-09-10 | Université de Montréal | Measurement signal processing method |
| US6753966B2 (en) | 2000-03-10 | 2004-06-22 | Textron Systems Corporation | Optical probes and methods for spectral analysis |
| US20020053545A1 (en) | 2000-08-03 | 2002-05-09 | Greef Jan Van Der | Method and system for identifying and quantifying chemical components of a mixture |
| US20020102610A1 (en) | 2000-09-08 | 2002-08-01 | Townsend Robert Reid | Automated identification of peptides |
| US6526299B2 (en) | 2001-02-07 | 2003-02-25 | University College London | Spectrum processing and processor |
Non-Patent Citations (21)
| Title |
|---|
| Aach & Church (2001) Bioinformatics 17:495-508. |
| Breen, et al. (2000) Electrophoresis 21:2243-2251. |
| Bryant et al. (2001) Rapid Commun. Mass Spectrom. 15:418-427. |
| Bylund et al. (2002) J. of Chromatography A. 961:237-244. |
| Chace (2001) Chem. Rev. 101: 445-477. |
| Chelius et al. (2002) J. Proteome Res. 1:317-323. |
| do Lago et al. (1995) Anal. Chim. Acta, 310: 281-288. |
| Fiehn et al. (2000) Nat. Biotech. 18:1157-1161. |
| Grung & Kvalheim (1995) Analytica Chimica Acta 304:57-66. |
| Gygi et al. (1999) Nat. Biotech. 17:994-999. |
| Hastings et al. (2002) Rapid Communications in Mass Spectrometry 16(5):462-467. |
| Kassidas et al. (1998) AlChE Journal 44(4):864-875. |
| Koradi et al. (1998) J. Mag. Res. 135:288-297. |
| Nielsen et al. (1998) J. of Chromatography A. 805:17-35. |
| Pravdova et al. (2002) Analytica Chimica Acta 456:77-92. |
| Prazen et al. (Jan. 15, 1998) Anal. Chem. 70:218-225. |
| Sakoe & Chiba (2002) IEEE Transactions on Acoustics, Speech and Signal Processing ASSP26(1):43-49. |
| Schoonjans et al. (2000) J. Pharm. & Biomed. Analysis 21:1197-1214. |
| Stein (1999) J. Am. Soc. Mass Spectrom. 10:770-81. |
| Wang et al. (1987) Analytical Chemistry 59:649-654. |
| Windig et al. (1996) Anal. Chem., 68: 3602-3606. |
Cited By (103)
| Publication number | Priority date | Publication date | Assignee | Title |
|---|---|---|---|---|
| US8680239B2 (en) | 2000-12-22 | 2014-03-25 | Max-Planck-Gesellschaft Zur Foerderung Der Wissenschaften E.V. | Use of RGM and its modulators |
| US20060131222A1 (en)* | 2002-05-09 | 2006-06-22 | Ppd Biomarker Discovery Sciences, Llc | Methods for time-alignment of liquid chromatography-mass spectrometry data |
| US7628914B2 (en) | 2002-05-09 | 2009-12-08 | Ppd Biomarker Discovery Sciences, Llc | Methods for time-alignment of liquid chromatography-mass spectrometry data |
| US8704164B2 (en) | 2002-07-24 | 2014-04-22 | Micromass Uk Limited | Mass analysis using alternating fragmentation modes |
| US10083825B2 (en) | 2002-07-24 | 2018-09-25 | Micromass Uk Limited | Mass spectrometer with bypass of a fragmentation device |
| US9384951B2 (en) | 2002-07-24 | 2016-07-05 | Micromass Uk Limited | Mass analysis using alternating fragmentation modes |
| US9697995B2 (en) | 2002-07-24 | 2017-07-04 | Micromass Uk Limited | Mass spectrometer with bypass of a fragmentation device |
| US20110215237A1 (en)* | 2002-07-24 | 2011-09-08 | Micromass Uk Limited | Mass Analysis Using Alternating Fragmentation Modes |
| JP2007522477A (en)* | 2004-02-13 | 2007-08-09 | ウオーターズ・インベストメンツ・リミテツド | System and method for tracking and quantifying chemicals |
| US9164067B2 (en) | 2004-02-13 | 2015-10-20 | Waters Technologies Corporation | System and method for tracking chemical entities in an LC/MS system |
| US20080208485A1 (en)* | 2004-02-13 | 2008-08-28 | Waters Investment Limited | System and Method for Tracking and Quantitating Chemical Entities |
| WO2005079261A3 (en)* | 2004-02-13 | 2006-07-06 | Waters Investments Ltd | System and method for tracking and quatitating chemical entites |
| US20060255258A1 (en)* | 2005-04-11 | 2006-11-16 | Yongdong Wang | Chromatographic and mass spectral date analysis |
| US20100057377A1 (en)* | 2005-08-26 | 2010-03-04 | Agilent Technologies, Inc. | System and Method for Feature Alignment |
| US7635433B2 (en)* | 2005-08-26 | 2009-12-22 | Agilent Technologies, Inc. | System and method for feature alignment |
| US8728309B2 (en) | 2005-08-26 | 2014-05-20 | Agilent Technologies, Inc. | System and method for feature alignment |
| US20070045190A1 (en)* | 2005-08-26 | 2007-03-01 | Xiangdong Don Li | System and method for feature allignment |
| US20090297527A1 (en)* | 2005-09-30 | 2009-12-03 | Muller Bernhard K | Binding Domains of Proteins of the Repulsive Guidance Molecule (RGM) Protein Family and Functional Fragments Thereof, and Their Use |
| US8906864B2 (en) | 2005-09-30 | 2014-12-09 | AbbVie Deutschland GmbH & Co. KG | Binding domains of proteins of the repulsive guidance molecule (RGM) protein family and functional fragments thereof, and their use |
| US7680606B2 (en) | 2006-02-08 | 2010-03-16 | Thermo Finnigan Llc | Two-step method to align three dimensional LC-MS chromatographic surfaces |
| US20080046447A1 (en)* | 2006-02-08 | 2008-02-21 | Sadygov Rovshan G | Two-step method to align three dimensional LC-MS chromatographic surfaces |
| US20090082728A1 (en)* | 2006-08-23 | 2009-03-26 | Medtronic Minimed, Inc. | Infusion medium delivery system, device and method with needle inserter and needle inserter device and method |
| US20100322948A1 (en)* | 2007-09-06 | 2010-12-23 | Abbott Gmbh & Co. Kg | Bone morphogenetic protein (BMP)-binding domains of proteins of the repulsive guidance molecule (RGM) protein family and functional fragments thereof, and use of same |
| US20100028340A1 (en)* | 2008-02-29 | 2010-02-04 | Abbott Gmbh & Co. Kg | Antibodies against the rgm a protein and uses thereof |
| US9605069B2 (en) | 2008-02-29 | 2017-03-28 | AbbVie Deutschland GmbH & Co. KG | Antibodies against the RGM a protein and uses thereof |
| US8962803B2 (en) | 2008-02-29 | 2015-02-24 | AbbVie Deutschland GmbH & Co. KG | Antibodies against the RGM A protein and uses thereof |
| US8631057B2 (en) | 2009-08-25 | 2014-01-14 | International Business Machines Corporation | Alignment of multiple liquid chromatography-mass spectrometry runs |
| US8635258B2 (en) | 2009-08-25 | 2014-01-21 | International Business Machines Corporation | Alignment of multiple liquid chromatography-mass spectrometry runs |
| US20110055301A1 (en)* | 2009-08-25 | 2011-03-03 | International Business Machines Corporation | Alignment of multiple liquid chromatography-mass spectrometry runs |
| WO2011133175A1 (en) | 2009-09-23 | 2011-10-27 | Celmatix, Inc. | Methods and devices for assessing infertility and/or egg quality |
| US9175075B2 (en) | 2009-12-08 | 2015-11-03 | AbbVie Deutschland GmbH & Co. KG | Methods of treating retinal nerve fiber layer degeneration with monoclonal antibodies against a retinal guidance molecule (RGM) protein |
| US9528998B2 (en) | 2010-04-16 | 2016-12-27 | Abbott Laboratories | Methods and reagents for diagnosing rheumatoid arthrtis |
| US11692980B2 (en) | 2011-03-23 | 2023-07-04 | Regents Of The University Of Minnesota | Valve and splitting system for multi-dimensional liquid analysis |
| US9239319B2 (en) | 2011-03-23 | 2016-01-19 | Regents Of The University Of Minnesota | Valve and splitting system for multi-dimensional liquid analysis |
| US10429361B2 (en) | 2011-03-23 | 2019-10-01 | Regents Of The University Of Minnesota | Valve and splitting system for multi-dimensional liquid analysis |
| EP3323897A1 (en) | 2011-10-03 | 2018-05-23 | Celmatix, Inc. | Methods and devices for assessing risk to a putative offspring of developing a condition |
| WO2013090633A2 (en) | 2011-12-14 | 2013-06-20 | AbbVie Deutschland GmbH & Co. KG | Composition and method for the diagnosis and treatment of iron-related disorders |
| US10118958B2 (en) | 2011-12-14 | 2018-11-06 | AbbVie Deutschland GmbH & Co. KG | Composition and method for the diagnosis and treatment of iron-related disorders |
| US12098189B2 (en) | 2011-12-14 | 2024-09-24 | AbbVie Deutschland GmbH & Co. KG | Composition and method for the diagnosis and treatment of iron-related disorders |
| US9636398B2 (en) | 2011-12-14 | 2017-05-02 | AbbVie Deutschland GmbH & Co. KG | Composition and method for the diagnosis and treatment of iron-related disorders |
| WO2013090635A2 (en) | 2011-12-14 | 2013-06-20 | AbbVie Deutschland GmbH & Co. KG | Composition and method for the diagnosis and treatment of iron-related disorders |
| US10822403B2 (en) | 2011-12-14 | 2020-11-03 | AbbVie Deutschland GmbH & Co. KG | Composition and method for the diagnosis and treatment of iron-related disorders |
| EP3800200A1 (en) | 2011-12-14 | 2021-04-07 | AbbVie Deutschland GmbH & Co. KG | Composition and method for the diagnosis and treatment of iron-related disorders |
| US12098192B2 (en) | 2011-12-14 | 2024-09-24 | AbbVie Deutschland GmbH & Co. KG | Composition and method for the diagnosis and treatment of iron-related disorders |
| US9365643B2 (en) | 2012-01-27 | 2016-06-14 | AbbVie Deutschland GmbH & Co. KG | Antibodies that bind to repulsive guidance molecule A (RGMA) |
| WO2013112922A1 (en) | 2012-01-27 | 2013-08-01 | AbbVie Deutschland GmbH & Co. KG | Composition and method for diagnosis and treatment of diseases associated with neurite degeneration |
| US9102722B2 (en) | 2012-01-27 | 2015-08-11 | AbbVie Deutschland GmbH & Co. KG | Composition and method for the diagnosis and treatment of diseases associated with neurite degeneration |
| EP3653647A1 (en) | 2012-01-27 | 2020-05-20 | AbbVie Deutschland GmbH & Co KG | Composition and method for diagnosis and treatment of diseases associated with neurite degeneration |
| EP3369746A1 (en) | 2012-01-27 | 2018-09-05 | AbbVie Deutschland GmbH & Co KG | Composition and method for diagnosis and treatment of diseases associated with neurite degeneration |
| US10106602B2 (en) | 2012-01-27 | 2018-10-23 | AbbVie Deutschland GmbH & Co. KG | Isolated monoclonal anti-repulsive guidance molecule A antibodies and uses thereof |
| WO2013135769A1 (en) | 2012-03-13 | 2013-09-19 | Abbvie Inc. | Method for selecting or identifying a subject for v1b antagonist therapy |
| WO2013166217A2 (en) | 2012-05-01 | 2013-11-07 | Synapdx Corporation | Systems and methods for normalizing gene expression profiles of biological samples having a mixed cell population |
| WO2013166444A2 (en) | 2012-05-04 | 2013-11-07 | Boreal Genomics Corp. | Biomarker analysis using scodaphoresis |
| US10607722B2 (en)* | 2012-05-07 | 2020-03-31 | Shimadzu Co. | Data-processing for chromatographic mass spectrometry |
| US20130297230A1 (en)* | 2012-05-07 | 2013-11-07 | Shimadzu Corporation | Data-Processing System For Chromatographic Mass Spectrometry |
| US10162800B2 (en) | 2012-10-17 | 2018-12-25 | Celmatix Inc. | Systems and methods for determining the probability of a pregnancy at a selected point in time |
| US9177098B2 (en) | 2012-10-17 | 2015-11-03 | Celmatix Inc. | Systems and methods for determining the probability of a pregnancy at a selected point in time |
| US20160078172A1 (en) | 2012-10-17 | 2016-03-17 | Celmatix Inc. | Systems and methods for determining the probability of a pregnancy at a selected point in time |
| US10580516B2 (en) | 2012-10-17 | 2020-03-03 | Celmatix, Inc. | Systems and methods for determining the probability of a pregnancy at a selected point in time |
| US9836577B2 (en) | 2012-12-14 | 2017-12-05 | Celmatix, Inc. | Methods and devices for assessing risk of female infertility |
| US9898575B2 (en) | 2013-08-21 | 2018-02-20 | Seven Bridges Genomics Inc. | Methods and systems for aligning sequences |
| US9116866B2 (en) | 2013-08-21 | 2015-08-25 | Seven Bridges Genomics Inc. | Methods and systems for detecting sequence variants |
| US9904763B2 (en) | 2013-08-21 | 2018-02-27 | Seven Bridges Genomics Inc. | Methods and systems for detecting sequence variants |
| EP3702472A1 (en) | 2013-08-21 | 2020-09-02 | Seven Bridges Genomics Inc. | Methods and systems for aligning sequences |
| US9390226B2 (en) | 2013-08-21 | 2016-07-12 | Seven Bridges Genomics Inc. | Methods and systems for detecting sequence variants |
| WO2015048753A1 (en) | 2013-09-30 | 2015-04-02 | Seven Bridges Genomics Inc. | Methods and system for detecting sequence variants |
| WO2015058097A1 (en) | 2013-10-18 | 2015-04-23 | Seven Bridges Genomics Inc. | Methods and systems for identifying disease-induced mutations |
| US10053736B2 (en) | 2013-10-18 | 2018-08-21 | Seven Bridges Genomics Inc. | Methods and systems for identifying disease-induced mutations |
| US11049587B2 (en) | 2013-10-18 | 2021-06-29 | Seven Bridges Genomics Inc. | Methods and systems for aligning sequences in the presence of repeating elements |
| US10832797B2 (en) | 2013-10-18 | 2020-11-10 | Seven Bridges Genomics Inc. | Method and system for quantifying sequence alignment |
| US11447828B2 (en) | 2013-10-18 | 2022-09-20 | Seven Bridges Genomics Inc. | Methods and systems for detecting sequence variants |
| US10078724B2 (en) | 2013-10-18 | 2018-09-18 | Seven Bridges Genomics Inc. | Methods and systems for genotyping genetic samples |
| EP3680347A1 (en) | 2013-10-18 | 2020-07-15 | Seven Bridges Genomics Inc. | Methods and systems for identifying disease-induced mutations |
| US10055539B2 (en) | 2013-10-21 | 2018-08-21 | Seven Bridges Genomics Inc. | Systems and methods for using paired-end data in directed acyclic structure |
| US12431217B2 (en) | 2014-01-10 | 2025-09-30 | Seven Bridges Genomics Inc. | Systems and methods for use of known alleles in read mapping |
| US10867693B2 (en) | 2014-01-10 | 2020-12-15 | Seven Bridges Genomics Inc. | Systems and methods for use of known alleles in read mapping |
| US9817944B2 (en) | 2014-02-11 | 2017-11-14 | Seven Bridges Genomics Inc. | Systems and methods for analyzing sequence data |
| US10208350B2 (en) | 2014-07-17 | 2019-02-19 | Celmatix Inc. | Methods and systems for assessing infertility and related pathologies |
| US20160033313A1 (en)* | 2014-07-30 | 2016-02-04 | International Business Machines Corporation | Measuring velocity using substance characteristics |
| US9558321B2 (en) | 2014-10-14 | 2017-01-31 | Seven Bridges Genomics Inc. | Systems and methods for smart tools in sequence pipelines |
| US10083064B2 (en) | 2014-10-14 | 2018-09-25 | Seven Bridges Genomics Inc. | Systems and methods for smart tools in sequence pipelines |
| US10192026B2 (en) | 2015-03-05 | 2019-01-29 | Seven Bridges Genomics Inc. | Systems and methods for genomic pattern analysis |
| US10275567B2 (en) | 2015-05-22 | 2019-04-30 | Seven Bridges Genomics Inc. | Systems and methods for haplotyping |
| US11697835B2 (en) | 2015-08-24 | 2023-07-11 | Seven Bridges Genomics Inc. | Systems and methods for epigenetic analysis |
| US10793895B2 (en) | 2015-08-24 | 2020-10-06 | Seven Bridges Genomics Inc. | Systems and methods for epigenetic analysis |
| US12365933B2 (en) | 2015-08-24 | 2025-07-22 | Seven Bridges Genomics Inc. | Systems and methods for epigenetic analysis |
| US10724110B2 (en) | 2015-09-01 | 2020-07-28 | Seven Bridges Genomics Inc. | Systems and methods for analyzing viral nucleic acids |
| US10584380B2 (en) | 2015-09-01 | 2020-03-10 | Seven Bridges Genomics Inc. | Systems and methods for mitochondrial analysis |
| US12173374B2 (en) | 2015-09-01 | 2024-12-24 | Seven Bridges Genomics Inc. | Systems and methods for analyzing viral nucleic acids |
| US11702708B2 (en) | 2015-09-01 | 2023-07-18 | Seven Bridges Genomics Inc. | Systems and methods for analyzing viral nucleic acids |
| US11649495B2 (en) | 2015-09-01 | 2023-05-16 | Seven Bridges Genomics Inc. | Systems and methods for mitochondrial analysis |
| US11347704B2 (en) | 2015-10-16 | 2022-05-31 | Seven Bridges Genomics Inc. | Biological graph or sequence serialization |
| US11810648B2 (en) | 2016-01-07 | 2023-11-07 | Seven Bridges Genomics Inc. | Systems and methods for adaptive local alignment for graph genomes |
| US11560598B2 (en) | 2016-01-13 | 2023-01-24 | Seven Bridges Genomics Inc. | Systems and methods for analyzing circulating tumor DNA |
| US10364468B2 (en) | 2016-01-13 | 2019-07-30 | Seven Bridges Genomics Inc. | Systems and methods for analyzing circulating tumor DNA |
| US10460829B2 (en) | 2016-01-26 | 2019-10-29 | Seven Bridges Genomics Inc. | Systems and methods for encoding genetic variation for a population |
| US10262102B2 (en) | 2016-02-24 | 2019-04-16 | Seven Bridges Genomics Inc. | Systems and methods for genotyping with graph reference |
| US11250931B2 (en) | 2016-09-01 | 2022-02-15 | Seven Bridges Genomics Inc. | Systems and methods for detecting recombination |
| WO2018067730A1 (en) | 2016-10-04 | 2018-04-12 | University Of Maryland, Baltimore | Methods of treating sepsis using anti-sepsis lipid a (asla) based therapeutics |
| WO2018164580A1 (en) | 2017-03-09 | 2018-09-13 | Rijksuniversiteit Groningen | Biomarkers for cellular senescence |
| US11454617B2 (en) | 2019-01-31 | 2022-09-27 | Thermo Finnigan Llc | Methods and systems for performing chromatographic alignment |
| US12365729B2 (en) | 2020-05-13 | 2025-07-22 | Disc Medicine, Inc. | Anti-hemojuvelin (HJV) antibodies for treating myelofibrosis |
| US12399162B2 (en) | 2020-10-06 | 2025-08-26 | Shimadzu Corporation | Waveform processing device for chromatogram and waveform processing method for chromatogram |
Also Published As
| Publication number | Publication date |
|---|---|
| WO2003095978A2 (en) | 2003-11-20 |
| AU2003239409A8 (en) | 2003-11-11 |
| WO2003095978A3 (en) | 2004-02-05 |
| AU2003239409A1 (en) | 2003-11-11 |
| US20060131222A1 (en) | 2006-06-22 |
| US20040113062A1 (en) | 2004-06-17 |
| CA2484625A1 (en) | 2003-11-20 |
| US7628914B2 (en) | 2009-12-08 |
Similar Documents
| Publication | Publication Date | Title |
|---|---|---|
| US6989100B2 (en) | Methods for time-alignment of liquid chromatography-mass spectrometry data | |
| US6906320B2 (en) | Mass spectrometry data analysis techniques | |
| EP2024064B1 (en) | Ion detection and parameter estimation for liquid chromatography - ion mobility spectrometry - mass spectrometry data | |
| US7645984B2 (en) | Apparatus and method for identifying peaks in liquid chromatography/mass spectrometry data and for forming spectra and chromatograms | |
| US6936814B2 (en) | Median filter for liquid chromatography-mass spectrometry data | |
| US7087896B2 (en) | Mass spectrometric quantification of chemical mixture components | |
| US7577538B2 (en) | Computational method and system for mass spectral analysis | |
| EP2834835B1 (en) | Method and apparatus for improved quantitation by mass spectrometry | |
| US20050255606A1 (en) | Methods for accurate component intensity extraction from separations-mass spectrometry data | |
| JP4704034B2 (en) | Method of using data binning in analysis of chromatographic / spectrometric data | |
| JP2005500543A (en) | Methods and systems for profiling biological systems | |
| US20090210167A1 (en) | Computational methods and systems for multidimensional analysis | |
| EP4078600B1 (en) | Method and system for the identification of compounds in complex biological or environmental samples | |
| Boccard et al. | Mass spectrometry metabolomic data handling for biomarker discovery | |
| CN108982729A (en) | System and method for extracting mass traces | |
| US7680606B2 (en) | Two-step method to align three dimensional LC-MS chromatographic surfaces | |
| Villanueva et al. | Data analysis of assorted serum peptidome profiles | |
| EP1623352B1 (en) | Computational methods and systems for multidimensional analysis | |
| Psillakis | SEPARATION SCIENCE |
Legal Events
| Date | Code | Title | Description |
|---|---|---|---|
| AS | Assignment | Owner name:SURROMED, INC., CALIFORNIA Free format text:ASSIGNMENT OF ASSIGNORS INTEREST;ASSIGNOR:NORTON, SCOTT M;REEL/FRAME:014110/0488 Effective date:20031024 | |
| AS | Assignment | Owner name:SM PURCHASE COMPANY, LLC, CALIFORNIA Free format text:ASSIGNMENT OF ASSIGNORS INTEREST;ASSIGNOR:SURROMED, INC.;REEL/FRAME:015972/0122 Effective date:20050131 | |
| AS | Assignment | Owner name:SURROMED, LLC, CALIFORNIA Free format text:CHANGE OF NAME;ASSIGNOR:SM PURCHASE COMPANY, LLC;REEL/FRAME:015972/0085 Effective date:20050209 | |
| AS | Assignment | Owner name:PPD BIOMARKER SERVICES, LLC, CALIFORNIA Free format text:CHANGE OF NAME;ASSIGNOR:SURROMED, LLC;REEL/FRAME:016263/0117 Effective date:20050504 Owner name:PPD BIOMARKER DISCOVERY SCIENCES, LLC, CALIFORNIA Free format text:CHANGE OF NAME;ASSIGNOR:PPD BIOMARKER SERVICES, LLC;REEL/FRAME:016263/0193 Effective date:20050602 | |
| STCF | Information on status: patent grant | Free format text:PATENTED CASE | |
| FPAY | Fee payment | Year of fee payment:4 | |
| AS | Assignment | Owner name:INVESTISSEMENT QUEBEC,CANADA Free format text:SECURITY AGREEMENT;ASSIGNOR:PPD BIOMARKER DISCOVERY SCIENCES, LLC;REEL/FRAME:024170/0737 Effective date:20100325 | |
| AS | Assignment | Owner name:CAPRION PROTEOMICS, INC., CANADA Free format text:ASSIGNMENT OF ASSIGNORS INTEREST;ASSIGNOR:PPD BIOMARKER DISCOVERY SCIENCES, LLC;REEL/FRAME:029792/0881 Effective date:20091021 | |
| FPAY | Fee payment | Year of fee payment:8 | |
| AS | Assignment | Owner name:NATIONAL BANK OF CANADA, CANADA Free format text:SECURITY AGREEMENT;ASSIGNOR:CAPRION PROTEOMICS USA, LLC;REEL/FRAME:029969/0015 Effective date:20121113 | |
| FPAY | Fee payment | Year of fee payment:12 |