US6970758B1 - System and software for data collection and process control in semiconductor manufacturing and method thereof - Google Patents
System and software for data collection and process control in semiconductor manufacturing and method thereofDownload PDFInfo
- Publication number
- US6970758B1 US6970758B1US09/905,220US90522001AUS6970758B1US 6970758 B1US6970758 B1US 6970758B1US 90522001 AUS90522001 AUS 90522001AUS 6970758 B1US6970758 B1US 6970758B1
- Authority
- US
- United States
- Prior art keywords
- data
- data collection
- process control
- control system
- statistical process
- Prior art date
- Legal status (The legal status is an assumption and is not a legal conclusion. Google has not performed a legal analysis and makes no representation as to the accuracy of the status listed.)
- Expired - Fee Related, expires
Links
Images


Classifications
- G—PHYSICS
- G05—CONTROLLING; REGULATING
- G05B—CONTROL OR REGULATING SYSTEMS IN GENERAL; FUNCTIONAL ELEMENTS OF SUCH SYSTEMS; MONITORING OR TESTING ARRANGEMENTS FOR SUCH SYSTEMS OR ELEMENTS
- G05B19/00—Programme-control systems
- G05B19/02—Programme-control systems electric
- G05B19/418—Total factory control, i.e. centrally controlling a plurality of machines, e.g. direct or distributed numerical control [DNC], flexible manufacturing systems [FMS], integrated manufacturing systems [IMS] or computer integrated manufacturing [CIM]
- G05B19/41875—Total factory control, i.e. centrally controlling a plurality of machines, e.g. direct or distributed numerical control [DNC], flexible manufacturing systems [FMS], integrated manufacturing systems [IMS] or computer integrated manufacturing [CIM] characterised by quality surveillance of production
- G—PHYSICS
- G05—CONTROLLING; REGULATING
- G05B—CONTROL OR REGULATING SYSTEMS IN GENERAL; FUNCTIONAL ELEMENTS OF SUCH SYSTEMS; MONITORING OR TESTING ARRANGEMENTS FOR SUCH SYSTEMS OR ELEMENTS
- G05B15/00—Systems controlled by a computer
- G05B15/02—Systems controlled by a computer electric
- G—PHYSICS
- G05—CONTROLLING; REGULATING
- G05B—CONTROL OR REGULATING SYSTEMS IN GENERAL; FUNCTIONAL ELEMENTS OF SUCH SYSTEMS; MONITORING OR TESTING ARRANGEMENTS FOR SUCH SYSTEMS OR ELEMENTS
- G05B2219/00—Program-control systems
- G05B2219/30—Nc systems
- G05B2219/32—Operator till task planning
- G05B2219/32179—Quality control, monitor production tool with multiple sensors
- G—PHYSICS
- G05—CONTROLLING; REGULATING
- G05B—CONTROL OR REGULATING SYSTEMS IN GENERAL; FUNCTIONAL ELEMENTS OF SUCH SYSTEMS; MONITORING OR TESTING ARRANGEMENTS FOR SUCH SYSTEMS OR ELEMENTS
- G05B2219/00—Program-control systems
- G05B2219/30—Nc systems
- G05B2219/32—Operator till task planning
- G05B2219/32233—Scheduling repair
- G—PHYSICS
- G05—CONTROLLING; REGULATING
- G05B—CONTROL OR REGULATING SYSTEMS IN GENERAL; FUNCTIONAL ELEMENTS OF SUCH SYSTEMS; MONITORING OR TESTING ARRANGEMENTS FOR SUCH SYSTEMS OR ELEMENTS
- G05B2219/00—Program-control systems
- G05B2219/30—Nc systems
- G05B2219/45—Nc applications
- G05B2219/45031—Manufacturing semiconductor wafers
- Y—GENERAL TAGGING OF NEW TECHNOLOGICAL DEVELOPMENTS; GENERAL TAGGING OF CROSS-SECTIONAL TECHNOLOGIES SPANNING OVER SEVERAL SECTIONS OF THE IPC; TECHNICAL SUBJECTS COVERED BY FORMER USPC CROSS-REFERENCE ART COLLECTIONS [XRACs] AND DIGESTS
- Y02—TECHNOLOGIES OR APPLICATIONS FOR MITIGATION OR ADAPTATION AGAINST CLIMATE CHANGE
- Y02P—CLIMATE CHANGE MITIGATION TECHNOLOGIES IN THE PRODUCTION OR PROCESSING OF GOODS
- Y02P90/00—Enabling technologies with a potential contribution to greenhouse gas [GHG] emissions mitigation
- Y02P90/02—Total factory control, e.g. smart factories, flexible manufacturing systems [FMS] or integrated manufacturing systems [IMS]
Definitions
- the present disclosurerelates generally to process control, and more particularly to data collection and process control in the semiconductor manufacturing industry.
- FIG. 1is an overview diagram illustrating the interrelationships of various system components of an integrated system according to at least one embodiment of the present disclosure
- FIG. 2is a drawing illustrating the modular nature of a system according to at least one embodiment of the present disclosure
- FIG. 3is a highly simplified UML collaboration diagram illustrating the highest-level activities that are performed in the process control system according to at least one embodiment of the present disclosure
- FIGS. 4A and 4Bare flow diagrams illustrating a typical operation of a process control system according to at least one embodiment of the present disclosure
- FIGS. 5A and 5Bare block diagrams of the major subsystems of a process control system according to at least one embodiment of the present disclosure
- FIG. 6is a block diagram of an equipment interface communication subsystem within a process control system according to at least one embodiment of the present disclosure
- FIG. 7is a block diagram of an engineering data collection (EDC) subsystem within the process control system according to at least one embodiment of the present disclosure
- FIG. 8is a block diagram of a statistical process control (SPC) subsystem within a process control system according to at least one embodiment of the present disclosure
- FIG. 9is a flow diagram presenting an overview of a process control strategy (PCS) system process according to at least one embodiment of the present disclosure
- FIG. 10is a flow diagram illustrating a PCS process according to at least one embodiment of the present disclosure.
- FIG. 11is a block diagram of a chart client subsystem within a process control system according to at least one embodiment of the present disclosure
- FIG. 12shows an example of a chart navigation feature window according to at least one embodiment of the present disclosure
- FIG. 13shows an example of a chart created according to at least one embodiment of the present disclosure
- FIG. 14is a flow diagram illustrating normalization/denormalization of data according to at least one embodiment of the present disclosure
- FIG. 15is a screen shot of a chart generated according to at least one embodiment of the present disclosure.
- FIG. 16is a screen shot of another chart generated according to at least one embodiment of the present disclosure.
- FIG. 17shows an Alter Grouping, Ordering window created according to at least one embodiment of the present disclosure
- FIG. 18shows a Graph Point Detail Window created according to at least one embodiment of the present disclosure
- FIG. 19shows a database schema according to at least one embodiment of the present disclosure.
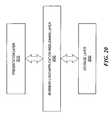
- FIG. 20illustrates the overall system architecture according to at least one embodiment of the present disclosure.
- the method, system and software disclosed hereincollect data from process and metrology tools in a semiconductor manufacturing environment, generate statistics from that data, detect tool failures, processing errors, and other conditions that can jeopardize product output, and perform high level process control in the form of tool shutdowns, lot holds, and lot releases.
- the collection and recording of data from process and metrology tools, the automatic configuration of data collection, and automatic process equipment shut downsare implemented within the existing framework of RS/1-based SPC systems and engineering data collection systems.
- FIGS. 1 through 20illustrate an engineering data collection and process control system for use in a semiconductor manufacturing environment.
- the method, system, and software disclosed hereincan be used to improve quality management objectives in areas such as data collection, data analysis, statistical process control, and corrective action plans, as well as other quality issues encountered in semiconductor manufacturing environments.
- measurement datais taken in from fabrication process tools and metrology tools, where it may then be characterized as to quality of product resulting from the various manufacturing processes.
- the methodcollects data from process and metrology tools, generates statistics from that data, detects tool failures, processing errors, and other conditions that can jeopardize product output, and performs high level process control in the form of tool shutdowns, lot holds, and lot releases.
- One method as disclosedautomates the recording of engineering data, automates configuration of data collection, and automates process equipment shut downs, all within the existing framework of existing MES systems, and engineering data collection systems in a semiconductor manufacturing environment.
- An embodimentsupports wafer- and chamber-level tracking, thus reducing the time required to detect tool failures or faulty configurations, as well as making it possible to increase the accurate diagnosis of tool failures or faulty configurations.
- the methodfacilitates control of chamber-to-chamber variations, and enables shutdown of single chambers on cluster tools.
- Measurement datamay be stored in fullest detail, and may be summarized upon extraction from the database rather than prior to storage, as is the case with many current systems. Additionally, engineering data is provided to an engineering data analysis (EDA) database as it is collected.
- EDAengineering data analysis
- the methodfacilitates decision support by allowing real-time monitoring of equipment performance during the various stages of a fabrication cycle by providing a chart client to allow, via graphical user interface, display of up to four charts per screen preview area, in a “web browser” (i.e., HTTP client program) window, via an Internet interface.
- the chartmay also be accessible without a web browser.
- Charts created with the method as disclosedpermit users to chart by semiconductor processing tool, metrology tool, or by a chamber within a semiconductor processing tool.
- usersmay view, modify, and perform “what if” analyses on statistical process control (SPC) charts, both from within a fabrication facility, or outside of a fabrication facility, on a PC or Unix workstation.
- SPCstatistical process control
- a “history reconstruction” featureallows detailed trend analyses, as well as a being a key enabler for performing “what-if” analyses.
- the engineering data collection and process control system disclosed hereinintegrates seamlessly with existing MES, engineering data collection systems, and equipment interfaces (EIs).
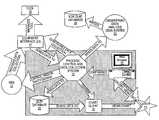
- FIG. 1is an overview diagram illustrating the functionality of systems integration in a semiconductor manufacturing environment under an embodiment of the present disclosure.
- a user 11is able to configure engineering data collection (EDC) from process and metrology tools, specify the data that is used for statistical process control (SPC), and define how the SPC data is to be processed and interpreted.
- EDCengineering data collection
- SPCstatistical process control
- all of thisis done via an Internet interface, such as web browser 15 .
- web browser 15may interface with a network other than the Internet.
- Web browser 15sends the EDC/SPC configuration data to the process control system 10 , which, through various sub-systems to be discussed in greater detail in the figures that follow, ensures that the appropriate action takes place to implement the desired EDC/SPC configuration in the manufacturing cycle.
- the manufacturing execution systembegins its function in the fabrication cycle by sending a trigger to the equipment interface (EI) 17 , which manages tool 18 .
- Tool 18may be either a process or a metrology tool used in a semiconductor manufacturing environment.
- the equipment interface 17requests and receives EDC configuration data from process control system 10 , and, in turn, sends the measurement data and other process data that the EI 17 collects from the tool 18 to process control system 10 .
- the tool measurement and other data sent from the EI 17 to the process control system 10is then sent by the process control system 10 to an OLTP (online transaction processing) database 20 , and an engineering data analysis system 25 and its online analytical processing (OLAP) database 26 .
- the measurement datamay also be distributed to various internal subscribers, such as an SPC subsystem (not illustrated).
- MES 13through process control system 10 , triggers the chart client 30 whenever a course of action involving process control occurs, in which case a relevant chart can be automatically displayed.
- the embodied process control system 10through chart client 30 , will thus automatically display SPC data as it is collected.
- This real-time data collection and analysis capabilityallows user 11 to specify high-level process control actions, such as tool shutdowns and lot holds, at any point in the manufacturing cycle.
- the area shaded in light grey in FIG. 1indicates the various systems and subsystems within process control system 10 , whose integration/interactions with existing MES and EDA systems facilitate this real-time decision support capability.
- FIG. 2the modular architecture of the various systems' components according to an embodiment of the present disclosure will be discussed.
- Each of the respective systemsare independent, yet, together function as an integral part of a whole.
- the dotted lines passing through equipment interface 50 and transaction processing database 60demarcate these integrated but separate systems, or “islands of automation” within the process control system as disclosed herein.
- Those functions handled by the data collection configuration component 55are independent of the engineering data control (EDC) broker component 65 .
- the EDC broker 65is independent of the statistical process control (SPC) component 70 .
- EDCengineering data control
- SPCstatistical process control
- FIG. 3shows a simplified Unified Modeling Language (UML) collaboration diagram illustrating the highest-level activities that are performed in the process control system according to at least one embodiment of the present disclosure.
- Unified Modeling Languageis the industry-standard, general-purpose notational language for specifying, visualizing, constructing, and documenting complex software systems, particularly large object-oriented projects, as well as for business modeling, and other non-software systems.
- UMLUnified Modeling Language
- UMLis the industry-standard, general-purpose notational language for specifying, visualizing, constructing, and documenting complex software systems, particularly large object-oriented projects, as well as for business modeling, and other non-software systems.
- FIG. 3some liberties have been taken in the order of processing, and internal components such as managers have been omitted.
- conventionsare used to describe concepts, flows, and interactions.
- a “stick man” figuredenotes an actor name or actor class (actor name:Actor class), i.e., the systems or users which interact within the system encompassed by the UML diagram.
- actor name:Actor classi.e., the systems or users which interact within the system encompassed by the UML diagram.
- FIG. 3there are six actor classes shown in FIG. 3 : :AutomationUser 301 , :ToolOwner 302 , :SPCExpert 303 , MES system 304 , :WFT (wafer fabrication technician) 305 , and :EI (equipment interface) 306 .
- the flow directional arrows going from each of the actors ( 301 - 306 )has a numerical sequence and notation written under the directional arrow.
- the numberindicates the order of the sequence within the system, and incrementing a number decimally indicates the “order” in a flow with multiple steps, thus 4 occurs first, 4.1 second, 4.2 third, 4.3 fourth, 4.3.1 fifth, 4.3.1.1 sixth, and so on.
- the notation after a number under the directional arrowsindicates the event or operation initiated or conducted by the respective actor class, and the rectangular box indicates the package name or object class name upon which the actors “act.”
- AutomationUser 301 1 :“create”indicates that AutomationUser 301 would create the object named ToolCapabilitySpec 308 .
- the second action (2)is creation of the DataCollectionPlan 307 by ToolOwner 302 .
- a third (3) actionis creation of SPCPlan 309 by SPCExpert 303 .
- MES 304sends DCIN message (4) to :EI 306 , which gets (4.1) DataCollectionPlan 307 , measures the product (4.2), transmits the data (4.3) to the EDCBroker 311 .
- EDCBroker 311updates (4.3.1) DataHistory 313 , which is stored (4.3.1.1) by Database 315 .
- Another action taken by EDCBroker 311is to update data (4.3.2) to the engineering data analysis interface, :EDALoader 317 , followed by updates (4.3.3) to the SPCProcedure.
- SPCProcedure 319gets (4.3.3.1) SPCPlan 309 . Should an out of control condition exist requiring a tool shutdown, SPCProcedure 319 sends a perform error action (4.3.3.2) to MES 304 . SPCProcedure 319 also updates (4.3.3.3) the data to the ChartClient 321 . WFT 305 views the chart and sends a correctError message (5) to Chart Client 321 , which, in turn, sends a perfomCorrectiveAction (6) message to MES 304 .
- a representative operation of the semiconductor manufacturing process control system as embodied hereinreceives measurement data at a statistical process control (SPC) system from an engineering data analysis data broker during a semiconductor manufacturing process; the SPC evaluates the data in accordance with a process control strategy (PCS), and implements appropriate control actions based upon the data evaluation.
- SPCstatistical process control
- PCSprocess control strategy
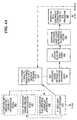
- FIG. 4is a flow diagram of a typical operation of the process control system according to at least one embodiment of the present invention. It should be noted that although the steps in FIGS. 4A-4B are described in a sequential order for purposes of illustration, some steps may be performed simultaneously with other steps, or some steps may be performed in a different order than shown in FIGS. 4A-4B .
- an automation usercreates a tool capability specification, known as a data collection capability specification (DCCS).
- DCCSdata collection capability specification
- a DCCSis a versioned document that defines the data collection capabilities of a tool (i.e., contexts, events, and parameters).
- a data collection capability specification (DCCS) versionis created before a data collection plan (DCP) is implemented.
- DCPdata collection plan
- a tool or process ownercreates a data collection plan (DCP), which, in one embodiment, is a versioned document that defines the parameters that a tool should collect at a particular context.
- the data collection plangets the tool capability specification or DCCS.
- a graphical user interfaceis used to receive for analysis a first selection indicating a set of statistical process control data associated with a semiconductor process; a second selection indicating what processing is to be performed on the set is received, and a statistical process subsystem processes the statistical process control data in accordance with the processing indicated by the second selection.
- a data collection planis associated with a DCCS and is attached to at least one MES context.
- An MES contextis the means by which DCPs are selected for engineering data collection. If a DCP is not attached to a context, it will not be used.
- the MES systemconsults the MES system database, and sends a DCIN message (stimulus) to the equipment interface (EI).
- the equipment interface (EI)gets the data collection plan.
- the EIperforms measurements (i.e., measureProduct), as requested by the data collection plan (DCP).
- the EIsends the measurement data to the engineering data collection (EDC) broker.
- the EDC brokerupdates DataHistory.
- the EDC brokersends updated DataHistory to the engineering data analysis (EDA) system, e.g., SAPPHIRE.
- EDAengineering data analysis
- step 433DataHistory subscriber sends new data to the OLTP database (transaction and performance monitoring system database) for storage.
- the EDC brokertriggers the statistical process control (SPC) procedure.
- SPC proceduregets the process control strategy (PCS) plan and data.
- the process control strategywas created by a tool or process owner in step 437 .
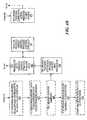
- the nature of the system framework in the method as embodied by the present disclosureis such that the measurement data received from fabrication process tools and metrology tools is received as the measurements occur, and statistical process analysis generates statistics from that data online, effectively in real-time.
- Real-timeas used herein implies both that analytical data may be displayed within seconds of its creation during a fabrication cycle, as well as there being a definitive time stamp associated with each data point generated according to an embodiment of the present disclosure.
- This real-time analysis capabilityenables early detection of processing errors and other conditions that can jeopardize product output, and does it at the batch, lot, or wafer level.
- an embodimentenables the performance of high-level process controls in the form of tool shutdowns (making a machine unavailable for use), lot holds, and lot releases.
- This high-level process control capabilityapplies to metrology tools and semiconductor processing tools, and even to the level of an individual chamber within a semiconductor processing tool having multiple chambers, or an individual polish head, for example, in the case of a tool with multiple polish heads.
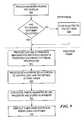
- This featureis seen in the latter steps of the flow chart of FIG. 4 (FIGS. 4 A- 4 B), as in step 445 where, if an error is detected, i.e., an out of control (OOC) condition exists, SPC procedure sends a message to the MES system (performErrorAction).
- OOCout of control
- step 450statistical process control (SPC) updates data for the chart client, and the wafer fabrication technician views SPC charts with the chart client, notes the error, and documents the action in step 455 .
- step 460the wafer fabrication technician documents the corrective action to the SPC procedure.
- step 470the SPC sends a perform corrective action message to MES system.
- FIG. 5is a block diagram of the major subsystems of the data collection and process control system.
- the components within the data collection and process control system domain 501includes a chart viewing client subsystem 505 , statistical process control subsystem 507 , the engineering data collection subsystem 508 , an interface 509 to the engineering data analysis system 511 , and a tap 503 which intercepts all communications between the equipment interface 512 and console 504 .
- Console 504serves as the interface between the engineering data collection subsystem 508 and the equipment interface 512 .
- the area shaded in darker grey in FIGS. 5A-5Bindicates the transaction processing and performance monitoring system areas 515 which are utilized by the various subsystems in process control system 501 .
- Transaction and performance monitoring system componentsmay be thought of as an underlying support layer, or “glue” which consolidates and orchestrates the smooth, seamless function of data collection and process control system 501 .
- the transaction and performance monitoring area 515includes the interface 517 between the MES system 513 and the SPC subsystem 507 .
- the graphical user interface (GUI)/HTTP-based web program interface 519allows a more user-friendly graphical presentation than that of the monolithic interfaces of the past for communicating with the other applications within the data collection and process control system domain 501 and the transaction and performance monitoring system area 515 .
- versioned documents 523can be created or edit versioned documents 523 such as a data collection capability specification (DCCS) or a process control specification (PCS).
- DCCSdata collection capability specification
- PCSprocess control specification
- versioned documents 523are not files, and are not stored as binary large objects (BLOBs).
- BLOBsbinary large objects
- Each of the versioned documents 523has its own tables in the transaction processing database into which it writes its attributes, which allows configuration data to be accessible to reporting tools.
- process context 529which is a rule-matching algorithm used to identify a DCP attached to a context matching the applicable MES context
- service management 530which groups components together into services for reliability purposes
- system management 532which controls the configuration and startup/shutdown of the system
- persistence 534which is responsible for storing the attributes of objects into the database.
- security 536authenticates users and authorizes them to perform particular functions within the system
- communication 539is the facility that allows the transmission of information from one component to another, often over a network
- logging 540which records significant events that occur in the system for troubleshooting purposes
- workflow 538insures that a versioned document that has been submitted for approval is properly routed to obtain the appropriate approvals before changes to the system proposed by the submitted versioned document become effective.
- FIG. 6a block diagram of the equipment interface communication (tap) subsystem within the data collection and process control system according to an embodiment of the present disclosure.
- tap 603may be thought of as a constant-monitoring type of device which intercepts all communications between equipment interface 612 and transaction and performance monitoring system console 604 .
- Console 604serves as the interface between the engineering data collection (EDC) subsystem 608 and the equipment interface 612 .
- EDCengineering data collection
- Tap 603is responsible for getting data out of tools 618 and into the data collection and process control system ( 501 , FIGS. 5 A- 5 B).
- Tap 603queries EDC controller 667 within EDC subsystem 608 for a data collection plan (DCP), and then sets up data collection according to the instructions in the DCP.
- EDC broker 665receives the data collected according to the DCP, and sends it to the various subscribers (not illustrated).
- entity data modelwhich is part of a semiconductor fabrication facility's equipment interface baseline (not illustrated).
- the tap 603knows how to convert the entity data model to FIDOSpeak (a simple ASCII language) and feed it to console 604 over UNIX standard input 611 .
- the console 604transmits the data 615 to the EDC broker 665 within the EDC subsystem 608 .
- EDCengineering data collection
- the EDC controller 777manages the configuration documents such as the data collection capability specification (DCCS) 781 , standard parameter naming specification (SPNS) 781 , standard collection event specification (SCES) 783 , and data collection plan (DCP) 782 from within the transaction and processing system versioned document area 725 .
- Data collection capability specifications 781describe what a tool can collect.
- Standard parameter naming specifications 780give a single person/group control over defining parameter names for consistency, while standard collection event specifications 783 are like an SPNS, but for collection events rather than parameter names.
- Data collection plans 782describe what a particular tool should collect at a particular context.
- Other application programming interfaces in support of versioned documents 725are workflow 738 , and a web user interface (UI) 719 .
- Engineering data collection (EDC) broker 765accepts data from equipment interfaces 795 or tap subsystem 703 , then distributes the data to all subscribers such as Data history 785 , the engineering data analysis (EDA) system interface 709 , and the statistical process control (SPC) subsystem 707 .
- Engineering data analysis system interface 709is responsible for transmitting raw data collection and process control system data to an engineering data analysis system (not illustrated).
- Interface 709allows MES system data collection to be deactivated in favor of the data collection and process control system as disclosed herein.
- Interface 709has a data subscription to the EDC broker 765 , just like Data History 785 and SPC subsystem 707 .
- interface 709is not a transaction and performance monitoring system component comparable to the other interfaces disclosed herein.
- Data history 785subscribes to everything and stores it in the transaction and performance monitoring system's online transaction processing (OLTP) database 790 .
- User input to engineering data collectionis accomplished via web interface 719 by a keyboard data entry client 704 .
- DCCSdata collection capability specification
- DCPdata collection plan
- the DCCSdefines the data collection capabilities of a tool and constrains the collection levels (e.g., wafer level, lot level, site level, and the like), the collection events (CEIDs) that a tool generates, and parameters that may be included in a DCP.
- the DCPdefines parameters that the tools collect, and the conditions under which to collect them based upon the DCCS with which it is associated.
- a DCPis used for engineering data collection as disclosed herein when attached to an MES context that matches the context of an MES process automation management (PAM) action.
- PAMis a proprietary term developed by Consilium to describe their application program interface (API) to equipment interfaces.
- a PAM actionis a message sent through that interface to an equipment interface (EI).
- EIequipment interface
- the EIWhen a data collection PAM action is initiated in the MES, the EI sends the PAM action context to the process control system as disclosed herein.
- the process control systemdetermines if there is a DCP attached to a context that matches the PAM action context. If there is, DCCS 1 associated with the matching DCP is used to convert the DCP to a DCEP (Data Collection Execution Plan), which is essentially the DCP with some fields resolved for the current time and context.
- the EIuses the DCEP to set up EDC behavior for data sent to the process control system as disclosed herein. If no context matching DCPs are found, engineering data collection does not transpire. Should context matching DCPs exist, the EI, through a DCEP, collects data and sends it to the data collection and process control system for storage in the OLTP database, statistical processing, and the like.
- the statistical process control (SPC) subsystemwhich includes SPC controller 807 , and SPC procedure 810 , is the heart of the data collection and process control system in the various embodiments as disclosed herein.
- SPCis responsible for performing calculations to generate statistics on collected data, applying rules to the statistics, and executing error actions when those rules are violated, and is supported through underlying transaction and performance monitoring system component 815 .
- the SPC procedure 810is a statistical engine that performs what the process control strategy 884 describes.
- a process control strategy (PCS) 884is an SPC configuration mechanism that defines the context at which to pull data from the database (i.e., the process to be controlled), the data to be used to calculate the statistical points (what data should be analyzed), how the data is processed and interpreted for SPC, and actions to take based upon the interpreted data (the rules to apply and the actions to be taken when rules are violated).
- the PCS 884is one of the versioned documents maintained within the transaction and processing system versioned document area 825 .
- Other application programming interfaces in support of versioned documents 825are workflow 838 , and a web user interface (UI) 819 .
- the SPC controller 807subscribes to the EDC subsystem 808 (EDC broker), and sends data to the appropriate SPC procedures 810 .
- EDC subsystem 808EDC broker
- the SPC controller 807is the outside world's only way to communicate with an SPC procedure 810 .
- SPC controller 807sends data to the chart client subsystem 805 , which allows visualization of statistics generated by SPC procedure 810 in graphical chart form.
- User input to create or edit process control strategy 884is accomplished via web interface 819 .
- SPC procedure 810is able to communicate with MES 813 via an interface 817 .
- PCS 884as disclosed herein enables a user to control a semiconductor manufacturing process by performing statistical analysis on the data collected on tools.
- PCS 884is an SPC configuration mechanism that defines one or more of the following: the context at which to pull data from the database (i.e., the process to be controlled); the data to be used to calculate the statistical points; how the data is processed and interpreted for SPC; and the actions to be taken based upon interpretation of the data.
- PCS 884may also define other process control elements and/or objects as desired.
- the usermakes the following specifications: Context Matching Specification, Pipeline Specification, Control Specification, and Symptoms, Causes and Fixes Specification.
- the Context Matching Specificationidentifies the context of the process control system data to use for SPC processing.
- the Pipeline Specificationdefines the data, at the matching context, to pull from the OLTP database for input to SPC, as well as describing how to process that data.
- the Control Specificationdescribes how to interpret the processed SPC data, and defines the appropriate actions to take when out of control (0° C.) conditions are detected.
- the Symptoms, Causes and Fixes Specification listscauses and fixes for potential symptoms.
- PCS 884One purpose of PCS 884 is to enable process engineers to specify how to monitor and control key components of the manufacturing process, such as process tool performance.
- a toolis controlled by monitoring the data collected before, during, and/or after specified processes. Information about the material processed on a tool is what links the data from process to process, and provides for logical separation of the data as disclosed herein.
- SPC variablethat is pulled from the database for input to SPC (e.g., parameter, toolname, tooltype, attribute, and the like)
- the lot ID, wafer ID, site ID, die ID, product and batchmay be automatically included.
- PCSsthere should be one or two PCSs per tool type, with some exceptions resulting in three or four PCSs per tool type. If, for a given process such as metal etch, a parameter is produced on multiple layers for multiple etchers, that parameter can be included in one PCS for all layers and etchers entitled, for example, Metal Etch FICD.
- metal Etch FICDMetal Etch FICD.
- stepper parametersinclude a wide range of overlay parameters, such as translation errors, magnitude errors, and the like, in addition to setup parameters and critical dimension (CD) parameters.
- Non-lot based parametersare those collected as part of a daily qualification (qual). For a given tool, non-lot based parameters would be input via a single PCS named, for example, DPS Etch Daily Qual.
- DPS Etch Daily QualFor PCSs that process lot-based parameters, there are typically as many as four parameters that represent all the controls for the tool type.
- the lot-based parameters that may be used to monitor and control an etcherinclude mean CD, standard deviation of CD, main etch rate, overetch rate, and punchthrough etch rate. These parameters would be processed as the result of one PCS named, for example, Metal Etch.
- the context matching component (not illustrated) of PCS 884 as embodied hereincontinuously monitors the OLTP database for data collected at MES contexts that match SPC contexts. Each time a match is found, the data is input to the SPC procedure 810 , which processes the data according to the Pipeline Specification discussed earlier, and then interprets the data and takes actions as defined in the Control Specification.
- PCSprocess control strategy
- the PCSdefines what data from the process control system OLTP database goes into the SPC procedure when the SPC procedure is invoked. This assumes that the data has been collected and is in the database. If the desired data has not been collected, as seen in step 907 , then the EDC of the process control system as disclosed herein is used to configure data for collection via a DCCS and DCP, as in step 909 .
- the embodied process control system data collection configurationis not a requirement, and data collection may be configured by other means that do not involve DCCSs and DCPs. Thus, there need not be a direct relationship between the PCS and the DCP or DCCS.
- the process control system data matching PCS-specified contextis processed according to the Pipeline Specification in step 911 .
- process datais interpreted according to the Control Specification, and the actions defined in the Control Specification are taken.
- the statistical points generated by the SPC procedureare stored in the OLTP database in step 913 .
- Statistical process control chartsmay be accessible by means of the Internet or another network, and may be presented via a graphical user interface in various formats such as wafer maps, histograms, scatter plots, bar chart, line graphs, and the like.
- a flow diagram illustrating use of the PCS process according to an embodiment of the present disclosureis presented in FIG. 10.
- a PCS document for the parameter to measureshould exist, therefore determination of whether a PCS document for the process context (e.g., tool type) to be measured exists is conducted in step 1010 . If a PCS process does exist, in step 1015 , determination is made as to whether the parameter(s) wanted may be added to the existing PCS document. If a suitable PCS document does not exist, then a new PCS version is created and saved, as in step 1020 . In step 1025 , determination is made as to the suitability of the PCS version. Should the PCS version not be suitable, in step 1030 the necessary editing of the PCS version is done.
- a PCS document for the process contexte.g., tool type
- the usermay plot and view statistical points using the chart client, as in step 1035 . If editing of a PCS version were required, after editing has been finalized, the edited PCS version would be attached to an approval flow (not illustrated). When the edited PCS version is approved by all of the approvers in the flow, it automatically becomes effective, that is, in use.
- Chartsare created in the process control system as embodied herein using the PCS component. Charts may be categorized by semiconductor fabrication module, and may display data in formats consisting of wafer maps, histograms, scatter plots, bar charts, line graphs, or any other suitable format on any processing tool or metrology tool which communicates with data collection and process control system as disclosed herein.
- the use of chart client 1105allows visualization of SPC procedure 1110 statistics using a graphical display 1104 . Chart client 1105 also allows for printing of charts to a printer 1106 , or to a file (not illustrated), should the user so desire.
- the chart client 1105talks to SPC controller 1107 to obtain data and record annotations.
- SPC controller 1107 and SPC procedure 1110are part of the SPC subsystem 1112 .
- Chart client 1105can perform certain types of “what-if” analyses, and includes a symptoms/cause/failure (SCF) graphical troubleshooting client (not illustrated).
- Chart client 1105may be utilized at an MES computer terminal after data collection, and is implemented as a stand-alone thin client in at least one embodiment.
- the procedure for starting chart client 1105may depend upon whether it will be run in the fabrication facility or outside the fabrication facility on a PC or Unix workstation.
- the MEScan automatically initiate chart client 1105 whenever a process involving process control occurs. In this instance, the relevant chart is automatically displayed.
- usersmay view charts, for example, using a telnet session through the transaction and performance monitoring system's production server using a Unix production account.
- FIG. 12shows an example of a chart navigation feature window according to an embodiment of the present disclosure, and designated generally as chart navigation feature window 1200 .
- Chart navigation feature window 1200displays a list of charts 1205 that pertain to a user-selectable dropdown module menu 1210 .
- the dropdown module menu 1210is displaying ETCH.
- the userTo select one of the listed charts 1205 , the user simply positions a mouse or other pointing device over the name of the listed chart to select (highlight) a particular chart name from the listed charts 1205 .
- the dropdown module menu 1210may be changed to display charts that belong to another module by the user making a selection from dropdown module menu 1210 .
- the number of runs to display field 1215indirectly controls the number of points displayed on the chart. Direct control of the number of runs to display is specified in the PCS.
- the PCSis not changed from chart navigation feature window 1200 , however, a user may temporarily change the value in number of runs field 1215 by editing the displayed value to the desired value.
- a click on the OK button 1217will display the chart. Actions may be cancelled at any time by clicking the cancel button 1218 .
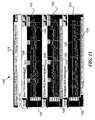
- Chart name 1310is displayed in the title bar of the chart.
- chart name 1310is a concatenation of information entered in the Version Information of the PCS, as follows: Criticality: Chart Owner: PCS Name: Owner Contact Info: Chart Title.
- CriticalityChart Owner: PCS Name: Owner Contact Info: Chart Title.
- the name of the chartis C: Jane Doe: Multilayer Normalized PCS by Group: ext 54321, mailto:Jane.Doe@amd.com: Testing PCS for Metal 4 . It will be appreciated that other suitable naming conventions can be used.
- Each graph 1311 , 1312 , and 1313 that makes up the chart window 1300displays a different statistic, and the name of the statistic 1314 , 1315 , and 1316 plotted is displayed immediately above the corresponding graph, along with the normalization state of the graph in parentheses after the statistic name 1314 - 1316 . Consequently, in our example, graph 1311 displays the statistic named Mean FICD (Non-Normalized) 1314 , while graph 1312 displays the statistic named STDDev FICD (Non-Normalized) 1315 , and graph 1313 displays the statistic named Normalized FICD (Normalized) 1316 . It should be noted that the terms in parentheses, e.g., (Normalized) are not apart of statistic name 1314 - 1316 , but rather an annotation added by the chart client for clarity.
- the order (first to last) in which these statistics are listed in the PCSdetermine their order of presentation (top to bottom) in chart window 1300 .
- the target value 1320is identified, as are the upper control limit 1325 and lower control limit 1330 .
- the PCS ownermay choose to display any valid attribute on the x-axis by specifying an attribute defined by the PCS owner in the Pipeline Specification/Input Variables section of the PCS. For example, in graphs 1312 and 1313 , measurement time was specified by the PCS owner, and is thus displayed on the x-axis.
- FIG. 14a flow diagram illustrating normalization/denormalization of data according to an embodiment of the present disclosure will be discussed.
- An embodiment of the process control and data collection systemallows for data analysis and presentation techniques for statistical control data charts in ways that may enable production engineers, process engineers, wafer fabrication technicians, and other technical personnel in a semiconductor fabrication facility to positively impact the final quality of product created.
- the chart client subsystemmay be used to display data that, in addition to the standard “normalized” SPC chart, is able to be manipulated and mathematically transformed such that the data may be presented in a “denormalized” fashion as well. This is not to say that one cannot generate the standard Shewhart control charts (where the center line is process mean, and the upper and lower control limits represent the 3-sigma values from the mean) using the method as disclosed, if desired.
- Each recipe performed with a semiconductor fabrication toolproduces results (data) with a measurable mean and standard deviation. Knowing the mean and standard deviation of each recipe permits the application of this mathematical transformation (referred to as normalizing) to the data from that recipe. Then, because all of the normalized data has the same distribution, it may be conveniently plotted on a single SPC chart whose centerline is zero with control limits at plus and minus 3, commonly referred to as the “normalized” SPC chart or Shewhart control chart as was discussed above. This offers the advantages of fewer charts, with more rapid accumulation of process history on a single chart as a result.
- FIG. 14An example of the technique as embodied herein is shown in FIG. 14 .
- Xbe a random variable whose distribution has mean, A, and standard deviation, B.
- Zbe a random variable whose distribution has mean, C, and standard deviation, D.
- Zphysically represents a second set of data associated with a second process with a set of parameters different from the first set of parameters.
- Y[(X ⁇ A)/B]D+C, 1430 , as a random variable whose distribution now has a mean, C, and standard deviation, D.
- step 1420we have X normalized using its own mean and standard deviation, and then denormalized using the mean and standard deviation of Z in step 1440 , in order to have the same distribution as Z, the target recipe. Then in step 1450 the values for Y and Z are plotted together utilizing the chart client as disclosed herein, thus allowing all the advantages of the normalized chart without the loss of reference produced by plain normalization.
- the recipeis the target recipe. Data from other recipes are transformed (normalized and then denormalized to the target recipe) to have the same distribution as the target recipe.
- target recipe pointsmay be highlighted, to present to the viewer an easy way to evaluate the performance of that single recipe over time. Points from other recipes are also plotted in time order, but their appearance is muted. Changing the target recipe is easily accomplished from within the chart client as embodied herein.
- usersmay modify the normalization of features displayed with the chart client.
- the usercan simply right click with a mouse or other pointing device, anywhere inside the graph.
- Thiswill display a normalization menu 1510 , as seen in FIG. 15 , which is a screen shot of a chart generated according to an embodiment of the present disclosure.
- Options selectable from normalization menu 1510include non-normalized 1512 , which means that the data displayed will not be normalized, that is, the actual statistical values will be plotted; normalized 1514 , which means that the statistical data points will be normalized (standardized) using the mean and standard deviation of the process recipe associated with the data; and normalized to target 1516 .
- the y-axiswill correspond to the normalized range of the statistics, which is +/ ⁇ 3-sigma.
- the Metal 4 statisticswill be normalized using the mean and standard deviation for the Metal 4 recipe
- the Metal 5 statisticswill be normalized using the mean and standard deviation of the Metal 5 recipe.
- the resulting graphwill have a target value of zero, and control limits of +/ ⁇ 3 sigma.
- the option normalized to target 1516is used to display the statistical data points on a graph whose y-axis corresponds to the natural metric of the statistic, instead of the unitless zero, +/ ⁇ 3 sigma of a normalized graph.
- the datais normalized as described above, and then the normalized points are normalized again using the mean and standard deviation of the target recipe selected.
- Target recipes in this exampleare Metal 5 , 1518 , and Metal 4 , 1519 . If item target 1520 is selected instead of a target recipe, then the target recipe will automatically be the recipe associated with the most recently generated point on the graph.
- Another embodiment of the present disclosure that may facilitate trend analysisis a data history reconstruction feature.
- the results of a history reconstruction operationare presented via the chart client subsystem by a common, graphical user interface (Internet or other network interface).
- Trends from past datamay be imported and viewed for trend analysis.
- Analysis chartsmay be used to, for example, recalculate control limits.
- a viewermay select to change plotting parameters and change grouping of data for display to investigate a “theoretical” new limit, tolerance, or other parameter of interest. These changes are not permanent, and are not sent to the database for recording because the changes are for problem analysis/solving and trialing purposes. Viewers may print these variously changed charts either to a file, or to a printer as a means of preserving the trials, if desired.
- An embodiment of the present disclosureallows for offline capability analysis of the semiconductor process measurement data as well. Should one wish to know if a processing machine's function could be changed from an existing specification requirement and increase the capability of the machine as a result, the method embodied herein supports this. For example, a user could select an amount of data, i.e., all of the measurements made by that tool during a period (i.e. week, month, year, machine cycle, or the like), create a histogram using the chart client as disclosed herein, and compare the outcome to see if the new process is capable of living inside the specification requirements.
- the main types of changes to the input data that a user may tryinclude, but are not limited to: data filtering based on grouping or control recipe, recalculation of graph limits based upon currently displayed statistics, and changing the grouping or ordering of the currently displayed statistics.
- Datamay be presented graphically as histograms, scatter plots, wafer maps, bar charts, line graphs, or the like.
- the methodinvolves identifying data to be processed, selecting statistical processing analyses to be carried out on the data, retrieving the identified data from storage, and evaluating the data according to the selected statistical processing analyses.
- the identified datamay include previously recorded semiconductor process measurements as well as original process parameters of the semiconductor process measurements, whether performed by metrology tools or process tools.
- the framework of the distributed architecture of the data collection and process control system as embodiedis such that the original process parameters and the semiconductor process measurements may be stored together, that is, accessible point by point, even if the respective measurements are stored in different tables of a relational database.
- This identified datamay be retrieved via an interface from online transaction processing (OLTP) databases associated with the transaction and performance monitoring system components underlying the process control and data collection system embodied by the present disclosure.
- OTPonline transaction processing
- a usermay change groupings and/or ordering of identified and selected statistics and display a new grouped chart of the change in grouping and/or ordering using a common graphical user interface.
- This change of grouping or ordering featureis accomplished with the chart client.
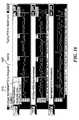
- FIG. 16is a screen shot of a chart generated according to an embodiment of the present disclosure.
- Grouping and ordering of the chart client graphsare specified in the Control Specifications/Statistics section of the process control strategy (PCS) as disclosed herein.
- PCSprocess control strategy
- a usermay temporarily regroup or reorder data statistics from within the chart client for experimentation or trial purposes.
- the usermay select Analysis ⁇ Group/Order Changes tab 1610 from menu bar 1605 .
- This actionwill launch a new window, shown in FIG. 17 , and referred to as Alter Grouping, Ordering window 1700 .
- the userFor each statistic (i.e., graph) 1705 , the user makes the desired selections from the Linked checkboxes 1710 , Group By drop down menus 1715 , or Order By drop down menus 1720 .
- the linked optionis used to facilitate grouping and ordering changes.
- the userselects the Linked checkbox 1710 to link the statistic to any other statistic whose Linked checkbox 1710 is checked. When the grouping or ordering of any linked statistic is changed, that attribute will be changed for all linked statistics.
- the group by attribute for Mean FICD 1706is changed to Product (not shown) in the Group By drop down menu 1715 associated with Mean FICD 1706
- the group by attribute for StdDev FICD 1707 and Normalized FICD 1708will automatically be changed to Product because all three statistics are linked by having their respective Linked checkboxes 1710 checked, as illustrated in FIG. 17.
- a userselects from the Group By drop down menus 1715 to change an attribute on which grouping is based. Examples of some choices available from the Group By drop down menus 1715 may include lot, product, recipe, or operation.
- a userselects from the Order By drop down menus 1720 to change an attribute on which ordering is based.
- Examples of some choices from Order By drop down menus 1720may include processing time at some prior context, metrology time, or lot number.
- the Go button 1725is selected to regenerate the graphs and display the new grouped and/or ordered chart.
- the userselects the Cancel button 1730 .
- the chart clienthas methods for identifying key graph points. For example, a blue box can be displayed around the most recently generated point on a graph, a green circle can be displayed around a point that has been annotated, a triangle along the x-axis can be used to denote a missing statistic, and a yellow box to identify a selected point. For example, when the user selects a point by clicking once on it, a yellow box may be displayed around that point. At the same time, a yellow box is displayed around those points corresponding to the same data that generated the selected point on the other graphs in the chart window. A small red “x” can be used to cover an “out of control” point as defined in the PCS.
- a usermay select this point by double-clicking on the large red “X” to display information regarding the out of control point in Graph Point Detail Window 1800 as illustrated in FIG. 18
- the General Information tab 1810 of Graph Point Detail Window 1800displays data about the selected point in one of several areas: an attribute and value area 1811 , a general area 1812 , an out-of-control actions area 1814 , and an annotation history area 1816 .
- Usersmay create an annotation for any point displayed with Graph Point Detail Window 1800 by entering text in area 1820 and clicking the add button 1821 . The annotation is added, and the point on the graph 10 will be circled.
- General area 1812displays various fields such as the value of the selected point, the upper control limit (UCL) of the graph containing the point, the target value for the graph containing the point, the lower control limit (LCL), the PCS Recipe, Run ID number, and out of control (OOC) violation.
- the attribute and value area 1811lists the attributes defined in the PCS and their corresponding values.
- the out-of-control actions area 1814lists the action(s) that were taken by the process control system as disclosed herein in the “Action” column 1825 for the selected out-of-control point, for example, shut down the tool, hold the lot, or (sent) Email to the person listed in the PCS. If no actions were taken by the process control system, Action column 1825 would be blank.
- the “Correct” column 1830would contain an active button. After taking the appropriate corrective action, the user selects this button to undo the corresponding action, i.e., to bring the tool back up or release the lot from hold. A message from the MES is displayed in the Message column 1835 if the user action to bring the tool back up or release the lot from hold failed. Otherwise, nothing is displayed in Message column 1835 .
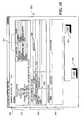
- database schema 1900the database schema according to an embodiment of the present disclosure, generally referred to as database schema 1900 .
- the schema, or structure of the databasedefines the tables, the fields in each table, and the relationships between fields and tables.
- the term schemais also used to refer to a graphical depiction of the database structure, such as that seen in FIG. 19 .
- Relational database technology as used in the embodied system as disclosed hereingenerally consists of a set of interconnected tables, such as the various tables seen in schema 1900 .
- Run table 1910is the top-level table when data is submitted.
- Each report of data to the data collection and process control system from a client applicationinserts a row into Run table 1910 .
- a “run” as used hererefers to a quantity of data collected on material that was processed together so, for example, a row in the run table may equate to data on three wafers, where each table has a field or an amalgamation of fields that uniquely identifies each record (tuple) in the table. This unique identifier is referred to as a primary key.
- a primary keyis a field that uniquely identifies a record in a table.
- Primary keysare identified with brackets, i.e, [PK 1 ] in schema 1900 .
- An example of a primary keyfor example, appears in Run table 1910 at the end of the RUNID row, which indicates that RUNID is a primary key.
- a foreign keyrepresents the value of a primary key for a related table. That is, a foreign key is a field or collection of fields in one table whose values match the values of the primary key of a different table. However, a foreign key may not need to be a primary key as disclosed herein.
- Foreign keysare also identified with brackets, i.e., [FK] in schema 1900 .
- a first primary key identifying a semiconductor runis stored in a first table of a relational database
- a second primary key identifying a production unitis stored in a second table of a relational database.
- a third tablestores process measurement information, and a third primary key identifying a production unit reading, as well as the first primary key to associate process measurement information with the semiconductor production run, and the second primary key to associate the process measurement information with the production unit.
- RunUnitReadingAttr table 1960An example of the use of primary and foreign keys is seen in RunUnitReadingAttr table 1960 , and RunUnitReading table 1950 .
- RunUnitReadingAttr table 1960the row READINGID is indicated to be a foreign key [FK], with the corresponding primary key [PK 1 ] being located in RunUnitReading table 1950 as READINGID.
- the RunUnitReading table 1950contains the measurements, and is for numeric readings only—string parameter readings are stored in the RunUnitReadingAttr table 1960 .
- RunUnit table 1930Another example is seen in RunUnit table 1930 , which has a primary key containing the data in both RUNID and UNITID together.
- RunUnit table 1930a row is inserted for each of the units in the run, where a unit is a lot, wafer, site, and the like, depending on the aggregation level.
- the RunUnitAttr table 1970contains any additional information about a unit that is the submitter of the data sent with it.
- the format used in RunUnitAttr table 1970is a name/value/BLOB (binary large objects) tuple (record).
- RunUnitReadingAttr table 1960serves the same purpose as RunUnitAttr table 1970 , but contains additional information about readings on those units, not the units themselves.
- An embodiment of the methodcomprises storing information about a first semiconductor process measurement in a first table of a relational database, where the first process measurement is associated with a first unit with a first aggregation level, and storing information about a second semiconductor process measurement in the first table, the second process measurement associated with a second unit with a second aggregation level different from the first aggregation level.
- An aggregation levelis the level at which the records are being described and controlled, that is, aggregation is an object made up of other objects.
- the stored information from the first tableis associated with a second table of the rational database, and information characterizing the first unit is stored in the second table, as is information characterizing the second unit.
- the information characterizing the first unitincludes information specifying the first aggregation level
- the information characterizing the second unitincludes information specifying the aggregation level
- the second tablemay be associated with a third table of the relational database, and the third table may store information characterizing a first product run associated with the first unit, and information characterizing a second product run associated with the second unit.
- aggregation levelsmay be selected from a group which includes batches, lots, and wafers.
- the information stored about the various process measurementsmay include various attributes such as die-level measurements, wafer-level measurements, site-level measurements, coordinate-level measurements, calculated results based on a plurality of measurements, or various mixtures thereof.
- aggregation levelsFor example, a lot-averaged measurement and a set of particular die measurements on a particular wafer could be considered aggregation levels.
- the use of aggregation levels and primary and foreign keys in schema 1900enables the storage of control limits with each data point such that when the data is retrieved, the data “remembers” what the limits were when it was stored. These old limits may be plotted with the chart client subsystem as embodied, along with “new” limits, should a process change control limits during a process evolution.
- each of the rowscontains a tuple (record) with a descriptive name.
- the namesare generally descriptive of the information within a tuple, and may be defined as follows:
- RUNID, UNITID, CATEGORY, ATTRIBUTENAME, ATTRIBUTE VALUE, AND ATTRIBUTE DATA in RUNUNITATTR table 1970are analgous to the terms in RUNUNITREADINGATTR table 1960 , but describe units instead.
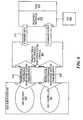
- the software system of an embodiment of the present disclosuremay utilize a three-tier architecture (browser, web server, database).
- the highest tier 2010is the Presentation Layer, the object-oriented remote method invocation (RMI) environment consisting of the menus, buttons, dialog boxes, charts and other items able to be seen by the user.
- the middle tier 2020contains the Business Logic/Application Middleware Layer such as the Java server components that are responsible for distributing objects across servers and networks (i.e., the Internet).
- the lowest tier 2030is a database containing raw production data that is connected by the Middleware Layer to other servers and the Presentation Layer. Oracle may be used as the database management system in lowest tier 2030 . It should be server, application server, database), may also be employed to practice the teachings as disclosed herein.
- the various functions and components in the present applicationmay be implemented using a data processor, or a plurality of data processing devices.
- a data processormay be a microprocessor, microcontroller, microcomputer, digital signal processor, state machine, logic circuitry, and/or any device that manipulates digital information based on operational instruction, or in a predefined manner.
- the various functions and systems represented by block diagramsare readily implemented by one of ordinary skill in the art using one or more of the implementation techniques listed herein.
- the instructionmay be stored in memory.
- a memorymay be a single memory device or a plurality of memory devices.
- Such a memory devicemay be read-only memory device, random access memory device, magnetic tape memory, floppy disk memory, hard drive memory, external tape, and/or any device that stores digital information.
- the data processorimplements one or more of its functions via a state machine or logic circuitry
- the memory storing the corresponding instructionsmay be embedded within the circuitry that includes a state machine and/or logic circuitry, or it may be unnecessary because the function is performed using combinational logic.
- Such an information handling machinemay be a system, or part of a system, such as a computer, a personal digital assistant (PDA), a hand held computing device, a cable set-top box, an Internet capable device, such as a cellular phone, and the like.
- PDApersonal digital assistant
- One of the implementations of the inventionis as sets of computer readable instructions resident in the random access memory of one or more processing systems configured generally as described in FIGS. 1-19 .
- the set of instructionsmay be stored in another computer readable memory, for example, in a hard disk drive or in a removable memory such as an optical disk for eventual use in a compact disc (CD) drive or digital video disc (DVD) drive or a floppy disk for eventual use in a floppy disk drive.
- the set of instructionscan be stored in the memory of another processing system and transmitted over a local area network or a wide area network, such as the Internet, where the transmitted signal could be a signal propagated through a medium such as an ISDN line, or the signal may be propagated through an air medium and received by a local satellite to be transferred to the processing system.
- a signalmay be a composite signal comprising a carrier signal, and contained within the carrier signal is the desired information containing at least one computer program instruction implementing the invention, and may be downloaded as such when desired by the user.
- the physical storage and/or transfer of the sets of instructionsphysically changes the medium upon which it is stored electrically, magnetically, or chemically so that the medium caries computer readable information.
Landscapes
- Engineering & Computer Science (AREA)
- General Engineering & Computer Science (AREA)
- Physics & Mathematics (AREA)
- General Physics & Mathematics (AREA)
- Automation & Control Theory (AREA)
- Manufacturing & Machinery (AREA)
- Quality & Reliability (AREA)
- General Factory Administration (AREA)
Abstract
Description
- RUN table1910 terms:
- RUNID—Identifier (ID) for a run. RUNID is the foreign key for Run table1910.
- FACILITY—Facility where data was generated, e.g.,
Fab 10 - OPERATION—Operation is a MES system term to describe a particular set of processing at a particular layer, generally identified by a four-digit number, e.g., Operation2270 might be gate critical dimension metrology. There are scripts at each operation that define the details of how to accomplish processing for that operation.
- STEPNAME—A user-friendly name for a particular processing point, for example “TEOS deposition”
- ENTITY—Almost always identifies a tool
- TIMESTAMP—Timestamp assigned by MES system at the beginning of a transaction
- RUNUNIT table1930 terms:
- RUNID—Identifier (ID) for a run.
- UNITID—Identifies a thing that was measured. For example, when the aggregation level is lot, the unit ID is a lot ID, and when the aggregation level is a wafer, the unit ID is a wafer ID, and so on.
- AGGREGATION LEVEL—the level at which the records are being described and controlled, that is, an aggregation level is an object made up of other objects.
- WAFERID—The vendor scribe, which is a unique code physically inscribed on the wafer.
- LOTID—Identifier for a lot. A lot is a cassette full of wafers.
- PRODUCT—type of product being manufactured, e.g., the type of chip being manufactured on a wafer
- ROUTE—MES or rework route
- EVENT—something that happens to an entity, i.e., represents some command to a tool
- PORT—input to tool, e.g. cassettes
- PROCESSINGAREA—a chamber
- BATCH—The number of wafers or lots that a tool processes in a single run
- LOTRECIPE—recipe used to manufacture lot
- SCRIPTID—Identification of processing script used for a given route for a given unit. The script is specific to a route (which is specific to a product) and an operation.
- WAFERRECIPE—When a tool runs multiple successive recipes on each wafer, the wafer recipe reports each of the recipes that was used.
- CARRIER—tray used to transport product
- SLOT—location in carrier
- RUNUNITREADING table1950 terms:
- READINGID—A surrogate key which is used to identify a reading uniquely.
- RUNID—Identifier (ID) for a run
- UNITID—Identifies a thing that was measured. For example, when the aggregation level is lot, the unit ID is a lot ID, and when the aggregation level is a wafer, the unit ID is a wafer ID, and so on.
- PARAMETERNAME—a name for the physical quantity being measured
- MEASUREMENTVALUE—the numerical value of the measured data
- ISEMPTY—A flag indicating whether or not the reading is an actual reading or a gap representing a missing reading.
- SITE ID—Identifier for where on a wafer a reading was taken. Site ID is a code that varies from tool to tool.
- SITEX—coordinates of the measurement site; the coordinate scheme and origin differ from tool to tool
- SITEY—coordinates of the measurement site; the coordinate scheme and origin differ from tool to tool
- DIEID—similar to the corresponding site locations, except these readings indicate a chip on a wafer instead of a point
- DIEX—similar to the corresponding site locations, except these readings indicate a chip on a wafer instead of a point
- DIEY—similar to the corresponding site locations, except these readings indicate a chip on a wafer instead of a point
- RUNUNITREADINGATTR table1960 terms:
- READINGID—foreign key identifying the reading to which this attribute applies
- CATEGORY—identifies the kind of attribute this is
- ATTRIBUTENAME—a name assigned to the attribute
- ATTRIBUTEVALUE—value assigned to an attribute. If ATTRIBUTEVALUE is anything other than a BLOB, the value is converted to a string and stored here.
- ATTRIBUTEDATA—if data type of attribute is BLOB, the data is here.
Claims (27)
Priority Applications (1)
| Application Number | Priority Date | Filing Date | Title |
|---|---|---|---|
| US09/905,220US6970758B1 (en) | 2001-07-12 | 2001-07-12 | System and software for data collection and process control in semiconductor manufacturing and method thereof |
Applications Claiming Priority (1)
| Application Number | Priority Date | Filing Date | Title |
|---|---|---|---|
| US09/905,220US6970758B1 (en) | 2001-07-12 | 2001-07-12 | System and software for data collection and process control in semiconductor manufacturing and method thereof |
Publications (1)
| Publication Number | Publication Date |
|---|---|
| US6970758B1true US6970758B1 (en) | 2005-11-29 |
Family
ID=35405330
Family Applications (1)
| Application Number | Title | Priority Date | Filing Date |
|---|---|---|---|
| US09/905,220Expired - Fee RelatedUS6970758B1 (en) | 2001-07-12 | 2001-07-12 | System and software for data collection and process control in semiconductor manufacturing and method thereof |
Country Status (1)
| Country | Link |
|---|---|
| US (1) | US6970758B1 (en) |
Cited By (65)
| Publication number | Priority date | Publication date | Assignee | Title |
|---|---|---|---|---|
| US20040162887A1 (en)* | 2003-02-19 | 2004-08-19 | Steven Dillon | Open network-based data acquisition, aggregation and optimization for use with process control systems |
| US20050027481A1 (en)* | 2003-07-18 | 2005-02-03 | Samsung Electronics Co., Ltd. | System for making semiconductor devices and processing control thereof |
| US20050288810A1 (en)* | 2004-06-24 | 2005-12-29 | Mu-Tsang Lin | Automatic statistical process control (SPC) chart generation apparatus and method thereof |
| US20060064188A1 (en)* | 2004-09-03 | 2006-03-23 | Yukihiro Ushiku | Process-state management system, management server and control server adapted for the system, method for managing process-states, method for manufacturing a product, and computer program product for the management server |
| US20060195212A1 (en)* | 2005-02-28 | 2006-08-31 | Gunnar Flach | Automated throughput control system and method of operating the same |
| US20060236142A1 (en)* | 2002-02-01 | 2006-10-19 | Xerox Corporation | Methods and systems for accessing email |
| US20070008972A1 (en)* | 2005-07-11 | 2007-01-11 | Mks Instruments, Inc. | Address-transparent device and method |
| US7200523B1 (en)* | 2005-11-30 | 2007-04-03 | Taiwan Semiconductor Manufacturing Company, Ltd. | Method and system for filtering statistical process data to enhance process performance |
| US7200824B1 (en)* | 2004-11-16 | 2007-04-03 | Altera Corporation | Performance/power mapping of a die |
| US7200671B1 (en)* | 2000-08-23 | 2007-04-03 | Mks Instruments, Inc. | Method and apparatus for monitoring host to tool communications |
| US20070150235A1 (en)* | 2004-04-07 | 2007-06-28 | Mks Instruments, Inc. | Controller and Method to Mediate Data Collection from Smart Sensors for Fab Applications |
| US20070191980A1 (en)* | 2006-02-16 | 2007-08-16 | Powerchip Semiconductor Corp. | Method for managing tools using statistical process control |
| US20070198108A1 (en)* | 2006-02-23 | 2007-08-23 | Rockwell Automation Technologies, Inc. | Safety versus availability graphical user interface |
| US20070239305A1 (en)* | 2006-03-28 | 2007-10-11 | Haoren Zhuang | Process control systems and methods |
| US20080103617A1 (en)* | 2006-10-27 | 2008-05-01 | Jayaraman Subramanian | Manufacturing execution system, equipment interface and method of operating a manufacturing execution system |
| US20080252643A1 (en)* | 2007-04-12 | 2008-10-16 | Promess, Inc. | Method and system for developing a strategy for use in a controller and storage medium for storing instructions which effectuate the method |
| US20090055692A1 (en)* | 2007-08-23 | 2009-02-26 | Natalia Kroupnova | Method and apparatus to automatically create virtual sensors with templates |
| US20090089247A1 (en)* | 2007-09-28 | 2009-04-02 | Terrence Lynn Blevins | Methods and apparatus to standardize data properties in a process control environment |
| US20100268365A1 (en)* | 2009-04-20 | 2010-10-21 | Siemens Aktiengesellschaft | Method for managing product segments of product production rules |
| US20110077765A1 (en)* | 2009-09-28 | 2011-03-31 | International Business Machines Corporation | Tool commonality and stratification analysis to enhance a production process |
| US20120022679A1 (en)* | 2010-06-14 | 2012-01-26 | Kla-Tencor Corporation | Advanced process control optimization |
| US20120029957A1 (en)* | 2010-08-02 | 2012-02-02 | National Tsing Hua University | Factor analysis system and analysis method thereof |
| US20130110263A1 (en)* | 2011-10-31 | 2013-05-02 | Applied Materials, Inc. | Bi-directional association and graphical acquisition of time-based equipment sensor data and material-based metrology statistical process control data |
| US20140188269A1 (en)* | 2012-12-31 | 2014-07-03 | Sunedison, Inc. | Method and system for a meta-recipe control software architecture |
| US9397836B2 (en) | 2014-08-11 | 2016-07-19 | Fisher-Rosemount Systems, Inc. | Securing devices to process control systems |
| US20160370797A1 (en)* | 2015-06-16 | 2016-12-22 | Kla-Tencor Corporation | System and Method for Monitoring Parameters of a Semiconductor Factory Automation System |
| US9541905B2 (en) | 2013-03-15 | 2017-01-10 | Fisher-Rosemount Systems, Inc. | Context sensitive mobile control in a process plant |
| US9558220B2 (en) | 2013-03-04 | 2017-01-31 | Fisher-Rosemount Systems, Inc. | Big data in process control systems |
| US9665088B2 (en) | 2014-01-31 | 2017-05-30 | Fisher-Rosemount Systems, Inc. | Managing big data in process control systems |
| US9697170B2 (en) | 2013-03-14 | 2017-07-04 | Fisher-Rosemount Systems, Inc. | Collecting and delivering data to a big data machine in a process control system |
| US9740802B2 (en) | 2013-03-15 | 2017-08-22 | Fisher-Rosemount Systems, Inc. | Data modeling studio |
| US9804588B2 (en) | 2014-03-14 | 2017-10-31 | Fisher-Rosemount Systems, Inc. | Determining associations and alignments of process elements and measurements in a process |
| US9823626B2 (en) | 2014-10-06 | 2017-11-21 | Fisher-Rosemount Systems, Inc. | Regional big data in process control systems |
| WO2018080781A1 (en)* | 2016-10-26 | 2018-05-03 | SignifAI Inc. | Systems and methods for monitoring and analyzing computer and network activity |
| US20180267520A1 (en)* | 2014-12-05 | 2018-09-20 | Safran Aircraft Engines | Method for manufacturing parts based on simultaneous analysis of statistical indicators |
| US20180267519A1 (en)* | 2014-12-05 | 2018-09-20 | Safran Aircraft Engines | Method of manufacturing parts based on the analysis of centring coefficients |
| US10168691B2 (en) | 2014-10-06 | 2019-01-01 | Fisher-Rosemount Systems, Inc. | Data pipeline for process control system analytics |
| US10282676B2 (en) | 2014-10-06 | 2019-05-07 | Fisher-Rosemount Systems, Inc. | Automatic signal processing-based learning in a process plant |
| WO2019094729A1 (en)* | 2017-11-09 | 2019-05-16 | Strong Force Iot Portfolio 2016, Llc | Methods and systems for the industrial internet of things |
| US10338553B2 (en) | 2016-05-09 | 2019-07-02 | Strong Force Iot Portfolio 2016, Llc | Methods and systems for the industrial internet of things |
| US10386827B2 (en) | 2013-03-04 | 2019-08-20 | Fisher-Rosemount Systems, Inc. | Distributed industrial performance monitoring and analytics platform |
| US10387899B2 (en) | 2016-10-26 | 2019-08-20 | New Relic, Inc. | Systems and methods for monitoring and analyzing computer and network activity |
| US10503483B2 (en) | 2016-02-12 | 2019-12-10 | Fisher-Rosemount Systems, Inc. | Rule builder in a process control network |
| US20200073371A1 (en)* | 2017-03-22 | 2020-03-05 | Siemens Aktiengesellschaft | Universal data access across devices |
| US10649424B2 (en) | 2013-03-04 | 2020-05-12 | Fisher-Rosemount Systems, Inc. | Distributed industrial performance monitoring and analytics |
| US10649449B2 (en) | 2013-03-04 | 2020-05-12 | Fisher-Rosemount Systems, Inc. | Distributed industrial performance monitoring and analytics |
| US10678225B2 (en) | 2013-03-04 | 2020-06-09 | Fisher-Rosemount Systems, Inc. | Data analytic services for distributed industrial performance monitoring |
| US10678233B2 (en) | 2017-08-02 | 2020-06-09 | Strong Force Iot Portfolio 2016, Llc | Systems and methods for data collection and data sharing in an industrial environment |
| US10712738B2 (en) | 2016-05-09 | 2020-07-14 | Strong Force Iot Portfolio 2016, Llc | Methods and systems for industrial internet of things data collection for vibration sensitive equipment |
| US10866952B2 (en) | 2013-03-04 | 2020-12-15 | Fisher-Rosemount Systems, Inc. | Source-independent queries in distributed industrial system |
| US10909137B2 (en) | 2014-10-06 | 2021-02-02 | Fisher-Rosemount Systems, Inc. | Streaming data for analytics in process control systems |
| CN112580997A (en)* | 2020-12-24 | 2021-03-30 | 特劢丝软件科技(上海)有限公司 | Data collection method and system, SPC system and computer storage medium |
| US10983507B2 (en) | 2016-05-09 | 2021-04-20 | Strong Force Iot Portfolio 2016, Llc | Method for data collection and frequency analysis with self-organization functionality |
| US11199837B2 (en) | 2017-08-02 | 2021-12-14 | Strong Force Iot Portfolio 2016, Llc | Data monitoring systems and methods to update input channel routing in response to an alarm state |
| US11199835B2 (en) | 2016-05-09 | 2021-12-14 | Strong Force Iot Portfolio 2016, Llc | Method and system of a noise pattern data marketplace in an industrial environment |
| CN113868484A (en)* | 2021-08-30 | 2021-12-31 | 北京北方华创微电子装备有限公司 | Method, device and system for data acquisition of semiconductor process equipment |
| US20220019203A1 (en)* | 2020-07-16 | 2022-01-20 | Changxin Memory Technologies, Inc. | Method and device for processing semiconductor manufacturing information |
| US11237546B2 (en) | 2016-06-15 | 2022-02-01 | Strong Force loT Portfolio 2016, LLC | Method and system of modifying a data collection trajectory for vehicles |
| CN115078744A (en)* | 2022-04-27 | 2022-09-20 | 广州伊创科技股份有限公司 | Control method, system, medium and product of industrial process on-line analyzer |
| US11556871B2 (en) | 2016-10-26 | 2023-01-17 | New Relic, Inc. | Systems and methods for escalation policy activation |
| US11774944B2 (en) | 2016-05-09 | 2023-10-03 | Strong Force Iot Portfolio 2016, Llc | Methods and systems for the industrial internet of things |
| CN118633065A (en)* | 2022-03-15 | 2024-09-10 | 应用材料公司 | Communication nodes for interconnection between evaluation systems and manufacturing systems |
| US12276420B2 (en) | 2016-02-03 | 2025-04-15 | Strong Force Iot Portfolio 2016, Llc | Industrial internet of things smart heating systems and methods that produce and use hydrogen fuel |
| US12353181B2 (en) | 2019-01-13 | 2025-07-08 | Strong Force Iot Portfolio 2016, Llc | Systems for monitoring and managing industrial settings |
| US12353203B2 (en) | 2018-05-07 | 2025-07-08 | Strong Force Iot Portfolio 2016, Llc | Methods and systems for data collection, learning, and streaming of machine signals for analytics and maintenance using the industrial Internet of Things |
Citations (47)
| Publication number | Priority date | Publication date | Assignee | Title |
|---|---|---|---|---|
| US4590550A (en) | 1983-06-29 | 1986-05-20 | International Business Machines Corporation | Internally distributed monitoring system |
| US4967381A (en) | 1985-04-30 | 1990-10-30 | Prometrix Corporation | Process control interface system for managing measurement data |
| US5196997A (en) | 1991-01-22 | 1993-03-23 | International Business Machines Corporation | Method and apparatus for quality measure driven process control |
| US5225998A (en) | 1990-03-26 | 1993-07-06 | At&T Bell Laboratories | Quality control using multi-process performance analysis |
| US5586041A (en) | 1992-12-14 | 1996-12-17 | Ford Motor Company | Method and system for real-time statistical process monitoring |
| US5646870A (en) | 1995-02-13 | 1997-07-08 | Advanced Micro Devices, Inc. | Method for setting and adjusting process parameters to maintain acceptable critical dimensions across each die of mass-produced semiconductor wafers |
| US5654903A (en) | 1995-11-07 | 1997-08-05 | Lucent Technologies Inc. | Method and apparatus for real time monitoring of wafer attributes in a plasma etch process |
| US5715181A (en) | 1995-04-03 | 1998-02-03 | Horst; Robert L. | Isogrammetric analysis method for high-yield processes |
| US5719495A (en) | 1990-12-31 | 1998-02-17 | Texas Instruments Incorporated | Apparatus for semiconductor device fabrication diagnosis and prognosis |
| US5761064A (en) | 1995-10-06 | 1998-06-02 | Advanced Micro Devices, Inc. | Defect management system for productivity and yield improvement |
| US5790977A (en) | 1997-02-06 | 1998-08-04 | Hewlett-Packard Company | Data acquisition from a remote instrument via the internet |
| US5838595A (en)* | 1993-07-19 | 1998-11-17 | Texas Instruments, Inc. | Apparatus and method for model based process control |
| US5841676A (en) | 1996-11-04 | 1998-11-24 | General Electric Company | System and method for estimating a change point time in a manufacturing process |
| JPH1116797A (en) | 1997-06-20 | 1999-01-22 | Tokyo Electron Ltd | Control system |
| US5883437A (en) | 1994-12-28 | 1999-03-16 | Hitachi, Ltd. | Method and apparatus for inspection and correction of wiring of electronic circuit and for manufacture thereof |
| US5930138A (en) | 1995-08-22 | 1999-07-27 | Advanced Micro Devices, Inc. | Arrangement and method for detecting sequential processing effects in manufacturing using predetermined sequences within runs |
| US5964643A (en) | 1995-03-28 | 1999-10-12 | Applied Materials, Inc. | Apparatus and method for in-situ monitoring of chemical mechanical polishing operations |
| US5978071A (en) | 1993-01-07 | 1999-11-02 | Nikon Corporation | Projection exposure apparatus and method in which mask stage is moved to provide alignment with a moving wafer stage |
| US5991699A (en) | 1995-05-04 | 1999-11-23 | Kla Instruments Corporation | Detecting groups of defects in semiconductor feature space |
| US5995912A (en) | 1996-04-30 | 1999-11-30 | Imec Vzw | Database and method for measurement correction for cross-sectional carrier profiling techniques |
| US6027842A (en) | 1997-08-28 | 2000-02-22 | International Business Machines Corporation | Process for controlling etching parameters |
| US6055463A (en) | 1997-05-20 | 2000-04-25 | Samsung Electronics Co. Ltd. | Control system and method for semiconductor integrated circuit test process |
| US6163801A (en) | 1998-10-30 | 2000-12-19 | Advanced Micro Devices, Inc. | Dynamic communication between computer processes |
| US6240329B1 (en) | 1998-11-09 | 2001-05-29 | Chin-Yang Sun | Method and apparatus for a semiconductor wafer inspection system using a knowledge-based system |
| US6303395B1 (en) | 1999-06-01 | 2001-10-16 | Applied Materials, Inc. | Semiconductor processing techniques |
| US6370487B1 (en) | 1998-04-23 | 2002-04-09 | Micron Technology, Inc. | Remote semiconductor microscopy |
| US6370448B1 (en) | 1997-10-13 | 2002-04-09 | Rosemount Inc. | Communication technique for field devices in industrial processes |
| US20020065895A1 (en) | 2000-10-18 | 2002-05-30 | Peking University Teclick Cyberworks Co., Ltd. | Method for transferring electronic mail |
| US20020078018A1 (en) | 1999-05-24 | 2002-06-20 | Tse Eva Man-Yan | Method and apparatus for populating multiple data marts in a single aggregation process |
| US6424876B1 (en) | 1999-07-22 | 2002-07-23 | Advanced Micro Devices, Inc. | Statistical process control system with normalized control charting |
| US6430565B1 (en) | 1999-06-22 | 2002-08-06 | Microsoft Corporation | Path compression for records of multidimensional database |
| US20020116083A1 (en)* | 2000-10-17 | 2002-08-22 | Schulze Bradley D. | System and method for automated monitoring and assessment of fabrication facility |
| US6442560B1 (en) | 1999-06-22 | 2002-08-27 | Microsoft Corporation | Record for multidimensional databases |
| US6442445B1 (en)* | 1999-03-19 | 2002-08-27 | International Business Machines Corporation, | User configurable multivariate time series reduction tool control method |
| US6446059B1 (en) | 1999-06-22 | 2002-09-03 | Microsoft Corporation | Record for a multidimensional database with flexible paths |
| US6445969B1 (en) | 1997-01-27 | 2002-09-03 | Circuit Image Systems | Statistical process control integration systems and methods for monitoring manufacturing processes |
| US20020138168A1 (en) | 1998-10-19 | 2002-09-26 | Metso Automation Networks Oy | Method and apparatus for monitoring the operation of an industrial process |
| US6470227B1 (en) | 1997-12-02 | 2002-10-22 | Murali D. Rangachari | Method and apparatus for automating a microelectric manufacturing process |
| US20020156548A1 (en)* | 1999-07-29 | 2002-10-24 | Applied Materials, Inc. | Computer integrated manufacturing techniques |
| US6487472B1 (en) | 1998-04-28 | 2002-11-26 | Samsung Electronics Co., Ltd. | Semiconductor device manufacturing facility with a diagnosis system |
| US6499007B1 (en) | 1998-07-21 | 2002-12-24 | Canon Kabushiki Kaisha | Parameter editing method and semiconductor exposure system |
| US20030002634A1 (en) | 2001-06-29 | 2003-01-02 | Virad Gupta | Event notification in a unified message system using an event notification server |
| US20030028509A1 (en) | 2001-08-06 | 2003-02-06 | Adam Sah | Storage of row-column data |
| US6528219B1 (en) | 2000-07-27 | 2003-03-04 | International Business Machines Corporation | Dynamic alignment scheme for a photolithography system |
| US6532427B1 (en) | 2000-05-10 | 2003-03-11 | Texas Instruments Incorporated | Web-based mining of statistical data |
| US20030109951A1 (en) | 2000-03-10 | 2003-06-12 | Hsiung Chang-Meng B. | Monitoring system for an industrial process using one or more multidimensional variables |
| US6587744B1 (en)* | 1999-06-22 | 2003-07-01 | Brooks Automation, Inc. | Run-to-run controller for use in microelectronic fabrication |
- 2001
- 2001-07-12USUS09/905,220patent/US6970758B1/ennot_activeExpired - Fee Related
Patent Citations (47)
| Publication number | Priority date | Publication date | Assignee | Title |
|---|---|---|---|---|
| US4590550A (en) | 1983-06-29 | 1986-05-20 | International Business Machines Corporation | Internally distributed monitoring system |
| US4967381A (en) | 1985-04-30 | 1990-10-30 | Prometrix Corporation | Process control interface system for managing measurement data |
| US5225998A (en) | 1990-03-26 | 1993-07-06 | At&T Bell Laboratories | Quality control using multi-process performance analysis |
| US5719495A (en) | 1990-12-31 | 1998-02-17 | Texas Instruments Incorporated | Apparatus for semiconductor device fabrication diagnosis and prognosis |
| US5196997A (en) | 1991-01-22 | 1993-03-23 | International Business Machines Corporation | Method and apparatus for quality measure driven process control |
| US5586041A (en) | 1992-12-14 | 1996-12-17 | Ford Motor Company | Method and system for real-time statistical process monitoring |
| US5978071A (en) | 1993-01-07 | 1999-11-02 | Nikon Corporation | Projection exposure apparatus and method in which mask stage is moved to provide alignment with a moving wafer stage |
| US5838595A (en)* | 1993-07-19 | 1998-11-17 | Texas Instruments, Inc. | Apparatus and method for model based process control |
| US5883437A (en) | 1994-12-28 | 1999-03-16 | Hitachi, Ltd. | Method and apparatus for inspection and correction of wiring of electronic circuit and for manufacture thereof |
| US5646870A (en) | 1995-02-13 | 1997-07-08 | Advanced Micro Devices, Inc. | Method for setting and adjusting process parameters to maintain acceptable critical dimensions across each die of mass-produced semiconductor wafers |
| US5964643A (en) | 1995-03-28 | 1999-10-12 | Applied Materials, Inc. | Apparatus and method for in-situ monitoring of chemical mechanical polishing operations |
| US5715181A (en) | 1995-04-03 | 1998-02-03 | Horst; Robert L. | Isogrammetric analysis method for high-yield processes |
| US5991699A (en) | 1995-05-04 | 1999-11-23 | Kla Instruments Corporation | Detecting groups of defects in semiconductor feature space |
| US5930138A (en) | 1995-08-22 | 1999-07-27 | Advanced Micro Devices, Inc. | Arrangement and method for detecting sequential processing effects in manufacturing using predetermined sequences within runs |
| US5761064A (en) | 1995-10-06 | 1998-06-02 | Advanced Micro Devices, Inc. | Defect management system for productivity and yield improvement |
| US5654903A (en) | 1995-11-07 | 1997-08-05 | Lucent Technologies Inc. | Method and apparatus for real time monitoring of wafer attributes in a plasma etch process |
| US5995912A (en) | 1996-04-30 | 1999-11-30 | Imec Vzw | Database and method for measurement correction for cross-sectional carrier profiling techniques |
| US5841676A (en) | 1996-11-04 | 1998-11-24 | General Electric Company | System and method for estimating a change point time in a manufacturing process |
| US6445969B1 (en) | 1997-01-27 | 2002-09-03 | Circuit Image Systems | Statistical process control integration systems and methods for monitoring manufacturing processes |
| US5790977A (en) | 1997-02-06 | 1998-08-04 | Hewlett-Packard Company | Data acquisition from a remote instrument via the internet |
| US6055463A (en) | 1997-05-20 | 2000-04-25 | Samsung Electronics Co. Ltd. | Control system and method for semiconductor integrated circuit test process |
| JPH1116797A (en) | 1997-06-20 | 1999-01-22 | Tokyo Electron Ltd | Control system |
| US6027842A (en) | 1997-08-28 | 2000-02-22 | International Business Machines Corporation | Process for controlling etching parameters |
| US6370448B1 (en) | 1997-10-13 | 2002-04-09 | Rosemount Inc. | Communication technique for field devices in industrial processes |
| US6470227B1 (en) | 1997-12-02 | 2002-10-22 | Murali D. Rangachari | Method and apparatus for automating a microelectric manufacturing process |
| US6370487B1 (en) | 1998-04-23 | 2002-04-09 | Micron Technology, Inc. | Remote semiconductor microscopy |
| US6487472B1 (en) | 1998-04-28 | 2002-11-26 | Samsung Electronics Co., Ltd. | Semiconductor device manufacturing facility with a diagnosis system |
| US6499007B1 (en) | 1998-07-21 | 2002-12-24 | Canon Kabushiki Kaisha | Parameter editing method and semiconductor exposure system |
| US20020138168A1 (en) | 1998-10-19 | 2002-09-26 | Metso Automation Networks Oy | Method and apparatus for monitoring the operation of an industrial process |
| US6163801A (en) | 1998-10-30 | 2000-12-19 | Advanced Micro Devices, Inc. | Dynamic communication between computer processes |
| US6240329B1 (en) | 1998-11-09 | 2001-05-29 | Chin-Yang Sun | Method and apparatus for a semiconductor wafer inspection system using a knowledge-based system |
| US6442445B1 (en)* | 1999-03-19 | 2002-08-27 | International Business Machines Corporation, | User configurable multivariate time series reduction tool control method |
| US20020078018A1 (en) | 1999-05-24 | 2002-06-20 | Tse Eva Man-Yan | Method and apparatus for populating multiple data marts in a single aggregation process |
| US6303395B1 (en) | 1999-06-01 | 2001-10-16 | Applied Materials, Inc. | Semiconductor processing techniques |
| US6587744B1 (en)* | 1999-06-22 | 2003-07-01 | Brooks Automation, Inc. | Run-to-run controller for use in microelectronic fabrication |
| US6442560B1 (en) | 1999-06-22 | 2002-08-27 | Microsoft Corporation | Record for multidimensional databases |
| US6446059B1 (en) | 1999-06-22 | 2002-09-03 | Microsoft Corporation | Record for a multidimensional database with flexible paths |
| US6430565B1 (en) | 1999-06-22 | 2002-08-06 | Microsoft Corporation | Path compression for records of multidimensional database |
| US6424876B1 (en) | 1999-07-22 | 2002-07-23 | Advanced Micro Devices, Inc. | Statistical process control system with normalized control charting |
| US20020156548A1 (en)* | 1999-07-29 | 2002-10-24 | Applied Materials, Inc. | Computer integrated manufacturing techniques |
| US20030109951A1 (en) | 2000-03-10 | 2003-06-12 | Hsiung Chang-Meng B. | Monitoring system for an industrial process using one or more multidimensional variables |
| US6532427B1 (en) | 2000-05-10 | 2003-03-11 | Texas Instruments Incorporated | Web-based mining of statistical data |
| US6528219B1 (en) | 2000-07-27 | 2003-03-04 | International Business Machines Corporation | Dynamic alignment scheme for a photolithography system |
| US20020116083A1 (en)* | 2000-10-17 | 2002-08-22 | Schulze Bradley D. | System and method for automated monitoring and assessment of fabrication facility |
| US20020065895A1 (en) | 2000-10-18 | 2002-05-30 | Peking University Teclick Cyberworks Co., Ltd. | Method for transferring electronic mail |
| US20030002634A1 (en) | 2001-06-29 | 2003-01-02 | Virad Gupta | Event notification in a unified message system using an event notification server |
| US20030028509A1 (en) | 2001-08-06 | 2003-02-06 | Adam Sah | Storage of row-column data |
Non-Patent Citations (4)
| Title |
|---|
| RSView Machine Edition: Technical Data, Nov. 2000. |
| RSView32: Technical Data, May 15, 2000. |
| SECSHost: Expand Your View with SECS Communications, Oct. 20, 1999. |
| SPC: Expand Your View with Statistical Process Control, Mar. 15, 2000. |
Cited By (269)
| Publication number | Priority date | Publication date | Assignee | Title |
|---|---|---|---|---|
| US7200671B1 (en)* | 2000-08-23 | 2007-04-03 | Mks Instruments, Inc. | Method and apparatus for monitoring host to tool communications |
| US20060236142A1 (en)* | 2002-02-01 | 2006-10-19 | Xerox Corporation | Methods and systems for accessing email |
| US7921166B2 (en) | 2002-02-01 | 2011-04-05 | Xerox Corporation | Methods and systems for accessing email |
| US7953842B2 (en)* | 2003-02-19 | 2011-05-31 | Fisher-Rosemount Systems, Inc. | Open network-based data acquisition, aggregation and optimization for use with process control systems |
| US20040162887A1 (en)* | 2003-02-19 | 2004-08-19 | Steven Dillon | Open network-based data acquisition, aggregation and optimization for use with process control systems |
| US20050027481A1 (en)* | 2003-07-18 | 2005-02-03 | Samsung Electronics Co., Ltd. | System for making semiconductor devices and processing control thereof |
| US7693687B2 (en) | 2004-04-07 | 2010-04-06 | Mks Instruments, Inc. | Controller and method to mediate data collection from smart sensors for fab applications |
| US20070150235A1 (en)* | 2004-04-07 | 2007-06-28 | Mks Instruments, Inc. | Controller and Method to Mediate Data Collection from Smart Sensors for Fab Applications |
| US20050288810A1 (en)* | 2004-06-24 | 2005-12-29 | Mu-Tsang Lin | Automatic statistical process control (SPC) chart generation apparatus and method thereof |
| US7117058B2 (en)* | 2004-06-24 | 2006-10-03 | Taiwan Semiconductor Manufacturing Co., Ltd. | Automatic statistical process control (SPC) chart generation apparatus and method thereof |
| US20060064188A1 (en)* | 2004-09-03 | 2006-03-23 | Yukihiro Ushiku | Process-state management system, management server and control server adapted for the system, method for managing process-states, method for manufacturing a product, and computer program product for the management server |
| US7324855B2 (en)* | 2004-09-03 | 2008-01-29 | Kabushiki Kaisha Toshiba | Process-state management system, management server and control server adapted for the system, method for managing process-states, method for manufacturing a product, and computer program product for the management server |
| US7200824B1 (en)* | 2004-11-16 | 2007-04-03 | Altera Corporation | Performance/power mapping of a die |
| US7783372B2 (en) | 2005-02-28 | 2010-08-24 | Advanced Micro Devices, Inc. | Automated throughput control system and method of operating the same |
| US20060195212A1 (en)* | 2005-02-28 | 2006-08-31 | Gunnar Flach | Automated throughput control system and method of operating the same |
| US20090292385A1 (en)* | 2005-02-28 | 2009-11-26 | Advanced Micro Devices, Inc. | Automated throughput control system and method of operating the same |
| US20070008972A1 (en)* | 2005-07-11 | 2007-01-11 | Mks Instruments, Inc. | Address-transparent device and method |
| US7787477B2 (en) | 2005-07-11 | 2010-08-31 | Mks Instruments, Inc. | Address-transparent device and method |
| US7200523B1 (en)* | 2005-11-30 | 2007-04-03 | Taiwan Semiconductor Manufacturing Company, Ltd. | Method and system for filtering statistical process data to enhance process performance |
| US20070191980A1 (en)* | 2006-02-16 | 2007-08-16 | Powerchip Semiconductor Corp. | Method for managing tools using statistical process control |
| US20070198108A1 (en)* | 2006-02-23 | 2007-08-23 | Rockwell Automation Technologies, Inc. | Safety versus availability graphical user interface |
| US7539550B2 (en)* | 2006-02-23 | 2009-05-26 | Rockwell Automation Technologies, Inc. | Safety versus availability graphical user interface |
| US20070239305A1 (en)* | 2006-03-28 | 2007-10-11 | Haoren Zhuang | Process control systems and methods |
| US7610177B2 (en)* | 2006-10-27 | 2009-10-27 | Hewlett-Packard Development Company, L.P. | Manufacturing execution system, equipment interface and method of operating a manufacturing execution system |
| US20080103617A1 (en)* | 2006-10-27 | 2008-05-01 | Jayaraman Subramanian | Manufacturing execution system, equipment interface and method of operating a manufacturing execution system |
| US7876324B2 (en) | 2007-04-12 | 2011-01-25 | Promess, Inc. | Method and system for developing a strategy for use in a controller and storage medium for storing instructions which effectuate the method |
| US20080252643A1 (en)* | 2007-04-12 | 2008-10-16 | Promess, Inc. | Method and system for developing a strategy for use in a controller and storage medium for storing instructions which effectuate the method |
| US20090055126A1 (en)* | 2007-08-23 | 2009-02-26 | Aleksey Yanovich | Virtual sensors |
| US20090055692A1 (en)* | 2007-08-23 | 2009-02-26 | Natalia Kroupnova | Method and apparatus to automatically create virtual sensors with templates |
| US10409272B2 (en) | 2007-08-23 | 2019-09-10 | Applied Materials, Inc. | Method and apparatus to automatically create virtual sensors with templates |
| US8812261B2 (en) | 2007-08-23 | 2014-08-19 | Applied Materials, Inc. | Method and apparatus to automatically create virtual sensors with templates |
| US8572155B2 (en)* | 2007-08-23 | 2013-10-29 | Applied Materials, Inc. | Virtual sensors |
| US20090089247A1 (en)* | 2007-09-28 | 2009-04-02 | Terrence Lynn Blevins | Methods and apparatus to standardize data properties in a process control environment |
| EP2490161A1 (en)* | 2007-09-28 | 2012-08-22 | Fisher-Rosemount Systems, Inc. | Methods and apparatus to standardize data properties in a process control environment |
| EP2098983A1 (en)* | 2007-09-28 | 2009-09-09 | Fisher-Rosemount Systems, Inc. Emerson Process Management | Methods and apparatus to standardize data properties in a process control environment |
| GB2453426A (en)* | 2007-09-28 | 2009-04-08 | Fisher Rosemount Systems Inc | Standardized data properties in a process control environment |
| GB2453426B (en)* | 2007-09-28 | 2013-05-01 | Fisher Rosemount Systems Inc | Methods and apparatus to standardize data properties in a process control environment |
| US8301274B2 (en)* | 2009-04-20 | 2012-10-30 | Siemens Aktiengesellschaft | Method for managing product segments of product production rules |
| US20100268365A1 (en)* | 2009-04-20 | 2010-10-21 | Siemens Aktiengesellschaft | Method for managing product segments of product production rules |
| US20110077765A1 (en)* | 2009-09-28 | 2011-03-31 | International Business Machines Corporation | Tool commonality and stratification analysis to enhance a production process |
| US8234001B2 (en) | 2009-09-28 | 2012-07-31 | International Business Machines Corporation | Tool commonality and stratification analysis to enhance a production process |
| US8655469B2 (en)* | 2010-06-14 | 2014-02-18 | Kla-Tencor Corporation | Advanced process control optimization |
| US20120022679A1 (en)* | 2010-06-14 | 2012-01-26 | Kla-Tencor Corporation | Advanced process control optimization |
| US8200528B2 (en)* | 2010-08-02 | 2012-06-12 | National Tsing Hua University | Factor analysis system and analysis method thereof |
| US20120029957A1 (en)* | 2010-08-02 | 2012-02-02 | National Tsing Hua University | Factor analysis system and analysis method thereof |
| US20130110263A1 (en)* | 2011-10-31 | 2013-05-02 | Applied Materials, Inc. | Bi-directional association and graphical acquisition of time-based equipment sensor data and material-based metrology statistical process control data |
| US9915940B2 (en)* | 2011-10-31 | 2018-03-13 | Applied Materials, Llc | Bi-directional association and graphical acquisition of time-based equipment sensor data and material-based metrology statistical process control data |
| US9727045B2 (en)* | 2012-12-31 | 2017-08-08 | Sunedison Semiconductor Limited (Uen201334164H) | Method and system for a meta-recipe control software architecture |
| US20140188269A1 (en)* | 2012-12-31 | 2014-07-03 | Sunedison, Inc. | Method and system for a meta-recipe control software architecture |
| US10678225B2 (en) | 2013-03-04 | 2020-06-09 | Fisher-Rosemount Systems, Inc. | Data analytic services for distributed industrial performance monitoring |
| US10649449B2 (en) | 2013-03-04 | 2020-05-12 | Fisher-Rosemount Systems, Inc. | Distributed industrial performance monitoring and analytics |
| US11385608B2 (en) | 2013-03-04 | 2022-07-12 | Fisher-Rosemount Systems, Inc. | Big data in process control systems |
| US9558220B2 (en) | 2013-03-04 | 2017-01-31 | Fisher-Rosemount Systems, Inc. | Big data in process control systems |
| US10866952B2 (en) | 2013-03-04 | 2020-12-15 | Fisher-Rosemount Systems, Inc. | Source-independent queries in distributed industrial system |
| US10386827B2 (en) | 2013-03-04 | 2019-08-20 | Fisher-Rosemount Systems, Inc. | Distributed industrial performance monitoring and analytics platform |
| US10649424B2 (en) | 2013-03-04 | 2020-05-12 | Fisher-Rosemount Systems, Inc. | Distributed industrial performance monitoring and analytics |
| US9697170B2 (en) | 2013-03-14 | 2017-07-04 | Fisher-Rosemount Systems, Inc. | Collecting and delivering data to a big data machine in a process control system |
| US10311015B2 (en) | 2013-03-14 | 2019-06-04 | Fisher-Rosemount Systems, Inc. | Distributed big data in a process control system |
| US10223327B2 (en) | 2013-03-14 | 2019-03-05 | Fisher-Rosemount Systems, Inc. | Collecting and delivering data to a big data machine in a process control system |
| US10037303B2 (en) | 2013-03-14 | 2018-07-31 | Fisher-Rosemount Systems, Inc. | Collecting and delivering data to a big data machine in a process control system |
| US11169651B2 (en) | 2013-03-15 | 2021-11-09 | Fisher-Rosemount Systems, Inc. | Method and apparatus for controlling a process plant with location aware mobile devices |
| US9778626B2 (en) | 2013-03-15 | 2017-10-03 | Fisher-Rosemount Systems, Inc. | Mobile control room with real-time environment awareness |
| US10031490B2 (en) | 2013-03-15 | 2018-07-24 | Fisher-Rosemount Systems, Inc. | Mobile analysis of physical phenomena in a process plant |
| US9541905B2 (en) | 2013-03-15 | 2017-01-10 | Fisher-Rosemount Systems, Inc. | Context sensitive mobile control in a process plant |
| US11112925B2 (en) | 2013-03-15 | 2021-09-07 | Fisher-Rosemount Systems, Inc. | Supervisor engine for process control |
| US10671028B2 (en) | 2013-03-15 | 2020-06-02 | Fisher-Rosemount Systems, Inc. | Method and apparatus for managing a work flow in a process plant |
| US10133243B2 (en) | 2013-03-15 | 2018-11-20 | Fisher-Rosemount Systems, Inc. | Method and apparatus for seamless state transfer between user interface devices in a mobile control room |
| US10152031B2 (en) | 2013-03-15 | 2018-12-11 | Fisher-Rosemount Systems, Inc. | Generating checklists in a process control environment |
| US10649413B2 (en) | 2013-03-15 | 2020-05-12 | Fisher-Rosemount Systems, Inc. | Method for initiating or resuming a mobile control session in a process plant |
| US10031489B2 (en) | 2013-03-15 | 2018-07-24 | Fisher-Rosemount Systems, Inc. | Method and apparatus for seamless state transfer between user interface devices in a mobile control room |
| US10551799B2 (en) | 2013-03-15 | 2020-02-04 | Fisher-Rosemount Systems, Inc. | Method and apparatus for determining the position of a mobile control device in a process plant |
| US10691281B2 (en) | 2013-03-15 | 2020-06-23 | Fisher-Rosemount Systems, Inc. | Method and apparatus for controlling a process plant with location aware mobile control devices |
| US10296668B2 (en) | 2013-03-15 | 2019-05-21 | Fisher-Rosemount Systems, Inc. | Data modeling studio |
| US10649412B2 (en) | 2013-03-15 | 2020-05-12 | Fisher-Rosemount Systems, Inc. | Method and apparatus for seamless state transfer between user interface devices in a mobile control room |
| US10324423B2 (en) | 2013-03-15 | 2019-06-18 | Fisher-Rosemount Systems, Inc. | Method and apparatus for controlling a process plant with location aware mobile control devices |
| US11573672B2 (en) | 2013-03-15 | 2023-02-07 | Fisher-Rosemount Systems, Inc. | Method for initiating or resuming a mobile control session in a process plant |
| US9740802B2 (en) | 2013-03-15 | 2017-08-22 | Fisher-Rosemount Systems, Inc. | Data modeling studio |
| US9678484B2 (en) | 2013-03-15 | 2017-06-13 | Fisher-Rosemount Systems, Inc. | Method and apparatus for seamless state transfer between user interface devices in a mobile control room |
| US10656627B2 (en) | 2014-01-31 | 2020-05-19 | Fisher-Rosemount Systems, Inc. | Managing big data in process control systems |
| US9665088B2 (en) | 2014-01-31 | 2017-05-30 | Fisher-Rosemount Systems, Inc. | Managing big data in process control systems |
| US9804588B2 (en) | 2014-03-14 | 2017-10-31 | Fisher-Rosemount Systems, Inc. | Determining associations and alignments of process elements and measurements in a process |
| US9397836B2 (en) | 2014-08-11 | 2016-07-19 | Fisher-Rosemount Systems, Inc. | Securing devices to process control systems |
| US9772623B2 (en) | 2014-08-11 | 2017-09-26 | Fisher-Rosemount Systems, Inc. | Securing devices to process control systems |
| US10909137B2 (en) | 2014-10-06 | 2021-02-02 | Fisher-Rosemount Systems, Inc. | Streaming data for analytics in process control systems |
| US10282676B2 (en) | 2014-10-06 | 2019-05-07 | Fisher-Rosemount Systems, Inc. | Automatic signal processing-based learning in a process plant |
| US10168691B2 (en) | 2014-10-06 | 2019-01-01 | Fisher-Rosemount Systems, Inc. | Data pipeline for process control system analytics |
| US9823626B2 (en) | 2014-10-06 | 2017-11-21 | Fisher-Rosemount Systems, Inc. | Regional big data in process control systems |
| US20180267519A1 (en)* | 2014-12-05 | 2018-09-20 | Safran Aircraft Engines | Method of manufacturing parts based on the analysis of centring coefficients |
| US20180267520A1 (en)* | 2014-12-05 | 2018-09-20 | Safran Aircraft Engines | Method for manufacturing parts based on simultaneous analysis of statistical indicators |
| US11569138B2 (en)* | 2015-06-16 | 2023-01-31 | Kla Corporation | System and method for monitoring parameters of a semiconductor factory automation system |
| US20160370797A1 (en)* | 2015-06-16 | 2016-12-22 | Kla-Tencor Corporation | System and Method for Monitoring Parameters of a Semiconductor Factory Automation System |
| US11886155B2 (en) | 2015-10-09 | 2024-01-30 | Fisher-Rosemount Systems, Inc. | Distributed industrial performance monitoring and analytics |
| US12276420B2 (en) | 2016-02-03 | 2025-04-15 | Strong Force Iot Portfolio 2016, Llc | Industrial internet of things smart heating systems and methods that produce and use hydrogen fuel |
| US10503483B2 (en) | 2016-02-12 | 2019-12-10 | Fisher-Rosemount Systems, Inc. | Rule builder in a process control network |
| US11347205B2 (en) | 2016-05-09 | 2022-05-31 | Strong Force Iot Portfolio 2016, Llc | Methods and systems for network-sensitive data collection and process assessment in an industrial environment |
| US10359751B2 (en) | 2016-05-09 | 2019-07-23 | Strong Force Iot Portfolio 2016, Llc | Methods and systems for the industrial internet of things |
| US10437218B2 (en) | 2016-05-09 | 2019-10-08 | Strong Force Iot Portfolio 2016, Llc | Methods and systems for the industrial internet of things |
| US10481572B2 (en) | 2016-05-09 | 2019-11-19 | Strong Force Iot Portfolio 2016, Llc | Methods and systems for the industrial internet of things |
| US10488836B2 (en) | 2016-05-09 | 2019-11-26 | Strong Force Iot Portfolio 2016, Llc | Methods and systems for the industrial internet of things |
| US10416632B2 (en) | 2016-05-09 | 2019-09-17 | Strong Force Iot Portfolio 2016, Llc | Methods and systems for the industrial internet of things |
| US10528018B2 (en) | 2016-05-09 | 2020-01-07 | Strong Force Iot Portfolio 2016, Llc | Methods and systems for the industrial internet of things |
| US10539940B2 (en) | 2016-05-09 | 2020-01-21 | Strong Force Iot Portfolio 2016, Llc | Methods and systems for the industrial internet of things |
| US10545474B2 (en) | 2016-05-09 | 2020-01-28 | Strong Force Iot Portfolio 2016, Llc | Methods and systems for the industrial internet of things |
| US10545472B2 (en) | 2016-05-09 | 2020-01-28 | Strong Force Iot Portfolio 2016, Llc | Methods and systems for the industrial Internet of Things |
| US10416638B2 (en) | 2016-05-09 | 2019-09-17 | Strong Force Iot Portfolio 2016, Llc | Methods and systems for the industrial internet of things |
| US10551811B2 (en) | 2016-05-09 | 2020-02-04 | Strong Force Iot Portfolio 2016, Llc | Methods and systems for the industrial internet of things |
| US10551812B2 (en) | 2016-05-09 | 2020-02-04 | Strong Force Iot Portfolio 2016, Llc | Methods and systems for the industrial internet of things |
| US10558187B2 (en) | 2016-05-09 | 2020-02-11 | Strong Force Iot Portfolio 2016, Llc | Methods and systems for the industrial internet of things |
| US10571881B2 (en) | 2016-05-09 | 2020-02-25 | Strong Force Iot Portfolio 2016, Llc | Methods and systems for the industrial internet of things |
| US11770196B2 (en) | 2016-05-09 | 2023-09-26 | Strong Force TX Portfolio 2018, LLC | Systems and methods for removing background noise in an industrial pump environment |
| US10627795B2 (en) | 2016-05-09 | 2020-04-21 | Strong Force Iot Portfolio 2016, Llc | Methods and systems for the industrial internet of things |
| US10416635B2 (en) | 2016-05-09 | 2019-09-17 | Strong Force Iot Portfolio 2016, Llc | Methods and systems for the industrial internet of things |
| US10416639B2 (en) | 2016-05-09 | 2019-09-17 | Strong Force Iot Portfolio 2016, Llc | Methods and systems for the industrial internet of things |
| US10416637B2 (en) | 2016-05-09 | 2019-09-17 | Strong Force Iot Portfolio 2016, Llc | Methods and systems for the industrial internet of things |
| US10416636B2 (en) | 2016-05-09 | 2019-09-17 | Strong Force Iot Portfolio 2016, Llc | Methods and systems for the industrial internet of things |
| US10416633B2 (en) | 2016-05-09 | 2019-09-17 | Strong Force Iot Portfolio 2016, Llc | Methods and systems for the industrial internet of things |
| US10409246B2 (en) | 2016-05-09 | 2019-09-10 | Strong Force Iot Portfolio 2016, Llc | Methods and systems for the industrial internet of things |
| US10409245B2 (en) | 2016-05-09 | 2019-09-10 | Strong Force Iot Portfolio 2016, Llc | Methods and systems for the industrial internet of things |
| US12372946B2 (en) | 2016-05-09 | 2025-07-29 | Strong Force Iot Portfolio 2016, Llc | Systems and methods for enabling user acceptance of a smart band data collection template for data collection in an industrial environment |
| US10409247B2 (en) | 2016-05-09 | 2019-09-10 | Strong Force Iot Portfolio 2016, Llc | Methods and systems for the industrial internet of things |
| US10712738B2 (en) | 2016-05-09 | 2020-07-14 | Strong Force Iot Portfolio 2016, Llc | Methods and systems for industrial internet of things data collection for vibration sensitive equipment |
| US10732621B2 (en) | 2016-05-09 | 2020-08-04 | Strong Force Iot Portfolio 2016, Llc | Methods and systems for process adaptation in an internet of things downstream oil and gas environment |
| US10739743B2 (en) | 2016-05-09 | 2020-08-11 | Strong Force Iot Portfolio 2016, Llc | Methods and systems for the industrial internet of things |
| US10754334B2 (en) | 2016-05-09 | 2020-08-25 | Strong Force Iot Portfolio 2016, Llc | Methods and systems for industrial internet of things data collection for process adjustment in an upstream oil and gas environment |
| US10775758B2 (en) | 2016-05-09 | 2020-09-15 | Strong Force Iot Portfolio 2016, Llc | Methods and systems for the industrial internet of things |
| US10775757B2 (en) | 2016-05-09 | 2020-09-15 | Strong Force Iot Portfolio 2016, Llc | Methods and systems for the industrial internet of things |
| US12333401B2 (en) | 2016-05-09 | 2025-06-17 | Strong Force Iot Portfolio 2016, Llc | Systems for self-organizing data collection and storage in a power generation environment |
| US12333403B2 (en) | 2016-05-09 | 2025-06-17 | Strong Force IoT Portfolio2016, LLC | Systems for self-organizing data collection in an industrial environment |
| US10394210B2 (en) | 2016-05-09 | 2019-08-27 | Strong Force Iot Portfolio 2016, Llc | Methods and systems for the industrial internet of things |
| US10866584B2 (en) | 2016-05-09 | 2020-12-15 | Strong Force Iot Portfolio 2016, Llc | Methods and systems for data processing in an industrial internet of things data collection environment with large data sets |
| US10877449B2 (en) | 2016-05-09 | 2020-12-29 | Strong Force Iot Portfolio 2016, Llc | Methods and systems for the industrial internet of things |
| US12333402B2 (en) | 2016-05-09 | 2025-06-17 | Strong Force Iot Portfolio 2016, Llc | Systems for self-organizing data collection and storage in a manufacturing environment |
| US11755878B2 (en) | 2016-05-09 | 2023-09-12 | Strong Force Iot Portfolio 2016, Llc | Methods and systems of diagnosing machine components using analog sensor data and neural network |
| US12327168B2 (en) | 2016-05-09 | 2025-06-10 | Strong Force Iot Portfolio 2016, Llc | Systems for self-organizing data collection and storage in a refining environment |
| US12282837B2 (en) | 2016-05-09 | 2025-04-22 | Strong Force Iot Portfolio 2016, Llc | Systems and methods for processing data collected in an industrial environment using neural networks |
| US10983507B2 (en) | 2016-05-09 | 2021-04-20 | Strong Force Iot Portfolio 2016, Llc | Method for data collection and frequency analysis with self-organization functionality |
| US10983514B2 (en) | 2016-05-09 | 2021-04-20 | Strong Force Iot Portfolio 2016, Llc | Methods and systems for equipment monitoring in an Internet of Things mining environment |
| US11003179B2 (en) | 2016-05-09 | 2021-05-11 | Strong Force Iot Portfolio 2016, Llc | Methods and systems for a data marketplace in an industrial internet of things environment |
| US11009865B2 (en) | 2016-05-09 | 2021-05-18 | Strong Force Iot Portfolio 2016, Llc | Methods and systems for a noise pattern data marketplace in an industrial internet of things environment |
| US11029680B2 (en) | 2016-05-09 | 2021-06-08 | Strong Force Iot Portfolio 2016, Llc | Methods and systems for detection in an industrial internet of things data collection environment with frequency band adjustments for diagnosing oil and gas production equipment |
| US11728910B2 (en) | 2016-05-09 | 2023-08-15 | Strong Force Iot Portfolio 2016, Llc | Methods and systems for detection in an industrial internet of things data collection environment with expert systems to predict failures and system state for slow rotating components |
| US11048248B2 (en) | 2016-05-09 | 2021-06-29 | Strong Force Iot Portfolio 2016, Llc | Methods and systems for industrial internet of things data collection in a network sensitive mining environment |
| US11054817B2 (en) | 2016-05-09 | 2021-07-06 | Strong Force Iot Portfolio 2016, Llc | Methods and systems for data collection and intelligent process adjustment in an industrial environment |
| US11067959B2 (en) | 2016-05-09 | 2021-07-20 | Strong Force Iot Portfolio 2016, Llc | Methods and systems for the industrial internet of things |
| US12259711B2 (en) | 2016-05-09 | 2025-03-25 | Strong Force Iot Portfolio 2016, Llc | Methods and systems for the industrial internet of things |
| US11073826B2 (en) | 2016-05-09 | 2021-07-27 | Strong Force Iot Portfolio 2016, Llc | Systems and methods for data collection providing a haptic user interface |
| US12244359B2 (en) | 2016-05-09 | 2025-03-04 | Strong Force Iot Portfolio 2016, Llc | Systems and methods for monitoring pumps and fans |
| US11086311B2 (en) | 2016-05-09 | 2021-08-10 | Strong Force Iot Portfolio 2016, Llc | Systems and methods for data collection having intelligent data collection bands |
| US11092955B2 (en) | 2016-05-09 | 2021-08-17 | Strong Force Iot Portfolio 2016, Llc | Systems and methods for data collection utilizing relative phase detection |
| US11106199B2 (en) | 2016-05-09 | 2021-08-31 | Strong Force Iot Portfolio 2016, Llc | Systems, methods and apparatus for providing a reduced dimensionality view of data collected on a self-organizing network |
| US11106188B2 (en) | 2016-05-09 | 2021-08-31 | Strong Force Iot Portfolio 2016, Llc | Methods and systems for the industrial internet of things |
| US11112784B2 (en) | 2016-05-09 | 2021-09-07 | Strong Force Iot Portfolio 2016, Llc | Methods and systems for communications in an industrial internet of things data collection environment with large data sets |
| US10365625B2 (en) | 2016-05-09 | 2019-07-30 | Strong Force Iot Portfolio 2016, Llc | Methods and systems for the industrial internet of things |
| US11112785B2 (en) | 2016-05-09 | 2021-09-07 | Strong Force Iot Portfolio 2016, Llc | Systems and methods for data collection and signal conditioning in an industrial environment |
| US11119473B2 (en) | 2016-05-09 | 2021-09-14 | Strong Force Iot Portfolio 2016, Llc | Systems and methods for data collection and processing with IP front-end signal conditioning |
| US12237873B2 (en) | 2016-05-09 | 2025-02-25 | Strong Force Iot Portfolio 2016, Llc | Systems and methods for balancing remote oil and gas equipment |
| US11126153B2 (en) | 2016-05-09 | 2021-09-21 | Strong Force Iot Portfolio 2016, Llc | Methods and systems for the industrial internet of things |
| US11126171B2 (en) | 2016-05-09 | 2021-09-21 | Strong Force Iot Portfolio 2016, Llc | Methods and systems of diagnosing machine components using neural networks and having bandwidth allocation |
| US12191926B2 (en) | 2016-05-09 | 2025-01-07 | Strong Force Iot Portfolio 2016, Llc | Methods and systems for detection in an industrial internet of things data collection environment with noise detection and system response for vibrating components |
| US11137752B2 (en) | 2016-05-09 | 2021-10-05 | Strong Force loT Portfolio 2016, LLC | Systems, methods and apparatus for data collection and storage according to a data storage profile |
| US12140930B2 (en) | 2016-05-09 | 2024-11-12 | Strong Force Iot Portfolio 2016, Llc | Method for determining service event of machine from sensor data |
| US11144025B2 (en) | 2016-05-09 | 2021-10-12 | Strong Force Iot Portfolio 2016, Llc | Methods and systems for the industrial internet of things |
| US11150621B2 (en) | 2016-05-09 | 2021-10-19 | Strong Force Iot Portfolio 2016, Llc | Methods and systems for the industrial internet of things |
| US11156998B2 (en) | 2016-05-09 | 2021-10-26 | Strong Force Iot Portfolio 2016, Llc | Methods and systems for process adjustments in an internet of things chemical production process |
| US11163282B2 (en) | 2016-05-09 | 2021-11-02 | Strong Force Iot Portfolio 2016, Llc | Methods and systems for the industrial internet of things |
| US11163283B2 (en) | 2016-05-09 | 2021-11-02 | Strong Force Iot Portfolio 2016, Llc | Methods and systems for the industrial internet of things |
| US11169497B2 (en) | 2016-05-09 | 2021-11-09 | Strong Force Iot Portfolio 2016, Llc | Methods and systems for the industrial internet of things |
| US11774944B2 (en) | 2016-05-09 | 2023-10-03 | Strong Force Iot Portfolio 2016, Llc | Methods and systems for the industrial internet of things |
| US11169496B2 (en) | 2016-05-09 | 2021-11-09 | Strong Force Iot Portfolio 2016, Llc | Methods and systems for the industrial internet of things |
| US11169511B2 (en) | 2016-05-09 | 2021-11-09 | Strong Force Iot Portfolio 2016, Llc | Methods and systems for network-sensitive data collection and intelligent process adjustment in an industrial environment |
| US12099911B2 (en) | 2016-05-09 | 2024-09-24 | Strong Force loT Portfolio 2016, LLC | Systems and methods for learning data patterns predictive of an outcome |
| US11175642B2 (en) | 2016-05-09 | 2021-11-16 | Strong Force Iot Portfolio 2016, Llc | Methods and systems for the industrial internet of things |
| US11181893B2 (en) | 2016-05-09 | 2021-11-23 | Strong Force Iot Portfolio 2016, Llc | Systems and methods for data communication over a plurality of data paths |
| US11194319B2 (en) | 2016-05-09 | 2021-12-07 | Strong Force Iot Portfolio 2016, Llc | Systems and methods for data collection in a vehicle steering system utilizing relative phase detection |
| US11194318B2 (en) | 2016-05-09 | 2021-12-07 | Strong Force Iot Portfolio 2016, Llc | Systems and methods utilizing noise analysis to determine conveyor performance |
| US12079701B2 (en) | 2016-05-09 | 2024-09-03 | Strong Force Iot Portfolio 2016, Llc | System, methods and apparatus for modifying a data collection trajectory for conveyors |
| US11199835B2 (en) | 2016-05-09 | 2021-12-14 | Strong Force Iot Portfolio 2016, Llc | Method and system of a noise pattern data marketplace in an industrial environment |
| US12039426B2 (en) | 2016-05-09 | 2024-07-16 | Strong Force Iot Portfolio 2016, Llc | Methods for self-organizing data collection, distribution and storage in a distribution environment |
| US11996900B2 (en) | 2016-05-09 | 2024-05-28 | Strong Force Iot Portfolio 2016, Llc | Systems and methods for processing data collected in an industrial environment using neural networks |
| US11215980B2 (en) | 2016-05-09 | 2022-01-04 | Strong Force Iot Portfolio 2016, Llc | Systems and methods utilizing routing schemes to optimize data collection |
| US11221613B2 (en) | 2016-05-09 | 2022-01-11 | Strong Force Iot Portfolio 2016, Llc | Methods and systems for noise detection and removal in a motor |
| US11836571B2 (en) | 2016-05-09 | 2023-12-05 | Strong Force Iot Portfolio 2016, Llc | Systems and methods for enabling user selection of components for data collection in an industrial environment |
| US10416634B2 (en) | 2016-05-09 | 2019-09-17 | Strong Force Iot Portfolio 2016, Llc | Methods and systems for the industrial internet of things |
| US11663442B2 (en) | 2016-05-09 | 2023-05-30 | Strong Force Iot Portfolio 2016, Llc | Methods and systems for detection in an industrial Internet of Things data collection environment with intelligent data management for industrial processes including sensors |
| US11243528B2 (en) | 2016-05-09 | 2022-02-08 | Strong Force Iot Portfolio 2016, Llc | Systems and methods for data collection utilizing adaptive scheduling of a multiplexer |
| US11243521B2 (en) | 2016-05-09 | 2022-02-08 | Strong Force Iot Portfolio 2016, Llc | Methods and systems for data collection in an industrial environment with haptic feedback and data communication and bandwidth control |
| US11243522B2 (en) | 2016-05-09 | 2022-02-08 | Strong Force Iot Portfolio 2016, Llc | Methods and systems for detection in an industrial Internet of Things data collection environment with intelligent data collection and equipment package adjustment for a production line |
| US11256243B2 (en) | 2016-05-09 | 2022-02-22 | Strong Force loT Portfolio 2016, LLC | Methods and systems for detection in an industrial Internet of Things data collection environment with intelligent data collection and equipment package adjustment for fluid conveyance equipment |
| US11256242B2 (en) | 2016-05-09 | 2022-02-22 | Strong Force Iot Portfolio 2016, Llc | Methods and systems of chemical or pharmaceutical production line with self organizing data collectors and neural networks |
| US11262737B2 (en) | 2016-05-09 | 2022-03-01 | Strong Force Iot Portfolio 2016, Llc | Systems and methods for monitoring a vehicle steering system |
| US11269319B2 (en) | 2016-05-09 | 2022-03-08 | Strong Force Iot Portfolio 2016, Llc | Methods for determining candidate sources of data collection |
| US11269318B2 (en) | 2016-05-09 | 2022-03-08 | Strong Force Iot Portfolio 2016, Llc | Systems, apparatus and methods for data collection utilizing an adaptively controlled analog crosspoint switch |
| US11281202B2 (en) | 2016-05-09 | 2022-03-22 | Strong Force Iot Portfolio 2016, Llc | Method and system of modifying a data collection trajectory for bearings |
| US11307565B2 (en) | 2016-05-09 | 2022-04-19 | Strong Force Iot Portfolio 2016, Llc | Method and system of a noise pattern data marketplace for motors |
| US11327475B2 (en) | 2016-05-09 | 2022-05-10 | Strong Force Iot Portfolio 2016, Llc | Methods and systems for intelligent collection and analysis of vehicle data |
| US11327455B2 (en) | 2016-05-09 | 2022-05-10 | Strong Force Iot Portfolio 2016, Llc | Methods and systems for the industrial Internet of Things |
| US11334063B2 (en) | 2016-05-09 | 2022-05-17 | Strong Force Iot Portfolio 2016, Llc | Systems and methods for policy automation for a data collection system |
| US11340573B2 (en) | 2016-05-09 | 2022-05-24 | Strong Force Iot Portfolio 2016, Llc | Methods and systems for the industrial internet of things |
| US11340589B2 (en) | 2016-05-09 | 2022-05-24 | Strong Force Iot Portfolio 2016, Llc | Methods and systems for detection in an industrial Internet of Things data collection environment with expert systems diagnostics and process adjustments for vibrating components |
| US11347206B2 (en) | 2016-05-09 | 2022-05-31 | Strong Force Iot Portfolio 2016, Llc | Methods and systems for data collection in a chemical or pharmaceutical production process with haptic feedback and control of data communication |
| US11347215B2 (en) | 2016-05-09 | 2022-05-31 | Strong Force Iot Portfolio 2016, Llc | Methods and systems for detection in an industrial internet of things data collection environment with intelligent management of data selection in high data volume data streams |
| US10345777B2 (en) | 2016-05-09 | 2019-07-09 | Strong Force Iot Portfolio 2016, Llc | Methods and systems for the industrial internet of things |
| US11353851B2 (en) | 2016-05-09 | 2022-06-07 | Strong Force Iot Portfolio 2016, Llc | Systems and methods of data collection monitoring utilizing a peak detection circuit |
| US11353850B2 (en) | 2016-05-09 | 2022-06-07 | Strong Force Iot Portfolio 2016, Llc | Systems and methods for data collection and signal evaluation to determine sensor status |
| US11353852B2 (en) | 2016-05-09 | 2022-06-07 | Strong Force Iot Portfolio 2016, Llc | Method and system of modifying a data collection trajectory for pumps and fans |
| US11360459B2 (en) | 2016-05-09 | 2022-06-14 | Strong Force Iot Portfolio 2016, Llc | Method and system for adjusting an operating parameter in a marginal network |
| US11366456B2 (en) | 2016-05-09 | 2022-06-21 | Strong Force Iot Portfolio 2016, Llc | Methods and systems for detection in an industrial internet of things data collection environment with intelligent data management for industrial processes including analog sensors |
| US11366455B2 (en) | 2016-05-09 | 2022-06-21 | Strong Force Iot Portfolio 2016, Llc | Methods and systems for optimization of data collection and storage using 3rd party data from a data marketplace in an industrial internet of things environment |
| US11372394B2 (en) | 2016-05-09 | 2022-06-28 | Strong Force Iot Portfolio 2016, Llc | Methods and systems for detection in an industrial internet of things data collection environment with self-organizing expert system detection for complex industrial, chemical process |
| US11372395B2 (en) | 2016-05-09 | 2022-06-28 | Strong Force Iot Portfolio 2016, Llc | Methods and systems for detection in an industrial Internet of Things data collection environment with expert systems diagnostics for vibrating components |
| US11378938B2 (en) | 2016-05-09 | 2022-07-05 | Strong Force Iot Portfolio 2016, Llc | System, method, and apparatus for changing a sensed parameter group for a pump or fan |
| US11385623B2 (en) | 2016-05-09 | 2022-07-12 | Strong Force Iot Portfolio 2016, Llc | Systems and methods of data collection and analysis of data from a plurality of monitoring devices |
| US11385622B2 (en) | 2016-05-09 | 2022-07-12 | Strong Force Iot Portfolio 2016, Llc | Systems and methods for characterizing an industrial system |
| US10338555B2 (en) | 2016-05-09 | 2019-07-02 | Strong Force Iot Portfolio 2016, Llc | Methods and systems for the industrial internet of things |
| US11392111B2 (en) | 2016-05-09 | 2022-07-19 | Strong Force Iot Portfolio 2016, Llc | Methods and systems for intelligent data collection for a production line |
| US11392109B2 (en) | 2016-05-09 | 2022-07-19 | Strong Force Iot Portfolio 2016, Llc | Methods and systems for data collection in an industrial refining environment with haptic feedback and data storage control |
| US11392116B2 (en) | 2016-05-09 | 2022-07-19 | Strong Force Iot Portfolio 2016, Llc | Systems and methods for self-organizing data collection based on production environment parameter |
| US11397422B2 (en) | 2016-05-09 | 2022-07-26 | Strong Force Iot Portfolio 2016, Llc | System, method, and apparatus for changing a sensed parameter group for a mixer or agitator |
| US11838036B2 (en) | 2016-05-09 | 2023-12-05 | Strong Force Iot Portfolio 2016, Llc | Methods and systems for detection in an industrial internet of things data collection environment |
| US11397421B2 (en) | 2016-05-09 | 2022-07-26 | Strong Force Iot Portfolio 2016, Llc | Systems, devices and methods for bearing analysis in an industrial environment |
| US11402826B2 (en) | 2016-05-09 | 2022-08-02 | Strong Force Iot Portfolio 2016, Llc | Methods and systems of industrial production line with self organizing data collectors and neural networks |
| US11409266B2 (en) | 2016-05-09 | 2022-08-09 | Strong Force Iot Portfolio 2016, Llc | System, method, and apparatus for changing a sensed parameter group for a motor |
| US11415978B2 (en) | 2016-05-09 | 2022-08-16 | Strong Force Iot Portfolio 2016, Llc | Systems and methods for enabling user selection of components for data collection in an industrial environment |
| US11797821B2 (en) | 2016-05-09 | 2023-10-24 | Strong Force Iot Portfolio 2016, Llc | System, methods and apparatus for modifying a data collection trajectory for centrifuges |
| US11791914B2 (en) | 2016-05-09 | 2023-10-17 | Strong Force Iot Portfolio 2016, Llc | Methods and systems for detection in an industrial Internet of Things data collection environment with a self-organizing data marketplace and notifications for industrial processes |
| US11493903B2 (en) | 2016-05-09 | 2022-11-08 | Strong Force Iot Portfolio 2016, Llc | Methods and systems for a data marketplace in a conveyor environment |
| US11507064B2 (en) | 2016-05-09 | 2022-11-22 | Strong Force Iot Portfolio 2016, Llc | Methods and systems for industrial internet of things data collection in downstream oil and gas environment |
| US11507075B2 (en) | 2016-05-09 | 2022-11-22 | Strong Force Iot Portfolio 2016, Llc | Method and system of a noise pattern data marketplace for a power station |
| US11646808B2 (en) | 2016-05-09 | 2023-05-09 | Strong Force Iot Portfolio 2016, Llc | Methods and systems for adaption of data storage and communication in an internet of things downstream oil and gas environment |
| US10338554B2 (en) | 2016-05-09 | 2019-07-02 | Strong Force Iot Portfolio 2016, Llc | Methods and systems for the industrial internet of things |
| US11573558B2 (en) | 2016-05-09 | 2023-02-07 | Strong Force Iot Portfolio 2016, Llc | Methods and systems for sensor fusion in a production line environment |
| US10338553B2 (en) | 2016-05-09 | 2019-07-02 | Strong Force Iot Portfolio 2016, Llc | Methods and systems for the industrial internet of things |
| US11573557B2 (en) | 2016-05-09 | 2023-02-07 | Strong Force Iot Portfolio 2016, Llc | Methods and systems of industrial processes with self organizing data collectors and neural networks |
| US11586188B2 (en) | 2016-05-09 | 2023-02-21 | Strong Force Iot Portfolio 2016, Llc | Methods and systems for a data marketplace for high volume industrial processes |
| US11586181B2 (en) | 2016-05-09 | 2023-02-21 | Strong Force Iot Portfolio 2016, Llc | Systems and methods for adjusting process parameters in a production environment |
| US11609553B2 (en) | 2016-05-09 | 2023-03-21 | Strong Force Iot Portfolio 2016, Llc | Systems and methods for data collection and frequency evaluation for pumps and fans |
| US11609552B2 (en) | 2016-05-09 | 2023-03-21 | Strong Force Iot Portfolio 2016, Llc | Method and system for adjusting an operating parameter on a production line |
| US11237546B2 (en) | 2016-06-15 | 2022-02-01 | Strong Force loT Portfolio 2016, LLC | Method and system of modifying a data collection trajectory for vehicles |
| US11556871B2 (en) | 2016-10-26 | 2023-01-17 | New Relic, Inc. | Systems and methods for escalation policy activation |
| WO2018080781A1 (en)* | 2016-10-26 | 2018-05-03 | SignifAI Inc. | Systems and methods for monitoring and analyzing computer and network activity |
| US10387899B2 (en) | 2016-10-26 | 2019-08-20 | New Relic, Inc. | Systems and methods for monitoring and analyzing computer and network activity |
| US20200073371A1 (en)* | 2017-03-22 | 2020-03-05 | Siemens Aktiengesellschaft | Universal data access across devices |
| US11231705B2 (en) | 2017-08-02 | 2022-01-25 | Strong Force Iot Portfolio 2016, Llc | Methods for data monitoring with changeable routing of input channels |
| US10921801B2 (en) | 2017-08-02 | 2021-02-16 | Strong Force loT Portfolio 2016, LLC | Data collection systems and methods for updating sensed parameter groups based on pattern recognition |
| US11442445B2 (en) | 2017-08-02 | 2022-09-13 | Strong Force Iot Portfolio 2016, Llc | Data collection systems and methods with alternate routing of input channels |
| US11397428B2 (en) | 2017-08-02 | 2022-07-26 | Strong Force Iot Portfolio 2016, Llc | Self-organizing systems and methods for data collection |
| US10678233B2 (en) | 2017-08-02 | 2020-06-09 | Strong Force Iot Portfolio 2016, Llc | Systems and methods for data collection and data sharing in an industrial environment |
| US10795350B2 (en) | 2017-08-02 | 2020-10-06 | Strong Force Iot Portfolio 2016, Llc | Systems and methods for data collection including pattern recognition |
| US10824140B2 (en) | 2017-08-02 | 2020-11-03 | Strong Force Iot Portfolio 2016, Llc | Systems and methods for network-sensitive data collection |
| US10908602B2 (en) | 2017-08-02 | 2021-02-02 | Strong Force Iot Portfolio 2016, Llc | Systems and methods for network-sensitive data collection |
| US11209813B2 (en) | 2017-08-02 | 2021-12-28 | Strong Force Iot Portfolio 2016, Llc | Data monitoring systems and methods to update input channel routing in response to an alarm state |
| US11199837B2 (en) | 2017-08-02 | 2021-12-14 | Strong Force Iot Portfolio 2016, Llc | Data monitoring systems and methods to update input channel routing in response to an alarm state |
| US11036215B2 (en) | 2017-08-02 | 2021-06-15 | Strong Force Iot Portfolio 2016, Llc | Data collection systems with pattern analysis for an industrial environment |
| US11175653B2 (en) | 2017-08-02 | 2021-11-16 | Strong Force Iot Portfolio 2016, Llc | Systems for data collection and storage including network evaluation and data storage profiles |
| US11144047B2 (en) | 2017-08-02 | 2021-10-12 | Strong Force Iot Portfolio 2016, Llc | Systems for data collection and self-organizing storage including enhancing resolution |
| US11131989B2 (en) | 2017-08-02 | 2021-09-28 | Strong Force Iot Portfolio 2016, Llc | Systems and methods for data collection including pattern recognition |
| US11126173B2 (en) | 2017-08-02 | 2021-09-21 | Strong Force Iot Portfolio 2016, Llc | Data collection systems having a self-sufficient data acquisition box |
| US11067976B2 (en) | 2017-08-02 | 2021-07-20 | Strong Force Iot Portfolio 2016, Llc | Data collection systems having a self-sufficient data acquisition box |
| WO2019094729A1 (en)* | 2017-11-09 | 2019-05-16 | Strong Force Iot Portfolio 2016, Llc | Methods and systems for the industrial internet of things |
| US12353203B2 (en) | 2018-05-07 | 2025-07-08 | Strong Force Iot Portfolio 2016, Llc | Methods and systems for data collection, learning, and streaming of machine signals for analytics and maintenance using the industrial Internet of Things |
| US12353181B2 (en) | 2019-01-13 | 2025-07-08 | Strong Force Iot Portfolio 2016, Llc | Systems for monitoring and managing industrial settings |
| US20220019203A1 (en)* | 2020-07-16 | 2022-01-20 | Changxin Memory Technologies, Inc. | Method and device for processing semiconductor manufacturing information |
| CN112580997B (en)* | 2020-12-24 | 2021-07-27 | 上海赛美特软件科技有限公司 | Data collection method and system, SPC system and computer storage medium |
| CN112580997A (en)* | 2020-12-24 | 2021-03-30 | 特劢丝软件科技(上海)有限公司 | Data collection method and system, SPC system and computer storage medium |
| CN113868484A (en)* | 2021-08-30 | 2021-12-31 | 北京北方华创微电子装备有限公司 | Method, device and system for data acquisition of semiconductor process equipment |
| US12430354B2 (en) | 2021-08-30 | 2025-09-30 | Beijing Naura Microelectronics Equipment Co., Ltd. | Data collection method, device, and system of semiconductor processing equipment |
| CN118633065A (en)* | 2022-03-15 | 2024-09-10 | 应用材料公司 | Communication nodes for interconnection between evaluation systems and manufacturing systems |
| CN115078744A (en)* | 2022-04-27 | 2022-09-20 | 广州伊创科技股份有限公司 | Control method, system, medium and product of industrial process on-line analyzer |
| CN115078744B (en)* | 2022-04-27 | 2024-02-13 | 广州伊创科技股份有限公司 | Control method, system, medium and product of industrial process online analyzer |
Similar Documents
| Publication | Publication Date | Title |
|---|---|---|
| US6970758B1 (en) | System and software for data collection and process control in semiconductor manufacturing and method thereof | |
| US6727106B1 (en) | System and software for statistical process control in semiconductor manufacturing and method thereof | |
| US6839713B1 (en) | System and software for database structure in semiconductor manufacturing and method thereof | |
| US6772034B1 (en) | System and software for data distribution in semiconductor manufacturing and method thereof | |
| EP1072967B1 (en) | Computer integrated manufacturing techniques | |
| US6744266B2 (en) | Defect knowledge library | |
| US6952656B1 (en) | Wafer fabrication data acquisition and management systems | |
| US20200272116A1 (en) | Distributed Industrial Performance Monitoring and Analytics | |
| US6128588A (en) | Integrated wafer fab time standard (machine tact) database | |
| US7020594B1 (en) | Electronic Kanban worksheet for the design and implementation of virtual or electronic Kanban systems | |
| US20190369607A1 (en) | Distributed industrial performance monitoring and analytics platform | |
| TWI286785B (en) | Method for interaction with status and control apparatus | |
| US6889178B1 (en) | Integrated wafer fabrication production characterization and scheduling system | |
| US7206646B2 (en) | Method and apparatus for performing a function in a plant using process performance monitoring with process equipment monitoring and control | |
| US6671570B2 (en) | System and method for automated monitoring and assessment of fabrication facility | |
| CN100407215C (en) | Method and apparatus for the monitoring and control of a semiconductor manufacturing process | |
| US6720194B1 (en) | Semiconductor characterization and production information system | |
| GB2545302A (en) | Distributed industrial performance monitoring and analytics | |
| KR20040045402A (en) | Method and apparatus for analyzing manufacturing data | |
| US20050159911A1 (en) | Method and apparatus for automatic sensor installation | |
| US8266540B2 (en) | Configuration based engineering data collection (EDC) for manufacturing lines | |
| US20020002560A1 (en) | Method and system for collecting diverse data types within a manufacturing environment and accessing the diverse data types through a network portal | |
| CN115689126A (en) | Data processing method, device, equipment and medium | |
| JP2004531794A (en) | Method and apparatus for integrating multiple process controllers | |
| US7778719B2 (en) | Method, system, apparatus, and computer-readable medium for providing configure to service for a semiconductor manufacturing service guide system |
Legal Events
| Date | Code | Title | Description |
|---|---|---|---|
| AS | Assignment | Owner name:ADVANCED MICRO DEVICES, INC., CALIFORNIA Free format text:ASSIGNMENT OF ASSIGNORS INTEREST;ASSIGNOR:PATTY, RICHARD B.;REEL/FRAME:012279/0541 Effective date:20010919 | |
| AS | Assignment | Owner name:ADVANCED MICRODEVICES, INC., CALIFORNIA Free format text:ASSIGNMENT OF ASSIGNORS INTEREST;ASSIGNORS:SHI, YURONG;BROWN, RUSSELL C.;RICHARDSON, DAVID A.;AND OTHERS;REEL/FRAME:012402/0725 Effective date:20010710 | |
| FEPP | Fee payment procedure | Free format text:PAYOR NUMBER ASSIGNED (ORIGINAL EVENT CODE: ASPN); ENTITY STATUS OF PATENT OWNER: LARGE ENTITY Free format text:PAYER NUMBER DE-ASSIGNED (ORIGINAL EVENT CODE: RMPN); ENTITY STATUS OF PATENT OWNER: LARGE ENTITY | |
| FEPP | Fee payment procedure | Free format text:PAYOR NUMBER ASSIGNED (ORIGINAL EVENT CODE: ASPN); ENTITY STATUS OF PATENT OWNER: LARGE ENTITY Free format text:PAYER NUMBER DE-ASSIGNED (ORIGINAL EVENT CODE: RMPN); ENTITY STATUS OF PATENT OWNER: LARGE ENTITY | |
| FPAY | Fee payment | Year of fee payment:4 | |
| AS | Assignment | Owner name:GLOBALFOUNDRIES INC., CAYMAN ISLANDS Free format text:AFFIRMATION OF PATENT ASSIGNMENT;ASSIGNOR:ADVANCED MICRO DEVICES, INC.;REEL/FRAME:023119/0083 Effective date:20090630 | |
| FPAY | Fee payment | Year of fee payment:8 | |
| REMI | Maintenance fee reminder mailed | ||
| LAPS | Lapse for failure to pay maintenance fees | Free format text:PATENT EXPIRED FOR FAILURE TO PAY MAINTENANCE FEES (ORIGINAL EVENT CODE: EXP.) | |
| STCH | Information on status: patent discontinuation | Free format text:PATENT EXPIRED DUE TO NONPAYMENT OF MAINTENANCE FEES UNDER 37 CFR 1.362 | |
| FP | Lapsed due to failure to pay maintenance fee | Effective date:20171129 | |
| AS | Assignment | Owner name:GLOBALFOUNDRIES U.S. INC., NEW YORK Free format text:RELEASE BY SECURED PARTY;ASSIGNOR:WILMINGTON TRUST, NATIONAL ASSOCIATION;REEL/FRAME:056987/0001 Effective date:20201117 |