US6944486B2 - Method and apparatus for determining analyte concentration using phase and magnitude detection of a radiation transfer function - Google Patents
Method and apparatus for determining analyte concentration using phase and magnitude detection of a radiation transfer functionDownload PDFInfo
- Publication number
- US6944486B2 US6944486B2US10/456,109US45610903AUS6944486B2US 6944486 B2US6944486 B2US 6944486B2US 45610903 AUS45610903 AUS 45610903AUS 6944486 B2US6944486 B2US 6944486B2
- Authority
- US
- United States
- Prior art keywords
- modulation
- transfer function
- radiation
- temperature
- emitted radiation
- Prior art date
- Legal status (The legal status is an assumption and is not a legal conclusion. Google has not performed a legal analysis and makes no representation as to the accuracy of the status listed.)
- Expired - Fee Related, expires
Links
- 230000005855radiationEffects0.000titleclaimsabstractdescription108
- 238000000034methodMethods0.000titleclaimsabstractdescription86
- 238000012546transferMethods0.000titleclaimsabstractdescription60
- 239000012491analyteSubstances0.000titleabstractdescription91
- 238000001514detection methodMethods0.000titledescription5
- 238000002835absorbanceMethods0.000claimsabstractdescription74
- 230000006870functionEffects0.000claimsdescription75
- 241000282414Homo sapiensSpecies0.000claimsdescription38
- 238000001816coolingMethods0.000claimsdescription36
- 239000000126substanceSubstances0.000claimsdescription30
- 238000010438heat treatmentMethods0.000claimsdescription18
- 239000000470constituentSubstances0.000claimsdescription16
- 230000001939inductive effectEffects0.000claimsdescription12
- 230000004044responseEffects0.000claimsdescription10
- 238000012544monitoring processMethods0.000claimsdescription9
- 238000009792diffusion processMethods0.000claimsdescription8
- 230000003287optical effectEffects0.000claimsdescription8
- 230000001419dependent effectEffects0.000claimsdescription6
- 238000004891communicationMethods0.000claimsdescription3
- 238000012360testing methodMethods0.000abstractdescription69
- 230000002596correlated effectEffects0.000abstractdescription9
- 239000000523sampleSubstances0.000description136
- WQZGKKKJIJFFOK-GASJEMHNSA-NGlucoseNatural productsOC[C@H]1OC(O)[C@H](O)[C@@H](O)[C@@H]1OWQZGKKKJIJFFOK-GASJEMHNSA-N0.000description63
- 239000008103glucoseSubstances0.000description63
- 210000004369bloodAnatomy0.000description47
- 239000008280bloodSubstances0.000description47
- 210000001519tissueAnatomy0.000description42
- 238000005259measurementMethods0.000description32
- 210000003491skinAnatomy0.000description31
- LFQSCWFLJHTTHZ-UHFFFAOYSA-NEthanolChemical compoundCCOLFQSCWFLJHTTHZ-UHFFFAOYSA-N0.000description26
- XLYOFNOQVPJJNP-UHFFFAOYSA-NwaterSubstancesOXLYOFNOQVPJJNP-UHFFFAOYSA-N0.000description25
- 230000000694effectsEffects0.000description20
- 238000004458analytical methodMethods0.000description19
- 238000012545processingMethods0.000description18
- 230000007423decreaseEffects0.000description14
- 239000000463materialSubstances0.000description14
- 230000005540biological transmissionEffects0.000description13
- 230000000737periodic effectEffects0.000description13
- 238000001228spectrumMethods0.000description11
- 210000000434stratum corneumAnatomy0.000description11
- 239000012530fluidSubstances0.000description10
- 238000001727in vivoMethods0.000description10
- 230000010363phase shiftEffects0.000description9
- 230000008901benefitEffects0.000description8
- 230000001965increasing effectEffects0.000description8
- 238000004611spectroscopical analysisMethods0.000description8
- 241001465754MetazoaSpecies0.000description7
- 238000000338in vitroMethods0.000description7
- 231100000430skin reactionToxicity0.000description7
- CURLTUGMZLYLDI-UHFFFAOYSA-NCarbon dioxideChemical compoundO=C=OCURLTUGMZLYLDI-UHFFFAOYSA-N0.000description6
- 238000000862absorption spectrumMethods0.000description6
- HVYWMOMLDIMFJA-DPAQBDIFSA-NcholesterolChemical compoundC1C=C2C[C@@H](O)CC[C@]2(C)[C@@H]2[C@@H]1[C@@H]1CC[C@H]([C@H](C)CCCC(C)C)[C@@]1(C)CC2HVYWMOMLDIMFJA-DPAQBDIFSA-N0.000description6
- 238000000295emission spectrumMethods0.000description6
- 241000196324EmbryophytaSpecies0.000description5
- 239000013626chemical specieSubstances0.000description5
- 230000003595spectral effectEffects0.000description5
- BPYKTIZUTYGOLE-IFADSCNNSA-NBilirubinChemical compoundN1C(=O)C(C)=C(C=C)\C1=C\C1=C(C)C(CCC(O)=O)=C(CC2=C(C(C)=C(\C=C/3C(=C(C=C)C(=O)N\3)C)N2)CCC(O)=O)N1BPYKTIZUTYGOLE-IFADSCNNSA-N0.000description4
- 108010054147HemoglobinsProteins0.000description4
- 102000001554HemoglobinsHuman genes0.000description4
- 230000009102absorptionEffects0.000description4
- 238000010521absorption reactionMethods0.000description4
- WQZGKKKJIJFFOK-VFUOTHLCSA-Nbeta-D-glucoseChemical compoundOC[C@H]1O[C@@H](O)[C@H](O)[C@@H](O)[C@@H]1OWQZGKKKJIJFFOK-VFUOTHLCSA-N0.000description4
- 210000004027cellAnatomy0.000description4
- DDRJAANPRJIHGJ-UHFFFAOYSA-NcreatinineChemical compoundCN1CC(=O)NC1=NDDRJAANPRJIHGJ-UHFFFAOYSA-N0.000description4
- 201000010099diseaseDiseases0.000description4
- 208000037265diseases, disorders, signs and symptomsDiseases0.000description4
- 239000003814drugSubstances0.000description4
- 210000002615epidermisAnatomy0.000description4
- NOESYZHRGYRDHS-UHFFFAOYSA-NinsulinChemical compoundN1C(=O)C(NC(=O)C(CCC(N)=O)NC(=O)C(CCC(O)=O)NC(=O)C(C(C)C)NC(=O)C(NC(=O)CN)C(C)CC)CSSCC(C(NC(CO)C(=O)NC(CC(C)C)C(=O)NC(CC=2C=CC(O)=CC=2)C(=O)NC(CCC(N)=O)C(=O)NC(CC(C)C)C(=O)NC(CCC(O)=O)C(=O)NC(CC(N)=O)C(=O)NC(CC=2C=CC(O)=CC=2)C(=O)NC(CSSCC(NC(=O)C(C(C)C)NC(=O)C(CC(C)C)NC(=O)C(CC=2C=CC(O)=CC=2)NC(=O)C(CC(C)C)NC(=O)C(C)NC(=O)C(CCC(O)=O)NC(=O)C(C(C)C)NC(=O)C(CC(C)C)NC(=O)C(CC=2NC=NC=2)NC(=O)C(CO)NC(=O)CNC2=O)C(=O)NCC(=O)NC(CCC(O)=O)C(=O)NC(CCCNC(N)=N)C(=O)NCC(=O)NC(CC=3C=CC=CC=3)C(=O)NC(CC=3C=CC=CC=3)C(=O)NC(CC=3C=CC(O)=CC=3)C(=O)NC(C(C)O)C(=O)N3C(CCC3)C(=O)NC(CCCCN)C(=O)NC(C)C(O)=O)C(=O)NC(CC(N)=O)C(O)=O)=O)NC(=O)C(C(C)CC)NC(=O)C(CO)NC(=O)C(C(C)O)NC(=O)C1CSSCC2NC(=O)C(CC(C)C)NC(=O)C(NC(=O)C(CCC(N)=O)NC(=O)C(CC(N)=O)NC(=O)C(NC(=O)C(N)CC=1C=CC=CC=1)C(C)C)CC1=CN=CN1NOESYZHRGYRDHS-UHFFFAOYSA-N0.000description4
- 102000004169proteins and genesHuman genes0.000description4
- 108090000623proteins and genesProteins0.000description4
- 210000003296salivaAnatomy0.000description4
- 210000002700urineAnatomy0.000description4
- 230000006399behaviorEffects0.000description3
- 239000013060biological fluidSubstances0.000description3
- 239000012620biological materialSubstances0.000description3
- 229910002092carbon dioxideInorganic materials0.000description3
- 239000001569carbon dioxideSubstances0.000description3
- 230000008859changeEffects0.000description3
- 235000012000cholesterolNutrition0.000description3
- 150000001875compoundsChemical class0.000description3
- 238000010586diagramMethods0.000description3
- 235000014113dietary fatty acidsNutrition0.000description3
- 229930195729fatty acidNatural products0.000description3
- 239000000194fatty acidSubstances0.000description3
- 238000012886linear functionMethods0.000description3
- 239000000203mixtureSubstances0.000description3
- 238000011002quantificationMethods0.000description3
- 229910052717sulfurInorganic materials0.000description3
- 230000036962time dependentEffects0.000description3
- 238000002235transmission spectroscopyMethods0.000description3
- 102000009027AlbuminsHuman genes0.000description2
- 108010088751AlbuminsProteins0.000description2
- 230000005457Black-body radiationEffects0.000description2
- 208000004434CalcinosisDiseases0.000description2
- 108010003320CarboxyhemoglobinProteins0.000description2
- 102000018832CytochromesHuman genes0.000description2
- 108010052832CytochromesProteins0.000description2
- 102000004877InsulinHuman genes0.000description2
- 108090001061InsulinProteins0.000description2
- 102000004895LipoproteinsHuman genes0.000description2
- 108090001030LipoproteinsProteins0.000description2
- GQPLMRYTRLFLPF-UHFFFAOYSA-NNitrous OxideChemical compound[O-][N+]#NGQPLMRYTRLFLPF-UHFFFAOYSA-N0.000description2
- XSQUKJJJFZCRTK-UHFFFAOYSA-NUreaChemical compoundNC(N)=OXSQUKJJJFZCRTK-UHFFFAOYSA-N0.000description2
- 239000000538analytical sampleSubstances0.000description2
- QVGXLLKOCUKJST-UHFFFAOYSA-Natomic oxygenChemical compound[O]QVGXLLKOCUKJST-UHFFFAOYSA-N0.000description2
- 239000012472biological sampleSubstances0.000description2
- 210000001124body fluidAnatomy0.000description2
- 239000010839body fluidSubstances0.000description2
- 239000004202carbamideSubstances0.000description2
- 230000001276controlling effectEffects0.000description2
- 210000004087corneaAnatomy0.000description2
- 230000000875corresponding effectEffects0.000description2
- 229940109239creatinineDrugs0.000description2
- 206010012601diabetes mellitusDiseases0.000description2
- 238000003745diagnosisMethods0.000description2
- 229940079593drugDrugs0.000description2
- 238000005516engineering processMethods0.000description2
- 210000003743erythrocyteAnatomy0.000description2
- 150000004665fatty acidsChemical class0.000description2
- 229940088597hormoneDrugs0.000description2
- 239000005556hormoneSubstances0.000description2
- 238000002329infrared spectrumMethods0.000description2
- 208000014674injuryDiseases0.000description2
- 229940125396insulinDrugs0.000description2
- 150000002576ketonesChemical class0.000description2
- 210000000265leukocyteAnatomy0.000description2
- 230000037323metabolic rateEffects0.000description2
- 238000010606normalizationMethods0.000description2
- 229910052760oxygenInorganic materials0.000description2
- 239000001301oxygenSubstances0.000description2
- 238000013186photoplethysmographyMethods0.000description2
- 210000000439stratum lucidumAnatomy0.000description2
- 238000002834transmittanceMethods0.000description2
- -1urineSubstances0.000description2
- 238000012935AveragingMethods0.000description1
- 206010048962Brain oedemaDiseases0.000description1
- 241000282412HomoSpecies0.000description1
- OAICVXFJPJFONN-UHFFFAOYSA-NPhosphorusChemical compound[P]OAICVXFJPJFONN-UHFFFAOYSA-N0.000description1
- 241000219094VitaceaeSpecies0.000description1
- 208000027418Wounds and injuryDiseases0.000description1
- 230000002238attenuated effectEffects0.000description1
- 235000013405beerNutrition0.000description1
- 230000017531blood circulationEffects0.000description1
- 239000012503blood componentSubstances0.000description1
- 230000008081blood perfusionEffects0.000description1
- 210000004556brainAnatomy0.000description1
- 208000006752brain edemaDiseases0.000description1
- 230000003925brain functionEffects0.000description1
- 230000000747cardiac effectEffects0.000description1
- 238000007705chemical testMethods0.000description1
- 239000000306componentSubstances0.000description1
- 238000012937correctionMethods0.000description1
- 125000004122cyclic groupChemical group0.000description1
- 230000001351cycling effectEffects0.000description1
- 230000006378damageEffects0.000description1
- 230000001934delayEffects0.000description1
- 230000027734detection of oxygenEffects0.000description1
- 230000003205diastolic effectEffects0.000description1
- 231100000673dose–response relationshipToxicity0.000description1
- 235000013399edible fruitsNutrition0.000description1
- 230000005670electromagnetic radiationEffects0.000description1
- 230000005284excitationEffects0.000description1
- 230000001747exhibiting effectEffects0.000description1
- 238000002474experimental methodMethods0.000description1
- 210000003722extracellular fluidAnatomy0.000description1
- 238000000605extractionMethods0.000description1
- 210000000744eyelidAnatomy0.000description1
- 230000004907fluxEffects0.000description1
- 239000011521glassSubstances0.000description1
- 235000021021grapesNutrition0.000description1
- 208000019622heart diseaseDiseases0.000description1
- 210000002977intracellular fluidAnatomy0.000description1
- 208000017169kidney diseaseDiseases0.000description1
- 230000003907kidney functionEffects0.000description1
- 150000003893lactate saltsChemical class0.000description1
- 150000002632lipidsChemical class0.000description1
- 238000013178mathematical modelMethods0.000description1
- 238000000691measurement methodMethods0.000description1
- 235000013372meatNutrition0.000description1
- 230000002503metabolic effectEffects0.000description1
- 230000007102metabolic functionEffects0.000description1
- 238000012986modificationMethods0.000description1
- 230000004048modificationEffects0.000description1
- 239000001272nitrous oxideSubstances0.000description1
- 230000004783oxidative metabolismEffects0.000description1
- 229910052698phosphorusInorganic materials0.000description1
- 239000011574phosphorusSubstances0.000description1
- 230000037081physical activityEffects0.000description1
- 230000010287polarizationEffects0.000description1
- 230000008569processEffects0.000description1
- 230000000541pulsatile effectEffects0.000description1
- 238000003908quality control methodMethods0.000description1
- 230000009103reabsorptionEffects0.000description1
- 230000009467reductionEffects0.000description1
- 230000035945sensitivityEffects0.000description1
- 238000004088simulationMethods0.000description1
- 239000007787solidSubstances0.000description1
- 238000002798spectrophotometry methodMethods0.000description1
- 239000000725suspensionSubstances0.000description1
- 230000002277temperature effectEffects0.000description1
- 230000002123temporal effectEffects0.000description1
- 230000000287tissue oxygenationEffects0.000description1
- 230000008733traumaEffects0.000description1
- 238000005353urine analysisMethods0.000description1
- 239000002699waste materialSubstances0.000description1
Images


Classifications
- A—HUMAN NECESSITIES
- A61—MEDICAL OR VETERINARY SCIENCE; HYGIENE
- A61B—DIAGNOSIS; SURGERY; IDENTIFICATION
- A61B5/00—Measuring for diagnostic purposes; Identification of persons
- A61B5/0059—Measuring for diagnostic purposes; Identification of persons using light, e.g. diagnosis by transillumination, diascopy, fluorescence
- G—PHYSICS
- G01—MEASURING; TESTING
- G01N—INVESTIGATING OR ANALYSING MATERIALS BY DETERMINING THEIR CHEMICAL OR PHYSICAL PROPERTIES
- G01N21/00—Investigating or analysing materials by the use of optical means, i.e. using sub-millimetre waves, infrared, visible or ultraviolet light
- G01N21/17—Systems in which incident light is modified in accordance with the properties of the material investigated
- G01N21/25—Colour; Spectral properties, i.e. comparison of effect of material on the light at two or more different wavelengths or wavelength bands
- G01N21/31—Investigating relative effect of material at wavelengths characteristic of specific elements or molecules, e.g. atomic absorption spectrometry
- G01N21/35—Investigating relative effect of material at wavelengths characteristic of specific elements or molecules, e.g. atomic absorption spectrometry using infrared light
Definitions
- This inventionrelates to methods of determining the presence and concentration of analytes in a test sample. More specifically, the present invention relates to methods for non-invasively determining the analyte concentrations in human or animal subjects. Most specifically, the present invention relates to non-invasive methods for the determination of blood glucose concentration in a human patient.
- the level of various types of cholesterol in the bloodhas a strong correlation with the onset of heart disease.
- Urine analysisprovides valuable information relating to kidney function and kidney disease.
- the concentration of alcohol in the bloodis known to be related to a subject's physical response time and coordination and can provide information related to, for example, the individual's fitness to drive a motor vehicle.
- tissuethere are many instances where it is desirable to measure the local concentration of chemical constituents in tissue, either in-vivo or in-vitro.
- tissuein-vivo or in-vitro.
- Such indicatorsinclude fatty acid compounds, water, blood, lactates, and certain proteins and lipids.
- Other specific examplesmay include the monitoring of tissue oxygenation or tissue blood perfusion as a means to of gauging the metabolic function of a human or animal subject.
- the present inventionis a method of analytical and quantitative testing for the presence of chemical species in a test sample.
- the methodis non-invasive and has wide utility, being easily applicable to the non-invasive measurement of humans, animals, plants, or even packaged materials. Being highly versatile the method is broadly applicable to both in-vivo and in-vitro samples.
- IR detection techniquesare known and have been used to detect the presence of chemical constituents in the blood. Specific examples include the IR detection of oxygen saturation, nitrous oxide concentration, carbon dioxide concentration, or measurement of oxidative metabolism, and blood glucose levels.
- the goal of these inventionsis the determination of human blood chemistry.
- a typical present technologyprojects light into the body while measuring the light after it passes through the body. Comparing the input beam with an exit beam allows a rough determination of blood chemistry.
- these techniquessuffer from a number of inadequacies, most especially, tissue interference, lack of specificity, and limited accuracy. A number of prior art patents describing such techniques are set forth below.
- Kaiserdescribes, in Swiss Patent No. 612,271, a technique for using an IR laser as a radiation source to measure glucose concentrations in a measuring cell. This technique uses venous blood passed through extra-corporeal cuvettes at high blood flow rates. This has the undesirable effect of heating the blood and requiring that the blood be removed from the patient's body. Kaiser does not describe a non-invasive technique for measuring glucose concentration.
- Hutchinsonin U.S. Pat. No. 5,009,230, describes a glucose monitor which uses polarized IR light to non-invasively detect glucose concentration in a person's blood stream, The method requires an external IR source, which is passed through a portion of the human body. However, the accuracy of measurement is limited by the wavelengths of the polarized light beam (940-1000 nm) being used. Unlike the present invention, Hutchinson relies on detected changes in the polarization of the incident light beam. Furthermore, Hutchinson does not use an induced temperature gradient as does the present invention.
- Dahneuses a directional external IR radiation source to emit a beam. Reflected and transmitted light from the beam is used to determine the glucose concentration Daline differs from other techniques in using radiation at wavelengths between 1000-2500 nm. Unlike Dahne, the present invention is not confined to using wavelengths, between 1000-2500 nm. Dahne also does not use an induced temperature gradient as does the present invention.
- the instrument of Mendelsonis based on the principles of light transmission and reflection photoplethysmography, whereby analyte measurements are made by analyzing either the differences or ratios between two different IR radiation sources that are transmitted through an appendage or reflected from tissue surface before or after blood volume change occurs in response to systolic and diastolic phases of the cardiac cycle.
- the techniquerequires the use of external IR sources and is susceptible to interference from body tissue and other blood compounds.
- Rosenthalet at., in U.S. Pat. No. 5,028,787, discloses a non-invasive blood glucose monitor which also uses IR energy in the near IR range (600-1100 nm) to measure glucose. As with the above-mentioned devices, these wavelengths suffer from poor analyte absorption which results in poor resolution and insufficient specificity.
- Optiscan, Inc of Alameda, Calif.has expanded the concept of gradient absorbance spectroscopy and demonstrated the utility of non-invasively measuring differential absorbance to determine blood glucose concentration in human subjects in U.S. patent application Ser. Nos. 08/816,723 and 08/820,378, both of which are hereby incorporated by reference.
- Basic transmission spectroscopyidentifies analytes (an analyte is defined as a chemical species sought to be identified by the present invention) by comparing a light beam passed through a test sample to a reference beam not passed through the sample.
- transmission spectroscopyrequires the test sample be removed from its native environment to a sample holder for analysis. The absorbance spectrum of the sample is examined. At specific wavelengths (known as analyte absorbance peaks) the light from the beams are compared.
- analyte absorbance peaksthe light from the beams are compared.
- Beer's Lawand comparing the sample beam with the reference beam in selected absorbance regions the absorbance of a sample may be measured and a determination of analyte concentration may be made. This is known as classical transmission cell spectroscopy.
- an analysis of radiation behaviorshows that, in objects at a constant and uniform temperature, photons emitted from the interior of the object are reabsorbed within 10-20 ⁇ m of the point of origin.
- an external radiation detectorcannot detect radiation emitted from deeper than 20 ⁇ m inside an object. Under these conditions, only an object's surface emission spectrum is detectable by a detector. This poses a significant problem for non-invasive measurement techniques seeking to analyze chemical characteristics present deeper within an object.
- the field of gradient spectroscopywas developed, in part, in an attempt to overcome the photon reabsorption problem.
- the Optiscan patent applications Ser. Nos. 08/816,723 and 08/820,378disclose a thermal gradient, induced by a single temperature event and a measurement of differences in signal magnitude to non-invasively measure human test samples.
- the Optiscan applicationsuse a temperature gradient induced by a single temperature event to non-invasively determine the glucose concentration in a human test subject by analyzing differences in signal magnitude at selected wavelengths.
- a temperature gradientexists where the temperature of a material varies according to some arbitrary function, usually related to depth or time or both. For example, if some material is at an initial temperature (e.g., 37° C.) and a surface of the material is cooled to some lower temperature (e.g., 10° C.) a gradient is induced in the material with the cooled surface being at approximately 10° C. and the deeper (and as yet unaffected) regions being at approximately 37° C. A temperature gradient exists between the two extremes.
- an initial temperaturee.g., 37° C.
- some lower temperaturee.g. 10° C.
- the total radiation reaching the surfaceis the sum of weighted radiation coming from all depths below the surface.
- the weight given to radiation from a given depthdepends on the absorbance of the medium between that depth and the surface. At any particular wavelength, this radiation weighting function decrease exponential-like with depth. If the medium is at a uniform temperature, T, then all depths will be radiating reaching the surface will have a Planck spectrum for temperature T. However, if the temperature below the surface is cooler (or hotter) than the surface, then the contribution to the total radiation from this cooler (or hotter) region will have a different spectrum than the surface radiation. Thus, the total radiation will not have a spectrum corresponding to either temperature, but will be something in between, depending on the relative contributions from the regions of different temperature.
- an object of the present inventionis to provide a new and improved method for detecting and quantifying various chemical analytes present within a test sample.
- an object of the present inventionis to determine the absolute or relative concentration of chemical species contained in a test sample medium.
- Another object of the present inventionto provide a non-invasive method of quantifying various chemical analytes within biological media.
- a specific object of the inventionis to provide a new and improved method for measuring the concentration in human, animal, and plant subjects of chemical species, such as glucose, insulin, water, carbon dioxide, alcohol, blood oxygen, cholesterol, bilirubin, ketones, fatty acids, lipoproteins, albumin, urea, creatinine, cytochrome, various proteins and chromophores, microcalcifications, and hormones, white blood cells, red blood cells, hemoglobin, oxygenated hemoglobin, carboxyhemoglobin, organic molecules, inorganic molecules, and inorganic molecules, such as phosphorus or various drugs and pharmaceuticals in blood, urine, saliva, or other body fluids.
- a further object of the inventionis to make such/measurements non-invasively, quickly, easily, and with extreme accuracy.
- the present inventiondescribes a method for quantitatively determining the chemical composition of a test sample.
- Test samplesmay be chosen from a broad range of in-vivo or in-vitro samples.
- the present methoduses a radiation detector, a data processing means, and a means for inducing a periodic thermal gradient in the test sample.
- the methodgenerally comprises the steps of providing a test sample, inducing a thermal gradient in the sample, using the detector for measuring analytical signals from the sample at one or more predetermined wavelengths. Simultaneously, one or more reference signals are measured at reference wavelengths.
- the analytical and reference signalsare compared to determine a parameter.
- the parametermay be phase difference or signal amplitude difference.
- the parameter informationis correlated with empirically determined analyte concentration information by the data processing means, thereby determining the analyte concentration of the sample. This information is transmitted as an electrical signal for further processing.
- a particularly useful parameteris a measurement of the phase difference (or phase delay) between said analytical and one or more of said reference signals.
- the magnitude of the phase differenceis correlated with data stored in a data processing means to determine analyte concentration.
- the accuracy of the methodis substantially enhanced by inducing a periodically modulated temperature gradient in the sample, measuring the reference and analytical signals, continuously monitoring the parameters between the reference and analytical signals, and then integrating the parameter information over a test period. Correlation of this information with empirically determined analyte concentration information allows the analyte concentration of the sample to be determined and transmitted as an electrical signal for further processing.
- phasewhen using a periodically modulated temperature gradient and phase difference information, the phase may be monitored at reference and analytical phase signal “zero crossings” to determine phase delay and thereby determine analyte concentration.
- the present methodmay be used to monitor analyte concentration at varying depths inside a test sample. This is accomplished by introducing two or more periodic temperature gradients in a sample at two or more driving frequencies. The resulting signals are processed to extract phase information and determine analyte concentration at varying depths within a sample. This has particular usefulness in analyzing analyte concentrations in test samples having non-uniform properties.
- a transfer function relating to a temperature modulation at the surface of the sample with the modulation of the radiation emitted from the sample over a number of wavelengthsis determined.
- an absorbanceis determined at different wavelengths and the concentration of an analyte is determined.
- model transfer functionsare stored at a central location, for example, a file server connected with a telecommunication network, such as the Internet.
- Each of these model transfer functionscorresponds to a particular sample type, for example the tissue of a human subject with a particular set of physical characteristics.
- a human subjectfor example, a person with diabetes, then selects a model transfer function based on his own physical characteristics to most closely match his own tissues.
- the selected transfer functionis then used by a device according to the present invention to determine the concentration of glucose in the patient's tissue.
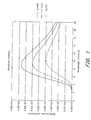
- FIG. 1is a graphical representation of the temperature effect on a blackbody radiator in units of emitted energy at a given wavelength.
- FIG. 2is a graphical comparison of a true blackbody radiation spectrum with the emission spectrum of a human body, given in units of emitted energy at a given wavelength.
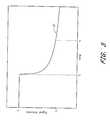
- FIG. 3is a graphical representation of detector signal response to an induced temperature gradient with the y-axis representing detector signal intensity and the x-axis representing time.
- FIGS. 4 (I)(a) through 4 (IV)(b)are schematic diagrams showing the effect of a thermal gradient on radiation emitted from the skin's surface.
- the (a) series of Figuresdepict gradient effects in a physical test sample material.
- the (b) series of Figuresare graphical depictions of the gradient effects as functions of detector signal and time.
- FIGS. 5 and 6are the photon emission effects on cross-section views of a test sample in the presence and absence of a temperature gradient.
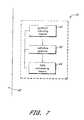
- FIG. 7is a block diagram showing a satisfactory apparatus for implementing the method of the present invention.
- FIG. 8is a flowchart showing an embodiment of the present invention.
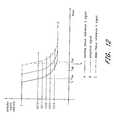
- FIGS. 9 , 10 , and 11show the absorbance spectra of water, ethanol, and glucose, respectively.
- FIG. 12is a graphical representation of the skin's response to a single induced temperature gradient with the y-axis representing detector signal intensity and the x-axis representing time.
- FIG. 13is a flowchart showing a second embodiment of the present invention.
- FIG. 14is a graphical representation of skin response to a periodically modulated temperature gradient with the y-axis representing detector signal intensity and the x-axis representing time.
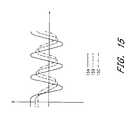
- FIG. 15is a graphical representation of skin response to a periodically modulated temperature gradient with the y-axis representing unnormalized detector signal intensity and the x-axis representing time.
- FIG. 16is a schematic illustration of the human skin.
- FIG. 17is a graphical representation of skin response to a periodically modulated temperature gradient with the y-axis representing the depth to which the gradient penetrates and the x-axis representing the time that the skin has been exposed to a 10° C. cooling source.
- FIG. 18is a graphical representation of skin response to a periodically modulated temperature gradient with the y-axis representing the depth to which the gradient penetrates and the x-axis representing the frequency of a gradient cooling/heating cycle.
- FIG. 19is a graphical representation of skin response to a two sequential periodically modulated temperature gradients with the y-axis representing relative detector signal intensity and the x-axis representing the time or phase angle.
- FIG. 20is a flowchart showing a third embodiment of the present invention.
- FIG. 21is a graphical representation of skin response to a two superimposed periodically modulated temperature gradients with the y-axis representing relative detector signal intensity and the x-axis representing the time or phase angle.
- FIGS. 22 a and 22 bare graphs showing a phase relationship between a surface temperature modulation and emitted radiation at selected infrared wavelengths.
- FIG. 23is a graph showing a correlation between phase shift or signal magnitude and actual glucose concentration measured using a device according to an embodiment of the present invention.
- FIG. 24is a graph showing actual glucose concentrations and glucose concentrations measured using a device according to an embodiment of the invention for a series of skin phantoms.
- the present inventiongoes beyond the existing art by advantageously exploiting phase effects caused by induced temperature gradients to determine analyte concentration.
- the following exampleillustrates the general principles of the present invention.
- test sampleshall be interpreted broadly to include any type of analytical sample. In its most basic form the sample comprises a sample medium and the chemical analytes contained therein.
- mediumis broad in its application.
- the mediummay be comprised of solids or fluids or any combination thereof.
- the mediummay comprise biological material.
- the present methodmay be applied to any type of material ordinarily analyzed using transmission cell spectroscopy.
- Biological materialssuch as human, animal, or plant material may be analyzed. These biological samples may be analyzed, either in-vivo or in-vitro.
- the methodis versatile and may be applied to a wide range of samples, including but not limited to, in-vivo blood samples or in-vivo analysis of fruit contents, for example, testing grapes remaining on the vine for sugar content.
- the methodfinds utility as a method for analyzing invasively removed samples such as blood or saliva removed from a subject and placed in a glass cuvette for analysis.
- the devicemay even be used to determine analyte concentrations in packaged meats without opening a plastic wrapper.
- the method of the present inventionrequires an induced temperature gradient and monitoring of radiation emitted from test samples.
- a satisfactory means for meeting this requirementis described in U.S. patent application Ser. No. 09/265,195 entitled “Solid-state Non-invasive Infrared Absorption Spectrometer for the Generation and Capture of Thermal Gradient Spectra from Living Tissue,” filed Mar. 10, 1999.
- FIG. 2shows the effect of temperature on spectral radiation emitted from the same body at increasing temperatures T 0 , T 1 , and T 2 .
- FIG. 3graphically depicts a radiation detector output 31 of a typical sample monitored over time. Prior to inducing a temperature event, no gradient exists in the sample. Using a uniformly warm test sample at an initial temperature T i , a detector signal 31 of constant intensity I i is measured. Without a temperature gradient, the signal 31 remains at a constant intensity I i
- FIG. 3illustrates the principle as applied to a cooling event.
- a cooling temperature T Cis induced in the sample at a time t C .
- the temperature of the samplebegins to drop, resulting in a lower detector signal 31 .
- the temperaturereaches a new (and lower) equilibrium temperature, resulting in a lower detector signal 31 having intensity I F .
- the oppositewould be true if the sample was heated, resulting in a higher final equilibrium temperature and higher output signal intensity.
- FIG. 4 (I)(a)depicts a typical sample material 40 prior to inducing a temperature event.
- the sample 40 depictedis at an arbitrarily warm uniform temperature T i (e.g., 30° C.). This means that the surface S of the sample 40 is at or about 30° C. and the interior d of the sample 40 is still at T i (about 30° C.) and no gradient is present.
- T iuniform temperature
- FIG. 4 (I)(b)if no temperature event is induced in the sample 40 , the temperature of the sample remains constant, no gradient exists, and a constant detector signal 31 is observed at an initial signal intensity I i .
- FIGS. 4 (III)(a) and 4 (III)(b)show the effects of the cooling event after some time t X .
- the deeper regions of the samplecontinue to cool, enlarging the depth and magnitude of the gradient G.
- the detector signal 31falls off, reflecting the effects of the declining temperature.
- the gradient effectis time dependent. Meaning, the longer the surface S is subjected to the cooling event, the colder the deeper regions of the sample will become. The lower limit on temperature being dictated by the temperature T C of the temperature event.
- the gradient Gexpands into the deeper regions of the sample 40 . This creates a time-dependent temperature gradient in the sample.
- the sample 40reaches a new cooler steady state temperature (e.g. 10° C.) and the gradient G disappears. Consequently, the detected signal 31 from the sample 40 equilibrates at a new, lower level I F .
- a new cooler steady state temperaturee.g. 10° C.
- the time-varying nature of the temperature gradientmay be exploited in a novel way to determine the concentration of various analytes contained in a test sample.
- the present inventionembodies an extremely accurate and non-invasive method of determining analyte concentration, which goes far beyond existing technologies.
- FIGS. 5 and 6illustrate the transmission/absorbance aspect of the present invention.
- FIG. 5is a cross-section view of a typical sample material 40 at an arbitrarily warm uniform temperature (e.g., about 37° C.)
- the sample 40 of FIG. 5is shown having a surface S and layers 40 a , 40 b , 40 c , and 40 d each representing successively deeper portions of the sample. Each layer being approximately 10 ⁇ m further inside the sample 40 . Layer 40 d being 30 ⁇ m beneath the sample surface S.
- photons P d emitted within the sampleare reabsorbed by the sample within a very short distance (approximately 10-20 ⁇ m). Only photons P S emitted at or near the surface S exit the sample to be detected by an external detector 60 .
- the radiation emission spectra of these photons P Sis determined by the temperature and emissivity em, of the sample 40 .
- FIG. 6shows the effects of inducing a gradient in the sample 40 of FIG. 5 .
- the surface Shas been cooled (e.g. to about 10° C.) while a deeper layer 40 d remains warm (e.g. 37° C.) with the intervening layers 40 a , 40 b , 40 c , exhibiting gradually cooler temperatures as the 10° C. surface S is approached.
- the total radiation reaching the surface Srepresented by photon P S and detected by the dector 60 is the sum of the radiation emitted by each of the layers 40 a , 40 b , 40 c , and 40 d , represented by photons P 1 weighted by the absorbance of the medium between each layer and the surface.
- the internally emitted photons P 1pass through intervening sample material 40 a , 40 b , 40 c , and S.
- the intervening material 40 a , 40 b , 40 c , and Sabsorbs some of the radiation reducing radiation output by the time it reaches the detector 60 .
- the analytes in the intervening regions 40 a , 40 b , 40 c , and Sabsorb radiation at specific characteristic wavelengths This reduces the radiation output at those wavelengths in a concentration-dependent manner. By comparing a detector signal at selected absorbance peak wavelengths with a reference signal at selected reference wavelengths, the analyte concentration may be determined.
- the present inventionovercomes many of the practical impediments encountered in the prior art, including difficulties in resolving low analyte concentrations and tissue interference problems.
- the method of the present inventionovercomes many of these difficulties by introducing a large temperature gradient in the sample to increase the detectable signal. Furthermore, by inducing a periodic temperature gradient in a sample substantial increases in accuracy and a much larger signal-to-noise ratio may be attained.
- the only limitations on gradient magnitudebeing the initial sample temperature and the necessity to avoid damaging the sample by making it too hot or too cold. These limitations become especially important when living tissue samples are used. Too high a temperature and the tissue burns, too cool and the tissue freezes. As a result preferable temperatures range from about 0° C. to about 40° C. for living test samples.
- the present inventionprovides a method for determining the concentration of chemical analytes in a test sample.
- the methodis typically used in conjunction with a testing apparatus constructed for measuring analyte concentration.
- a testing apparatusconstructed for measuring analyte concentration.
- such an apparatus 70comprises a thermal gradient inducing means 62 , a radiation detector 60 , and a data processing means 64 for controlling the gradient and determining analyte concentration based on detector information and predetermined database.
- One satisfactory apparatus for implementing the method of the present inventionis described in co-pending U.S. patent application Ser. No. 09/265,195.
- the testerIn the analysis of test samples the tester typically knows what analytes he is seeking.
- the analyte soughtis identified, and its IR absorbance spectrum analyzed.
- Analyte absorbance peaksare identified. Once one or more absorbance peak wavelengths are identified, one or more reference wavelengths are chosen.
- a temperature gradientis induced in the test sample.
- the sample radiation emissionsare monitored with an IR detector.
- Detector signalsare monitored. Signals are monitored at predefined wavelength intervals defined by absorbance characteristics of the analyte sought. These signals are referred to as analytical emission signals or just analytical signals.
- the analytical signalsare measured at analyte absorbance peak wavelengths.
- IR detector signalsare also monitored at so-called reference wavelengths.
- reference emission signalsThese are referred to as reference emission signals or just reference signals. It is advantageous to measure reference signals at wavelengths do not overlap the analyte absorbance peaks and it is advantageous if reference signals and analytical signals are not measured at wavelengths that overlap absorbance peaks of other possible constituents of the sample.
- the reference wavelengthsare typically dictated by the absorbance spectrum of the main constituent of the sample.
- the main constituentis the medium in which the analytes are suspended.
- the main constituentis water. Therefore, any analyte measurement must take into consideration the large amounts of water present.
- Reference measurementsmay be taken in regions where sample media absorbance is low (i.e., transmission near 100%). However, there are advantages to using reference measurements taken in regions where the sample media absorbance is high (i.e., transmission near 0%). Alternatively, reference measurements may be taken in regions bracketing the analyte absorbance peaks in question. Ideally, analyte absorbance peaks are chosen in regions where the absorbance effects of the major constituents are small. It is the way in which the information gathered at these absorbance and reference wavelengths is processed which allows the present invention to determine analyte concentration.
- the present inventioncombines detector output measurements taken at the appropriate wavelengths with analysis of the radiation emission spectra of the subject material at known temperatures to facilitate the accurate determination of analyte concentration.
- An application of the present inventionis illustrated in the following noni-inivasive determination of blood ethanol concentration in a human test subject.
- FIGS. 9 and 10depict the IR spectra of water and ethanol, respectively.
- water absorbance peaksare present at 2.9 ⁇ m and 6.1 ⁇ m.
- a transmittance peakexists in the range of about 3.6 ⁇ m to 4.2 ⁇ m.
- an area of relatively uniform absorbanceexists between about 6.8 ⁇ m and about 11.0 ⁇ m.
- ethanol absorbance peaksare shown between about 9.3 ⁇ m and 10.1 ⁇ m.
- the sampleblood and ethanol
- FOG. 2a blackbody radiator
- the blackbody radiative characteristicsprovide a source of known IR radiation which may be used to analyze the constituents of the sample.
- Step 100a test sample 40 is provided at some arbitrarily warm constant uniform initial temperature (e.g., approximately 37° C.), no gradient exists.
- Step 102a temperature gradient is induced in the sample 40 (for example, by subjecting the surface of the sample to a cooling event using means 62 ). Radiation passing through the gradient passes through the ethanol suspended in the sample and reaches the surface where it is detected by an IR detector 60 .
- Step 104radiation is measured at selected wavelengths (specifically, at reference wavelengths and analyte absorbance peaks) producing analytical signals and reference signals.
- Step 106analytical signals and reference signals are compared and analyzed to determine phase differences caused by changes in the absorbance spectra in the affected regions.
- the present inventiondetermines the analyte concentration in the sample by comparing the absorbance effects of the analyte with known absorbance information. This comparison and analysis is typically done using a data processing means 64 .
- this concentration informationis then transmitted, as an electrical signal, for further processing.
- a first reference signal 12 Amay be measured at a first reference wavelength.
- a first reference signalis measured at a wavelength where water strongly absorbs (e.g., 2.9 ⁇ m or 6.1 ⁇ m as shown in FIG. 9 ). Because water strongly absorbs radiation at these wavelengths, the detector signal intensity is reduced at those wavelengths. Moreover, at these wavelengths water absorbs the photon emissions emanating from deep inside the sample. The net effect being that a signal emitted from deep inside the sample is not detected.
- the first reference signal 12 Ais a good indicator of gradient effects near the sample surface and is known as a surface reference signal. This signal may be calibrated and normalized to a value of 1. For greater accuracy, the detector signal at more than one first reference wavelength may be measured. For example, both 2.9 ⁇ m and 6.1 ⁇ m may be chosen as first reference wavelengths.
- a second reference signal 12 Cmay also be measured.
- the second signal 12 Cmay be measured at a wavelength where water has very low absorbance (e.g., 3.81 ⁇ m or 5.5 ⁇ m as shown in FIG. 7 ).
- the second reference signal 12 Cis measured at a wavelength largely transparent to radiation.
- This signalmay also be calibrated and normalized to a value of 1.
- This second reference signal 12 Cprovides the analyst with information concerning the deeper regions of the sample, whereas the first signal 12 A provides information concerning the sample surface. As with the first (surface) reference signal 12 A, greater accuracy may be obtained by using more than one second (deep) reference signal 12 C.
- a third signal 12 Bis also measured. This signal is measured at an IR absorbance peak of the selected analyte. Ethanol peak wavelengths are in the range of about 9.3-10.1 ⁇ m (as shown in FIG. 9 ). This detector signal may also be calibrated and normalized to 1. As with the reference signals 12 A, 12 C, the analytical signal 12 B may be measured using more than one absorbance peak.
- reference signalsmay be measured at wavelengths that bracket the analyte absorbance peak.
- bracketing wavelengthsmay be chosen at 7.0-8.0 ⁇ m and 10.3-11.5 ⁇ m. These signals may also be calibrated and normalized to a value of 1. These signals may be advantageously monitored at reference wavelengths which do not overlap the analyte absorbance peaks. Further, it is advantageous to measure reference wavelengths and absorbance peaks which do not overlap the absorbance peaks of other possible constituents contained in the tissue. Corrections for known extraneous biological matter contained in a sample may be made if desired.
- Step 106the analytical 12 B and reference, signals 12 A, 12 C are compared.
- the signal intensities 12 A, 12 B, 12 Call begin at an initial signal intensity (all shown here at a normalized value of 1). This reflects the baseline radiation behavior of a test sample in the absence of a gradient.
- Step 102at some time, t C , the surface of the sample is subjected to a temperature event which induces a temperature gradient in the sample surface. This gradient can be induced by heating or cooling the sample surface.
- the example shown in FIG. 12uses cooling, for example, using a 10° C. cooling event. Similar to FIG. 3 , the detector signal decreases over time. However, due to the effects of the temperature gradient and variances in absorbance, each signal 12 A, 12 B, 12 C decreases in intensity.
- the surfacecools before the deeper regions of the sample cool.
- the signals 12 A, 12 B, 12 Care monitored as they drop in intensity, a pattern emerges. Signal intensity declines as expected, but if the signals are monitored as they reach a set amplitude value (or series of amplitude values: 1210 , 1211 , 1212 , 1213 , 1214 ), certain temporal effects are noted.
- the first (surface) reference signal 12 Adeclines in amplitude most rapidly, reaching a checkpoint 1210 first, at time t l2A . This is due to the fact that the first reference signal 12 A mirrors the sample's radiative characteristics near the surface of the sample. Since the sample surface cools before the underlying regions, the surface (first) reference signal 12 A drops in signal intensity first.
- the second reference signal 12 Cis monitored. Since the second reference signal 12 C mirrors the radiation characteristics of deeper regions inside the sample, which do not cool as rapidly as the surface (due to the time needed for the surface cooling to propagate into the deeper regions of the sample), the intensity of signal 12 C does not decline until slightly later. Consequently, signal 12 C does not reach magnitude 1210 until some later time t 12C . This results in a time delay between the time t 12A that the amplitude of the first reference signal 12 A reaches the checkpoint 1210 and the time t 12C that the second reference signal 12 C reaches the same checkpoint 1210 . This time delay can be expressed as a phase difference ⁇ ( ⁇ ).
- phase differencemay be measured between the analytical signal 12 B and either or both reference signal 12 A, 12 C.
- phase differences ⁇ ( ⁇ )are compared in Step 106 of FIG. 8 .
- the concentration of analyteincreases, the amount of absorbance at the analytical wavelength increases. This reduces the intensity of the analytical signal 12 B in a concentration dependent way. Consequently, the analytical signal 12 B reaches intensity 1210 at some intermediate time t 12B .
- the higher the concentration of analytethe more the analytical signal 12 B shifts to the left.
- the phase difference ⁇ ( ⁇ ) relative to the first reference signal 12 Adecreases and relative to the second reference signal 12 C (the deep tissue signal) the phase difference ⁇ ( ⁇ ) increases.
- These phase differences ⁇ ( ⁇ )are directly related to analyte concentration and can be used to make accurate determinations of analyte concentration.
- Accuracymay be enhanced by choosing several checkpoints, for example, 1210 , 1211 , 1212 , 1213 , and 1214 and averaging the phase difference ⁇ ( ⁇ ).
- the accuracy of this methodmay be further enhanced by integrating the phase difference ⁇ ( ⁇ ) continuously over the entire test period. Because only a single temperature event has been induced and because measurements must be taken only in the presence of a temperature gradient all measurements must be taken before a new lower equilibrium temperature is reached and the signals stabilize at a new constant level I F and the gradient vanishes. Further accuracy may be obtained by measuring detector signals at reference wavelengths chosen near analyte absorbance peaks. The point should be made that the method works equally well with temperature gradients induced by heating.
- the method of the present inventionis not limited to the determination of phase difference ⁇ ( ⁇ ).
- the amplitude of the analytical signal 12 Bmay be compared to the amplitude of either or both of the reference signals 12 A, 12 C, The difference in signal magnitude may be correlated and processed to determine analyte concentration.
- the analytical signal 12 B and the reference signals 12 A, 12 Cmay be processed for concentration dependent frequency information. The differences in each of these parameters (phase, magnitude, and frequency) may be processed using the data processing means of the present invention (not shown) to determine analyte concentration.
- the inventionis versatile. This method is not limited to the detection or quantification of in-vitro ethanol concentration. As stated previously, the method may be used on human, animal, or even plant subjects. The method may be used to take non-invasive measurements of in-vivo samples of virtually any kind. In addition to blood samples, the method is adaptable and may be used to determine chemical concentrations in other body fluids (e.g., urine or saliva) once they have been extracted from a patient. In fact, the method may be used for the measurement of in-vitro samples of virtually any kind.
- body fluidse.g., urine or saliva
- the methodis useful for measuring the concentration of a wide range of additional chemical analytes, including but not limited to, glucose, insulin, water, carbon dioxide, blood oxygen, cholesterol, bilirubin, ketones, fatty acids, lipoproteins, albumin, urea, creatinine, white blood cells, red blood cells, hemoglobin, oxygenated hemoglobin, carboxyhemoglobin, organic molecules, inorganic molecules, pharmaceuticals, cytochrome, various proteins and chromophores, microcalcifications, hormones, as well as other chemical compounds. All that is required is the careful selection of analytical and reference wavelengths.
- the principles of the present inventionmay be applied to a more elegant method of determining analyte concentration.
- a more accurate determination of analyte concentrationmay be made.
- FIG. 13is a flowchart of an embodiment of the present invention using a periodically modulated temperature gradient to determine the analyte concentration of a sample.
- Step 200a periodic gradient is induced in a sample.
- Steps 202 and 204the radiation output of the sample is measured using at least one analytical signal and at least one reference signal.
- Step 206the analytical and reference signals are compared and processed.
- Step 208the processed information is used to determine parameter differences between said analytical and reference signals.
- the parameter signalis used in conjunction with predetermined parameter information to deduce the analyte concentration of the sample.
- FIGS. 9 and 1Idepict the IR spectra of water and glucose, respectively.
- water absorbance peaksare present at 2.9 ⁇ m and 6.1 ⁇ m.
- a transmittance peakexists in the range of about 3.6 ⁇ m to 4.2 ⁇ m.
- an area of relatively uniform absorbanceexists between about 6.8 ⁇ m and about 11.0 ⁇ m.
- a number of glucose absorbance peaksexist between about 6.5 ⁇ m and 11.0 ⁇ m.
- phase difference ⁇ ( ⁇ )is present whether the gradient is induced through heating or cooling.
- This feature of the inventionhas tremendous advantages.
- the present inventionadvantageously exploits the fact that phase difference ⁇ ( ⁇ ) exists in the presence of both positive and negative gradients.
- FIG. 14graphically depicts detector signals emanating from a test sample.
- one or more reference signals 14 A, 14 Care measured.
- One or more analytical signals 14 Bare also monitored. These signals may optionally be normalized to a value of 1.
- FIG. 14shows the signals after normalization.
- a temperature evente.g., cooling
- the signals ( 12 A, 12 B, 12 C)decline until the gradient disappears and a new equilibrium detector signal I F is reached.
- FIG. 12the present embodiment
- Step 200 of FIG. 13is the objective of Step 200 of FIG. 13 .
- a phase difference ⁇ ( ⁇ )may be measured and used to determine analyte concentration.
- periodic reference ( 14 A, 14 C) and analytical 14 B signalsare measured in Steps 202 and 204 .
- the reference ( 14 A, 14 C) and analytical 14 B wavelengthsare chosen for analysis based on the same considerations used to determine the reference and analytical wavelengths shown in FIG. 12 (i.e., absorbance peaks, transmission peaks, non-interference with the media).
- FIG. 14shows these signals after an optional normalization step has occurred.
- FIG. 14shows that a first (surface) reference signal 14 A declines and rises in intensity first.
- a second (deep tissue) reference signal 14 Cdeclines and rises in a time-delayed manner relative to the first reference signal 14 A.
- the analytical signal 14 Bexhibits a time delay dependent on the analyte concentration. With increasing concentration, the analytical signal 14 B shifts to the left. As with FIG. 12 a phase difference ⁇ ( ⁇ ) may be measured.
- reference signals 14 A, 14 Care compared with analytical signals 14 B to determine a phase difference ⁇ ( ⁇ ).
- a phase difference ⁇ ( ⁇ ) between the second reference signal 14 C and an analytical signal 14 B, measured at some set amplitude 1402is shown.
- the phase difference ⁇ ( ⁇ )can be used to determine the phase difference between any reference signal 14 A, 14 C and any analytical signal 14 B to generate a phase signal as in Step 208 .
- the magnitude of the phase signalreflects the analyte concentration of the sample.
- the phase difference ⁇ ( ⁇ ) informationis correlated by the data processing means 64 with previously determined phase information (typically stored in the data processing means 64 of FIG. 7 ) to determine the analyte concentration in the sample.
- phase difference ⁇ ( ⁇ )is constant and continuous measurements of phase may be integrated over the entire test period for an extremely accurate measure of phase difference ⁇ ( ⁇ ).
- the signal-to-noise ratiomay be substantially increased resulting in very accurate determinations of phase.
- the accuracy of the methodmay be improved by using more than one reference signal and/or more than one analytical signal.
- the present methodmay be advantageously employed to simultaneously measure the concentration of one or more analytes.
- phase differencescan be simultaneously measured and processed to determine analyte concentrations.
- FIG. 14illustrates the method used in conjunction with a sinusoidally modulated temperature gradient
- the principleapplies to temperature gradients conforming to any periodic function.
- analysis using signal processing with Fourier transforms or other techniquesallows accurate determinations of phase difference ⁇ ( ⁇ ) and analyte concentration.
- Such processingmay be accomplished using the data processing means 64 of FIG. 7 .
- phase differences ⁇ ( ⁇ )may be determined by measuring the time intervals between the amplitude peaks (or troughs) of the reference signals 15 A, 15 C and the analytical signals 15 B.
- the time intervals between the “zero crossings”may be used to determine the phase difference ⁇ ( ⁇ ) between analytical signals 15 B and the reference signals 15 A, 15 C. This information is subsequently processed and a determination of analyte concentration may then be made.
- the methodhas the advantage of not requiring normalized signals.
- test samplescomprised of heterogeneous material, such as complex biological tissues.
- heterogeneous materialsuch as complex biological tissues.
- a typical examplebeing human skin.
- the skin's structurediffers from the completely uniform homogeneous examples previously described.
- skillis a layered structure.
- a thin layer of stratum corneum approximately 10 ⁇ m thick 1610covers the surface of the skin, and contains no fluid.
- Underlying the stratum corneumis a layer of epidermis 1611 approximately 100 ⁇ m thick.
- the epidermis 1611contains fluids (e.g. interstitial and intracellular fluids) which are important because the fluids suspend analyte materials of interest (such as glucose).
- Beneath the epidermis 1611lies a thick layer of derma 1612 , which also contains fluid and suspended blood analytes (for example, glucose). It is the methods for analyzing these suspended analytes that form the present embodiment of the invention.
- the human body's spectral radiation characteristicsare very similar to that of the previously discussed blackbody radiator (FIG. 2 ).
- the near blackbody radiative characteristics of the human bodyprovide a source of known IR radiation, which may be used to analyze the constituents of human blood contained within the skin.
- the body's internal temperature T 1is constant at approximately 37° C.
- ordinary room temperaturee.g., 21° C.
- a naturally occurring temperature gradientexists in the skin.
- a 21° C. room temperatureis less than the body's 37° C. internal temperature T 1 .
- a small 4° C. temperature gradientexists between the body's 37° C. internal regions and the skin's 33° C. surface.
- This naturally occurring gradientis not sufficient and a larger gradient is needed.
- the larger gradientequates to a greater detector signal and a better picture of thermal behavior deeper inside the skin.
- the present inventionutilizes this phenomenon to analyze the body's chemical composition.
- the present inventionintegrates all the previous concepts in a method of determining analyte concentration in heterogeneous (non-uniform) test samples.
- the method of the present inventionmay be used to non-invasively determine the blood glucose concentration in human subjects. It allows the measurement of specific regions inside a test sample. This has significant advantages when used to analyze samples having non-uniform analyte distribution characteristics. This method finds particular utility in the non invasive analysis of biological tissues.
- FIGS. 17 and 18illustrate this principle.
- FIG. 17plots length of a temperature event versus depth of gradient.
- FIG. 18plots frequency of a periodic cooling/heating cycle versus depth of gradient.
- a test sampleis at some arbitrarily warm constant temperature (e.g., 37° C.) when at some later time t c .
- a cold evente.g., 10° C.
- the detector signal 31drops off as the sample cools.
- the limitations of the cooling/heating cycleare dictated largely by the limitations of the test sample.
- a cooling temperature of less than about 0° C.begins to freeze the tissue and a heating temperature of greater than about 40° C. begins to cause discomfort to the patient. This defines the limits of the heating and cooling cycle used for human subjects.
- a cooling/heating cycle(also referred to as a driving frequency) of 1 Hz provides information to a depth of about 150 ⁇ m. It has also been determined that exposure to a 10° C. cooling event for about 167 ms leads to a gradient that penetrates to a depth of 50 ⁇ m (FIG. 17 ). Therefore, a cooling/heating cycle of 3 Hz provides information to a depth of about 50 ⁇ m (FIG. 18 ). By subtracting the detector signal information measured at a 3 Hz driving frequency from the detector signal information measured at a 1 Hz driving frequency, a picture of skin between 50 and 150 ⁇ m emerges.
- the present inventionuses a first (fast) driving frequency to induce a shallow temperature gradient and a second (slow) driving frequency to induce deeper gradients.
- the individual requirements for driving frequenciesare determined by test sample and temperatures of the heating and cooling events.
- the phase information measured at each driving frequencyis correlated and processed by a data processing means to accurately determine the analyte concentration.
- stratum corneum 1610In human skin the stratum corneum 1610 is 10-30 ⁇ m thick and provides little useful information concerning the concentration of blood analytes. However, the underlying derma 1611 and epidermis 1612 contain fluids which contain significant amounts of analytes.
- the present inventionprovides a method for determining analyte concentration in the underlying layers 1611 , 1612 while compensating for the inaccuracies induced by the overlying stratum corneum 1610 .
- the present inventionrelies on the introduction of two sequentially implemented gradients. Each gradient having a different driving frequency. This embodiment also relies on the detection and measurement of phase differences ⁇ ( ⁇ ) between reference 19 C, 19 C′ and analytical 19 B, 19 B′ signals.
- the present inventionmeasures the phase differences ⁇ ( ⁇ ) at both fast (e.g., 3 Hz) and slow (e.g., 1 Hz) driving frequencies.
- a slow cyclee.g., 1 Hz
- An analytical signal 19 Bis measured and a reference signal 19 C is measured.
- a phase delay ⁇ ( ⁇ )is measured.
- the phase delay between 19 B and 19 Cis relatively longer at higher analyte concentrations.
- the slow driving frequencycontinues for arbitrarily chosen number of cycles (in region SL t ), for example, two full cycles. Then a higher driving frequency (fast cycle) temperature modulation is induced. Due to the higher frequency of the fast cycle (e.g., 3 Hz), only information contained in the shallower regions (e.g., the regions from 0-50 ⁇ m) of the skin is measured.
- An analytical signal 19 B′is measured and a reference signal 19 C′ is measured at the higher driving frequency and the phase delay ⁇ ( ⁇ )′ is determined.
- the phase delayis relatively smaller ⁇ ( ⁇ )′.
- the fast cycleis also run through a number of cycles (for example, in region f 1 , e.g., two cycles). By running through the fast and slow cycles a few times, the various phase delays ⁇ ( ⁇ ), ⁇ ( ⁇ )′ can be integrated over time. In fact, the pattern may be continued for any amount of time.
- the fast cycle (shallow tissue) phase data ⁇ ( ⁇ )′is subtracted from the slow cycle data ⁇ ( ⁇ ), providing an accurate determination of analyte concentration in the region between 50 to 150 ⁇ m in depth.
- the two frequenciescan be superposed so that high and low frequency signals are applied simultaneously.
- This embodimenthas the advantage that signals from both near-surface and deeper layers are obtained at the same time, thereby reducing the total amount of time necessary to take a measurement in two layers of tissue. It should be noted, however, that where frequencies are imposed simultaneously, the total power at each frequency must be reduced so that the total power applied to a patient's tissues does not cause injury.
- the sequentially applied driving frequenciesshow in FIG. 19 can safely deliver greater power at each of the driving frequencies.
- FIG. 20is a flowchart depicting an embodiment of the present invention having more than one gradient driving frequency.
- Step 300shallow and deep gradients are cyclically induced in a test sample.
- Steps 302 , 304 , 306 , and 308respectively, measurements are made of a shallow analytical signal 19 B′, a shallow reference signal 19 C, a deep analytical signal 19 B, and a deep reference signal 19 C. It should be noted that one or more shallow analytical signals 19 B′, one or more shallow reference signals 19 C′, one or more deep analytical signals 19 B, and a deep reference signals 19 C may be measured.
- Step 310the shallow analytical signals 19 B′ of Step 302 and the shallow reference signals 19 C′ of Step 304 are compared to form a shallow parameter signal (for example, a shallow phase signal).
- Step 312the deep analytical signals 19 B of Step 306 and the deep reference signals 19 C of Step 308 are compared to form a deep parameter signal (for example, a deep phase signal).
- Step 314the shallow parameter signal of Step 310 is processed with the deep parameter signal of Step 312 to determine a combined parameter signal.
- Step 316the combined parameter signal of Step 314 is used to deduce the analyte concentration of the test sample.
- the two driving frequenciescan be multiplexed as shown in FIG. 21 .
- the fast (3 Hz) and slow (1 Hz) driving frequenciescan be superimposed rather than sequentially implemented.
- the signalscan be separated by frequency (using Fourier transform or other techniques) using a data processing means and independent measurements of phase delay at each of the two driving frequencies may be calculated. Once resolved, the two signals are processed by a data processing means to determine absorbance and analyte concentration.
- the present inventionmay be used to quickly, accurately, and non-invasively determine the blood glucose concentration in a human patient.
- the gradient driving frequenciesmay be implemented sequentially (as in FIG. 19 ) or simultaneously (as in FIG. 21 ).
- the method of FIG. 19will be used to determine the blood glucose concentration of a human subject.
- a first driving frequencyis induced at about 1 Hz and penetrates deeply into the fluid containing regions of the skin (e.g. about 150 ⁇ m).
- a second gradientis induced at a second driving frequency.
- the second frequencyis at approximately 3 Hz and induces a shallow gradient which penetrates to just beneath the stratus corneum.
- test periodcan be any length of time, but for convenience, a sixty second test period serves well. It should also be noted that the order of implementation of the first and second driving frequencies can be freely altered.
- the analytical signals 19 B, 19 B′are measured at a glucose absorbance peak in the range of 7-10 ⁇ m.
- the analytical signalmay be monitored using the glucose absorbance peak at 9.3 ⁇ m.
- Reference wavelengthsare chosen.
- the signalmay be monitored at one or more wavelengths.
- the reference signal 19 C, 19 C′ shown in FIG. 19is measured at a water transmission peak, for example, at about 4 ⁇ m.
- the signal when measured at a transmission peakreflects gradient effects deep within the skin. As with all embodiments more then one reference wavelength may be monitored for increased accuracy.
- a first analytical signal 19 B and a first reference signal 19 Care monitored.
- the first analytical signal 19 B and the first reference signal 19 Care compared. Based on the comparison, a phase difference between the first analytical signal 19 B and the first reference signal 19 C is measured This phase difference forms a first phase signal ⁇ ( ⁇ )
- This first phase signal ⁇ ( ⁇ )measures phase differences deeply into the skin, including the stratum corneum.
- the first phase signal ⁇ ( ⁇ )is monitored as the cooling/heating cycle runs for a predetermined number of cycles.
- a second gradientis then induced at a higher frequency (e.g. 1 Hz). This high frequency gradient penetrates to just below the stratum corneum.
- a second analytical signal 19 B′ and a second reference signal 19 C′are monitored.
- the second analytical signal 19 B′ and the second reference signal 19 C′are compared. Based on the comparison, a phase difference between the second analytical signal 19 B′ and the second reference signal 19 C′ is measured.
- This phase differenceforms a second phase signal ⁇ ( ⁇ )′.
- the second phase signal ⁇ ( ⁇ )′measures phase in the shallow regions of the skin like the stratum corneum.
- the second phase signal ⁇ ( ⁇ )′is monitored as the cooling/heating cycle runs for a predetermined number of cycles.
- the first and second gradientsare measured repeatedly over a test period (e.g. about 5-10 seconds).
- the first phase signal ⁇ ( ⁇ )is subtracted from the second phase signal ⁇ ( ⁇ )′ to form a combined phase signal.
- the combined signalcompensates for the effects of the surface and stratum corneum to provide an accurate measure of the phase difference only in the fluid containing regions of the skin, as measured throughout the test period.
- This combined phase signal informationis correlated with previously determined data relating phase to glucose concentration and the concentration of blood glucose in the patient is determined.
- This patient blood glucose informationcan be transmitted, as an electrical signal, for further processing.
- the present inventiondiscloses a method for measuring radiation absorbance effects and determining analyte concentration in test samples.
- the procedurehas been optimized and illustrated with regard to samples containing large relative quantities of water.
- the methodis widely applicable to homogeneous materials and especially heterogeneous or layered materials provided that useful wavelengths can be identified: (1) a reference wavelength where radiation transmission is high and/or (2) a reference wavelength where radiation transmission is low; (3) analyte absorbance peak where interference with the reference wavelength is low.
- the present inventionis useful in aqueous systems in the analysis of glucose concentration.
- the relationship between the modulation of radiation emitted from the surface of a body, for example a human patient, and the modulation of the induced temperature of the surface callbe defined in terms of a radiation transfer function.
- the radiation transfer functiondepends on absorbance, which, as discussed above depends on the concentration of substances in the tissue. By monitoring the phase and magnitude of the radiation transfer function, the absorbance at selected wavelengths can be determined and from this absorbance the concentration of the analyte is determined.
- the transfer functionis developed as follows. It is assumed that a body, for example, the tissue of a patient, in contact with a temperature modulating device is a semi-infinite medium (0 ⁇ x ⁇ ) in which the temperature, T(x,t), is a function only of the depth and time, and the infrared absorbance of the tissue with a given concentration of an analyte, for example glucose, ⁇ (x, ⁇ ), is a function only of depth and wavelength.
- T(x,t)The temperature distribution within the tissue, T(x,t), is governed by the one-dimensional diffusion equation.
- ⁇ overscore (T) ⁇ (x)is a complex quantity that specifies the magnitude and phase of the temperature modulation at depth x.
- the coefficients. A and B,are determined by the boundary conditions.
- the magnitude of the modulationdecreases exponentially with depth, and the phase of the modulation decreases linearly with depth. The higher the modulation frequency, the more rapidly magnitude and phase decrease with depth.
- the tissueis composed of layers, for example the stratum corneum, stratum lucidum, and deep tissue of a human patient. Within each of theses layers thermal and optical characteristics can be considered uniform. For a layered medium, in which the properties of the medium are constant within each layer a piecewise solution to the diffusion equation is constructed by combining the solutions in each layer with appropriate boundary conditions at the interfaces.
- the layersinclude the stratum corneum, the stratum lucidum and deep tissue of a patient and a piecewise solution to the diffusion equation yields transfer function G(x,w).
- the amplitude of the temperature modulation at the surface of the tissueis ⁇ 5 K (i.e., ⁇ 5° C.) centered about 303 K (i.e., 30° C.).
- T 1 (x)T 0 +T 1 ( x )cos( ⁇ t+ ⁇ ( x )).
- the depth-dependence of the magnitude, T 1 (x), and phase ⁇ (x)will be governed by the diffusion equation.
- T 1 (x) ⁇ 10 K and T 0303 K
- T 1 (x) ⁇ T 0and the linear approximation can be used
- P ⁇ ( t )⁇ ⁇ ⁇ ( T 0 , ⁇ ) + ⁇ ⁇ T ⁇ ( T 0 , ⁇ ) ⁇ ⁇ 0 ⁇ ⁇ d x ⁇ ⁇ ⁇ ⁇ ⁇ ( x ) ⁇ ⁇ exp ⁇ [ - ⁇ 0 x ⁇ d ⁇ ⁇ ⁇ ⁇ ⁇ ( ⁇ ] [ T 1 ⁇ ( x ) ⁇ ⁇ cos ⁇ ( ⁇ ⁇ ⁇ t + ⁇ ⁇ ( x ) ] ] .
- the complex amplitude of the modulated radiationi.e., its magnitude and phase
- the complex amplitude (magnitude and phase) of the temperature modulationis a linear function of the complex amplitude (magnitude and phase) of the temperature modulation.
- P ⁇⁇ T ⁇ ( T 0 , ⁇ ) ⁇ ⁇ 0 ⁇ ⁇ ⁇ d x ⁇ ⁇ ⁇ ⁇ ( x ) ⁇ exp ⁇ [ - ⁇ 0 x ⁇ d ⁇ ⁇ ⁇ ⁇ ( ⁇ ) ] ⁇ G ⁇ ( x , ⁇ ) ⁇ T ⁇ ⁇ ( 0 )
- H( ⁇ , ⁇ )is the radiation transfer function from the surface temperature modulation, ⁇ overscore (T) ⁇ ( 0 ), to the radiation modulation, ⁇ overscore (P) ⁇ .
- Both the magnitude and phase of H( ⁇ , ⁇ )are functions of the thermal and infrared properties of the medium.
- H( ⁇ , ⁇ )is the dependence of H( ⁇ , ⁇ ) on the absorbance, ⁇ (x). Changes in substance concentration, for example glucose concentration, affect the absorbance spectrum of the medium, and thereby affect both the magnitude and phase of H( ⁇ , ⁇ ).
- a temperature inducing apparatusis controlled by a signal processor to heat and cool the surface of a patient's skin.
- the signal processoris connected with an optical detector that monitors emitted infrared radiation from the skin surface at a number of discrete wavelengths using, for example, a number of band-pass filters.
- the signal processorincludes the transfer function H( ⁇ , ⁇ ) as discussed above.
- the transfer functionmay be a model transfer function based on expected values for infrared absorbance, diffusivity, and thermal conductivity for human tissue.
- the model transfer functionis stored as an element of a database of model transfer functions at a central location, for example, a file server connected with a communication network such as the Internet.
- the signal processoris equipped with a telecommunications device, such as a telephone modem, for accessing the database and for retrieving the model transfer function.
- Model transfer functions stored in the file serverinclude transfer functions for particular types of patients, based for example, on patient's skin color, weight, age, level of physical activity, on the presence of other diseases or medicines in the body that might complicate measurement of glucose, and the like.
- the signed processorselects from the database a selected model transfer function based on a patient's response to questions.
- the selected model transfer functionis then used to correlate the modulation of the radiation emitted from the patient's skin with the modulation of the surface temperature induced in the skin surface to determine glucose concentration.
- Such a systemhas the benefit that, as more accurate model transfer functions are developed, these can be added to the database. Furthermore, as a patients condition changes, for example as he gains or loses weight, a different transfer function is selected, thus compensating for variations in the patient's condition.
- the transfer function H( ⁇ , ⁇ )may be developed from measurements of a particular patient at a time when the patients glucose level is known using a known technique; for example, analysis of a blood sample using transmission spectrophotometry.
- the phase modulation of the emitted radiation at the discrete wavelengthsis compared with the expected modulation based on the transfer function H( ⁇ , ⁇ ) and the difference in phase modulation is used to determine a value for glucose concentration based on a known relation between absorbance, ⁇ (x) and concentration.
- the transfer functionis stored in the database, described above, along with other transfer functions developed empirically from the particular patient, or from other patients having similar demographics, different demographics, or a combination thereof and accessed via the modem.
- the skin surface temperatureis continually cycled at a 1 Hz. rate. Radiation emitted from the skin surface is monitored by an optical detector at a number of predetermined wavelengths, for example 9.25 ⁇ m or 9.65 ⁇ m, where glucose absorbs strongly and 8.45 ⁇ m where glucose absorbs weakly as can be seen from the spectrum of glucose, when dissolved in water, shown in FIG. 11 . Both of the absorbance maxima at 9.25 and at 9.65 ⁇ m are appropriate for quantification. These absorbances can be referenced to the absorbances at a wavelength band such as 8.45 ⁇ m, where the glucose absorbance is minimal. At each of these wavelengths water absorbs almost equally, as shown in FIG. 9 .
- the periodic temperature cyclingproduces a corresponding periodic signal detected by the detector at each of the predetermined wavelengths. Both magnitude and phase differences of the detector signals are correlated to spectral absorbance and with the application of conventional spectroscopy, converted to glucose concentration.
- FIGS. 22 a and 22 bAn example of actual signals acquired from two detector channels operated according to an aspect of this embodiment of the invention is shown in FIGS. 22 a and 22 b .
- FIG. 22 ashows the emission responses at the optical wavelengths 9.25 ⁇ m and 8.45 ⁇ m are phase shifted relative to a sinusoidal thermal excitation drive function for a sample composed of water with 520 mg/dL glucose.
- the phase shift of the emission response relative to the thermal drive functionis a function of the transfer function H( ⁇ , ⁇ )
- FIG. 22 bis a detailed view of a portion of the signals shown in FIG. 22 b showing the phase difference between the two IR signals.
- FIG. 23The phase shift and magnitude results of a series of different glucose concentrations in water are shown in FIG. 23 .
- the line drawn through the datais a regression line.
- the average glucose errorwas calculated to be 2 mg/dL.
- the observed sensitivitywas 0.2 millidegrees of phase shift per mg/dL of glucose.
- a series of tissue “phantoms”were prepared to represent the mechanical properties of skin, as well as the protein and water content of human tissue. Employing phase information from the series of tissue phantoms of varying glucose-equivalent concentration, a linear dose-response relationship between glucose and phase shift was developed.
- the linear calibration equation, relating phase shift difference to glucose concentration, obtained from glucose/water phase shift datawas applied to the phantom phase shift data.
- FIG. 24shows the correlation between the predicted glucose concentration determined from the measured phase shift and the actual glocuse concentration in the prepared phantoms.
- the present inventionhas been shown and described with regard to certain preferred embodiments. However, it should be readily apparent to those of ordinary skill in the art that various changes and modifications in form or detail may be made with departure from the spirit and scope of the disclosure, as set forth, which embodiments are provided for purpose of illustration and not of limitation.
- the invention disclosed hereinis not limited to detection of ethanol or glucose, but may be used to quantify an analyte concentration of a wide variety of analytes.
- the inventionis not confined to use on a test sample that is an in-vivo human subject but rather may be used on other tests samples such as animals in-vivo and plants as well as on in-vitro test samples.
Landscapes
- Life Sciences & Earth Sciences (AREA)
- Health & Medical Sciences (AREA)
- Medical Informatics (AREA)
- Biophysics (AREA)
- Pathology (AREA)
- Engineering & Computer Science (AREA)
- Biomedical Technology (AREA)
- Heart & Thoracic Surgery (AREA)
- Physics & Mathematics (AREA)
- Molecular Biology (AREA)
- Surgery (AREA)
- Animal Behavior & Ethology (AREA)
- General Health & Medical Sciences (AREA)
- Public Health (AREA)
- Veterinary Medicine (AREA)
- Investigating Or Analysing Materials By Optical Means (AREA)
- Measurement Of The Respiration, Hearing Ability, Form, And Blood Characteristics Of Living Organisms (AREA)
- Investigating Or Analysing Biological Materials (AREA)
Abstract
Description
Φ(λ)=t12A−t12B
Φ(λ)=t12B−t12C
{overscore (T)}(x)=Aekx+Be−kx,
where
The coefficients. A and B, are determined by the boundary conditions. For example, in a uniform medium extending from zero to infinity, {overscore (T)}(x) is given by
{overscore (T)}(x)={overscore (T)}(0)e−γxe−iγx.
It is to be noted that the magnitude of the modulation decreases exponentially with depth, and the phase of the modulation decreases linearly with depth. The higher the modulation frequency, the more rapidly magnitude and phase decrease with depth.
{overscore (T)}(x)=G(x,ω){overscore (T)}(0).
For the case of a semi-infinite uniform medium the transfer function is given by,
G(x,ω)=e−γxe−γx,
as noted above. For a layered medium, G(x,ω) is determined by the solution to the diffusion equation with boundary condition {overscore (T)}(0) at x=0, as well as boundary conditions at surfaces of the layers within the body. According to one aspect of this embodiment, the layers include the stratum corneum, the stratum lucidum and deep tissue of a patient and a piecewise solution to the diffusion equation yields transfer function G(x,w).
where Γ(T,λ) is the Planck radiation function.
where c2=14,380 μm K.
The weighting function, w(x), has unit area, independent of the absorbance function, α(x); i.e.,
Γ(T(x,t),λ)≈Γ(T0,λ)+ΓT(T0,λ)[T(x,t)−T0],
where
The first (constant) term is the black body radiation associated with the average temperature, T0. The second term is the response to the time-varying temperature modulation. It is important to note that the time-varying modulation of the radiation is a linear function of the temperature modulation, T(x,t)−T0.
T(x,t)=T0+T1(x)cos(ωt+θ(x)).
The depth-dependence of the magnitude, T1(x), and phase θ(x), will be governed by the diffusion equation. According to the present embodiment T1(x)<10 K and T0=303 K, thus T1(x)<<T0, and the linear approximation can be used, and
T1(x)cos(ωt+θ(x))=Real[T1(x)eiθ(x)eiωt]=Real[{overscore (T)}(x)eiωt],
where {overscore (T)}(x)=T1(x)eiθ(x)is the complex amplitude of T1(x)cos(ωt+θ(x)).
Thus,
or,
P(t)=Γ(T0,λ)+Real[{overscore (P)}eiωt],
where,
is the complex amplitude of the sinusoidal component of P(t).
{overscore (T)}(x)=G(x,ω){overscore (T)}(0)
Thus,
or,
{overscore (P)}=H(ω,λ){overscore (T)}(0),
where
Claims (27)
Priority Applications (1)
| Application Number | Priority Date | Filing Date | Title |
|---|---|---|---|
| US10/456,109US6944486B2 (en) | 1997-03-12 | 2003-06-06 | Method and apparatus for determining analyte concentration using phase and magnitude detection of a radiation transfer function |
Applications Claiming Priority (4)
| Application Number | Priority Date | Filing Date | Title |
|---|---|---|---|
| US08/820,378US5900632A (en) | 1997-03-12 | 1997-03-12 | Subsurface thermal gradient spectrometry |
| US09/267,121US6161028A (en) | 1999-03-10 | 1999-03-10 | Method for determining analyte concentration using periodic temperature modulation and phase detection |
| US09/538,164US6580934B1 (en) | 1999-03-10 | 2000-03-30 | Method and apparatus for determining analyte concentration using phase and magnitude detection of a radiation transfer function |
| US10/456,109US6944486B2 (en) | 1997-03-12 | 2003-06-06 | Method and apparatus for determining analyte concentration using phase and magnitude detection of a radiation transfer function |
Related Parent Applications (1)
| Application Number | Title | Priority Date | Filing Date |
|---|---|---|---|
| US09/538,164ContinuationUS6580934B1 (en) | 1997-03-12 | 2000-03-30 | Method and apparatus for determining analyte concentration using phase and magnitude detection of a radiation transfer function |
Publications (2)
| Publication Number | Publication Date |
|---|---|
| US20040087841A1 US20040087841A1 (en) | 2004-05-06 |
| US6944486B2true US6944486B2 (en) | 2005-09-13 |
Family
ID=23017403
Family Applications (7)
| Application Number | Title | Priority Date | Filing Date |
|---|---|---|---|
| US09/267,121Expired - Fee RelatedUS6161028A (en) | 1997-03-12 | 1999-03-10 | Method for determining analyte concentration using periodic temperature modulation and phase detection |
| US09/538,164Expired - Fee RelatedUS6580934B1 (en) | 1997-03-12 | 2000-03-30 | Method and apparatus for determining analyte concentration using phase and magnitude detection of a radiation transfer function |
| US09/663,071Expired - Fee RelatedUS6556850B1 (en) | 1997-03-12 | 2000-09-15 | Method for determining analyte concentration using periodic temperature modulation and phase detection |
| US09/663,114Expired - Fee RelatedUS6577885B1 (en) | 1997-03-12 | 2000-09-15 | Method for determining analyte concentration using periodic temperature modulation and phase detection |
| US10/377,020AbandonedUS20040034291A1 (en) | 1997-03-12 | 2003-02-27 | Method for determining analyte concentration using periodic temperature modulation and phase detection |
| US10/426,160Expired - Fee RelatedUS7006857B2 (en) | 1997-03-12 | 2003-04-28 | Method for determining analyte concentration using periodic temperature modulation and phase detection |
| US10/456,109Expired - Fee RelatedUS6944486B2 (en) | 1997-03-12 | 2003-06-06 | Method and apparatus for determining analyte concentration using phase and magnitude detection of a radiation transfer function |
Family Applications Before (6)
| Application Number | Title | Priority Date | Filing Date |
|---|---|---|---|
| US09/267,121Expired - Fee RelatedUS6161028A (en) | 1997-03-12 | 1999-03-10 | Method for determining analyte concentration using periodic temperature modulation and phase detection |
| US09/538,164Expired - Fee RelatedUS6580934B1 (en) | 1997-03-12 | 2000-03-30 | Method and apparatus for determining analyte concentration using phase and magnitude detection of a radiation transfer function |
| US09/663,071Expired - Fee RelatedUS6556850B1 (en) | 1997-03-12 | 2000-09-15 | Method for determining analyte concentration using periodic temperature modulation and phase detection |
| US09/663,114Expired - Fee RelatedUS6577885B1 (en) | 1997-03-12 | 2000-09-15 | Method for determining analyte concentration using periodic temperature modulation and phase detection |
| US10/377,020AbandonedUS20040034291A1 (en) | 1997-03-12 | 2003-02-27 | Method for determining analyte concentration using periodic temperature modulation and phase detection |
| US10/426,160Expired - Fee RelatedUS7006857B2 (en) | 1997-03-12 | 2003-04-28 | Method for determining analyte concentration using periodic temperature modulation and phase detection |
Country Status (6)
| Country | Link |
|---|---|
| US (7) | US6161028A (en) |
| EP (1) | EP1158894A1 (en) |
| JP (1) | JP2002537931A (en) |
| AU (1) | AU3525000A (en) |
| CA (1) | CA2362780A1 (en) |
| WO (1) | WO2000053086A1 (en) |
Cited By (72)
| Publication number | Priority date | Publication date | Assignee | Title |
|---|---|---|---|---|
| US20060271319A1 (en)* | 2005-05-25 | 2006-11-30 | Raivo Loosme | Analysis system and method |
| US7297151B2 (en) | 2002-04-19 | 2007-11-20 | Elikan Technologies, Inc. | Method and apparatus for body fluid sampling with improved sensing |
| US20070267575A1 (en)* | 2006-05-17 | 2007-11-22 | Sandor Holly | Cryogenic terahertz spectroscopy |
| US7316700B2 (en) | 2001-06-12 | 2008-01-08 | Pelikan Technologies, Inc. | Self optimizing lancing device with adaptation means to temporal variations in cutaneous properties |
| US7344894B2 (en) | 2001-10-16 | 2008-03-18 | Agilent Technologies, Inc. | Thermal regulation of fluidic samples within a diagnostic cartridge |
| US7344507B2 (en) | 2002-04-19 | 2008-03-18 | Pelikan Technologies, Inc. | Method and apparatus for lancet actuation |
| US7374544B2 (en) | 2002-04-19 | 2008-05-20 | Pelikan Technologies, Inc. | Method and apparatus for penetrating tissue |
| US7410468B2 (en) | 2002-04-19 | 2008-08-12 | Pelikan Technologies, Inc. | Method and apparatus for penetrating tissue |
| US7481776B2 (en) | 2002-04-19 | 2009-01-27 | Pelikan Technologies, Inc. | Method and apparatus for penetrating tissue |
| US7491178B2 (en) | 2002-04-19 | 2009-02-17 | Pelikan Technologies, Inc. | Method and apparatus for penetrating tissue |
| US7524293B2 (en) | 2002-04-19 | 2009-04-28 | Pelikan Technologies, Inc. | Method and apparatus for penetrating tissue |
| US7537571B2 (en) | 2001-06-12 | 2009-05-26 | Pelikan Technologies, Inc. | Integrated blood sampling analysis system with multi-use sampling module |
| US7547287B2 (en) | 2002-04-19 | 2009-06-16 | Pelikan Technologies, Inc. | Method and apparatus for penetrating tissue |
| US7563232B2 (en) | 2002-04-19 | 2009-07-21 | Pelikan Technologies, Inc. | Method and apparatus for penetrating tissue |
| US7582063B2 (en) | 2000-11-21 | 2009-09-01 | Pelikan Technologies, Inc. | Blood testing apparatus having a rotatable cartridge with multiple lancing elements and testing means |
| US7582099B2 (en) | 2002-04-19 | 2009-09-01 | Pelikan Technologies, Inc | Method and apparatus for penetrating tissue |
| US20090247853A1 (en)* | 2008-03-31 | 2009-10-01 | Nellcor Puritan Bennett Llc | Non-Invasive Total Hemoglobin Measurement by Spectral Optical Coherence Tomography |
| US7604592B2 (en) | 2003-06-13 | 2009-10-20 | Pelikan Technologies, Inc. | Method and apparatus for a point of care device |
| US20090272906A1 (en)* | 2008-05-03 | 2009-11-05 | Luca Joseph Gratton | Method and apparatus for the identification of lithospheric or shielded material deposits by doppler-shifted response photon spectra from interrogation by ionizing radiation |
| US20100001899A1 (en)* | 2008-07-03 | 2010-01-07 | Sandor Holly | Unbalanced non-linear radar |
| US20100001915A1 (en)* | 2008-07-03 | 2010-01-07 | Burns Richard H | Composite dipole array assembly |
| US7648468B2 (en) | 2002-04-19 | 2010-01-19 | Pelikon Technologies, Inc. | Method and apparatus for penetrating tissue |
| US7666149B2 (en) | 1997-12-04 | 2010-02-23 | Peliken Technologies, Inc. | Cassette of lancet cartridges for sampling blood |
| US7674232B2 (en) | 2002-04-19 | 2010-03-09 | Pelikan Technologies, Inc. | Method and apparatus for penetrating tissue |
| US7682318B2 (en) | 2001-06-12 | 2010-03-23 | Pelikan Technologies, Inc. | Blood sampling apparatus and method |
| US7699791B2 (en) | 2001-06-12 | 2010-04-20 | Pelikan Technologies, Inc. | Method and apparatus for improving success rate of blood yield from a fingerstick |
| US7713214B2 (en) | 2002-04-19 | 2010-05-11 | Pelikan Technologies, Inc. | Method and apparatus for a multi-use body fluid sampling device with optical analyte sensing |
| US7717863B2 (en) | 2002-04-19 | 2010-05-18 | Pelikan Technologies, Inc. | Method and apparatus for penetrating tissue |
| US7731729B2 (en) | 2002-04-19 | 2010-06-08 | Pelikan Technologies, Inc. | Method and apparatus for penetrating tissue |
| US7822454B1 (en) | 2005-01-03 | 2010-10-26 | Pelikan Technologies, Inc. | Fluid sampling device with improved analyte detecting member configuration |
| US7833171B2 (en) | 2002-04-19 | 2010-11-16 | Pelikan Technologies, Inc. | Method and apparatus for penetrating tissue |
| US7841992B2 (en) | 2001-06-12 | 2010-11-30 | Pelikan Technologies, Inc. | Tissue penetration device |
| US7850621B2 (en) | 2003-06-06 | 2010-12-14 | Pelikan Technologies, Inc. | Method and apparatus for body fluid sampling and analyte sensing |
| US7862520B2 (en) | 2002-04-19 | 2011-01-04 | Pelikan Technologies, Inc. | Body fluid sampling module with a continuous compression tissue interface surface |
| US7874994B2 (en) | 2002-04-19 | 2011-01-25 | Pelikan Technologies, Inc. | Method and apparatus for penetrating tissue |
| US7892183B2 (en) | 2002-04-19 | 2011-02-22 | Pelikan Technologies, Inc. | Method and apparatus for body fluid sampling and analyte sensing |
| US7901362B2 (en) | 2002-04-19 | 2011-03-08 | Pelikan Technologies, Inc. | Method and apparatus for penetrating tissue |
| US7909778B2 (en) | 2002-04-19 | 2011-03-22 | Pelikan Technologies, Inc. | Method and apparatus for penetrating tissue |
| US7909775B2 (en) | 2001-06-12 | 2011-03-22 | Pelikan Technologies, Inc. | Method and apparatus for lancet launching device integrated onto a blood-sampling cartridge |
| US7914465B2 (en) | 2002-04-19 | 2011-03-29 | Pelikan Technologies, Inc. | Method and apparatus for penetrating tissue |
| US7959582B2 (en) | 2002-04-19 | 2011-06-14 | Pelikan Technologies, Inc. | Method and apparatus for penetrating tissue |
| US7976476B2 (en) | 2002-04-19 | 2011-07-12 | Pelikan Technologies, Inc. | Device and method for variable speed lancet |
| US8106810B2 (en) | 2008-07-03 | 2012-01-31 | The Boeing Company | Millimeter wave filters |
| US8197421B2 (en) | 2002-04-19 | 2012-06-12 | Pelikan Technologies, Inc. | Method and apparatus for penetrating tissue |
| US8221334B2 (en) | 2002-04-19 | 2012-07-17 | Sanofi-Aventis Deutschland Gmbh | Method and apparatus for penetrating tissue |
| US8235897B2 (en) | 2010-04-27 | 2012-08-07 | A.D. Integrity Applications Ltd. | Device for non-invasively measuring glucose |
| US8267870B2 (en) | 2002-04-19 | 2012-09-18 | Sanofi-Aventis Deutschland Gmbh | Method and apparatus for body fluid sampling with hybrid actuation |
| US8282576B2 (en) | 2003-09-29 | 2012-10-09 | Sanofi-Aventis Deutschland Gmbh | Method and apparatus for an improved sample capture device |
| US8333710B2 (en) | 2002-04-19 | 2012-12-18 | Sanofi-Aventis Deutschland Gmbh | Tissue penetration device |
| US8435190B2 (en) | 2002-04-19 | 2013-05-07 | Sanofi-Aventis Deutschland Gmbh | Method and apparatus for penetrating tissue |
| US8439872B2 (en) | 1998-03-30 | 2013-05-14 | Sanofi-Aventis Deutschland Gmbh | Apparatus and method for penetration with shaft having a sensor for sensing penetration depth |
| US8652831B2 (en) | 2004-12-30 | 2014-02-18 | Sanofi-Aventis Deutschland Gmbh | Method and apparatus for analyte measurement test time |
| US8668656B2 (en) | 2003-12-31 | 2014-03-11 | Sanofi-Aventis Deutschland Gmbh | Method and apparatus for improving fluidic flow and sample capture |
| US8702624B2 (en) | 2006-09-29 | 2014-04-22 | Sanofi-Aventis Deutschland Gmbh | Analyte measurement device with a single shot actuator |
| US8721671B2 (en) | 2001-06-12 | 2014-05-13 | Sanofi-Aventis Deutschland Gmbh | Electric lancet actuator |
| US8828203B2 (en) | 2004-05-20 | 2014-09-09 | Sanofi-Aventis Deutschland Gmbh | Printable hydrogels for biosensors |
| US8965476B2 (en) | 2010-04-16 | 2015-02-24 | Sanofi-Aventis Deutschland Gmbh | Tissue penetration device |
| US9034639B2 (en) | 2002-12-30 | 2015-05-19 | Sanofi-Aventis Deutschland Gmbh | Method and apparatus using optical techniques to measure analyte levels |
| US9072842B2 (en) | 2002-04-19 | 2015-07-07 | Sanofi-Aventis Deutschland Gmbh | Method and apparatus for penetrating tissue |
| US9144401B2 (en) | 2003-06-11 | 2015-09-29 | Sanofi-Aventis Deutschland Gmbh | Low pain penetrating member |
| US9226699B2 (en) | 2002-04-19 | 2016-01-05 | Sanofi-Aventis Deutschland Gmbh | Body fluid sampling module with a continuous compression tissue interface surface |
| US9248267B2 (en) | 2002-04-19 | 2016-02-02 | Sanofi-Aventis Deustchland Gmbh | Tissue penetration device |
| US9314194B2 (en) | 2002-04-19 | 2016-04-19 | Sanofi-Aventis Deutschland Gmbh | Tissue penetration device |
| US9351680B2 (en) | 2003-10-14 | 2016-05-31 | Sanofi-Aventis Deutschland Gmbh | Method and apparatus for a variable user interface |
| US9375169B2 (en) | 2009-01-30 | 2016-06-28 | Sanofi-Aventis Deutschland Gmbh | Cam drive for managing disposable penetrating member actions with a single motor and motor and control system |
| US9386944B2 (en) | 2008-04-11 | 2016-07-12 | Sanofi-Aventis Deutschland Gmbh | Method and apparatus for analyte detecting device |
| US9427532B2 (en) | 2001-06-12 | 2016-08-30 | Sanofi-Aventis Deutschland Gmbh | Tissue penetration device |
| US9560993B2 (en) | 2001-11-21 | 2017-02-07 | Sanofi-Aventis Deutschland Gmbh | Blood testing apparatus having a rotatable cartridge with multiple lancing elements and testing means |
| US9795747B2 (en) | 2010-06-02 | 2017-10-24 | Sanofi-Aventis Deutschland Gmbh | Methods and apparatus for lancet actuation |
| US9820684B2 (en) | 2004-06-03 | 2017-11-21 | Sanofi-Aventis Deutschland Gmbh | Method and apparatus for a fluid sampling device |
| US9839386B2 (en) | 2002-04-19 | 2017-12-12 | Sanofi-Aventis Deustschland Gmbh | Body fluid sampling device with capacitive sensor |
| US10837902B2 (en) | 2017-08-21 | 2020-11-17 | Tokyo Electron Limited | Optical sensor for phase determination |
Families Citing this family (107)
| Publication number | Priority date | Publication date | Assignee | Title |
|---|---|---|---|---|
| US6161028A (en)* | 1999-03-10 | 2000-12-12 | Optiscan Biomedical Corporation | Method for determining analyte concentration using periodic temperature modulation and phase detection |
| US7043287B1 (en)* | 1998-05-18 | 2006-05-09 | Abbott Laboratories | Method for modulating light penetration depth in tissue and diagnostic applications using same |
| US6393310B1 (en)* | 1998-09-09 | 2002-05-21 | J. Todd Kuenstner | Methods and systems for clinical analyte determination by visible and infrared spectroscopy |
| US6959211B2 (en) | 1999-03-10 | 2005-10-25 | Optiscan Biomedical Corp. | Device for capturing thermal spectra from tissue |
| US6633771B1 (en)* | 1999-03-10 | 2003-10-14 | Optiscan Biomedical Corporation | Solid-state non-invasive thermal cycling spectrometer |
| AT408376B (en)* | 1999-04-07 | 2001-11-26 | Lendl Bernhard Dr | METHOD FOR INFRARED-OPTICALLY DETERMINING THE CONCENTRATION OF AT LEAST ONE ANALYTIC IN A LIQUID SAMPLE |
| US6196046B1 (en) | 1999-08-25 | 2001-03-06 | Optiscan Biomedical Corporation | Devices and methods for calibration of a thermal gradient spectrometer |
| US7509153B2 (en)* | 2000-09-26 | 2009-03-24 | Sensys Medical, Inc. | Method and apparatus for control of skin perfusion for indirect glucose measurement |
| US6549861B1 (en) | 2000-08-10 | 2003-04-15 | Euro-Celtique, S.A. | Automated system and method for spectroscopic analysis |
| US6675030B2 (en) | 2000-08-21 | 2004-01-06 | Euro-Celtique, S.A. | Near infrared blood glucose monitoring system |
| US6640117B2 (en) | 2000-09-26 | 2003-10-28 | Sensys Medical, Inc. | Method and apparatus for minimizing spectral effects attributable to tissue state variations during NIR-based non-invasive blood analyte determination |
| US20020107640A1 (en)* | 2000-11-14 | 2002-08-08 | Ideker Trey E. | Methods for determining the true signal of an analyte |
| EP1257093B1 (en)* | 2001-05-08 | 2006-07-26 | Agere Systems Guardian Corporation | Wireless network system comprising access points |
| US6802812B1 (en)* | 2001-07-27 | 2004-10-12 | Nostix Llc | Noninvasive optical sensor for measuring near infrared light absorbing analytes |
| US6631282B2 (en) | 2001-08-09 | 2003-10-07 | Optiscan Biomedical Corporation | Device for isolating regions of living tissue |
| US6678542B2 (en) | 2001-08-16 | 2004-01-13 | Optiscan Biomedical Corp. | Calibrator configured for use with noninvasive analyte-concentration monitor and employing traditional measurements |
| US20030108976A1 (en) | 2001-10-09 | 2003-06-12 | Braig James R. | Method and apparatus for improving clinical accuracy of analyte measurements |
| US6989891B2 (en) | 2001-11-08 | 2006-01-24 | Optiscan Biomedical Corporation | Device and method for in vitro determination of analyte concentrations within body fluids |
| US6731961B2 (en)* | 2001-11-09 | 2004-05-04 | Optiscan Biomedical Corp. | Method for transforming phase spectra to absorption spectra |
| AU2002346486A1 (en) | 2001-11-21 | 2003-06-10 | James R. Braig | Method for adjusting a blood analyte measurement |
| AU2002346485A1 (en) | 2001-11-21 | 2003-06-10 | Optiscan Biomedical Corporation | Method and apparatus for adjusting signal variation of an electronically controlled infrared transmissive window |
| US6862534B2 (en)* | 2001-12-14 | 2005-03-01 | Optiscan Biomedical Corporation | Method of determining an analyte concentration in a sample from an absorption spectrum |
| US7009180B2 (en)* | 2001-12-14 | 2006-03-07 | Optiscan Biomedical Corp. | Pathlength-independent methods for optically determining material composition |
| EP1528890A1 (en) | 2002-08-14 | 2005-05-11 | Optiscan Biomedical Corporation | Device and method for in vitro determination of analyte concentrations within body fluids |
| US7908324B2 (en)* | 2002-10-02 | 2011-03-15 | Disney Enterprises, Inc. | Multi-user interactive communication network environment |
| US7233817B2 (en)* | 2002-11-01 | 2007-06-19 | Brian Yen | Apparatus and method for pattern delivery of radiation and biological characteristic analysis |
| US6983177B2 (en)* | 2003-01-06 | 2006-01-03 | Optiscan Biomedical Corporation | Layered spectroscopic sample element with microporous membrane |
| US20040132167A1 (en)* | 2003-01-06 | 2004-07-08 | Peter Rule | Cartridge lance |
| US20040132168A1 (en) | 2003-01-06 | 2004-07-08 | Peter Rule | Sample element for reagentless whole blood glucose meter |
| US7271912B2 (en) | 2003-04-15 | 2007-09-18 | Optiscan Biomedical Corporation | Method of determining analyte concentration in a sample using infrared transmission data |
| US20050043630A1 (en)* | 2003-08-21 | 2005-02-24 | Buchert Janusz Michal | Thermal Emission Non-Invasive Analyte Monitor |
| US7132657B2 (en)* | 2004-02-09 | 2006-11-07 | Sensor Electronics Corporation | Infrared gas detector |
| US8251907B2 (en) | 2005-02-14 | 2012-08-28 | Optiscan Biomedical Corporation | System and method for determining a treatment dose for a patient |
| US20070103678A1 (en)* | 2005-02-14 | 2007-05-10 | Sterling Bernhard B | Analyte detection system with interferent identification and correction |
| US20060189925A1 (en)* | 2005-02-14 | 2006-08-24 | Gable Jennifer H | Methods and apparatus for extracting and analyzing a component of a bodily fluid |
| WO2008030218A2 (en)* | 2005-07-27 | 2008-03-13 | L-3 Communications Cyterra Corporation | Energetic material detector |
| US8292496B1 (en) | 2005-07-27 | 2012-10-23 | L-3 Communications Cyterra Corporation | Energetic material detector |
| EP2243425B1 (en) | 2005-11-30 | 2014-08-13 | Toshiba Medical Systems Corporation | Method for noninvasive measurement of glucose and apparatus for noninvasive measurement of glucose |
| US7729734B2 (en)* | 2006-03-07 | 2010-06-01 | Andreas Mandelis | Non-invasive biothermophotonic sensor for blood glucose monitoring |
| EP2095096A4 (en)* | 2006-12-22 | 2010-12-01 | L3 Communications Cyterra Corp | Energetic material detector |
| AT504436B8 (en)* | 2007-03-01 | 2008-09-15 | Anton Paar Gmbh | METHOD AND DEVICE FOR DETERMINING THE ALCOHOLIC STRENGTH OF LIQUIDS |
| US20090018414A1 (en)* | 2007-03-23 | 2009-01-15 | Mehrdad Toofan | Subcutanous Blood Vessels Imaging System |
| JP5303851B2 (en)* | 2007-04-03 | 2013-10-02 | 株式会社島津製作所 | Alcohol detection device |
| US8417311B2 (en) | 2008-09-12 | 2013-04-09 | Optiscan Biomedical Corporation | Fluid component analysis system and method for glucose monitoring and control |
| US8597190B2 (en) | 2007-05-18 | 2013-12-03 | Optiscan Biomedical Corporation | Monitoring systems and methods with fast initialization |
| CA2702116C (en) | 2007-10-10 | 2021-01-05 | Optiscan Biomedical Corporation | Fluid component analysis system and method for glucose monitoring and control |
| WO2009049245A1 (en)* | 2007-10-11 | 2009-04-16 | Optiscan Biomedical Corporation | Synchronization and configuration of patient monitoring devices |
| US20110004080A1 (en) | 2008-04-11 | 2011-01-06 | Glucovista, Llc | Method for non-invasive analysis of a substance concentration within a body |
| US9681832B2 (en)* | 2008-04-11 | 2017-06-20 | Glucovista Inc. | Measurement apparatuses and methods using a combined substance cooling device |
| US7959598B2 (en) | 2008-08-20 | 2011-06-14 | Asante Solutions, Inc. | Infusion pump systems and methods |
| US20100112614A1 (en)* | 2008-11-06 | 2010-05-06 | Physical Logic Ag | Coupled Antenna Impedance Spectroscopy |
| CN102238902A (en)* | 2008-12-05 | 2011-11-09 | 皇家飞利浦电子股份有限公司 | Apparatus, system and method for combined optical and thermal imaging detection of joint condition |
| US10475529B2 (en) | 2011-07-19 | 2019-11-12 | Optiscan Biomedical Corporation | Method and apparatus for analyte measurements using calibration sets |
| US8649835B2 (en)* | 2009-11-17 | 2014-02-11 | Andreas Mandelis | Method of performing wavelength modulated differential laser photothermal radiometry with high sensitivity |
| DE102010000701A1 (en)* | 2010-01-06 | 2011-07-07 | Ford Global Technologies, LLC, Mich. | Method and device for estimating the temperature felt when touching a surface |
| US20130226603A1 (en)* | 2010-12-31 | 2013-08-29 | Stephen Suffin | Delivery of Medical Services Based on Observed Parametric Variation in Analyte Values |
| US8945936B2 (en) | 2011-04-06 | 2015-02-03 | Fresenius Medical Care Holdings, Inc. | Measuring chemical properties of a sample fluid in dialysis systems |
| US9561324B2 (en) | 2013-07-19 | 2017-02-07 | Bigfoot Biomedical, Inc. | Infusion pump system and method |
| GB2523989B (en) | 2014-01-30 | 2020-07-29 | Insulet Netherlands B V | Therapeutic product delivery system and method of pairing |
| CN106488742B (en)* | 2014-06-19 | 2020-11-13 | 格鲁科威斯塔公司 | Substance concentration monitoring apparatus and method |
| US10588552B2 (en) | 2014-06-19 | 2020-03-17 | Glucovista Inc. | Substance concentration analysis methods and apparatuses |
| WO2016054079A1 (en) | 2014-09-29 | 2016-04-07 | Zyomed Corp. | Systems and methods for blood glucose and other analyte detection and measurement using collision computing |
| JP2018505756A (en) | 2015-02-18 | 2018-03-01 | インシュレット コーポレイション | Fluid delivery and infusion device and method of use thereof |
| US10139407B2 (en) | 2016-04-11 | 2018-11-27 | Universiteit Maastricht | Methods for detecting bacteria using polymer materials |
| CN108369197B (en)* | 2015-11-16 | 2020-09-15 | 马斯特里赫特大学 | Apparatus and method for detecting analytes using thermal waves |
| EP3374905A1 (en) | 2016-01-13 | 2018-09-19 | Bigfoot Biomedical, Inc. | User interface for diabetes management system |
| HK1256995A1 (en) | 2016-01-14 | 2019-10-11 | Bigfoot Biomedical, Inc. | Occlusion resolution in medication delivery devices, systems, and methods |
| US10806859B2 (en) | 2016-01-14 | 2020-10-20 | Bigfoot Biomedical, Inc. | Adjusting insulin delivery rates |
| US9554738B1 (en) | 2016-03-30 | 2017-01-31 | Zyomed Corp. | Spectroscopic tomography systems and methods for noninvasive detection and measurement of analytes using collision computing |
| US10324087B2 (en) | 2016-04-11 | 2019-06-18 | Universiteit Maastricht | Thermocouples comprising a polymer for detecting analytes and related methods |
| US12383166B2 (en) | 2016-05-23 | 2025-08-12 | Insulet Corporation | Insulin delivery system and methods with risk-based set points |
| US10765807B2 (en) | 2016-09-23 | 2020-09-08 | Insulet Corporation | Fluid delivery device with sensor |
| EP3500161A4 (en) | 2016-12-12 | 2020-01-08 | Bigfoot Biomedical, Inc. | ALARMS AND WARNINGS FOR MEDICINE DELIVERY DEVICES AND RELATED SYSTEMS AND METHODS |
| US10758675B2 (en) | 2017-01-13 | 2020-09-01 | Bigfoot Biomedical, Inc. | System and method for adjusting insulin delivery |
| US10500334B2 (en) | 2017-01-13 | 2019-12-10 | Bigfoot Biomedical, Inc. | System and method for adjusting insulin delivery |
| EP3568859A1 (en) | 2017-01-13 | 2019-11-20 | Bigfoot Biomedical, Inc. | Insulin delivery methods, systems and devices |
| US10881792B2 (en) | 2017-01-13 | 2021-01-05 | Bigfoot Biomedical, Inc. | System and method for adjusting insulin delivery |
| US20180271417A1 (en)* | 2017-03-21 | 2018-09-27 | Wipro Limited | Method and a device for non-invasive monitoring of a blood glucose level of a user |
| USD928199S1 (en) | 2018-04-02 | 2021-08-17 | Bigfoot Biomedical, Inc. | Medication delivery device with icons |
| EP4492399A3 (en) | 2018-05-04 | 2025-03-26 | Insulet Corporation | Safety constraints for a control algorithm-based drug delivery system |
| WO2020069406A1 (en) | 2018-09-28 | 2020-04-02 | Insulet Corporation | Activity mode for artificial pancreas system |
| US11565039B2 (en) | 2018-10-11 | 2023-01-31 | Insulet Corporation | Event detection for drug delivery system |
| KR102669993B1 (en)* | 2018-10-17 | 2024-05-27 | 삼성전자주식회사 | Apparatus and method for processing spectrum according to change of object temperature |
| USD920343S1 (en) | 2019-01-09 | 2021-05-25 | Bigfoot Biomedical, Inc. | Display screen or portion thereof with graphical user interface associated with insulin delivery |
| US11801344B2 (en) | 2019-09-13 | 2023-10-31 | Insulet Corporation | Blood glucose rate of change modulation of meal and correction insulin bolus quantity |
| US11935637B2 (en) | 2019-09-27 | 2024-03-19 | Insulet Corporation | Onboarding and total daily insulin adaptivity |
| EP4354455A3 (en) | 2019-12-06 | 2024-07-10 | Insulet Corporation | Techniques and devices providing adaptivity and personalization in diabetes treatment |
| US11833329B2 (en) | 2019-12-20 | 2023-12-05 | Insulet Corporation | Techniques for improved automatic drug delivery performance using delivery tendencies from past delivery history and use patterns |
| AU2021206190A1 (en) | 2020-01-06 | 2022-08-18 | Insulet Corporation | Prediction of meal and/or exercise events based on persistent residuals |
| WO2021158580A1 (en) | 2020-02-03 | 2021-08-12 | Insulet Corporation | Use of fuzzy logic in predicting user behavior affecting blood glucose concentration |
| US11551802B2 (en) | 2020-02-11 | 2023-01-10 | Insulet Corporation | Early meal detection and calorie intake detection |
| US11547800B2 (en) | 2020-02-12 | 2023-01-10 | Insulet Corporation | User parameter dependent cost function for personalized reduction of hypoglycemia and/or hyperglycemia in a closed loop artificial pancreas system |
| US11986630B2 (en) | 2020-02-12 | 2024-05-21 | Insulet Corporation | Dual hormone delivery system for reducing impending hypoglycemia and/or hyperglycemia risk |
| US11324889B2 (en) | 2020-02-14 | 2022-05-10 | Insulet Corporation | Compensation for missing readings from a glucose monitor in an automated insulin delivery system |
| US11607493B2 (en) | 2020-04-06 | 2023-03-21 | Insulet Corporation | Initial total daily insulin setting for user onboarding |
| WO2022020197A1 (en) | 2020-07-22 | 2022-01-27 | Insulet Corporation | Open-loop insulin delivery basal parameters based on insulin delivery records |
| US11684716B2 (en) | 2020-07-31 | 2023-06-27 | Insulet Corporation | Techniques to reduce risk of occlusions in drug delivery systems |
| US10952655B1 (en)* | 2020-09-21 | 2021-03-23 | The Florida International University Board Of Trustees | Retinal blood vessel oximetry using retinal auofluorescence |
| WO2022072618A1 (en) | 2020-09-30 | 2022-04-07 | Insulet Corporation | Secure wireless communications between a glucose monitor and other devices |
| EP4221785A1 (en) | 2020-09-30 | 2023-08-09 | Insulet Corporation | Drug delivery device with integrated optical-based glucose monitor |
| US11160925B1 (en) | 2021-01-29 | 2021-11-02 | Insulet Corporation | Automatic drug delivery system for delivery of a GLP-1 therapeutic |
| EP4305636A1 (en) | 2021-03-10 | 2024-01-17 | Insulet Corporation | A medicament delivery device with an adjustable and piecewise analyte level cost component to address persistent positive analyte level excursions |
| US11904140B2 (en) | 2021-03-10 | 2024-02-20 | Insulet Corporation | Adaptable asymmetric medicament cost component in a control system for medicament delivery |
| EP4101482A1 (en) | 2021-06-07 | 2022-12-14 | Insulet Corporation | Exercise safety prediction based on physiological conditions |
| US11738144B2 (en) | 2021-09-27 | 2023-08-29 | Insulet Corporation | Techniques enabling adaptation of parameters in aid systems by user input |
| US11439754B1 (en) | 2021-12-01 | 2022-09-13 | Insulet Corporation | Optimizing embedded formulations for drug delivery |
| US12097355B2 (en) | 2023-01-06 | 2024-09-24 | Insulet Corporation | Automatically or manually initiated meal bolus delivery with subsequent automatic safety constraint relaxation |
Citations (46)
| Publication number | Priority date | Publication date | Assignee | Title |
|---|---|---|---|---|
| US3958560A (en) | 1974-11-25 | 1976-05-25 | Wayne Front March | Non-invasive automatic glucose sensor system |
| CH612271A5 (en) | 1976-02-20 | 1979-07-13 | Kaiser Nils | |
| US4429999A (en) | 1981-06-22 | 1984-02-07 | Bimberg Dieter H | Method for calorimetric absorption spectroscopy and device for working the method |
| US4655225A (en) | 1985-04-18 | 1987-04-07 | Kurabo Industries Ltd. | Spectrophotometric method and apparatus for the non-invasive |
| US4926867A (en) | 1986-05-27 | 1990-05-22 | Sumitomo Electric Industries, Ltd. | Light-reflecting and heating type oximeter |
| US5009230A (en) | 1988-05-31 | 1991-04-23 | Eol, Inc. | Personal glucose monitor |
| US5040539A (en) | 1989-05-12 | 1991-08-20 | The United States Of America | Pulse oximeter for diagnosis of dental pulp pathology |
| WO1991015992A1 (en) | 1990-04-19 | 1991-10-31 | Worcester Polytechnic Institute | Method and apparatus for measuring the concentration of absorbing substances |
| US5070242A (en) | 1989-01-13 | 1991-12-03 | Iowa State University Research Foundation, Inc. | Apparatus and method for transient thermal infrared spectrometry |
| US5122974A (en) | 1989-02-06 | 1992-06-16 | Nim, Inc. | Phase modulated spectrophotometry |
| WO1992010131A1 (en) | 1990-12-14 | 1992-06-25 | Georgia Tech Research Corporation | Non-invasive blood glucose measurement system |
| US5137023A (en) | 1990-04-19 | 1992-08-11 | Worcester Polytechnic Institute | Method and apparatus for monitoring blood analytes noninvasively by pulsatile photoplethysmography |
| WO1993000855A1 (en) | 1991-07-03 | 1993-01-21 | Vivascan Corporation | Electromagnetic method and apparatus to measure constituents of human or animal tissue |
| US5187672A (en) | 1989-02-06 | 1993-02-16 | Nim Incorporated | Phase modulation spectroscopic system |
| US5191215A (en) | 1989-01-13 | 1993-03-02 | Iowa State University Research Foundation, Inc. | Apparatus and method for transient thermal infrared spectrometry of flowable enclosed materials |
| US5209231A (en) | 1990-11-02 | 1993-05-11 | University Of Connecticut | Optical glucose sensor apparatus and method |
| WO1993013706A2 (en) | 1992-01-17 | 1993-07-22 | The Government Of The United States Of America, As Represented By The Secretary Of The Department Of Health And Human Services | Optical method for monitoring arterial blood hematocrit |
| US5313941A (en) | 1993-01-28 | 1994-05-24 | Braig James R | Noninvasive pulsed infrared spectrophotometer |
| WO1994013199A1 (en) | 1992-12-10 | 1994-06-23 | Sunshine Medical Instruments, Inc. | Non-invasive blood glucose measurement |
| US5348003A (en) | 1992-09-03 | 1994-09-20 | Sirraya, Inc. | Method and apparatus for chemical analysis |
| US5360004A (en) | 1992-12-09 | 1994-11-01 | Diasense, Inc. | Non-invasive determination of analyte concentration using non-continuous radiation |
| US5361758A (en) | 1988-06-09 | 1994-11-08 | Cme Telemetrix Inc. | Method and device for measuring concentration levels of blood constituents non-invasively |
| US5370114A (en) | 1992-03-12 | 1994-12-06 | Wong; Jacob Y. | Non-invasive blood chemistry measurement by stimulated infrared relaxation emission |
| US5372135A (en) | 1991-12-31 | 1994-12-13 | Vivascan Corporation | Blood constituent determination based on differential spectral analysis |
| US5372136A (en) | 1990-10-06 | 1994-12-13 | Noninvasive Medical Technology Corporation | System and method for noninvasive hematocrit monitoring |
| US5383452A (en) | 1993-07-01 | 1995-01-24 | Buchert; Janusz | Method, apparatus and procedure for non-invasive monitoring blood glucose by measuring the polarization ratio of blood luminescence |
| WO1995020757A1 (en) | 1994-01-31 | 1995-08-03 | Minnesota Mining And Manufacturing Company | Method and apparatus for noninvasive prediction of hematocrit |
| US5451787A (en) | 1993-05-04 | 1995-09-19 | Westinghouse Electric Corporation | Hazardous air pollutants monitor |
| US5461229A (en) | 1994-06-06 | 1995-10-24 | Unisys Corporation | On-the-go optical spectroscopy soil analyzer |
| US5471056A (en) | 1992-09-25 | 1995-11-28 | Texaco Inc. | Airborne scanner image spectrometer |
| US5473162A (en) | 1987-10-26 | 1995-12-05 | Baylor University | Infrared emission detection of a gas |
| WO1996001075A1 (en) | 1994-07-06 | 1996-01-18 | Med Science Gmbh | Process and device for sensing heat transfer between a living body and a sensor |
| US5492118A (en) | 1993-12-16 | 1996-02-20 | Board Of Trustees Of The University Of Illinois | Determining material concentrations in tissues |
| US5515847A (en) | 1993-01-28 | 1996-05-14 | Optiscan, Inc. | Self-emission noninvasive infrared spectrophotometer |
| US5615672A (en) | 1993-01-28 | 1997-04-01 | Optiscan, Inc. | Self-emission noninvasive infrared spectrophotometer with body temperature compensation |
| US5666956A (en) | 1996-05-20 | 1997-09-16 | Buchert; Janusz Michal | Instrument and method for non-invasive monitoring of human tissue analyte by measuring the body's infrared radiation |
| US5676143A (en) | 1992-11-09 | 1997-10-14 | Boehringer Mannheim Gmbh | Apparatus for analytical determination of glucose in a biological matrix |
| US5692503A (en) | 1995-03-10 | 1997-12-02 | Kuenstner; J. Todd | Method for noninvasive (in-vivo) total hemoglobin, oxyhemogolobin, deoxyhemoglobin, carboxyhemoglobin and methemoglobin concentration determination |
| US5770454A (en) | 1994-05-19 | 1998-06-23 | Boehringer Mannheim Gmbh | Method and aparatus for determining an analyte in a biological sample |
| US5823677A (en) | 1996-03-18 | 1998-10-20 | The Board Of Trustees Of Western Michigan | Method of identifying a substance by infrared imaging |
| US5900632A (en) | 1997-03-12 | 1999-05-04 | Optiscan Biomedical Corporation | Subsurface thermal gradient spectrometry |
| WO1999055222A1 (en) | 1998-04-24 | 1999-11-04 | Lightouch Medical, Inc. | Apparatus and method for thermal tissue modulation |
| US6002953A (en) | 1998-05-06 | 1999-12-14 | Optix Lp | Non-invasive IR transmission measurement of analyte in the tympanic membrane |
| US6016435A (en) | 1996-11-26 | 2000-01-18 | Matsushita Electric Works Ltd. | Device for non-invasive determination of a glucose concentration in the blood of a subject |
| US20020026106A1 (en) | 1998-05-18 | 2002-02-28 | Abbots Laboratories | Non-invasive sensor having controllable temperature feature |
| US6580934B1 (en)* | 1999-03-10 | 2003-06-17 | Optiscan Biomedical Corporation | Method and apparatus for determining analyte concentration using phase and magnitude detection of a radiation transfer function |
Family Cites Families (15)
| Publication number | Priority date | Publication date | Assignee | Title |
|---|---|---|---|---|
| US5672875A (en)* | 1992-07-15 | 1997-09-30 | Optix Lp | Methods of minimizing scattering and improving tissue sampling in non-invasive testing and imaging |
| US5580177A (en)* | 1994-03-29 | 1996-12-03 | Hewlett-Packard Company | Printer/client network with centrally updated printer drivers and printer status monitoring |
| EP0944347B1 (en)* | 1996-07-19 | 2006-11-29 | Daedalus I, LLC | Device for noninvasive determination of blood parameters |
| JPH1051065A (en)* | 1996-08-02 | 1998-02-20 | Matsushita Electron Corp | Semiconductor laser device |
| JP3226854B2 (en)* | 1997-10-24 | 2001-11-05 | 日本電気株式会社 | Semiconductor laser module |
| US6606162B1 (en)* | 1999-07-21 | 2003-08-12 | Hewlett-Packard Development Company, L.P. | Network printer groups |
| US6915337B1 (en)* | 2000-03-07 | 2005-07-05 | Ricoh Co. Ltd. | Method and system for updating the device driver of a business office appliance |
| US6886111B1 (en)* | 2000-03-08 | 2005-04-26 | International Business Machines Corporation | Method and data processing system for software testing of a device driver |
| US20020067504A1 (en)* | 2000-12-06 | 2002-06-06 | Xerox Corporation | Method and apparatus for automatic upgrade of a product's printer driver |
| US20030110412A1 (en)* | 2001-06-19 | 2003-06-12 | Xerox Corporation | System and method for automated printer diagnostics |
| JP2003308215A (en)* | 2002-02-14 | 2003-10-31 | Canon Inc | Information processing apparatus, control method, control program |
| ITMN20020012A1 (en)* | 2002-04-04 | 2003-10-06 | Amfag Spa | TAP WITH REMOVABLE DISPENSER |
| US20040227973A1 (en)* | 2002-04-04 | 2004-11-18 | Taylor Jarrett D. | System and method for distributing printer properties on a computer network |
| US7146542B2 (en)* | 2002-12-20 | 2006-12-05 | Hewlett-Packard Development Company, L.P. | Method and apparatus for diagnosis and repair of computer devices and device drivers |
| US7457831B2 (en)* | 2003-03-31 | 2008-11-25 | Microsoft Corporation | Peripheral device driver maintenance scheme for networked peripheral device clients |
- 1999
- 1999-03-10USUS09/267,121patent/US6161028A/ennot_activeExpired - Fee Related
- 2000
- 2000-03-10EPEP00913890Apatent/EP1158894A1/ennot_activeWithdrawn
- 2000-03-10JPJP2000603579Apatent/JP2002537931A/enactivePending
- 2000-03-10CACA000000006Apatent/CA2362780A1/ennot_activeAbandoned
- 2000-03-10AUAU35250/00Apatent/AU3525000A/ennot_activeAbandoned
- 2000-03-10WOPCT/US2000/006348patent/WO2000053086A1/ennot_activeApplication Discontinuation
- 2000-03-30USUS09/538,164patent/US6580934B1/ennot_activeExpired - Fee Related
- 2000-09-15USUS09/663,071patent/US6556850B1/ennot_activeExpired - Fee Related
- 2000-09-15USUS09/663,114patent/US6577885B1/ennot_activeExpired - Fee Related
- 2003
- 2003-02-27USUS10/377,020patent/US20040034291A1/ennot_activeAbandoned
- 2003-04-28USUS10/426,160patent/US7006857B2/ennot_activeExpired - Fee Related
- 2003-06-06USUS10/456,109patent/US6944486B2/ennot_activeExpired - Fee Related
Patent Citations (48)
| Publication number | Priority date | Publication date | Assignee | Title |
|---|---|---|---|---|
| US3958560A (en) | 1974-11-25 | 1976-05-25 | Wayne Front March | Non-invasive automatic glucose sensor system |
| CH612271A5 (en) | 1976-02-20 | 1979-07-13 | Kaiser Nils | |
| US4429999A (en) | 1981-06-22 | 1984-02-07 | Bimberg Dieter H | Method for calorimetric absorption spectroscopy and device for working the method |
| US4655225A (en) | 1985-04-18 | 1987-04-07 | Kurabo Industries Ltd. | Spectrophotometric method and apparatus for the non-invasive |
| US4926867A (en) | 1986-05-27 | 1990-05-22 | Sumitomo Electric Industries, Ltd. | Light-reflecting and heating type oximeter |
| US5473162A (en) | 1987-10-26 | 1995-12-05 | Baylor University | Infrared emission detection of a gas |
| US5009230A (en) | 1988-05-31 | 1991-04-23 | Eol, Inc. | Personal glucose monitor |
| US5361758A (en) | 1988-06-09 | 1994-11-08 | Cme Telemetrix Inc. | Method and device for measuring concentration levels of blood constituents non-invasively |
| US5191215A (en) | 1989-01-13 | 1993-03-02 | Iowa State University Research Foundation, Inc. | Apparatus and method for transient thermal infrared spectrometry of flowable enclosed materials |
| US5075552A (en) | 1989-01-13 | 1991-12-24 | Iowa State University Research Foundation Inc. | Apparatus and method for transient thermal infrared emission spectrometry |
| US5070242A (en) | 1989-01-13 | 1991-12-03 | Iowa State University Research Foundation, Inc. | Apparatus and method for transient thermal infrared spectrometry |
| US5122974A (en) | 1989-02-06 | 1992-06-16 | Nim, Inc. | Phase modulated spectrophotometry |
| US5187672A (en) | 1989-02-06 | 1993-02-16 | Nim Incorporated | Phase modulation spectroscopic system |
| US5040539A (en) | 1989-05-12 | 1991-08-20 | The United States Of America | Pulse oximeter for diagnosis of dental pulp pathology |
| US5137023A (en) | 1990-04-19 | 1992-08-11 | Worcester Polytechnic Institute | Method and apparatus for monitoring blood analytes noninvasively by pulsatile photoplethysmography |
| WO1991015992A1 (en) | 1990-04-19 | 1991-10-31 | Worcester Polytechnic Institute | Method and apparatus for measuring the concentration of absorbing substances |
| US5372136A (en) | 1990-10-06 | 1994-12-13 | Noninvasive Medical Technology Corporation | System and method for noninvasive hematocrit monitoring |
| US5209231A (en) | 1990-11-02 | 1993-05-11 | University Of Connecticut | Optical glucose sensor apparatus and method |
| WO1992010131A1 (en) | 1990-12-14 | 1992-06-25 | Georgia Tech Research Corporation | Non-invasive blood glucose measurement system |
| WO1993000855A1 (en) | 1991-07-03 | 1993-01-21 | Vivascan Corporation | Electromagnetic method and apparatus to measure constituents of human or animal tissue |
| US5372135A (en) | 1991-12-31 | 1994-12-13 | Vivascan Corporation | Blood constituent determination based on differential spectral analysis |
| WO1993013706A2 (en) | 1992-01-17 | 1993-07-22 | The Government Of The United States Of America, As Represented By The Secretary Of The Department Of Health And Human Services | Optical method for monitoring arterial blood hematocrit |
| US5370114A (en) | 1992-03-12 | 1994-12-06 | Wong; Jacob Y. | Non-invasive blood chemistry measurement by stimulated infrared relaxation emission |
| US5348003A (en) | 1992-09-03 | 1994-09-20 | Sirraya, Inc. | Method and apparatus for chemical analysis |
| US5471056A (en) | 1992-09-25 | 1995-11-28 | Texaco Inc. | Airborne scanner image spectrometer |
| US5676143A (en) | 1992-11-09 | 1997-10-14 | Boehringer Mannheim Gmbh | Apparatus for analytical determination of glucose in a biological matrix |
| US5360004A (en) | 1992-12-09 | 1994-11-01 | Diasense, Inc. | Non-invasive determination of analyte concentration using non-continuous radiation |
| WO1994013199A1 (en) | 1992-12-10 | 1994-06-23 | Sunshine Medical Instruments, Inc. | Non-invasive blood glucose measurement |
| US5515847A (en) | 1993-01-28 | 1996-05-14 | Optiscan, Inc. | Self-emission noninvasive infrared spectrophotometer |
| US5313941A (en) | 1993-01-28 | 1994-05-24 | Braig James R | Noninvasive pulsed infrared spectrophotometer |
| US5615672A (en) | 1993-01-28 | 1997-04-01 | Optiscan, Inc. | Self-emission noninvasive infrared spectrophotometer with body temperature compensation |
| US5451787A (en) | 1993-05-04 | 1995-09-19 | Westinghouse Electric Corporation | Hazardous air pollutants monitor |
| US5383452A (en) | 1993-07-01 | 1995-01-24 | Buchert; Janusz | Method, apparatus and procedure for non-invasive monitoring blood glucose by measuring the polarization ratio of blood luminescence |
| US5492118A (en) | 1993-12-16 | 1996-02-20 | Board Of Trustees Of The University Of Illinois | Determining material concentrations in tissues |
| WO1995020757A1 (en) | 1994-01-31 | 1995-08-03 | Minnesota Mining And Manufacturing Company | Method and apparatus for noninvasive prediction of hematocrit |
| US5755226A (en) | 1994-01-31 | 1998-05-26 | Minnesota Mining And Manufacturing Company | Method and apparatus for noninvasive prediction of hematocrit |
| US5770454A (en) | 1994-05-19 | 1998-06-23 | Boehringer Mannheim Gmbh | Method and aparatus for determining an analyte in a biological sample |
| US5461229A (en) | 1994-06-06 | 1995-10-24 | Unisys Corporation | On-the-go optical spectroscopy soil analyzer |
| WO1996001075A1 (en) | 1994-07-06 | 1996-01-18 | Med Science Gmbh | Process and device for sensing heat transfer between a living body and a sensor |
| US5692503A (en) | 1995-03-10 | 1997-12-02 | Kuenstner; J. Todd | Method for noninvasive (in-vivo) total hemoglobin, oxyhemogolobin, deoxyhemoglobin, carboxyhemoglobin and methemoglobin concentration determination |
| US5823677A (en) | 1996-03-18 | 1998-10-20 | The Board Of Trustees Of Western Michigan | Method of identifying a substance by infrared imaging |
| US5666956A (en) | 1996-05-20 | 1997-09-16 | Buchert; Janusz Michal | Instrument and method for non-invasive monitoring of human tissue analyte by measuring the body's infrared radiation |
| US6016435A (en) | 1996-11-26 | 2000-01-18 | Matsushita Electric Works Ltd. | Device for non-invasive determination of a glucose concentration in the blood of a subject |
| US5900632A (en) | 1997-03-12 | 1999-05-04 | Optiscan Biomedical Corporation | Subsurface thermal gradient spectrometry |
| WO1999055222A1 (en) | 1998-04-24 | 1999-11-04 | Lightouch Medical, Inc. | Apparatus and method for thermal tissue modulation |
| US6002953A (en) | 1998-05-06 | 1999-12-14 | Optix Lp | Non-invasive IR transmission measurement of analyte in the tympanic membrane |
| US20020026106A1 (en) | 1998-05-18 | 2002-02-28 | Abbots Laboratories | Non-invasive sensor having controllable temperature feature |
| US6580934B1 (en)* | 1999-03-10 | 2003-06-17 | Optiscan Biomedical Corporation | Method and apparatus for determining analyte concentration using phase and magnitude detection of a radiation transfer function |
Non-Patent Citations (11)
| Title |
|---|
| A.S. Glushkov, Thermoptical converter with liquid modulating medium, Sov. Tech. Phys. Lett. 5(10), p. 512 (Oct. 1979). |
| Barnes, Barnes Infrared Camera, Defense and Space Division Bames Engineering Co. Bulletin, 12-600, pp. 1-12 (May 1963). |
| Dueker et al., Germanium Nonscanned Infrared Imager, IEEE Transaction on Electron Devices, vol. ED-18, No. 11, pp. 1108-1112 (Nov. 1991). |
| F.G. Pollack, Advanced in Turbine Blade Temperature Measurements 22<SUP>nd </SUP>Int'l Instrumentation Symposium, San Diego CA, ISA ASI 76256, pp. 393-398 (May 1976). |
| Halliday et al., Fundamentals of Physics, 2<SUP>nd </SUP>Ed. 1981, pp. 358-361. |
| O. Guillois, I. Nenner, R. Papoular, & C. Reynaud, IR Emission Spectrum of Solid Materials Under Periodic Heating; Modulcated Emission Spectroscopy (MES), Applied Spectroscopy, vol. 48, No. 3, pp. 297-306 Mar., 1994). |
| R. Bowling Barnes, Thermography of the Human Body, Science, May 24, 1963, vol. 140, No. 3569, pp. 870-877. |
| Roger W. Johns & John R. McClelland, Transient Intrared Transmission Spectroscopy, Analytic Chemistry, 1990. |
| Roger W. Jones & John F. McClelland, Quantitative Analysis of Solids in Motion By Transient Infrared Emission Spectroscopy Using Hot-Gas Jet Excitation, Analytic Chemistry, 1990. |
| Roger W. Jones & John F. McClelland, Real-Time Infrared Spectroscopy of Moving Solids for On-Line Analysis, 1991. |
| Roger W. Jones & John R. McClelland, on-line analysis of solids and viscous liquids by transient infrared spectroscopy, Process Control and Quality, 1993, pp. 253-260. |
Cited By (130)
| Publication number | Priority date | Publication date | Assignee | Title |
|---|---|---|---|---|
| US7666149B2 (en) | 1997-12-04 | 2010-02-23 | Peliken Technologies, Inc. | Cassette of lancet cartridges for sampling blood |
| US8439872B2 (en) | 1998-03-30 | 2013-05-14 | Sanofi-Aventis Deutschland Gmbh | Apparatus and method for penetration with shaft having a sensor for sensing penetration depth |
| US7582063B2 (en) | 2000-11-21 | 2009-09-01 | Pelikan Technologies, Inc. | Blood testing apparatus having a rotatable cartridge with multiple lancing elements and testing means |
| US8721671B2 (en) | 2001-06-12 | 2014-05-13 | Sanofi-Aventis Deutschland Gmbh | Electric lancet actuator |
| US8162853B2 (en) | 2001-06-12 | 2012-04-24 | Pelikan Technologies, Inc. | Tissue penetration device |
| US7850622B2 (en) | 2001-06-12 | 2010-12-14 | Pelikan Technologies, Inc. | Tissue penetration device |
| US9427532B2 (en) | 2001-06-12 | 2016-08-30 | Sanofi-Aventis Deutschland Gmbh | Tissue penetration device |
| US8845550B2 (en) | 2001-06-12 | 2014-09-30 | Sanofi-Aventis Deutschland Gmbh | Tissue penetration device |
| US7841992B2 (en) | 2001-06-12 | 2010-11-30 | Pelikan Technologies, Inc. | Tissue penetration device |
| US8679033B2 (en) | 2001-06-12 | 2014-03-25 | Sanofi-Aventis Deutschland Gmbh | Tissue penetration device |
| US8641643B2 (en) | 2001-06-12 | 2014-02-04 | Sanofi-Aventis Deutschland Gmbh | Sampling module device and method |
| US8622930B2 (en) | 2001-06-12 | 2014-01-07 | Sanofi-Aventis Deutschland Gmbh | Tissue penetration device |
| US7537571B2 (en) | 2001-06-12 | 2009-05-26 | Pelikan Technologies, Inc. | Integrated blood sampling analysis system with multi-use sampling module |
| US7316700B2 (en) | 2001-06-12 | 2008-01-08 | Pelikan Technologies, Inc. | Self optimizing lancing device with adaptation means to temporal variations in cutaneous properties |
| US8382683B2 (en) | 2001-06-12 | 2013-02-26 | Sanofi-Aventis Deutschland Gmbh | Tissue penetration device |
| US9694144B2 (en) | 2001-06-12 | 2017-07-04 | Sanofi-Aventis Deutschland Gmbh | Sampling module device and method |
| US8360991B2 (en) | 2001-06-12 | 2013-01-29 | Sanofi-Aventis Deutschland Gmbh | Tissue penetration device |
| US7909775B2 (en) | 2001-06-12 | 2011-03-22 | Pelikan Technologies, Inc. | Method and apparatus for lancet launching device integrated onto a blood-sampling cartridge |
| US8343075B2 (en) | 2001-06-12 | 2013-01-01 | Sanofi-Aventis Deutschland Gmbh | Tissue penetration device |
| US8123700B2 (en) | 2001-06-12 | 2012-02-28 | Pelikan Technologies, Inc. | Method and apparatus for lancet launching device integrated onto a blood-sampling cartridge |
| US8211037B2 (en) | 2001-06-12 | 2012-07-03 | Pelikan Technologies, Inc. | Tissue penetration device |
| US8206319B2 (en) | 2001-06-12 | 2012-06-26 | Sanofi-Aventis Deutschland Gmbh | Tissue penetration device |
| US8206317B2 (en) | 2001-06-12 | 2012-06-26 | Sanofi-Aventis Deutschland Gmbh | Tissue penetration device |
| US8282577B2 (en) | 2001-06-12 | 2012-10-09 | Sanofi-Aventis Deutschland Gmbh | Method and apparatus for lancet launching device integrated onto a blood-sampling cartridge |
| US9802007B2 (en) | 2001-06-12 | 2017-10-31 | Sanofi-Aventis Deutschland Gmbh | Methods and apparatus for lancet actuation |
| US8216154B2 (en) | 2001-06-12 | 2012-07-10 | Sanofi-Aventis Deutschland Gmbh | Tissue penetration device |
| US7682318B2 (en) | 2001-06-12 | 2010-03-23 | Pelikan Technologies, Inc. | Blood sampling apparatus and method |
| US7699791B2 (en) | 2001-06-12 | 2010-04-20 | Pelikan Technologies, Inc. | Method and apparatus for improving success rate of blood yield from a fingerstick |
| US8016774B2 (en) | 2001-06-12 | 2011-09-13 | Pelikan Technologies, Inc. | Tissue penetration device |
| US7988645B2 (en) | 2001-06-12 | 2011-08-02 | Pelikan Technologies, Inc. | Self optimizing lancing device with adaptation means to temporal variations in cutaneous properties |
| US7981055B2 (en) | 2001-06-12 | 2011-07-19 | Pelikan Technologies, Inc. | Tissue penetration device |
| US7344894B2 (en) | 2001-10-16 | 2008-03-18 | Agilent Technologies, Inc. | Thermal regulation of fluidic samples within a diagnostic cartridge |
| US9560993B2 (en) | 2001-11-21 | 2017-02-07 | Sanofi-Aventis Deutschland Gmbh | Blood testing apparatus having a rotatable cartridge with multiple lancing elements and testing means |
| US8197423B2 (en) | 2002-04-19 | 2012-06-12 | Pelikan Technologies, Inc. | Method and apparatus for penetrating tissue |
| US7563232B2 (en) | 2002-04-19 | 2009-07-21 | Pelikan Technologies, Inc. | Method and apparatus for penetrating tissue |
| US7833171B2 (en) | 2002-04-19 | 2010-11-16 | Pelikan Technologies, Inc. | Method and apparatus for penetrating tissue |
| US9839386B2 (en) | 2002-04-19 | 2017-12-12 | Sanofi-Aventis Deustschland Gmbh | Body fluid sampling device with capacitive sensor |
| US7862520B2 (en) | 2002-04-19 | 2011-01-04 | Pelikan Technologies, Inc. | Body fluid sampling module with a continuous compression tissue interface surface |
| US7874994B2 (en) | 2002-04-19 | 2011-01-25 | Pelikan Technologies, Inc. | Method and apparatus for penetrating tissue |
| US7892183B2 (en) | 2002-04-19 | 2011-02-22 | Pelikan Technologies, Inc. | Method and apparatus for body fluid sampling and analyte sensing |
| US7901362B2 (en) | 2002-04-19 | 2011-03-08 | Pelikan Technologies, Inc. | Method and apparatus for penetrating tissue |
| US7909778B2 (en) | 2002-04-19 | 2011-03-22 | Pelikan Technologies, Inc. | Method and apparatus for penetrating tissue |
| US7909774B2 (en) | 2002-04-19 | 2011-03-22 | Pelikan Technologies, Inc. | Method and apparatus for penetrating tissue |
| US7297151B2 (en) | 2002-04-19 | 2007-11-20 | Elikan Technologies, Inc. | Method and apparatus for body fluid sampling with improved sensing |
| US7909777B2 (en) | 2002-04-19 | 2011-03-22 | Pelikan Technologies, Inc | Method and apparatus for penetrating tissue |
| US7914465B2 (en) | 2002-04-19 | 2011-03-29 | Pelikan Technologies, Inc. | Method and apparatus for penetrating tissue |
| US7938787B2 (en) | 2002-04-19 | 2011-05-10 | Pelikan Technologies, Inc. | Method and apparatus for penetrating tissue |
| US7959582B2 (en) | 2002-04-19 | 2011-06-14 | Pelikan Technologies, Inc. | Method and apparatus for penetrating tissue |
| US7976476B2 (en) | 2002-04-19 | 2011-07-12 | Pelikan Technologies, Inc. | Device and method for variable speed lancet |
| US7731729B2 (en) | 2002-04-19 | 2010-06-08 | Pelikan Technologies, Inc. | Method and apparatus for penetrating tissue |
| US7981056B2 (en) | 2002-04-19 | 2011-07-19 | Pelikan Technologies, Inc. | Methods and apparatus for lancet actuation |
| US7717863B2 (en) | 2002-04-19 | 2010-05-18 | Pelikan Technologies, Inc. | Method and apparatus for penetrating tissue |
| US7988644B2 (en) | 2002-04-19 | 2011-08-02 | Pelikan Technologies, Inc. | Method and apparatus for a multi-use body fluid sampling device with sterility barrier release |
| US8007446B2 (en) | 2002-04-19 | 2011-08-30 | Pelikan Technologies, Inc. | Method and apparatus for penetrating tissue |
| US7713214B2 (en) | 2002-04-19 | 2010-05-11 | Pelikan Technologies, Inc. | Method and apparatus for a multi-use body fluid sampling device with optical analyte sensing |
| US9795334B2 (en) | 2002-04-19 | 2017-10-24 | Sanofi-Aventis Deutschland Gmbh | Method and apparatus for penetrating tissue |
| US8062231B2 (en) | 2002-04-19 | 2011-11-22 | Pelikan Technologies, Inc. | Method and apparatus for penetrating tissue |
| US8079960B2 (en) | 2002-04-19 | 2011-12-20 | Pelikan Technologies, Inc. | Methods and apparatus for lancet actuation |
| US9724021B2 (en) | 2002-04-19 | 2017-08-08 | Sanofi-Aventis Deutschland Gmbh | Method and apparatus for penetrating tissue |
| US7674232B2 (en) | 2002-04-19 | 2010-03-09 | Pelikan Technologies, Inc. | Method and apparatus for penetrating tissue |
| US7344507B2 (en) | 2002-04-19 | 2008-03-18 | Pelikan Technologies, Inc. | Method and apparatus for lancet actuation |
| US7648468B2 (en) | 2002-04-19 | 2010-01-19 | Pelikon Technologies, Inc. | Method and apparatus for penetrating tissue |
| US9498160B2 (en) | 2002-04-19 | 2016-11-22 | Sanofi-Aventis Deutschland Gmbh | Method for penetrating tissue |
| US8197421B2 (en) | 2002-04-19 | 2012-06-12 | Pelikan Technologies, Inc. | Method and apparatus for penetrating tissue |
| US7374544B2 (en) | 2002-04-19 | 2008-05-20 | Pelikan Technologies, Inc. | Method and apparatus for penetrating tissue |
| US8202231B2 (en) | 2002-04-19 | 2012-06-19 | Sanofi-Aventis Deutschland Gmbh | Method and apparatus for penetrating tissue |
| US9314194B2 (en) | 2002-04-19 | 2016-04-19 | Sanofi-Aventis Deutschland Gmbh | Tissue penetration device |
| US9248267B2 (en) | 2002-04-19 | 2016-02-02 | Sanofi-Aventis Deustchland Gmbh | Tissue penetration device |
| US9226699B2 (en) | 2002-04-19 | 2016-01-05 | Sanofi-Aventis Deutschland Gmbh | Body fluid sampling module with a continuous compression tissue interface surface |
| US9186468B2 (en) | 2002-04-19 | 2015-11-17 | Sanofi-Aventis Deutschland Gmbh | Method and apparatus for penetrating tissue |
| US8221334B2 (en) | 2002-04-19 | 2012-07-17 | Sanofi-Aventis Deutschland Gmbh | Method and apparatus for penetrating tissue |
| US9089294B2 (en) | 2002-04-19 | 2015-07-28 | Sanofi-Aventis Deutschland Gmbh | Analyte measurement device with a single shot actuator |
| US9089678B2 (en) | 2002-04-19 | 2015-07-28 | Sanofi-Aventis Deutschland Gmbh | Method and apparatus for penetrating tissue |
| US8267870B2 (en) | 2002-04-19 | 2012-09-18 | Sanofi-Aventis Deutschland Gmbh | Method and apparatus for body fluid sampling with hybrid actuation |
| US9072842B2 (en) | 2002-04-19 | 2015-07-07 | Sanofi-Aventis Deutschland Gmbh | Method and apparatus for penetrating tissue |
| US8905945B2 (en) | 2002-04-19 | 2014-12-09 | Dominique M. Freeman | Method and apparatus for penetrating tissue |
| US7410468B2 (en) | 2002-04-19 | 2008-08-12 | Pelikan Technologies, Inc. | Method and apparatus for penetrating tissue |
| US8333710B2 (en) | 2002-04-19 | 2012-12-18 | Sanofi-Aventis Deutschland Gmbh | Tissue penetration device |
| US8337420B2 (en) | 2002-04-19 | 2012-12-25 | Sanofi-Aventis Deutschland Gmbh | Tissue penetration device |
| US8337419B2 (en) | 2002-04-19 | 2012-12-25 | Sanofi-Aventis Deutschland Gmbh | Tissue penetration device |
| US8690796B2 (en) | 2002-04-19 | 2014-04-08 | Sanofi-Aventis Deutschland Gmbh | Method and apparatus for penetrating tissue |
| US7582099B2 (en) | 2002-04-19 | 2009-09-01 | Pelikan Technologies, Inc | Method and apparatus for penetrating tissue |
| US7481776B2 (en) | 2002-04-19 | 2009-01-27 | Pelikan Technologies, Inc. | Method and apparatus for penetrating tissue |
| US8382682B2 (en) | 2002-04-19 | 2013-02-26 | Sanofi-Aventis Deutschland Gmbh | Method and apparatus for penetrating tissue |
| US8388551B2 (en) | 2002-04-19 | 2013-03-05 | Sanofi-Aventis Deutschland Gmbh | Method and apparatus for multi-use body fluid sampling device with sterility barrier release |
| US8403864B2 (en) | 2002-04-19 | 2013-03-26 | Sanofi-Aventis Deutschland Gmbh | Method and apparatus for penetrating tissue |
| US8414503B2 (en) | 2002-04-19 | 2013-04-09 | Sanofi-Aventis Deutschland Gmbh | Methods and apparatus for lancet actuation |
| US8430828B2 (en) | 2002-04-19 | 2013-04-30 | Sanofi-Aventis Deutschland Gmbh | Method and apparatus for a multi-use body fluid sampling device with sterility barrier release |
| US8435190B2 (en) | 2002-04-19 | 2013-05-07 | Sanofi-Aventis Deutschland Gmbh | Method and apparatus for penetrating tissue |
| US7547287B2 (en) | 2002-04-19 | 2009-06-16 | Pelikan Technologies, Inc. | Method and apparatus for penetrating tissue |
| US8579831B2 (en) | 2002-04-19 | 2013-11-12 | Sanofi-Aventis Deutschland Gmbh | Method and apparatus for penetrating tissue |
| US7524293B2 (en) | 2002-04-19 | 2009-04-28 | Pelikan Technologies, Inc. | Method and apparatus for penetrating tissue |
| US7491178B2 (en) | 2002-04-19 | 2009-02-17 | Pelikan Technologies, Inc. | Method and apparatus for penetrating tissue |
| US9034639B2 (en) | 2002-12-30 | 2015-05-19 | Sanofi-Aventis Deutschland Gmbh | Method and apparatus using optical techniques to measure analyte levels |
| US7850621B2 (en) | 2003-06-06 | 2010-12-14 | Pelikan Technologies, Inc. | Method and apparatus for body fluid sampling and analyte sensing |
| US8251921B2 (en) | 2003-06-06 | 2012-08-28 | Sanofi-Aventis Deutschland Gmbh | Method and apparatus for body fluid sampling and analyte sensing |
| US9144401B2 (en) | 2003-06-11 | 2015-09-29 | Sanofi-Aventis Deutschland Gmbh | Low pain penetrating member |
| US10034628B2 (en) | 2003-06-11 | 2018-07-31 | Sanofi-Aventis Deutschland Gmbh | Low pain penetrating member |
| US7604592B2 (en) | 2003-06-13 | 2009-10-20 | Pelikan Technologies, Inc. | Method and apparatus for a point of care device |
| US8282576B2 (en) | 2003-09-29 | 2012-10-09 | Sanofi-Aventis Deutschland Gmbh | Method and apparatus for an improved sample capture device |
| US8945910B2 (en) | 2003-09-29 | 2015-02-03 | Sanofi-Aventis Deutschland Gmbh | Method and apparatus for an improved sample capture device |
| US9351680B2 (en) | 2003-10-14 | 2016-05-31 | Sanofi-Aventis Deutschland Gmbh | Method and apparatus for a variable user interface |
| US8668656B2 (en) | 2003-12-31 | 2014-03-11 | Sanofi-Aventis Deutschland Gmbh | Method and apparatus for improving fluidic flow and sample capture |
| US9561000B2 (en) | 2003-12-31 | 2017-02-07 | Sanofi-Aventis Deutschland Gmbh | Method and apparatus for improving fluidic flow and sample capture |
| US8296918B2 (en) | 2003-12-31 | 2012-10-30 | Sanofi-Aventis Deutschland Gmbh | Method of manufacturing a fluid sampling device with improved analyte detecting member configuration |
| US8828203B2 (en) | 2004-05-20 | 2014-09-09 | Sanofi-Aventis Deutschland Gmbh | Printable hydrogels for biosensors |
| US9261476B2 (en) | 2004-05-20 | 2016-02-16 | Sanofi Sa | Printable hydrogel for biosensors |
| US9820684B2 (en) | 2004-06-03 | 2017-11-21 | Sanofi-Aventis Deutschland Gmbh | Method and apparatus for a fluid sampling device |
| US8652831B2 (en) | 2004-12-30 | 2014-02-18 | Sanofi-Aventis Deutschland Gmbh | Method and apparatus for analyte measurement test time |
| US7822454B1 (en) | 2005-01-03 | 2010-10-26 | Pelikan Technologies, Inc. | Fluid sampling device with improved analyte detecting member configuration |
| US7630848B2 (en)* | 2005-05-25 | 2009-12-08 | Foss Analytical A/B | Analysis system and method implementing distributed processing |
| US20060271319A1 (en)* | 2005-05-25 | 2006-11-30 | Raivo Loosme | Analysis system and method |
| AU2006250020B2 (en)* | 2005-05-25 | 2010-12-09 | Foss Analytical Ab | Distributed analysis system |
| US7473898B2 (en)* | 2006-05-17 | 2009-01-06 | The Boeing Company | Cryogenic terahertz spectroscopy |
| US20070267575A1 (en)* | 2006-05-17 | 2007-11-22 | Sandor Holly | Cryogenic terahertz spectroscopy |
| US8702624B2 (en) | 2006-09-29 | 2014-04-22 | Sanofi-Aventis Deutschland Gmbh | Analyte measurement device with a single shot actuator |
| US20090247853A1 (en)* | 2008-03-31 | 2009-10-01 | Nellcor Puritan Bennett Llc | Non-Invasive Total Hemoglobin Measurement by Spectral Optical Coherence Tomography |
| US9386944B2 (en) | 2008-04-11 | 2016-07-12 | Sanofi-Aventis Deutschland Gmbh | Method and apparatus for analyte detecting device |
| US20090272906A1 (en)* | 2008-05-03 | 2009-11-05 | Luca Joseph Gratton | Method and apparatus for the identification of lithospheric or shielded material deposits by doppler-shifted response photon spectra from interrogation by ionizing radiation |
| US8193504B2 (en) | 2008-05-03 | 2012-06-05 | Luca Joseph Gratton | Method and apparatus for the identification of lithospheric or shielded material deposits by doppler-shifted response photon spectra from interrogation by ionizing radiation |
| US20100001899A1 (en)* | 2008-07-03 | 2010-01-07 | Sandor Holly | Unbalanced non-linear radar |
| US8130160B2 (en) | 2008-07-03 | 2012-03-06 | The Boeing Company | Composite dipole array assembly |
| US8106810B2 (en) | 2008-07-03 | 2012-01-31 | The Boeing Company | Millimeter wave filters |
| US8035550B2 (en) | 2008-07-03 | 2011-10-11 | The Boeing Company | Unbalanced non-linear radar |
| US20100001915A1 (en)* | 2008-07-03 | 2010-01-07 | Burns Richard H | Composite dipole array assembly |
| US9375169B2 (en) | 2009-01-30 | 2016-06-28 | Sanofi-Aventis Deutschland Gmbh | Cam drive for managing disposable penetrating member actions with a single motor and motor and control system |
| US8965476B2 (en) | 2010-04-16 | 2015-02-24 | Sanofi-Aventis Deutschland Gmbh | Tissue penetration device |
| US8235897B2 (en) | 2010-04-27 | 2012-08-07 | A.D. Integrity Applications Ltd. | Device for non-invasively measuring glucose |
| US9795747B2 (en) | 2010-06-02 | 2017-10-24 | Sanofi-Aventis Deutschland Gmbh | Methods and apparatus for lancet actuation |
| US10837902B2 (en) | 2017-08-21 | 2020-11-17 | Tokyo Electron Limited | Optical sensor for phase determination |
Also Published As
| Publication number | Publication date |
|---|---|
| US20040087841A1 (en) | 2004-05-06 |
| WO2000053086A1 (en) | 2000-09-14 |
| US6161028A (en) | 2000-12-12 |
| US20030199742A1 (en) | 2003-10-23 |
| US6580934B1 (en) | 2003-06-17 |
| CA2362780A1 (en) | 2000-09-14 |
| US6577885B1 (en) | 2003-06-10 |
| WO2000053086A9 (en) | 2001-10-25 |
| US7006857B2 (en) | 2006-02-28 |
| AU3525000A (en) | 2000-09-28 |
| US20040034291A1 (en) | 2004-02-19 |
| US6556850B1 (en) | 2003-04-29 |
| EP1158894A1 (en) | 2001-12-05 |
| JP2002537931A (en) | 2002-11-12 |
Similar Documents
| Publication | Publication Date | Title |
|---|---|---|
| US6944486B2 (en) | Method and apparatus for determining analyte concentration using phase and magnitude detection of a radiation transfer function | |
| US6025597A (en) | Non-invasive infrared absorption spectrometer for measuring glucose or other constituents in a human or other body | |
| US6662030B2 (en) | Non-invasive sensor having controllable temperature feature | |
| US6049081A (en) | Subsurface thermal gradient spectrometry | |
| CA2189754C (en) | Self-emission noninvasive infrared spectrophotometer | |
| US7167734B2 (en) | Method for optical measurements of tissue to determine disease state or concentration of an analyte | |
| JP3621699B2 (en) | Highly reliable non-invasive blood gas measurement method | |
| US6615061B1 (en) | Optical sensor having a selectable sampling distance for determination of analytes | |
| US20030108976A1 (en) | Method and apparatus for improving clinical accuracy of analyte measurements | |
| US20060167349A1 (en) | Apparatus for non-invasive determination of direction and rate of change of an analyte | |
| JP2004500155A (en) | Method and apparatus for non-invasive blood sample measurement | |
| WO1998040724A9 (en) | Subsurface thermal gradient spectrometry | |
| JP2001507457A (en) | Non-invasive infrared absorption spectrometer for temperature gradient spectra | |
| JP2005013273A (en) | Blood glucose level measuring device | |
| JP2003523793A (en) | Method of controlling the depth of light penetration into tissue and diagnostic application using the same | |
| Pleitez et al. | Infrared reflectometry of skin: Analysis of backscattered light from different skin layers | |
| Shih et al. | Introduction to spectroscopy for noninvasive glucose sensing |
Legal Events
| Date | Code | Title | Description |
|---|---|---|---|
| AS | Assignment | Owner name:OPTISCAN BIOMEDICAL CORPORATION, CALIFORNIA Free format text:ASSIGNMENT OF ASSIGNORS INTEREST;ASSIGNORS:BRAIG, JAMES R.;KRAMER, CHARLES E. PH.D.;STERLING, BERNHARD B. PH.D.;AND OTHERS;REEL/FRAME:015686/0492;SIGNING DATES FROM 20020226 TO 20020315 | |
| AS | Assignment | Owner name:HERCULES TECHNOLOGY GROWTH CAPITAL, INC., CALIFORN Free format text:PATENT COLLATERAL ASSIGNMENT;ASSIGNOR:OPTISCAN BIOMEDICAL CORPORATION;REEL/FRAME:016172/0354 Effective date:20050316 | |
| AS | Assignment | Owner name:HERCULES TECHNOLOGY II, L.P., CALIFORNIA Free format text:SECURITY AGREEMENT;ASSIGNOR:OPTISCAN BIOMEDICAL CORPORATION;REEL/FRAME:020995/0202 Effective date:20080522 Owner name:HERCULES TECHNOLOGY II, L.P.,CALIFORNIA Free format text:SECURITY AGREEMENT;ASSIGNOR:OPTISCAN BIOMEDICAL CORPORATION;REEL/FRAME:020995/0202 Effective date:20080522 | |
| REMI | Maintenance fee reminder mailed | ||
| LAPS | Lapse for failure to pay maintenance fees | ||
| STCH | Information on status: patent discontinuation | Free format text:PATENT EXPIRED DUE TO NONPAYMENT OF MAINTENANCE FEES UNDER 37 CFR 1.362 | |
| FP | Lapsed due to failure to pay maintenance fee | Effective date:20090913 | |
| AS | Assignment | Owner name:EAST WEST BANK, CALIFORNIA Free format text:SECURITY AGREEMENT;ASSIGNOR:OPTISCAN BIOMEDICAL CORPORATION;REEL/FRAME:031815/0377 Effective date:20131212 | |
| AS | Assignment | Owner name:OPTISCAN BIOMEDICAL CORPORATION, CALIFORNIA Free format text:ASSIGNMENT AND RELEASE OF SECURITY INTEREST;ASSIGNOR:HERCULES TECHNOLOGY GROWTH CAPITAL, INC.;REEL/FRAME:031847/0600 Effective date:20131213 | |
| AS | Assignment | Owner name:OPTISCAN BIOMEDICAL CORPORATION, CALIFORNIA Free format text:RELEASE BY SECURED PARTY;ASSIGNOR:HERCULES TECHNOLOGY II, L.P.;REEL/FRAME:041344/0534 Effective date:20170111 |