US6933154B2 - Optimal windows for obtaining optical data for characterization of tissue samples - Google Patents
Optimal windows for obtaining optical data for characterization of tissue samplesDownload PDFInfo
- Publication number
- US6933154B2 US6933154B2US10/295,794US29579402AUS6933154B2US 6933154 B2US6933154 B2US 6933154B2US 29579402 AUS29579402 AUS 29579402AUS 6933154 B2US6933154 B2US 6933154B2
- Authority
- US
- United States
- Prior art keywords
- tissue
- cin
- reflectance
- fluorescence
- time
- Prior art date
- Legal status (The legal status is an assumption and is not a legal conclusion. Google has not performed a legal analysis and makes no representation as to the accuracy of the status listed.)
- Expired - Fee Related, expires
Links
Images


Classifications
- G—PHYSICS
- G01—MEASURING; TESTING
- G01N—INVESTIGATING OR ANALYSING MATERIALS BY DETERMINING THEIR CHEMICAL OR PHYSICAL PROPERTIES
- G01N21/00—Investigating or analysing materials by the use of optical means, i.e. using sub-millimetre waves, infrared, visible or ultraviolet light
- G01N21/62—Systems in which the material investigated is excited whereby it emits light or causes a change in wavelength of the incident light
- G01N21/63—Systems in which the material investigated is excited whereby it emits light or causes a change in wavelength of the incident light optically excited
- G01N21/64—Fluorescence; Phosphorescence
- G01N21/6408—Fluorescence; Phosphorescence with measurement of decay time, time resolved fluorescence
- A—HUMAN NECESSITIES
- A61—MEDICAL OR VETERINARY SCIENCE; HYGIENE
- A61B—DIAGNOSIS; SURGERY; IDENTIFICATION
- A61B5/00—Measuring for diagnostic purposes; Identification of persons
- A61B5/0059—Measuring for diagnostic purposes; Identification of persons using light, e.g. diagnosis by transillumination, diascopy, fluorescence
- A—HUMAN NECESSITIES
- A61—MEDICAL OR VETERINARY SCIENCE; HYGIENE
- A61B—DIAGNOSIS; SURGERY; IDENTIFICATION
- A61B5/00—Measuring for diagnostic purposes; Identification of persons
- A61B5/72—Signal processing specially adapted for physiological signals or for diagnostic purposes
- A61B5/7235—Details of waveform analysis
- A61B5/7264—Classification of physiological signals or data, e.g. using neural networks, statistical classifiers, expert systems or fuzzy systems
- G—PHYSICS
- G01—MEASURING; TESTING
- G01N—INVESTIGATING OR ANALYSING MATERIALS BY DETERMINING THEIR CHEMICAL OR PHYSICAL PROPERTIES
- G01N21/00—Investigating or analysing materials by the use of optical means, i.e. using sub-millimetre waves, infrared, visible or ultraviolet light
- G01N21/17—Systems in which incident light is modified in accordance with the properties of the material investigated
- G01N21/25—Colour; Spectral properties, i.e. comparison of effect of material on the light at two or more different wavelengths or wavelength bands
- G01N21/31—Investigating relative effect of material at wavelengths characteristic of specific elements or molecules, e.g. atomic absorption spectrometry
- G—PHYSICS
- G01—MEASURING; TESTING
- G01N—INVESTIGATING OR ANALYSING MATERIALS BY DETERMINING THEIR CHEMICAL OR PHYSICAL PROPERTIES
- G01N21/00—Investigating or analysing materials by the use of optical means, i.e. using sub-millimetre waves, infrared, visible or ultraviolet light
- G01N21/62—Systems in which the material investigated is excited whereby it emits light or causes a change in wavelength of the incident light
- G01N21/63—Systems in which the material investigated is excited whereby it emits light or causes a change in wavelength of the incident light optically excited
- G01N21/64—Fluorescence; Phosphorescence
- G01N21/6428—Measuring fluorescence of fluorescent products of reactions or of fluorochrome labelled reactive substances, e.g. measuring quenching effects, using measuring "optrodes"
- A—HUMAN NECESSITIES
- A61—MEDICAL OR VETERINARY SCIENCE; HYGIENE
- A61B—DIAGNOSIS; SURGERY; IDENTIFICATION
- A61B5/00—Measuring for diagnostic purposes; Identification of persons
- A61B5/72—Signal processing specially adapted for physiological signals or for diagnostic purposes
- A61B5/7235—Details of waveform analysis
- A61B5/7264—Classification of physiological signals or data, e.g. using neural networks, statistical classifiers, expert systems or fuzzy systems
- A61B5/7267—Classification of physiological signals or data, e.g. using neural networks, statistical classifiers, expert systems or fuzzy systems involving training the classification device
- G—PHYSICS
- G16—INFORMATION AND COMMUNICATION TECHNOLOGY [ICT] SPECIALLY ADAPTED FOR SPECIFIC APPLICATION FIELDS
- G16H—HEALTHCARE INFORMATICS, i.e. INFORMATION AND COMMUNICATION TECHNOLOGY [ICT] SPECIALLY ADAPTED FOR THE HANDLING OR PROCESSING OF MEDICAL OR HEALTHCARE DATA
- G16H50/00—ICT specially adapted for medical diagnosis, medical simulation or medical data mining; ICT specially adapted for detecting, monitoring or modelling epidemics or pandemics
- G16H50/20—ICT specially adapted for medical diagnosis, medical simulation or medical data mining; ICT specially adapted for detecting, monitoring or modelling epidemics or pandemics for computer-aided diagnosis, e.g. based on medical expert systems
- Y—GENERAL TAGGING OF NEW TECHNOLOGICAL DEVELOPMENTS; GENERAL TAGGING OF CROSS-SECTIONAL TECHNOLOGIES SPANNING OVER SEVERAL SECTIONS OF THE IPC; TECHNICAL SUBJECTS COVERED BY FORMER USPC CROSS-REFERENCE ART COLLECTIONS [XRACs] AND DIGESTS
- Y10—TECHNICAL SUBJECTS COVERED BY FORMER USPC
- Y10S—TECHNICAL SUBJECTS COVERED BY FORMER USPC CROSS-REFERENCE ART COLLECTIONS [XRACs] AND DIGESTS
- Y10S435/00—Chemistry: molecular biology and microbiology
- Y10S435/808—Optical sensing apparatus
- Y—GENERAL TAGGING OF NEW TECHNOLOGICAL DEVELOPMENTS; GENERAL TAGGING OF CROSS-SECTIONAL TECHNOLOGIES SPANNING OVER SEVERAL SECTIONS OF THE IPC; TECHNICAL SUBJECTS COVERED BY FORMER USPC CROSS-REFERENCE ART COLLECTIONS [XRACs] AND DIGESTS
- Y10—TECHNICAL SUBJECTS COVERED BY FORMER USPC
- Y10T—TECHNICAL SUBJECTS COVERED BY FORMER US CLASSIFICATION
- Y10T436/00—Chemistry: analytical and immunological testing
- Y10T436/25—Chemistry: analytical and immunological testing including sample preparation
Definitions
- the inventionrelates generally to spectroscopic methods. More particularly, the invention relates to the diagnosis of disease in tissue using spectral analysis and/or image analysis.
- Spectral analysisis used to diagnose disease in tissue. For example, data from spectral scans performed on the tissue of a patient are used to screen tissue for disease. Some diagnostic procedures include the application of a chemical contrast agent to the tissue in order to enhance the image and/or spectral response of the tissue for diagnosis. In an acetowhitening procedure, acetic acid is used as the contrast agent. Use of a contrast agent enhances the difference between data obtained from normal tissue and data obtained from abnormal or diseased tissue.
- the inventionprovides optimal criteria for selecting spectral and/or image data from tissue that has been treated with a contrast agent for disease screening.
- a contrast agentfor disease screening.
- the sensitivity and specificity of optical diagnostic screeningis improved by obtaining optical data at optimal time points after application of a contrast agent.
- methods of the inventionprovide optimal windows in time for obtaining spectral data from tissue that has been treated with a contrast agent in order to improve the results of disease screening.
- the inventionfurther provides methods for identifying such windows in the context of any optical diagnostic screen.
- the inventionprovides methods for disease screening using kinetic data obtained across multiple diagnostic windows. Methods of the invention allow an optical diagnostic test to focus on data that will produce the highest diagnostic sensitivity and specificity with respect to the tissue being examined.
- the inventionallows the identification of specific points in time after treatment of a tissue when spectral and/or image data most accurately reflects the health of the tissue being measured.
- Time windows for observing selected spectral datamay be determined empirically or from a database of known tissue responses to optical stimulation.
- the inventioncomprises building and using classification models to characterize the state of health of an unknown tissue sample from which optical signals are obtained.
- an optical signalmay comprise a discrete or continuous electromagnetic signal or any portion thereof, or the data representing such a signal.
- optical diagnostic windowsare based upon the points at which classification models perform best.
- optimal diagnostic windows of the inventionmay be predetermined segments of time following application of a contrast agent to a tissue.
- Optimal diagnostic windowsmay also be points in time at which an optical measurement meets a predetermined threshold or falls within a predetermined range, where the optical measurement represents the change of an optical signal received from the tissue following application of a contrast agent.
- a windowmay be selected to include points in time at which the change in optical signal intensity from an initial condition is maximized.
- the optical measurement upon which a window is basedmay also reflect the rate of change in a spectral property obtained from the tissue.
- optimal windowsare determined by obtaining optical signals from reference tissue samples with known states of health at various times following application of a contrast agent.
- one embodimentcomprises obtaining a first set of optical signals from tissue samples having a known disease state, such as CIN 2/3 (grades 2 and/or 3 cervical intraepithelial neoplasia); obtaining a second set of optical signals from tissue samples having a different state of health, such as non-diseased; and categorizing each optical signal into “bins” according to the time it was obtained in relation to the time of application of contrast agent.
- the optical signalmay comprise, for example, a reflectance spectrum, a fluorescence spectrum, a video image intensity signal, or any combination of these.
- a measure of the difference between the optical signals associated with the two types of tissueis then obtained, for example, by determining a mean signal as a function of wavelength for each of the two types of tissue samples for each time bin, and using a discrimination function to determine a weighted measure of difference between the two mean optical signals obtained within a given time bin.
- Thisprovides a measure of the difference between the mean optical signals of the two categories of tissue samples—diseased and healthy—weighted by the variance between optical signals of samples within each of the two categories.
- the inventionfurther comprises developing a classification model for each time bin. After determining a measure of difference between the tissue types in each bin, an optimal window of time for differentiating between tissue types is determined by identifying at least one bin in which the measure of difference between the two tissue types is substantially maximized. For example, an optimal window of time may be chosen to include every time bin in which the respective classification model provides an accuracy of 70% or greater.
- the optimal windowdescribes a period of time following application of a contrast agent in which an optical signal can be obtained for purposes of classifying the state of health of the tissue sample with an accuracy of at least 70%.
- An analogous embodimentcomprises determining an optimal threshold or range of a measure of change of an optical signal to use in obtaining (or triggering the acquisition of) the same or a different signal for predicting the state of health of the sample.
- this embodimentincludes determining an optimal threshold of change in a signal, such as a video image whiteness intensity signal, after which an optical signal, such as a diffuse reflectance spectrum and/or a fluorescence spectrum, can be obtained to accurately characterize the state of health or other characteristic of the sample.
- An embodimentincludes monitoring reflectance and/or fluorescence at a single or multiple wavelength(s), and upon reaching a threshold change from the initial condition, obtaining a full reflectance and/or fluorescence spectrum for use in diagnosing the region of tissue.
- This methodallows for reduced data retrieval and monitoring since, in an embodiment, it involves continuous tracking of a single, partial-spectrum or discrete-wavelength “trigger” signal (instead of multiple, full-spectrum scans), followed by the acquisition of one or more spectral scans for use in diagnosis.
- the triggermay include more than one discrete-wavelength or partial-spectrum signal.
- the diagnostic data obtainedwill generally be more extensive than the trigger signal, and may include one or more complete sets of spectral data.
- the measure of change used to trigger obtaining one or more optical signals for tissue classificationmay be a weighted measure, and/or it may be a combination of measures of change of more than one signal.
- the signal(s) used for tissue classification/diagnosismay comprise one or more reflectance, fluorescence, and/or video signals.
- two reflectance signalsare obtained from the same region in order to provide a redundant signal for use when one reflectance signal is adversely affected by an artifact such as glare or shadow.
- Use of multiple types of classification signalsmay provide improved diagnostic accuracy over the use of a single type of signal.
- a reflectance, fluorescence, and a video signal from a region of a tissue sampleare all used in the classification of the region.
- an optimal threshold or range of a measure of the rate of change of an optical signalis determined. For example, the rate of change of reflectance and/or fluorescence is monitored at a single or multiple wavelength(s), and upon reaching a threshold rate of change, a full reflectance spectrum and/or fluorescence spectrum is acquired for use in diagnosing the region of tissue.
- the measure of rate of change used to trigger obtaining one or more optical signals for tissue classificationmay be a weighted measure, and/or it may be combination of measures of change of more than one signal. For example, the measured rate of change may be weighted by an initial signal intensity.
- the inventionalso provides methods of disease screening using kinetic data from optical signals obtained at various times following application of a contrast agent.
- These methodscomprise techniques for using specific features of fluorescence and diffuse reflectance spectra from reference cervical tissue samples of known states of health in order to diagnose a region of a tissue sample.
- These techniquesallow monitoring of a particular optical signal from a test sample during a specified period of time following application of contrast agent to obtain pertinent kinetic data for characterizing the sample. For example, two or more time-separated measures of video intensity, fluorescence, and/or reflectance are obtained for a test sample at times between which it is known that an increase or decrease indicative of a given state of health occurs.
- a video, reflectance, and/or fluorescence signal from a test samplemay be monitored over time to determine a time at which the signal reaches a maximum or minimum value. The time following application of contrast agent at which this minimum or maximum is reached can then be used to determine indication of a disease state in the test sample.
- data used as a baseline in determining an increase, decrease, maximum, or minimum as discussed aboveis not obtained before, but is obtained immediately following application of contrast agent to the tissue.
- the time period immediately following application of contrast agentis about ten seconds, and in another case, it is about five seconds, although other time periods are possible. This may be done to avoid error caused by movement of tissue or movement of the optical signal detection device upon application of contrast agent, particularly where such movement is not otherwise compensated for. Movement of tissue may cause error where a change from an initial condition is being monitored and the region of the tissue corresponding to the location at which the initial signal was obtained shifts following application of contrast agent.
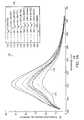
- FIG. 1Ashows a graph depicting mean fluorescence spectra before application of acetic acid and at various times following the application of acetic acid for NED tissue (no evidence of disease, confirmed by pathology).
- FIG. 1Bshows a graph depicting mean reflectance spectra before application of acetic acid and at various times following the application of acetic acid for NED tissue (no evidence of disease, confirmed by pathology).
- FIG. 2Ashows a graph depicting mean fluorescence spectra before application of acetic acid and at various times following the application of acetic acid for CIN 2/3 tissue (grades 2 and/or 3 cervical intraepithelial neoplasia).
- FIG. 2Bshows a graph depicting mean reflectance spectra before application of acetic acid and at various times following the application of acetic acid for CIN 2/3 tissue (grades 2 and/or 3 cervical intraepithelial neoplasia).
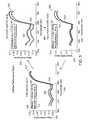
- FIG. 3Ashows a graph depicting fluorescence intensity at three different wavelengths relative to pre-AA (fluorescence before application of acetic acid) as a function of time following application of acetic acid for NED tissue.
- FIG. 3Bshows a graph depicting reflectance at three different wavelengths relative to pre-AA (reflectance before application of acetic acid) as a function of time following application of acetic acid for NED tissue.
- FIG. 3Cshows a graph depicting fluorescence intensity at three different wavelengths relative to pre-AA (fluorescence before application of acetic acid) as a function of time following application of acetic acid for CIN 2/3 tissue.
- FIG. 3Dshows a graph depicting reflectance at three different wavelengths relative to pre-AA (reflectance before application of acetic acid) as a function of time following application of acetic acid for CIN 2/3 tissue.
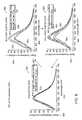
- FIG. 4Ashows a graph depicting reflectance relative to pre-AA at 425 nm as a function of time following application of acetic acid for various tissue types.
- FIG. 4Bshows a graph depicting fluorescence relative to pre-AA at 460 nm as a function of time following application of acetic acid for various tissue types.
- FIG. 5shows a series of graphs depicting mean reflectance spectra for CIN 2/3 and non-CIN 2/3 (NED and CIN 1) tissues at a time prior to application of acetic acid, at a time corresponding to maximum whitening, and at a time corresponding to the latest time at which data was obtained.
- FIG. 6shows a graph depicting the reflectance discrimination function spectra useful for differentiating between CIN 2/3 and non-CIN 2/3 (NED and CIN 1) tissues.
- FIG. 7shows a graph depicting the performance of two LDA (linear discriminant analysis) models as applied to reflectance data obtained at various times following application of acetic acid; one of the models is based on data obtained between 60 and 80 seconds following application of acetic acid, and the other model is based on data obtained between 160 and 180 seconds following application of acetic acid.
- LDAlinear discriminant analysis
- FIG. 8shows a series of graphs depicting mean fluorescence spectra for CIN 2/3 and non-CIN 2/3 (NED and CIN 1) tissues at a time prior to application of acetic acid, at a time corresponding to maximum whitening, and at a time corresponding to the latest time at which data was obtained.
- FIG. 9shows a graph depicting the fluorescence discrimination function spectra useful for differentiating between CIN 2/3 and non-CIN 2/3 (NED and CIN 1) tissues.
- FIG. 10shows a graph depicting the performance of two LDA (linear discriminant analysis) models as applied to fluorescence data obtained at various times following application of acetic acid; one of the models is based on data obtained between 60 and 80 seconds following application of acetic acid, and the other model is based on data obtained between 160 and 180 seconds following application of acetic acid.
- LDAlinear discriminant analysis
- FIG. 11shows a graph depicting the performance of three LDA models as applied to data obtained at various times following application of acetic acid.
- FIG. 12Ashows a graph depicting the determination of an optimal time window for obtaining diagnostic optical data using an optical amplitude trigger.
- FIG. 12Bshows a graph depicting the determination of an optimal time window for obtaining diagnostic data using a rate of change of mean reflectance signal trigger.
- the inventionrelates to methods for determining a characteristic of a tissue sample using spectral data and/or images obtained within an optimal window of time following the application of a chemical agent to the tissue sample.
- the inventionprovides methods of determining optimal windows of time.
- the inventionprovides methods of determining criteria, based on a spectral amplitude or rate of amplitude change, for triggering the acquisition of an optical signal for classifying tissue.
- the inventioncomprises methods of diagnosing a tissue sample using spectral data and/or images obtained within an optimal window.
- Application of the inventionallows the diagnosis of regions of a tissue sample using various features of the time response of fluorescence and/or reflectance spectra following the application of a contrast agent such as acetic acid. For example, it is possible to diagnose a region of a tissue sample by determining a time at which a minimum value of fluorescence spectral intensity is reached following application of a contrast agent.
- Methods of the inventionare also used to analyze tissue samples, including cervical tissue, colorectal tissue, gastroesophageal tissue, urinary bladder tissue, lung tissue, or other tissue containing epithelial cells.
- tissue samplesincluding cervical tissue, colorectal tissue, gastroesophageal tissue, urinary bladder tissue, lung tissue, or other tissue containing epithelial cells.
- the tissuemay be analyzed in vivo or ex vivo, for example.
- Tissue samplesare generally divided into regions, each having its own characteristic. This characteristic may be a state of health, such as intraepithelial neoplasia, mature and immature metaplasia, normal columnar epithelia, normal squamous epithelia, and cancer.
- Chemical contrast agentswhich are used in practice of the invention include acetic acid, formic acid, propionic acid, butyric acid, Lugol's iodine, Shiller's iodine, methylene blue, toluidine blue, indigo carmine, indocyanine green, fluorescein, and combinations comprising these agents.
- concentrations between about 3 volume percent and about 6 volume percent acetic acidare typical, although in some embodiments, concentrations outside this range may be used.
- a 5 volume percent solution of acetic acidis used as contrast agent.
- Optical signals used in practice of the inventioncomprise, for example, fluorescence, reflectance, Raman, infrared, and video signals.
- Video signalscomprise images from standard black-and-white or color CCD cameras, as well as hyperspectral imaging signals based on fluorescence, reflectance, Raman, infrared, and other spectroscopic techniques.
- an embodimentcomprises analyzing an intensity component indicative of the “whiteness” of a pixel in an image during an acetowhitening test.
- a preferred embodimentuses optical signals obtained from tissue samples within optimal windows of time.
- Obtaining an optical signalmay comprise actually acquiring a signal within an optimal window of time, or, of course, simply triggering the acquisition of an optical signal within an optimal window of time.
- the optimal window of timemay account for a delay between the triggering of the acquisition of a signal, and its actual acquisition.
- An embodiment of the inventionmay comprise determining an optimal window of time in which to trigger the acquisition of an optical signal, as well as determining an optimal window of time in which to actually acquire an optical signal.
- One embodimentcomprises determining an optimum time window in which to obtain spectra from cervical tissue such that sites indicative of grades 2 and 3 cervical intraepithelial neoplasia (CIN 2/3) can be separated from non-CIN 2/3 sites.
- Non-CIN 2/3 sitesinclude sites with grade 1 cervical intraepithelial neoplasia (CIN 1), as well as NED sites (which include mature and immature metaplasia, and normal columnar and normal squamous epithelia).
- sites indicative of high grade disease, CIN 2+which includes CIN 2/3 categories, carcinoma in situ (CIS), and cancer, may be separated from non-high-grade-disease sites.
- CIN 2/3is used as a category for classification or characterization of tissue
- the more expansive category CIN 2+may be used alternatively.
- One embodimentcomprises differentiating amongst three or more classification categories. Exemplary embodiments are described below and comprise analysis of the time response of diffuse reflectance and/or 337-nm fluorescence spectra of a set of reference tissue samples with regions having known states of health, as listed in the Appendix Table, to determine temporal characteristics indicative of the respective states of health. These characteristics are then used in building a model to determine a state of health of an unknown tissue sample. Other embodiments comprise analysis of fluorescence spectra using other excitation wavelengths, such as 380 nm and 460 nm, for example.
- Diffuse reflectance and/or 337-nm fluorescence emission spectraare taken from cervical tissue samples that are categorized as CIN 2/3 (having grades 2 and/or 3 cervical intraepithelial neoplasia), CIN 1 and NED (no evidence of disease, confirmed by pathology, including normal squamous tissue, normal columnar tissue, immature metaplasia tissue, and mature metaplasia tissue). All spectra are filtered then placed in the time bins indicated in Table 1. Data affected by arifacts such as glare, shadow, or obstructions may be removed and/of compensated for by using the technique disclosed in the co-owned U.S.
- Time bins for which means spectra are calculated in an exemplary embodimentTime after application Bin of Acetic Acid (s) 1 t ⁇ 0 2 0 ⁇ t ⁇ 40 3 40 ⁇ t ⁇ 60 4 60 ⁇ t ⁇ 80 5 80 ⁇ t ⁇ 100 6 100 ⁇ t ⁇ 120 7 120 ⁇ t ⁇ 140 8 140 ⁇ t ⁇ 160 9 160 ⁇ t ⁇ 180 10 t > 180
- FIGS. 1A , 1 B, 2 A, and 2 Bshow mean fluorescence and reflectance spectra for exemplary healthy tissue (NED tissue—no evidence of disease, confirmed by pathology) and CIN 2/3 (grades 2 and/or 3 cervical intraepithelial neoplasia) tissue samples. These figures demonstrate the temporal effect of acetic acid on the spectral data.
- one or more characteristics of the time responses shown in FIGS. 1A , 1 B, 2 A, and 2 Bare determined. Subsequently, the time response of a sample of unknown type is obtained, and the sample is then diagnosed according to one or more features of the response, compared against those of the known sample set.
- FIG. 1Ashows a graph 102 depicting mean fluorescence spectra for each of the 10 time bins 108 of Table 1 for NED tissue (no evidence of disease, confirmed by pathology).
- Mean fluorescence intensity (relative counts/ ⁇ J) 104is plotted as a function of wavelength (nm) 106 for each time bin shown in the legend 108 .
- the curve corresponding to the first time bin 110is a graph of the mean fluorescence intensity as a function of wavelength for data collected prior to acetic acid application
- the curve corresponding to the last time bin 128is a graph of the mean fluorescence intensity as a function of wavelength for data collected at times greater than 180 seconds (with an average of about 210 seconds).
- Each of the curves in between ( 112 , 114 , 116 , 118 , 120 , 122 , 124 , 126 )is a graph of the mean fluorescence intensity as a function of wavelength for data collected in the respective time bin shown in the legend 108 .
- the value of N shown in the legend 108 beside each curvedenotes the number of spectra that are in the respective time bin for this particular embodiment.
- FIG. 1Bshows a graph 150 depicting mean reflectance spectra for each of the 10 time bins 108 of Table 1 for NED tissue (no evidence of disease, confirmed by pathology).
- Mean reflectance 152is plotted as a function of wavelength (nm) 106 for each time bin shown in the legend 108 .
- the curve corresponding to the first time bin 154is a graph of the mean reflectance as a function of wavelength for data collected prior to acetic acid application
- the curve corresponding to the last time bin 172is a graph of the mean reflectance as a function of wavelength for data collected at times greater than 180 seconds (with an average of about 210 seconds).
- Each of the curves in between ( 156 , 158 , 160 , 162 , 164 , 166 , 168 , 170 )is a graph of the mean reflectance as a function of wavelength for data collected in the respective time bin shown in the legend 108 .
- the value of N shown in the legend 108 beside each curvedenotes the number of spectra that are in the respective time bin for this particular embodiment.
- FIG. 2Ashows a graph 202 depicting mean fluorescence spectra for each of the 10 time bins 204 of Table 1 for CIN 2/3 tissue (grades 2 and/or 3 cervical intraepithelial neoplasia).
- Mean fluorescence intensity (relative counts/ ⁇ J) 104is plotted as a function of wavelength (nm) 106 for each time bin shown in the legend 204 .
- the curve corresponding to the first time bin 206is a graph of the mean fluorescence intensity as a function of wavelength for data collected prior to acetic acid application
- the curve corresponding to the last time bin 224is a graph of the mean fluorescence intensity as a function of wavelength for data collected at times greater than 180 seconds (with an average of about 210 seconds).
- Each of the curves in between( 208 , 210 , 212 , 214 , 216 , 218 , 220 , 220 ) is a graph of the mean fluorescence intensity as a function of wavelength for data collected in the respective time bin shown in the legend 204 .
- the value of N shown in the legend 204 beside each curvedenotes the number of spectra that are in the respective time bin for this particular embodiment.
- FIG. 2Bshows a graph 250 depicting mean reflectance spectra for each of the 10 time bins 204 of Table 1 for CIN 2/3 tissue (grades 2 and/or 3 cervical intraepithelial neoplasia).
- Mean reflectance 152is plotted as a function of wavelength (nm) 106 for each time bin shown in the legend 204 .
- the curve corresponding to the first time bin 254is a graph of the mean reflectance as a function of wavelength for data collected prior to acetic acid application, and the curve corresponding to the last time bin 272 is a graph of the mean reflectance as a function of wavelength for data collected at times greater than 180 seconds (with an average of about 210 seconds).
- Each of the curves in between ( 256 , 258 , 260 , 262 , 264 , 266 , 268 , 270 )is a graph of the mean reflectance as a function of wavelength for data collected in the respective time bin shown in the legend 204 .
- the value of N shown in the legend 204 beside each curvedenotes the number of spectra that are in the respective time bin for this particular embodiment.
- FIG. 3Ashows a graph 302 depicting the time response of fluorescence intensity relative to pre-AA (fluorescence prior to application of acetic acid) 304 of NED tissue at 390, 460 and 600 nm wavelengths following application of acetic acid.
- FIG. 3Bshows a graph 320 depicting the time response of reflectance relative to pre-AA 322 for NED tissue at 425, 500, and 630 nm wavelengths following application of acetic acid.
- FIG. 3Cshows a graph 350 depicting the time response of fluorescence intensity relative to pre-AA 304 of CIN 2/3 tissue at 390, 460, and 600 nm wavelengths following application of acetic acid.
- FIG. 3Dshows a graph 370 depicting the time response of reflectance relative to pre-AA 322 for CIN 2/3 tissue at 425, 500, and 630 nm wavelengths following application of acetic acid.
- FIG. 3Areveals a continuous drop in fluorescence for the NED group over the measurement period at the three wavelengths.
- FIG. 3Cshows partial recovery at all three wavelengths for CIN 2/3 tissue.
- Each of the curves representing CIN 2/3 tissue labeled 352 , 354 , and 356 in FIG. 3Cdemonstrates a generalized local minimum at a time from about 70 to about 130 seconds following application of acetic acid, whereas each of the curves representing NED tissue labeled 310 , 312 , and 314 in FIG. 3A does not show such a local minimum.
- the fluorescence and reflectance kineticsare similar for the CIN 2/3 group but differ for the NED group. Partial recovery (return toward initial condition) is noted in both the reflectance and the fluorescence curves at all 3 wavelengths for CIN 2/3 tissue, as shown in the curves labeled 352 , 354 , 356 , 372 , 374 , and 376 in FIG. 3 C and FIG. 3 D. However, partial recovery is noted only in the reflectance curves for NED tissue (curves 326 , 328 , and 330 of FIG. 3 B), while the NED fluorescence intensities continue to drop (curves 310 , 312 , and 314 of FIG. 3 A).
- the magnitude of change in the time response of reflectance and fluorescence data following application of acetic acidis different between the CIN 2/3 group and the NED group.
- the relative maximum change in reflectivity at about 425 nmis about twice as large for CIN 2/3 (i.e. line segment 274 in FIG. 2B ) compared to non-CIN (i.e. line segment 174 in FIG. 1 B), while the maximum change for fluorescence is approximately equivalent for CIN 2/3 and non-CIN samples.
- the magnitude of change in the reflectance signaldepends on tissue type while the magnitude of change in the fluorescence signal does not depend on tissue type.
- the time to reach the maximum change in fluorescenceis delayed for NED spectra. This is shown by comparing curves 310 , 312 , and 314 of FIG. 3A with curves 352 , 354 , and 356 of FIG. 3 C. It is therefore possible, for example, to use the time required to reach a minimum value of fluorescence spectral intensity to distinguish CIN 2/3 from NED samples.
- the fluorescence line-shapechanges with time post acetic acid, particularly at later times where a valley at about 420 nm and a band at about 510 nm become more distinct.
- the valley at about 420 nmis shown in FIG. 1A at reference number 130 and in FIG. 2A at reference number 226 , while the band at about 510 nm can be seen in FIG. 1A at reference number 132 and in FIG. 2A at reference number 228 .
- collagen and NADHdecrease tissue fluorescence and FAD increases tissue fluorescence.
- the fluorescence intensity of NADHdecreases by a factor of two while FAD increases six-fold.
- Increased scattering in the epithelial layerwould decrease the contribution of collagen fluorescence from the submucosal layer. Characterization of such changes in spectral curve shape is useful, for example, in distinguishing tissue types.
- an optimal window for obtaining spectral and/or image datais a period of time in which there is a peak “whitening” as seen in image and/or reflectance data.
- an optimal windowis a period of time in which there is a peak “darkening” of fluorescence of the tissue.
- FIGS. 1A , 1 B, 2 A, 2 B, 3 A, 3 B, 3 C, and 3 Ddemonstrate “whitening” of reflectance and “darkening” of fluorescence as a function of wavelength and time following application of acetic acid. The maximum change observed in the CIN 2/3 group is determined from the data shown in FIGS. 2A , 2 B, 3 C, and 3 D.
- the peak “darkening” of the fluorescence datalags peak “whitening” of the reflectance data.
- the window for peak whiteninglies between about 30 s and about 110 s following the application of acetic acid with a maximum at about 70 s.
- the peak whitening windowlies between about 30 s and about 130 s; and in another embodiment from about 20 s to about 180 s.
- the peak “darkening” windowlies between about 50 s and about 150 s with a minimum at about 80 s.
- the peak darkening windowlies between about 60 s and about 220 s. Peak “whitening” for the non-CIN reflectance spectra is less intense but similar in shape to that found for CIN 2/3. Peak darkening in non-CIN fluorescence appears later than in CIN 2/3 fluorescence.
- FIGS. 4A and 4Bdepict the influence of acetic acid on reflectance and fluorescence intensities at about 425 nm and about 460 nm, respectively, for various reference tissue classes. These classes include CIN 2/3 (curves 406 and 454 ), CIN 1 (curves 408 and 456 ), metaplasia TT 016 and TT 017 (curves 410 and 458 ), normal columnar TT022 (curves 412 and 460 ) and normal squamous TT 025 (curves 414 and 462 ) tissues, as shown in FIGS. 4A and 4B . In general, the reflectance curves of FIG.
- FIGS. 4Ashow some distinct differences with tissue type, with CIN 2/3 tissue (curve 406 ) having the largest change.
- Columnar epithelial tissue(curve 412 ) shows rapid relatively intense whitening followed by rapid recovery while squamous epithelial tissue (curve 414 ) has a weak, slow response with very little recovery.
- Metaplastic tissues(curve 410 ) and tissue with CIN 1 (curve 408 ) have similar behavior with a relatively fast increase and decay. The acetowhitening response of all tissue groups ride on top of a slowing, increasing background, thereby suggesting a secondary response to acetic acid. This secondary response is most distinct in the CIN 1 group and appears to be the predominant response in the normal squamous group.
- the magnitude of the acetodarkening effect for fluorescenceis similar independent of tissue type, as shown in FIG. 4 B.
- the time to reach a minimum fluorescenceis different for different tissue classes, with normal squamous tissue (curve 462 ) having the slowest response and normal columnar tissue (curve 460 ) having the fastest response.
- the response for CIN 2/3 (curve 454 ), CIN 1 (curve 456 ), and metaplastic tissues (curve 458 )are very similar. There is partial recovery from the acetic acid effect in the CIN 2/3 group (curve 454 ).
- An embodiment of the inventioncomprises determining an optimum window for obtaining diagnostic spectral data using fluorescence and/or reflectance time-response data as shown in the above figures, and as discussed above.
- an optimum windowis determined by tracking the difference between spectral data of various tissue types using a discrimination function.
- the quantity ⁇corresponds to the mean optical signal and ⁇ corresponds to the standard deviation.
- the optical signalincludes diffuse reflectance.
- the optical signalincludes 337-nm fluorescence emission spectra.
- the optical signalis a video signal, Raman signal, or infrared signal.
- Some embodimentscomprise using difference spectra calculated between different phases of acetowhitening, using various normalization schema, and/or using various combinations of spectral data and/or image data as discussed above.
- One embodimentcomprises developing linear discriminant analysis models using spectra from each time bin as shown in Table 1.
- nonlinear discriminant analysis modelsmay be developed.
- modelsare trained using reflectance and fluorescence data separately, although some embodiments comprise use of both data types to train a model.
- reflectance and fluorescence intensitiesare down-sampled to one value every 10 nm between 360 and 720 nm.
- a modelis trained by adding and removing intensities in a forward manner, continuously repeating the process until the model converges such that additional intensities do not appreciably improve tissue classification. Testing is performed by a leave-one-spectrum-out jack-knife process.
- FIG. 5shows the difference between the mean reflectance spectra for non-CIN 2/3 tissues (including CIN 1 and NED tissues) and CIN 2/3 tissues at three times—at a time prior to the application of acetic acid (graph 502 ), at a time corresponding to maximum whitening (graph 520 , about 60-80 seconds post-AA), and at a time corresponding to the latest time period in which data was obtained (graph 550 , about 160-180 seconds post-AA).
- the time corresponding to maximum whiteningwas determined from reflectance data, and occurs between about 60 seconds and 80 seconds following application of acetic acid.
- the reflectance spectra for CIN 2/3curve 510 of graph 502 in FIG.
- discrimination function ‘spectra’are calculated from the reflectance spectra of CIN 2/3 and non-CIN 2/3 tissues shown in FIG. 5 .
- discrimination function spectracomprise values of the discrimination function in Equation (1) determined as a function of wavelength for sets of spectral data obtained at various times.
- FIG. 6shows a graph 602 depicting the discrimination function spectra evaluated using the diffuse reflectance data of FIG. 5 obtained prior to application of acetic acid, and at two times post-AA.
- Curve 608corresponds to the discrimination function 604 evaluated as a function of wavelength 606 using non-CIN 2/3 data and CIN 2/3 data obtained prior to application of acetic acid.
- Curve 610corresponds to the discrimination function 604 evaluated as a function of wavelength 606 using non-CIN 2/3 data and CIN 2/3 data obtained between about 60 and about 80 seconds after application of acetic acid; and curve 612 corresponds to the discrimination function 604 evaluated as a function of wavelength 606 using non-CIN 2/3 data and CIN 2/3 data obtained between about 160 and about 180 seconds after application of acetic acid. Distinguishing between CIN 2/3 and non-CIN 2/3 tissues using reflectance data is improved with the application of acetic acid.
- the largest differencesare found from data measured from about 60 s to about 80 s post-acetic acid (curve 610 ), and these agree with the differences seen in the mean reflectance spectra of FIG. 5 (curves 522 and 524 of graph 520 in FIG. 5 ).
- An application of one embodimentcomprises classifying data represented in the CIN 2/3, CIN 1, and NED categories in the Appendix Table into CIN 2/3 and non-CIN 2/3 categories by using classification models developed from the reflectance data shown in FIG. 5 .
- reflectance intensitiesare down-sampled to one about every 10 nm between about 360 nm and about 720 nm.
- the modelis trained by adding intensities in a forward-stepped manner. Testing is performed with a leave-one-spectrum-out jack-knife process. The result of this analysis shows which wavelengths best separate CIN 2/3 from non-CIN 2/3, as shown in table 2 for an exemplary embodiment.
- the two best models for separating CIN 2/3 and non-CIN 2/3 for this embodimentinclude the model using reflectance data obtained at peak CIN 2/3 whitening (from about 60 s to about 80 s) and the model using reflectance data from the latest time measured (from about 160 s to about 180 s post acetic acid).
- the first modeluses input wavelengths between about 360 and about 600 nm, while the second model uses more red-shifted wavelengths between about 490 and about 650 nm. This is consistent with the behavior of the discrimination function spectra shown in FIG. 6 .
- FIG. 7demonstrates one method of determining an optimal window for obtaining reflectance spectral data in the diagnosis of the state of health of a region of a sample as CIN 2/3 or non-CIN 2/3.
- FIG. 7shows a graph 702 depicting the performance of the two LDA models described in Table 2 above as applied to reflectance spectral data obtained at various times following application of acetic acid 706 .
- Curve 710 in FIG. 7is a plot of the diagnostic accuracy of the LDA model based on reflectance spectral data obtained between about 60 and about 80 seconds (“peak whitening model”) as applied to reflectance spectra from the bins of Table 1, and curve 712 in FIG.
- FIG. 7is a plot of the diagnostic accuracy of the LDA model based on reflectance spectral data obtained between about 160 and about 180 seconds, as applied to reflectance spectra from the bins of Table 1.
- the highest accuracywas obtained at about 70 s, while accuracies greater than 70% were obtained with spectra collected in a window between about 30 s and about 130 s.
- the 160-180 s modelhad a narrower window around 70 s, but performs better at longer times.
- FIG. 8shows the difference between the mean 337-nm fluorescence spectra for non-CIN 2/3 tissues (including CIN 1 and NED tissues) and CIN 2/3 tissues at three times—at a time prior to application of acetic acid (graph 802 ), at a time corresponding to maximum whitening (graph 820 , about 60 to about 80 seconds post-AA), and at a time corresponding to the latest time period in which data was obtained (graph 850 , about 160 to about 180 seconds post-AA). The time corresponding to maximum whitening was determined from reflectance data, and occurs between about 60 seconds and 80 seconds following application of acetic acid. In the absence of acetic acid, the fluorescence spectra for CIN 2/3 tissue (curve 812 of graph 802 in FIG.
- discrimination function ‘spectra’are calculated from the fluorescence spectra of CIN 2/3 and non-CIN 2/3 tissues shown in FIG. 8 .
- discrimination function spectracomprise values of the discrimination function in Equation (1) determined as a function of wavelength for sets of spectral data obtained at various times.
- FIG. 9shows a graph 902 depicting the discrimination function spectra evaluated using the fluorescence data of FIG. 8 obtained prior to application of acetic acid, and at two times post-AA.
- Curve 908corresponds to the discrimination function 904 evaluated as a function of wavelength 906 using non-CIN 2/3 data and CIN 2/3 data obtained prior to application of acetic acid.
- Curve 910corresponds to the discrimination function 904 evaluated as a function of wavelength 906 using non-CIN 2/3 data and CIN 2/3 data obtained between about 60 and about 80 seconds after application of acetic acid; and curve 912 corresponds to the discrimination function 904 evaluated as a function of wavelength 906 using non-CIN 2/3 data and CIN 2/3 data obtained between about 160 and about 180 seconds after application of acetic acid. Distinguishing between CIN 2/3 and non-CIN 2/3 tissues using fluorescence data is improved with the application of acetic acid.
- the largest absolute valuesare found from data measured within the range of about 160-180 s post-acetic acid (curve 912 ), and these agree with the differences seen in the mean fluorescence spectra of FIG. 8 (curves 852 and 854 of graph 850 in FIG. 8 ).
- An application of one embodimentcomprises classifying data represented in the CIN 2/3, CIN 1, and NED categories in the Appendix Table into CIN 2/3 and non-CIN 2/3 categories by using classification models developed from the fluorescence data shown in FIG. 8 . Fluorescence intensities are down-sampled to one about every 10 nm between about 360 and about 720 nm. The model is trained by adding intensities in a forward manner. Testing is performed by a leave-one-spectrum-out jack-knife process. The result of this analysis shows which wavelengths best separate CIN 2/3 from non-CIN 2/3, as shown in Table 3 for an exemplary embodiment.
- the two best models for separating CIN 2/3 and non-CIN 2/3 for this embodimentinclude the method using data obtained at peak CIN 2/3 whitening (60-80 s) and the model using data at the time measured (160-180 s post acetic acid).
- the first modeluses input wavelengths between about 360 and about 670 nm, while the second model uses wavelengths between about 370 and about 720 nm. This is consistent with the discrimination function spectra shown in FIG. 9 .
- FIG. 10demonstrates one method of determining an optimal window for obtaining flourescence spectral data in the diagnosis of the state of health of a region of a sample as CIN 2/3 or non-CIN 2/3.
- FIG. 10shows a graph 1002 depicting the performance of the two LDA models described in Table 3 above as applied to fluorescence spectral data obtained at various times following application of acetic acid 1006 .
- Curve 1010 in FIG. 10is a plot of the diagnostic accuracy of the LDA model based on fluorescence spectral data obtained between about 60 and about 80 seconds (“peak whitening model”) as applied to fluorescence spectra from the bias of Table 1, and curve 1012 in FIG.
- FIG. 10is a plot of the diagnostic accuracy of the LDA model based on fluorescence spectral data obtained between about 160 and about 180 seconds, as applied to fluorescence spectra from the bins of Table 1.
- the accuracies of these modelsvary depending on when the fluorescence spectra are recorded relative to the application of acetic acid, as shown in FIG. 10 .
- the predictive ability of the fluorescence models in FIG. 10tend to be less than that of the reflectance models in FIG. 7 .
- Accuracies greater than 70%are obtained with spectra collected after about 160 seconds post-AA.
- Another embodimentcomprises classifying data represented in the CIN 2/3, CIN 1, and NED categories in the Appendix Table into CIN 2/3 and non-CIN 2/3 categories by using fluorescence divided by diffuse reflectance spectra.
- Modelsare developed based on time post acetic acid. Ratios of fluorescence to reflectance are down-sampled to one every 10 nm between about 360 and about 720 nm.
- the modelis trained by adding intensities in a forward manner. Testing is performed by a leave-one-spectrum-out jack-knife process.
- the modelis based on intensities at about 360, 400, 420, 430, 560, 610, and 630 nm.
- the resultsare slightly better than a model based on fluorescence alone. Improved performance is noted from spectra acquired at about 160 s post acetic acid.
- FIG. 11shows a graph 1102 depicting the accuracy of three LDA models as applied to spectral data obtained at various times following application of acetic acid.
- Curve 1110 in FIG. 11is a plot of the diagnostic accuracy of the LDA model based on reflectance spectral data obtained between about 60 and about 80 seconds (“peak whitening model”), also shown as curve 710 in FIG. 7 .
- Curve 1112 in FIG. 11is a plot of the diagnostic accuracy of the LDA model based on fluorescence spectral data obtained between about 60 and about 80 seconds (“peak whitening model”), also shown as curve 1010 in FIG. 10 .
- Curve 1114 in FIG. 11is a plot of the diagnostic accuracy of the LDA model based on fluorescence intensity divided by reflectance, as described in the immediately preceding paragraph.
- the exemplary embodiments discussed abovedemonstrate that the ability to distinguish between non-CIN 2/3 and CIN 2/3 fluorescence and reflectance spectra is improved with the application of acetic acid or other contrast agent.
- the highest accuracy for the exemplary applications of the embodiments discussed hereinis obtained at about 70 s following introduction of acetic acid, while accuracies greater than about 70% are obtained with spectra collected in a window between about 30 s and about 130 s.
- the predictive ability of the fluorescence models in the examples abovetend to be less than that of the reflectance models for the examples discussd above.
- Accuracies greater than 70%are obtained with fluorescence at times greater than about 160 s post acetic acid.
- the time response of fluorescence intensity or the time response of reflectance following application of contrast agentmay be curve-fitted to determine one or more parameters sensitive to a curve feature of interest.
- a parameter sensitive to a local minimummay be determined for a given set of fluorescence response data.
- a parameteris determined by curve-fitting fluorescence time response data to a sigmoidal function.
- Values of the parameter and/or goodness-of-fit dataare then used to develop a statistical model for classifying a sample in terms of a characteristic of the sample, such as its state of health.
- the modelis built using reference data with known states of health.
- the time response of spectral intensity of a test sample with unknown state of health following application of a contrast agentis obtained.
- values of the indicated parameter(s)may be obtained, and the model may be used to either directly determine the characteristic of the test sample, or to indicate an optimal window in which spectral data should be obtained and used to accurately classify the tissue.
- the parameter determined by curve-fitting spectral time response curvesis not used directly to classify the tissue, but is used to determine an optimal window.
- the parameterindicates a window of time in which one or more complete sets of spectral and/or video data should be obtained for accurate diagnosis of the tissue.
- An embodiment of the inventioncomprises determining and using a relative amplitude change and/or rate of amplitude change as a trigger for obtaining diagnostic optical data from a sample.
- the triggercan also be used to determine an optical window of time for obtaining such diagnostic optical data.
- the triggers determined abovemay be converted into optimal time windows for obtaining diagnostic optical data from a sample.
- FIG. 12Ashows how an optical amplitude trigger can be used to determine an optimal time window for obtaining diagnostic optical data.
- the graph 1200 in FIG. 12Aplots the normalized relative change of mean reflectance signal 1202 from tissue samples with a given state of health as a function of time following application of acetic acid 1204 .
- the mean reflectance signal determined from CIN 1, CIN 2, and Metaplasia samplesare depicted in FIG. 12A by curves 1210 , 1208 , and 1212 , respectively.
- spectral and/or image data obtained from a tissue sample between t 1 and t 2 seconds following application of acetic acidcan be used in accurately determining whether or not CIN 2 is indicated for that sample.
- the relative change of reflectance of a tissue sample at one or more given wavelengthsis monitored, and when that relative change is greater than or equal to the 0.75 threshold, more comprehensive spectral and/or image data is obtained from the sample for purposes of characterizing whether or not the sample is indicative of CIN 2.
- FIG. 12Ademonstrates the use of a threshold value of relative optical signal change.
- a predetermined range of values of the relative optical signal changeis used such that when the relative signal change falls within the predetermined range of values, additional spectral and/or image data is captured in order to characterize the sample.
- FIG. 12Bshows how a rate-of-change of optical amplitude trigger can be used to determine an optimal time window for obtaining diagnostic optical data.
- the graph 1250 of FIG. 12Bplots the slope of mean reflectance signal 1252 from tissue samples with a given state of health as a function of time following application of acetic acid 1204 .
- the slope of mean reflectanceis a measure of the rate of change of the mean reflectance signal.
- the rate of change of mean reflectance determined from CIN 1, CIN 2, and Metaplasia samplesare depicted in FIG. 12B by curves 1258 , 1256 , and 1260 , respectively.
- the absolute value of the slopehas an absolute value less than or equal to 0.1, for example, in the vicinity of maximum reflectance, the image intensity data and/or the full reflectance and/or fluorescence spectrum for a given sample is most indicative of a given state of health of a sample.
- thiscorresponds to a time period between t 1 and t 2 as shown in the graph 1250 of FIG. 12 B. Therefore, spectral and/or image data obtained from a tissue sample between t 1 and t 2 seconds following application of acetic acid can be used in accurately determining whether or not CIN 2 is indicated for that sample.
- the rate of change of reflectance of a tissue sampleis monitored at one or more given wavelengths, and when that rate of change has an absolute value less than or equal to 0.1, more comprehensive spectral and/or image data is obtained from the sample for purposes of characterizing whether or not the sample is indicative of CIN 2.
- FIG. 12Bdemonstrates use of a range of values of rate of optical signal change. Other embodiments use a single threshold value.
- the figures discussed hereininclude time-response fluorescence and reflectance data obtained following application of a contrast agent to tissue.
- an “acetodarkening” effectis observed in the fluorescence data.
- the fluorescence intensity of diseased regionsdecreases to a minimum at about 70 s to about 130 s following application of acetic acid.
- the presence of a minimum fluorescence intensity within this window of time, as well as the accompanying increase in fluorescence from this minimummay be used to indicate disease.
- An embodiment of the inventioncomprises a method of identifying a characteristic of a region of a tissue sample including applying a contrast agent to a region of a tissue sample, obtaining at least two values of fluorescence spectral intensity corresponding to the region, determining whether the fluorescence spectral intensity corresponding to the region increases after a predetermined time following the applying step, and identifying a characteristic of the region based at least in part on the determining step.
- the obtaining stepcomprises obtaining a fluorescence spectral intensity signal corresponding to the region as a function of time following the applying step.
- the methodfurther comprises determining whether the fluorescence spectral intensity corresponding to the region decreases following the applying step, then increases after the predetermined time.
- the predetermined timeis about 80 seconds.
- An embodimentcomprises a method of identifying a characteristic of a region of a tissue sample comprising applying a contrast agent to a region of a tissue sample, obtaining a fluorescence spectral intensity signal from the region of the tissue sample, determining an elapsed time following the applying step at which the fluorescence spectral intensity signal has a minimum value, and identifying a characteristic of the region based at least in part on the elapsed time.
- An embodimentcomprises a method of identifying a characteristic of a region of a tissue sample comprising applying a contrast agent to a region of a tissue sample, obtaining a reflectance signal from the region of the tissue sample, determining a change in reflectance spectral intensity corresponding to the region of the tissue sample following the applying step, and identifying a characteristic of the region based at least in part on the change in reflectance spectral intensity.
- the change in reflectance spectral intensity corresponding to the regioncomprises a change relative to an initial condition of the region.
- An embodimentcomprises a method of identifying a characteristic of a region of a tissue sample comprising applying a contrast agent to a region of a tissue sample, obtaining an optical signal from the region of the tissue sample, determining a rate of change of the optical signal corresponding to the region of the tissue sample, and identifying a characteristic of the region based at least in part on the rate of change.
- the optical signalcomprises fluorescence spectral intensity at a given wavelength.
- the optical signalcomprises reflectance spectral intensity at a given wavelength.
- An embodimentcomprises a method of identifying a characteristic of a region of a tissue sample comprising applying a contrast agent to a region of a tissue sample, obtaining a fluorescence signal from the region of the tissue sample, obtaining a reflectance signal from the region of the tissue sample, and identifying a characteristic of the region based at least in part on the fluorescence signal and the reflectance signal.
- An embodimentcomprises obtaining an optical signal from 499 regions, each region having a diameter of approximately 1 mm, covering an area of tissue about 25 mm in diameter.
- An embodimentmay also comprise obtaining a video image of about 480 by about 560 pixels covering the same 25-mm diameter area of tissue.
Landscapes
- Health & Medical Sciences (AREA)
- Life Sciences & Earth Sciences (AREA)
- Physics & Mathematics (AREA)
- General Health & Medical Sciences (AREA)
- Pathology (AREA)
- Immunology (AREA)
- Engineering & Computer Science (AREA)
- Chemical & Material Sciences (AREA)
- General Physics & Mathematics (AREA)
- Biochemistry (AREA)
- Analytical Chemistry (AREA)
- Medical Informatics (AREA)
- Nuclear Medicine, Radiotherapy & Molecular Imaging (AREA)
- Public Health (AREA)
- Veterinary Medicine (AREA)
- Artificial Intelligence (AREA)
- Spectroscopy & Molecular Physics (AREA)
- Animal Behavior & Ethology (AREA)
- Biophysics (AREA)
- Biomedical Technology (AREA)
- Heart & Thoracic Surgery (AREA)
- Molecular Biology (AREA)
- Surgery (AREA)
- Fuzzy Systems (AREA)
- Signal Processing (AREA)
- Psychiatry (AREA)
- Physiology (AREA)
- Computer Vision & Pattern Recognition (AREA)
- Mathematical Physics (AREA)
- Evolutionary Computation (AREA)
- Chemical Kinetics & Catalysis (AREA)
- Optics & Photonics (AREA)
- Investigating, Analyzing Materials By Fluorescence Or Luminescence (AREA)
- Investigating Or Analysing Materials By Optical Means (AREA)
Abstract
Description
| TABLE 1 |
| Time bins for which means spectra are |
| calculated in an exemplary embodiment |
| Time after application | |||
| Bin | of Acetic Acid (s) | ||
| 1 | t ≦ 0 | ||
| 2 | 0 < t ≦ 40 | ||
| 3 | 40 < t ≦ 60 | ||
| 4 | 60 < t ≦ 80 | ||
| 5 | 80 < t ≦ 100 | ||
| 6 | 100 < t ≦ 120 | ||
| 7 | 120 < t ≦ 140 | ||
| 8 | 140 < t ≦ 160 | ||
| 9 | 160 < t ≦ 180 | ||
| 10 | t > 180 | ||
The quantity μ corresponds to the mean optical signal and σ corresponds to the standard deviation. In one embodiment, the optical signal includes diffuse reflectance. In another embodiment, the optical signal includes 337-nm fluorescence emission spectra. Other embodiments use fluorescence emission spectra at another excitation wavelength such as 380 nm and 460 nm. In still other embodiments, the optical signal is a video signal, Raman signal, or infrared signal. Some embodiments comprise using difference spectra calculated between different phases of acetowhitening, using various normalization schema, and/or using various combinations of spectral data and/or image data as discussed above.
| TABLE 2 |
| Forwarded selected best reflectance wavelengths for classifying |
| from |
 |
| TABLE 3 |
| Forwarded selected best 337-nm fluorescence wavelengths for classifying |
| post-AA. |
 |
| APPENDIX TABLE |
| Number of spectra (number of subject) for each tissue class in each time bin for |
| exemplary embodiments discussed herein. |
| Time | CIN 2/3 | CIN 1 | Metaplasia | TT_0221 | TT_0251 | NEDpath11 |
| t ≦ 0 | 451 (62) | 202 (46) | 329 (77) | 202 (56) | 294 (70) | 816 (186) |
| 0 < t ≦ 40 | 118 (21) | 72 (14) | 147 (33) | 51 (14) | 113 (22) | 307 (64) |
| 40 < t ≦ 60 | 300 (47) | 135 (31) | 255 (58) | 116 (32) | 230 (51) | 597 (133) |
| 60 < t ≦ 80 | 375 (54) | 162 (39) | 300 (68) | 179 (42) | 262 (61) | 731 (157) |
| 80 < t ≦ 100 | 455 (60) | 195 (42) | 308 (70) | 190 (49) | 263 (64) | 752 (167) |
| 100 < t ≦ 120 | 446 (60) | 209 (45) | 328 (76) | 208 (52) | 284 (68) | 811 (178) |
| 120 < t ≦ 140 | 303 (44) | 135 (30) | 200 (48) | 165 (43) | 185 (51) | 545 (129) |
| 140 < t ≦ 160 | 130 (18) | 82 (17) | 75 (19) | 96 (23) | 66 (21) | 232 (53) |
| 160 < t ≦ 180 | 53 (9) | 50 (9) | 34 (9) | 38 (12) | 19 (6) | 91 (24) |
| t > 180 | 14 (3) | 26 (3) | 33 (6) | 23 (6) | 30 (5) | 86 (15) |
| 1TT 022 = Normal columnar tissue; TT 025 = Normal squamous tissue; NEDPath1 = NED = Metaplasia, TT_022, and TT_025. | ||||||
Claims (24)
Priority Applications (7)
| Application Number | Priority Date | Filing Date | Title |
|---|---|---|---|
| US10/295,794US6933154B2 (en) | 2002-07-09 | 2002-11-15 | Optimal windows for obtaining optical data for characterization of tissue samples |
| US10/418,415US7282723B2 (en) | 2002-07-09 | 2003-04-18 | Methods and apparatus for processing spectral data for use in tissue characterization |
| AU2003248819AAU2003248819A1 (en) | 2002-07-09 | 2003-07-08 | Optimal windows for obtaining optical data for characterization of tissue samples |
| CA002491561ACA2491561A1 (en) | 2002-07-09 | 2003-07-08 | Optimal windows for obtaining optical data for characterization of tissue samples |
| EP03763174AEP1700105A4 (en) | 2002-07-09 | 2003-07-08 | Optimal time windows for obtaining optical data for characterization of tissue samples |
| PCT/US2003/020998WO2004005885A2 (en) | 2002-07-09 | 2003-07-08 | Optimal windows for obtaining optical data for characterization of tissue samples |
| US10/828,624US20040204648A1 (en) | 2002-07-09 | 2004-04-21 | Optimal windows for obtaining optical data for characterization of tissue samples |
Applications Claiming Priority (2)
| Application Number | Priority Date | Filing Date | Title |
|---|---|---|---|
| US39469602P | 2002-07-09 | 2002-07-09 | |
| US10/295,794US6933154B2 (en) | 2002-07-09 | 2002-11-15 | Optimal windows for obtaining optical data for characterization of tissue samples |
Related Parent Applications (1)
| Application Number | Title | Priority Date | Filing Date |
|---|---|---|---|
| US10/243,535Continuation-In-PartUS6818903B2 (en) | 2002-07-09 | 2002-09-13 | Method and apparatus for identifying spectral artifacts |
Related Child Applications (2)
| Application Number | Title | Priority Date | Filing Date |
|---|---|---|---|
| US10/418,415Continuation-In-PartUS7282723B2 (en) | 2002-07-09 | 2003-04-18 | Methods and apparatus for processing spectral data for use in tissue characterization |
| US10/828,624DivisionUS20040204648A1 (en) | 2002-07-09 | 2004-04-21 | Optimal windows for obtaining optical data for characterization of tissue samples |
Publications (2)
| Publication Number | Publication Date |
|---|---|
| US20040023406A1 US20040023406A1 (en) | 2004-02-05 |
| US6933154B2true US6933154B2 (en) | 2005-08-23 |
Family
ID=30117977
Family Applications (2)
| Application Number | Title | Priority Date | Filing Date |
|---|---|---|---|
| US10/295,794Expired - Fee RelatedUS6933154B2 (en) | 2002-07-09 | 2002-11-15 | Optimal windows for obtaining optical data for characterization of tissue samples |
| US10/828,624AbandonedUS20040204648A1 (en) | 2002-07-09 | 2004-04-21 | Optimal windows for obtaining optical data for characterization of tissue samples |
Family Applications After (1)
| Application Number | Title | Priority Date | Filing Date |
|---|---|---|---|
| US10/828,624AbandonedUS20040204648A1 (en) | 2002-07-09 | 2004-04-21 | Optimal windows for obtaining optical data for characterization of tissue samples |
Country Status (5)
| Country | Link |
|---|---|
| US (2) | US6933154B2 (en) |
| EP (1) | EP1700105A4 (en) |
| AU (1) | AU2003248819A1 (en) |
| CA (1) | CA2491561A1 (en) |
| WO (1) | WO2004005885A2 (en) |
Cited By (24)
| Publication number | Priority date | Publication date | Assignee | Title |
|---|---|---|---|---|
| US20040204648A1 (en)* | 2002-07-09 | 2004-10-14 | Medispectra, Inc. | Optimal windows for obtaining optical data for characterization of tissue samples |
| US20040206913A1 (en)* | 2003-04-18 | 2004-10-21 | Medispectra, Inc. | Methods and apparatus for characterization of tissue samples |
| US20040206914A1 (en)* | 2003-04-18 | 2004-10-21 | Medispectra, Inc. | Methods and apparatus for calibrating spectral data |
| US20050227310A1 (en)* | 2002-05-15 | 2005-10-13 | Nicholas Thomas | Method for the determination of changes in a cellular morphological parameter |
| US7127282B2 (en) | 1998-12-23 | 2006-10-24 | Medispectra, Inc. | Optical methods and systems for rapid screening of the cervix |
| US7136518B2 (en) | 2003-04-18 | 2006-11-14 | Medispectra, Inc. | Methods and apparatus for displaying diagnostic data |
| US7187810B2 (en) | 1999-12-15 | 2007-03-06 | Medispectra, Inc. | Methods and systems for correcting image misalignment |
| US20070093701A1 (en)* | 2005-10-26 | 2007-04-26 | Hutchinson Technology Incorporated | Dynamic StO2 measurements and analysis |
| US7260248B2 (en) | 1999-12-15 | 2007-08-21 | Medispectra, Inc. | Image processing using measures of similarity |
| US7282723B2 (en) | 2002-07-09 | 2007-10-16 | Medispectra, Inc. | Methods and apparatus for processing spectral data for use in tissue characterization |
| US7310547B2 (en) | 2002-07-10 | 2007-12-18 | Medispectra, Inc. | Fluorescent fiberoptic probe for tissue health discrimination |
| US20080144013A1 (en)* | 2006-12-01 | 2008-06-19 | Institute For Technology Development | System and method for co-registered hyperspectral imaging |
| US7469160B2 (en)* | 2003-04-18 | 2008-12-23 | Banks Perry S | Methods and apparatus for evaluating image focus |
| US20110004448A1 (en)* | 2009-07-01 | 2011-01-06 | Schlumberger Technology Corporation | Method to quantify discrete pore shapes, volumes, and surface areas using confocal profilometry |
| US8725477B2 (en) | 2008-04-10 | 2014-05-13 | Schlumberger Technology Corporation | Method to generate numerical pseudocores using borehole images, digital rock samples, and multi-point statistics |
| US9042967B2 (en) | 2008-05-20 | 2015-05-26 | University Health Network | Device and method for wound imaging and monitoring |
| US9404870B2 (en) | 2013-03-15 | 2016-08-02 | Cedars-Sinai Medical Center | Time-resolved laser-induced fluorescence spectroscopy systems and uses thereof |
| US9433468B2 (en) | 2013-10-04 | 2016-09-06 | Tidi Products, Llc | Sheath for a medical or dental instrument |
| US9581723B2 (en) | 2008-04-10 | 2017-02-28 | Schlumberger Technology Corporation | Method for characterizing a geological formation traversed by a borehole |
| US10394008B2 (en) | 2016-10-19 | 2019-08-27 | Cornell University | Hyperspectral multiphoton microscope for biomedical applications |
| US10438356B2 (en) | 2014-07-24 | 2019-10-08 | University Health Network | Collection and analysis of data for diagnostic purposes |
| US10656089B2 (en) | 2016-04-01 | 2020-05-19 | Black Light Surgical, Inc. | Systems, devices, and methods for time-resolved fluorescent spectroscopy |
| US11103181B2 (en) | 2017-08-01 | 2021-08-31 | Samsung Electronics Co., Ltd. | Apparatus and method for processing bio-information |
| US11134847B2 (en) | 2017-09-13 | 2021-10-05 | Samsung Electronics Co., Ltd. | Disease prediction model generation apparatus, and apparatus and method for predicting disease |
Families Citing this family (19)
| Publication number | Priority date | Publication date | Assignee | Title |
|---|---|---|---|---|
| US20010041843A1 (en)* | 1999-02-02 | 2001-11-15 | Mark Modell | Spectral volume microprobe arrays |
| US6847490B1 (en) | 1997-01-13 | 2005-01-25 | Medispectra, Inc. | Optical probe accessory device for use in vivo diagnostic procedures |
| CA2356623C (en)* | 1998-12-23 | 2005-10-18 | Medispectra, Inc. | Systems and methods for optical examination of samples |
| US6902935B2 (en)* | 1999-12-15 | 2005-06-07 | Medispectra, Inc. | Methods of monitoring effects of chemical agents on a sample |
| US6839661B2 (en)* | 2000-12-15 | 2005-01-04 | Medispectra, Inc. | System for normalizing spectra |
| US20040208390A1 (en)* | 2003-04-18 | 2004-10-21 | Medispectra, Inc. | Methods and apparatus for processing image data for use in tissue characterization |
| US20040208385A1 (en)* | 2003-04-18 | 2004-10-21 | Medispectra, Inc. | Methods and apparatus for visually enhancing images |
| US20040209237A1 (en)* | 2003-04-18 | 2004-10-21 | Medispectra, Inc. | Methods and apparatus for characterization of tissue samples |
| US20050250091A1 (en)* | 2004-05-05 | 2005-11-10 | Chemlmage Corporation | Raman molecular imaging for detection of bladder cancer |
| US20060239916A1 (en)* | 2005-01-07 | 2006-10-26 | Kai Licha | Use of cyanine dyes for the diagnosis of proliferative diseases |
| CA2652010C (en)* | 2006-06-05 | 2016-01-05 | Forth Photonics Limited | Methods for characterizing tissues |
| CN103619257B (en)* | 2011-04-18 | 2016-06-29 | 皇家飞利浦有限公司 | Dynamic perfusion imaging |
| CN108732114B (en)* | 2018-04-11 | 2021-01-05 | 武汉瑞法医疗器械有限公司 | Method for rapidly detecting fixed quantity of glucan sulfate in blood fat adsorbent |
| CN109543719B (en)* | 2018-10-30 | 2020-09-08 | 浙江大学 | Cervical atypical lesion diagnosis model and device based on multimodal attention model |
| CN111310598B (en)* | 2020-01-20 | 2023-06-20 | 浙江工业大学 | A Hyperspectral Remote Sensing Image Classification Method Based on 3D and 2D Hybrid Convolution |
| CN112381898B (en)* | 2020-12-07 | 2024-03-01 | 苏州律点信息科技有限公司 | Image feature extraction method and device, storage medium and electronic equipment |
| CN113155755B (en)* | 2021-03-31 | 2022-05-24 | 中国科学院长春光学精密机械与物理研究所 | On-line calibration method for micro-lens array type imaging spectrometer |
| CN114092479B (en)* | 2022-01-21 | 2022-05-03 | 武汉大学 | Medical image evaluation method and device |
| CN115937755B (en)* | 2023-02-21 | 2023-05-12 | 山东双力现代农业装备有限公司 | Visual inspection method for end mill piece of tractor gearbox |
Citations (237)
| Publication number | Priority date | Publication date | Assignee | Title |
|---|---|---|---|---|
| US3013467A (en) | 1957-11-07 | 1961-12-19 | Minsky Marvin | Microscopy apparatus |
| US3632865A (en) | 1969-12-23 | 1972-01-04 | Bell Telephone Labor Inc | Predictive video encoding using measured subject velocity |
| US3809072A (en) | 1971-10-07 | 1974-05-07 | Med General Inc | Sterile sheath apparatus for fiber optic illuminator with compatible lens |
| US3890462A (en) | 1974-04-17 | 1975-06-17 | Bell Telephone Labor Inc | Speed and direction indicator for video systems |
| US3963019A (en) | 1974-11-25 | 1976-06-15 | Quandt Robert S | Ocular testing method and apparatus |
| US4017192A (en) | 1975-02-06 | 1977-04-12 | Neotec Corporation | Optical analysis of biomedical specimens |
| US4071020A (en) | 1976-06-03 | 1978-01-31 | Xienta, Inc. | Apparatus and methods for performing in-vivo measurements of enzyme activity |
| US4198571A (en) | 1977-04-28 | 1980-04-15 | National Research Development Corporation | Scanning microscopes |
| US4218703A (en) | 1979-03-16 | 1980-08-19 | Bell Telephone Laboratories, Incorporated | Technique for estimation of displacement and/or velocity of objects in video scenes |
| US4254421A (en) | 1979-12-05 | 1981-03-03 | Communications Satellite Corporation | Integrated confocal electromagnetic wave lens and feed antenna system |
| US4273110A (en) | 1978-07-13 | 1981-06-16 | Jean Groux | Ultraviolet endoscope |
| US4357075A (en) | 1979-07-02 | 1982-11-02 | Hunter Thomas M | Confocal reflector system |
| US4397557A (en) | 1979-12-20 | 1983-08-09 | Heimann Gmbh | Optical arrangement for a light scattering type smoke detector |
| EP0135134A2 (en) | 1983-08-11 | 1985-03-27 | Vitacomm Ltd | Esophageal stethoscope and vital signs monitor system |
| US4515165A (en) | 1980-02-04 | 1985-05-07 | Energy Conversion Devices, Inc. | Apparatus and method for detecting tumors |
| US4549229A (en) | 1982-02-01 | 1985-10-22 | Sony Corporation | Method and apparatus for compensating for tape jitter during recording and reproducing of a video signal and PCM audio signal |
| US4558462A (en) | 1982-09-02 | 1985-12-10 | Hitachi Medical Corporation | Apparatus for correcting image distortions automatically by inter-image processing |
| US4641352A (en) | 1984-07-12 | 1987-02-03 | Paul Fenster | Misregistration correction |
| US4646722A (en) | 1984-12-10 | 1987-03-03 | Opielab, Inc. | Protective endoscope sheath and method of installing same |
| US4662360A (en) | 1984-10-23 | 1987-05-05 | Intelligent Medical Systems, Inc. | Disposable speculum |
| US4733063A (en) | 1985-12-13 | 1988-03-22 | Hitachi, Ltd. | Scanning laser microscope with aperture alignment |
| US4741326A (en) | 1986-10-01 | 1988-05-03 | Fujinon, Inc. | Endoscope disposable sheath |
| US4753530A (en) | 1980-08-21 | 1988-06-28 | Oriel Scientific Ltd. | Analytical optical instruments |
| EP0280418A1 (en) | 1987-02-02 | 1988-08-31 | Wyatt Technology Corporation | Method and apparatus for examining the interior of semi-opaque objects |
| US4768513A (en) | 1986-04-21 | 1988-09-06 | Agency Of Industrial Science And Technology | Method and device for measuring and processing light |
| US4800571A (en) | 1988-01-11 | 1989-01-24 | Tektronix, Inc. | Timing jitter measurement display |
| US4844617A (en) | 1988-01-20 | 1989-07-04 | Tencor Instruments | Confocal measuring microscope with automatic focusing |
| US4845352A (en) | 1986-12-08 | 1989-07-04 | U.S. Philips Corporation | Scanning differential phase contrast microscope |
| US4852955A (en) | 1986-09-16 | 1989-08-01 | Laser Precision Corporation | Microscope for use in modular FTIR spectrometer system |
| US4877033A (en) | 1988-05-04 | 1989-10-31 | Seitz Jr H Michael | Disposable needle guide and examination sheath for transvaginal ultrasound procedures |
| US4878485A (en) | 1989-02-03 | 1989-11-07 | Adair Edwin Lloyd | Rigid video endoscope with heat sterilizable sheath |
| US4891829A (en) | 1986-11-19 | 1990-01-02 | Exxon Research And Engineering Company | Method and apparatus for utilizing an electro-optic detector in a microtomography system |
| US4930516A (en) | 1985-11-13 | 1990-06-05 | Alfano Robert R | Method for detecting cancerous tissue using visible native luminescence |
| US4945478A (en) | 1987-11-06 | 1990-07-31 | Center For Innovative Technology | Noninvasive medical imaging system and method for the identification and 3-D display of atherosclerosis and the like |
| US4965441A (en) | 1988-01-27 | 1990-10-23 | Commissariat A L'energie Atomique | Method for the scanning confocal light-optical microscopic and indepth examination of an extended field and devices for implementing said method |
| US4972258A (en) | 1989-07-31 | 1990-11-20 | E. I. Du Pont De Nemours And Company | Scanning laser microscope system and methods of use |
| US4974580A (en) | 1988-06-25 | 1990-12-04 | Effner Gmbh | Endoscope protective member |
| US4979498A (en) | 1989-10-30 | 1990-12-25 | Machida Incorporated | Video cervicoscope system |
| US4997242A (en) | 1988-03-07 | 1991-03-05 | Medical Research Council | Achromatic scanning system |
| EP0335725A3 (en) | 1988-04-01 | 1991-03-27 | Syntex (U.S.A.) Inc. | Apparatus and method for detection of fluorescence or light scatter |
| US5003979A (en) | 1989-02-21 | 1991-04-02 | University Of Virginia | System and method for the noninvasive identification and display of breast lesions and the like |
| US5011243A (en) | 1986-09-16 | 1991-04-30 | Laser Precision Corporation | Reflectance infrared microscope having high radiation throughput |
| US5022757A (en) | 1989-01-23 | 1991-06-11 | Modell Mark D | Heterodyne system and method for sensing a target substance |
| US5028802A (en) | 1990-01-11 | 1991-07-02 | Eye Research Institute Of Retina Foundation | Imaging apparatus and methods utilizing scannable microlaser source |
| US5032720A (en) | 1988-04-21 | 1991-07-16 | White John G | Confocal imaging system |
| US5034613A (en) | 1989-11-14 | 1991-07-23 | Cornell Research Foundation, Inc. | Two-photon laser microscopy |
| US5036853A (en) | 1988-08-26 | 1991-08-06 | Polartechnics Ltd. | Physiological probe |
| US5042494A (en) | 1985-11-13 | 1991-08-27 | Alfano Robert R | Method and apparatus for detecting cancerous tissue using luminescence excitation spectra |
| EP0444689A2 (en) | 1990-03-01 | 1991-09-04 | X-Rite, Inc. | A compensation method adapted for use in color measuring apparatus |
| US5048946A (en) | 1990-05-15 | 1991-09-17 | Phoenix Laser Systems, Inc. | Spectral division of reflected light in complex optical diagnostic and therapeutic systems |
| US5054926A (en) | 1987-03-24 | 1991-10-08 | Commonwealth Scientific And Industrial Research Organisation | Distance measuring device |
| US5065008A (en) | 1989-10-18 | 1991-11-12 | Fuji Photo Film Co., Ltd. | Scanning microscope and scanning mechanism for the same |
| US5071246A (en) | 1989-10-27 | 1991-12-10 | Carl-Zeiss-Stiftung | Confocal scanning ophthalmoscope |
| US5074306A (en) | 1990-02-22 | 1991-12-24 | The General Hospital Corporation | Measurement of burn depth in skin |
| US5083220A (en) | 1990-03-22 | 1992-01-21 | Tandem Scanning Corporation | Scanning disks for use in tandem scanning reflected light microscopes and other optical systems |
| US5091652A (en) | 1990-01-12 | 1992-02-25 | The Regents Of The University Of California | Laser excited confocal microscope fluorescence scanner and method |
| US5101825A (en) | 1988-10-28 | 1992-04-07 | Blackbox, Inc. | Method for noninvasive intermittent and/or continuous hemoglobin, arterial oxygen content, and hematocrit determination |
| US5120953A (en) | 1988-07-13 | 1992-06-09 | Harris Martin R | Scanning confocal microscope including a single fibre for transmitting light to and receiving light from an object |
| US5122653A (en) | 1989-08-22 | 1992-06-16 | Nikon Corporation | Confocal type laser scan microscope with integrated illumination, detection and waveguide system |
| US5132526A (en) | 1990-04-10 | 1992-07-21 | Fuji Photo Film Co., Ltd. | Confocal scanning microscope having a signal output regulating means |
| US5139025A (en) | 1983-10-14 | 1992-08-18 | Somanetics Corporation | Method and apparatus for in vivo optical spectroscopic examination |
| US5154166A (en) | 1990-02-01 | 1992-10-13 | Machida Endoscope Co., Ltd. | Endoscope cover |
| US5161053A (en) | 1988-08-01 | 1992-11-03 | Commonwealth Scientific & Industrial Research | Confocal microscope |
| US5159919A (en) | 1990-02-01 | 1992-11-03 | Machida Endoscope Co., Ltd. | Endoscope cover |
| US5162941A (en) | 1991-07-23 | 1992-11-10 | The Board Of Governors Of Wayne State University | Confocal microscope |
| US5162641A (en) | 1991-02-19 | 1992-11-10 | Phoenix Laser Systems, Inc. | System and method for detecting, correcting and measuring depth movement of target tissue in a laser surgical system |
| WO1992019148A1 (en) | 1991-05-06 | 1992-11-12 | Adair Edwin Lloyd | Cervical videoscope with detachable camera unit |
| US5168157A (en) | 1990-11-20 | 1992-12-01 | Fuji Photo Film Co., Ltd. | Scanning microscope with means for detecting a first and second polarized light beams along first and second optical receiving paths |
| US5192980A (en) | 1990-06-27 | 1993-03-09 | A. E. Dixon | Apparatus and method for method for spatially- and spectrally-resolved measurements |
| US5193525A (en) | 1990-11-30 | 1993-03-16 | Vision Sciences | Antiglare tip in a sheath for an endoscope |
| USRE34214E (en) | 1984-03-15 | 1993-04-06 | Molecular Dynamics, Inc. | Method and apparatus for microphotometering microscope specimens |
| US5199431A (en) | 1985-03-22 | 1993-04-06 | Massachusetts Institute Of Technology | Optical needle for spectroscopic diagnosis |
| US5201908A (en) | 1991-06-10 | 1993-04-13 | Endomedical Technologies, Inc. | Sheath for protecting endoscope from contamination |
| US5201318A (en) | 1989-04-24 | 1993-04-13 | Rava Richard P | Contour mapping of spectral diagnostics |
| US5203328A (en) | 1991-07-17 | 1993-04-20 | Georgia Tech Research Corporation | Apparatus and methods for quantitatively measuring molecular changes in the ocular lens |
| EP0474264A3 (en) | 1991-04-24 | 1993-06-16 | Kaman Aerospace Corporation | Spectrally dispersive imaging lidar method and apparatus |
| US5225671A (en) | 1991-05-29 | 1993-07-06 | Olympus Optical Co., Ltd. | Confocal optical apparatus |
| WO1993014688A1 (en) | 1992-01-24 | 1993-08-05 | Frantz Medical Development, Ltd. | Endoscope sterile liquid supply system |
| US5235457A (en) | 1987-09-24 | 1993-08-10 | Washington University | Kit for converting a standard microscope into a single aperture confocal scanning epi-illumination microscope |
| US5239178A (en) | 1990-11-10 | 1993-08-24 | Carl Zeiss | Optical device with an illuminating grid and detector grid arranged confocally to an object |
| US5237984A (en) | 1991-06-24 | 1993-08-24 | Xomed-Treace Inc. | Sheath for endoscope |
| US5248876A (en) | 1992-04-21 | 1993-09-28 | International Business Machines Corporation | Tandem linear scanning confocal imaging system with focal volumes at different heights |
| US5253071A (en) | 1991-12-20 | 1993-10-12 | Sony Corporation Of America | Method and apparatus for stabilizing an image produced in a video camera |
| US5257617A (en) | 1989-12-25 | 1993-11-02 | Asahi Kogaku Kogyo Kabushiki Kaisha | Sheathed endoscope and sheath therefor |
| US5260578A (en) | 1991-04-10 | 1993-11-09 | Mayo Foundation For Medical Education And Research | Confocal imaging system for visible and ultraviolet light |
| US5260569A (en) | 1991-07-25 | 1993-11-09 | Fuji Photo Film Co., Ltd. | Scanning microscope and scanning mechanism |
| US5262646A (en) | 1990-07-27 | 1993-11-16 | Booker Graham R | Infra-red scanning microscopy |
| US5261410A (en) | 1991-02-07 | 1993-11-16 | Alfano Robert R | Method for determining if a tissue is a malignant tumor tissue, a benign tumor tissue, or a normal or benign tissue using Raman spectroscopy |
| US5274240A (en) | 1990-01-12 | 1993-12-28 | The Regents Of The University Of California | Capillary array confocal fluorescence scanner and method |
| US5284149A (en) | 1992-01-23 | 1994-02-08 | Dhadwal Harbans S | Method and apparatus for determining the physical characteristics of ocular tissue |
| US5289274A (en) | 1991-02-06 | 1994-02-22 | Sony Corporation | Electronic image stabilization apparatus |
| US5294799A (en) | 1993-02-01 | 1994-03-15 | Aslund Nils R D | Apparatus for quantitative imaging of multiple fluorophores |
| US5296700A (en) | 1991-09-12 | 1994-03-22 | Nikon Corporation | Fluorescent confocal microscope with chromatic aberration compensation |
| US5303026A (en) | 1991-02-26 | 1994-04-12 | The Regents Of The University Of California Los Alamos National Laboratory | Apparatus and method for spectroscopic analysis of scattering media |
| US5306902A (en) | 1992-09-01 | 1994-04-26 | International Business Machines Corporation | Confocal method and apparatus for focusing in projection lithography |
| US5313567A (en) | 1991-06-13 | 1994-05-17 | At&T Bell Laboratories | Arrangement for determining and displaying volumetric data in an imaging system |
| US5319200A (en) | 1991-06-05 | 1994-06-07 | Zeltex, Inc. | Rapid near-infrared measurement of nonhomogeneous samples |
| US5321501A (en) | 1991-04-29 | 1994-06-14 | Massachusetts Institute Of Technology | Method and apparatus for optical imaging with means for controlling the longitudinal range of the sample |
| US5324979A (en) | 1990-09-26 | 1994-06-28 | Futrex, Inc. | Method and means for generating synthetic spectra allowing quantitative measurement in near infrared measuring instruments |
| US5325846A (en) | 1992-07-27 | 1994-07-05 | Linvatec Corporation | Endoscopic draping apparatus and method |
| US5329352A (en) | 1991-04-12 | 1994-07-12 | Bayer Aktiengesellschaft | Spectroscopically correlated light scanning microscopy |
| US5337734A (en) | 1992-10-29 | 1994-08-16 | Advanced Polymers, Incorporated | Disposable sheath with optically transparent window formed continuously integral therewith |
| US5343038A (en) | 1991-12-12 | 1994-08-30 | Matsushita Electric Industrial Co., Ltd. | Scanning laser microscope with photo coupling and detecting unit |
| US5345306A (en) | 1990-05-22 | 1994-09-06 | Research Development Corporation Of Japan | Method and apparatus for measuring spectral absorption in an opaque specimen and method and apparatus for measuring the microscopic absorption distribution |
| WO1994026168A1 (en) | 1993-05-12 | 1994-11-24 | Board Of Regents, The University Of Texas System | Diagnosis of dysplasia using laser induced fluorescence |
| WO1995000067A1 (en) | 1993-06-18 | 1995-01-05 | Infra-Temp, Inc. | Electronic thermometer probe cover |
| WO1995004385A1 (en) | 1993-07-27 | 1995-02-09 | Microsulis Limited | Treatment apparatus |
| US5398685A (en) | 1992-01-10 | 1995-03-21 | Wilk; Peter J. | Endoscopic diagnostic system and associated method |
| US5402768A (en) | 1992-09-01 | 1995-04-04 | Adair; Edwin L. | Endoscope with reusable core and disposable sheath with passageways |
| US5406939A (en) | 1994-02-14 | 1995-04-18 | Bala; Harry | Endoscope sheath |
| US5413108A (en) | 1993-04-21 | 1995-05-09 | The Research Foundation Of City College Of New York | Method and apparatus for mapping a tissue sample for and distinguishing different regions thereof based on luminescence measurements of cancer-indicative native fluorophor |
| US5415157A (en) | 1993-02-05 | 1995-05-16 | Welcome; Steven | Damage preventing endoscope head cover |
| US5418797A (en) | 1993-01-15 | 1995-05-23 | The United States Of America As Represented By The Secretary Of The Navy | Time gated imaging through scattering material using polarization and stimulated raman amplification |
| US5419311A (en) | 1993-02-18 | 1995-05-30 | Olympus Optical Co., Ltd. | Endoscope apparatus of a type having cover for covering the endoscope |
| US5419323A (en) | 1988-12-21 | 1995-05-30 | Massachusetts Institute Of Technology | Method for laser induced fluorescence of tissue |
| US5421337A (en) | 1989-04-14 | 1995-06-06 | Massachusetts Institute Of Technology | Spectral diagnosis of diseased tissue |
| US5424543A (en) | 1993-04-19 | 1995-06-13 | Surface Optics Corporation | Imaging spectroradiometer |
| US5451931A (en) | 1992-09-14 | 1995-09-19 | Cerberus Ag | Optical smoke detector |
| US5450857A (en) | 1994-05-19 | 1995-09-19 | Board Of Regents, The University Of Texas System | Method for the diagnosis of cervical changes |
| US5458133A (en) | 1993-03-15 | 1995-10-17 | Olympus Optical Co., Ltd. | Cover type endoscope apparatus |
| US5458132A (en) | 1993-03-15 | 1995-10-17 | Olympus Optical Co., Ltd. | Endoscope cover-sheathed endoscope system |
| US5467767A (en) | 1991-11-25 | 1995-11-21 | Alfano; Robert R. | Method for determining if tissue is malignant as opposed to non-malignant using time-resolved fluorescence spectroscopy |
| US5469853A (en) | 1992-12-11 | 1995-11-28 | Tetrad Corporation | Bendable ultrasonic probe and sheath for use therewith |
| US5477382A (en) | 1994-08-05 | 1995-12-19 | Northrop Grumman Corporation | Optical correlator system |
| EP0689045A1 (en) | 1994-06-23 | 1995-12-27 | Koninklijke Philips Electronics N.V. | Multi-frequency modulation spectrometer |
| US5480775A (en) | 1990-01-26 | 1996-01-02 | Canon Kabushiki Kaisha | Method for measuring a specimen by the use of fluorescent light |
| US5493444A (en) | 1994-04-28 | 1996-02-20 | The United States Of America As Represented By The Secretary Of The Air Force | Photorefractive two-beam coupling nonlinear joint transform correlator |
| US5496259A (en) | 1993-09-13 | 1996-03-05 | Welch Allyn, Inc. | Sterile protective sheath and drape for video laparoscope and method of use |
| US5507295A (en) | 1992-07-01 | 1996-04-16 | British Technology Group Limited | Medical devices |
| US5516010A (en) | 1984-10-23 | 1996-05-14 | Sherwood Medical Company | Sanitary speculum for tympanic thermometer probe |
| US5519545A (en) | 1993-11-30 | 1996-05-21 | Sony Corporation | Digital signal recording circuit using a rotary transformer with a reduced-jitter low-frequency compensation circuit |
| US5529235A (en) | 1994-04-28 | 1996-06-25 | Ethicon Endo-Surgery, Inc. | Identification device for surgical instrument |
| US5536236A (en) | 1993-02-12 | 1996-07-16 | Olympus Optical Co., Ltd. | Covered endoscope system |
| US5545121A (en) | 1993-02-02 | 1996-08-13 | Olympus Optical Co., Ltd. | Cover-type endoscope apparatus |
| US5551945A (en) | 1993-03-16 | 1996-09-03 | Olympus Optical Co., Ltd. | Endoscope system including endoscope and protection cover |
| US5556367A (en) | 1993-03-05 | 1996-09-17 | Olympus Optical Co., Ltd. | Cover type endoscope apparatus |
| EP0737849A2 (en) | 1995-04-12 | 1996-10-16 | Kyoto Daiichi Kagaku Co., Ltd. | Method of stabilizing spectra in spectometry |
| JPH08280602A (en) | 1995-04-14 | 1996-10-29 | Olympus Optical Co Ltd | Cover type endoscope |
| US5579773A (en) | 1994-09-30 | 1996-12-03 | Martin Marietta Energy Systems, Inc. | Laser-induced differential normalized fluorescence method for cancer diagnosis |
| US5587832A (en) | 1993-10-20 | 1996-12-24 | Biophysica Technologies, Inc. | Spatially light modulated confocal microscope and method |
| US5596992A (en) | 1993-06-30 | 1997-01-28 | Sandia Corporation | Multivariate classification of infrared spectra of cell and tissue samples |
| US5599717A (en) | 1994-09-02 | 1997-02-04 | Martin Marietta Energy Systems, Inc. | Advanced synchronous luminescence system |
| WO1997005473A1 (en) | 1995-08-01 | 1997-02-13 | Medispectra, Inc. | Optical microprobes and methods for spectral analysis of materials |
| US5609560A (en) | 1992-08-19 | 1997-03-11 | Olympus Optical Co., Ltd. | Medical operation device control system for controlling a operation devices accessed respectively by ID codes |
| US5612540A (en) | 1995-03-31 | 1997-03-18 | Board Of Regents, The University Of Texas Systems | Optical method for the detection of cervical neoplasias using fluorescence spectroscopy |
| US5643175A (en) | 1992-09-01 | 1997-07-01 | Adair; Edwin L. | Sterilizable endoscope with separable disposable tube assembly |
| US5647368A (en) | 1996-02-28 | 1997-07-15 | Xillix Technologies Corp. | Imaging system for detecting diseased tissue using native fluorsecence in the gastrointestinal and respiratory tract |
| US5662588A (en) | 1994-05-31 | 1997-09-02 | Olympus Optical Co., Ltd. | Endoscope apparatus |
| US5685822A (en) | 1996-08-08 | 1997-11-11 | Vision-Sciences, Inc. | Endoscope with sheath retaining device |
| US5690106A (en) | 1995-06-30 | 1997-11-25 | Siemens Corporate Research, Inc. | Flexible image registration for rotational angiography |
| US5693043A (en) | 1985-03-22 | 1997-12-02 | Massachusetts Institute Of Technology | Catheter for laser angiosurgery |
| US5695448A (en) | 1994-08-29 | 1997-12-09 | Olympus Optical Co., Ltd. | Endoscopic sheath |
| US5697373A (en) | 1995-03-14 | 1997-12-16 | Board Of Regents, The University Of Texas System | Optical method and apparatus for the diagnosis of cervical precancers using raman and fluorescence spectroscopies |
| US5699795A (en) | 1995-03-31 | 1997-12-23 | Board Of Regents, The University Of Texas System | Optical probe for the detection of cervical neoplasia using fluorescence spectroscopy and apparatus incorporating same |
| WO1997048331A1 (en) | 1996-06-19 | 1997-12-24 | Board Of Regents, The University Of Texas System | Method and apparatus for diagnosing squamous intraepithelial lesions of the cervix using fluorescence spectroscopy |
| US5704892A (en) | 1992-09-01 | 1998-01-06 | Adair; Edwin L. | Endoscope with reusable core and disposable sheath with passageways |
| US5713364A (en) | 1995-08-01 | 1998-02-03 | Medispectra, Inc. | Spectral volume microprobe analysis of materials |
| US5717209A (en) | 1996-04-29 | 1998-02-10 | Petrometrix Ltd. | System for remote transmission of spectral information through communication optical fibers for real-time on-line hydrocarbons process analysis by near infra red spectroscopy |
| WO1998005253A1 (en) | 1996-08-02 | 1998-02-12 | The Board Of Regents, The University Of Texas System | Method and apparatus for the characterization of tissue of epithelial lined viscus |
| US5730701A (en) | 1995-09-12 | 1998-03-24 | Olympus Optical Co., Ltd. | Endoscope |
| US5733244A (en) | 1995-03-13 | 1998-03-31 | Asahi Kogaku Kogyo Kabushiki Kaisha | Distal end part of endoscope |
| US5735276A (en) | 1995-03-21 | 1998-04-07 | Lemelson; Jerome | Method and apparatus for scanning and evaluating matter |
| US5746695A (en) | 1993-11-18 | 1998-05-05 | Asahi Kogaku Kogyo Kabushiki Kaisha | Front end structure of endoscope |
| WO1998024369A1 (en) | 1996-12-02 | 1998-06-11 | The University Of Texas System | Spectroscopic detection of cervical pre-cancer using radial basis function networks |
| US5768333A (en) | 1996-12-02 | 1998-06-16 | Philips Electronics N.A. Corporation | Mass detection in digital radiologic images using a two stage classifier |
| US5769792A (en) | 1991-07-03 | 1998-06-23 | Xillix Technologies Corp. | Endoscopic imaging system for diseased tissue |
| US5773835A (en) | 1996-06-07 | 1998-06-30 | Rare Earth Medical, Inc. | Fiber optic spectroscopy |
| WO1998030889A1 (en) | 1997-01-13 | 1998-07-16 | Medispectra, Inc. | Spatially resolved optical measurements |
| US5791346A (en) | 1996-08-22 | 1998-08-11 | Western Research Company, Inc. | Colposcope device and method for measuring areas of cervical lesions |
| US5795632A (en) | 1996-02-06 | 1998-08-18 | Parker Laboratories | Protective cover set for a medical probe |
| US5800350A (en) | 1993-11-01 | 1998-09-01 | Polartechnics, Limited | Apparatus for tissue type recognition |
| US5807248A (en) | 1996-05-15 | 1998-09-15 | Ohmeda Inc. | Medical monitoring probe with modular device housing |
| WO1998041176A1 (en) | 1997-03-17 | 1998-09-24 | Polartechnics Limited | Sheath for a side view probe |
| US5813987A (en) | 1995-08-01 | 1998-09-29 | Medispectra, Inc. | Spectral volume microprobe for analysis of materials |
| US5817015A (en) | 1993-06-22 | 1998-10-06 | Adair; Edwin L. | Endoscope with reusable core and disposable sheath with passageways |
| US5830146A (en) | 1997-03-17 | 1998-11-03 | Polartechnics Limited | Sheathed probes for tissue type recognition |
| US5833617A (en) | 1996-03-06 | 1998-11-10 | Fuji Photo Film Co., Ltd. | Fluorescence detecting apparatus |
| US5840035A (en) | 1995-02-07 | 1998-11-24 | Siemens Aktiengesellschaft | Method for the spectroscopic examination of a biological tissue |
| US5842995A (en) | 1996-06-28 | 1998-12-01 | Board Of Regents, The Univerisity Of Texas System | Spectroscopic probe for in vivo measurement of raman signals |
| US5855551A (en) | 1997-03-17 | 1999-01-05 | Polartechnics Limited | Integral sheathing apparatus for tissue recognition probes |
| US5860913A (en) | 1996-05-16 | 1999-01-19 | Olympus Optical Co., Ltd. | Endoscope whose distal cover can be freely detachably attached to main distal part thereof with high positioning precision |
| US5863287A (en) | 1995-10-04 | 1999-01-26 | Fuji Photo Optical Co., Ltd. | Removable protector sheath for use with endoscopic insertion instrument |
| US5865726A (en) | 1996-03-27 | 1999-02-02 | Asahi Kogaku Kogyo Kabushiki Kaisha | Front end structure of side-view type endoscope |
| WO1999018847A1 (en) | 1997-10-15 | 1999-04-22 | Accumed International, Inc. | Imaging diseased tissue using autofluorescence |
| WO1999020313A1 (en) | 1997-10-20 | 1999-04-29 | The Board Of Regents, The University Of Texas System | Acetic acid as a contrast agent in reflectance confocal imaging of tissue |
| US5920399A (en) | 1997-03-18 | 1999-07-06 | Sandia Corporation | Multispectral imaging method and apparatus |
| US5921926A (en) | 1997-07-28 | 1999-07-13 | University Of Central Florida | Three dimensional optical imaging colposcopy |
| US5929985A (en) | 1997-03-18 | 1999-07-27 | Sandia Corporation | Multispectral imaging probe |
| US5931779A (en) | 1996-06-06 | 1999-08-03 | Wisconsin Alumni Research Foundation | Real-time in-vivo measurement of myoglobin oxygen saturation |
| WO1999047041A1 (en) | 1998-03-19 | 1999-09-23 | Board Of Regents, The University Of Texas System | Fiber-optic confocal imaging apparatus and methods of use |
| US5983125A (en) | 1993-12-13 | 1999-11-09 | The Research Foundation Of City College Of New York | Method and apparatus for in vivo examination of subcutaneous tissues inside an organ of a body using optical spectroscopy |
| WO1999057507A1 (en) | 1998-05-01 | 1999-11-11 | Board Of Regents, The University Of Texas System | Method and apparatus for subsurface imaging |
| US5991653A (en) | 1995-03-14 | 1999-11-23 | Board Of Regents, The University Of Texas System | Near-infrared raman spectroscopy for in vitro and in vivo detection of cervical precancers |
| US5989184A (en) | 1997-04-04 | 1999-11-23 | Medtech Research Corporation | Apparatus and method for digital photography useful in cervical cancer detection |
| US5995645A (en) | 1993-08-18 | 1999-11-30 | Applied Spectral Imaging Ltd. | Method of cancer cell detection |
| US6021344A (en) | 1996-12-04 | 2000-02-01 | Derma Technologies, Inc. | Fluorescence scope system for dermatologic diagnosis |
| WO1999057529A9 (en) | 1998-05-04 | 2000-03-02 | Univ Texas | Combined fluorescence and reflectance spectroscopy |
| WO2000015101A1 (en) | 1998-09-11 | 2000-03-23 | Spectrx, Inc. | Multi-modal optical tissue diagnostic system |
| US6058322A (en) | 1997-07-25 | 2000-05-02 | Arch Development Corporation | Methods for improving the accuracy in differential diagnosis on radiologic examinations |
| US6069689A (en) | 1997-04-16 | 2000-05-30 | Derma Technologies, Inc. | Apparatus and methods relating to optical systems for diagnosis of skin diseases |
| US6083487A (en)* | 1997-08-25 | 2000-07-04 | Advanced Photodynamic Technologies, Inc. | Methylene blue and toluidene blue mediated fluorescence diagnosis of cancer |
| US6091985A (en) | 1998-01-23 | 2000-07-18 | Research Foundation Of City College Of New York | Detection of cancer and precancerous conditions in tissues and/or cells using native fluorescence excitation spectroscopy |
| WO2000041615A1 (en) | 1999-01-11 | 2000-07-20 | Medispectra, Inc. | Spectral volume microprobe arrays |
| US6096065A (en) | 1997-09-29 | 2000-08-01 | Boston Scientific Corporation | Sheath for tissue spectroscopy |
| US6099464A (en) | 1995-04-10 | 2000-08-08 | Olympus Optical Co., Ltd. | Bending sheath for probe |
| US6119031A (en) | 1996-11-21 | 2000-09-12 | Boston Scientific Corporation | Miniature spectrometer |
| US6124597A (en) | 1997-07-07 | 2000-09-26 | Cedars-Sinai Medical Center | Method and devices for laser induced fluorescence attenuation spectroscopy |
| WO2000057361A1 (en) | 1999-03-19 | 2000-09-28 | Isis Innovation Limited | Method and apparatus for image processing |
| US6146897A (en) | 1995-11-13 | 2000-11-14 | Bio-Rad Laboratories | Method for the detection of cellular abnormalities using Fourier transform infrared spectroscopy |
| US6169817B1 (en) | 1998-11-04 | 2001-01-02 | University Of Rochester | System and method for 4D reconstruction and visualization |
| US6208887B1 (en) | 1999-06-24 | 2001-03-27 | Richard H. Clarke | Catheter-delivered low resolution Raman scattering analyzing system for detecting lesions |
| US6243601B1 (en) | 1998-09-18 | 2001-06-05 | Abund Ottokar Wist | Transillumination imaging instrumentation with scattered light discrimination |
| US6246479B1 (en) | 1998-06-08 | 2001-06-12 | Lj Laboratories, L.L.C. | Integrated spectrometer assembly and methods |
| US6246471B1 (en) | 1998-06-08 | 2001-06-12 | Lj Laboratories, Llc | Apparatus and method for measuring optical characteristics of an object |
| WO2000059366A3 (en) | 1999-04-07 | 2001-06-28 | Blue Lake Products Inc | Identification of protective covers for medical imaging devices |
| WO2000074556A3 (en) | 1999-06-09 | 2001-07-12 | Medispectra Inc | An optical probe accessory device for use in in vivo diagnostic procedures |
| US6285639B1 (en) | 1998-04-29 | 2001-09-04 | Sony Corporation | On-the-fly of jitter during optical disc mastering/recording |
| US6312385B1 (en) | 2000-05-01 | 2001-11-06 | Ge Medical Systems Global Technology Company, Llc | Method and apparatus for automatic detection and sizing of cystic objects |
| US6317617B1 (en) | 1997-07-25 | 2001-11-13 | Arch Development Corporation | Method, computer program product, and system for the automated analysis of lesions in magnetic resonance, mammogram and ultrasound images |
| US20020007123A1 (en) | 2000-03-28 | 2002-01-17 | Constantinos Balas | Method and system for characterization and mapping of tissue lesions |
| US20020007122A1 (en) | 1999-12-15 | 2002-01-17 | Howard Kaufman | Methods of diagnosing disease |
| USD453832S1 (en) | 2001-02-09 | 2002-02-19 | Medispectra, Inc. | Sheath for cervical optical probe |
| USD453964S1 (en) | 2001-02-09 | 2002-02-26 | Medispectra, Inc. | Sheath for cervical optical probe |
| USD453962S1 (en) | 2001-02-09 | 2002-02-26 | Medispectra, Inc. | Sheath for cervical optical probe |
| USD453963S1 (en) | 2001-02-09 | 2002-02-26 | Medispectra, Inc. | Sheath for cervical optical probe |
| US6377842B1 (en) | 1998-09-22 | 2002-04-23 | Aurora Optics, Inc. | Method for quantitative measurement of fluorescent and phosphorescent drugs within tissue utilizing a fiber optic probe |
| US6385484B2 (en) | 1998-12-23 | 2002-05-07 | Medispectra, Inc. | Spectroscopic system employing a plurality of data types |
| USD460821S1 (en) | 2001-02-09 | 2002-07-23 | Medispectra, Inc. | Sheath for cervical optical probe |
| US6427082B1 (en) | 1998-12-23 | 2002-07-30 | Medispectra, Incorporated | Optical methods and systems for rapid screening of the cervix |
| US20020107668A1 (en) | 2000-12-15 | 2002-08-08 | Costa Peter J. | System for normalizing spectra |
| EP0641542B1 (en) | 1993-09-03 | 2002-11-27 | Ken Ishihara | Non-invasive blood analyzer |
| US20030095721A1 (en) | 1999-12-15 | 2003-05-22 | Thomas Clune | Methods and systems for correcting image misalignment |
| US6574502B2 (en) | 1999-12-02 | 2003-06-03 | Fuji Photo Film Co., Ltd. | Apparatus for displaying fluorescence images |
| US20030144585A1 (en) | 1999-12-15 | 2003-07-31 | Howard Kaufman | Image processing using measures of similarity |
| US20040010187A1 (en) | 2002-07-10 | 2004-01-15 | Schomacker Kevin T. | Colonic polyp discrimination by tissue fluorescence and fiberoptic probe |
| US20040010195A1 (en) | 2002-07-10 | 2004-01-15 | Zelenchuk Alex R. | Fluorescent fiberoptic probe for tissue health discrimination and method of use thereof |
| US20040007674A1 (en) | 2002-07-09 | 2004-01-15 | Schomacker Kevin T. | Method and apparatus for identifying spectral artifacts |
Family Cites Families (7)
| Publication number | Priority date | Publication date | Assignee | Title |
|---|---|---|---|---|
| US34214A (en)* | 1862-01-21 | Improvement in washers for paper-pulp | ||
| US5218703A (en)* | 1988-07-07 | 1993-06-08 | Siemens Aktiengesellschaft | Circuit configuration and method for priority selection of interrupts for a microprocessor |
| US5699798A (en)* | 1990-08-10 | 1997-12-23 | University Of Washington | Method for optically imaging solid tumor tissue |
| US6150157A (en)* | 1994-09-23 | 2000-11-21 | The Regents Of The University Of California | Reductive dehalogenation of organic halides in contaminated groundwater |
| US5756132A (en)* | 1996-05-03 | 1998-05-26 | Domain, Inc. | Milk replacer for calves, and method |
| US6620611B2 (en)* | 2001-01-06 | 2003-09-16 | Geovation Technologies, Inc. | Solid-chemical composition for sustained release of organic substrates and complex inorganic phosphates for bioremediation |
| US6933154B2 (en)* | 2002-07-09 | 2005-08-23 | Medispectra, Inc. | Optimal windows for obtaining optical data for characterization of tissue samples |
- 2002
- 2002-11-15USUS10/295,794patent/US6933154B2/ennot_activeExpired - Fee Related
- 2003
- 2003-07-08WOPCT/US2003/020998patent/WO2004005885A2/ennot_activeApplication Discontinuation
- 2003-07-08AUAU2003248819Apatent/AU2003248819A1/ennot_activeAbandoned
- 2003-07-08CACA002491561Apatent/CA2491561A1/ennot_activeAbandoned
- 2003-07-08EPEP03763174Apatent/EP1700105A4/ennot_activeWithdrawn
- 2004
- 2004-04-21USUS10/828,624patent/US20040204648A1/ennot_activeAbandoned
Patent Citations (264)
| Publication number | Priority date | Publication date | Assignee | Title |
|---|---|---|---|---|
| US3013467A (en) | 1957-11-07 | 1961-12-19 | Minsky Marvin | Microscopy apparatus |
| US3632865A (en) | 1969-12-23 | 1972-01-04 | Bell Telephone Labor Inc | Predictive video encoding using measured subject velocity |
| US3809072A (en) | 1971-10-07 | 1974-05-07 | Med General Inc | Sterile sheath apparatus for fiber optic illuminator with compatible lens |
| US3890462A (en) | 1974-04-17 | 1975-06-17 | Bell Telephone Labor Inc | Speed and direction indicator for video systems |
| US3963019A (en) | 1974-11-25 | 1976-06-15 | Quandt Robert S | Ocular testing method and apparatus |
| US4017192A (en) | 1975-02-06 | 1977-04-12 | Neotec Corporation | Optical analysis of biomedical specimens |
| US4071020A (en) | 1976-06-03 | 1978-01-31 | Xienta, Inc. | Apparatus and methods for performing in-vivo measurements of enzyme activity |
| US4198571A (en) | 1977-04-28 | 1980-04-15 | National Research Development Corporation | Scanning microscopes |
| US4273110A (en) | 1978-07-13 | 1981-06-16 | Jean Groux | Ultraviolet endoscope |
| US4218703A (en) | 1979-03-16 | 1980-08-19 | Bell Telephone Laboratories, Incorporated | Technique for estimation of displacement and/or velocity of objects in video scenes |
| US4357075A (en) | 1979-07-02 | 1982-11-02 | Hunter Thomas M | Confocal reflector system |
| US4254421A (en) | 1979-12-05 | 1981-03-03 | Communications Satellite Corporation | Integrated confocal electromagnetic wave lens and feed antenna system |
| US4397557A (en) | 1979-12-20 | 1983-08-09 | Heimann Gmbh | Optical arrangement for a light scattering type smoke detector |
| US4515165A (en) | 1980-02-04 | 1985-05-07 | Energy Conversion Devices, Inc. | Apparatus and method for detecting tumors |
| US4753530A (en) | 1980-08-21 | 1988-06-28 | Oriel Scientific Ltd. | Analytical optical instruments |
| US4549229A (en) | 1982-02-01 | 1985-10-22 | Sony Corporation | Method and apparatus for compensating for tape jitter during recording and reproducing of a video signal and PCM audio signal |
| US4558462A (en) | 1982-09-02 | 1985-12-10 | Hitachi Medical Corporation | Apparatus for correcting image distortions automatically by inter-image processing |
| EP0135134A2 (en) | 1983-08-11 | 1985-03-27 | Vitacomm Ltd | Esophageal stethoscope and vital signs monitor system |
| US5139025A (en) | 1983-10-14 | 1992-08-18 | Somanetics Corporation | Method and apparatus for in vivo optical spectroscopic examination |
| US5349961A (en) | 1983-10-14 | 1994-09-27 | Somanetics Corporation | Method and apparatus for in vivo optical spectroscopic examination |
| USRE34214E (en) | 1984-03-15 | 1993-04-06 | Molecular Dynamics, Inc. | Method and apparatus for microphotometering microscope specimens |
| US4641352A (en) | 1984-07-12 | 1987-02-03 | Paul Fenster | Misregistration correction |
| US5707343A (en) | 1984-10-23 | 1998-01-13 | O'hara; Gary J. | Disposable sanitary speculum for timpanic thermometer probe |
| US4662360A (en) | 1984-10-23 | 1987-05-05 | Intelligent Medical Systems, Inc. | Disposable speculum |
| US5516010A (en) | 1984-10-23 | 1996-05-14 | Sherwood Medical Company | Sanitary speculum for tympanic thermometer probe |
| US4646722A (en) | 1984-12-10 | 1987-03-03 | Opielab, Inc. | Protective endoscope sheath and method of installing same |
| US5199431A (en) | 1985-03-22 | 1993-04-06 | Massachusetts Institute Of Technology | Optical needle for spectroscopic diagnosis |
| US5693043A (en) | 1985-03-22 | 1997-12-02 | Massachusetts Institute Of Technology | Catheter for laser angiosurgery |
| US5042494A (en) | 1985-11-13 | 1991-08-27 | Alfano Robert R | Method and apparatus for detecting cancerous tissue using luminescence excitation spectra |
| US4930516A (en) | 1985-11-13 | 1990-06-05 | Alfano Robert R | Method for detecting cancerous tissue using visible native luminescence |
| US4930516B1 (en) | 1985-11-13 | 1998-08-04 | Laser Diagnostic Instr Inc | Method for detecting cancerous tissue using visible native luminescence |
| US4733063A (en) | 1985-12-13 | 1988-03-22 | Hitachi, Ltd. | Scanning laser microscope with aperture alignment |
| US4768513A (en) | 1986-04-21 | 1988-09-06 | Agency Of Industrial Science And Technology | Method and device for measuring and processing light |
| US5011243A (en) | 1986-09-16 | 1991-04-30 | Laser Precision Corporation | Reflectance infrared microscope having high radiation throughput |
| US4852955A (en) | 1986-09-16 | 1989-08-01 | Laser Precision Corporation | Microscope for use in modular FTIR spectrometer system |
| US4741326A (en) | 1986-10-01 | 1988-05-03 | Fujinon, Inc. | Endoscope disposable sheath |
| US4891829A (en) | 1986-11-19 | 1990-01-02 | Exxon Research And Engineering Company | Method and apparatus for utilizing an electro-optic detector in a microtomography system |
| US4845352A (en) | 1986-12-08 | 1989-07-04 | U.S. Philips Corporation | Scanning differential phase contrast microscope |
| EP0280418A1 (en) | 1987-02-02 | 1988-08-31 | Wyatt Technology Corporation | Method and apparatus for examining the interior of semi-opaque objects |
| US5054926A (en) | 1987-03-24 | 1991-10-08 | Commonwealth Scientific And Industrial Research Organisation | Distance measuring device |
| US5235457A (en) | 1987-09-24 | 1993-08-10 | Washington University | Kit for converting a standard microscope into a single aperture confocal scanning epi-illumination microscope |
| US4945478A (en) | 1987-11-06 | 1990-07-31 | Center For Innovative Technology | Noninvasive medical imaging system and method for the identification and 3-D display of atherosclerosis and the like |
| US4800571A (en) | 1988-01-11 | 1989-01-24 | Tektronix, Inc. | Timing jitter measurement display |
| US4844617A (en) | 1988-01-20 | 1989-07-04 | Tencor Instruments | Confocal measuring microscope with automatic focusing |
| US4965441A (en) | 1988-01-27 | 1990-10-23 | Commissariat A L'energie Atomique | Method for the scanning confocal light-optical microscopic and indepth examination of an extended field and devices for implementing said method |
| US4997242A (en) | 1988-03-07 | 1991-03-05 | Medical Research Council | Achromatic scanning system |
| EP0335725A3 (en) | 1988-04-01 | 1991-03-27 | Syntex (U.S.A.) Inc. | Apparatus and method for detection of fluorescence or light scatter |
| US5032720A (en) | 1988-04-21 | 1991-07-16 | White John G | Confocal imaging system |
| US4877033A (en) | 1988-05-04 | 1989-10-31 | Seitz Jr H Michael | Disposable needle guide and examination sheath for transvaginal ultrasound procedures |
| US4974580A (en) | 1988-06-25 | 1990-12-04 | Effner Gmbh | Endoscope protective member |
| US5120953A (en) | 1988-07-13 | 1992-06-09 | Harris Martin R | Scanning confocal microscope including a single fibre for transmitting light to and receiving light from an object |
| US5161053A (en) | 1988-08-01 | 1992-11-03 | Commonwealth Scientific & Industrial Research | Confocal microscope |
| US5036853A (en) | 1988-08-26 | 1991-08-06 | Polartechnics Ltd. | Physiological probe |
| US5101825A (en) | 1988-10-28 | 1992-04-07 | Blackbox, Inc. | Method for noninvasive intermittent and/or continuous hemoglobin, arterial oxygen content, and hematocrit determination |
| US5419323A (en) | 1988-12-21 | 1995-05-30 | Massachusetts Institute Of Technology | Method for laser induced fluorescence of tissue |
| US5562100A (en) | 1988-12-21 | 1996-10-08 | Massachusetts Institute Of Technology | Method for laser induced fluorescence of tissue |
| US5022757A (en) | 1989-01-23 | 1991-06-11 | Modell Mark D | Heterodyne system and method for sensing a target substance |
| US4878485A (en) | 1989-02-03 | 1989-11-07 | Adair Edwin Lloyd | Rigid video endoscope with heat sterilizable sheath |
| US5003979A (en) | 1989-02-21 | 1991-04-02 | University Of Virginia | System and method for the noninvasive identification and display of breast lesions and the like |
| US5421337A (en) | 1989-04-14 | 1995-06-06 | Massachusetts Institute Of Technology | Spectral diagnosis of diseased tissue |
| US5201318A (en) | 1989-04-24 | 1993-04-13 | Rava Richard P | Contour mapping of spectral diagnostics |
| US5345941A (en) | 1989-04-24 | 1994-09-13 | Massachusetts Institute Of Technology | Contour mapping of spectral diagnostics |
| US4972258A (en) | 1989-07-31 | 1990-11-20 | E. I. Du Pont De Nemours And Company | Scanning laser microscope system and methods of use |
| US5122653A (en) | 1989-08-22 | 1992-06-16 | Nikon Corporation | Confocal type laser scan microscope with integrated illumination, detection and waveguide system |
| US5065008A (en) | 1989-10-18 | 1991-11-12 | Fuji Photo Film Co., Ltd. | Scanning microscope and scanning mechanism for the same |
| US5071246A (en) | 1989-10-27 | 1991-12-10 | Carl-Zeiss-Stiftung | Confocal scanning ophthalmoscope |
| US4979498A (en) | 1989-10-30 | 1990-12-25 | Machida Incorporated | Video cervicoscope system |
| US5034613A (en) | 1989-11-14 | 1991-07-23 | Cornell Research Foundation, Inc. | Two-photon laser microscopy |
| US5257617A (en) | 1989-12-25 | 1993-11-02 | Asahi Kogaku Kogyo Kabushiki Kaisha | Sheathed endoscope and sheath therefor |
| US5028802A (en) | 1990-01-11 | 1991-07-02 | Eye Research Institute Of Retina Foundation | Imaging apparatus and methods utilizing scannable microlaser source |
| US5274240A (en) | 1990-01-12 | 1993-12-28 | The Regents Of The University Of California | Capillary array confocal fluorescence scanner and method |
| US5091652A (en) | 1990-01-12 | 1992-02-25 | The Regents Of The University Of California | Laser excited confocal microscope fluorescence scanner and method |
| US5480775A (en) | 1990-01-26 | 1996-01-02 | Canon Kabushiki Kaisha | Method for measuring a specimen by the use of fluorescent light |
| US5154166A (en) | 1990-02-01 | 1992-10-13 | Machida Endoscope Co., Ltd. | Endoscope cover |
| US5159919A (en) | 1990-02-01 | 1992-11-03 | Machida Endoscope Co., Ltd. | Endoscope cover |
| US5074306A (en) | 1990-02-22 | 1991-12-24 | The General Hospital Corporation | Measurement of burn depth in skin |
| EP0444689A2 (en) | 1990-03-01 | 1991-09-04 | X-Rite, Inc. | A compensation method adapted for use in color measuring apparatus |
| US5083220A (en) | 1990-03-22 | 1992-01-21 | Tandem Scanning Corporation | Scanning disks for use in tandem scanning reflected light microscopes and other optical systems |
| US5132526A (en) | 1990-04-10 | 1992-07-21 | Fuji Photo Film Co., Ltd. | Confocal scanning microscope having a signal output regulating means |
| US5048946A (en) | 1990-05-15 | 1991-09-17 | Phoenix Laser Systems, Inc. | Spectral division of reflected light in complex optical diagnostic and therapeutic systems |
| US5345306A (en) | 1990-05-22 | 1994-09-06 | Research Development Corporation Of Japan | Method and apparatus for measuring spectral absorption in an opaque specimen and method and apparatus for measuring the microscopic absorption distribution |
| US5192980A (en) | 1990-06-27 | 1993-03-09 | A. E. Dixon | Apparatus and method for method for spatially- and spectrally-resolved measurements |
| US5262646A (en) | 1990-07-27 | 1993-11-16 | Booker Graham R | Infra-red scanning microscopy |
| US5324979A (en) | 1990-09-26 | 1994-06-28 | Futrex, Inc. | Method and means for generating synthetic spectra allowing quantitative measurement in near infrared measuring instruments |
| US5239178A (en) | 1990-11-10 | 1993-08-24 | Carl Zeiss | Optical device with an illuminating grid and detector grid arranged confocally to an object |
| US5168157A (en) | 1990-11-20 | 1992-12-01 | Fuji Photo Film Co., Ltd. | Scanning microscope with means for detecting a first and second polarized light beams along first and second optical receiving paths |
| US5193525A (en) | 1990-11-30 | 1993-03-16 | Vision Sciences | Antiglare tip in a sheath for an endoscope |
| US5289274A (en) | 1991-02-06 | 1994-02-22 | Sony Corporation | Electronic image stabilization apparatus |
| US5261410A (en) | 1991-02-07 | 1993-11-16 | Alfano Robert R | Method for determining if a tissue is a malignant tumor tissue, a benign tumor tissue, or a normal or benign tissue using Raman spectroscopy |
| US5162641A (en) | 1991-02-19 | 1992-11-10 | Phoenix Laser Systems, Inc. | System and method for detecting, correcting and measuring depth movement of target tissue in a laser surgical system |
| US5286964A (en) | 1991-02-19 | 1994-02-15 | Phoenix Laser Systems, Inc. | System for detecting, correcting and measuring depth movement of a target |
| US5303026A (en) | 1991-02-26 | 1994-04-12 | The Regents Of The University Of California Los Alamos National Laboratory | Apparatus and method for spectroscopic analysis of scattering media |
| US5260578A (en) | 1991-04-10 | 1993-11-09 | Mayo Foundation For Medical Education And Research | Confocal imaging system for visible and ultraviolet light |
| US5329352A (en) | 1991-04-12 | 1994-07-12 | Bayer Aktiengesellschaft | Spectroscopically correlated light scanning microscopy |
| EP0474264A3 (en) | 1991-04-24 | 1993-06-16 | Kaman Aerospace Corporation | Spectrally dispersive imaging lidar method and apparatus |
| US5321501A (en) | 1991-04-29 | 1994-06-14 | Massachusetts Institute Of Technology | Method and apparatus for optical imaging with means for controlling the longitudinal range of the sample |
| WO1992019148A1 (en) | 1991-05-06 | 1992-11-12 | Adair Edwin Lloyd | Cervical videoscope with detachable camera unit |
| US5225671A (en) | 1991-05-29 | 1993-07-06 | Olympus Optical Co., Ltd. | Confocal optical apparatus |
| US5319200A (en) | 1991-06-05 | 1994-06-07 | Zeltex, Inc. | Rapid near-infrared measurement of nonhomogeneous samples |
| US5201908A (en) | 1991-06-10 | 1993-04-13 | Endomedical Technologies, Inc. | Sheath for protecting endoscope from contamination |
| US5313567A (en) | 1991-06-13 | 1994-05-17 | At&T Bell Laboratories | Arrangement for determining and displaying volumetric data in an imaging system |
| US5237984A (en) | 1991-06-24 | 1993-08-24 | Xomed-Treace Inc. | Sheath for endoscope |
| US5413092A (en) | 1991-06-24 | 1995-05-09 | Xomed-Treace, Inc. | Sheath for endoscope |
| US5769792A (en) | 1991-07-03 | 1998-06-23 | Xillix Technologies Corp. | Endoscopic imaging system for diseased tissue |
| US5582168A (en) | 1991-07-17 | 1996-12-10 | Georgia Tech Research Corp. | Apparatus and methods for measuring characteristics of biological tissues and similar materials |
| US5203328A (en) | 1991-07-17 | 1993-04-20 | Georgia Tech Research Corporation | Apparatus and methods for quantitatively measuring molecular changes in the ocular lens |
| US5162941A (en) | 1991-07-23 | 1992-11-10 | The Board Of Governors Of Wayne State University | Confocal microscope |
| US5260569A (en) | 1991-07-25 | 1993-11-09 | Fuji Photo Film Co., Ltd. | Scanning microscope and scanning mechanism |
| US5296700A (en) | 1991-09-12 | 1994-03-22 | Nikon Corporation | Fluorescent confocal microscope with chromatic aberration compensation |
| US5467767A (en) | 1991-11-25 | 1995-11-21 | Alfano; Robert R. | Method for determining if tissue is malignant as opposed to non-malignant using time-resolved fluorescence spectroscopy |
| US5343038A (en) | 1991-12-12 | 1994-08-30 | Matsushita Electric Industrial Co., Ltd. | Scanning laser microscope with photo coupling and detecting unit |
| US5253071A (en) | 1991-12-20 | 1993-10-12 | Sony Corporation Of America | Method and apparatus for stabilizing an image produced in a video camera |
| US5398685A (en) | 1992-01-10 | 1995-03-21 | Wilk; Peter J. | Endoscopic diagnostic system and associated method |
| US5284149A (en) | 1992-01-23 | 1994-02-08 | Dhadwal Harbans S | Method and apparatus for determining the physical characteristics of ocular tissue |
| WO1993014688A1 (en) | 1992-01-24 | 1993-08-05 | Frantz Medical Development, Ltd. | Endoscope sterile liquid supply system |
| US5248876A (en) | 1992-04-21 | 1993-09-28 | International Business Machines Corporation | Tandem linear scanning confocal imaging system with focal volumes at different heights |
| US5507295A (en) | 1992-07-01 | 1996-04-16 | British Technology Group Limited | Medical devices |
| US5325846A (en) | 1992-07-27 | 1994-07-05 | Linvatec Corporation | Endoscopic draping apparatus and method |
| US5609560A (en) | 1992-08-19 | 1997-03-11 | Olympus Optical Co., Ltd. | Medical operation device control system for controlling a operation devices accessed respectively by ID codes |
| US5643175A (en) | 1992-09-01 | 1997-07-01 | Adair; Edwin L. | Sterilizable endoscope with separable disposable tube assembly |
| US5704892A (en) | 1992-09-01 | 1998-01-06 | Adair; Edwin L. | Endoscope with reusable core and disposable sheath with passageways |
| US5402768A (en) | 1992-09-01 | 1995-04-04 | Adair; Edwin L. | Endoscope with reusable core and disposable sheath with passageways |
| US5306902A (en) | 1992-09-01 | 1994-04-26 | International Business Machines Corporation | Confocal method and apparatus for focusing in projection lithography |
| US5451931A (en) | 1992-09-14 | 1995-09-19 | Cerberus Ag | Optical smoke detector |
| US5337734A (en) | 1992-10-29 | 1994-08-16 | Advanced Polymers, Incorporated | Disposable sheath with optically transparent window formed continuously integral therewith |
| US5469853A (en) | 1992-12-11 | 1995-11-28 | Tetrad Corporation | Bendable ultrasonic probe and sheath for use therewith |
| US5418797A (en) | 1993-01-15 | 1995-05-23 | The United States Of America As Represented By The Secretary Of The Navy | Time gated imaging through scattering material using polarization and stimulated raman amplification |
| US5294799A (en) | 1993-02-01 | 1994-03-15 | Aslund Nils R D | Apparatus for quantitative imaging of multiple fluorophores |
| US5545121A (en) | 1993-02-02 | 1996-08-13 | Olympus Optical Co., Ltd. | Cover-type endoscope apparatus |
| US5415157A (en) | 1993-02-05 | 1995-05-16 | Welcome; Steven | Damage preventing endoscope head cover |
| US5536236A (en) | 1993-02-12 | 1996-07-16 | Olympus Optical Co., Ltd. | Covered endoscope system |
| US5419311A (en) | 1993-02-18 | 1995-05-30 | Olympus Optical Co., Ltd. | Endoscope apparatus of a type having cover for covering the endoscope |
| US5556367A (en) | 1993-03-05 | 1996-09-17 | Olympus Optical Co., Ltd. | Cover type endoscope apparatus |
| US5458132A (en) | 1993-03-15 | 1995-10-17 | Olympus Optical Co., Ltd. | Endoscope cover-sheathed endoscope system |
| US5458133A (en) | 1993-03-15 | 1995-10-17 | Olympus Optical Co., Ltd. | Cover type endoscope apparatus |
| US5551945A (en) | 1993-03-16 | 1996-09-03 | Olympus Optical Co., Ltd. | Endoscope system including endoscope and protection cover |
| US5424543A (en) | 1993-04-19 | 1995-06-13 | Surface Optics Corporation | Imaging spectroradiometer |
| US5413108A (en) | 1993-04-21 | 1995-05-09 | The Research Foundation Of City College Of New York | Method and apparatus for mapping a tissue sample for and distinguishing different regions thereof based on luminescence measurements of cancer-indicative native fluorophor |
| WO1994026168A1 (en) | 1993-05-12 | 1994-11-24 | Board Of Regents, The University Of Texas System | Diagnosis of dysplasia using laser induced fluorescence |
| US5623932A (en) | 1993-05-12 | 1997-04-29 | Board Of Regents, The University Of Texas System | Diagnosis of dysplasia using laser induced fluorescence |
| US5421339A (en) | 1993-05-12 | 1995-06-06 | Board Of Regents, The University Of Texas System | Diagnosis of dysplasia using laser induced fluoroescence |
| WO1995000067A1 (en) | 1993-06-18 | 1995-01-05 | Infra-Temp, Inc. | Electronic thermometer probe cover |
| US5817015A (en) | 1993-06-22 | 1998-10-06 | Adair; Edwin L. | Endoscope with reusable core and disposable sheath with passageways |
| US5596992A (en) | 1993-06-30 | 1997-01-28 | Sandia Corporation | Multivariate classification of infrared spectra of cell and tissue samples |
| WO1995004385A1 (en) | 1993-07-27 | 1995-02-09 | Microsulis Limited | Treatment apparatus |
| US5995645A (en) | 1993-08-18 | 1999-11-30 | Applied Spectral Imaging Ltd. | Method of cancer cell detection |
| EP0641542B1 (en) | 1993-09-03 | 2002-11-27 | Ken Ishihara | Non-invasive blood analyzer |
| US5496259A (en) | 1993-09-13 | 1996-03-05 | Welch Allyn, Inc. | Sterile protective sheath and drape for video laparoscope and method of use |
| US5587832A (en) | 1993-10-20 | 1996-12-24 | Biophysica Technologies, Inc. | Spatially light modulated confocal microscope and method |
| US5800350A (en) | 1993-11-01 | 1998-09-01 | Polartechnics, Limited | Apparatus for tissue type recognition |
| US5746695A (en) | 1993-11-18 | 1998-05-05 | Asahi Kogaku Kogyo Kabushiki Kaisha | Front end structure of endoscope |
| US5519545A (en) | 1993-11-30 | 1996-05-21 | Sony Corporation | Digital signal recording circuit using a rotary transformer with a reduced-jitter low-frequency compensation circuit |
| US5983125A (en) | 1993-12-13 | 1999-11-09 | The Research Foundation Of City College Of New York | Method and apparatus for in vivo examination of subcutaneous tissues inside an organ of a body using optical spectroscopy |
| US5406939A (en) | 1994-02-14 | 1995-04-18 | Bala; Harry | Endoscope sheath |
| US5529235A (en) | 1994-04-28 | 1996-06-25 | Ethicon Endo-Surgery, Inc. | Identification device for surgical instrument |
| US5493444A (en) | 1994-04-28 | 1996-02-20 | The United States Of America As Represented By The Secretary Of The Air Force | Photorefractive two-beam coupling nonlinear joint transform correlator |
| US5450857A (en) | 1994-05-19 | 1995-09-19 | Board Of Regents, The University Of Texas System | Method for the diagnosis of cervical changes |
| US5662588A (en) | 1994-05-31 | 1997-09-02 | Olympus Optical Co., Ltd. | Endoscope apparatus |
| EP0689045A1 (en) | 1994-06-23 | 1995-12-27 | Koninklijke Philips Electronics N.V. | Multi-frequency modulation spectrometer |
| US5477382A (en) | 1994-08-05 | 1995-12-19 | Northrop Grumman Corporation | Optical correlator system |
| US5695448A (en) | 1994-08-29 | 1997-12-09 | Olympus Optical Co., Ltd. | Endoscopic sheath |
| US5599717A (en) | 1994-09-02 | 1997-02-04 | Martin Marietta Energy Systems, Inc. | Advanced synchronous luminescence system |
| US5938617A (en) | 1994-09-02 | 1999-08-17 | Lockhead Martin Energy Research Corporation | Advanced synchronous luminescence system for the detection of biological agents and infectious pathogens |
| US5579773A (en) | 1994-09-30 | 1996-12-03 | Martin Marietta Energy Systems, Inc. | Laser-induced differential normalized fluorescence method for cancer diagnosis |
| US5840035A (en) | 1995-02-07 | 1998-11-24 | Siemens Aktiengesellschaft | Method for the spectroscopic examination of a biological tissue |
| US5733244A (en) | 1995-03-13 | 1998-03-31 | Asahi Kogaku Kogyo Kabushiki Kaisha | Distal end part of endoscope |
| US5697373A (en) | 1995-03-14 | 1997-12-16 | Board Of Regents, The University Of Texas System | Optical method and apparatus for the diagnosis of cervical precancers using raman and fluorescence spectroscopies |
| US6095982A (en) | 1995-03-14 | 2000-08-01 | Board Of Regents, The University Of Texas System | Spectroscopic method and apparatus for optically detecting abnormal mammalian epithelial tissue |
| US5991653A (en) | 1995-03-14 | 1999-11-23 | Board Of Regents, The University Of Texas System | Near-infrared raman spectroscopy for in vitro and in vivo detection of cervical precancers |
| US5735276A (en) | 1995-03-21 | 1998-04-07 | Lemelson; Jerome | Method and apparatus for scanning and evaluating matter |
| US5612540A (en) | 1995-03-31 | 1997-03-18 | Board Of Regents, The University Of Texas Systems | Optical method for the detection of cervical neoplasias using fluorescence spectroscopy |
| US5699795A (en) | 1995-03-31 | 1997-12-23 | Board Of Regents, The University Of Texas System | Optical probe for the detection of cervical neoplasia using fluorescence spectroscopy and apparatus incorporating same |
| US6099464A (en) | 1995-04-10 | 2000-08-08 | Olympus Optical Co., Ltd. | Bending sheath for probe |
| EP0737849A2 (en) | 1995-04-12 | 1996-10-16 | Kyoto Daiichi Kagaku Co., Ltd. | Method of stabilizing spectra in spectometry |
| JPH08280602A (en) | 1995-04-14 | 1996-10-29 | Olympus Optical Co Ltd | Cover type endoscope |
| US5690106A (en) | 1995-06-30 | 1997-11-25 | Siemens Corporate Research, Inc. | Flexible image registration for rotational angiography |
| US6104945A (en) | 1995-08-01 | 2000-08-15 | Medispectra, Inc. | Spectral volume microprobe arrays |
| US5813987A (en) | 1995-08-01 | 1998-09-29 | Medispectra, Inc. | Spectral volume microprobe for analysis of materials |
| US5713364A (en) | 1995-08-01 | 1998-02-03 | Medispectra, Inc. | Spectral volume microprobe analysis of materials |
| WO1997005473A1 (en) | 1995-08-01 | 1997-02-13 | Medispectra, Inc. | Optical microprobes and methods for spectral analysis of materials |
| US5730701A (en) | 1995-09-12 | 1998-03-24 | Olympus Optical Co., Ltd. | Endoscope |
| US5863287A (en) | 1995-10-04 | 1999-01-26 | Fuji Photo Optical Co., Ltd. | Removable protector sheath for use with endoscopic insertion instrument |
| US6146897A (en) | 1995-11-13 | 2000-11-14 | Bio-Rad Laboratories | Method for the detection of cellular abnormalities using Fourier transform infrared spectroscopy |
| US5795632A (en) | 1996-02-06 | 1998-08-18 | Parker Laboratories | Protective cover set for a medical probe |
| US5647368A (en) | 1996-02-28 | 1997-07-15 | Xillix Technologies Corp. | Imaging system for detecting diseased tissue using native fluorsecence in the gastrointestinal and respiratory tract |
| US5833617A (en) | 1996-03-06 | 1998-11-10 | Fuji Photo Film Co., Ltd. | Fluorescence detecting apparatus |
| US5865726A (en) | 1996-03-27 | 1999-02-02 | Asahi Kogaku Kogyo Kabushiki Kaisha | Front end structure of side-view type endoscope |
| US5717209A (en) | 1996-04-29 | 1998-02-10 | Petrometrix Ltd. | System for remote transmission of spectral information through communication optical fibers for real-time on-line hydrocarbons process analysis by near infra red spectroscopy |
| US5807248A (en) | 1996-05-15 | 1998-09-15 | Ohmeda Inc. | Medical monitoring probe with modular device housing |
| US5860913A (en) | 1996-05-16 | 1999-01-19 | Olympus Optical Co., Ltd. | Endoscope whose distal cover can be freely detachably attached to main distal part thereof with high positioning precision |
| US5931779A (en) | 1996-06-06 | 1999-08-03 | Wisconsin Alumni Research Foundation | Real-time in-vivo measurement of myoglobin oxygen saturation |
| US5773835A (en) | 1996-06-07 | 1998-06-30 | Rare Earth Medical, Inc. | Fiber optic spectroscopy |
| US6258576B1 (en) | 1996-06-19 | 2001-07-10 | Board Of Regents, The University Of Texas System | Diagnostic method and apparatus for cervical squamous intraepithelial lesions in vitro and in vivo using fluorescence spectroscopy |
| WO1997048331A1 (en) | 1996-06-19 | 1997-12-24 | Board Of Regents, The University Of Texas System | Method and apparatus for diagnosing squamous intraepithelial lesions of the cervix using fluorescence spectroscopy |
| US5842995A (en) | 1996-06-28 | 1998-12-01 | Board Of Regents, The Univerisity Of Texas System | Spectroscopic probe for in vivo measurement of raman signals |
| WO1998005253A1 (en) | 1996-08-02 | 1998-02-12 | The Board Of Regents, The University Of Texas System | Method and apparatus for the characterization of tissue of epithelial lined viscus |
| US5876329A (en) | 1996-08-08 | 1999-03-02 | Vision-Sciences, Inc. | Endoscope with sheath retaining device |
| US5685822A (en) | 1996-08-08 | 1997-11-11 | Vision-Sciences, Inc. | Endoscope with sheath retaining device |
| US5791346A (en) | 1996-08-22 | 1998-08-11 | Western Research Company, Inc. | Colposcope device and method for measuring areas of cervical lesions |
| US6119031A (en) | 1996-11-21 | 2000-09-12 | Boston Scientific Corporation | Miniature spectrometer |
| US5768333A (en) | 1996-12-02 | 1998-06-16 | Philips Electronics N.A. Corporation | Mass detection in digital radiologic images using a two stage classifier |
| WO1998024369A1 (en) | 1996-12-02 | 1998-06-11 | The University Of Texas System | Spectroscopic detection of cervical pre-cancer using radial basis function networks |
| US6021344A (en) | 1996-12-04 | 2000-02-01 | Derma Technologies, Inc. | Fluorescence scope system for dermatologic diagnosis |
| US6411835B1 (en) | 1997-01-13 | 2002-06-25 | Medispectra, Inc. | Spectral volume microprobe arrays |
| WO1998030889A1 (en) | 1997-01-13 | 1998-07-16 | Medispectra, Inc. | Spatially resolved optical measurements |
| US5855551A (en) | 1997-03-17 | 1999-01-05 | Polartechnics Limited | Integral sheathing apparatus for tissue recognition probes |
| US5941834A (en) | 1997-03-17 | 1999-08-24 | Polartechnics Limited | Sheath for a side view probe |
| WO1998041176A1 (en) | 1997-03-17 | 1998-09-24 | Polartechnics Limited | Sheath for a side view probe |
| US5830146A (en) | 1997-03-17 | 1998-11-03 | Polartechnics Limited | Sheathed probes for tissue type recognition |
| US5929985A (en) | 1997-03-18 | 1999-07-27 | Sandia Corporation | Multispectral imaging probe |
| US5920399A (en) | 1997-03-18 | 1999-07-06 | Sandia Corporation | Multispectral imaging method and apparatus |
| US5989184A (en) | 1997-04-04 | 1999-11-23 | Medtech Research Corporation | Apparatus and method for digital photography useful in cervical cancer detection |
| US6069689A (en) | 1997-04-16 | 2000-05-30 | Derma Technologies, Inc. | Apparatus and methods relating to optical systems for diagnosis of skin diseases |
| US6124597A (en) | 1997-07-07 | 2000-09-26 | Cedars-Sinai Medical Center | Method and devices for laser induced fluorescence attenuation spectroscopy |
| US6317617B1 (en) | 1997-07-25 | 2001-11-13 | Arch Development Corporation | Method, computer program product, and system for the automated analysis of lesions in magnetic resonance, mammogram and ultrasound images |
| US6058322A (en) | 1997-07-25 | 2000-05-02 | Arch Development Corporation | Methods for improving the accuracy in differential diagnosis on radiologic examinations |
| US5921926A (en) | 1997-07-28 | 1999-07-13 | University Of Central Florida | Three dimensional optical imaging colposcopy |
| US6083487A (en)* | 1997-08-25 | 2000-07-04 | Advanced Photodynamic Technologies, Inc. | Methylene blue and toluidene blue mediated fluorescence diagnosis of cancer |
| US6096065A (en) | 1997-09-29 | 2000-08-01 | Boston Scientific Corporation | Sheath for tissue spectroscopy |
| WO1999018847A1 (en) | 1997-10-15 | 1999-04-22 | Accumed International, Inc. | Imaging diseased tissue using autofluorescence |
| WO1999020314A1 (en) | 1997-10-20 | 1999-04-29 | Board Of Regents, The University Of Texas System | Acetic acid as a signal enhancing contrast agent in fluorescence spectroscopy |
| US6187289B1 (en)* | 1997-10-20 | 2001-02-13 | Board Of Regents, The University Of Texas System | Acetic acid as a contrast in reflectance confocal imaging of tissue |
| WO1999020313A1 (en) | 1997-10-20 | 1999-04-29 | The Board Of Regents, The University Of Texas System | Acetic acid as a contrast agent in reflectance confocal imaging of tissue |
| US6241662B1 (en) | 1997-10-20 | 2001-06-05 | Lifespex, Inc. | Acetic acid as a signal enhancing contrast agent in fluorescence spectroscopy |
| US6091985A (en) | 1998-01-23 | 2000-07-18 | Research Foundation Of City College Of New York | Detection of cancer and precancerous conditions in tissues and/or cells using native fluorescence excitation spectroscopy |
| WO1999047041A1 (en) | 1998-03-19 | 1999-09-23 | Board Of Regents, The University Of Texas System | Fiber-optic confocal imaging apparatus and methods of use |
| US6285639B1 (en) | 1998-04-29 | 2001-09-04 | Sony Corporation | On-the-fly of jitter during optical disc mastering/recording |
| WO1999057507A1 (en) | 1998-05-01 | 1999-11-11 | Board Of Regents, The University Of Texas System | Method and apparatus for subsurface imaging |
| US6571118B1 (en) | 1998-05-04 | 2003-05-27 | Board Of Regents, The University Of Texas System | Combined fluorescence and reflectance spectroscopy |
| WO1999057529A9 (en) | 1998-05-04 | 2000-03-02 | Univ Texas | Combined fluorescence and reflectance spectroscopy |
| US6246479B1 (en) | 1998-06-08 | 2001-06-12 | Lj Laboratories, L.L.C. | Integrated spectrometer assembly and methods |
| US6246471B1 (en) | 1998-06-08 | 2001-06-12 | Lj Laboratories, Llc | Apparatus and method for measuring optical characteristics of an object |
| WO2000015101A1 (en) | 1998-09-11 | 2000-03-23 | Spectrx, Inc. | Multi-modal optical tissue diagnostic system |
| US6243601B1 (en) | 1998-09-18 | 2001-06-05 | Abund Ottokar Wist | Transillumination imaging instrumentation with scattered light discrimination |
| US6377842B1 (en) | 1998-09-22 | 2002-04-23 | Aurora Optics, Inc. | Method for quantitative measurement of fluorescent and phosphorescent drugs within tissue utilizing a fiber optic probe |
| US6169817B1 (en) | 1998-11-04 | 2001-01-02 | University Of Rochester | System and method for 4D reconstruction and visualization |
| US6760613B2 (en) | 1998-12-23 | 2004-07-06 | Medispectra, Inc. | Substantially monostatic, substantially confocal optical systems for examination of samples |
| US6427082B1 (en) | 1998-12-23 | 2002-07-30 | Medispectra, Incorporated | Optical methods and systems for rapid screening of the cervix |
| US20020183626A1 (en) | 1998-12-23 | 2002-12-05 | Medispectra, Inc. | Systems and methods for optical examination of samples |
| US20020177777A1 (en) | 1998-12-23 | 2002-11-28 | Medispectra, Inc. | Optical methods and systems for rapid screening of the cervix |
| US6385484B2 (en) | 1998-12-23 | 2002-05-07 | Medispectra, Inc. | Spectroscopic system employing a plurality of data types |
| US6411838B1 (en) | 1998-12-23 | 2002-06-25 | Medispectra, Inc. | Systems and methods for optical examination of samples |
| US6421553B1 (en) | 1998-12-23 | 2002-07-16 | Mediaspectra, Inc. | Spectral data classification of samples |
| WO2000041615A1 (en) | 1999-01-11 | 2000-07-20 | Medispectra, Inc. | Spectral volume microprobe arrays |
| WO2000057361A1 (en) | 1999-03-19 | 2000-09-28 | Isis Innovation Limited | Method and apparatus for image processing |
| WO2000059366A3 (en) | 1999-04-07 | 2001-06-28 | Blue Lake Products Inc | Identification of protective covers for medical imaging devices |
| WO2000074556A3 (en) | 1999-06-09 | 2001-07-12 | Medispectra Inc | An optical probe accessory device for use in in vivo diagnostic procedures |
| US6208887B1 (en) | 1999-06-24 | 2001-03-27 | Richard H. Clarke | Catheter-delivered low resolution Raman scattering analyzing system for detecting lesions |
| US6574502B2 (en) | 1999-12-02 | 2003-06-03 | Fuji Photo Film Co., Ltd. | Apparatus for displaying fluorescence images |
| US20020007122A1 (en) | 1999-12-15 | 2002-01-17 | Howard Kaufman | Methods of diagnosing disease |
| US20030144585A1 (en) | 1999-12-15 | 2003-07-31 | Howard Kaufman | Image processing using measures of similarity |
| US20030095721A1 (en) | 1999-12-15 | 2003-05-22 | Thomas Clune | Methods and systems for correcting image misalignment |
| US20020127735A1 (en) | 1999-12-15 | 2002-09-12 | Howard Kaufman | Methods of monitoring effects of chemical agents on a sample |
| US20020007123A1 (en) | 2000-03-28 | 2002-01-17 | Constantinos Balas | Method and system for characterization and mapping of tissue lesions |
| US6312385B1 (en) | 2000-05-01 | 2001-11-06 | Ge Medical Systems Global Technology Company, Llc | Method and apparatus for automatic detection and sizing of cystic objects |
| US20020107668A1 (en) | 2000-12-15 | 2002-08-08 | Costa Peter J. | System for normalizing spectra |
| USD453963S1 (en) | 2001-02-09 | 2002-02-26 | Medispectra, Inc. | Sheath for cervical optical probe |
| USD453962S1 (en) | 2001-02-09 | 2002-02-26 | Medispectra, Inc. | Sheath for cervical optical probe |
| USD453964S1 (en) | 2001-02-09 | 2002-02-26 | Medispectra, Inc. | Sheath for cervical optical probe |
| USD453832S1 (en) | 2001-02-09 | 2002-02-19 | Medispectra, Inc. | Sheath for cervical optical probe |
| USD460821S1 (en) | 2001-02-09 | 2002-07-23 | Medispectra, Inc. | Sheath for cervical optical probe |
| US20040007674A1 (en) | 2002-07-09 | 2004-01-15 | Schomacker Kevin T. | Method and apparatus for identifying spectral artifacts |
| US20040010187A1 (en) | 2002-07-10 | 2004-01-15 | Schomacker Kevin T. | Colonic polyp discrimination by tissue fluorescence and fiberoptic probe |
| US20040010195A1 (en) | 2002-07-10 | 2004-01-15 | Zelenchuk Alex R. | Fluorescent fiberoptic probe for tissue health discrimination and method of use thereof |
Non-Patent Citations (110)
Cited By (47)
| Publication number | Priority date | Publication date | Assignee | Title |
|---|---|---|---|---|
| US7127282B2 (en) | 1998-12-23 | 2006-10-24 | Medispectra, Inc. | Optical methods and systems for rapid screening of the cervix |
| US7260248B2 (en) | 1999-12-15 | 2007-08-21 | Medispectra, Inc. | Image processing using measures of similarity |
| US7187810B2 (en) | 1999-12-15 | 2007-03-06 | Medispectra, Inc. | Methods and systems for correcting image misalignment |
| US7527940B2 (en)* | 2002-05-15 | 2009-05-05 | Ge Healthcare Uk Limited | Method for the determination of changes in a cellular morphological parameter |
| US20050227310A1 (en)* | 2002-05-15 | 2005-10-13 | Nicholas Thomas | Method for the determination of changes in a cellular morphological parameter |
| US20040204648A1 (en)* | 2002-07-09 | 2004-10-14 | Medispectra, Inc. | Optimal windows for obtaining optical data for characterization of tissue samples |
| US7282723B2 (en) | 2002-07-09 | 2007-10-16 | Medispectra, Inc. | Methods and apparatus for processing spectral data for use in tissue characterization |
| US7310547B2 (en) | 2002-07-10 | 2007-12-18 | Medispectra, Inc. | Fluorescent fiberoptic probe for tissue health discrimination |
| US8005527B2 (en) | 2002-07-10 | 2011-08-23 | Luma Imaging Corporation | Method of determining a condition of a tissue |
| US7136518B2 (en) | 2003-04-18 | 2006-11-14 | Medispectra, Inc. | Methods and apparatus for displaying diagnostic data |
| US7309867B2 (en) | 2003-04-18 | 2007-12-18 | Medispectra, Inc. | Methods and apparatus for characterization of tissue samples |
| US7459696B2 (en) | 2003-04-18 | 2008-12-02 | Schomacker Kevin T | Methods and apparatus for calibrating spectral data |
| US7469160B2 (en)* | 2003-04-18 | 2008-12-23 | Banks Perry S | Methods and apparatus for evaluating image focus |
| US20040206914A1 (en)* | 2003-04-18 | 2004-10-21 | Medispectra, Inc. | Methods and apparatus for calibrating spectral data |
| US20040206913A1 (en)* | 2003-04-18 | 2004-10-21 | Medispectra, Inc. | Methods and apparatus for characterization of tissue samples |
| US20070093701A1 (en)* | 2005-10-26 | 2007-04-26 | Hutchinson Technology Incorporated | Dynamic StO2 measurements and analysis |
| US7536214B2 (en) | 2005-10-26 | 2009-05-19 | Hutchinson Technology Incorporated | Dynamic StO2 measurements and analysis |
| US20080144013A1 (en)* | 2006-12-01 | 2008-06-19 | Institute For Technology Development | System and method for co-registered hyperspectral imaging |
| US8725477B2 (en) | 2008-04-10 | 2014-05-13 | Schlumberger Technology Corporation | Method to generate numerical pseudocores using borehole images, digital rock samples, and multi-point statistics |
| US9581723B2 (en) | 2008-04-10 | 2017-02-28 | Schlumberger Technology Corporation | Method for characterizing a geological formation traversed by a borehole |
| US11284800B2 (en) | 2008-05-20 | 2022-03-29 | University Health Network | Devices, methods, and systems for fluorescence-based endoscopic imaging and collection of data with optical filters with corresponding discrete spectral bandwidth |
| US12251191B2 (en) | 2008-05-20 | 2025-03-18 | University Health Network | Diagnostic method and system with optical and temperature sensors for imaging and mapping fluorescence intensities of tissue |
| US11154198B2 (en) | 2008-05-20 | 2021-10-26 | University Health Network | Method and system for imaging and collection of data for diagnostic purposes |
| US12226186B2 (en) | 2008-05-20 | 2025-02-18 | University Health Network | Devices, methods, and systems with spectral filtering for detecting wound and identifying bacteria based on fluorescence signature |
| US11375898B2 (en) | 2008-05-20 | 2022-07-05 | University Health Network | Method and system with spectral filtering and thermal mapping for imaging and collection of data for diagnostic purposes from bacteria |
| US9042967B2 (en) | 2008-05-20 | 2015-05-26 | University Health Network | Device and method for wound imaging and monitoring |
| US8311788B2 (en) | 2009-07-01 | 2012-11-13 | Schlumberger Technology Corporation | Method to quantify discrete pore shapes, volumes, and surface areas using confocal profilometry |
| US20110004448A1 (en)* | 2009-07-01 | 2011-01-06 | Schlumberger Technology Corporation | Method to quantify discrete pore shapes, volumes, and surface areas using confocal profilometry |
| US10288567B2 (en) | 2013-03-15 | 2019-05-14 | Cedars-Sinai Medical Center | Time-resolved laser-induced fluorescence spectroscopy systems and uses thereof |
| US10983060B2 (en) | 2013-03-15 | 2021-04-20 | Cedars-Sinai Medical Center | Time-resolved laser-induced fluorescence spectroscopy systems and uses thereof |
| US12152991B2 (en) | 2013-03-15 | 2024-11-26 | Cedars-Sinai Medical Center | Time-resolved laser-induced fluorescence spectroscopy systems and uses thereof |
| US11428636B2 (en) | 2013-03-15 | 2022-08-30 | Cedars-Sinai Medical Center | Time-resolved laser-induced fluorescence spectroscopy systems and uses thereof |
| US9404870B2 (en) | 2013-03-15 | 2016-08-02 | Cedars-Sinai Medical Center | Time-resolved laser-induced fluorescence spectroscopy systems and uses thereof |
| US9433468B2 (en) | 2013-10-04 | 2016-09-06 | Tidi Products, Llc | Sheath for a medical or dental instrument |
| US10438356B2 (en) | 2014-07-24 | 2019-10-08 | University Health Network | Collection and analysis of data for diagnostic purposes |
| US11676276B2 (en) | 2014-07-24 | 2023-06-13 | University Health Network | Collection and analysis of data for diagnostic purposes |
| US11954861B2 (en) | 2014-07-24 | 2024-04-09 | University Health Network | Systems, devices, and methods for visualization of tissue and collection and analysis of data regarding same |
| US11961236B2 (en) | 2014-07-24 | 2024-04-16 | University Health Network | Collection and analysis of data for diagnostic purposes |
| US12169935B2 (en) | 2014-07-24 | 2024-12-17 | University Health Network | Systems, devices, and methods for visualization of tissue and collection and analysis of data regarding same |
| US12387335B2 (en) | 2014-07-24 | 2025-08-12 | University Health Network | Systems, devices, and methods for visualization of tissue and collection and analysis of data regarding same |
| US11630061B2 (en) | 2016-04-01 | 2023-04-18 | Black Light Surgical, Inc. | Systems, devices, and methods for time-resolved fluorescent spectroscopy |
| US12025557B2 (en) | 2016-04-01 | 2024-07-02 | Black Light Surgical, Inc. | Systems, devices, and methods for time-resolved fluorescent spectroscopy |
| US10656089B2 (en) | 2016-04-01 | 2020-05-19 | Black Light Surgical, Inc. | Systems, devices, and methods for time-resolved fluorescent spectroscopy |
| US10394008B2 (en) | 2016-10-19 | 2019-08-27 | Cornell University | Hyperspectral multiphoton microscope for biomedical applications |
| US11103181B2 (en) | 2017-08-01 | 2021-08-31 | Samsung Electronics Co., Ltd. | Apparatus and method for processing bio-information |
| US11134847B2 (en) | 2017-09-13 | 2021-10-05 | Samsung Electronics Co., Ltd. | Disease prediction model generation apparatus, and apparatus and method for predicting disease |
| US11684265B2 (en) | 2017-09-13 | 2023-06-27 | Samsung Electronics Co., Ltd. | Disease prediction model generation apparatus, and apparatus and method for predicting disease |
Also Published As
| Publication number | Publication date |
|---|---|
| CA2491561A1 (en) | 2004-01-15 |
| WO2004005885A3 (en) | 2004-03-25 |
| EP1700105A2 (en) | 2006-09-13 |
| US20040204648A1 (en) | 2004-10-14 |
| US20040023406A1 (en) | 2004-02-05 |
| AU2003248819A1 (en) | 2004-01-23 |
| EP1700105A4 (en) | 2009-01-14 |
| WO2004005885A2 (en) | 2004-01-15 |
Similar Documents
| Publication | Publication Date | Title |
|---|---|---|
| US6933154B2 (en) | Optimal windows for obtaining optical data for characterization of tissue samples | |
| JP3753186B2 (en) | Diagnosis of dysplasia using laser-induced fluorescence | |
| US7282723B2 (en) | Methods and apparatus for processing spectral data for use in tissue characterization | |
| US7459696B2 (en) | Methods and apparatus for calibrating spectral data | |
| US7136518B2 (en) | Methods and apparatus for displaying diagnostic data | |
| US7309867B2 (en) | Methods and apparatus for characterization of tissue samples | |
| JP7257009B2 (en) | Systems and methods for real-time Raman spectroscopy for cancer detection | |
| Krishna et al. | In vivo Raman spectroscopy for detection of oral neoplasia: a pilot clinical study | |
| ElMasry et al. | Early detection of apple bruises on different background colors using hyperspectral imaging | |
| US7469160B2 (en) | Methods and apparatus for evaluating image focus | |
| US6526299B2 (en) | Spectrum processing and processor | |
| EP0765134B1 (en) | Optical method and apparatus for the diagnosis of cervical precancers using raman and fluorescence spectroscopies | |
| US20040208385A1 (en) | Methods and apparatus for visually enhancing images | |
| US20040209237A1 (en) | Methods and apparatus for characterization of tissue samples | |
| JP2001501727A (en) | Method and apparatus for diagnosing squamous intraepithelial lesions of the cervix using fluorescence spectroscopy | |
| US20040208390A1 (en) | Methods and apparatus for processing image data for use in tissue characterization | |
| US20060013454A1 (en) | Systems for identifying, displaying, marking, and treating suspect regions of tissue | |
| CN101460090B (en) | Methods for Characterizing Tissues | |
| AU2003259095A2 (en) | Methods and apparatus for characterization of tissue samples | |
| AU2002228241A1 (en) | Method of processing a broadband elastic scattering spectrum obtained from tissue | |
| US8862208B2 (en) | System and method for noninvasive tissue examination | |
| EP4179298B1 (en) | Inflammatory bowel disease diagnosis method | |
| CN120705786A (en) | Oral health monitoring system based on laser irradiation and data processing method thereof | |
| HK1131323B (en) | Methods for characterizing tissues |
Legal Events
| Date | Code | Title | Description |
|---|---|---|---|
| AS | Assignment | Owner name:MEDISPECTRA, INC., MASSACHUSETTS Free format text:ASSIGNMENT OF ASSIGNORS INTEREST;ASSIGNORS:SCHOMACKER, KEVIN T.;ZELENCHUK, ALEX;FLEWELLING, ROSS;AND OTHERS;REEL/FRAME:014049/0293 Effective date:20021113 | |
| REFU | Refund | Free format text:REFUND - SURCHARGE, PETITION TO ACCEPT PYMT AFTER EXP, UNINTENTIONAL (ORIGINAL EVENT CODE: R2551); ENTITY STATUS OF PATENT OWNER: SMALL ENTITY Free format text:REFUND - SURCHARGE FOR LATE PAYMENT, SMALL ENTITY (ORIGINAL EVENT CODE: R2554); ENTITY STATUS OF PATENT OWNER: SMALL ENTITY | |
| FPAY | Fee payment | Year of fee payment:4 | |
| AS | Assignment | Owner name:EUCLIDSR PARTNERS, L.P., NEW YORK Free format text:ASSIGNMENT OF ASSIGNORS INTEREST;ASSIGNOR:EUCLIDSR PARTNERS, LP, COLLATERAL AGENT;REEL/FRAME:025876/0158 Effective date:20070907 Owner name:EUCLIDSR PARTNERS IV, L.P., NEW YORK Free format text:ASSIGNMENT OF ASSIGNORS INTEREST;ASSIGNOR:EUCLIDSR PARTNERS, LP, COLLATERAL AGENT;REEL/FRAME:025876/0158 Effective date:20070907 Owner name:EUCLIDSR PARTNERS, LP, COLLATERAL AGENT, NEW YORK Free format text:ASSIGNMENT OF ASSIGNORS INTEREST;ASSIGNOR:MEDISPECTRA, INC.;REEL/FRAME:025876/0143 Effective date:20070830 Owner name:EUCLIDSR BIOTECHNOLOGY PARTNERS, L.P., NEW YORK Free format text:ASSIGNMENT OF ASSIGNORS INTEREST;ASSIGNOR:EUCLIDSR PARTNERS, LP, COLLATERAL AGENT;REEL/FRAME:025876/0158 Effective date:20070907 Owner name:LUMA IMAGING CORPORATION, CALIFORNIA Free format text:ASSIGNMENT OF ASSIGNORS INTEREST;ASSIGNORS:EUCLIDSR PARTNERS IV, L.P.;EUCLIDSR PARTNERS, L.P.;EUCLIDSR BIOTECHNOLOGY PARTNERS, L.P.;SIGNING DATES FROM 20070907 TO 20070910;REEL/FRAME:025876/0178 | |
| FPAY | Fee payment | Year of fee payment:8 | |
| REMI | Maintenance fee reminder mailed | ||
| LAPS | Lapse for failure to pay maintenance fees | Free format text:PATENT EXPIRED FOR FAILURE TO PAY MAINTENANCE FEES (ORIGINAL EVENT CODE: EXP.) | |
| STCH | Information on status: patent discontinuation | Free format text:PATENT EXPIRED DUE TO NONPAYMENT OF MAINTENANCE FEES UNDER 37 CFR 1.362 | |
| FP | Lapsed due to failure to pay maintenance fee | Effective date:20170823 |