US6708137B2 - System and method for providing composite variance analysis for network operation - Google Patents
System and method for providing composite variance analysis for network operationDownload PDFInfo
- Publication number
- US6708137B2 US6708137B2US09/906,288US90628801AUS6708137B2US 6708137 B2US6708137 B2US 6708137B2US 90628801 AUS90628801 AUS 90628801AUS 6708137 B2US6708137 B2US 6708137B2
- Authority
- US
- United States
- Prior art keywords
- measurements
- variance statistic
- variance
- network
- statistic
- Prior art date
- Legal status (The legal status is an assumption and is not a legal conclusion. Google has not performed a legal analysis and makes no representation as to the accuracy of the status listed.)
- Expired - Lifetime
Links
- 238000000034methodMethods0.000titleclaimsabstractdescription30
- 238000004458analytical methodMethods0.000titleabstractdescription18
- 239000002131composite materialSubstances0.000titleabstractdescription14
- 238000005259measurementMethods0.000claimsabstractdescription169
- 238000012545processingMethods0.000claimsdescription15
- 230000000737periodic effectEffects0.000claimsdescription6
- 238000013480data collectionMethods0.000claimsdescription4
- 238000010586diagramMethods0.000description4
- 238000009877renderingMethods0.000description4
- 238000012360testing methodMethods0.000description4
- 239000003795chemical substances by applicationSubstances0.000description3
- 230000000694effectsEffects0.000description3
- 230000009885systemic effectEffects0.000description3
- 238000004364calculation methodMethods0.000description2
- 230000007613environmental effectEffects0.000description2
- 238000012986modificationMethods0.000description2
- 230000004048modificationEffects0.000description2
- 238000013024troubleshootingMethods0.000description2
- 230000002730additional effectEffects0.000description1
- 230000015556catabolic processEffects0.000description1
- 230000001413cellular effectEffects0.000description1
- 238000010276constructionMethods0.000description1
- 238000007405data analysisMethods0.000description1
- 238000013500data storageMethods0.000description1
- 238000006731degradation reactionMethods0.000description1
- 230000014759maintenance of locationEffects0.000description1
- 230000007257malfunctionEffects0.000description1
- 230000003287optical effectEffects0.000description1
- 238000010561standard procedureMethods0.000description1
- 238000007619statistical methodMethods0.000description1
- 238000010025steamingMethods0.000description1
Images


Classifications
- H—ELECTRICITY
- H04—ELECTRIC COMMUNICATION TECHNIQUE
- H04L—TRANSMISSION OF DIGITAL INFORMATION, e.g. TELEGRAPHIC COMMUNICATION
- H04L41/00—Arrangements for maintenance, administration or management of data switching networks, e.g. of packet switching networks
- H04L41/22—Arrangements for maintenance, administration or management of data switching networks, e.g. of packet switching networks comprising specially adapted graphical user interfaces [GUI]
- H—ELECTRICITY
- H04—ELECTRIC COMMUNICATION TECHNIQUE
- H04L—TRANSMISSION OF DIGITAL INFORMATION, e.g. TELEGRAPHIC COMMUNICATION
- H04L41/00—Arrangements for maintenance, administration or management of data switching networks, e.g. of packet switching networks
- H04L41/14—Network analysis or design
- H04L41/142—Network analysis or design using statistical or mathematical methods
- H—ELECTRICITY
- H04—ELECTRIC COMMUNICATION TECHNIQUE
- H04L—TRANSMISSION OF DIGITAL INFORMATION, e.g. TELEGRAPHIC COMMUNICATION
- H04L43/00—Arrangements for monitoring or testing data switching networks
- H04L43/12—Network monitoring probes
Definitions
- the present inventionrelates to performance of information networks.
- the present inventionrelates to statistical measurements of performance characteristics of an information network.
- Internet web sitescontinue to become more sophisticated and offer a wider variety of media for a user to access. With this trend, users have become more demanding of quick, high quality internet experiences. As such, to be able to keep up with users' demands, it has become increasingly important for the providers of Internet content to be able to monitor and troubleshoot Internet performance issues to both avoid degraded performance and provide improved performance.
- DCAsdata collection agents
- a DCAgenerally connects to a device in the network about which a measurement is desired and takes one or more measurements of one or more predetermined metrics.
- the DCAthen typically stores the results of the measurement either locally or in a remote database. The stored measurements can then be called up and reviewed by a user who accesses the agent.
- Such systemscan typically measure metrics related to either Universal Resource Locator (URL) objects (such as a web page located on a server on the network) or streaming media objects.
- URL objects and streaming media objectsare collectively referred to herein as network services.
- metricscan include, but are not limited to:
- End-to-End TimeThe time taken from the moment a user clicks on a link to the instant the page is fully downloaded and displayed. It encompasses the collection of all objects making up a page including, but not limited to, third party content on off-site servers, graphics, frames, and redirections.
- DNSDomain Name System
- LookupThe time it takes for the browser to turn the text based hostname into an IP address.
- Connect TimeThe time it takes to set up a network connection from the end-user's browser to a web site. A web page is transferred over this connection and many are setup for each page.
- Request TimeThe time it takes to send a request from a user's browser to a server. This is a relevant amount of time if you are submitting a large form (e.g. a message on an email service), or uploading a file (e.g. an attachment to a message on a discussion board). It reflects the ability of a server to accept data.
- Download TimeThe time for the page download from the start of the first object to the end of the last object.
- the unit in parenthesis following the name of the metricis the unit in which the measurement is generally taken and recorded.
- such metricsinclude, but are not limited to:
- DNS Lookup Time(seconds): This metric is generally the same as the DNS lookup time for URL-type objects.
- Quantity of Data Received(bytes or bits): The absolute amount of data gathered by the DCA if a stream had been rendered.
- Packet LossThe number of packets that are not received by the media monitor.
- Percent Packet Loss(number): The percentage of total packets that are not received by the media monitor.
- Packets Received(number): The total number of packets received by the media monitor.
- Packets Resend Requested(number): The number of packets that have been requested to be resent. This metric preferably applies to REALMEDIA® streams.
- Packets Recovered(number): The number of packets for which some type of corrective action is taken. “Corrective action” typically means requesting that the missing or broken packets be resent. This metric preferably applies to RealMedia® streams.
- Packets Resent(number): (Also known as packets resend received) the number of packets asked for again (the packets resend requested metric) and were received. This metric preferably applies to RealMedia® streams.
- Packets Received NormallyThe number of packets received by the media monitor from the streaming media server without incident.
- Clip Bandwidth(bytes/second): The rate at which data is received measured over the length of the entire stream or over a relatively long predetermined timeframe.
- Results of the above measurementscan be used to help determine whether network services operating up to standard.
- results of the above URL object measurementscan, for instance, indicate whether a web page is downloading consistently, at a high enough speed, or completely.
- results of measurements of the above streaming media parameterscan help determine the same information with respect to a streaming media object.
- a userin order to determine whether a particular network service is operating appropriately using the above described methods, a user must initiate measurement of one or more network performance metrics, retrieve and then analyze the result. That is, there is no way for a system that does no more than take measurements of network performance metrics to notify a user if a network is not operating correctly because there is no baseline or other reference available to the system to make such a determination.
- What is neededis a system for measuring network performance metrics which allows a user to take into account network conditions, such a traffic load, when analyzing the measurement. Also, the system should allow a user to be able to make predictions about network performance at a given time. Additionally, such a system should be automated and should be able to analyze and present measurement results in a manner which is meaningful and straightforward to interpret.
- a system and method in accordance with the present inventioncollects measurements of network performance metrics and automatically calculates and provides composite variance analysis of such metrics.
- the system and methodcan then use history of performance data statistics to alert a user about performance of network services that are outside acceptable tolerance or control limits.
- the techniqueexposes subtle deviation from accepted measurement tolerance that can, in turn, be categorized in relation to control limits based on defined standard deviation thresholds.
- a system in accordance with the present inventionincludes at least one DCA located on a network, a processing module interconnected with the DCA, and, preferably, a comparison module interconnected with the processing module.
- the DCAcollects at least a first plurality of measurements of a single network parameter and at least a first set of measurements including at least a single measurement of the single network parameter. Each of the first plurality of measurements is taken at a different time.
- the processing modulecalculates at least a first variance statistic, such as an average value, and a second variance statistic. The first variance statistic relates to the first plurality of measurements and the second variance statistic relates to the first set of measurements.
- the comparison modulecompares the first variance statistic with at least the second variance statistic to determine if a predetermined relationship exists between the first variance statistic and the second variance statistic.
- the variance statisticscould be averages of the group and first set of measurements.
- the comparison modulecould determine if the average of the first set of measurements is within a predetermined multiple of standard deviations from the average of the group of measurements.
- the systemalso includes a screen display for displaying at least the first and second variance statistics and the results of the comparison thereof.
- a method in accordance with the present inventionincludes collecting at a first plurality of measurements of a single network parameter, each measurement taken at a different time. Also, at least a first set of measurements is collected including at least a single measurement of the single network parameter. Then a first variance statistic associated with the first plurality of measurements and at least a second variance statistic associated with the first set of measurements are calculated. The first variance statistic is then compared with at least the second variance statistic to determine if a predetermined relationship exists the two variance statistics.
- FIG. 1is a block diagram illustrating a preferred embodiment of a method for providing composite variance analysis for network operations in accordance with the present invention.
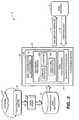
- FIG. 2is a block diagram showing a system for providing composite variance analysis for network operations in accordance with the present invention.
- FIG. 3is a reproduction of a preferred embodiment of a screen display rendered by a page rendering module of a system in accordance with the present invention.
- FIG. 4is a reproduction of the screen display reproduced in FIG. 3 showing a different portion of the screen display.
- FIG. 5is a reproduction of the screen display reproduced in FIG. 3 showing a different portion of the screen display.
- a system and method in accordance with the present inventioncollects measurements of network performance metrics and automatically calculates and provides composite variance analysis of such metrics.
- the system and methodcan then use history of performance data statistics to alert a user about performance of network services that are outside acceptable tolerance or control limits. That is, a system and method in accordance with the present invention collects raw data including a set of periodic measurements of at least a single network performance metric such as, without limitation, end-to-end time or throughput of at least a single network service.
- Composite variance analysisis then completed on this set of measurements.
- the results of this analysisare preferably values such as the average, mean, median, minimum, maximum and standard deviation (referred to collectively herein as variance statistics) of the group of periodic measurements of the single metric.
- the data collection and analysiscan be completed with respect to any network performance metric or group of such metrics. Further, a set of periodic measurements for a single metric can be accumulated over any period of time. Accordingly, the results of the composite variance analysis can advantageously be used to determine how the performance of a given network service with respect to any desired performance metric or group of metrics varies over any amount of time. This also allows a user to advantageously determine whether performance of a network service at any particular time is outside of acceptable limits.
- FIG. 1is a block diagram illustrating a method 100 of providing composite variance analysis of network performance.
- network performance datais collected from a network (not shown) and stored. Such data preferably includes periodically repeated measurements of one or more network performance metrics including, but not limited to, those enumerated in the Background section with respect to both URL services and streaming media services such as DNS lookup time or packets lost.
- method 100measures and stores at least one network performance metric corresponding to a URL object or streaming media object on a continuous basis.
- a metriccan include, but is not limited to: throughput, DNS lookup time, connect time, request time, server response time, teardown time, download time, and/or end-to-end time.
- such a metriccan include, but is not limited to: packets lost, packets received, bytes received, jitter, percent packets lost, DNS lookup time, buffer time average bandwidth, and/or first stat time.
- each of the above listed metricsis collected and stored in step 110 on a continuous basis. It is also considered to collect each metric, or a subset of the metrics, at only predetermined times.
- step 110method 100 preferably takes a measurement of each of the above listed metrics approximately once per minute to take a total of approximately 60 measurements per hour of each metric on a continuous basis.
- this informationcan be stored in a database or other type of data storage configuration.
- step 110method 100 collects error data relating to measurements made of network services. More preferably, step 110 collects errors referred to as access errors, service errors and content errors.
- An access errorincludes an error that prevents a DCA from starting the download process for a given URL.
- a service errorincludes a DCA's failure to load the first object on the URL's page. Service errors can occur, for example, when the configuration for a monitored URL is an improperly formatted or when the site is being worked on.
- a content errorincludes an error that is encountered when downloading a component object for a URL.
- a userrequests a report of collected network performance data and a composite variance analysis of such data.
- the userpreferably includes information identifying the URL of the site or the streaming media service to be measured and a time range over which measurements are desired, preferably in the form of a date range or single date with a time range.
- the retrieved raw network performance datais analyzed to generate variance statistics.
- the variance statisticsinclude average value, mean value, median value, standard deviations, minimums and maximums of each requested network performance metric over the requested time period. For example, if a user requests throughput, DNS lookup time, connect time, request time and response time for a specific URL over a given 48 hour period, the average value, mean value, median value, minimum value, maximum value and standard deviation for all the measurements taken of each of these metrics over the 48 hour time period is calculated.
- variance statistics average, minimum, maximum and standard deviation of 2880 measurementsis calculated.
- variance statistics for each of the requested metricsis also calculated for smaller increments of time.
- a single variance statistic, the averageis calculated for this smaller increment of time.
- the average value of each requested metric over a 1 hour periodis preferably also calculated.
- Providing to a user the mean, median, average, minimum, maximum and standard deviation of each metric in the manner described abovecan advantageously allow the user to determine network performance over a period of time and determine whether a network service device is operating outside of tolerance at any given time during the relevant time period. Additionally, calculating and storing variance statistics for a given metric over predetermined time periods provides a baseline for performance of a network service over time. As such, a user can compare performance of the network service at any given time to the established baseline. As discussed in greater detail below, this can advantageously allow a user to “filter out” systemic network problems, such as network traffic load, which might effect the performance of a network service at a particular time, in evaluating the performance of a network service.
- a system and method in accordance with the present inventionpreferably identifies for a user network performance parameters that are outside of acceptable control limits. Accordingly, in one embodiment of the present invention, in step 132 , averages of subsets of measurements are compared to a calculated standard deviation for the metric as calculated from a larger group of measurements taken over a longer time period. For example, and without limitation, if a user requests measurements of a particular metric over a 48 hour period, and each requested metric is measured approximately once per minute, the subsets of hourly averages (or other variance statistic), preferably calculated from 60 measurements during the 48 hour period can be compared to the same variance statistic calculated for the entire group of 2880 measurements taken over the 48 hour period.
- the hourly average of each metricis compared to the average value of the same metric over the entire requested time period, or, as explained below, over another time period.
- a subset of measurementscan include a single measurement. In such a case, the average for the subset exists and is considered to be the value of the single measurement.
- the comparison that is made in step 132preferably, though not necessarily, involves determining if the average (or other variance statistic) of a subset of measurements is within a predetermined number of standard deviations from the average (or other variance statistic) of an overall group of measurements from which the standard deviation was calculated.
- the subset or subsets of measurementscan be part of the overall group of measurements but need not be. If the variance statistic of a subset of measurements is more than a predetermined number of standard deviations away from the same variance statistic of an overall group of measurement, then the variance statistic of the subset of measurements is considered to be outside of acceptable tolerance or, in other words, “out of control”. What constitutes out of control performance, that is, how many standard deviations a variance statistic of a subset of measurements must be away from the same variance statistic of a larger group of measurements, is preferably configurable by a user.
- Chart 1provides an example of the results of a potential measurement of end-to-end time (the time taken from the moment a user clicks on a link to a web page to the instant the web page is fully downloaded and displayed) illustrating_“in control”_and potentially_“out of control”_performance.
- end-to-end timethe time taken from the moment a user clicks on a link to a web page to the instant the web page is fully downloaded and displayed
- the total measurement timeis over a 48 hour period and that end-to-end time pertaining to the relevant web site is being measured approximately once per minute.
- the variance statistic that is calculated and comparedis average value of the end-to-end time. It could, however, be a mean, median, maximum, minimum or other such statistic of the end-to-end time.
- the first four rows of the first column of chart 1list the average of the 60 measurements taken during the first four hours of the 48 hour time period.
- the fifth row of the first columnlists the collective average of the 2880 measurements taken of end-to-end time over the 48 hour period and the sixth row of the first column lists the standard deviation of this collective set of measurements.
- the second column of chart 1displays the number of standard deviations each hourly average is away from the collective average. As shown, in hour 1, the average end-to-end time was 4.5 seconds which is less that 1 standard deviation away from the collective average. Accordingly, the end-to-end time in hour one would likely be considered within acceptable operating tolerance or in control. However, in hour 2 the hourly average was 8.0 seconds.
- hour 2This is more that 1 standard deviation away from the collective average but still less that 2 standard deviations away from the collective average. Accordingly, the end-to-end time in hour 2 might be considered out of control.
- hour 3the hourly average is 12.5 seconds. This is greater than 2 standard deviations away from the collective average and accordingly, would likely be considered out of control.
- hour 4the hourly average is back within control at 4.2 seconds, which is less than one standard deviation away from the collective average.
- Whether a metric is in or out of controlis preferably determinable by the user. For example, the user may determine that anything within 2 standard deviations of a collective variance statistic is in control or that anything greater than 1 standard deviation from the collective variance statistic is out of control. Any other scheme for determining what performance is in control and what performance is out of control is also within the ambit of the present invention. For example, and without limitation, the determination of whether a network parameter is out of control or not could also be made using any other number of standard deviations or fractions of standard deviations. That is, if the measurement is greater than 1.5 standard deviations away from the collective average or greater than 2.5 standard deviations away from the collective average, the parameter could be considered out of control.
- any measurement greater than 1 standard deviation from the collective average but less that 2 standard deviations therefromcould be considered a first, or warning level.
- any measurement greater than 2 standard deviations away from a collective averagewould be considered a second, or alert level.
- Each levelcould, for example, indicate that certain corrective or additional actions should be taken.
- variance statistics which are out of controlare highlighted to stand out from other calculated and reported variance statistics for the user that requested the set of measurements in step 120 . How the measurements are highlighted depends upon how the information is to be reported to the user.
- the requested measurements and statisticsare reported to the user in a tabular or chart format in a screen display provided on a user terminal. Using this reporting format, measurements that are out of control are preferably highlighted by displaying such measurement in a different color than measurements that are in control.
- variance statistics that are within 1 to 2 standard deviations away from a collective variance statisticare highlighted in a first color and variance statistics that are greater than 2 standard deviations from a collective variance statistics are highlighted in a second color.
- the results of the request made in step 120are reported back to the user making the request. As discussed above, this is preferably done by providing a screen display showing the measurement and variance analysis results in tabular or chart form on a monitor of a user terminal. It is also considered, however, that the measurement and variance analysis results be displayed in any other format such a graph showing averages (or other variance statistic) over time as compared to standard deviations.
- the reporting out stepincludes generating an alarm when one or more metrics for one or more network services are out of control.
- the method and system of the present inventioncould send and e-mail to a predetermined address, send a fax, or initiate a phone call.
- step 132in one embodiment of method 100 it is preferable to compare hourly averages of measured network performance metrics with collective averages of such metrics over a longer period of time, such as 48 hours, which includes the hour from which the hourly average was calculated.
- a longer period of timesuch as 48 hours
- past network performancecan vary depending on time of day, day or week or even time of year. Specifically, for example, due to different amounts of network traffic in the middle of a week day afternoon as compared to early morning weekend times, a network service will likely display superior performance during the early morning weekend times. For example, due to varying network traffic, an average end-to-end time would likely be longer in the middle of a Friday afternoon that early Saturday morning.
- limits of acceptable network performancewould likely be different for the two time periods.
- variance statistics of network performance metrics for the high network traffic periodswould reflect the fact that the network is under heavy load. For example, DNS lookup times, connect times, request times, packets lost and packets received may all be longer during a period of high network traffic than during a period of low network traffic. And, such longer time periods might not represent any type of network service malfunction, only that network traffic is high. Thus, applying the limits determined for a consistently low network traffic period to a period of consistently high network traffic period, or vice-versa, could produce misleading results.
- a collective average applied to DNS lookup time during periods of high network trafficmight be too low and result in false reports of out of control measurements.
- including measurements for periods of high network traffic in the collective average applied to periods of low network trafficcould result in missing measurements which might otherwise be considered out of control.
- including periods of relatively high network traffic with periods of relatively low network trafficcould result in larger standard deviations. This could cause variance statistics which might otherwise be considered out of control not to be designated as such.
- step 132it is also within the ambit of the present invention to compare performance at any particular time of interest to past performance at a similar time. For example, network performance on, say, a Wednesday from 2:00 to 4:00 can be compared to network performance on any number of previous Wednesdays over the same time period as opposed to including other times and days of the week in the comparison, such as a Sunday evening at 11:00 p.m. when network traffic would likely be quite different.
- network performance on, say, a Wednesday from 2:00 to 4:00can be compared to network performance on any number of previous Wednesdays over the same time period as opposed to including other times and days of the week in the comparison, such as a Sunday evening at 11:00 p.m. when network traffic would likely be quite different.
- itcan be requested by a user in step 120 .
- past data from a time frame similar to the time frame of interestcan be used to perform the composite variance analysis in step 130 .
- Determining network performance by comparing network performance data with data collected at similar timescan take into account systemic or environmental network conditions such as network traffic. Such a comparison allows systemic or environmental network conditions to be “filtered out” so that operation of a network device or service can advantageously be isolated and accurately measured.
- FIG. 2is a block diagram showing a preferred embodiment of a system 10 for measuring and reporting performance statistics for network operations in accordance with the present invention.
- system 10includes at least one data collection agent (DCA) 20 which is preferably located on a distributed computer network 25 such as the internet.
- DCAdata collection agent
- Network 25could also include, but is not limited to, a LAN (local area network), WAN (wide area network), MAN (metropolitan area network), VAN (value-added network), PAN (personal area network), PON (passive optical network), VPN, enterprise-wide network, direct connection, active network, control network, an intranet, or any other suitable network.
- DCA 20is preferably an automated server that carries out measurements on network 25 , predetermined portions of or services provided on network 25 , or a device which is part of network 25 .
- Services provided by network 25can include, but are not limited to, URL objects such as web sites and streaming media objects.
- DCA 20The type of measurement carried out by DCA 20 depends upon the data to be collected. For example, if DCA 20 is to collect data for a throughput measurement of a given web site, DCA 20 will connect to the given web site and measure the throughput for a predetermined amount of time. Preferably, as discussed above, this measurement will be repeated on a periodic basis for a given duration of time. Measurement of URL object and streaming media object parameters, such as those listed in the Background section, by DCA's is well understood by those skilled in the art.
- DCA 20is pre-configured with information concerning what measurements are to be taken, at what times and on which network services.
- Such preconfiguration of a DCAis well understood by those skilled in the art.
- the configurationpreferably contains the URL or location of the streaming media object for which a given test is to be performed.
- the configurationalso contains the network performance metric to be tested and the frequency of the test to be performed (for example, once each minute, preferably at substantially evenly spaced intervals).
- DCA 20is configured to take measurements of at least each of the following URL or streaming media service metrics once each minute on a continuous basis: throughput, DNS lookup time, connect time, request time, server response time, connection time, socket teardown time download time, and/or end to end time.
- URL or streaming media service metricscan include, but are not limited to: packets lost, packets received, bytes received, jitter, percent packets lost, DNS lookup time, buffer time average bandwidth, and/or first stat time.
- which metrics are measured and when they are measuredcan be determined in advance by a user.
- DCA 20then performs the requested tests to collect performance data for one or more URLs or service metrics named in the subscription.
- DCA 20can be a Windows NT servers, UNIX servers or any other type of server. Configuration and implementation of a DCA such as DCA 20 is well understood by those skilled in the art.
- DCA 20After data is collected by DCA 20 , the data is forwarded to data ingest module 30 which transforms the data into an appropriate format for storage as is well understood by those skilled in the art.
- DCA 20forwards data to data ingest module 30 on a regular, predetermined basis. Information concerning when this data is to be forwarded is preferably included in the DCA configuration information.
- Data ingest module 30then forwards the data to performance data repository 40 which is preferably, but not necessarily, placed at a network location apart from DCA 20 .
- Performance data repository 40can be any type of database or a plurality of databases capable of storing network performance metric data collected by DCA 20 . It is also considered, however, that performance data repository could be any facility for storing text strings.
- performance data repository 40supports Structured Query Language (SQL).
- SQLStructured Query Language
- System 10also includes processing software 50 which performs statistical analyses on network performance metric data collected by DCA 20 and stored in performance data repository 40 .
- Processing software 50preferably runs on a processing server 55 and will be discussed in greater detail below.
- System 10also includes web browser 70 which provides a user (not shown) with access to processing server 55 and processing software 50 .
- Data collected by DCA 20remains in database 40 until a user request 72 is initiated by the user of web browser 70 .
- Web browser 70is preferably a standard computer terminal including a display monitor but can be any device, such as a PDA or cellular telephone, capable of communicating with processing server 55 .
- User request 72preferably includes identifying information for the URL or streaming media service, network device, or other portion of network 25 which the user wishes to analyze. User request 72 also preferably includes a time and/or date range over which the user wishes to retrieve data. Additionally, as discussed above, if the user wishes to compare data from the requested time and date range to a similar, but different, time and date range, user request 72 will also include the similar time and date range to which the requested time and date range is to be compared. User request 72 is received by data access module 52 . Preferably, data access module 52 constructs a query for data repository 40 to retrieve the raw data from data repository 40 necessary to generate the requested composite variable statistics.
- DCA 20preferably measures a wide range of metrics of predetermined network services on a continuous basis. And, most preferably, such measurements are taken approximately once each minute. Also as discussed above, all these measurements are stored in data repository 40 . Further, data repository 40 preferably retains all the data provided to it by data ingest module 30 for a predetermined period, such as 3 months. As such, a request for data constructed by data access module 50 can preferably retrieve data from any time frame within the predetermined data retention time period for any metric measured for a monitored network device or service. Also, because data repository 40 preferably stores each measurement made and measurements are preferably made in approximately one minute increments, data is preferably retrieved in one minute increments. Construction of a query to retrieve data from a data repository such as data repository is well understood by those skilled in the art.
- data access moduleAfter retrieving the required raw data from data repository 40 , data access module forwards the raw data to recordset processing module 54 .
- Recordset processing module 54preferably completes requested composite variance analysis on raw measurement data collected by DCA 20 .
- recordset processing module 54preferably constructs components of a display of the calculated statistics. The display is to be used to present the calculated statistics to the network analyst on web browser 70 .
- recordset processing module 54constructs components of a display using a computer markup language such as HTML.
- Recordset processing module 54includes compute statistics module 54 a , compare module 54 b and build components module 54 c .
- Compute statistics module 54 a of recordset processing module 54preferably completes the composite variance analysis of the raw data provided by data access module 52 .
- Compute statistics module 54 aaccepts data sets for each metric included in the query results and calculates statistics over predetermined time periods for each of the data sets.
- compute statistics module 54 acan be configured to calculate any statistics for a data set over any time range. More preferably, however, compute statistics module 54 a calculates the following statistics over the associated time periods: mean value, median value, average value, standard deviation, minimum value and maximum value for the data set associated with each metric for the entire time period requested (e.g. 48 hours); and hourly averages for the data set associated with each metric. Calculation of such statistics from sets of data is well understood by those skilled in the art.
- compute statistics module 54 aAfter computing the requested statistics from the provided raw data, compute statistics module 54 a preferably provides the calculated statistics to compare module 54 b .
- compare module 54 bcompares given variance statistics calculated by compute statistics module 54 a to determine if a predetermined relationship exists between the given variance statistics.
- compare module 54 bcompares averages, means, medians, minimums and/or maximums of subsets of measurements to an average, mean, median, minimum and/or maximum value calculated from a larger group of measurements taken over a longer time period.
- compute statistics module 54 adetermines if the variance statistic associated with the subset of measurements (e.g.
- compare module 54 bidentifies the variance statistic associated with the subset of measurements for which the predetermined relationship did (or did not) exist.
- the subsets of hourly averages (including 60 measurements) during the 48 hour periodcan be compared to the standard deviation calculated for the entire group of 2880 measurements taken over the 48 hour period.
- the hourly average of each metricis compared to the average value of the same metric over the entire requested time period, or, as explained below, over another time period.
- a subset of measurementscan include a single measurement. In such a case, the average for the subset exists and is considered to be the value of the single measurement.
- compare module 54 bdetermines if the average of a subset of measurements is within a predetermined number of standard deviations from the average of an overall group of measurements from which the standard deviation was calculated.
- the subset or subsets of measurementscan be part of the overall group of measurements but need not be. If the average of a subset of measurements is more than a predetermined number of standard deviations away from the average of an overall group of measurements, then the average of the subset of measurements is considered to be “out of control”. Compare module 54 b can then flag or otherwise identify averages of the subset of measurements that are out of control.
- What constitutes out of control performancethat is, how many standard deviations an average of a subset of measurements must be away from the average of a larger group of measurements, is preferably configurable by a user. Performing the above described comparisons between calculated variance statistics, and identifying variance statistics which do not meet certain conditions, is well understood by those skilled in the art.
- build components module 54 cpreferably constructs components of a display of the calculated variance statistics.
- build components module 54 caccomplishes this using a computer markup language such at hypertext markup language (HTML).
- HTMLhypertext markup language
- page rendering module 56interprets the output of build components module 54 c and preferably displays the measurements and statistics display on web browser 70 .
- build components module 54 bpreferably constructs an HTML document. Accordingly, page rendering module 56 preferably renders the measurement and statistics display using HTML.
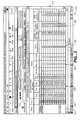
- FIG. 3is a screen print showing a preferred embodiment of a measurements and statistics screen display 210 rendered by page rendering module 56 in accordance with the present invention.
- Performance analysis line 212 of screen display 210provides identification information for the service or network component for which calculated statistic are displayed.
- the displayed statisticsrelate to a web site having the URL shown in the Figure.
- display chart 214displays measurement and statistics relevant to the displayed URL.
- Date column 216displays the date on which corresponding measurements were made.
- Hour column 218displays the time over which the corresponding averages were made. In the example shown by display chart 214 of FIG. 3, the time period over which the corresponding averages were calculated is one hour. However, it is considered that hour column 218 could also display any other time period over which displayed measurements were made or displayed averages or other statistic were calculated.
- Statistics column 220displays statistics calculated from the measurements taken by DCA 20 relevant to a user selected metric.
- the selected metricis displayed at the top of statistics column 220 .
- the selected metricis end-to-end time. However, any measured metric can preferably be selected. Beneath the column label is displayed the statistics which have been calculated for the relevant metric.
- statistics column 220is preferably divided into an additional 4 columns displaying for each hour measurements were taken, an average value, minimum value, maximum value and standard deviation.
- each measurement of each metricis taken approximately once each minute.
- the averages, minimums, maximums and standard deviations displayed in statistics column 220represent statistics calculated from approximately 60 measurements.
- the hour and date associated with each statistic displayedis preferably provided in the same row as the statistic.
- the average end-to-end time for the web site listed on Jun. 10, 2001 at 1600 hourswas 4.35 seconds.
- the minimum end-to-end time in that hourwas 1.59 seconds, the maximum was 15.24 seconds and the standard deviation for the measurements taken over the hour was 3.44. It is also considered to display additional or fewer statistics in statistics column 220 .
- Display chart 214also preferably includes errors column 222 which displays the number of errors DCA 20 experienced while taking measurements in the corresponding date and hour.
- DCA 20preferably records three types of errors: access errors, service errors and content errors.
- Errors column 222is preferably divided into three additional columns to display each of these types of errors for the corresponding date and hour in which the errors occurred. For example, there were 13 content errors with respect to the relevant web site during the first hour of Jun. 11, 2001.
- Display chart 214also preferably includes total measurements column 224 which displays the total number of measurements taken in a corresponding time period (shown in hour column 218 ). For example, while 60 measurements were taken during most hours on Jun. 10, 2001, at 2100 hours on that day, only 59 measurements were taken.
- Display chart 214also preferably includes performance details column 226 , which displays one statistic for the measurements made during the corresponding time period (shown in hour column 218 ).
- the statistic displayedis the average value of the metric listed at the top of the listing column during the corresponding time period.
- the left-most sub-column of performance details column 226displays the average value of the end-to-end time during the corresponding date and time.
- the average of the 60 measurements taken during 1900 hours of end-to-end time of the measured web sitewas 4.68 seconds.
- performance details column 226is divided into as many additional columns as metrics for which measurements were taken during the relevant time period.
- FIG. 4which is second view of display chart 214 showing the entire performance details column 226
- sub-columns for the following measurementsare included in performance details column 226 : end-to-end time, throughput, DNS lookup time, connect time, request time, response time, teardown time, and download time. It is also considered to include fewer or additional (if DCA 20 took measurements of additional metrics with respect to the particular object being measured) types of metrics in performance details column 226 .
- FIG. 5is a screen display showing a portion of display chart 214 of screen display 210 .
- processing software 50highlights a measurement statistic in a first color, as discussed above, if the measurement statistic is more that 1.5 standard deviations, but less than 2 standard deviations, away from a collective average and highlights a measurement statistic in a second color if the measurement statistic is greater than 2 standard deviations away from a collective average. As shown in FIG.
- the throughput for hour 1000 on Jun. 11, 2001(26.90 KB/Sec) has been highlighted in a different color. Accordingly, while the user is not informed on display chart 214 of what the collective average or standard deviation for throughput is, the user is alerted that the throughput for hour 1000 is greater than 1 standard deviation but less that 2 standard deviations away from the collective average.
- statistics screen display 210preferably displays hourly averages of a wide range of metrics related to a network object in a relatively compact tabular format and highlights measurements which reflect that a network service may be out of control.
- a system and method in accordance with the present inventionconsolidates and presents a relatively large amount of detailed network performance data. This advantageously allows a user viewing statistics screen display 210 to quickly complete a relatively thorough assessment the performance of a selected network object and determine whether any corrective actions are necessary with respect to the network object. This can advantageously save time when troubleshooting performance of a network service.
- a system and method in accordance with the present inventioncan measure, analyze and report network performance metrics other than those enumerated in the Background section including network performance statistics that are not associated with a URL or streaming media object.
- a system and method in accordance with the present inventioncould measure, analyze and report network performance metrics associated with network hardware devices, such as server, or portions of a network.
Landscapes
- Engineering & Computer Science (AREA)
- Signal Processing (AREA)
- Computer Networks & Wireless Communication (AREA)
- Mathematical Analysis (AREA)
- Mathematical Optimization (AREA)
- Mathematical Physics (AREA)
- Probability & Statistics with Applications (AREA)
- Pure & Applied Mathematics (AREA)
- Physics & Mathematics (AREA)
- General Physics & Mathematics (AREA)
- Algebra (AREA)
- Human Computer Interaction (AREA)
- Debugging And Monitoring (AREA)
- Data Exchanges In Wide-Area Networks (AREA)
Abstract
Description
| End-To-End Time |
| # Std. Dev. from | ||||
| Hourly Average (Sec.) | Collective Avg. | |||
| 4.5 | <1 | |||
| 8.0 | > 1 but < 2 | |||
| 12.5 | > 2 | |||
| Hour 4 | 4.2 | < 1 | ||
| Collective | 4.0 | |||
| Average | ||||
| Standard | 2.0 | |||
| Deviation | ||||
Claims (7)
Priority Applications (3)
| Application Number | Priority Date | Filing Date | Title |
|---|---|---|---|
| US09/906,288US6708137B2 (en) | 2001-07-16 | 2001-07-16 | System and method for providing composite variance analysis for network operation |
| PCT/US2002/022553WO2003009162A1 (en) | 2001-07-16 | 2002-07-16 | System and method for providing composite variance analysis for network operation |
| US10/743,732US7069177B2 (en) | 2001-07-16 | 2003-12-24 | System and method for providing composite variance analysis for network operation |
Applications Claiming Priority (1)
| Application Number | Priority Date | Filing Date | Title |
|---|---|---|---|
| US09/906,288US6708137B2 (en) | 2001-07-16 | 2001-07-16 | System and method for providing composite variance analysis for network operation |
Related Child Applications (2)
| Application Number | Title | Priority Date | Filing Date |
|---|---|---|---|
| US10/743,732ContinuationUS7069177B2 (en) | 2001-07-16 | 2003-12-24 | System and method for providing composite variance analysis for network operation |
| US10/743,732DivisionUS7069177B2 (en) | 2001-07-16 | 2003-12-24 | System and method for providing composite variance analysis for network operation |
Publications (2)
| Publication Number | Publication Date |
|---|---|
| US20030018450A1 US20030018450A1 (en) | 2003-01-23 |
| US6708137B2true US6708137B2 (en) | 2004-03-16 |
Family
ID=25422202
Family Applications (2)
| Application Number | Title | Priority Date | Filing Date |
|---|---|---|---|
| US09/906,288Expired - LifetimeUS6708137B2 (en) | 2001-07-16 | 2001-07-16 | System and method for providing composite variance analysis for network operation |
| US10/743,732Expired - LifetimeUS7069177B2 (en) | 2001-07-16 | 2003-12-24 | System and method for providing composite variance analysis for network operation |
Family Applications After (1)
| Application Number | Title | Priority Date | Filing Date |
|---|---|---|---|
| US10/743,732Expired - LifetimeUS7069177B2 (en) | 2001-07-16 | 2003-12-24 | System and method for providing composite variance analysis for network operation |
Country Status (2)
| Country | Link |
|---|---|
| US (2) | US6708137B2 (en) |
| WO (1) | WO2003009162A1 (en) |
Cited By (52)
| Publication number | Priority date | Publication date | Assignee | Title |
|---|---|---|---|---|
| US20020133535A1 (en)* | 2001-03-14 | 2002-09-19 | Microsoft Corporation | Identity-centric data access |
| US20030065703A1 (en)* | 2001-10-02 | 2003-04-03 | Justin Aborn | Automated server replication |
| US20030065762A1 (en)* | 2001-09-28 | 2003-04-03 | Cable & Wireless Internet Services, Inc. | Configurable adaptive global traffic control and management |
| US20030079027A1 (en)* | 2001-10-18 | 2003-04-24 | Michael Slocombe | Content request routing and load balancing for content distribution networks |
| US20030131069A1 (en)* | 2001-03-14 | 2003-07-10 | Lucovsky Mark H. | Schema-based context service |
| US20030145080A1 (en)* | 2002-01-31 | 2003-07-31 | International Business Machines Corporation | Method and system for performance reporting in a network environment |
| US20030177264A1 (en)* | 2002-03-14 | 2003-09-18 | Ferhan Elvanoglu | Measuring performance metrics of networked computing entities by routing network messages |
| US20030200293A1 (en)* | 2002-04-18 | 2003-10-23 | International Business Machines Corporation | Graphics for end to end component mapping and problem - solving in a network environment |
| US20040039806A1 (en)* | 2001-10-26 | 2004-02-26 | Miras Bertrand | Methods and systems for the synchronized recording and reading of data coming from a plurality of terminal devices |
| US20040064546A1 (en)* | 2002-09-26 | 2004-04-01 | International Business Machines Corporation | E-business operations measurements |
| US20040205100A1 (en)* | 2003-03-06 | 2004-10-14 | International Business Machines Corporation | E-business competitive measurements |
| US20040205184A1 (en)* | 2003-03-06 | 2004-10-14 | International Business Machines Corporation | E-business operations measurements reporting |
| US20050165773A1 (en)* | 2001-03-14 | 2005-07-28 | Microsoft Corporation | Executing dynamically assigned functions while providing services |
| US20050177631A1 (en)* | 2004-02-06 | 2005-08-11 | Microsoft Corporation | Network DNA |
| US20050185631A1 (en)* | 2004-02-19 | 2005-08-25 | Bernard Marc R. | Optical line termination, passive optical network, and method and apparatus for performance monitoring |
| US6961677B1 (en)* | 2003-08-25 | 2005-11-01 | Itt Manufacturing Enterprises, Inc. | Method and apparatus for categorizing unexplained residuals |
| US6973490B1 (en)* | 1999-06-23 | 2005-12-06 | Savvis Communications Corp. | Method and system for object-level web performance and analysis |
| US20060015574A1 (en)* | 2002-02-14 | 2006-01-19 | Digital Island, Inc. | Managed object replication and delivery |
| US20060031469A1 (en)* | 2004-06-29 | 2006-02-09 | International Business Machines Corporation | Measurement, reporting, and management of quality of service for a real-time communication application in a network environment |
| US20060147203A1 (en)* | 2004-12-30 | 2006-07-06 | Thinguldstad Arthur M | Optical network element with remote access capability |
| US7079904B1 (en)* | 2003-09-12 | 2006-07-18 | Itt Manufacturing Enterprises, Inc. | Adaptive software management |
| US20060277190A1 (en)* | 2005-06-03 | 2006-12-07 | Microsoft Corporation | Search authoring metrics and debugging |
| US20060293868A1 (en)* | 2005-06-08 | 2006-12-28 | Azaleos Corporation | Subscriber based monitoring service with contextual analysis |
| US20070078825A1 (en)* | 2005-09-30 | 2007-04-05 | Sap Ag | Systems and methods for repeatable database performance testing |
| US20070083561A1 (en)* | 2001-03-14 | 2007-04-12 | Microsoft Corporation | Distributing notifications to multiple recipients via a broadcast list |
| US7277843B1 (en)* | 2002-07-15 | 2007-10-02 | Network Physics | Method for real-time auto-detection of outliers |
| US20080056144A1 (en)* | 2006-09-06 | 2008-03-06 | Cypheredge Technologies | System and method for analyzing and tracking communications network operations |
| US20080133746A1 (en)* | 2005-06-08 | 2008-06-05 | Azaleos Corporation | Monitoring service with inter-enterprise contextual analysis |
| US20080215718A1 (en)* | 2001-09-28 | 2008-09-04 | Level 3 Communications, Llc | Policy-based content delivery network selection |
| US20080250141A1 (en)* | 2005-06-07 | 2008-10-09 | Azaleos Corporation | Monitoring service with inter-enterprise contextual analysis |
| US20080270836A1 (en)* | 2006-12-19 | 2008-10-30 | Kallakuri Praveen | State discovery automaton for dynamic web applications |
| US20080279222A1 (en)* | 2001-10-18 | 2008-11-13 | Level 3 Communications Llc | Distribution of traffic across a computer network |
| US20090028553A1 (en)* | 2007-07-27 | 2009-01-29 | Moshe Oron | Method and apparatus of detecting abnormal behavior in a passive optical network (PON) |
| US7509343B1 (en)* | 2004-06-09 | 2009-03-24 | Sprint Communications Company L.P. | System and method of collecting and reporting system performance metrics |
| US20090089629A1 (en)* | 2007-09-27 | 2009-04-02 | Microsoft Corporation | Capturing diagnostics in web browser applications |
| US20090158304A1 (en)* | 2007-12-18 | 2009-06-18 | Baofeng Jiang | Systems and methods for data collection in networks |
| WO2009097434A3 (en)* | 2008-01-29 | 2009-11-05 | Virtual Instruments Corporation | Systems and methods for filtering network diagnostic statistics |
| US20100153787A1 (en)* | 2008-12-12 | 2010-06-17 | Beattie James Gordon Jr | Methods and apparatus to detect an error condition in a communication network |
| US20100268356A1 (en)* | 2009-04-17 | 2010-10-21 | Siemens Ag | Method for Checking Suitability of a Data Processing Device for Performing Failsafe Automation Processes |
| US20100332595A1 (en)* | 2008-04-04 | 2010-12-30 | David Fullagar | Handling long-tail content in a content delivery network (cdn) |
| US7953888B2 (en) | 1999-06-18 | 2011-05-31 | Level 3 Communications, Llc | On-demand overlay routing for computer-based communication networks |
| US8185619B1 (en)* | 2006-06-28 | 2012-05-22 | Compuware Corporation | Analytics system and method |
| US20120310625A1 (en)* | 2011-05-31 | 2012-12-06 | International Business Machines Corporation | Method for testing a browser-based application |
| US8543901B1 (en) | 1999-11-01 | 2013-09-24 | Level 3 Communications, Llc | Verification of content stored in a network |
| US8718976B2 (en) | 2007-08-30 | 2014-05-06 | Hsb Solomon Associates, Llc | Control asset comparative performance analysis system and methodology |
| US20140164537A1 (en)* | 2012-12-07 | 2014-06-12 | International Business Machines Corporation | Expert availability identification |
| US8930538B2 (en) | 2008-04-04 | 2015-01-06 | Level 3 Communications, Llc | Handling long-tail content in a content delivery network (CDN) |
| US9055124B1 (en)* | 2012-06-19 | 2015-06-09 | Amazon Technologies, Inc. | Enhanced caching of network content |
| WO2016200731A1 (en)* | 2015-06-12 | 2016-12-15 | Level 3 Communications, Llc | Network operational flaw detection using metrics |
| US9886309B2 (en) | 2002-06-28 | 2018-02-06 | Microsoft Technology Licensing, Llc | Identity-based distributed computing for device resources |
| US9953052B1 (en) | 2012-06-19 | 2018-04-24 | Amazon Technologies, Inc. | Caching of updated network content portions |
| US10924573B2 (en) | 2008-04-04 | 2021-02-16 | Level 3 Communications, Llc | Handling long-tail content in a content delivery network (CDN) |
Families Citing this family (97)
| Publication number | Priority date | Publication date | Assignee | Title |
|---|---|---|---|---|
| US7409440B1 (en)* | 2002-12-12 | 2008-08-05 | F5 Net Works, Inc. | User defined data items |
| US7296263B1 (en) | 2002-12-12 | 2007-11-13 | F5 Networks, Inc. | Method and system for performing operations on data using XML streams |
| EP1441329B1 (en)* | 2003-01-21 | 2009-09-09 | Psytechnics Ltd | Audio signal quality assessment method and apparatus |
| ATE389226T1 (en)* | 2003-01-21 | 2008-03-15 | Psytechnics Ltd | METHOD FOR DETERMINING THE QUALITY OF AN AUDIO SIGNAL |
| EP1478126A1 (en)* | 2003-05-16 | 2004-11-17 | Siemens Aktiengesellschaft | Real time monitoring of measured data for telecommunications systems |
| US20050097088A1 (en)* | 2003-11-04 | 2005-05-05 | Dominic Bennett | Techniques for analyzing the performance of websites |
| US20050223264A1 (en)* | 2004-03-30 | 2005-10-06 | Jennifer Arden | System and method providing high level network object performance information |
| US7499994B2 (en)* | 2004-03-30 | 2009-03-03 | Emc Corporation | System and method of providing performance information for a communications network |
| US7565610B2 (en) | 2004-03-30 | 2009-07-21 | Emc Corporation | System and method providing detailed network object performance information to locate root cause |
| US7685273B1 (en)* | 2004-03-31 | 2010-03-23 | Compuware Corporation | Methods and apparatus for collecting and displaying performance metrics from a web site |
| US8065410B1 (en) | 2004-03-31 | 2011-11-22 | Compuware Corporation | Methods and apparatus for collecting performance metrics from a web site |
| US20060031522A1 (en)* | 2004-06-01 | 2006-02-09 | Telefonaktiebolaget L M Ericsson (Publ) | Method and network entity for session initiation protocol (SIP) based network traffic measurements |
| US20060114911A1 (en)* | 2004-11-03 | 2006-06-01 | Applied Expert Systems, Inc. | Collection and analysis of route data for "Forward and Reverse" routes |
| CN100440796C (en) | 2004-12-04 | 2008-12-03 | 华为技术有限公司 | A method for obtaining network key performance indicators and key performance indicator components |
| FR2881009B1 (en) | 2005-01-17 | 2007-04-20 | Bouygues Telecom Sa | METHOD FOR DETECTING EVENTS IN A TELECOMMUNICATIONS NETWORK |
| US8274904B1 (en)* | 2005-02-28 | 2012-09-25 | At&T Intellectual Property Ii, L.P. | Method and apparatus for providing signature based predictive maintenance in communication networks |
| US10127130B2 (en) | 2005-03-18 | 2018-11-13 | Salesforce.Com | Identifying contributors that explain differences between a data set and a subset of the data set |
| US9129226B2 (en)* | 2011-12-04 | 2015-09-08 | Beyondcore, Inc. | Analyzing data sets with the help of inexpert humans to find patterns |
| US7751331B1 (en)* | 2005-05-09 | 2010-07-06 | Cisco Technology, Inc. | Technique for policy conflict resolution using priority with variance |
| US7626939B1 (en)* | 2005-05-16 | 2009-12-01 | Emc Corporation | Method and apparatus for automated time-based peer-to-peer thresholding |
| US20060277206A1 (en)* | 2005-06-02 | 2006-12-07 | Bailey Philip G | Automated reporting of computer system metrics |
| US8209406B2 (en)* | 2005-10-28 | 2012-06-26 | Adobe Systems Incorporated | Assessment of click or traffic quality |
| US8251924B2 (en)* | 2006-07-07 | 2012-08-28 | Ambient Corporation | Neural translator |
| US8880541B2 (en) | 2006-11-27 | 2014-11-04 | Adobe Systems Incorporated | Qualification of website data and analysis using anomalies relative to historic patterns |
| US20080175588A1 (en)* | 2006-12-08 | 2008-07-24 | Tellabs Vienna, Inc. | Method and apparatus for analyzing a network or a network element fault |
| US8095650B1 (en) | 2007-07-30 | 2012-01-10 | Compuware Corporation | Methods and apparatus for real user monitoring including flash monitoring |
| US9106800B2 (en)* | 2007-08-31 | 2015-08-11 | At&T Intellectual Property I, L.P. | System and method of monitoring video data packet delivery |
| US8626949B2 (en)* | 2007-09-27 | 2014-01-07 | Microsoft Corporation | Intelligent network address lookup service |
| US8121117B1 (en) | 2007-10-01 | 2012-02-21 | F5 Networks, Inc. | Application layer network traffic prioritization |
| US7930394B2 (en)* | 2008-10-01 | 2011-04-19 | Microsoft Corporation | Measured client experience for computer network |
| US9558164B1 (en) | 2008-12-31 | 2017-01-31 | F5 Networks, Inc. | Methods and system for converting WSDL documents into XML schema |
| US8531978B2 (en) | 2009-02-02 | 2013-09-10 | Level 3 Communications, Llc | Network cost analysis |
| CN102369690B (en)* | 2009-02-02 | 2015-10-21 | 第三雷沃通讯有限责任公司 | Analysis of network traffic |
| US8527588B2 (en)* | 2009-05-12 | 2013-09-03 | International Business Machines Corporation | Web conference performance monitoring system |
| EP2446583A1 (en)* | 2009-06-25 | 2012-05-02 | Telefonaktiebolaget L M Ericsson (PUBL) | Estimating user-perceived tcp throughput |
| US8856027B2 (en)* | 2009-10-07 | 2014-10-07 | Yahoo! Inc. | System and method for slow ad detection |
| US10721269B1 (en) | 2009-11-06 | 2020-07-21 | F5 Networks, Inc. | Methods and system for returning requests with javascript for clients before passing a request to a server |
| US8806056B1 (en) | 2009-11-20 | 2014-08-12 | F5 Networks, Inc. | Method for optimizing remote file saves in a failsafe way |
| US11140178B1 (en) | 2009-11-23 | 2021-10-05 | F5 Networks, Inc. | Methods and system for client side analysis of responses for server purposes |
| US20110145714A1 (en)* | 2009-12-15 | 2011-06-16 | At&T Intellectual Property I, L.P. | System and method for web-integrated statistical analysis |
| JP2011243112A (en)* | 2010-05-20 | 2011-12-01 | Hitachi Ltd | System management method and management device |
| US9503375B1 (en) | 2010-06-30 | 2016-11-22 | F5 Networks, Inc. | Methods for managing traffic in a multi-service environment and devices thereof |
| US9420049B1 (en) | 2010-06-30 | 2016-08-16 | F5 Networks, Inc. | Client side human user indicator |
| US8347100B1 (en) | 2010-07-14 | 2013-01-01 | F5 Networks, Inc. | Methods for DNSSEC proxying and deployment amelioration and systems thereof |
| US10296653B2 (en) | 2010-09-07 | 2019-05-21 | F5 Networks, Inc. | Systems and methods for accelerating web page loading |
| EP2710784B1 (en) | 2011-05-16 | 2017-12-06 | F5 Networks, Inc | A method for load balancing of requests' processing of diameter servers |
| US8396836B1 (en) | 2011-06-30 | 2013-03-12 | F5 Networks, Inc. | System for mitigating file virtualization storage import latency |
| US8463850B1 (en) | 2011-10-26 | 2013-06-11 | F5 Networks, Inc. | System and method of algorithmically generating a server side transaction identifier |
| US10796232B2 (en) | 2011-12-04 | 2020-10-06 | Salesforce.Com, Inc. | Explaining differences between predicted outcomes and actual outcomes of a process |
| US10802687B2 (en) | 2011-12-04 | 2020-10-13 | Salesforce.Com, Inc. | Displaying differences between different data sets of a process |
| US10230566B1 (en) | 2012-02-17 | 2019-03-12 | F5 Networks, Inc. | Methods for dynamically constructing a service principal name and devices thereof |
| US9244843B1 (en) | 2012-02-20 | 2016-01-26 | F5 Networks, Inc. | Methods for improving flow cache bandwidth utilization and devices thereof |
| US9020912B1 (en) | 2012-02-20 | 2015-04-28 | F5 Networks, Inc. | Methods for accessing data in a compressed file system and devices thereof |
| WO2013163648A2 (en) | 2012-04-27 | 2013-10-31 | F5 Networks, Inc. | Methods for optimizing service of content requests and devices thereof |
| US10404556B2 (en)* | 2012-06-22 | 2019-09-03 | Microsoft Technology Licensing, Llc | Methods and computer program products for correlation analysis of network traffic in a network device |
| US10033837B1 (en) | 2012-09-29 | 2018-07-24 | F5 Networks, Inc. | System and method for utilizing a data reducing module for dictionary compression of encoded data |
| US9578090B1 (en) | 2012-11-07 | 2017-02-21 | F5 Networks, Inc. | Methods for provisioning application delivery service and devices thereof |
| US10375155B1 (en) | 2013-02-19 | 2019-08-06 | F5 Networks, Inc. | System and method for achieving hardware acceleration for asymmetric flow connections |
| US9497614B1 (en) | 2013-02-28 | 2016-11-15 | F5 Networks, Inc. | National traffic steering device for a better control of a specific wireless/LTE network |
| US20140280751A1 (en)* | 2013-03-15 | 2014-09-18 | Sharon Jiayin Lo | System and Method of Use of Interactive User Group Function for Network Devices |
| US10320628B2 (en)* | 2013-06-19 | 2019-06-11 | Citrix Systems, Inc. | Confidence scoring of device reputation based on characteristic network behavior |
| TWI580219B (en)* | 2013-10-25 | 2017-04-21 | 中磊電子股份有限公司 | Method for measuring network bandwidth |
| US10187317B1 (en) | 2013-11-15 | 2019-01-22 | F5 Networks, Inc. | Methods for traffic rate control and devices thereof |
| US9300549B2 (en)* | 2013-11-27 | 2016-03-29 | At&T Intellectual Property I, L.P. | Method and apparatus for measuring end-to-end accessibility in voice over long term evolution networks |
| US11838851B1 (en) | 2014-07-15 | 2023-12-05 | F5, Inc. | Methods for managing L7 traffic classification and devices thereof |
| CN105491078B (en)* | 2014-09-15 | 2019-01-22 | 阿里巴巴集团控股有限公司 | Data processing method and device, SOA system in SOA system |
| US10896432B1 (en)* | 2014-09-22 | 2021-01-19 | Amazon Technologies, Inc. | Bandwidth cost assignment for multi-tenant networks |
| US10182013B1 (en) | 2014-12-01 | 2019-01-15 | F5 Networks, Inc. | Methods for managing progressive image delivery and devices thereof |
| US11895138B1 (en) | 2015-02-02 | 2024-02-06 | F5, Inc. | Methods for improving web scanner accuracy and devices thereof |
| US10387412B1 (en)* | 2015-02-12 | 2019-08-20 | Cloud & Stream Gears Llc | Incremental Z-score calculation for big data or streamed data using components |
| US10834065B1 (en) | 2015-03-31 | 2020-11-10 | F5 Networks, Inc. | Methods for SSL protected NTLM re-authentication and devices thereof |
| BR112017022494A2 (en) | 2015-04-20 | 2018-07-17 | Univation Tech Llc | bridged biaromatic ligands and transition metal compounds prepared therefrom |
| BR112017022240A2 (en) | 2015-04-20 | 2018-07-10 | Univation Technologies, Llc | Methods for preparing bridged biaromatic ligands |
| EP3286161B1 (en) | 2015-04-20 | 2020-01-08 | Univation Technologies, LLC | Methods for preparing bridged bi-aromatic ligands |
| CA2982900C (en) | 2015-04-20 | 2023-09-12 | Univation Technologies, Llc | Bridged bi-aromatic ligands and olefin polymerization catalysts prepared therefrom |
| US10505818B1 (en) | 2015-05-05 | 2019-12-10 | F5 Networks. Inc. | Methods for analyzing and load balancing based on server health and devices thereof |
| US11350254B1 (en) | 2015-05-05 | 2022-05-31 | F5, Inc. | Methods for enforcing compliance policies and devices thereof |
| US10476992B1 (en) | 2015-07-06 | 2019-11-12 | F5 Networks, Inc. | Methods for providing MPTCP proxy options and devices thereof |
| US11757946B1 (en) | 2015-12-22 | 2023-09-12 | F5, Inc. | Methods for analyzing network traffic and enforcing network policies and devices thereof |
| US10404698B1 (en) | 2016-01-15 | 2019-09-03 | F5 Networks, Inc. | Methods for adaptive organization of web application access points in webtops and devices thereof |
| US10797888B1 (en) | 2016-01-20 | 2020-10-06 | F5 Networks, Inc. | Methods for secured SCEP enrollment for client devices and devices thereof |
| US11178150B1 (en) | 2016-01-20 | 2021-11-16 | F5 Networks, Inc. | Methods for enforcing access control list based on managed application and devices thereof |
| EP3433958B1 (en)* | 2016-03-24 | 2020-05-13 | Telefonaktiebolaget LM Ericsson (publ) | A method and apparatus for determining a value for a transmission parameter |
| US10412198B1 (en) | 2016-10-27 | 2019-09-10 | F5 Networks, Inc. | Methods for improved transmission control protocol (TCP) performance visibility and devices thereof |
| US11063758B1 (en) | 2016-11-01 | 2021-07-13 | F5 Networks, Inc. | Methods for facilitating cipher selection and devices thereof |
| US10505792B1 (en) | 2016-11-02 | 2019-12-10 | F5 Networks, Inc. | Methods for facilitating network traffic analytics and devices thereof |
| US10310471B2 (en)* | 2017-02-28 | 2019-06-04 | Accenture Global Solutions Limited | Content recognition and communication system |
| US10812266B1 (en) | 2017-03-17 | 2020-10-20 | F5 Networks, Inc. | Methods for managing security tokens based on security violations and devices thereof |
| US11122042B1 (en) | 2017-05-12 | 2021-09-14 | F5 Networks, Inc. | Methods for dynamically managing user access control and devices thereof |
| US11343237B1 (en) | 2017-05-12 | 2022-05-24 | F5, Inc. | Methods for managing a federated identity environment using security and access control data and devices thereof |
| US10735529B2 (en)* | 2017-12-07 | 2020-08-04 | At&T Intellectual Property I, L.P. | Operations control of network services |
| US11223689B1 (en) | 2018-01-05 | 2022-01-11 | F5 Networks, Inc. | Methods for multipath transmission control protocol (MPTCP) based session migration and devices thereof |
| CN108920662A (en)* | 2018-07-04 | 2018-11-30 | 上海小蚁科技有限公司 | A kind of data comparison method and device, storage medium, terminal |
| US12003422B1 (en) | 2018-09-28 | 2024-06-04 | F5, Inc. | Methods for switching network packets based on packet data and devices |
| KR102179029B1 (en)* | 2019-10-08 | 2020-11-16 | 한국과학기술원 | Method and apparatus for probabilistic content caching through cooperative nodes to lessen backhaul traffic |
| CN113852512B (en)* | 2020-06-28 | 2024-09-27 | 中兴通讯股份有限公司 | Data analysis method, electronic device and storage medium |
| US11411811B2 (en)* | 2020-08-24 | 2022-08-09 | International Business Machines Corporation | Fault localization for cloud-native applications |
Citations (2)
| Publication number | Priority date | Publication date | Assignee | Title |
|---|---|---|---|---|
| US6073089A (en)* | 1997-10-22 | 2000-06-06 | Baker; Michelle | Systems and methods for adaptive profiling, fault detection, and alert generation in a changing environment which is measurable by at least two different measures of state |
| US6377907B1 (en)* | 1999-11-17 | 2002-04-23 | Mci Worldcom, Inc. | System and method for collating UNIX performance metrics |
Family Cites Families (3)
| Publication number | Priority date | Publication date | Assignee | Title |
|---|---|---|---|---|
| US6564174B1 (en)* | 1999-09-29 | 2003-05-13 | Bmc Software, Inc. | Enterprise management system and method which indicates chaotic behavior in system resource usage for more accurate modeling and prediction |
| US6701363B1 (en)* | 2000-02-29 | 2004-03-02 | International Business Machines Corporation | Method, computer program product, and system for deriving web transaction performance metrics |
| US6643613B2 (en)* | 2001-07-03 | 2003-11-04 | Altaworks Corporation | System and method for monitoring performance metrics |
- 2001
- 2001-07-16USUS09/906,288patent/US6708137B2/ennot_activeExpired - Lifetime
- 2002
- 2002-07-16WOPCT/US2002/022553patent/WO2003009162A1/ennot_activeApplication Discontinuation
- 2003
- 2003-12-24USUS10/743,732patent/US7069177B2/ennot_activeExpired - Lifetime
Patent Citations (2)
| Publication number | Priority date | Publication date | Assignee | Title |
|---|---|---|---|---|
| US6073089A (en)* | 1997-10-22 | 2000-06-06 | Baker; Michelle | Systems and methods for adaptive profiling, fault detection, and alert generation in a changing environment which is measurable by at least two different measures of state |
| US6377907B1 (en)* | 1999-11-17 | 2002-04-23 | Mci Worldcom, Inc. | System and method for collating UNIX performance metrics |
Non-Patent Citations (3)
| Title |
|---|
| Judge, J., "A Model for the Marginal Distribution of Aggregate Per Second HTTP Request Rate", Local and Metropolitan Area Networks, 1999, pp. 29-36 (No month).** |
| Kushida, T., "The Traffice Measurement and the Empirical Studies for the Internet", Global Telecommunications Conference, 1998, IEEE, pp. 1142-1147. (No month).* |
| Morris et al., "Variance of aggregated Web traffice", INFOCOM 2000, Nineteenth Annual Joint Conference of the IEEE Computer and Communications Societies, Proceedings, IEEE, vol.: 1, 2000, pp. 360-366 (No month).** |
Cited By (112)
| Publication number | Priority date | Publication date | Assignee | Title |
|---|---|---|---|---|
| US8599697B2 (en) | 1999-06-18 | 2013-12-03 | Level 3 Communications, Llc | Overlay network |
| US7953888B2 (en) | 1999-06-18 | 2011-05-31 | Level 3 Communications, Llc | On-demand overlay routing for computer-based communication networks |
| US7353272B2 (en) | 1999-06-23 | 2008-04-01 | Savvis Communications Corporation | Method and system for internet performance monitoring and analysis including user interface and periodic information measurement and collection |
| US6973490B1 (en)* | 1999-06-23 | 2005-12-06 | Savvis Communications Corp. | Method and system for object-level web performance and analysis |
| US8543901B1 (en) | 1999-11-01 | 2013-09-24 | Level 3 Communications, Llc | Verification of content stored in a network |
| US9413817B2 (en) | 2001-03-14 | 2016-08-09 | Microsoft Technology Licensing, Llc | Executing dynamically assigned functions while providing services |
| US20020133535A1 (en)* | 2001-03-14 | 2002-09-19 | Microsoft Corporation | Identity-centric data access |
| US20070083561A1 (en)* | 2001-03-14 | 2007-04-12 | Microsoft Corporation | Distributing notifications to multiple recipients via a broadcast list |
| US9460421B2 (en) | 2001-03-14 | 2016-10-04 | Microsoft Technology Licensing, Llc | Distributing notifications to multiple recipients via a broadcast list |
| US8572576B2 (en) | 2001-03-14 | 2013-10-29 | Microsoft Corporation | Executing dynamically assigned functions while providing services |
| US20030131069A1 (en)* | 2001-03-14 | 2003-07-10 | Lucovsky Mark H. | Schema-based context service |
| US20060150140A1 (en)* | 2001-03-14 | 2006-07-06 | Microsoft Corporation | Executing dynamically assigned functions while providing services |
| US7539747B2 (en) | 2001-03-14 | 2009-05-26 | Microsoft Corporation | Schema-based context service |
| US20050165773A1 (en)* | 2001-03-14 | 2005-07-28 | Microsoft Corporation | Executing dynamically assigned functions while providing services |
| US20030065762A1 (en)* | 2001-09-28 | 2003-04-03 | Cable & Wireless Internet Services, Inc. | Configurable adaptive global traffic control and management |
| US20080215718A1 (en)* | 2001-09-28 | 2008-09-04 | Level 3 Communications, Llc | Policy-based content delivery network selection |
| US7822871B2 (en) | 2001-09-28 | 2010-10-26 | Level 3 Communications, Llc | Configurable adaptive global traffic control and management |
| US20080147866A1 (en)* | 2001-09-28 | 2008-06-19 | Level 3 Communications, Llc | Distributing requests across multiple content delivery networks based on subscriber policy |
| US8645517B2 (en) | 2001-09-28 | 2014-02-04 | Level 3 Communications, Llc | Policy-based content delivery network selection |
| US7860964B2 (en) | 2001-09-28 | 2010-12-28 | Level 3 Communications, Llc | Policy-based content delivery network selection |
| US9203636B2 (en) | 2001-09-28 | 2015-12-01 | Level 3 Communications, Llc | Distributing requests across multiple content delivery networks based on subscriber policy |
| US9338227B2 (en) | 2001-10-02 | 2016-05-10 | Level 3 Communications, Llc | Automated management of content servers based on change in demand |
| US20030065703A1 (en)* | 2001-10-02 | 2003-04-03 | Justin Aborn | Automated server replication |
| US10771541B2 (en) | 2001-10-02 | 2020-09-08 | Level 3 Communications, Llc | Automated management of content servers based on change in demand |
| US20080162700A1 (en)* | 2001-10-02 | 2008-07-03 | Level 3 Communications Llc | Automated server replication |
| US7373644B2 (en) | 2001-10-02 | 2008-05-13 | Level 3 Communications, Llc | Automated server replication |
| US20030079027A1 (en)* | 2001-10-18 | 2003-04-24 | Michael Slocombe | Content request routing and load balancing for content distribution networks |
| US20080279222A1 (en)* | 2001-10-18 | 2008-11-13 | Level 3 Communications Llc | Distribution of traffic across a computer network |
| US10476984B2 (en) | 2001-10-18 | 2019-11-12 | Level 3 Communications, Llc | Content request routing and load balancing for content distribution networks |
| US9021112B2 (en) | 2001-10-18 | 2015-04-28 | Level 3 Communications, Llc | Content request routing and load balancing for content distribution networks |
| US20040039806A1 (en)* | 2001-10-26 | 2004-02-26 | Miras Bertrand | Methods and systems for the synchronized recording and reading of data coming from a plurality of terminal devices |
| US20030145080A1 (en)* | 2002-01-31 | 2003-07-31 | International Business Machines Corporation | Method and system for performance reporting in a network environment |
| US8086720B2 (en) | 2002-01-31 | 2011-12-27 | International Business Machines Corporation | Performance reporting in a network environment |
| US20080065724A1 (en)* | 2002-02-14 | 2008-03-13 | Level 3 Communications, Llc | Peer server handoff in content delivery network |
| US10979499B2 (en) | 2002-02-14 | 2021-04-13 | Level 3 Communications, Llc | Managed object replication and delivery |
| US9992279B2 (en) | 2002-02-14 | 2018-06-05 | Level 3 Communications, Llc | Managed object replication and delivery |
| US8924466B2 (en) | 2002-02-14 | 2014-12-30 | Level 3 Communications, Llc | Server handoff in content delivery network |
| US9167036B2 (en) | 2002-02-14 | 2015-10-20 | Level 3 Communications, Llc | Managed object replication and delivery |
| US20060015574A1 (en)* | 2002-02-14 | 2006-01-19 | Digital Island, Inc. | Managed object replication and delivery |
| US6816886B2 (en)* | 2002-03-14 | 2004-11-09 | Microsoft Corporation | Measuring performance metrics of networked computing entities |
| US20030177264A1 (en)* | 2002-03-14 | 2003-09-18 | Ferhan Elvanoglu | Measuring performance metrics of networked computing entities by routing network messages |
| US7412502B2 (en) | 2002-04-18 | 2008-08-12 | International Business Machines Corporation | Graphics for end to end component mapping and problem-solving in a network environment |
| US20080216095A1 (en)* | 2002-04-18 | 2008-09-04 | International Business Machines Corporation | Graphics for End to End Component Mapping and Problem-Solving in a Network Environment |
| US20030200293A1 (en)* | 2002-04-18 | 2003-10-23 | International Business Machines Corporation | Graphics for end to end component mapping and problem - solving in a network environment |
| US8316381B2 (en) | 2002-04-18 | 2012-11-20 | International Business Machines Corporation | Graphics for end to end component mapping and problem-solving in a network environment |
| US9886309B2 (en) | 2002-06-28 | 2018-02-06 | Microsoft Technology Licensing, Llc | Identity-based distributed computing for device resources |
| US7277843B1 (en)* | 2002-07-15 | 2007-10-02 | Network Physics | Method for real-time auto-detection of outliers |
| US20040064546A1 (en)* | 2002-09-26 | 2004-04-01 | International Business Machines Corporation | E-business operations measurements |
| US7269651B2 (en) | 2002-09-26 | 2007-09-11 | International Business Machines Corporation | E-business operations measurements |
| US8527620B2 (en) | 2003-03-06 | 2013-09-03 | International Business Machines Corporation | E-business competitive measurements |
| US20040205100A1 (en)* | 2003-03-06 | 2004-10-14 | International Business Machines Corporation | E-business competitive measurements |
| US20040205184A1 (en)* | 2003-03-06 | 2004-10-14 | International Business Machines Corporation | E-business operations measurements reporting |
| US6961677B1 (en)* | 2003-08-25 | 2005-11-01 | Itt Manufacturing Enterprises, Inc. | Method and apparatus for categorizing unexplained residuals |
| US7079904B1 (en)* | 2003-09-12 | 2006-07-18 | Itt Manufacturing Enterprises, Inc. | Adaptive software management |
| US9374286B2 (en) | 2004-02-06 | 2016-06-21 | Microsoft Technology Licensing, Llc | Network classification |
| US8676969B2 (en) | 2004-02-06 | 2014-03-18 | Microsoft Corporation | Network classification |
| US9608883B2 (en) | 2004-02-06 | 2017-03-28 | Microsoft Technology Licensing, Llc | Network classification |
| US8126999B2 (en)* | 2004-02-06 | 2012-02-28 | Microsoft Corporation | Network DNA |
| US20050177631A1 (en)* | 2004-02-06 | 2005-08-11 | Microsoft Corporation | Network DNA |
| US7103073B2 (en)* | 2004-02-19 | 2006-09-05 | Advanced Fibre Communications, Inc. | Optical line termination, passive optical network, and method and apparatus for performance monitoring |
| US20050185631A1 (en)* | 2004-02-19 | 2005-08-25 | Bernard Marc R. | Optical line termination, passive optical network, and method and apparatus for performance monitoring |
| WO2005079416A3 (en)* | 2004-02-19 | 2005-09-29 | Tellabs Petaluma Inc | Optical line termination, passive optical network, and method and apparatus for performance monitoring |
| US20070002903A1 (en)* | 2004-02-19 | 2007-01-04 | Advanced Fibre Communications, Inc. | Optical line termination, passive optical network, and method and apparatus for performance monitoring |
| US7509343B1 (en)* | 2004-06-09 | 2009-03-24 | Sprint Communications Company L.P. | System and method of collecting and reporting system performance metrics |
| US20060031469A1 (en)* | 2004-06-29 | 2006-02-09 | International Business Machines Corporation | Measurement, reporting, and management of quality of service for a real-time communication application in a network environment |
| US20060147203A1 (en)* | 2004-12-30 | 2006-07-06 | Thinguldstad Arthur M | Optical network element with remote access capability |
| US7783657B2 (en)* | 2005-06-03 | 2010-08-24 | Microsoft Corporation | Search authoring metrics and debugging |
| US20060277190A1 (en)* | 2005-06-03 | 2006-12-07 | Microsoft Corporation | Search authoring metrics and debugging |
| US7502846B2 (en)* | 2005-06-07 | 2009-03-10 | Azaleos Corporation | Monitoring service with inter-enterprise contextual analysis |
| US20080250141A1 (en)* | 2005-06-07 | 2008-10-09 | Azaleos Corporation | Monitoring service with inter-enterprise contextual analysis |
| US20080133746A1 (en)* | 2005-06-08 | 2008-06-05 | Azaleos Corporation | Monitoring service with inter-enterprise contextual analysis |
| US20060293868A1 (en)* | 2005-06-08 | 2006-12-28 | Azaleos Corporation | Subscriber based monitoring service with contextual analysis |
| US7403954B2 (en)* | 2005-09-30 | 2008-07-22 | Sap Ag | Systems and methods for repeatable database performance testing |
| US20070078825A1 (en)* | 2005-09-30 | 2007-04-05 | Sap Ag | Systems and methods for repeatable database performance testing |
| US8185619B1 (en)* | 2006-06-28 | 2012-05-22 | Compuware Corporation | Analytics system and method |
| US20080056144A1 (en)* | 2006-09-06 | 2008-03-06 | Cypheredge Technologies | System and method for analyzing and tracking communications network operations |
| US20080270836A1 (en)* | 2006-12-19 | 2008-10-30 | Kallakuri Praveen | State discovery automaton for dynamic web applications |
| US20090028553A1 (en)* | 2007-07-27 | 2009-01-29 | Moshe Oron | Method and apparatus of detecting abnormal behavior in a passive optical network (PON) |
| US8718976B2 (en) | 2007-08-30 | 2014-05-06 | Hsb Solomon Associates, Llc | Control asset comparative performance analysis system and methodology |
| US8271836B2 (en)* | 2007-09-27 | 2012-09-18 | Microsoft Corporation | Capturing diagnostics in web browser applications |
| US20090089629A1 (en)* | 2007-09-27 | 2009-04-02 | Microsoft Corporation | Capturing diagnostics in web browser applications |
| US20090158304A1 (en)* | 2007-12-18 | 2009-06-18 | Baofeng Jiang | Systems and methods for data collection in networks |
| US20100023867A1 (en)* | 2008-01-29 | 2010-01-28 | Virtual Instruments Corporation | Systems and methods for filtering network diagnostic statistics |
| WO2009097434A3 (en)* | 2008-01-29 | 2009-11-05 | Virtual Instruments Corporation | Systems and methods for filtering network diagnostic statistics |
| US10218806B2 (en) | 2008-04-04 | 2019-02-26 | Level 3 Communications, Llc | Handling long-tail content in a content delivery network (CDN) |
| US10924573B2 (en) | 2008-04-04 | 2021-02-16 | Level 3 Communications, Llc | Handling long-tail content in a content delivery network (CDN) |
| US9762692B2 (en) | 2008-04-04 | 2017-09-12 | Level 3 Communications, Llc | Handling long-tail content in a content delivery network (CDN) |
| US8930538B2 (en) | 2008-04-04 | 2015-01-06 | Level 3 Communications, Llc | Handling long-tail content in a content delivery network (CDN) |
| US20100332595A1 (en)* | 2008-04-04 | 2010-12-30 | David Fullagar | Handling long-tail content in a content delivery network (cdn) |
| US7954010B2 (en)* | 2008-12-12 | 2011-05-31 | At&T Intellectual Property I, L.P. | Methods and apparatus to detect an error condition in a communication network |
| US20100153787A1 (en)* | 2008-12-12 | 2010-06-17 | Beattie James Gordon Jr | Methods and apparatus to detect an error condition in a communication network |
| US8751875B2 (en)* | 2009-04-17 | 2014-06-10 | Siemens Aktiengesellschaft | Method for checking suitability of a data processing device for performing failsafe automation processes |
| US20100268356A1 (en)* | 2009-04-17 | 2010-10-21 | Siemens Ag | Method for Checking Suitability of a Data Processing Device for Performing Failsafe Automation Processes |
| US10083109B2 (en)* | 2011-05-31 | 2018-09-25 | International Business Machines Corporation | Testing a browser-based application |
| US20120310625A1 (en)* | 2011-05-31 | 2012-12-06 | International Business Machines Corporation | Method for testing a browser-based application |
| US9582404B2 (en)* | 2011-05-31 | 2017-02-28 | International Business Machines Corporation | Method for testing a browser-based application |
| US9235568B2 (en)* | 2011-05-31 | 2016-01-12 | International Business Machines Corporation | Method for testing a browser-based application |
| US20130290403A1 (en)* | 2011-05-31 | 2013-10-31 | International Business Machines Corporation | System for testing a browser-based application |
| US9201872B2 (en)* | 2011-05-31 | 2015-12-01 | International Business Machines Corporation | System for testing a browser-based application |
| US20160034376A1 (en)* | 2011-05-31 | 2016-02-04 | International Business Machines Corporation | Method for testing a browser-based application |
| US20160034377A1 (en)* | 2011-05-31 | 2016-02-04 | International Business Machines Corporation | System for testing a browser-based application |
| US9582405B2 (en)* | 2011-05-31 | 2017-02-28 | International Business Machines Corporation | System for testing a browser-based application |
| US20170116107A1 (en)* | 2011-05-31 | 2017-04-27 | International Business Machines Corporation | Testing a browser-based application |
| US9055124B1 (en)* | 2012-06-19 | 2015-06-09 | Amazon Technologies, Inc. | Enhanced caching of network content |
| US9953052B1 (en) | 2012-06-19 | 2018-04-24 | Amazon Technologies, Inc. | Caching of updated network content portions |
| US10909104B2 (en) | 2012-06-19 | 2021-02-02 | Amazon Technologies, Inc. | Caching of updated network content portions |
| US20140164537A1 (en)* | 2012-12-07 | 2014-06-12 | International Business Machines Corporation | Expert availability identification |
| US9825888B2 (en)* | 2012-12-07 | 2017-11-21 | International Business Machines Corporation | Expert availability identification |
| US10404561B2 (en) | 2015-06-12 | 2019-09-03 | Level 3 Communications, Llc | Network operational flaw detection using metrics |
| US10805195B2 (en) | 2015-06-12 | 2020-10-13 | Level 3 Communications, Llc | Network operational flaw detection using metrics |
| US9917753B2 (en) | 2015-06-12 | 2018-03-13 | Level 3 Communications, Llc | Network operational flaw detection using metrics |
| WO2016200731A1 (en)* | 2015-06-12 | 2016-12-15 | Level 3 Communications, Llc | Network operational flaw detection using metrics |
Also Published As
| Publication number | Publication date |
|---|---|
| WO2003009162A1 (en) | 2003-01-30 |
| US20030018450A1 (en) | 2003-01-23 |
| US7069177B2 (en) | 2006-06-27 |
| US20040138858A1 (en) | 2004-07-15 |
Similar Documents
| Publication | Publication Date | Title |
|---|---|---|
| US6708137B2 (en) | System and method for providing composite variance analysis for network operation | |
| US6108800A (en) | Method and apparatus for analyzing the performance of an information system | |
| US6738933B2 (en) | Root cause analysis of server system performance degradations | |
| US7197559B2 (en) | Transaction breakdown feature to facilitate analysis of end user performance of a server system | |
| US7277938B2 (en) | Method and system for managing performance of data transfers for a data access system | |
| US20020198985A1 (en) | Post-deployment monitoring and analysis of server performance | |
| US7568023B2 (en) | Method, system, and data structure for monitoring transaction performance in a managed computer network environment | |
| US6704732B1 (en) | Website usage monitoring | |
| US6505248B1 (en) | Method and system for monitoring and dynamically reporting a status of a remote server | |
| US7953847B2 (en) | Monitoring and management of distributing information systems | |
| US20080177874A1 (en) | Method and System for Visualizing Network Performance Characteristics | |
| US7051244B2 (en) | Method and apparatus for managing incident reports | |
| US7685270B1 (en) | Method and apparatus for measuring latency in web services | |
| US7577701B1 (en) | System and method for continuous monitoring and measurement of performance of computers on network | |
| US8706726B2 (en) | Method and system for monitoring and analyzing tickets | |
| EP0994602A2 (en) | Computer system and network performance monitoring | |
| US20080294946A1 (en) | System and Method for Problem Determination Using Dependency Graphs and Run-Time Behavior Models | |
| US20050097207A1 (en) | System and method of predicting future behavior of a battery of end-to-end probes to anticipate and prevent computer network performance degradation | |
| US20060026467A1 (en) | Method and apparatus for automatically discovering of application errors as a predictive metric for the functional health of enterprise applications | |
| US20050097517A1 (en) | Method and system for adjusting the relative value of system configuration recommendations | |
| WO2006014585A2 (en) | Systems and methods for monitoring and evaluating a connectivity device | |
| WO2003010685A1 (en) | Traffic flow analysis method | |
| US20050198279A1 (en) | Using trend data to address computer faults | |
| CN113676509A (en) | Method and system for active detection of HTTP interface health status | |
| US9645877B2 (en) | Monitoring apparatus, monitoring method, and recording medium |
Legal Events
| Date | Code | Title | Description |
|---|---|---|---|
| AS | Assignment | Owner name:GENERAL ELECTRIC CAPITAL CORPORATION, AS AGENT, CO Free format text:SECURITY INTEREST;ASSIGNOR:EXODUS COMMUNICATIONS, INC.;REEL/FRAME:012318/0778 Effective date:20011114 | |
| AS | Assignment | Owner name:CABLE & WIRELESS INTERNET SERVICES, INC., CALIFORN Free format text:ASSIGNMENT OF ASSIGNORS INTEREST;ASSIGNOR:CARLEY, STEPHEN;REEL/FRAME:012977/0758 Effective date:20020604 | |
| STCF | Information on status: patent grant | Free format text:PATENTED CASE | |
| AS | Assignment | Owner name:SAVVIS ASSET HOLDINGS, INC., MISSOURI Free format text:ASSIGNMENT OF ASSIGNORS INTEREST;ASSIGNOR:CABLE & WIRELESS INTERNET SERVICES, INC.;REEL/FRAME:015788/0435 Effective date:20040213 Owner name:SAVVIS, INC., MISSOURI Free format text:CHANGE OF NAME;ASSIGNOR:SAVVIS ASSET HODLING, INC.;REEL/FRAME:016386/0994 Effective date:20040308 | |
| AS | Assignment | Owner name:SAVVIS COMMUNCIATIONS CORPORATION,MISSOURI Free format text:MERGER;ASSIGNOR:SAVVIS, INC.;REEL/FRAME:016004/0209 Effective date:20050330 Owner name:SAVVIS COMMUNCIATIONS CORPORATION, MISSOURI Free format text:MERGER;ASSIGNOR:SAVVIS, INC.;REEL/FRAME:016004/0209 Effective date:20050330 | |
| AS | Assignment | Owner name:WELLS FARGO FOOTHILL, INC., AS ADMINISTRATIVE AGEN Free format text:SECURITY INTEREST;ASSIGNOR:SAVVIS COMMUNICATIONS CORPORATION;REEL/FRAME:016353/0633 Effective date:20050610 | |
| FEPP | Fee payment procedure | Free format text:PAYOR NUMBER ASSIGNED (ORIGINAL EVENT CODE: ASPN); ENTITY STATUS OF PATENT OWNER: LARGE ENTITY | |
| FPAY | Fee payment | Year of fee payment:4 | |
| AS | Assignment | Owner name:WELLS FARGO FOOTHILL, LLC, CALIFORNIA Free format text:AGREEMENT REGARDING AGENCY RESIGNATION, APPOINTMENT AND ACCEPTANCE;ASSIGNOR:WELLS FARGO FOOTHILL, INC.;REEL/FRAME:021936/0321 Effective date:20081208 Owner name:WELLS FARGO FOOTHILL, LLC,CALIFORNIA Free format text:AGREEMENT REGARDING AGENCY RESIGNATION, APPOINTMENT AND ACCEPTANCE;ASSIGNOR:WELLS FARGO FOOTHILL, INC.;REEL/FRAME:021936/0321 Effective date:20081208 | |
| AS | Assignment | Owner name:WELLS FARGO CAPITAL FINANCE, LLC,CALIFORNIA Free format text:CHANGE OF NAME;ASSIGNOR:WELLS FARGO FOOTHILL, LLC;REEL/FRAME:023985/0837 Effective date:20100115 Owner name:WELLS FARGO CAPITAL FINANCE, LLC, CALIFORNIA Free format text:CHANGE OF NAME;ASSIGNOR:WELLS FARGO FOOTHILL, LLC;REEL/FRAME:023985/0837 Effective date:20100115 | |
| AS | Assignment | Owner name:BANK OF AMERICA, N.A., AS ADMINISTRATIVE AGENT, TE Free format text:SECURITY AGREEMENT;ASSIGNORS:SAVVIS COMMUNICATIONS CORPORATION, A MISSOURI CORPORATION;SAVVIS, INC., A DELAWARE CORPORATION;REEL/FRAME:024794/0088 Effective date:20100804 Owner name:SAVVIS COMMUNICATIONS CORPORATION, A MISSOURI CORP Free format text:PATENT RELEASE;ASSIGNOR:WELLS FARGO CAPITAL FINANCE, LLC, AS AGENT, A DELAWARE LIMITED LIABILITY COMPANY;REEL/FRAME:024785/0942 Effective date:20100804 | |
| AS | Assignment | Owner name:SAVVIS COMMUNICATIONS CORPORATION, MISSOURI Free format text:RELEASE BY SECURED PARTY;ASSIGNOR:BANK OF AMERICA, N.A., AS ADMINISTRATIVE AGENT;REEL/FRAME:026601/0689 Effective date:20110715 Owner name:SAVVIS, INC., MISSOURI Free format text:RELEASE BY SECURED PARTY;ASSIGNOR:BANK OF AMERICA, N.A., AS ADMINISTRATIVE AGENT;REEL/FRAME:026601/0689 Effective date:20110715 | |
| REMI | Maintenance fee reminder mailed | ||
| FPAY | Fee payment | Year of fee payment:8 | |
| SULP | Surcharge for late payment | Year of fee payment:7 | |
| FEPP | Fee payment procedure | Free format text:PAYOR NUMBER ASSIGNED (ORIGINAL EVENT CODE: ASPN); ENTITY STATUS OF PATENT OWNER: LARGE ENTITY Free format text:PAYER NUMBER DE-ASSIGNED (ORIGINAL EVENT CODE: RMPN); ENTITY STATUS OF PATENT OWNER: LARGE ENTITY | |
| FPAY | Fee payment | Year of fee payment:12 | |
| AS | Assignment | Owner name:SAVVIS COMMUNICATIONS, LLC, MISSOURI Free format text:CHANGE OF NAME;ASSIGNOR:SAVVIS COMMUNICATIONS CORPORATION;REEL/FRAME:042177/0819 Effective date:20161212 Owner name:COLORADO WSC, LLC, LOUISIANA Free format text:ASSIGNMENT OF ASSIGNORS INTEREST;ASSIGNORS:SAVVIS COMMUNICATIONS, LLC;SAVVIS INC.;REEL/FRAME:041887/0106 Effective date:20170331 |