US6704016B1 - Method and apparatus for the graphical presentation of selected data - Google Patents
Method and apparatus for the graphical presentation of selected dataDownload PDFInfo
- Publication number
- US6704016B1 US6704016B1US09/566,828US56682800AUS6704016B1US 6704016 B1US6704016 B1US 6704016B1US 56682800 AUS56682800 AUS 56682800AUS 6704016 B1US6704016 B1US 6704016B1
- Authority
- US
- United States
- Prior art keywords
- new
- data
- values
- data values
- scaling factor
- Prior art date
- Legal status (The legal status is an assumption and is not a legal conclusion. Google has not performed a legal analysis and makes no representation as to the accuracy of the status listed.)
- Expired - Lifetime
Links
Images


Classifications
- G—PHYSICS
- G06—COMPUTING OR CALCULATING; COUNTING
- G06T—IMAGE DATA PROCESSING OR GENERATION, IN GENERAL
- G06T11/00—2D [Two Dimensional] image generation
- G06T11/20—Drawing from basic elements, e.g. lines or circles
- G06T11/206—Drawing of charts or graphs
- G—PHYSICS
- G06—COMPUTING OR CALCULATING; COUNTING
- G06F—ELECTRIC DIGITAL DATA PROCESSING
- G06F3/00—Input arrangements for transferring data to be processed into a form capable of being handled by the computer; Output arrangements for transferring data from processing unit to output unit, e.g. interface arrangements
- G06F3/01—Input arrangements or combined input and output arrangements for interaction between user and computer
- G06F3/048—Interaction techniques based on graphical user interfaces [GUI]
- G06F3/0484—Interaction techniques based on graphical user interfaces [GUI] for the control of specific functions or operations, e.g. selecting or manipulating an object, an image or a displayed text element, setting a parameter value or selecting a range
- G06F3/0485—Scrolling or panning
Definitions
- the present inventionrelates to an apparatus and method for the presentation of data in graphical form and more particularly to the scaling of graphical representations of selected data from a series of data.
- a common data analysis taskis to graphically present a series of numerical data associated with a particular concept.
- the conceptmay or may not be directly related to a physical object.
- the datamay be displayed on a computer display screen (or alternatively printed) in the form of a “bar chart” where each bar represents data associated with an object e.g. a physical device, and the length of each “bar” represents the numerical value for the data.
- a numerical data seriesrepresenting the concept of the quantity of data packets sent and received by devices on the network may be displayed in the bar chart, where each bar represents a particular network device and the length of each bar represents the quantity of data packets sent and received by the device.
- the data for the group of conceptsmight conveniently be displayed in the same bar chart.
- a stacked bar chartdisplays a plurality of these stacked bars with each stacked bar representing data relating to an object such as a physical device.
- the stacked barsare presented in the bar chart in a particular order. For instance, the bars may be ordered by the sum of the data values for all the data groups from largest to smallest, i.e. ordered by the length of the stacked bars from longest to shortest.
- stacked bar chartsare in network management in which numerical data relating to a group of concepts, such as the quantity of data packets using different protocols sent and received from devices on the network, may be conveniently displayed together in a single stacked bar chart.
- each barrelates to a particular network device
- each segment of a barrepresents the quantity of data sent and received by the device using a particular network protocol
- the sum of the segmentsrepresents the total quantity of data packets sent and received by the device.
- FIG. 1shows an example of such a stacked bar chart used in network management as described above.
- the bar chartis displayed in a “window” on a computer display screen.
- the stacked barsare displayed as an ordered series of horizontally extending bars with the top bar representing the device having the largest number of associated data packets and the bottom bar representing the device having the smallest number of data packets associated with it.
- every bar in the chartis represented using the same, linear scale along its length, i.e. across the width of the window.
- the length of the topmost baris scaled to occupy the full width of the window, leaving appropriate margins, and the remaining bars are represented according to the same scaling factor. Since the scale is linear, segments of the bars having the same length represent the same quantitative data value.
- a problem with presenting bar charts as an ordered series of bars having the same linear scaleis that if there is a large number of data values represented in the chart, and a large variation in numerical data values in the data series, the bars relating to the smaller numerical values may be rendered too small to distinguish each of the stacked segments on the display.
- FIG. 2shows the numerical data values represented in the linearly scaled bar chart of FIG. 1 presented in a logarithmically scaled bar chart.
- logarithmic scalinggives increased space for representing data at the low end of the scale (in FIG. 2 the left hand side). This means that data at the low end of the scale is presented in greater detail than data at the high end of the scale.
- the smaller bars, at the bottom of the chart of FIG. 2occupy more space than they occupied using linear scaling as in FIG. 1 . Consequently, the segments of these smaller stacked bars can be visually identified since they are presented in more detail, thus overcoming the aforementioned problems associated with linear scaling.
- logarithmic scalinghas a number of disadvantages. Firstly, the sizes of the bars and individual segments are no longer linearly related. In particular, because the scale is logarithmic, two adjacent segments of the same length in the same bar do not equate to the same numerical quantity (e.g. number of data packets) and so the viewer has more difficulty in comparing relative values associated with segments in the same bar. In addition, for large bars, segments representing relatively large data quantities at the high end of the scale are shown closer together and are therefore no longer visibly distinguished. This is because large data values at the high end of the logarithmic scale are represented by short segments. Finally, since in most uses, large data values are considered to be more significant than smaller values, associating large bars with relatively small data quantities may be confusing to the viewer.
- the present inventionseeks to overcome the disadvantages of these prior art methods.
- the present inventionprovides a method for graphically presenting a selected set of data values of a series of data values in a predetermined presentation area, the method comprising: determining the largest data value within the selected set of data values; determining a scaling factor for scaling the determined largest data value to a lateral dimension of the presentation area; applying the determined scaling factor to all the data values in the set of data values to provide a scaled set of data values, and graphically presenting the scaled set of data values within the presentation area.
- the present inventionprovides a method by which the bars can be dynamically scaled as a result of selection of a set of data values by the user so as to make the best and most informative use of the display space available for the chart.
- the present inventionprovides a computer program for carrying out the method in accordance with the first aspect of the present invention.
- FIG. 1shows a top portion of a stacked bar chart employing linear scaling in accordance with a prior art method
- FIG. 2shows the data of the top portion of the stacked bar chart of FIG. 1 represented in a stacked bar chart employing logarithmic scaling in accordance with a prior art method
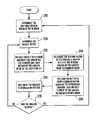
- FIG. 3is a flow diagram of a sequence of program steps for producing a bar chart representing data on a computer display screen in accordance with a prior art method
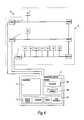
- FIG. 4is a block diagram showing a network management system in accordance with a preferred embodiment of the present invention.
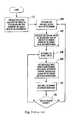
- FIG. 5is a flow diagram of a sequence of program steps for producing a bar chart representing data on a computer display screen in accordance with a preferred embodiment of the present invention
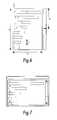
- FIG. 6is a schematic illustration of the parameters used in the graphical presentation of data in accordance with the present invention.
- FIG. 7shows the data of a middle portion of the stacked bar chart of FIG. 1 represented in a stacked bar chart produced in accordance with the method of the preferred embodiment of the present invention.
- FIG. 4illustrates a network management system 1 comprising a computer network 5 having a network management station 7 .
- the network management station 7is typically a conventional computer having a processor 11 , memory 12 including a disk drive, and a database 14 for network management data.
- the network management station 7includes network management software which retrieves data from inter alia network traffic monitors or probes 3 , and stores the retrieved data in the database 14 .
- Probes 3are strategically located on the network 5 to monitor data traffic on the network and collect management data relating to the monitored data traffic, such as RMON data, as is well known in the art.
- the retrieval and storage of datais achieved using conventional methods, such as those disclosed in UK Patent Application GB-A-2 337 903 which is herein incorporated by reference.
- the network management station 7further includes user interfaces 16 including a display screen 9 , a keyboard and a mouse.
- FIG. 1shows a stacked bar chart 31 having a linear scale displayed in a window 33 of a display screen 9 of network management station 7 produced in accordance with a prior art method.
- the window 33has a scroll bar 35 to enable the user to scroll up and down the bar chart to reveal selected areas of the bar chart 31 .
- FIG. 1shows the top five bars a to e representing the five largest numerical values of the bar chart 31 .
- the largest bar arepresents the largest numerical value (which may be the sum of numerical sub values) in the data series represented in the bar chart.
- the bar arepresents data for the monitored network device having the largest data volume associated with it, and the numerical values and sub values represent the quantity of data associated with traffic involving the device.
- the bar ais dimensioned to occupy the full width of the window, with margins either side. This ensures that the level of detail shown in the bar is maximised so that the segments of the bar can be readily distinguished.
- FIG. 3shows the prior art method steps implemented in a computer program used to produce the bar chart of FIG. 1 .
- the programstarts upon receiving a group of data series having related numerical data values for data traffic associated with a plurality of network devices, which data needs to be presented in the form of a stacked bar chart.
- Each tuplehas a group of elements (or a group of sub-values) having numerical data values associated with corresponding groups of concepts.
- the group of conceptsare different network protocols, and the tuple elements represent the data traffic associated with a network device using a particular network protocol.
- the programdetermines the sum of the tuple elements for each tuple and determines which tuple has the largest sum. This tuple will then be represented by the largest bar in the bar chart, and the scaling factor for the data values and sub values is determined accordingly.
- the programdetermines the available width of the display area or “window” 33 of the display screen 9 .
- the programcalculates the scaling factor to be used to represent the bars in the bar chart.
- the scaling factoris calculated to be the width determined in step 120 divided by the value of the largest tuple as determined in step 110 .
- the programdetermines which of the tuples will be displayed in the window 33 of the display screen 9 . This is achieved using the mathematical formulae and processes described below.
- the programgenerates a graphical bar for each of the tuples, in each case scaling the elements of the tuple by multiplying the element or data sub value by the scaling factor determined in step 130 , and displays the thus generated bars on a bar chart in the window 33 .
- the programthen waits at step 160 , until there is a change in the selected tuples for display in the window by scrolling the scroll bar 35 , or a change in the size of the window 33 .
- the programdetermines if the change included a change in the size of the window 33 . If the size of the window has changed, the program returns to step 120 to redetermine the width of the window before determining the new scaling factor. If the size of the window 33 has not changed, the program returns to step 140 .
- FIG. 5illustrates a method in accordance with a preferred embodiment of the present invention.
- the methodis implemented in the form of a computer program run on a network management station 7 .
- the computer program steps as illustrated by FIG. 5dynamically adjust the scaling factor applied to represent the data values according to the largest tuple visible within the display window 33 . More specifically, each time the window 33 is scrolled, a new set of tuple values are effectively selected for display within the window 33 , and the program performs a calculation to determine the appropriate scaling factor for the tuples displayed in the window.
- the program of FIG. 5starts upon receiving the tuples having a plurality of tuple elements, which data needs to be presented in the form of a stacked bar chart.
- the programdetermines the available width of the display area or “window” 33 of the display screen 9 . This is determined using the formula:
- wis the width of the window and o is the width of margin on both the left hand side and the right hand side (see FIG. 6 ).
- step 220the program determines which of the tuples will be displayed in the window 33 of the display screen 9 . This is achieved using the same mathematical process as step 140 of the program of FIG. 3 and described in more detail below.
- the programdetermines the sum of the tuple elements for each tuple and determines which tuple has the largest sum.
- the tuple determined using this formulawill then be represented by the largest bar of the bar chart in the window 33 .
- the programdetermines the scaling factor based upon the tuple having the largest sum as determined in step 230 .
- This scaling factoris the width determined in step 210 divided by the sum of the tuple elements of the largest tuple determined in step 230 .
- the programcalculates the length of each element for each tuple, for representation in the graphical bar, by multiplying the element by the scaling factor.
- the programthus generates a graphical bar for each of the tuples and displays the bars on a bar chart in the window 33 .
- the programwaits until a change to the window is necessary, for instance the window 33 may be scrolled or resized.
- the programdetermines if the change included a change in the size of the window 33 . If the size of the window has changes, the program returns to step 210 to redetermine the width of the window before determining the new scaling factor. If the size of the window has not changed, the program returns to step 220 . The program then continues by determining the new largest tuple, and therefore the new scaling factor for use in displaying the bar chart.
- the steps employed in accordance with the preferred embodiment of the present inventionhave the advantage of scaling the bar chart dynamically according to the data selected for display in the window 33 for instance by scrolling the scrollbar.
- the determination of which of the tuples i will be displayed in the window 33 of the display screen 3 in step 140 of the program of FIG. 3 or step 220 of the program of FIG. 5is determined using the position of the scroll bar 35 .
- This calculationinvolves the following parameters which are shown in FIG. 6 .
- his the height of the window 33
- pis the position of the scroll bar as an offset from the top of the window
- nis the number of tuples or data values to be displayed in the window
- sis the height of each stacked bar, including associated blank area above and below the bar.
- the start of the visible area of the vertically scrollable window, as shown in FIG. 6,is calculated as: ( p h ⁇ ( ( n ⁇ s ) - h ) )
- the selected range of tuples iare those numbered between and including the values for i calculated using the above formulae.
- FIG. 7shows a portion of the data represented in the stacked bar chart of FIG. 1 represented in a stacked bar chart scaled in accordance with the present invention.
- FIG. 7shows a window of a display screen illustrating a stacked bar chart.
- the scroll bar of the windowis scrolled to select bars representing the data of bars c to g of the bar chart of FIG. 1 (of which the data for bars f and g is not shown in FIG. 1 ).
- the selected barsare scaled using a scaling factor so that the bar representing the largest data value, bar c, occupies the full width of the window, as described above.
- bar chartshave been illustrated with individual bars extending horizontally, and the scrollbar thus extending vertically, it will be appreciated that the bar chart can be presented in other orientations. For example, the bars in the bar chart could extend vertically.
- the method of the present inventionhas been described as implemented in the form of a computer program, but may equally be carried out by other means, for example in hardware.
- the programmay be carried on a computer readable medium
- Such computer readable mediummay be a disk which can be loaded in the disk drive of a network management station computer, or may be the computer system carrying a website which permits downloading of the program over the Internet by a network management station.
- the present inventionmay be embodied in the form of a carrier wave with the computer program carried thereon
Landscapes
- Engineering & Computer Science (AREA)
- Theoretical Computer Science (AREA)
- General Engineering & Computer Science (AREA)
- Physics & Mathematics (AREA)
- General Physics & Mathematics (AREA)
- Human Computer Interaction (AREA)
- User Interface Of Digital Computer (AREA)
Abstract
Description


Claims (24)


Priority Applications (2)
| Application Number | Priority Date | Filing Date | Title |
|---|---|---|---|
| US09/566,828US6704016B1 (en) | 2000-05-08 | 2000-05-08 | Method and apparatus for the graphical presentation of selected data |
| GB0011099AGB2362232B (en) | 2000-05-08 | 2000-05-08 | Method and apparatus for the graphical presentation of selected data |
Applications Claiming Priority (2)
| Application Number | Priority Date | Filing Date | Title |
|---|---|---|---|
| US09/566,828US6704016B1 (en) | 2000-05-08 | 2000-05-08 | Method and apparatus for the graphical presentation of selected data |
| GB0011099AGB2362232B (en) | 2000-05-08 | 2000-05-08 | Method and apparatus for the graphical presentation of selected data |
Publications (1)
| Publication Number | Publication Date |
|---|---|
| US6704016B1true US6704016B1 (en) | 2004-03-09 |
Family
ID=32472125
Family Applications (1)
| Application Number | Title | Priority Date | Filing Date |
|---|---|---|---|
| US09/566,828Expired - LifetimeUS6704016B1 (en) | 2000-05-08 | 2000-05-08 | Method and apparatus for the graphical presentation of selected data |
Country Status (2)
| Country | Link |
|---|---|
| US (1) | US6704016B1 (en) |
| GB (1) | GB2362232B (en) |
Cited By (109)
| Publication number | Priority date | Publication date | Assignee | Title |
|---|---|---|---|---|
| US20040098229A1 (en)* | 2002-06-28 | 2004-05-20 | Brett Error | Efficient click-stream data collection |
| US20040196286A1 (en)* | 2003-04-01 | 2004-10-07 | Microsoft Corporation | Progressive scale graph |
| US20040254942A1 (en)* | 2003-03-04 | 2004-12-16 | Error Brett M. | Associating website clicks with links on a web page |
| US20050114510A1 (en)* | 2003-03-04 | 2005-05-26 | Error Brett M. | Assigning value to elements contributing to business success |
| US20050216844A1 (en)* | 2004-03-03 | 2005-09-29 | Error Brett M | Delayed transmission of website usage data |
| US7031880B1 (en)* | 2004-05-07 | 2006-04-18 | Johnson Controls Technology Company | Method and apparatus for assessing performance of an environmental control system |
| US20060123340A1 (en)* | 2004-03-03 | 2006-06-08 | Bailey Michael P | WEB usage overlays for third-party WEB plug-in content |
| US20060274763A1 (en)* | 2005-06-03 | 2006-12-07 | Error Christopher R | Variable sampling rates for website visitation analysis |
| US20060277198A1 (en)* | 2005-06-03 | 2006-12-07 | Error Brett M | One-click segmentation definition |
| US20060277197A1 (en)* | 2005-06-03 | 2006-12-07 | Bailey Michael P | Data format for website traffic statistics |
| US20060277211A1 (en)* | 2005-06-03 | 2006-12-07 | Error Brett M | Incrementally adding segmentation criteria to a data set |
| US20060277585A1 (en)* | 2005-06-06 | 2006-12-07 | Error Christopher R | Creation of segmentation definitions |
| US20060277212A1 (en)* | 2005-06-03 | 2006-12-07 | Error Brett M | User interface providing summary information or a status pane in a web analytics tool |
| US7149975B1 (en)* | 2001-12-26 | 2006-12-12 | Nortel Networks Limited | Optical network administration graphical user interface |
| US20070100992A1 (en)* | 2005-10-28 | 2007-05-03 | Wong Catherine J | Comparison of Website Visitation Data Sets |
| US20070143451A1 (en)* | 2005-12-20 | 2007-06-21 | Johnson Controls Technology Company | System and method for configuring a control system |
| USD552622S1 (en)* | 2006-03-29 | 2007-10-09 | Samsung Electronics Co., Ltd. | Generated image for display on a portable telephone |
| USD553633S1 (en)* | 2006-03-29 | 2007-10-23 | Samsung Electronics Co., Ltd. | Generated image for display on a portable telephone |
| US20080195930A1 (en)* | 2007-02-08 | 2008-08-14 | Microsoft Corporation | User Interface Pane for an Interactive Chart |
| US20090002373A1 (en)* | 2007-06-29 | 2009-01-01 | Business Objects, S.A. | Apparatus and method for guided graphical navigation through multidimensional databases |
| USD593112S1 (en)* | 2008-10-24 | 2009-05-26 | Microsoft Corporation | User interface for a display screen |
| USD593109S1 (en)* | 2008-10-24 | 2009-05-26 | Microsoft Corporation | User interface for a display screen |
| US20090282325A1 (en)* | 2008-05-07 | 2009-11-12 | Microsoft Corporation | Sparklines in the grid |
| USD604314S1 (en)* | 2008-06-27 | 2009-11-17 | Microsoft Corporation | User interface for a portion of a display screen |
| USD604318S1 (en)* | 2008-06-27 | 2009-11-17 | Microsoft Corporation | Transitional image for a portion of a display screen |
| USD604313S1 (en)* | 2008-06-27 | 2009-11-17 | Microsoft Corporation | User interface for a portion of a display screen |
| USD604316S1 (en)* | 2008-06-27 | 2009-11-17 | Microsoft Corporation | User interface for a portion of a display screen |
| US7644375B1 (en) | 2006-09-18 | 2010-01-05 | Adobe Systems Incorporated | Dynamic path flow reports |
| US7714876B1 (en)* | 2005-03-10 | 2010-05-11 | Hewlett-Packard Development Company, L.P. | Method and system for creating visualizations |
| US8738609B2 (en) | 2002-06-28 | 2014-05-27 | Adobe Systems Incorporated | Capturing and presenting site visitation path data |
| US8793236B2 (en) | 2012-11-01 | 2014-07-29 | Adobe Systems Incorporated | Method and apparatus using historical influence for success attribution in network site activity |
| US20150193094A1 (en)* | 2014-01-08 | 2015-07-09 | Sap Ag | Space Constrained Ordered List Previews |
| US20160253828A1 (en)* | 2015-02-27 | 2016-09-01 | Fujitsu Limited | Display control system, and graph display method |
| US9449409B2 (en)* | 2014-04-11 | 2016-09-20 | Fitbit, Inc. | Graphical indicators in analog clock format |
| US10089714B2 (en) | 2014-04-11 | 2018-10-02 | Fitbit, Inc. | Personalized scaling of graphical indicators |
| US10347017B2 (en)* | 2016-02-12 | 2019-07-09 | Microsoft Technology Licensing, Llc | Interactive controls that are collapsible and expandable and sequences for chart visualization optimizations |
| US10748312B2 (en) | 2016-02-12 | 2020-08-18 | Microsoft Technology Licensing, Llc | Tagging utilizations for selectively preserving chart elements during visualization optimizations |
| US20210134414A1 (en)* | 2019-11-01 | 2021-05-06 | Seattle Children's Hospital D/B/A Seattle Children's Research Institute | Generation of combined information display interfaces to support clinical patient prioritization |
| US11164198B2 (en)* | 2017-03-31 | 2021-11-02 | ASK Chemicals LLC | Graphical user interface for visualizing market share analysis |
| US20220138183A1 (en) | 2017-09-27 | 2022-05-05 | Johnson Controls Tyco IP Holdings LLP | Web services platform with integration and interface of smart entities with enterprise applications |
| US20220376944A1 (en) | 2019-12-31 | 2022-11-24 | Johnson Controls Tyco IP Holdings LLP | Building data platform with graph based capabilities |
| US11699903B2 (en) | 2017-06-07 | 2023-07-11 | Johnson Controls Tyco IP Holdings LLP | Building energy optimization system with economic load demand response (ELDR) optimization and ELDR user interfaces |
| US11704311B2 (en) | 2021-11-24 | 2023-07-18 | Johnson Controls Tyco IP Holdings LLP | Building data platform with a distributed digital twin |
| US11709965B2 (en) | 2017-09-27 | 2023-07-25 | Johnson Controls Technology Company | Building system with smart entity personal identifying information (PII) masking |
| US11714930B2 (en) | 2021-11-29 | 2023-08-01 | Johnson Controls Tyco IP Holdings LLP | Building data platform with digital twin based inferences and predictions for a graphical building model |
| US11727738B2 (en) | 2017-11-22 | 2023-08-15 | Johnson Controls Tyco IP Holdings LLP | Building campus with integrated smart environment |
| US11726632B2 (en) | 2017-07-27 | 2023-08-15 | Johnson Controls Technology Company | Building management system with global rule library and crowdsourcing framework |
| US11735021B2 (en) | 2017-09-27 | 2023-08-22 | Johnson Controls Tyco IP Holdings LLP | Building risk analysis system with risk decay |
| US11733663B2 (en) | 2017-07-21 | 2023-08-22 | Johnson Controls Tyco IP Holdings LLP | Building management system with dynamic work order generation with adaptive diagnostic task details |
| US11741165B2 (en) | 2020-09-30 | 2023-08-29 | Johnson Controls Tyco IP Holdings LLP | Building management system with semantic model integration |
| US11755604B2 (en) | 2017-02-10 | 2023-09-12 | Johnson Controls Technology Company | Building management system with declarative views of timeseries data |
| US11754982B2 (en) | 2012-08-27 | 2023-09-12 | Johnson Controls Tyco IP Holdings LLP | Syntax translation from first syntax to second syntax based on string analysis |
| US11762353B2 (en) | 2017-09-27 | 2023-09-19 | Johnson Controls Technology Company | Building system with a digital twin based on information technology (IT) data and operational technology (OT) data |
| US11762343B2 (en) | 2019-01-28 | 2023-09-19 | Johnson Controls Tyco IP Holdings LLP | Building management system with hybrid edge-cloud processing |
| US11762351B2 (en) | 2017-11-15 | 2023-09-19 | Johnson Controls Tyco IP Holdings LLP | Building management system with point virtualization for online meters |
| US11763266B2 (en) | 2019-01-18 | 2023-09-19 | Johnson Controls Tyco IP Holdings LLP | Smart parking lot system |
| US11764991B2 (en) | 2017-02-10 | 2023-09-19 | Johnson Controls Technology Company | Building management system with identity management |
| US11761653B2 (en) | 2017-05-10 | 2023-09-19 | Johnson Controls Tyco IP Holdings LLP | Building management system with a distributed blockchain database |
| US11762362B2 (en) | 2017-03-24 | 2023-09-19 | Johnson Controls Tyco IP Holdings LLP | Building management system with dynamic channel communication |
| US11762886B2 (en) | 2017-02-10 | 2023-09-19 | Johnson Controls Technology Company | Building system with entity graph commands |
| US11769066B2 (en) | 2021-11-17 | 2023-09-26 | Johnson Controls Tyco IP Holdings LLP | Building data platform with digital twin triggers and actions |
| US11768004B2 (en) | 2016-03-31 | 2023-09-26 | Johnson Controls Tyco IP Holdings LLP | HVAC device registration in a distributed building management system |
| US11770020B2 (en) | 2016-01-22 | 2023-09-26 | Johnson Controls Technology Company | Building system with timeseries synchronization |
| US11778030B2 (en) | 2017-02-10 | 2023-10-03 | Johnson Controls Technology Company | Building smart entity system with agent based communication and control |
| US11774930B2 (en) | 2017-02-10 | 2023-10-03 | Johnson Controls Technology Company | Building system with digital twin based agent processing |
| US11774922B2 (en) | 2017-06-15 | 2023-10-03 | Johnson Controls Technology Company | Building management system with artificial intelligence for unified agent based control of building subsystems |
| US11774920B2 (en) | 2016-05-04 | 2023-10-03 | Johnson Controls Technology Company | Building system with user presentation composition based on building context |
| US11782407B2 (en) | 2017-11-15 | 2023-10-10 | Johnson Controls Tyco IP Holdings LLP | Building management system with optimized processing of building system data |
| US11792039B2 (en) | 2017-02-10 | 2023-10-17 | Johnson Controls Technology Company | Building management system with space graphs including software components |
| US11796974B2 (en) | 2021-11-16 | 2023-10-24 | Johnson Controls Tyco IP Holdings LLP | Building data platform with schema extensibility for properties and tags of a digital twin |
| US11874635B2 (en) | 2015-10-21 | 2024-01-16 | Johnson Controls Technology Company | Building automation system with integrated building information model |
| US11874809B2 (en) | 2020-06-08 | 2024-01-16 | Johnson Controls Tyco IP Holdings LLP | Building system with naming schema encoding entity type and entity relationships |
| US11880677B2 (en) | 2020-04-06 | 2024-01-23 | Johnson Controls Tyco IP Holdings LLP | Building system with digital network twin |
| US11894944B2 (en) | 2019-12-31 | 2024-02-06 | Johnson Controls Tyco IP Holdings LLP | Building data platform with an enrichment loop |
| US11892180B2 (en) | 2017-01-06 | 2024-02-06 | Johnson Controls Tyco IP Holdings LLP | HVAC system with automated device pairing |
| US11900287B2 (en) | 2017-05-25 | 2024-02-13 | Johnson Controls Tyco IP Holdings LLP | Model predictive maintenance system with budgetary constraints |
| US11902375B2 (en) | 2020-10-30 | 2024-02-13 | Johnson Controls Tyco IP Holdings LLP | Systems and methods of configuring a building management system |
| US11899723B2 (en) | 2021-06-22 | 2024-02-13 | Johnson Controls Tyco IP Holdings LLP | Building data platform with context based twin function processing |
| US11921481B2 (en) | 2021-03-17 | 2024-03-05 | Johnson Controls Tyco IP Holdings LLP | Systems and methods for determining equipment energy waste |
| US11920810B2 (en) | 2017-07-17 | 2024-03-05 | Johnson Controls Technology Company | Systems and methods for agent based building simulation for optimal control |
| US11927925B2 (en) | 2018-11-19 | 2024-03-12 | Johnson Controls Tyco IP Holdings LLP | Building system with a time correlated reliability data stream |
| US11934966B2 (en) | 2021-11-17 | 2024-03-19 | Johnson Controls Tyco IP Holdings LLP | Building data platform with digital twin inferences |
| US11941238B2 (en) | 2018-10-30 | 2024-03-26 | Johnson Controls Technology Company | Systems and methods for entity visualization and management with an entity node editor |
| US11947785B2 (en) | 2016-01-22 | 2024-04-02 | Johnson Controls Technology Company | Building system with a building graph |
| US11954478B2 (en) | 2017-04-21 | 2024-04-09 | Tyco Fire & Security Gmbh | Building management system with cloud management of gateway configurations |
| US11954713B2 (en) | 2018-03-13 | 2024-04-09 | Johnson Controls Tyco IP Holdings LLP | Variable refrigerant flow system with electricity consumption apportionment |
| US11954154B2 (en) | 2020-09-30 | 2024-04-09 | Johnson Controls Tyco IP Holdings LLP | Building management system with semantic model integration |
| US12013823B2 (en) | 2022-09-08 | 2024-06-18 | Tyco Fire & Security Gmbh | Gateway system that maps points into a graph schema |
| US12013673B2 (en) | 2021-11-29 | 2024-06-18 | Tyco Fire & Security Gmbh | Building control system using reinforcement learning |
| US12021650B2 (en) | 2019-12-31 | 2024-06-25 | Tyco Fire & Security Gmbh | Building data platform with event subscriptions |
| US12019437B2 (en) | 2017-02-10 | 2024-06-25 | Johnson Controls Technology Company | Web services platform with cloud-based feedback control |
| US12055908B2 (en) | 2017-02-10 | 2024-08-06 | Johnson Controls Technology Company | Building management system with nested stream generation |
| US12061633B2 (en) | 2022-09-08 | 2024-08-13 | Tyco Fire & Security Gmbh | Building system that maps points into a graph schema |
| US12061453B2 (en) | 2020-12-18 | 2024-08-13 | Tyco Fire & Security Gmbh | Building management system performance index |
| US12100280B2 (en) | 2020-02-04 | 2024-09-24 | Tyco Fire & Security Gmbh | Systems and methods for software defined fire detection and risk assessment |
| US12099334B2 (en) | 2019-12-31 | 2024-09-24 | Tyco Fire & Security Gmbh | Systems and methods for presenting multiple BIM files in a single interface |
| US12184444B2 (en) | 2017-02-10 | 2024-12-31 | Johnson Controls Technology Company | Space graph based dynamic control for buildings |
| US12196437B2 (en) | 2016-01-22 | 2025-01-14 | Tyco Fire & Security Gmbh | Systems and methods for monitoring and controlling an energy plant |
| US12197299B2 (en) | 2019-12-20 | 2025-01-14 | Tyco Fire & Security Gmbh | Building system with ledger based software gateways |
| US12235617B2 (en) | 2021-02-08 | 2025-02-25 | Tyco Fire & Security Gmbh | Site command and control tool with dynamic model viewer |
| US12333657B2 (en) | 2021-12-01 | 2025-06-17 | Tyco Fire & Security Gmbh | Building data platform with augmented reality based digital twins |
| US12339825B2 (en) | 2017-09-27 | 2025-06-24 | Tyco Fire & Security Gmbh | Building risk analysis system with risk cards |
| US12346381B2 (en) | 2020-09-30 | 2025-07-01 | Tyco Fire & Security Gmbh | Building management system with semantic model integration |
| US12367443B2 (en) | 2019-01-14 | 2025-07-22 | Tyco Fire & Security Gmbh | System and method for showing key performance indicators |
| US12372955B2 (en) | 2022-05-05 | 2025-07-29 | Tyco Fire & Security Gmbh | Building data platform with digital twin functionality indicators |
| US12379718B2 (en) | 2017-05-25 | 2025-08-05 | Tyco Fire & Security Gmbh | Model predictive maintenance system for building equipment |
| US12399467B2 (en) | 2021-11-17 | 2025-08-26 | Tyco Fire & Security Gmbh | Building management systems and methods for tuning fault detection thresholds |
| US12412003B2 (en) | 2021-11-29 | 2025-09-09 | Tyco Fire & Security Gmbh | Building data platform with digital twin based predictive recommendation visualization |
| USRE50632E1 (en) | 2023-05-23 | 2025-10-14 | Tyco Fire & Security Gmbh | Building energy optimization system with battery powered vehicle cost optimization |
Families Citing this family (1)
| Publication number | Priority date | Publication date | Assignee | Title |
|---|---|---|---|---|
| US10726252B2 (en)* | 2017-05-17 | 2020-07-28 | Tab2Ex Llc | Method of digitizing and extracting meaning from graphic objects |
Citations (7)
| Publication number | Priority date | Publication date | Assignee | Title |
|---|---|---|---|---|
| US4847785A (en) | 1985-01-22 | 1989-07-11 | International Business Machines Corp. | Interactive display for trend or bar graph |
| US5485564A (en)* | 1992-05-08 | 1996-01-16 | Canon Kabushiki Kaisha | Method and apparatus for forming a graphical display of data and for omitting a range of data within the graph |
| US5636350A (en)* | 1993-08-24 | 1997-06-03 | Lucent Technologies Inc. | Using symbols whose appearance varies to show characteristics of a result of a query |
| US5917499A (en)* | 1996-04-05 | 1999-06-29 | Microsoft Corporation | Interactive graph display system |
| US6031547A (en) | 1997-11-10 | 2000-02-29 | Lam Research Corporation | Computer graphical status display |
| US6064401A (en)* | 1998-05-28 | 2000-05-16 | Ncr Corporation | User interface controls for adjusting the display of multi-dimensional graphical plots |
| US6429869B1 (en)* | 1998-05-14 | 2002-08-06 | Sharp Kabusshiki Kaisha | Method for displaying bar graph without totaling data and program storage medium thereof |
- 2000
- 2000-05-08GBGB0011099Apatent/GB2362232B/ennot_activeExpired - Fee Related
- 2000-05-08USUS09/566,828patent/US6704016B1/ennot_activeExpired - Lifetime
Patent Citations (7)
| Publication number | Priority date | Publication date | Assignee | Title |
|---|---|---|---|---|
| US4847785A (en) | 1985-01-22 | 1989-07-11 | International Business Machines Corp. | Interactive display for trend or bar graph |
| US5485564A (en)* | 1992-05-08 | 1996-01-16 | Canon Kabushiki Kaisha | Method and apparatus for forming a graphical display of data and for omitting a range of data within the graph |
| US5636350A (en)* | 1993-08-24 | 1997-06-03 | Lucent Technologies Inc. | Using symbols whose appearance varies to show characteristics of a result of a query |
| US5917499A (en)* | 1996-04-05 | 1999-06-29 | Microsoft Corporation | Interactive graph display system |
| US6031547A (en) | 1997-11-10 | 2000-02-29 | Lam Research Corporation | Computer graphical status display |
| US6429869B1 (en)* | 1998-05-14 | 2002-08-06 | Sharp Kabusshiki Kaisha | Method for displaying bar graph without totaling data and program storage medium thereof |
| US6064401A (en)* | 1998-05-28 | 2000-05-16 | Ncr Corporation | User interface controls for adjusting the display of multi-dimensional graphical plots |
Cited By (176)
| Publication number | Priority date | Publication date | Assignee | Title |
|---|---|---|---|---|
| US7149975B1 (en)* | 2001-12-26 | 2006-12-12 | Nortel Networks Limited | Optical network administration graphical user interface |
| US8738609B2 (en) | 2002-06-28 | 2014-05-27 | Adobe Systems Incorporated | Capturing and presenting site visitation path data |
| US20040098229A1 (en)* | 2002-06-28 | 2004-05-20 | Brett Error | Efficient click-stream data collection |
| US9529859B2 (en) | 2002-06-28 | 2016-12-27 | Adobe Systems Incorporated | Capturing and presenting site visitation path data |
| US20090006995A1 (en)* | 2003-03-04 | 2009-01-01 | Omniture, Inc. | Associating Website Clicks With Links On A Web Page |
| US20050114510A1 (en)* | 2003-03-04 | 2005-05-26 | Error Brett M. | Assigning value to elements contributing to business success |
| US7441195B2 (en) | 2003-03-04 | 2008-10-21 | Omniture, Inc. | Associating website clicks with links on a web page |
| US8196048B2 (en) | 2003-03-04 | 2012-06-05 | Adobe Systems Incorporated | Associating website clicks with links on a web page |
| US7603373B2 (en) | 2003-03-04 | 2009-10-13 | Omniture, Inc. | Assigning value to elements contributing to business success |
| US20040254942A1 (en)* | 2003-03-04 | 2004-12-16 | Error Brett M. | Associating website clicks with links on a web page |
| US20040196286A1 (en)* | 2003-04-01 | 2004-10-07 | Microsoft Corporation | Progressive scale graph |
| US10318598B2 (en) | 2003-06-27 | 2019-06-11 | Adobe Inc. | One-click segmentation definition |
| US7584435B2 (en) | 2004-03-03 | 2009-09-01 | Omniture, Inc. | Web usage overlays for third-party web plug-in content |
| US20060123340A1 (en)* | 2004-03-03 | 2006-06-08 | Bailey Michael P | WEB usage overlays for third-party WEB plug-in content |
| US20050216844A1 (en)* | 2004-03-03 | 2005-09-29 | Error Brett M | Delayed transmission of website usage data |
| US7031880B1 (en)* | 2004-05-07 | 2006-04-18 | Johnson Controls Technology Company | Method and apparatus for assessing performance of an environmental control system |
| US7714876B1 (en)* | 2005-03-10 | 2010-05-11 | Hewlett-Packard Development Company, L.P. | Method and system for creating visualizations |
| US20060277211A1 (en)* | 2005-06-03 | 2006-12-07 | Error Brett M | Incrementally adding segmentation criteria to a data set |
| US20060277197A1 (en)* | 2005-06-03 | 2006-12-07 | Bailey Michael P | Data format for website traffic statistics |
| US20060274763A1 (en)* | 2005-06-03 | 2006-12-07 | Error Christopher R | Variable sampling rates for website visitation analysis |
| US7941394B2 (en) | 2005-06-03 | 2011-05-10 | Adobe Systems Incorporated | User interface providing summary information or a status pane in a web analytics tool |
| US9171093B2 (en) | 2005-06-03 | 2015-10-27 | Adobe Systems Incorporated | User interface providing summary information or a status pane in a web analytics tool |
| US20060277212A1 (en)* | 2005-06-03 | 2006-12-07 | Error Brett M | User interface providing summary information or a status pane in a web analytics tool |
| US9081863B2 (en) | 2005-06-03 | 2015-07-14 | Adobe Systems Incorporated | One-click segmentation definition |
| US7991732B2 (en) | 2005-06-03 | 2011-08-02 | Adobe Systems Incorporated | Incrementally adding segmentation criteria to a data set |
| US20060277198A1 (en)* | 2005-06-03 | 2006-12-07 | Error Brett M | One-click segmentation definition |
| US8538969B2 (en) | 2005-06-03 | 2013-09-17 | Adobe Systems Incorporated | Data format for website traffic statistics |
| US8578041B2 (en) | 2005-06-03 | 2013-11-05 | Adobe Systems Incorporated | Variable sampling rates for website visitation analysis |
| US20060277585A1 (en)* | 2005-06-06 | 2006-12-07 | Error Christopher R | Creation of segmentation definitions |
| US8135722B2 (en) | 2005-06-06 | 2012-03-13 | Adobe Systems Incorporated | Creation of segmentation definitions |
| US7761457B2 (en) | 2005-06-06 | 2010-07-20 | Adobe Systems Incorporated | Creation of segmentation definitions |
| US7383334B2 (en) | 2005-10-28 | 2008-06-03 | Omniture, Inc. | Comparison of website visitation data sets generated from using different navigation tools |
| US20070100992A1 (en)* | 2005-10-28 | 2007-05-03 | Wong Catherine J | Comparison of Website Visitation Data Sets |
| US20070143451A1 (en)* | 2005-12-20 | 2007-06-21 | Johnson Controls Technology Company | System and method for configuring a control system |
| USD552622S1 (en)* | 2006-03-29 | 2007-10-09 | Samsung Electronics Co., Ltd. | Generated image for display on a portable telephone |
| USD553633S1 (en)* | 2006-03-29 | 2007-10-23 | Samsung Electronics Co., Ltd. | Generated image for display on a portable telephone |
| US7644375B1 (en) | 2006-09-18 | 2010-01-05 | Adobe Systems Incorporated | Dynamic path flow reports |
| US20080195930A1 (en)* | 2007-02-08 | 2008-08-14 | Microsoft Corporation | User Interface Pane for an Interactive Chart |
| US8321781B2 (en) | 2007-02-08 | 2012-11-27 | Microsoft Corporation | User interface pane for an interactive chart |
| US8862980B2 (en)* | 2007-06-29 | 2014-10-14 | Business Objects Software Limited | Guided graphical navigation through multidimensional databases |
| US20090002373A1 (en)* | 2007-06-29 | 2009-01-01 | Business Objects, S.A. | Apparatus and method for guided graphical navigation through multidimensional databases |
| US10289671B2 (en)* | 2008-05-07 | 2019-05-14 | Microsoft Technology Licensing, Llc | Graphically displaying selected data sources within a grid |
| US20090282325A1 (en)* | 2008-05-07 | 2009-11-12 | Microsoft Corporation | Sparklines in the grid |
| USD604314S1 (en)* | 2008-06-27 | 2009-11-17 | Microsoft Corporation | User interface for a portion of a display screen |
| USD604316S1 (en)* | 2008-06-27 | 2009-11-17 | Microsoft Corporation | User interface for a portion of a display screen |
| USD604313S1 (en)* | 2008-06-27 | 2009-11-17 | Microsoft Corporation | User interface for a portion of a display screen |
| USD604318S1 (en)* | 2008-06-27 | 2009-11-17 | Microsoft Corporation | Transitional image for a portion of a display screen |
| USD593109S1 (en)* | 2008-10-24 | 2009-05-26 | Microsoft Corporation | User interface for a display screen |
| USD593112S1 (en)* | 2008-10-24 | 2009-05-26 | Microsoft Corporation | User interface for a display screen |
| US11754982B2 (en) | 2012-08-27 | 2023-09-12 | Johnson Controls Tyco IP Holdings LLP | Syntax translation from first syntax to second syntax based on string analysis |
| US8793236B2 (en) | 2012-11-01 | 2014-07-29 | Adobe Systems Incorporated | Method and apparatus using historical influence for success attribution in network site activity |
| US9582612B2 (en)* | 2014-01-08 | 2017-02-28 | Sap Se | Space constrained ordered list previews |
| US20150193094A1 (en)* | 2014-01-08 | 2015-07-09 | Sap Ag | Space Constrained Ordered List Previews |
| US10089714B2 (en) | 2014-04-11 | 2018-10-02 | Fitbit, Inc. | Personalized scaling of graphical indicators |
| US9449409B2 (en)* | 2014-04-11 | 2016-09-20 | Fitbit, Inc. | Graphical indicators in analog clock format |
| US20160253828A1 (en)* | 2015-02-27 | 2016-09-01 | Fujitsu Limited | Display control system, and graph display method |
| US11899413B2 (en) | 2015-10-21 | 2024-02-13 | Johnson Controls Technology Company | Building automation system with integrated building information model |
| US11874635B2 (en) | 2015-10-21 | 2024-01-16 | Johnson Controls Technology Company | Building automation system with integrated building information model |
| US12405581B2 (en) | 2015-10-21 | 2025-09-02 | Johnson Controls Technology Company | Building automation system with integrated building information model |
| US12105484B2 (en) | 2015-10-21 | 2024-10-01 | Johnson Controls Technology Company | Building automation system with integrated building information model |
| US12196437B2 (en) | 2016-01-22 | 2025-01-14 | Tyco Fire & Security Gmbh | Systems and methods for monitoring and controlling an energy plant |
| US11947785B2 (en) | 2016-01-22 | 2024-04-02 | Johnson Controls Technology Company | Building system with a building graph |
| US11894676B2 (en) | 2016-01-22 | 2024-02-06 | Johnson Controls Technology Company | Building energy management system with energy analytics |
| US11770020B2 (en) | 2016-01-22 | 2023-09-26 | Johnson Controls Technology Company | Building system with timeseries synchronization |
| US10748312B2 (en) | 2016-02-12 | 2020-08-18 | Microsoft Technology Licensing, Llc | Tagging utilizations for selectively preserving chart elements during visualization optimizations |
| US10347017B2 (en)* | 2016-02-12 | 2019-07-09 | Microsoft Technology Licensing, Llc | Interactive controls that are collapsible and expandable and sequences for chart visualization optimizations |
| US11768004B2 (en) | 2016-03-31 | 2023-09-26 | Johnson Controls Tyco IP Holdings LLP | HVAC device registration in a distributed building management system |
| US11927924B2 (en) | 2016-05-04 | 2024-03-12 | Johnson Controls Technology Company | Building system with user presentation composition based on building context |
| US12210324B2 (en) | 2016-05-04 | 2025-01-28 | Johnson Controls Technology Company | Building system with user presentation composition based on building context |
| US11774920B2 (en) | 2016-05-04 | 2023-10-03 | Johnson Controls Technology Company | Building system with user presentation composition based on building context |
| US11892180B2 (en) | 2017-01-06 | 2024-02-06 | Johnson Controls Tyco IP Holdings LLP | HVAC system with automated device pairing |
| US11778030B2 (en) | 2017-02-10 | 2023-10-03 | Johnson Controls Technology Company | Building smart entity system with agent based communication and control |
| US12184444B2 (en) | 2017-02-10 | 2024-12-31 | Johnson Controls Technology Company | Space graph based dynamic control for buildings |
| US11755604B2 (en) | 2017-02-10 | 2023-09-12 | Johnson Controls Technology Company | Building management system with declarative views of timeseries data |
| US12019437B2 (en) | 2017-02-10 | 2024-06-25 | Johnson Controls Technology Company | Web services platform with cloud-based feedback control |
| US11809461B2 (en) | 2017-02-10 | 2023-11-07 | Johnson Controls Technology Company | Building system with an entity graph storing software logic |
| US12292720B2 (en) | 2017-02-10 | 2025-05-06 | Johnson Controls Technology Company | Building system with digital twin based agent processing |
| US12055908B2 (en) | 2017-02-10 | 2024-08-06 | Johnson Controls Technology Company | Building management system with nested stream generation |
| US11764991B2 (en) | 2017-02-10 | 2023-09-19 | Johnson Controls Technology Company | Building management system with identity management |
| US11774930B2 (en) | 2017-02-10 | 2023-10-03 | Johnson Controls Technology Company | Building system with digital twin based agent processing |
| US12341624B2 (en) | 2017-02-10 | 2025-06-24 | Johnson Controls Technology Company | Building management system with identity management |
| US11762886B2 (en) | 2017-02-10 | 2023-09-19 | Johnson Controls Technology Company | Building system with entity graph commands |
| US12229156B2 (en) | 2017-02-10 | 2025-02-18 | Johnson Controls Technology Company | Building management system with eventseries processing |
| US11994833B2 (en) | 2017-02-10 | 2024-05-28 | Johnson Controls Technology Company | Building smart entity system with agent based data ingestion and entity creation using time series data |
| US11792039B2 (en) | 2017-02-10 | 2023-10-17 | Johnson Controls Technology Company | Building management system with space graphs including software components |
| US11762362B2 (en) | 2017-03-24 | 2023-09-19 | Johnson Controls Tyco IP Holdings LLP | Building management system with dynamic channel communication |
| US11164198B2 (en)* | 2017-03-31 | 2021-11-02 | ASK Chemicals LLC | Graphical user interface for visualizing market share analysis |
| US11954478B2 (en) | 2017-04-21 | 2024-04-09 | Tyco Fire & Security Gmbh | Building management system with cloud management of gateway configurations |
| US11761653B2 (en) | 2017-05-10 | 2023-09-19 | Johnson Controls Tyco IP Holdings LLP | Building management system with a distributed blockchain database |
| US11900287B2 (en) | 2017-05-25 | 2024-02-13 | Johnson Controls Tyco IP Holdings LLP | Model predictive maintenance system with budgetary constraints |
| US12379718B2 (en) | 2017-05-25 | 2025-08-05 | Tyco Fire & Security Gmbh | Model predictive maintenance system for building equipment |
| US11699903B2 (en) | 2017-06-07 | 2023-07-11 | Johnson Controls Tyco IP Holdings LLP | Building energy optimization system with economic load demand response (ELDR) optimization and ELDR user interfaces |
| US12061446B2 (en) | 2017-06-15 | 2024-08-13 | Johnson Controls Technology Company | Building management system with artificial intelligence for unified agent based control of building subsystems |
| US11774922B2 (en) | 2017-06-15 | 2023-10-03 | Johnson Controls Technology Company | Building management system with artificial intelligence for unified agent based control of building subsystems |
| US11920810B2 (en) | 2017-07-17 | 2024-03-05 | Johnson Controls Technology Company | Systems and methods for agent based building simulation for optimal control |
| US12270560B2 (en) | 2017-07-17 | 2025-04-08 | Johnson Controls Technology Company | Systems and methods for digital twin-based equipment control |
| US11733663B2 (en) | 2017-07-21 | 2023-08-22 | Johnson Controls Tyco IP Holdings LLP | Building management system with dynamic work order generation with adaptive diagnostic task details |
| US11726632B2 (en) | 2017-07-27 | 2023-08-15 | Johnson Controls Technology Company | Building management system with global rule library and crowdsourcing framework |
| US11741812B2 (en) | 2017-09-27 | 2023-08-29 | Johnson Controls Tyco IP Holdings LLP | Building risk analysis system with dynamic modification of asset-threat weights |
| US12056999B2 (en) | 2017-09-27 | 2024-08-06 | Tyco Fire & Security Gmbh | Building risk analysis system with natural language processing for threat ingestion |
| US11762356B2 (en) | 2017-09-27 | 2023-09-19 | Johnson Controls Technology Company | Building management system with integration of data into smart entities |
| US11735021B2 (en) | 2017-09-27 | 2023-08-22 | Johnson Controls Tyco IP Holdings LLP | Building risk analysis system with risk decay |
| US11762353B2 (en) | 2017-09-27 | 2023-09-19 | Johnson Controls Technology Company | Building system with a digital twin based on information technology (IT) data and operational technology (OT) data |
| US12013842B2 (en) | 2017-09-27 | 2024-06-18 | Johnson Controls Tyco IP Holdings LLP | Web services platform with integration and interface of smart entities with enterprise applications |
| US12395818B2 (en) | 2017-09-27 | 2025-08-19 | Tyco Fire & Security Gmbh | Web services for smart entity management for sensor systems |
| US11768826B2 (en) | 2017-09-27 | 2023-09-26 | Johnson Controls Tyco IP Holdings LLP | Web services for creation and maintenance of smart entities for connected devices |
| US12400035B2 (en) | 2017-09-27 | 2025-08-26 | Johnson Controls Technology Company | Building system with smart entity personal identifying information (PII) masking |
| US12339825B2 (en) | 2017-09-27 | 2025-06-24 | Tyco Fire & Security Gmbh | Building risk analysis system with risk cards |
| US12399475B2 (en) | 2017-09-27 | 2025-08-26 | Johnson Controls Technology Company | Building management system with integration of data into smart entities |
| US11709965B2 (en) | 2017-09-27 | 2023-07-25 | Johnson Controls Technology Company | Building system with smart entity personal identifying information (PII) masking |
| US20220138183A1 (en) | 2017-09-27 | 2022-05-05 | Johnson Controls Tyco IP Holdings LLP | Web services platform with integration and interface of smart entities with enterprise applications |
| US11762351B2 (en) | 2017-11-15 | 2023-09-19 | Johnson Controls Tyco IP Holdings LLP | Building management system with point virtualization for online meters |
| US11782407B2 (en) | 2017-11-15 | 2023-10-10 | Johnson Controls Tyco IP Holdings LLP | Building management system with optimized processing of building system data |
| US11727738B2 (en) | 2017-11-22 | 2023-08-15 | Johnson Controls Tyco IP Holdings LLP | Building campus with integrated smart environment |
| US11954713B2 (en) | 2018-03-13 | 2024-04-09 | Johnson Controls Tyco IP Holdings LLP | Variable refrigerant flow system with electricity consumption apportionment |
| US11941238B2 (en) | 2018-10-30 | 2024-03-26 | Johnson Controls Technology Company | Systems and methods for entity visualization and management with an entity node editor |
| US11927925B2 (en) | 2018-11-19 | 2024-03-12 | Johnson Controls Tyco IP Holdings LLP | Building system with a time correlated reliability data stream |
| US12367443B2 (en) | 2019-01-14 | 2025-07-22 | Tyco Fire & Security Gmbh | System and method for showing key performance indicators |
| US11763266B2 (en) | 2019-01-18 | 2023-09-19 | Johnson Controls Tyco IP Holdings LLP | Smart parking lot system |
| US11769117B2 (en) | 2019-01-18 | 2023-09-26 | Johnson Controls Tyco IP Holdings LLP | Building automation system with fault analysis and component procurement |
| US11775938B2 (en) | 2019-01-18 | 2023-10-03 | Johnson Controls Tyco IP Holdings LLP | Lobby management system |
| US11762343B2 (en) | 2019-01-28 | 2023-09-19 | Johnson Controls Tyco IP Holdings LLP | Building management system with hybrid edge-cloud processing |
| US20210134414A1 (en)* | 2019-11-01 | 2021-05-06 | Seattle Children's Hospital D/B/A Seattle Children's Research Institute | Generation of combined information display interfaces to support clinical patient prioritization |
| US12197299B2 (en) | 2019-12-20 | 2025-01-14 | Tyco Fire & Security Gmbh | Building system with ledger based software gateways |
| US11991018B2 (en) | 2019-12-31 | 2024-05-21 | Tyco Fire & Security Gmbh | Building data platform with edge based event enrichment |
| US11777758B2 (en) | 2019-12-31 | 2023-10-03 | Johnson Controls Tyco IP Holdings LLP | Building data platform with external twin synchronization |
| US11770269B2 (en) | 2019-12-31 | 2023-09-26 | Johnson Controls Tyco IP Holdings LLP | Building data platform with event enrichment with contextual information |
| US11777757B2 (en) | 2019-12-31 | 2023-10-03 | Johnson Controls Tyco IP Holdings LLP | Building data platform with event based graph queries |
| US11968059B2 (en) | 2019-12-31 | 2024-04-23 | Johnson Controls Tyco IP Holdings LLP | Building data platform with graph based capabilities |
| US12021650B2 (en) | 2019-12-31 | 2024-06-25 | Tyco Fire & Security Gmbh | Building data platform with event subscriptions |
| US12393611B2 (en) | 2019-12-31 | 2025-08-19 | Tyco Fire & Security Gmbh | Building data platform with graph based capabilities |
| US12040911B2 (en) | 2019-12-31 | 2024-07-16 | Tyco Fire & Security Gmbh | Building data platform with a graph change feed |
| US11777759B2 (en) | 2019-12-31 | 2023-10-03 | Johnson Controls Tyco IP Holdings LLP | Building data platform with graph based permissions |
| US11991019B2 (en) | 2019-12-31 | 2024-05-21 | Johnson Controls Tyco IP Holdings LLP | Building data platform with event queries |
| US11777756B2 (en) | 2019-12-31 | 2023-10-03 | Johnson Controls Tyco IP Holdings LLP | Building data platform with graph based communication actions |
| US11824680B2 (en) | 2019-12-31 | 2023-11-21 | Johnson Controls Tyco IP Holdings LLP | Building data platform with a tenant entitlement model |
| US12271163B2 (en) | 2019-12-31 | 2025-04-08 | Tyco Fire & Security Gmbh | Building information model management system with hierarchy generation |
| US12273215B2 (en) | 2019-12-31 | 2025-04-08 | Tyco Fire & Security Gmbh | Building data platform with an enrichment loop |
| US12231255B2 (en) | 2019-12-31 | 2025-02-18 | Tyco Fire & Security Gmbh | Building data platform with graph projections |
| US11894944B2 (en) | 2019-12-31 | 2024-02-06 | Johnson Controls Tyco IP Holdings LLP | Building data platform with an enrichment loop |
| US12063126B2 (en) | 2019-12-31 | 2024-08-13 | Tyco Fire & Security Gmbh | Building data graph including application programming interface calls |
| US12143237B2 (en) | 2019-12-31 | 2024-11-12 | Tyco Fire & Security Gmbh | Building data platform with graph based permissions |
| US12099334B2 (en) | 2019-12-31 | 2024-09-24 | Tyco Fire & Security Gmbh | Systems and methods for presenting multiple BIM files in a single interface |
| US20220376944A1 (en) | 2019-12-31 | 2022-11-24 | Johnson Controls Tyco IP Holdings LLP | Building data platform with graph based capabilities |
| US12100280B2 (en) | 2020-02-04 | 2024-09-24 | Tyco Fire & Security Gmbh | Systems and methods for software defined fire detection and risk assessment |
| US11880677B2 (en) | 2020-04-06 | 2024-01-23 | Johnson Controls Tyco IP Holdings LLP | Building system with digital network twin |
| US11874809B2 (en) | 2020-06-08 | 2024-01-16 | Johnson Controls Tyco IP Holdings LLP | Building system with naming schema encoding entity type and entity relationships |
| US11741165B2 (en) | 2020-09-30 | 2023-08-29 | Johnson Controls Tyco IP Holdings LLP | Building management system with semantic model integration |
| US11954154B2 (en) | 2020-09-30 | 2024-04-09 | Johnson Controls Tyco IP Holdings LLP | Building management system with semantic model integration |
| US12346381B2 (en) | 2020-09-30 | 2025-07-01 | Tyco Fire & Security Gmbh | Building management system with semantic model integration |
| US12063274B2 (en) | 2020-10-30 | 2024-08-13 | Tyco Fire & Security Gmbh | Self-configuring building management system |
| US12231496B2 (en) | 2020-10-30 | 2025-02-18 | Tyco Fire & Security Gmbh | Building management system with dynamic building model enhanced by digital twins |
| US11902375B2 (en) | 2020-10-30 | 2024-02-13 | Johnson Controls Tyco IP Holdings LLP | Systems and methods of configuring a building management system |
| US12432277B2 (en) | 2020-10-30 | 2025-09-30 | Tyco Fire & Security Gmbh | Systems and methods of configuring a building management system |
| US12058212B2 (en) | 2020-10-30 | 2024-08-06 | Tyco Fire & Security Gmbh | Building management system with auto-configuration using existing points |
| US12061453B2 (en) | 2020-12-18 | 2024-08-13 | Tyco Fire & Security Gmbh | Building management system performance index |
| US12235617B2 (en) | 2021-02-08 | 2025-02-25 | Tyco Fire & Security Gmbh | Site command and control tool with dynamic model viewer |
| US11921481B2 (en) | 2021-03-17 | 2024-03-05 | Johnson Controls Tyco IP Holdings LLP | Systems and methods for determining equipment energy waste |
| US11899723B2 (en) | 2021-06-22 | 2024-02-13 | Johnson Controls Tyco IP Holdings LLP | Building data platform with context based twin function processing |
| US12197508B2 (en) | 2021-06-22 | 2025-01-14 | Tyco Fire & Security Gmbh | Building data platform with context based twin function processing |
| US11796974B2 (en) | 2021-11-16 | 2023-10-24 | Johnson Controls Tyco IP Holdings LLP | Building data platform with schema extensibility for properties and tags of a digital twin |
| US12055907B2 (en) | 2021-11-16 | 2024-08-06 | Tyco Fire & Security Gmbh | Building data platform with schema extensibility for properties and tags of a digital twin |
| US11769066B2 (en) | 2021-11-17 | 2023-09-26 | Johnson Controls Tyco IP Holdings LLP | Building data platform with digital twin triggers and actions |
| US12399467B2 (en) | 2021-11-17 | 2025-08-26 | Tyco Fire & Security Gmbh | Building management systems and methods for tuning fault detection thresholds |
| US12406193B2 (en) | 2021-11-17 | 2025-09-02 | Tyco Fire & Security Gmbh | Building data platform with digital twin triggers and actions |
| US11934966B2 (en) | 2021-11-17 | 2024-03-19 | Johnson Controls Tyco IP Holdings LLP | Building data platform with digital twin inferences |
| US12386827B2 (en) | 2021-11-24 | 2025-08-12 | Tyco Fire & Security Gmbh | Building data platform with a distributed digital twin |
| US11704311B2 (en) | 2021-11-24 | 2023-07-18 | Johnson Controls Tyco IP Holdings LLP | Building data platform with a distributed digital twin |
| US12013673B2 (en) | 2021-11-29 | 2024-06-18 | Tyco Fire & Security Gmbh | Building control system using reinforcement learning |
| US12412003B2 (en) | 2021-11-29 | 2025-09-09 | Tyco Fire & Security Gmbh | Building data platform with digital twin based predictive recommendation visualization |
| US11714930B2 (en) | 2021-11-29 | 2023-08-01 | Johnson Controls Tyco IP Holdings LLP | Building data platform with digital twin based inferences and predictions for a graphical building model |
| US12333657B2 (en) | 2021-12-01 | 2025-06-17 | Tyco Fire & Security Gmbh | Building data platform with augmented reality based digital twins |
| US12372955B2 (en) | 2022-05-05 | 2025-07-29 | Tyco Fire & Security Gmbh | Building data platform with digital twin functionality indicators |
| US12061633B2 (en) | 2022-09-08 | 2024-08-13 | Tyco Fire & Security Gmbh | Building system that maps points into a graph schema |
| US12013823B2 (en) | 2022-09-08 | 2024-06-18 | Tyco Fire & Security Gmbh | Gateway system that maps points into a graph schema |
| USRE50632E1 (en) | 2023-05-23 | 2025-10-14 | Tyco Fire & Security Gmbh | Building energy optimization system with battery powered vehicle cost optimization |
Also Published As
| Publication number | Publication date |
|---|---|
| GB2362232B (en) | 2002-04-10 |
| GB2362232A (en) | 2001-11-14 |
| GB0011099D0 (en) | 2000-06-28 |
Similar Documents
| Publication | Publication Date | Title |
|---|---|---|
| US6704016B1 (en) | Method and apparatus for the graphical presentation of selected data | |
| US7248263B2 (en) | User interface for representing multiple data sets on a common graph | |
| US10558681B2 (en) | Automated computer visualization and interaction with big data | |
| JP3735684B2 (en) | Apparatus and method for displaying data by interactive split pie chart | |
| US7292245B2 (en) | Method and apparatus for time series graph display | |
| US7519923B2 (en) | Method for generating a tree view of elements in a graphical user interface (GUI) | |
| US9449408B2 (en) | Visualizing high-cardinality data | |
| EP0905607A2 (en) | Scrolling assisted by relevance indication | |
| US6539347B1 (en) | Method of generating a display for a dynamic simulation model utilizing node and link representations | |
| US20060224992A1 (en) | Graphical user interface management | |
| EP1672589A1 (en) | Method, system, and computer-readable medium for the layout of automatically-placed elements and user-placed elements in a chart | |
| US20030071815A1 (en) | Method for placement of data for visualization of multidimensional data sets using multiple pixel bar charts | |
| US7716227B1 (en) | Visually representing series data sets in accordance with importance values | |
| US6317140B1 (en) | Displaying interactive bitmap images within a display space | |
| US8020116B2 (en) | System and method for visualizing a multi-screen workspace on a single display screen | |
| WO1990003008A1 (en) | Method and apparatus for accessing and manipulating time series | |
| JP5419292B2 (en) | User interface program, system and method for displaying time series data | |
| WO2002071301A1 (en) | Method and system for selective content display | |
| US7505048B2 (en) | Estimation of overlap of polygons | |
| CN107257976A (en) | The device, method and system that the signal graph relied on for resolution ratio is represented | |
| US20080216010A1 (en) | Method and system for displaying hierarchical information | |
| EP0636965A1 (en) | Displaying graphic data | |
| US6262727B1 (en) | Method of compressing and expanding large lists of data | |
| US20220035798A1 (en) | Data analysis support apparatus, data analysis support method, and computer-readable recording medium | |
| CN113761424B (en) | Web page scrolling positioning method, device and storage medium |
Legal Events
| Date | Code | Title | Description |
|---|---|---|---|
| AS | Assignment | Owner name:3COM CORPORATION, CALIFORNIA Free format text:ASSIGNMENT OF ASSIGNORS INTEREST;ASSIGNORS:OLIVER, PETER I.;TAMS, JONATHAN G.G.;REEL/FRAME:011090/0607;SIGNING DATES FROM 20000707 TO 20000712 | |
| STCF | Information on status: patent grant | Free format text:PATENTED CASE | |
| FEPP | Fee payment procedure | Free format text:PAYOR NUMBER ASSIGNED (ORIGINAL EVENT CODE: ASPN); ENTITY STATUS OF PATENT OWNER: LARGE ENTITY | |
| FPAY | Fee payment | Year of fee payment:4 | |
| REMI | Maintenance fee reminder mailed | ||
| AS | Assignment | Owner name:HEWLETT-PACKARD COMPANY, CALIFORNIA Free format text:MERGER;ASSIGNOR:3COM CORPORATION;REEL/FRAME:024630/0820 Effective date:20100428 | |
| AS | Assignment | Owner name:HEWLETT-PACKARD COMPANY, CALIFORNIA Free format text:CORRECTIVE ASSIGNMENT TO CORRECT THE SEE ATTACHED;ASSIGNOR:3COM CORPORATION;REEL/FRAME:025039/0844 Effective date:20100428 | |
| FPAY | Fee payment | Year of fee payment:8 | |
| AS | Assignment | Owner name:HEWLETT-PACKARD DEVELOPMENT COMPANY, L.P., TEXAS Free format text:ASSIGNMENT OF ASSIGNORS INTEREST;ASSIGNOR:HEWLETT-PACKARD COMPANY;REEL/FRAME:027329/0044 Effective date:20030131 | |
| AS | Assignment | Owner name:HEWLETT-PACKARD DEVELOPMENT COMPANY, L.P., TEXAS Free format text:CORRECTIVE ASSIGNMENT PREVIUOSLY RECORDED ON REEL 027329 FRAME 0001 AND 0044;ASSIGNOR:HEWLETT-PACKARD COMPANY;REEL/FRAME:028911/0846 Effective date:20111010 | |
| FPAY | Fee payment | Year of fee payment:12 | |
| AS | Assignment | Owner name:HEWLETT PACKARD ENTERPRISE DEVELOPMENT LP, TEXAS Free format text:ASSIGNMENT OF ASSIGNORS INTEREST;ASSIGNOR:HEWLETT-PACKARD DEVELOPMENT COMPANY, L.P.;REEL/FRAME:037079/0001 Effective date:20151027 | |
| AS | Assignment | Owner name:OT PATENT ESCROW, LLC, ILLINOIS Free format text:PATENT ASSIGNMENT, SECURITY INTEREST, AND LIEN AGREEMENT;ASSIGNORS:HEWLETT PACKARD ENTERPRISE DEVELOPMENT LP;HEWLETT PACKARD ENTERPRISE COMPANY;REEL/FRAME:055269/0001 Effective date:20210115 | |
| AS | Assignment | Owner name:VALTRUS INNOVATIONS LIMITED, IRELAND Free format text:ASSIGNMENT OF ASSIGNORS INTEREST;ASSIGNOR:OT PATENT ESCROW, LLC;REEL/FRAME:061244/0298 Effective date:20220803 |