US6611833B1 - Methods for profiling and classifying tissue using a database that includes indices representative of a tissue population - Google Patents
Methods for profiling and classifying tissue using a database that includes indices representative of a tissue populationDownload PDFInfo
- Publication number
- US6611833B1 US6611833B1US09/338,909US33890999AUS6611833B1US 6611833 B1US6611833 B1US 6611833B1US 33890999 AUS33890999 AUS 33890999AUS 6611833 B1US6611833 B1US 6611833B1
- Authority
- US
- United States
- Prior art keywords
- tissue
- indices
- specimens
- normal
- distribution
- Prior art date
- Legal status (The legal status is an assumption and is not a legal conclusion. Google has not performed a legal analysis and makes no representation as to the accuracy of the status listed.)
- Expired - Lifetime
Links
- 238000000034methodMethods0.000titleclaimsdescription120
- 210000004204blood vesselAnatomy0.000claimsabstractdescription57
- 230000002159abnormal effectEffects0.000claimsabstractdescription55
- 239000011159matrix materialSubstances0.000claimsabstractdescription28
- 210000001519tissueAnatomy0.000claimsdescription539
- 238000009826distributionMethods0.000claimsdescription184
- 230000001413cellular effectEffects0.000claimsdescription100
- 239000006185dispersionSubstances0.000claimsdescription94
- 108090000623proteins and genesProteins0.000claimsdescription42
- 150000002632lipidsChemical class0.000claimsdescription39
- 102000004169proteins and genesHuman genes0.000claimsdescription39
- 108020004999messenger RNAProteins0.000claimsdescription38
- 238000004458analytical methodMethods0.000claimsdescription35
- 238000003384imaging methodMethods0.000claimsdescription27
- 210000003205muscleAnatomy0.000claimsdescription13
- 210000000936intestineAnatomy0.000claimsdescription12
- 210000003734kidneyAnatomy0.000claims9
- 210000004556brainAnatomy0.000claims8
- 210000004185liverAnatomy0.000claims7
- 230000003915cell functionEffects0.000abstractdescription89
- 230000005226mechanical processes and functionsEffects0.000abstractdescription24
- 241001465754MetazoaSpecies0.000abstractdescription5
- 235000013305foodNutrition0.000abstractdescription4
- 210000004027cellAnatomy0.000description117
- 230000000875corresponding effectEffects0.000description39
- 150000002500ionsChemical class0.000description33
- 238000010586diagramMethods0.000description14
- 210000004072lungAnatomy0.000description13
- 238000004519manufacturing processMethods0.000description10
- 238000013461designMethods0.000description8
- 238000000386microscopyMethods0.000description8
- 238000003556assayMethods0.000description6
- 230000002596correlated effectEffects0.000description6
- 210000002435tendonAnatomy0.000description6
- 210000000845cartilageAnatomy0.000description5
- 238000009510drug designMethods0.000description5
- 210000000944nerve tissueAnatomy0.000description5
- 238000011160researchMethods0.000description5
- 238000012360testing methodMethods0.000description5
- 238000013459approachMethods0.000description4
- 239000002131composite materialSubstances0.000description4
- 230000006870functionEffects0.000description4
- 241001260012BursaSpecies0.000description3
- 210000004100adrenal glandAnatomy0.000description3
- 210000000436anusAnatomy0.000description3
- 210000005068bladder tissueAnatomy0.000description3
- 210000000988bone and boneAnatomy0.000description3
- 210000001185bone marrowAnatomy0.000description3
- 210000005013brain tissueAnatomy0.000description3
- 210000001951dura materAnatomy0.000description3
- 210000003238esophagusAnatomy0.000description3
- 210000003195fasciaAnatomy0.000description3
- 210000000232gallbladderAnatomy0.000description3
- 210000005003heart tissueAnatomy0.000description3
- 238000010191image analysisMethods0.000description3
- 210000003041ligamentAnatomy0.000description3
- 210000005228liver tissueAnatomy0.000description3
- 210000001165lymph nodeAnatomy0.000description3
- 210000004379membraneAnatomy0.000description3
- 230000005499meniscusEffects0.000description3
- 210000003097mucusAnatomy0.000description3
- 230000037311normal skinEffects0.000description3
- 230000002611ovarianEffects0.000description3
- 210000004923pancreatic tissueAnatomy0.000description3
- 210000003516pericardiumAnatomy0.000description3
- 210000004303peritoneumAnatomy0.000description3
- 210000004224pleuraAnatomy0.000description3
- 210000005084renal tissueAnatomy0.000description3
- 210000000952spleenAnatomy0.000description3
- 210000003708urethraAnatomy0.000description3
- 210000004291uterusAnatomy0.000description3
- 238000004624confocal microscopyMethods0.000description2
- 238000011161developmentMethods0.000description2
- 238000001493electron microscopyMethods0.000description2
- 238000012014optical coherence tomographyMethods0.000description2
- 210000000056organAnatomy0.000description2
- 230000003595spectral effectEffects0.000description2
- 102000010834Extracellular Matrix ProteinsHuman genes0.000description1
- 108010037362Extracellular Matrix ProteinsProteins0.000description1
- 210000003484anatomyAnatomy0.000description1
- 210000000467autonomic pathwayAnatomy0.000description1
- 230000036770blood supplyEffects0.000description1
- 239000000470constituentSubstances0.000description1
- 201000010099diseaseDiseases0.000description1
- 208000037265diseases, disorders, signs and symptomsDiseases0.000description1
- 238000011156evaluationMethods0.000description1
- 210000002744extracellular matrixAnatomy0.000description1
- 230000002068genetic effectEffects0.000description1
- 238000012986modificationMethods0.000description1
- 230000004048modificationEffects0.000description1
- 229920000642polymerPolymers0.000description1
- 238000003908quality control methodMethods0.000description1
- 230000001953sensory effectEffects0.000description1
- 238000012163sequencing techniqueMethods0.000description1
- 239000000725suspensionSubstances0.000description1
Images


Classifications
- G—PHYSICS
- G01—MEASURING; TESTING
- G01N—INVESTIGATING OR ANALYSING MATERIALS BY DETERMINING THEIR CHEMICAL OR PHYSICAL PROPERTIES
- G01N33/00—Investigating or analysing materials by specific methods not covered by groups G01N1/00 - G01N31/00
- G01N33/48—Biological material, e.g. blood, urine; Haemocytometers
- G01N33/50—Chemical analysis of biological material, e.g. blood, urine; Testing involving biospecific ligand binding methods; Immunological testing
- G01N33/68—Chemical analysis of biological material, e.g. blood, urine; Testing involving biospecific ligand binding methods; Immunological testing involving proteins, peptides or amino acids
- G01N33/6803—General methods of protein analysis not limited to specific proteins or families of proteins
- G—PHYSICS
- G01—MEASURING; TESTING
- G01N—INVESTIGATING OR ANALYSING MATERIALS BY DETERMINING THEIR CHEMICAL OR PHYSICAL PROPERTIES
- G01N33/00—Investigating or analysing materials by specific methods not covered by groups G01N1/00 - G01N31/00
- G01N33/48—Biological material, e.g. blood, urine; Haemocytometers
- G01N33/50—Chemical analysis of biological material, e.g. blood, urine; Testing involving biospecific ligand binding methods; Immunological testing
- G01N33/5005—Chemical analysis of biological material, e.g. blood, urine; Testing involving biospecific ligand binding methods; Immunological testing involving human or animal cells
- Y—GENERAL TAGGING OF NEW TECHNOLOGICAL DEVELOPMENTS; GENERAL TAGGING OF CROSS-SECTIONAL TECHNOLOGIES SPANNING OVER SEVERAL SECTIONS OF THE IPC; TECHNICAL SUBJECTS COVERED BY FORMER USPC CROSS-REFERENCE ART COLLECTIONS [XRACs] AND DIGESTS
- Y10—TECHNICAL SUBJECTS COVERED BY FORMER USPC
- Y10S—TECHNICAL SUBJECTS COVERED BY FORMER USPC CROSS-REFERENCE ART COLLECTIONS [XRACs] AND DIGESTS
- Y10S128/00—Surgery
- Y10S128/92—Computer assisted medical diagnostics
- Y10S128/923—Computer assisted medical diagnostics by comparison of patient data to other data
- Y—GENERAL TAGGING OF NEW TECHNOLOGICAL DEVELOPMENTS; GENERAL TAGGING OF CROSS-SECTIONAL TECHNOLOGIES SPANNING OVER SEVERAL SECTIONS OF THE IPC; TECHNICAL SUBJECTS COVERED BY FORMER USPC CROSS-REFERENCE ART COLLECTIONS [XRACs] AND DIGESTS
- Y10—TECHNICAL SUBJECTS COVERED BY FORMER USPC
- Y10S—TECHNICAL SUBJECTS COVERED BY FORMER USPC CROSS-REFERENCE ART COLLECTIONS [XRACs] AND DIGESTS
- Y10S707/00—Data processing: database and file management or data structures
- Y10S707/99931—Database or file accessing
- Y10S707/99933—Query processing, i.e. searching
- Y10S707/99936—Pattern matching access
- Y—GENERAL TAGGING OF NEW TECHNOLOGICAL DEVELOPMENTS; GENERAL TAGGING OF CROSS-SECTIONAL TECHNOLOGIES SPANNING OVER SEVERAL SECTIONS OF THE IPC; TECHNICAL SUBJECTS COVERED BY FORMER USPC CROSS-REFERENCE ART COLLECTIONS [XRACs] AND DIGESTS
- Y10—TECHNICAL SUBJECTS COVERED BY FORMER USPC
- Y10S—TECHNICAL SUBJECTS COVERED BY FORMER USPC CROSS-REFERENCE ART COLLECTIONS [XRACs] AND DIGESTS
- Y10S707/00—Data processing: database and file management or data structures
- Y10S707/99931—Database or file accessing
- Y10S707/99937—Sorting
- Y—GENERAL TAGGING OF NEW TECHNOLOGICAL DEVELOPMENTS; GENERAL TAGGING OF CROSS-SECTIONAL TECHNOLOGIES SPANNING OVER SEVERAL SECTIONS OF THE IPC; TECHNICAL SUBJECTS COVERED BY FORMER USPC CROSS-REFERENCE ART COLLECTIONS [XRACs] AND DIGESTS
- Y10—TECHNICAL SUBJECTS COVERED BY FORMER USPC
- Y10S—TECHNICAL SUBJECTS COVERED BY FORMER USPC CROSS-REFERENCE ART COLLECTIONS [XRACs] AND DIGESTS
- Y10S707/00—Data processing: database and file management or data structures
- Y10S707/99941—Database schema or data structure
- Y10S707/99943—Generating database or data structure, e.g. via user interface
- Y—GENERAL TAGGING OF NEW TECHNOLOGICAL DEVELOPMENTS; GENERAL TAGGING OF CROSS-SECTIONAL TECHNOLOGIES SPANNING OVER SEVERAL SECTIONS OF THE IPC; TECHNICAL SUBJECTS COVERED BY FORMER USPC CROSS-REFERENCE ART COLLECTIONS [XRACs] AND DIGESTS
- Y10—TECHNICAL SUBJECTS COVERED BY FORMER USPC
- Y10S—TECHNICAL SUBJECTS COVERED BY FORMER USPC CROSS-REFERENCE ART COLLECTIONS [XRACs] AND DIGESTS
- Y10S707/00—Data processing: database and file management or data structures
- Y10S707/99941—Database schema or data structure
- Y10S707/99944—Object-oriented database structure
- Y10S707/99945—Object-oriented database structure processing
Definitions
- the present inventionrelates to methods for profiling, engineering, manufacturing and classifying various types of tissue. More particularly, the present invention relates to the development and use of a novel tissue information database for engineering, manufacturing and classifying various types of tissue.
- the novel databaseincludes structural, cell function and/or mechanical indices that correspond to statistically significant representations of tissue characteristics associated with various tissue populations.
- Tissue engineeringis an emerging segment within the biotechnology industry.
- random tissue engineeringis used for making simple two-dimensional tissues that do not require a blood supply, e.g., skin and cartilage.
- cellsare placed in suspension on culture plates or within sponge-like polymer matrices and the respective tissues are grown in incubators with minimal intervention. While structurally simple tissues may be manufactured today in this manner, there is general agreement that this approach will not work for more complex tissues such as muscle and vascularized organs, and that these applications will require more complex growth environments whose applications will depend on tissue knowledge.
- rational tissue engineeringwill be required to make more complex tissues such as muscle and vascularized organs.
- rational tissue engineeringwill use structural information at the tissue level, as well as mechanical and cell function information on tissue, in order to develop complex three-dimensional “blueprints” of tissue. These blueprints will then be used to manufacture complex tissue on a microscopic level by delivering the proper cells and intercellular constituents required for generation of the tissue during the manufacturing process.
- tissue engineeringIn order for the rational tissue engineering approach discussed above to be successful, structural information at the tissue level, as well as mechanical and cell function information on tissue, will be required and such information must be made accessible to persons in the tissue engineering, drug design and genomics research fields. It is an object of the present invention to develop such tissue information and to provide this information to persons and entities in the tissue engineering/manufacturing, drug design and genomics research fields. It is a further object of the present invention to use this tissue information to evaluate, classify and/or perform quality control on living and manufactured tissue specimens provided by tissue suppliers.
- tissue informationthat is the subject of the present invention to identify normal elements of such manufactured tissue specimens in cases where, for example, such manufactured tissue specimens do not appear normal in total but contain elements that appear and/or function normally.
- the present inventionis directed to the development of a database that includes indices representative of a tissue population, and the use of the database for classification and evaluation of tissue specimens.
- a sample of normal tissue specimens obtained from a subset of a population of subjects with shared characteristicsare profiled in order to generate a plurality of structural indices that correspond to statistically significant representations of characteristics of tissue associated with the population.
- the structural indicesinclude cell density, matrix density, blood vessel density and layer thickness.
- the tissue specimens obtained from the subset of the populationare profiled by imaging a plurality of sections of each tissue specimen from the subset. Distributions of cell density values, matrix density values and blood vessel density values associated with the plurality of sections are then determined in accordance with the results of the imaging.
- a cell density index representative of tissue associated with the populationis determined in accordance with the distribution of cell density values
- a matrix density index representative of tissue associated with the populationis determined in accordance with the distribution of matrix density values
- a blood vessel density index representative of tissue associated with the populationis determined in accordance with the distribution of blood vessel density values.
- the cell density indexis determined by calculating a statistical average of the distribution of cell density values
- the matrix density indexis determined by calculating a statistical average of the distribution of matrix density values
- the blood vessel density indexis determined by calculating a statistical average of the distribution of blood vessel density values.
- Each statistical average of a distribution valuesrepresents, for example, a mean, median or mode of the distribution of values.
- the structural indicesinclude a further cell density index corresponding to an index of dispersion of the distribution of cell density values, a further matrix density index corresponding to an index of dispersion of the distribution of matrix density values, and a further blood vessel density index corresponding to an index of dispersion of the distribution of blood vessel density values.
- Each index of dispersion of a distribution valuesrepresents, for example, a standard deviation, standard error of the mean or range of the distribution of values.
- distributions of relative cell location values, relative matrix location values and relative blood vessel location values associated with the plurality of sectionsare also determined in accordance with the results of the imaging.
- a relative cell location index representative of tissue associated with the populationis determined in accordance with the distribution of relative cell location values
- a relative matrix location index representative of tissue associated with the populationis determined in accordance with the distribution of relative matrix location values
- a relative blood vessel location index representative of tissue associated with the populationis determined in accordance with the distribution of relative blood vessel location values.
- the relative cell location indexis determined by calculating a statistical average of the distribution of relative cell location values
- the relative matrix location indexis determined by calculating a statistical average of the distribution of relative matrix location values
- the relative blood vessel location indexis determined by calculating a statistical average of the distribution of relative blood vessel location values.
- the structural indicesinclude a further relative cell location index corresponding to an index of dispersion of the distribution of relative cell location values, a further relative matrix location index corresponding to an index of dispersion of the distribution of relative matrix location values, and a further relative blood vessel location index corresponding to an index of dispersion of the distribution of relative blood vessel location values.
- each index of dispersion of a distribution valuesrepresents, for example, a standard deviation, standard error of the mean or range of the distribution of values.
- imaging modalitiesmay be used for profiling the tissue specimens and generating the structural indices described above.
- light microscopy, fluorescent microscopy spectral microscopy, hyper-spectral microscopy, electron microscopy, confocal microscopy and optical coherence tomographymay be used for profiling the tissue specimens in accordance with the present invention.
- a combination of such imaging modalitiescan also be used for profiling tissue specimens in accordance with the present invention.
- one or more mechanical indicesmay be determined from the normal tissue specimens.
- the sample of normal tissue specimens obtained from the subset of the population with shared characteristicsis further profiled in order to generate one or more mechanical indices that correspond to statistically significant representations of characteristics of tissue associated with the population.
- One of the mechanical indicesmay correspond to a modulus of elasticity associated with the normal tissue specimens.
- the mechanical index corresponding to the modulus of elasticityis preferably determined by obtaining a distribution of elasticity values associated with the plurality of sections discussed above, and then determining an elasticity index representative of tissue associated with the population in accordance with the distribution of elasticity values.
- the elasticity indexpreferably represents the statistical average (e.g., mean, median or mode) of the distribution of elasticity values.
- a further elasticity index representative of the index of dispersion of the distribution of elasticity valuesis determined.
- This further elasticity indexpreferably represents the standard deviation, standard error of the mean or range of the distribution of elasticity values.
- a further mechanical index corresponding to the mechanical strength (e.g., breaking or tensile strength) associated with the normal tissue specimensmay also be determined.
- the mechanical index corresponding to the breaking strengthis preferably determined by obtaining a distribution of breaking strength values associated with the plurality of sections discussed above, and then determining a breaking strength index representative of tissue associated with the population in accordance with the distribution of breaking strength values.
- the breaking strength indexpreferably represents the statistical average (e.g., mean, median or mode) of the distribution of breaking strength values.
- a further breaking strength index representative of the index of dispersion of the distribution of breaking strength valuesis determined. This further breaking strength index preferably represents the standard deviation, standard error of the mean or range of the distribution of breaking strength values.
- one or more cell function indicesmay be determined from the normal tissue specimens.
- a plurality of cell function assaysare performed on the sample of normal tissue specimens from the subset of the population of subjects with shared characteristics. The results of the cell function assays are used to generate a plurality of cell function indices that correspond to statistically significant representations of characteristics of tissue associated with the population.
- the cell function indicesare optionally used to form a cell function map that is stored in a tissue information database. In an alternate embodiment, only the cell function indices and/or the cell function map (and not the structural or mechanical indices) are determined.
- the cell function indices used in connection with this aspect of the inventioncorrespond, for example, to (i) location, type and amount of DNA in the normal tissue specimens from the subset, (ii) location, type and amount of mRNA in the normal tissue specimens from the subset, (iii) location, type and amount of cellular proteins in the normal tissue specimens from the subset, (iv) location, type and amount of cellular lipids in the normal tissue specimens from the subset, and/or (v) location, type and amount of cellular ion distributions in the normal tissue specimens from the subset.
- the correlation between various one of the indices described abovemay also be determined.
- a correlation between two structural indices, a correlation between two mechanical indices, a correlation between two cell function indices, a correlation between a structural index and a mechanical index, a correlation between a structural index and a cell function index, and/or a correlation between a mechanical index and a cell function indexmay also be determined.
- the normal tissue specimens profiled to generate the structural, mechanical and/or cell function indices described abovecorrespond, for example, to a set of either normal intestine tissue specimens, normal cartilage tissue specimens, normal eye tissue specimens, normal bone tissue specimens, normal fat tissue specimens, normal muscle tissue specimens, normal kidney tissue specimens, normal brain tissue specimens, normal heart tissue specimens, normal liver tissue specimens, normal skin tissue specimens, normal pleura tissue specimens, normal peritoneum tissue specimens, normal pericardium tissue specimens, normal dura-mater tissue specimens, normal oral-nasal mucus membrane tissue specimens, normal pancreas tissue specimens, normal spleen tissue specimens, normal gall bladder tissue specimens, normal blood vessel tissue specimens, normal bladder tissue specimens, normal uterus tissue specimens, normal ovarian tissue specimens, normal urethra tissue specimens, normal penile tissue specimens, normal vaginal tissue specimens, normal esophagus tissue specimens, normal anus tissue specimens, normal adrenal gland
- the present inventionis directed to a computer implemented method for providing information representative of a plurality of tissue types to a subscriber.
- Tissue information representative of a plurality of tissue typese.g., the structural, mechanical and/or cell function indices described above for a plurality of tissue types and the correlation results described above for a plurality of tissue types
- the databaseincludes, for example, a plurality of structural indices generated from a sample of normal tissue specimens obtained from a subset of a population of subjects with shared characteristics.
- the structural indicescorrespond to statistically significant representations of characteristics of tissue associated with the population.
- the plurality of structural indicesinclude cell density, matrix density, blood vessel density and layer thickness.
- the databasealternatively includes a plurality of the cell function and/or mechanical indices described above either alone, or in combination with the aforementioned structural indices.
- Subscribers or users interested in engineering, classifying, manufacturing or analyzing tissueare provided access to the database in exchange for a subscription fee.
- the subscribersmay optionally measure parameters associated with subscriber-supplied tissue samples.
- the subscriber-supplied tissue samplesare then classified by comparing measured parameters associated with the subscriber-supplied tissue samples with the tissue information stored in the database (e.g., the structural, mechanical and/or cell function indices described above and/or the correlation results described above.)
- the databaseoptionally stores indices representative of one or more abnormal tissue types, and the subscriber-supplied tissue samples are classified as either normal or abnormal by comparing measured parameters associated with the subscriber-supplied tissue samples to the tissue information stored in the database.
- measured parameters associated with the subscriber-supplied tissue samplesmay be compared to the tissue information stored in the database in order to identify normal elements of such manufactured tissue specimens in cases where, for example, such manufactured tissue specimens do not appear normal in total but contain elements that appear and/or function normally.
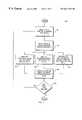
- FIG. 1is a flow diagram of a method for profiling samples of normal tissue specimens.
- each sample profiledis obtained from a subset of a population of subjects with shared characteristics, and used to generate structural, mechanical and cell function indices that correspond to statistically significant representations of characteristics of tissue associated with such population.
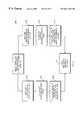
- FIGS. 2A, 2 B, 2 C and 2 Dare a flow diagram of a method for profiling a sample of normal tissue specimens obtained from a subset of a population of subjects with shared characteristics in order to generate a plurality of structural indices that correspond to statistically significant representations of characteristics of tissue associated with the population.
- FIG. 3is a flow diagram of a method for profiling a sample of normal tissue specimens obtained from a subset of a population of subjects with shared characteristics in order to generate a plurality of mechanical indices that correspond to statistically significant representations of characteristics of tissue associated with the population.
- FIGS. 4A and 4Bare a flow diagram of a method for profiling a sample of normal tissue specimens obtained from a subset of a population of subjects with shared characteristics in order to generate a plurality of cell function indices that correspond to statistically significant representations of characteristics of tissue associated with the population.
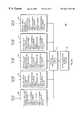
- FIGS. 5is a diagram of an exemplary data structure for storing structural indices associated with a given tissue type (or population of tissue specimens) in a database.
- FIG. 6is a diagram of an exemplary data structure for storing mechanical indices associated with a given tissue type (or population of tissue specimens) in a database.
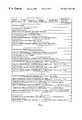
- FIGS. 7A, 7 B and 7 Care a diagram of an exemplary data structure for storing cell function indices associated with a given tissue type (or population of tissue specimens) in a database.
- FIG. 8is a diagram of a database for storing structural, mechanical and cell function indices associated with a plurality of different tissue types.
- FIG. 9is an exemplary cell function map associated with a tissue population and generated using the cell function indices described herein.
- FIG. 10is a flow diagram showing a method for designing and manufacturing engineered tissue, in accordance with a preferred embodiment of the present invention.
- FIG. 11is a flow diagram showing a method for providing information representative of a plurality of tissue populations to a subscriber and for classifying a user-supplied tissue specimen using such information, in accordance with a preferred embodiment of the present invention.
- a tissue typeis selected for analysis.
- the tissue typecorresponds to a population of tissue subject having shared characteristics.
- the tissue typecorresponds to human lung tissue, intestine tissue, cartilage tissue, etc.
- the tissue typemay be further specified as a population of subjects having a common age bracket, race and/or gender.
- the tissue type selected for analysismay correspond to a population of lung tissue subjects associated with Caucasian males between the ages of 18-35.
- the tissue type selected for analysiscan correspond to either a normal or an abnormal tissue type.
- the tissue type selected for analysismay correspond to a tissue type associated with a particular plant or animal species, or a food product.
- a sample of specimensis selected from the population selected for analysis in step 50 .
- the sample of specimensrepresents a subset of the selected population and includes a sufficient number of specimens to permit a statistically significant analysis of the population as a whole.
- the sampleincludes a sufficient number of specimens such that the structural, mechanical and cell function indices generated from the sample correspond to a statistically significant representation of those indices for the population as a whole.
- a plurality of structural indices representative of the selected populationare measured from the sample and stored in a database.
- the structural indicesare parameters that are representative of the physical structure of the tissue specimens in the sample.
- Exemplary structural indices measured and stored in step 200include: the average density of each of a plurality of cell types in the specimens in the sample, an index of dispersion (e.g., standard deviation) associated with each measured average cell density, the average density of each of the matrix in the specimens in the sample, an index of dispersion associated with the measured average matrix density, the average layer thickness of each layer in the specimens in the sample, an index of dispersion associated with each measured average layer thickness, the average density of blood vessels in the specimens in the sample, an index of dispersion associated with the measured average blood vessel density, the average relative location of (or distance between) selected types of cells in the specimens in the sample, an index of dispersion associated with each measured average relative location of cell types, the average relative location between blood vessels and selected cell types in the specimens in
- step 200structural indices other than those enumerated above may be measured and stored in step 200 , and that the use of such other structural indices is within the scope of the present invention.
- a set of exemplary steps that may be used to measure a sample of specimens and generate the structural indices enumerated aboveis shown in detail in FIGS. 2, 2 A and 2 B and discussed more fully below.
- a plurality of mechanical indices representative of the selected populationare measured from the sample and stored in the database.
- the mechanical indicesare parameters that are representative of the reaction of the tissue specimens in the sample to external forces.
- Exemplary mechanical indices measured and stored in step 300include: the average elasticity of specimens in the sample, an index of dispersion associated with the measured average elasticity, the average breaking strength of specimens in the sample, and an index of dispersion associated with the measured average breaking strength. It will be understood by those skilled in the art that mechanical indices other than those enumerated above may be measured and stored in step 300 , and that the use of such other mechanical indices is within the scope of the present invention.
- a set of exemplary steps that may be used to measure a sample of specimens and generate the mechanical indices enumerated aboveis shown in detail in FIG. 3 and discussed more fully below.
- a plurality of cell function indices representative of the selected populationare measured from the sample, stored in a database and optionally used to form a cell function map representative of the selected population.
- the cell function indicesare parameters that represent the character and function of cells in the tissue specimens in the sample.
- Exemplary cell function indices measured and stored in step 400include: the average amount of a first type of DNA in the specimens in the sample and an index of dispersion associated with the measured average amount of the first type of DNA, the average amount of a second type of DNA in the specimens in the sample and an index of dispersion associated with the measured average amount of the second type of DNA, . . .
- the average amount of an nth type of DNA in the specimens in the sample and an index of dispersion associated with the measured average amount of the nth type of DNAthe average amount of a first type of mRNA in the specimens in the sample and an index of dispersion associated with the measured average amount of the first type of mRNA, the average amount of a second type of mRNA in the specimens in the sample and an index of dispersion associated with the measured average amount of the second type of mRNA, . . .
- the average amount of an nth type of mRNA in the specimens in the sample and an index of dispersion associated with the measured average amount of the nth type of mRNAthe average amount of a first type of cellular protein in the specimens in the sample and an index of dispersion associated with the measured average amount of the first type of cellular protein, the average amount of a second type of cellular protein in the specimens in the sample and an index of dispersion associated with the measured average amount of the second type of cellular protein, . . .
- the average amount of an nth type of cellular protein in the specimens in the sample and an index of dispersion associated with the measured average amount of the nth type of cellular proteinthe average amount of a first type of cellular lipid in the specimens in the sample and an index of dispersion associated with the measured average amount of the first type of cellular lipid, the average amount of a second type of cellular lipid in the specimens in the sample and an index of dispersion associated with the measured average amount of the second type of cellular lipid, . . .
- cell function indices other than those enumerated abovemay be measured and stored in step 400 , and that the use of such other structural indices is within the scope of the present invention.
- a set of exemplary steps that may be used to measure a sample of specimens and generate the cell function indices enumerated aboveis shown in detail in FIG. 4 and discussed more fully below.
- step 500correlation operations are performed on the various structural, machanical and cell function indices generated in steps 200 , 300 and 400 , and the results of the correlations are stored in the data base.
- selected pairs of structural indicesare correlated with each other
- selected pairs of mechanical indicesare correlated with each other
- selected pairs of cell function indicesare correlated with each other
- selected structual indicesmay be correlated with selected mechanical or cell function indices
- selected mechanical indicesmay be correlated with selected cell function indices.
- correlations between the following pairs of indicesare performed in step 500 and store in the base:
- correlation values other than those enumerated abovemay be measured and stored in step 500 , and that the use of such other correlation values is within the scope of the present invention.
- the process described abovemay be repeated for each tissue population of interest.
- the present inventionmay be used to generate a data base such as that shown in FIG. 8, which includes structural, mechanical and cell function indices for many different tissue populations.
- the structural, mechanical and/or cell function indices associated with each tissue populationcollectively represent a “blueprint” of the tissue in the population and may be used, inter alia, to rationally design and then manufacture engineered tissue corresponding to the tissue population (as shown in FIG. 10 ).
- the rational tissue design formed for a given tissue population using the present inventionpreferably consists of Cartesian coordinates of cells, matrices and blood vessels within units that repeat in a common fashion throughout the design.
- the coordinatesare preferably in two-dimensions or three-dimensions.
- a fourth dimension(corresponding to time) may be included in the tissue design to account for changes to a particular tissue population as it ages over time.
- the time dimension in the tissue designmight reflect the differences among the lung tissue of Caucasian males falling in different age brackets (e.g., 18-25 years old, 26-35 years old, etc.).
- each specimen from the sample selected in step 100is imaged using, for example, light microscopy, fluorescent microscopy, spectral microscopy, hyper-spectral microscopy, electron microscopy, confocal microscopy and/or optical coherence tomography.
- the specimens from the samplesmay be imaged using a combination of the above imaging modalities.
- a plurality of sections in each tissue specimen in the sampleis imaged using one or more of the above imaging modalities in step 202 .
- step 204the imaging information from step 202 is analyzed in order to generate a distribution of density values associated with a particular cell type (i.e., cell type 1 ) in the specimens in the sample.
- a particular cell typei.e., cell type 1
- the imaging information corresponding to each imaged section of each specimenis analyzed in order to determine the density of the particular cell type (i.e., cell type 1 ) in the section.
- a distribution of density values for the particular cell typemay then be obtained.
- an average cell density index representative of an average density of the particular cell type (i.e., cell type 1 ) in the populationis calculated by taking the statistical average of the distribution of values generated in step 204 .
- the statistical averagecorresponds, for example, to a mean, median or mode of the distribution of values generated in step 204 .
- an index of dispersion about the average density of the particular cell type (i.e., cell type 1 ) in the populationis calculated by, for example, taking the standard deviation, standard error, or standard error of the mean of the distribution of values generated in step 204 .
- the imaging information from step 202may be further analyzed in order to generate a further distribution of density values associated with a different cell type (i.e., cell type 2 ) in the specimens in the sample.
- the imaging information corresponding to each imaged section of each specimenis analyzed in order to determine the density of the particular cell type (i.e., cell type 2 ) in the section.
- a distribution of density values for the particular cell typei.e., cell type 2
- an average cell density index representative of an average density of the particular cell type (i.e., cell type 2 ) in the populationis calculated by taking the statistical average of the distribution of values generated in step 210 .
- the statistical averagecorresponds, for example, to a mean, median or mode of the distribution of values generated in step 210 .
- an index of dispersion about the average density of the particular cell type (i.e., cell type 2 ) in the populationis calculated by, for example, taking the standard deviation, standard error, or standard error of the mean of the distribution of values generated in step 210 .
- steps 216 , 218 , 220steps 204 , 206 , 208 and 210 , 212 , 214 may be repeated further times for each other cell type of interest in order to generate an average cell density index and a corresponding index of dispersion for each cell type of interest in the population.
- step 222the imaging information from step 202 is analyzed in order to generate a distribution of density values associated with the matrix associated with the specimens in the sample.
- the imaging information corresponding to each imaged section of each specimenis analyzed in order to determine the density of the matrix in the section.
- This matrix density in a given specimenmay correspond, for example, to the density of one or more proteins in the extra-cellular matrix of the specimen.
- a distribution of density values for the particular matrixis obtained.
- step 224an average matrix density index representative of an average density of the particular matrix associated with the population is calculated by taking the statistical average of the distribution of values generated in step 222 .
- the statistical averagecorresponds, for example, to a mean, median or mode of the distribution of values generated in step 222 .
- an index of dispersion about the average density of the particular matrix associated with the populationis calculated by, for example, taking the standard deviation, standard error, or standard error of the mean of the distribution of values generated in step 222 .
- step 228the imaging information from step 202 is analyzed in order to generate a distribution of layer thickness values associated with the specimens in the sample.
- the imaging information corresponding to each imaged section of each specimenis analyzed in order to determine the thickness a particular tissue layer in the section.
- a distribution of layer thickness values for the particular layeris obtained.
- an average layer thickness index representative of an average thickness of the particular tissue layer associated with the populationis calculated by taking the statistical average of the distribution of values generated in step 228 .
- the statistical averagecorresponds, for example, to a mean, median or mode of the distribution of values generated in step 228 .
- an index of dispersion about the average layer thickness of the particular layer associated with the populationis calculated by, for example, taking the standard deviation, standard error, or standard error of the mean of the distribution of values generated in step 228 .
- steps 228 - 232are preferably repeated for each tissue layer of interest, and an average layer thickness index and an index of dispersion about such average are generated for each such layer.
- the other structural, mechanical and cell function indices described hereinmay be determined separately for each tissue layer in the population.
- the imaging information from step 202is analyzed in order to generate a distribution of density values associated with blood vessels in the specimens in the sample.
- the imaging information corresponding to each imaged section of each specimenis analyzed in order to determine the density of blood vessels in the section.
- the blood vesselscan be categorized by diameter, and the density of blood vessels in a given specimen can correspond to the density of blood vessels having one diameter. Alternatively, the density of blood vessels in a given specimen will correspond to the density of all blood vessels (regardless of their diameter) in the specimen.
- an average blood vessel density index representative of an average density of blood vessels (i.e., blood vessels per unit area/unit volume) in the populationis calculated by taking the statistical average (e.g., mean, median or mode) of the distribution of values generated in step 240 .
- an index of dispersion about the average blood vessel densityis calculated by, for example, taking the standard deviation, standard error, or standard error of the mean of the distribution of values generated in step 240 .
- the imaging information from step 202is further analyzed in order to generate a distribution of relative cell location values representative of the relative proximity of two particular cell types (i.e., cell types 1 and 2 ) in the specimens in the sample.
- the imaging information corresponding to each imaged section of each specimenis analyzed in order to determine the average proximity of the two particular cell types (i.e., cell types 1 and 2 ) in the section. This process can be performed by using image analysis to determine the centers and boundaries of the cell types of interest, and then calculating the distances between the relevant cells in each image.
- each occurrence of cell type 1 in a sectioncan be identified and the distance to the closest cell of type 2 can then be measured.
- the centroids of the respective spaces occupied by the cells of type 1 and the cells of type 2can be determined, and the distance between the centroids can then be measured.
- an average relative cell location index representative of an average proximity between the particular cell types of interest (i.e., cell types 1 and 2 ) in the populationis calculated by taking the statistical average (e.g., mean, median or mode) of the distribution of values generated in step 246 .
- an index of dispersion about the average proximity between the particular cell types of interest (i.e., cell types 1 and 2 ) in the populationis calculated by, for example, taking the standard deviation, standard error, or standard error of the mean of the distribution of values generated in step 246 .
- the imaging information from step 202is further analyzed in order to generate a distribution of relative cell location values representative of the relative proximity of a further pair of particular cell types (i.e., cell types 1 and 3 ) in the specimens in the sample.
- the imaging information corresponding to each imaged section of each specimenis analyzed (as discussed in connection with step 246 ) in order to determine the average proximity of the a different pair of particular cell types (i.e., cell types 1 and 3 ) in the section.
- a distribution of relative cell location values for the particular cell types of interestmay then be obtained.
- an average relative cell location index representative of an average proximity between the particular cell types of interest (i.e., cell types 1 and 3 ) in the populationis calculated by taking the statistical average (e.g., mean, median or mode) of the distribution of values generated in step 252 .
- an index of dispersion about the average proximity between the particular cell types of interest (i.e., cell types 1 and 3 ) in the populationis calculated by, for example, taking the standard deviation, standard error, or standard error of the mean of the distribution of values generated in step 252 .
- steps 258 , 260 , 262steps 246 , 248 , 250 and 252 , 254 , 256 may be repeated further times for each other pair of cell types of interest (i.e., cell types a and b) in order to generate an average relative cell location index and a corresponding index of dispersion for each pair of cell types of interest in the population.
- the imaging information from step 202is further analyzed in order to generate a distribution of relative blood vessel location values representative of the relative proximity of blood vessel to a particular type of cell (i.e., cell types 1 ) in the specimens in the sample.
- the imaging information corresponding to each imaged section of each specimenis analyzed in order to determine the average proximity of blood vessels to the particular cell type (i.e., cell types 1 ) in the section.
- This processcan be performed by using image analysis to determine the centers and boundaries of the cell types of interest, and then calculating the distances between the relevant cells in each image and the closest blood vessels.
- a distribution of relative blood vessel location values for the particular cell type of interestmay then be obtained.
- an average relative blood vessel location index representative of an average proximity between blood vessels and the particular cell type of interest (i.e., cell type 1 ) in the populationis calculated by taking the statistical average (e.g., mean, median or mode) of the distribution of values generated in step 264 .
- an index of dispersion about the average proximity between blood vessels and the particular cell type of interest (i.e., cell type 1 ) in the populationis calculated by, for example, taking the standard deviation, standard error, or standard error of the mean of the distribution of values generated in step 264 .
- the imaging information from step 202is further analyzed in order to generate a distribution of relative blood vessel location values representative of the relative proximity between blood vessel of a further particular cell type of interest (i.e., cell type 2 ) in the specimens in the sample.
- the imaging information corresponding to each imaged section of each specimenis analyzed in order to determine the average proximity of blood vessels to the further particular cell type (i.e., cell type 2 ) in the section.
- This processcan be performed by using image analysis to determine the centers and boundaries of the cell types of interest, and then calculating the distances between the relevant cells in each image and the closest blood vessels.
- an average relative blood vessel location index representative of an average proximity between blood vessels and the cell type of interest (i.e., cell type 2 ) in the populationis calculated by taking the statistical average (e.g., mean, median or mode) of the distribution of values generated in step 270 .
- an index of dispersion about the average proximity between blood vessel and the cell type of interest (i.e., cell type 2 ) in the populationis calculated by, for example, taking the standard deviation, standard error, or standard error of the mean of the distribution of values generated in step 270 .
- steps 276 , 278 , 280steps 264 , 266 , 268 and 270 , 272 , 274 may be repeated further times for other cell types of interest (i.e., up to cell type n) in order to generate an average relative blood vessel location index and a corresponding index of dispersion for each cell type of interest in the population.
- steps 264 , 266 , 268 and 270 , 272 , 274may be repeated further times for other cell types of interest (i.e., up to cell type n) in order to generate an average relative blood vessel location index and a corresponding index of dispersion for each cell type of interest in the population.
- step 282all of the structural indices associated with the population of interest and described above are stored in a tissue data base using, for example, a data structure such as that shown in FIG. 5 .
- a data structuresuch as that shown in FIG. 5 .
- a separate data structure of the form shown in FIG. 5may be generated for each layer of interest.
- FIG. 3there is shown a flow diagram of method 300 for profiling a sample of normal tissue specimens obtained from a subset of a population of subjects with shared characteristics in order to generate a plurality of mechanical indices that correspond to statistically significant representations of characteristics of tissue associated with the population.
- mechanical testssuch as, for example, tensile strength and mechanical elasticity tests, are applied to each specimen from the sample selected in step 100 .
- the mechanical testsmay be applied to a plurality of sections in each tissue specimen in the sample.
- step 302the information from the mechanical tests is analyzed in order to generate a distribution of elasticity values associated with the specimens in the sample.
- the mechanical information corresponding to each analyzed section of each specimenis analyzed in order to determine the elasticity of the particular section.
- a distribution of elasticity values for the populationmay then be obtained.
- an average elasticity index representative of an average elasticity of the populationis calculated by taking the statistical average (e.g., mean, median or mode) of the distribution of values generated in step 302 .
- an index of dispersion about the average elasticity of the populationis calculated by, for example, taking the standard deviation, standard error, or standard error of the mean of the distribution of values generated in step 302 .
- step 308the information from the mechanical tests is analyzed in order to generate a distribution of breaking strength values associated with the specimens in the sample.
- the mechanical information corresponding to each analyzed section of each specimenis analyzed in order to determine the breaking strength of the particular section.
- a distribution of breaking strength values for the populationmay then be obtained.
- an average breaking strength index representative of an average breaking strength of the populationis calculated by taking the statistical average (e.g., mean, median or mode) of the distribution of values generated in step 308 .
- an index of dispersion about the average breaking strength of the populationis calculated by, for example, taking the standard deviation, standard error, or standard error of the mean of the distribution of values generated in step 308 .
- step 314all of the mechanical indices associated with the population of interest and described above are stored in a tissue data base using, for example, a data structure such as that shown in FIG. 6 .
- a data structuresuch as that shown in FIG. 6 .
- a separate data structure of the form shown in FIG. 6may be generated for each layer of interest.
- a cell function assayis applied to each specimen from the sample selected in step 100 .
- the cell function assay(s)that may be used for a given tissue population include, for example, DNA content, mRNA content, protein content, ion content, lipid content, and their respective individual elements such specific genes, specific mRNA, specific proteins, specific ions, and specific lipid content assays.
- one or more assaysare applied to a plurality of sections in each tissue specimen in the sample.
- step 404the cell function information from step 402 is analyzed in order to identify types of DNA that are present in the specimens in the sample.
- the types of DNA identified for analysispreferably correspond to the types of DNA that distinguish the tissue population of interest from other tissue populations.
- step 406four cell function indices are determined for each type of DNA that was identified in step 404 .
- the following indicesare determined in step 404 : (i) the average amount of the particular type of DNA in the specimens in the sample, (ii) an index of dispersion associated with the measured average amount of the particular type of DNA, (iii) the average relative location of the particular type of DNA in the specimens in the sample, and (iv) an index of dispersion associated with the measured average relative location of the particular type of DNA.
- the average amount of the particular type of DNA in the specimens in the sample and the index of dispersion associated with the measured average amount of the particular type of DNAare determined by first analyzing the cell function information corresponding to each section of each specimen in the sample in order to determine the average amount of the particular type of DNA in each such section. By performing such an analysis on each section of each specimen in the sample, a distribution of DNA amount values for the particular type of DNA may then be obtained. An average amount index representative of an average amount of the particular type of DNA in the population is then calculated by taking the statistical average of this distribution. Similarly, an index of dispersion about the average amount of the particular type of DNA in the population is calculated by, for example, taking the standard deviation, standard error, or standard error of the mean of the distribution of DNA amount values obtained for the particular type of DNA from the sample.
- the average relative location of the particular type of DNA in the specimens in the sample and the index of dispersion associated with the measured average relative location of the particular type of DNAare determined by first analyzing the cell function information corresponding to each section of each specimen in the sample in order to determine the average relative location of the particular type of DNA in each such section. By performing such an analysis on each section of each specimen in the sample, a distribution of DNA relative location values for the particular type of DNA may then be obtained. An average relative location index representative of an average relative location of the particular type of DNA in the population is then calculated by taking the statistical average of this distribution. Similarly, an index of dispersion about the average relative location of the particular type of DNA in the population is calculated by, for example, taking the standard deviation, standard error, or standard error of the mean of the distribution of DNA relative location values obtained for the particular type of DNA from the sample.
- step 408the cell function information from step 402 is analyzed in order to identify types of mRNA that are present in the specimens in the sample.
- the types of mRNA identified for analysispreferably correspond to the types of mRNA that distinguish the tissue population of interest from other tissue populations.
- step 410four cell function indices are determined for each type of mRNA that was identified in step 408 .
- the following indicesare determined in step 410 : (i) the average amount of the particular type of mRNA in the specimens in the sample, (ii) an index of dispersion associated with the measured average amount of the particular type of mRNA, (iii) the average relative location of the particular type of mRNA in the specimens in the sample, and (iv) an index of dispersion associated with the measured average relative location of the particular type of mRNA.
- the average amount of the particular type of mRNA in the specimens in the sample and the index of dispersion associated with the measured average amount of the particular type of mRNAare determined by first analyzing the cell function information corresponding to each section of each specimen in the sample in order to determine the average amount of the particular type of mRNA in each such section. By performing such an analysis on each section of each specimen in the sample, a distribution of mRNA amount values for the particular type of mRNA may then be obtained. An average amount index representative of an average amount of the particular type of mRNA in the population is then calculated by taking the statistical average of this distribution.
- an index of dispersion about the average amount of the particular type of mRNA in the populationis calculated by, for example, taking the standard deviation, standard error, or standard error of the mean of the distribution of mRNA amount values obtained for the particular type of mRNA from the sample.
- the average relative location of the particular type of mRNA in the specimens in the sample and the index of dispersion associated with the measured average relative location of the particular type of mRNAare determined by first analyzing the cell function information corresponding to each section of each specimen in the sample in order to determine the average relative location of the particular type of mRNA in each such section. By performing such an analysis on each section of each specimen in the sample, a distribution of mRNA relative location values for the particular type of mRNA may then be obtained. An average relative location index representative of an average relative location of the particular type of mRNA in the population is then calculated by taking the statistical average of this distribution.
- an index of dispersion about the average relative location of the particular type of mRNA in the populationis calculated by, for example, taking the standard deviation, standard error, or standard error of the mean of the distribution of mRNA relative location values obtained for the particular type of mRNA from the sample.
- step 412the cell function information from step 402 is analyzed in order to identify types of cellular proteins that are present in the specimens in the sample.
- the types of cellular proteins identified for analysispreferably correspond to the types of cellular proteins that distinguish the tissue population of interest from other tissue populations.
- step 414four cell function indices are determined for each type of cellular protein that was identified in step 412 .
- the following indicesare determined in step 414 : (i) the average amount of the particular type of cellular protein in the specimens in the sample, (ii) an index of dispersion associated with the measured average amount of the particular type of cellular protein, (iii) the average relative location of the particular type of cellular protein in the specimens in the sample, and (iv) an index of dispersion associated with the measured average relative location of the particular type of cellular protein.
- the average amount of the particular type of cellular protein in the specimens in the sample and the index of dispersion associated with the measured average amount of the particular type of cellular proteinare determined by first analyzing the cell function information corresponding to each section of each specimen in the sample in order to determine the average amount of the particular type of cellular protein in each such section. By performing such an analysis on each section of each specimen in the sample, a distribution of cellular protein amount values for the particular type of cellular protein may then be obtained. An average amount index representative of an average amount of the particular type of cellular protein in the population is then calculated by taking the statistical average of this distribution.
- an index of dispersion about the average amount of the particular type of cellular protein in the populationis calculated by, for example, taking the standard deviation, standard error, or standard error of the mean of the distribution of cellular protein amount values obtained for the particular type of cellular protein from the sample.
- the average relative location of the particular type of cellular protein in the specimens in the sample and the index of dispersion associated with the measured average relative location of the particular type of cellular proteinare determined by first analyzing the cell function information corresponding to each section of each specimen in the sample in order to determine the average relative location of the particular type of cellular protein in each such section. By performing such an analysis on each section of each specimen in the sample, a distribution of cellular protein relative location values for the particular type of cellular protein may then be obtained. An average relative location index representative of an average relative location of the particular type of cellular protein in the population is then calculated by taking the statistical average of this distribution.
- an index of dispersion about the average relative location of the particular type of cellular protein in the populationis calculated by, for example, taking the standard deviation, standard error, or standard error of the mean of the distribution of cellular protein relative location values obtained for the particular type of cellular protein from the sample.
- step 416the cell function information from step 402 is analyzed in order to identify types of cellular lipids that are present in the specimens in the sample.
- the types of cellular lipids identified for analysispreferably correspond to the types of cellular lipids that distinguish the tissue population of interest from other tissue populations.
- step 418four cell function indices are determined for each type of cellular lipid that was identified in step 416 .
- the following indicesare determined in step 418 : (i) the average amount of the particular type of cellular lipid in the specimens in the sample, (ii) an index of dispersion associated with the measured average amount of the particular type of cellular lipid, (iii) the average relative location of the particular type of cellular lipid in the specimens in the sample, and (iv) an index of dispersion associated with the measured average relative location of the particular type of cellular lipid.
- the average amount of the particular type of cellular lipid in the specimens in the sample and the index of dispersion associated with the measured average amount of the particular type of cellular lipidare determined by first analyzing the cell function information corresponding to each section of each specimen in the sample in order to determine the average amount of the particular type of cellular lipid in each such section. By performing such an analysis on each section of each specimen in the sample, a distribution of cellular lipid amount values for the particular type of cellular lipid may then be obtained. An average amount index representative of an average amount of the particular type of cellular lipid in the population is then calculated by taking the statistical average of this distribution.
- an index of dispersion about the average amount of the particular type of cellular lipid in the populationis calculated by, for example, taking the standard deviation, standard error, or standard error of the mean of the distribution of cellular lipid amount values obtained for the particular type of cellular lipid from the sample.
- the average relative location of the particular type of cellular lipid in the specimens in the sample and the index of dispersion associated with the measured average relative location of the particular type of cellular lipidare determined by first analyzing the cell function information corresponding to each section of each specimen in the sample in order to determine the average relative location of the particular type of cellular lipid in each such section. By performing such an analysis on each section of each specimen in the sample, a distribution of cellular lipid relative location values for the particular type of cellular lipid may then be obtained. An average relative location index representative of an average relative location of the particular type of cellular lipid in the population is then calculated by taking the statistical average of this distribution.
- an index of dispersion about the average relative location of the particular type of cellular lipid in the populationis calculated by, for example, taking the standard deviation, standard error, or standard error of the mean of the distribution of cellular lipid relative location values obtained for the particular type of cellular lipid from the sample.
- step 420the cell function information from step 402 is analyzed in order to identify types of cellular ion distributions that are present in the specimens in the sample.
- the types of cellular ion distributions identified for analysispreferably correspond to the types of cellular ion distributions that distinguish the tissue population of interest from other tissue populations.
- step 422four cell function indices are determined for each type of cellular ion distribution that was identified in step 420 .
- the following indicesare determined in step 422 : (i) the average amount of the particular type of cellular ion distribution in the specimens in the sample, (ii) an index of dispersion associated with the measured average amount of the particular type of cellular ion distribution, (iii) the average relative location of the particular type of cellular ion distribution in the specimens in the sample, and (iv) an index of dispersion associated with the measured average relative location of the particular type of cellular ion distribution.
- the average amount of the particular type of cellular ion distribution in the specimens in the sample and the index of dispersion associated with the measured average amount of the particular type of cellular ion distributionare determined by first analyzing the cell function information corresponding to each section of each specimen in the sample in order to determine the average amount of the particular type of cellular ion distribution in each such section. By performing such an analysis on each section of each specimen in the sample, a sample distribution of cellular ion amount values for the particular type of cellular ion distribution may then be obtained. An average amount index representative of an average amount of the particular type of cellular ion distribution in the population is then calculated by taking the statistical average of the sample distribution. Similarly, an index of dispersion about the average amount of the particular type of cellular ion distribution in the population is calculated by, for example, taking the standard deviation, standard error, or standard error of the mean of the sample distribution.
- the average relative location of the particular type of cellular ion distribution in the specimens in the sample and the index of dispersion associated with the measured average relative location of the particular type of cellular ion distributionare determined by first analyzing the cell function information corresponding to each section of each specimen in the sample in order to determine the average relative location of the particular type of cellular ion distribution in each such section. By performing such an analysis on each section of each specimen in the sample, a sample distribution of relative location values for the particular type of cellular ion distribution may then be obtained. An average relative location index representative of an average relative location of the particular type of cellular ion distribution in the population is then calculated by taking the statistical average of the sample distribution. Similarly, an index of dispersion about the average relative location of the particular type of cellular ion distribution in the population is calculated by, for example, taking the standard deviation, standard error, or standard error of the mean of the sample distribution.
- step 424the cell function indices associated with the population of interest and described above are optionally used to form a cell function map representative of the population of interest.
- An exemplary cell function map formed using such cell function indicesis shown in FIG. 9 .
- the cell function mapis also preferably stored in the data base with the structural, mechanical and cell function indices associated with the population of interest.
- step 426all of the cell function indices associated with the population of interest and described above are stored in a tissue data base using, for example, a data structure such as that shown in FIGS. 7A, 7 B and 7 C. Again, for tissue populations having multiple layers, a separate data structure of the form shown in FIGS. 7A, 7 B and 7 C may be generated for each layer of interest.
- the cell function mapis also preferably stored in the data base with the cell function indices associated with the population of interest.
- process 1000 described abovemay be repeated for each tissue population of interest.
- the present inventionmay be used to generate a data base such as that shown in FIG. 8, which includes structural, mechanical and cell function indices for many different tissue populations.
- the data base shown in FIG. 8also optionally includes correlation values (as discussed above) and a cell function map for each population of interest.
- process 1000is used to generate a database that includes structural, mechanical and cell function indices and optionally the correlation values and cell function map information discussed above for each of the following tissue populations: normal intestine tissue, normal cartilage tissue, normal eye tissue, normal bone tissue, normal fat tissue, normal muscle tissue, normal kidney tissue, normal brain tissue, normal heart tissue, normal liver tissue, normal skin tissue, normal pleura tissue, normal peritoneum tissue, normal pericardium tissue, normal dura-mater tissue, normal oral-nasal mucus membrane tissue, normal pancreas tissue, normal spleen tissue, normal gall bladder tissue, normal blood vessel tissue, normal bladder tissue, normal uterus tissue, normal ovarian tissue, normal urethra tissue, normal penile tissue, normal vaginal tissue, normal esophagus tissue, normal anus tissue, normal adrenal gland tissue, normal ligament tissue, normal intervertebral disk tissue, normal bursa tissue, normal meniscus tissue, normal fascia tissue, normal bone marrow tissue, normal tendon tissue, normal pulle
- process 1000is used to generate a database that includes multiple sets of structural, mechanical and cell function indices and optionally the correlation values and cell function map information discussed above for each of the tissue types set forth in the paragraph above.
- tissue typee.g., normal lung tissue
- multiple tissue populationsare defined based on age bracket, race and/or gender.
- a first normal lung tissue populationwill include lung tissue from Caucasian males between ages x-y;
- a second normal lung tissue populationwill include lung tissue from Asian males between ages x-y;
- a third normal lung tissue populationwill include lung tissue from Caucasian females between ages x-y; and so on.
- a separate set of structural, mechanical and cell function indices and optionally the correlation values and cell function map information discussed aboveis determined using process 1000 for each of the different lung tissue populations and then stored in the tissue information database.
- the different populations associated with a given tissue typemay also be defined based on other criteria such as the physical fitness level, behavior, geographic location, nationality or disease(s) associated with the subjects having the given tissue type.
- process 1000is used to generate a database that includes structural, mechanical and cell function indices and optionally the correlation values and cell function map information discussed above for populations of abnormal tissue types, for population of tissue types associated with specific plant or animal species, for populations of non-living tissue types and for populations of virtual tissue types.
- the present inventionmay be used to profile “composite” tissue types, i.e., tissue populations that consist of two or more normal tissue types.
- the sample of normal tissue specimens profiled during process 1000correspond to first and second groups of different normal tissue specimens, wherein the first and second groups each correspond, for example, to a set of either normal intestine tissue specimens, normal cartilage tissue specimens, normal eye tissue specimens, normal bone tissue specimens, normal fat tissue specimens, normal muscle tissue specimens, normal kidney tissue specimens, normal brain tissue specimens, normal heart tissue specimens, normal liver tissue specimens, normal skin tissue specimens, normal pleura tissue specimens, normal peritoneum tissue specimens, normal pericardium tissue specimens, normal dura-mater tissue specimens, normal oral-nasal mucus membrane tissue specimens, normal pancreas tissue specimens, normal spleen tissue specimens, normal gall bladder tissue specimens, normal blood vessel tissue specimens, normal bladder tissue specimens, normal uterus tissue specimens,
- process 1000is thus used to generate a database that includes structural, mechanical and cell function indices and optionally the correlation values and cell function map information discussed above for composite tissue types. Such information may then be used as a blueprint for design, engineering and manufacture of composite tissue designs.
- process 1000is used to generate structural, mechanical and cell function indices for each tissue population of interest. It will be understood by those skilled in the art that all such indices need not be generated for every tissue population of interest, and that the present invention can be used for rational design without the use of all of the indices described herein. For example, for a particular tissue population, only selected ones of the structural indices described herein may be generated and used for the design and manufacture of engineered tissue.
- the tissue database described hereinis used to provide information representative of a plurality of tissue types to subscribers over a computer network, such as the internet. Subscribers to such information would include, for example, persons or businesses in the tissue engineering, drug design, gene discovery and genomics research fields.
- each subscriberis granted access to all or part of the database (e.g., a subscriber may granted access to information corresponding to only a particular tissue type or a particular tissue population) based on a subscription fee paid by the user.
- the subscribersmay also use such information to classify tissue specimens (e.g., human tissue specimens, animal tissue specimens, plant tissue specimens, food tissue specimens, or manufactured tissue specimens) provided by the subscriber.
- tissue specimense.g., human tissue specimens, animal tissue specimens, plant tissue specimens, food tissue specimens, or manufactured tissue specimens
- the usercan measure parameters (e.g., structural, mechanical and/or cell function indices) associated with the subscriber's tissue specimens (using the techniques described above) and then compare this information to the corresponding parameters for normal tissue in the database in order to classify the subscriber's tissue specimens as either normal or abnormal.
- a subscribercan assess the normalcy of subscriber-supplied tissue specimens which are believed to correspond to normal lung tissue specimens by retrieving the structural, mechanical and/or cell function indices corresponding to normal lung tissue stored in the database, and then comparing these stored indices to corresponding parameters measured from the subscriber-supplied samples. To the extent that the measured parameters deviate from the indices stored in the database for a given subscriber-supplied specimen by more than a threshold amount, the subscriber-supplied specimen will be classified as abnormal.
- measured parameters associated with the subscriber-supplied tissue samplesmay be compared to the tissue information stored in the database in order to identify normal elements of such manufactured tissue specimens in cases where, for example, such manufactured tissue specimens do not appear normal in total but contain elements that appear and/or function normally.
- the classification processcan also be performed by the party responsible for creation of the database, in which case the user of the database would likely access the tissue information stored in the database without payment of the subscription fee mentioned above.
Landscapes
- Life Sciences & Earth Sciences (AREA)
- Health & Medical Sciences (AREA)
- Engineering & Computer Science (AREA)
- Molecular Biology (AREA)
- Immunology (AREA)
- Biomedical Technology (AREA)
- Chemical & Material Sciences (AREA)
- Hematology (AREA)
- Urology & Nephrology (AREA)
- Physics & Mathematics (AREA)
- Medicinal Chemistry (AREA)
- Pathology (AREA)
- Cell Biology (AREA)
- Food Science & Technology (AREA)
- Biotechnology (AREA)
- Microbiology (AREA)
- Analytical Chemistry (AREA)
- Biochemistry (AREA)
- General Health & Medical Sciences (AREA)
- General Physics & Mathematics (AREA)
- Tropical Medicine & Parasitology (AREA)
- Bioinformatics & Cheminformatics (AREA)
- Bioinformatics & Computational Biology (AREA)
- Biophysics (AREA)
- Proteomics, Peptides & Aminoacids (AREA)
- Investigating Or Analysing Biological Materials (AREA)
- Apparatus Associated With Microorganisms And Enzymes (AREA)
- Measuring Or Testing Involving Enzymes Or Micro-Organisms (AREA)
Abstract
Description
| TABLE I | |
| Correlation | |
| Operation No. | |
| 1 | Cell Density and |
| 2 | Blood Vessel Density and |
| 3 | Matrix Density and Breaking Strength |
| 4 | Blood Vessel Location and Density of Adjacent Cells |
| 5 | Layer Thickness and Cell Density |
Claims (87)
Priority Applications (9)
| Application Number | Priority Date | Filing Date | Title |
|---|---|---|---|
| US09/338,909US6611833B1 (en) | 1999-06-23 | 1999-06-23 | Methods for profiling and classifying tissue using a database that includes indices representative of a tissue population |
| EP00944845AEP1194775A4 (en) | 1999-06-23 | 2000-06-23 | METHODS OF CREATING A TISSUE PROFILE AND CLASSIFICATION USING A DATABASE CONTAINING TISSUE POPULATION INDICES |
| PCT/US2000/017391WO2000079269A1 (en) | 1999-06-23 | 2000-06-23 | Methods for profiling and classifying tissue using a database that includes indices representative of a tissue population |
| AU58880/00AAU5888000A (en) | 1999-06-23 | 2000-06-23 | Methods for profiling and classifying tissue using a database that includes indices representative of a tissue population |
| CA2389220ACA2389220C (en) | 1999-06-23 | 2000-06-23 | Methods for profiling and classifying tissue using a database that includes indices representative of a tissue population |
| JP2001505187AJP2003502669A (en) | 1999-06-23 | 2000-06-23 | Method of profiling and classifying an organization using a database containing indices representing the population of the organization |
| US10/041,254US6993170B2 (en) | 1999-06-23 | 2002-01-07 | Method for quantitative analysis of blood vessel structure |
| US10/646,578US20040117343A1 (en) | 1999-06-23 | 2003-08-22 | Methods for profiling and classifying tissue using a database that includes indices representative of a tissue population |
| US11/233,897US20060029927A1 (en) | 1999-06-23 | 2005-09-23 | Method for quantitative analysis of blood vessel structure |
Applications Claiming Priority (1)
| Application Number | Priority Date | Filing Date | Title |
|---|---|---|---|
| US09/338,909US6611833B1 (en) | 1999-06-23 | 1999-06-23 | Methods for profiling and classifying tissue using a database that includes indices representative of a tissue population |
Related Child Applications (4)
| Application Number | Title | Priority Date | Filing Date |
|---|---|---|---|
| US09/338,908Continuation-In-PartUS6581011B1 (en) | 1999-06-23 | 1999-06-23 | Online database that includes indices representative of a tissue population |
| US10/041,254Continuation-In-PartUS6993170B2 (en) | 1999-06-23 | 2002-01-07 | Method for quantitative analysis of blood vessel structure |
| US10/646,578ContinuationUS20040117343A1 (en) | 1999-06-23 | 2003-08-22 | Methods for profiling and classifying tissue using a database that includes indices representative of a tissue population |
| US11/233,897Continuation-In-PartUS20060029927A1 (en) | 1999-06-23 | 2005-09-23 | Method for quantitative analysis of blood vessel structure |
Publications (1)
| Publication Number | Publication Date |
|---|---|
| US6611833B1true US6611833B1 (en) | 2003-08-26 |
Family
ID=23326653
Family Applications (2)
| Application Number | Title | Priority Date | Filing Date |
|---|---|---|---|
| US09/338,909Expired - LifetimeUS6611833B1 (en) | 1999-06-23 | 1999-06-23 | Methods for profiling and classifying tissue using a database that includes indices representative of a tissue population |
| US10/646,578AbandonedUS20040117343A1 (en) | 1999-06-23 | 2003-08-22 | Methods for profiling and classifying tissue using a database that includes indices representative of a tissue population |
Family Applications After (1)
| Application Number | Title | Priority Date | Filing Date |
|---|---|---|---|
| US10/646,578AbandonedUS20040117343A1 (en) | 1999-06-23 | 2003-08-22 | Methods for profiling and classifying tissue using a database that includes indices representative of a tissue population |
Country Status (6)
| Country | Link |
|---|---|
| US (2) | US6611833B1 (en) |
| EP (1) | EP1194775A4 (en) |
| JP (1) | JP2003502669A (en) |
| AU (1) | AU5888000A (en) |
| CA (1) | CA2389220C (en) |
| WO (1) | WO2000079269A1 (en) |
Cited By (97)
| Publication number | Priority date | Publication date | Assignee | Title |
|---|---|---|---|---|
| US20020028010A1 (en)* | 2000-09-05 | 2002-03-07 | Fuji Photo Film Co., Ltd. | Method and apparatus for outputting optical tomographic image diagnostic data |
| US20020087511A1 (en)* | 1999-09-02 | 2002-07-04 | Johnson Peter C. | Methods for profiling and manufacturing tissue using a database that includes indices representative of a tissue population |
| US20020183631A1 (en)* | 2001-05-08 | 2002-12-05 | Unix Electronics Co., Ltd. | Method and apparatus for detecting cardiovascular disease |
| US20030149535A1 (en)* | 2001-07-17 | 2003-08-07 | Yukio Sudo | Method for quantifying nucleic acid by cell counting |
| US20050014131A1 (en)* | 2003-07-16 | 2005-01-20 | Cytokinetics, Inc. | Methods and apparatus for investigating side effects |
| US20050108753A1 (en)* | 2003-11-18 | 2005-05-19 | Olivier Saidi | Support vector regression for censored data |
| US20050165290A1 (en)* | 2003-11-17 | 2005-07-28 | Angeliki Kotsianti | Pathological tissue mapping |
| US20050197982A1 (en)* | 2004-02-27 | 2005-09-08 | Olivier Saidi | Methods and systems for predicting occurrence of an event |
| US20050262031A1 (en)* | 2003-07-21 | 2005-11-24 | Olivier Saidi | Systems and methods for treating, diagnosing and predicting the occurrence of a medical condition |
| US20060029927A1 (en)* | 1999-06-23 | 2006-02-09 | Johnson Peter C | Method for quantitative analysis of blood vessel structure |
| US20060064248A1 (en)* | 2004-08-11 | 2006-03-23 | Olivier Saidi | Systems and methods for automated diagnosis and grading of tissue images |
| US20070061323A1 (en)* | 2005-09-14 | 2007-03-15 | National Institute Of Information And Communications Technology | Apparatus and method for displaying data, and program thereof |
| US20070165921A1 (en)* | 2006-01-17 | 2007-07-19 | Gad Agam | Method for enhancing diagnostic images using vessel reconstruction |
| US20090003789A1 (en)* | 2004-07-02 | 2009-01-01 | The General Hospital Corporation | Imaging system and related techniques |
| KR100963689B1 (en) | 2008-05-13 | 2010-06-15 | 대한민국 | How to classify human tissue |
| US7761139B2 (en) | 2003-01-24 | 2010-07-20 | The General Hospital Corporation | System and method for identifying tissue using low-coherence interferometry |
| US7796270B2 (en) | 2006-01-10 | 2010-09-14 | The General Hospital Corporation | Systems and methods for generating data based on one or more spectrally-encoded endoscopy techniques |
| US7797119B2 (en) | 2002-01-24 | 2010-09-14 | The General Hospital Corporation | Apparatus and method for rangings and noise reduction of low coherence interferometry LCI and optical coherence tomography OCT signals by parallel detection of spectral bands |
| US7864822B2 (en) | 2003-06-06 | 2011-01-04 | The General Hospital Corporation | Process and apparatus for a wavelength tuning source |
| US7889348B2 (en) | 2005-10-14 | 2011-02-15 | The General Hospital Corporation | Arrangements and methods for facilitating photoluminescence imaging |
| US7898656B2 (en) | 2008-04-30 | 2011-03-01 | The General Hospital Corporation | Apparatus and method for cross axis parallel spectroscopy |
| US7920271B2 (en) | 2006-08-25 | 2011-04-05 | The General Hospital Corporation | Apparatus and methods for enhancing optical coherence tomography imaging using volumetric filtering techniques |
| US7933021B2 (en) | 2007-10-30 | 2011-04-26 | The General Hospital Corporation | System and method for cladding mode detection |
| US7949019B2 (en) | 2007-01-19 | 2011-05-24 | The General Hospital | Wavelength tuning source based on a rotatable reflector |
| US7969578B2 (en) | 2003-10-27 | 2011-06-28 | The General Hospital Corporation | Method and apparatus for performing optical imaging using frequency-domain interferometry |
| US7982879B2 (en) | 2006-02-24 | 2011-07-19 | The General Hospital Corporation | Methods and systems for performing angle-resolved fourier-domain optical coherence tomography |
| US7995210B2 (en) | 2004-11-24 | 2011-08-09 | The General Hospital Corporation | Devices and arrangements for performing coherence range imaging using a common path interferometer |
| US8018598B2 (en) | 2004-05-29 | 2011-09-13 | The General Hospital Corporation | Process, system and software arrangement for a chromatic dispersion compensation using reflective layers in optical coherence tomography (OCT) imaging |
| US8045177B2 (en) | 2007-04-17 | 2011-10-25 | The General Hospital Corporation | Apparatus and methods for measuring vibrations using spectrally-encoded endoscopy |
| US8050747B2 (en) | 2001-05-01 | 2011-11-01 | The General Hospital Corporation | Method and apparatus for determination of atherosclerotic plaque type by measurement of tissue optical properties |
| US8054468B2 (en) | 2003-01-24 | 2011-11-08 | The General Hospital Corporation | Apparatus and method for ranging and noise reduction of low coherence interferometry LCI and optical coherence tomography OCT signals by parallel detection of spectral bands |
| US8081316B2 (en) | 2004-08-06 | 2011-12-20 | The General Hospital Corporation | Process, system and software arrangement for determining at least one location in a sample using an optical coherence tomography |
| US8097864B2 (en) | 2009-01-26 | 2012-01-17 | The General Hospital Corporation | System, method and computer-accessible medium for providing wide-field superresolution microscopy |
| US8145018B2 (en) | 2006-01-19 | 2012-03-27 | The General Hospital Corporation | Apparatus for obtaining information for a structure using spectrally-encoded endoscopy techniques and methods for producing one or more optical arrangements |
| US8149418B2 (en) | 2005-09-29 | 2012-04-03 | The General Hospital Corporation | Method and apparatus for optical imaging via spectral encoding |
| US8175685B2 (en) | 2006-05-10 | 2012-05-08 | The General Hospital Corporation | Process, arrangements and systems for providing frequency domain imaging of a sample |
| US8174702B2 (en) | 2003-01-24 | 2012-05-08 | The General Hospital Corporation | Speckle reduction in optical coherence tomography by path length encoded angular compounding |
| US8208995B2 (en) | 2004-08-24 | 2012-06-26 | The General Hospital Corporation | Method and apparatus for imaging of vessel segments |
| US20120207360A1 (en)* | 2011-02-11 | 2012-08-16 | Courosh Mehanian | Systems and Methods for Object Identification |
| US8249696B2 (en) | 2007-12-19 | 2012-08-21 | Depuy Spine, Inc. | Smart pedicle tool |
| US8351665B2 (en)* | 2005-04-28 | 2013-01-08 | The General Hospital Corporation | Systems, processes and software arrangements for evaluating information associated with an anatomical structure by an optical coherence ranging technique |
| USRE44042E1 (en) | 2004-09-10 | 2013-03-05 | The General Hospital Corporation | System and method for optical coherence imaging |
| US8593619B2 (en) | 2008-05-07 | 2013-11-26 | The General Hospital Corporation | System, method and computer-accessible medium for tracking vessel motion during three-dimensional coronary artery microscopy |
| US8770954B2 (en) | 2010-02-10 | 2014-07-08 | KickSmart International, Inc. | Human-powered irrigation pump |
| US8804126B2 (en) | 2010-03-05 | 2014-08-12 | The General Hospital Corporation | Systems, methods and computer-accessible medium which provide microscopic images of at least one anatomical structure at a particular resolution |
| US8838213B2 (en) | 2006-10-19 | 2014-09-16 | The General Hospital Corporation | Apparatus and method for obtaining and providing imaging information associated with at least one portion of a sample, and effecting such portion(s) |
| US8861910B2 (en) | 2008-06-20 | 2014-10-14 | The General Hospital Corporation | Fused fiber optic coupler arrangement and method for use thereof |
| US20140350434A1 (en)* | 2008-10-03 | 2014-11-27 | Hlz Innovation, Llc | Adjustable pneumatic supporting surface |
| US8922781B2 (en) | 2004-11-29 | 2014-12-30 | The General Hospital Corporation | Arrangements, devices, endoscopes, catheters and methods for performing optical imaging by simultaneously illuminating and detecting multiple points on a sample |
| US8937724B2 (en) | 2008-12-10 | 2015-01-20 | The General Hospital Corporation | Systems and methods for extending imaging depth range of optical coherence tomography through optical sub-sampling |
| US8965487B2 (en) | 2004-08-24 | 2015-02-24 | The General Hospital Corporation | Process, system and software arrangement for measuring a mechanical strain and elastic properties of a sample |
| USRE45512E1 (en) | 2004-09-29 | 2015-05-12 | The General Hospital Corporation | System and method for optical coherence imaging |
| US9060689B2 (en) | 2005-06-01 | 2015-06-23 | The General Hospital Corporation | Apparatus, method and system for performing phase-resolved optical frequency domain imaging |
| US9069130B2 (en) | 2010-05-03 | 2015-06-30 | The General Hospital Corporation | Apparatus, method and system for generating optical radiation from biological gain media |
| US9087368B2 (en) | 2006-01-19 | 2015-07-21 | The General Hospital Corporation | Methods and systems for optical imaging or epithelial luminal organs by beam scanning thereof |
| US9176319B2 (en) | 2007-03-23 | 2015-11-03 | The General Hospital Corporation | Methods, arrangements and apparatus for utilizing a wavelength-swept laser using angular scanning and dispersion procedures |
| US9178330B2 (en) | 2009-02-04 | 2015-11-03 | The General Hospital Corporation | Apparatus and method for utilization of a high-speed optical wavelength tuning source |
| US9186066B2 (en) | 2006-02-01 | 2015-11-17 | The General Hospital Corporation | Apparatus for applying a plurality of electro-magnetic radiations to a sample |
| US9282931B2 (en) | 2000-10-30 | 2016-03-15 | The General Hospital Corporation | Methods for tissue analysis |
| US9295391B1 (en) | 2000-11-10 | 2016-03-29 | The General Hospital Corporation | Spectrally encoded miniature endoscopic imaging probe |
| US9330092B2 (en) | 2011-07-19 | 2016-05-03 | The General Hospital Corporation | Systems, methods, apparatus and computer-accessible-medium for providing polarization-mode dispersion compensation in optical coherence tomography |
| US9341783B2 (en) | 2011-10-18 | 2016-05-17 | The General Hospital Corporation | Apparatus and methods for producing and/or providing recirculating optical delay(s) |
| US9375158B2 (en) | 2007-07-31 | 2016-06-28 | The General Hospital Corporation | Systems and methods for providing beam scan patterns for high speed doppler optical frequency domain imaging |
| US9415550B2 (en) | 2012-08-22 | 2016-08-16 | The General Hospital Corporation | System, method, and computer-accessible medium for fabrication miniature endoscope using soft lithography |
| US9441948B2 (en) | 2005-08-09 | 2016-09-13 | The General Hospital Corporation | Apparatus, methods and storage medium for performing polarization-based quadrature demodulation in optical coherence tomography |
| US9510758B2 (en) | 2010-10-27 | 2016-12-06 | The General Hospital Corporation | Apparatus, systems and methods for measuring blood pressure within at least one vessel |
| US9557154B2 (en) | 2010-05-25 | 2017-01-31 | The General Hospital Corporation | Systems, devices, methods, apparatus and computer-accessible media for providing optical imaging of structures and compositions |
| US9615748B2 (en) | 2009-01-20 | 2017-04-11 | The General Hospital Corporation | Endoscopic biopsy apparatus, system and method |
| US9629528B2 (en) | 2012-03-30 | 2017-04-25 | The General Hospital Corporation | Imaging system, method and distal attachment for multidirectional field of view endoscopy |
| US9733460B2 (en) | 2014-01-08 | 2017-08-15 | The General Hospital Corporation | Method and apparatus for microscopic imaging |
| US9777053B2 (en) | 2006-02-08 | 2017-10-03 | The General Hospital Corporation | Methods, arrangements and systems for obtaining information associated with an anatomical sample using optical microscopy |
| US9784681B2 (en) | 2013-05-13 | 2017-10-10 | The General Hospital Corporation | System and method for efficient detection of the phase and amplitude of a periodic modulation associated with self-interfering fluorescence |
| US9795301B2 (en) | 2010-05-25 | 2017-10-24 | The General Hospital Corporation | Apparatus, systems, methods and computer-accessible medium for spectral analysis of optical coherence tomography images |
| US9955910B2 (en) | 2005-10-14 | 2018-05-01 | Aranz Healthcare Limited | Method of monitoring a surface feature and apparatus therefor |
| US9968261B2 (en) | 2013-01-28 | 2018-05-15 | The General Hospital Corporation | Apparatus and method for providing diffuse spectroscopy co-registered with optical frequency domain imaging |
| US10011864B2 (en)* | 2000-07-28 | 2018-07-03 | Eolas Technologies Inc. | Multidimensional microdissection and morphological reconstruction of genomic or proteomic expression activity |
| US10013527B2 (en) | 2016-05-02 | 2018-07-03 | Aranz Healthcare Limited | Automatically assessing an anatomical surface feature and securely managing information related to the same |
| US10058250B2 (en) | 2013-07-26 | 2018-08-28 | The General Hospital Corporation | System, apparatus and method for utilizing optical dispersion for fourier-domain optical coherence tomography |
| US10117576B2 (en) | 2013-07-19 | 2018-11-06 | The General Hospital Corporation | System, method and computer accessible medium for determining eye motion by imaging retina and providing feedback for acquisition of signals from the retina |
| US10228556B2 (en) | 2014-04-04 | 2019-03-12 | The General Hospital Corporation | Apparatus and method for controlling propagation and/or transmission of electromagnetic radiation in flexible waveguide(s) |
| US10241028B2 (en) | 2011-08-25 | 2019-03-26 | The General Hospital Corporation | Methods, systems, arrangements and computer-accessible medium for providing micro-optical coherence tomography procedures |
| US10285568B2 (en) | 2010-06-03 | 2019-05-14 | The General Hospital Corporation | Apparatus and method for devices for imaging structures in or at one or more luminal organs |
| US10426548B2 (en) | 2006-02-01 | 2019-10-01 | The General Hosppital Corporation | Methods and systems for providing electromagnetic radiation to at least one portion of a sample using conformal laser therapy procedures |
| US10478072B2 (en) | 2013-03-15 | 2019-11-19 | The General Hospital Corporation | Methods and system for characterizing an object |
| US10534129B2 (en) | 2007-03-30 | 2020-01-14 | The General Hospital Corporation | System and method providing intracoronary laser speckle imaging for the detection of vulnerable plaque |
| US10736494B2 (en) | 2014-01-31 | 2020-08-11 | The General Hospital Corporation | System and method for facilitating manual and/or automatic volumetric imaging with real-time tension or force feedback using a tethered imaging device |
| US10835110B2 (en) | 2008-07-14 | 2020-11-17 | The General Hospital Corporation | Apparatus and method for facilitating at least partial overlap of dispersed ration on at least one sample |
| US10874302B2 (en) | 2011-11-28 | 2020-12-29 | Aranz Healthcare Limited | Handheld skin measuring or monitoring device |
| US10893806B2 (en) | 2013-01-29 | 2021-01-19 | The General Hospital Corporation | Apparatus, systems and methods for providing information regarding the aortic valve |
| US10912462B2 (en) | 2014-07-25 | 2021-02-09 | The General Hospital Corporation | Apparatus, devices and methods for in vivo imaging and diagnosis |
| US11116407B2 (en) | 2016-11-17 | 2021-09-14 | Aranz Healthcare Limited | Anatomical surface assessment methods, devices and systems |
| US11179028B2 (en) | 2013-02-01 | 2021-11-23 | The General Hospital Corporation | Objective lens arrangement for confocal endomicroscopy |
| US11452433B2 (en) | 2013-07-19 | 2022-09-27 | The General Hospital Corporation | Imaging apparatus and method which utilizes multidirectional field of view endoscopy |
| US11490826B2 (en) | 2009-07-14 | 2022-11-08 | The General Hospital Corporation | Apparatus, systems and methods for measuring flow and pressure within a vessel |
| US11490797B2 (en) | 2012-05-21 | 2022-11-08 | The General Hospital Corporation | Apparatus, device and method for capsule microscopy |
| US11903723B2 (en) | 2017-04-04 | 2024-02-20 | Aranz Healthcare Limited | Anatomical surface assessment methods, devices and systems |
| US12039726B2 (en) | 2019-05-20 | 2024-07-16 | Aranz Healthcare Limited | Automated or partially automated anatomical surface assessment methods, devices and systems |
Families Citing this family (1)
| Publication number | Priority date | Publication date | Assignee | Title |
|---|---|---|---|---|
| US8052622B2 (en)* | 2009-09-02 | 2011-11-08 | Artann Laboratories Inc | Methods for characterizing vaginal tissue elasticity |
Citations (17)
| Publication number | Priority date | Publication date | Assignee | Title |
|---|---|---|---|---|
| US5506098A (en)* | 1991-09-04 | 1996-04-09 | Daikin Industries, Ltd. | In situ hybridization method |
| US5526258A (en) | 1990-10-10 | 1996-06-11 | Cell Analysis System, Inc. | Method and apparatus for automated analysis of biological specimens |
| US5640453A (en)* | 1994-08-11 | 1997-06-17 | Stanford Telecommunications, Inc. | Universal interactive set-top controller for downloading and playback of information and entertainment services |
| US5668634A (en)* | 1992-07-03 | 1997-09-16 | Newman; Paul Bernard David | Quality control and grading system for meat |
| US5685313A (en)* | 1994-05-31 | 1997-11-11 | Brain Monitor Ltd. | Tissue monitor |
| US5713364A (en)* | 1995-08-01 | 1998-02-03 | Medispectra, Inc. | Spectral volume microprobe analysis of materials |
| US5785663A (en)* | 1992-12-21 | 1998-07-28 | Artann Corporation | Method and device for mechanical imaging of prostate |
| US5836872A (en)* | 1989-04-13 | 1998-11-17 | Vanguard Imaging, Ltd. | Digital optical visualization, enhancement, quantification, and classification of surface and subsurface features of body surfaces |
| US5891619A (en) | 1997-01-14 | 1999-04-06 | Inphocyte, Inc. | System and method for mapping the distribution of normal and abnormal cells in sections of tissue |
| US5933519A (en) | 1994-09-20 | 1999-08-03 | Neo Path, Inc. | Cytological slide scoring apparatus |
| US5987346A (en)* | 1993-02-26 | 1999-11-16 | Benaron; David A. | Device and method for classification of tissue |
| US6026174A (en)* | 1992-10-14 | 2000-02-15 | Accumed International, Inc. | System and method for automatically detecting malignant cells and cells having malignancy-associated changes |
| US6081612A (en)* | 1997-02-28 | 2000-06-27 | Electro Optical Sciences Inc. | Systems and methods for the multispectral imaging and characterization of skin tissue |
| US6104835A (en) | 1997-11-14 | 2000-08-15 | Kla-Tencor Corporation | Automatic knowledge database generation for classifying objects and systems therefor |
| US6136955A (en)* | 1997-05-09 | 2000-10-24 | Incyte Pharmaceuticals, Inc. | Human SMT3-like protein |
| US6238342B1 (en) | 1998-05-26 | 2001-05-29 | Riverside Research Institute | Ultrasonic tissue-type classification and imaging methods and apparatus |
| US6246785B1 (en) | 1996-04-27 | 2001-06-12 | Roche Diagnostics Gmbh | Automated, microscope-assisted examination process of tissue or bodily fluid samples |
Family Cites Families (9)
| Publication number | Priority date | Publication date | Assignee | Title |
|---|---|---|---|---|
| JP3139085B2 (en)* | 1991-11-07 | 2001-02-26 | 株式会社ニコン | Apparatus and method for determining ion concentration |
| US5293772A (en)* | 1992-01-17 | 1994-03-15 | Center For Innovative Technology | Instrumentation and method for evaluating platelet performance during clotting and dissolution of blood clots and for evaluating erythrocyte flexibility |
| JPH0694706A (en)* | 1992-09-10 | 1994-04-08 | Sumitomo Metal Ind Ltd | Pathological image inspection support device |
| EP0592997A3 (en)* | 1992-10-16 | 1994-11-17 | Becton Dickinson Co | Methods and apparatus for measuring tissue section thickness. |
| NZ294720A (en)* | 1995-01-27 | 1998-06-26 | Incyte Pharma Inc | Computer system storing and analyzing microbiological data |
| US5733739A (en)* | 1995-06-07 | 1998-03-31 | Inphocyte, Inc. | System and method for diagnosis of disease by infrared analysis of human tissues and cells |
| US5837283A (en)* | 1997-03-12 | 1998-11-17 | The Regents Of The University Of California | Cationic lipid compositions targeting angiogenic endothelial cells |
| US5993844A (en)* | 1997-05-08 | 1999-11-30 | Organogenesis, Inc. | Chemical treatment, without detergents or enzymes, of tissue to form an acellular, collagenous matrix |
| JPH1119077A (en)* | 1997-06-30 | 1999-01-26 | Konica Corp | Method and device for detection of tumor shadow in radiation image |
- 1999
- 1999-06-23USUS09/338,909patent/US6611833B1/ennot_activeExpired - Lifetime
- 2000
- 2000-06-23EPEP00944845Apatent/EP1194775A4/ennot_activeWithdrawn
- 2000-06-23WOPCT/US2000/017391patent/WO2000079269A1/ennot_activeApplication Discontinuation
- 2000-06-23AUAU58880/00Apatent/AU5888000A/ennot_activeAbandoned
- 2000-06-23CACA2389220Apatent/CA2389220C/ennot_activeExpired - Lifetime
- 2000-06-23JPJP2001505187Apatent/JP2003502669A/enactivePending
- 2003
- 2003-08-22USUS10/646,578patent/US20040117343A1/ennot_activeAbandoned
Patent Citations (17)
| Publication number | Priority date | Publication date | Assignee | Title |
|---|---|---|---|---|
| US5836872A (en)* | 1989-04-13 | 1998-11-17 | Vanguard Imaging, Ltd. | Digital optical visualization, enhancement, quantification, and classification of surface and subsurface features of body surfaces |
| US5526258A (en) | 1990-10-10 | 1996-06-11 | Cell Analysis System, Inc. | Method and apparatus for automated analysis of biological specimens |
| US5506098A (en)* | 1991-09-04 | 1996-04-09 | Daikin Industries, Ltd. | In situ hybridization method |
| US5668634A (en)* | 1992-07-03 | 1997-09-16 | Newman; Paul Bernard David | Quality control and grading system for meat |
| US6026174A (en)* | 1992-10-14 | 2000-02-15 | Accumed International, Inc. | System and method for automatically detecting malignant cells and cells having malignancy-associated changes |
| US5785663A (en)* | 1992-12-21 | 1998-07-28 | Artann Corporation | Method and device for mechanical imaging of prostate |
| US5987346A (en)* | 1993-02-26 | 1999-11-16 | Benaron; David A. | Device and method for classification of tissue |
| US5685313A (en)* | 1994-05-31 | 1997-11-11 | Brain Monitor Ltd. | Tissue monitor |
| US5640453A (en)* | 1994-08-11 | 1997-06-17 | Stanford Telecommunications, Inc. | Universal interactive set-top controller for downloading and playback of information and entertainment services |
| US5933519A (en) | 1994-09-20 | 1999-08-03 | Neo Path, Inc. | Cytological slide scoring apparatus |
| US5713364A (en)* | 1995-08-01 | 1998-02-03 | Medispectra, Inc. | Spectral volume microprobe analysis of materials |
| US6246785B1 (en) | 1996-04-27 | 2001-06-12 | Roche Diagnostics Gmbh | Automated, microscope-assisted examination process of tissue or bodily fluid samples |
| US5891619A (en) | 1997-01-14 | 1999-04-06 | Inphocyte, Inc. | System and method for mapping the distribution of normal and abnormal cells in sections of tissue |
| US6081612A (en)* | 1997-02-28 | 2000-06-27 | Electro Optical Sciences Inc. | Systems and methods for the multispectral imaging and characterization of skin tissue |
| US6136955A (en)* | 1997-05-09 | 2000-10-24 | Incyte Pharmaceuticals, Inc. | Human SMT3-like protein |
| US6104835A (en) | 1997-11-14 | 2000-08-15 | Kla-Tencor Corporation | Automatic knowledge database generation for classifying objects and systems therefor |
| US6238342B1 (en) | 1998-05-26 | 2001-05-29 | Riverside Research Institute | Ultrasonic tissue-type classification and imaging methods and apparatus |
Non-Patent Citations (5)
| Title |
|---|
| Ellenberg et al. "Two-color green fluorescent protein time-lapse imaging" Biotechniques vol. 25, pp. 838-846, 1998.** |
| Jamin et al. "Highly resolved chemical imaging of living cells by using synchrotron infrared microscopy" Proc. Natl. Acad. Sci. USA, vol. 95, pp. 4837-4840, 1998.** |
| Lawrence et al. "Quantitative analysis of in situ hybridization methods for the detection of actin gene expression" Nucleic Acids Research vol. 13, pp. 1777-1799, 1985.* |
| Persoon-Rothert et al. "Oxidative stress-induced perturbations of calcium homeostasis and cell death in cultured myocytes: role of extracellular calcium" Molecular and Cellular Biochemistry vol. 136 pp. 1-9, 1994.** |
| Xing et al."Preservation of Specific RNA Distribution within the Chromatin-dpleted Nuclear Substructure Demonstrated by in Situ Hybridization Coupled with Biochemical Fractionation" The Journal of Cellular Biology vol. 112, pp. 1055-1063, 1991.** |
Cited By (157)
| Publication number | Priority date | Publication date | Assignee | Title |
|---|---|---|---|---|
| US20060029927A1 (en)* | 1999-06-23 | 2006-02-09 | Johnson Peter C | Method for quantitative analysis of blood vessel structure |
| US20020087511A1 (en)* | 1999-09-02 | 2002-07-04 | Johnson Peter C. | Methods for profiling and manufacturing tissue using a database that includes indices representative of a tissue population |
| US10011864B2 (en)* | 2000-07-28 | 2018-07-03 | Eolas Technologies Inc. | Multidimensional microdissection and morphological reconstruction of genomic or proteomic expression activity |
| US20020028010A1 (en)* | 2000-09-05 | 2002-03-07 | Fuji Photo Film Co., Ltd. | Method and apparatus for outputting optical tomographic image diagnostic data |
| US9282931B2 (en) | 2000-10-30 | 2016-03-15 | The General Hospital Corporation | Methods for tissue analysis |
| US9295391B1 (en) | 2000-11-10 | 2016-03-29 | The General Hospital Corporation | Spectrally encoded miniature endoscopic imaging probe |
| US8150496B2 (en) | 2001-05-01 | 2012-04-03 | The General Hospital Corporation | Method and apparatus for determination of atherosclerotic plaque type by measurement of tissue optical properties |
| US8050747B2 (en) | 2001-05-01 | 2011-11-01 | The General Hospital Corporation | Method and apparatus for determination of atherosclerotic plaque type by measurement of tissue optical properties |
| US20020183631A1 (en)* | 2001-05-08 | 2002-12-05 | Unix Electronics Co., Ltd. | Method and apparatus for detecting cardiovascular disease |
| US20030149535A1 (en)* | 2001-07-17 | 2003-08-07 | Yukio Sudo | Method for quantifying nucleic acid by cell counting |
| US7797119B2 (en) | 2002-01-24 | 2010-09-14 | The General Hospital Corporation | Apparatus and method for rangings and noise reduction of low coherence interferometry LCI and optical coherence tomography OCT signals by parallel detection of spectral bands |
| US7903257B2 (en) | 2002-01-24 | 2011-03-08 | The General Hospital Corporation | Apparatus and method for ranging and noise reduction of low coherence interferometry (LCI) and optical coherence tomography (OCT) signals by parallel detection of spectral bands |
| US7761139B2 (en) | 2003-01-24 | 2010-07-20 | The General Hospital Corporation | System and method for identifying tissue using low-coherence interferometry |
| US8054468B2 (en) | 2003-01-24 | 2011-11-08 | The General Hospital Corporation | Apparatus and method for ranging and noise reduction of low coherence interferometry LCI and optical coherence tomography OCT signals by parallel detection of spectral bands |
| US9226665B2 (en) | 2003-01-24 | 2016-01-05 | The General Hospital Corporation | Speckle reduction in optical coherence tomography by path length encoded angular compounding |
| US8559012B2 (en) | 2003-01-24 | 2013-10-15 | The General Hospital Corporation | Speckle reduction in optical coherence tomography by path length encoded angular compounding |
| US8174702B2 (en) | 2003-01-24 | 2012-05-08 | The General Hospital Corporation | Speckle reduction in optical coherence tomography by path length encoded angular compounding |
| US20110092823A1 (en)* | 2003-01-24 | 2011-04-21 | The General Hospital Corporation | System and Method for Identifying Tissue Using Low-Coherence Interferometry |
| US7864822B2 (en) | 2003-06-06 | 2011-01-04 | The General Hospital Corporation | Process and apparatus for a wavelength tuning source |
| US8416818B2 (en) | 2003-06-06 | 2013-04-09 | The General Hospital Corporation | Process and apparatus for a wavelength tuning source |
| USRE47675E1 (en) | 2003-06-06 | 2019-10-29 | The General Hospital Corporation | Process and apparatus for a wavelength tuning source |
| US7995627B2 (en) | 2003-06-06 | 2011-08-09 | The General Hospital Corporation | Process and apparatus for a wavelength tuning source |
| US20050014131A1 (en)* | 2003-07-16 | 2005-01-20 | Cytokinetics, Inc. | Methods and apparatus for investigating side effects |
| US7467119B2 (en) | 2003-07-21 | 2008-12-16 | Aureon Laboratories, Inc. | Systems and methods for treating, diagnosing and predicting the occurrence of a medical condition |
| US20050262031A1 (en)* | 2003-07-21 | 2005-11-24 | Olivier Saidi | Systems and methods for treating, diagnosing and predicting the occurrence of a medical condition |
| US9377290B2 (en) | 2003-10-27 | 2016-06-28 | The General Hospital Corporation | Method and apparatus for performing optical imaging using frequency-domain interferometry |
| US8705046B2 (en) | 2003-10-27 | 2014-04-22 | The General Hospital Corporation | Method and apparatus for performing optical imaging using frequency-domain interferometry |
| US7969578B2 (en) | 2003-10-27 | 2011-06-28 | The General Hospital Corporation | Method and apparatus for performing optical imaging using frequency-domain interferometry |
| US20090262993A1 (en)* | 2003-11-17 | 2009-10-22 | Aureon Laboratories, Inc. | Pathological tissue mapping |
| US20050165290A1 (en)* | 2003-11-17 | 2005-07-28 | Angeliki Kotsianti | Pathological tissue mapping |
| US7483554B2 (en)* | 2003-11-17 | 2009-01-27 | Aureon Laboratories, Inc. | Pathological tissue mapping |
| US20050108753A1 (en)* | 2003-11-18 | 2005-05-19 | Olivier Saidi | Support vector regression for censored data |
| US7505948B2 (en) | 2003-11-18 | 2009-03-17 | Aureon Laboratories, Inc. | Support vector regression for censored data |
| US7321881B2 (en) | 2004-02-27 | 2008-01-22 | Aureon Laboratories, Inc. | Methods and systems for predicting occurrence of an event |
| US20050197982A1 (en)* | 2004-02-27 | 2005-09-08 | Olivier Saidi | Methods and systems for predicting occurrence of an event |
| US7702598B2 (en) | 2004-02-27 | 2010-04-20 | Aureon Laboratories, Inc. | Methods and systems for predicting occurrence of an event |
| US20080306893A1 (en)* | 2004-02-27 | 2008-12-11 | Aureon Laboratories, Inc. | Methods and systems for predicting occurrence of an event |
| US8018598B2 (en) | 2004-05-29 | 2011-09-13 | The General Hospital Corporation | Process, system and software arrangement for a chromatic dispersion compensation using reflective layers in optical coherence tomography (OCT) imaging |
| US20090003789A1 (en)* | 2004-07-02 | 2009-01-01 | The General Hospital Corporation | Imaging system and related techniques |
| US7925133B2 (en) | 2004-07-02 | 2011-04-12 | The General Hospital Corporation | Imaging system and related techniques |
| US8369669B2 (en) | 2004-07-02 | 2013-02-05 | The General Hospital Corporation | Imaging system and related techniques |
| US9664615B2 (en) | 2004-07-02 | 2017-05-30 | The General Hospital Corporation | Imaging system and related techniques |
| US8676013B2 (en) | 2004-07-02 | 2014-03-18 | The General Hospital Corporation | Imaging system using and related techniques |
| US20090022463A1 (en)* | 2004-07-02 | 2009-01-22 | The General Hospital Corporation | Imaging system and related techniques |
| US7809225B2 (en) | 2004-07-02 | 2010-10-05 | The General Hospital Corporation | Imaging system and related techniques |
| US7809226B2 (en) | 2004-07-02 | 2010-10-05 | The General Hospital Corporation | Imaging system and related techniques |
| US9226660B2 (en) | 2004-08-06 | 2016-01-05 | The General Hospital Corporation | Process, system and software arrangement for determining at least one location in a sample using an optical coherence tomography |
| US8081316B2 (en) | 2004-08-06 | 2011-12-20 | The General Hospital Corporation | Process, system and software arrangement for determining at least one location in a sample using an optical coherence tomography |
| US7761240B2 (en) | 2004-08-11 | 2010-07-20 | Aureon Laboratories, Inc. | Systems and methods for automated diagnosis and grading of tissue images |
| US20060064248A1 (en)* | 2004-08-11 | 2006-03-23 | Olivier Saidi | Systems and methods for automated diagnosis and grading of tissue images |
| US9254102B2 (en) | 2004-08-24 | 2016-02-09 | The General Hospital Corporation | Method and apparatus for imaging of vessel segments |
| US8208995B2 (en) | 2004-08-24 | 2012-06-26 | The General Hospital Corporation | Method and apparatus for imaging of vessel segments |
| US8965487B2 (en) | 2004-08-24 | 2015-02-24 | The General Hospital Corporation | Process, system and software arrangement for measuring a mechanical strain and elastic properties of a sample |
| US9763623B2 (en) | 2004-08-24 | 2017-09-19 | The General Hospital Corporation | Method and apparatus for imaging of vessel segments |
| USRE44042E1 (en) | 2004-09-10 | 2013-03-05 | The General Hospital Corporation | System and method for optical coherence imaging |
| USRE45512E1 (en) | 2004-09-29 | 2015-05-12 | The General Hospital Corporation | System and method for optical coherence imaging |
| US7995210B2 (en) | 2004-11-24 | 2011-08-09 | The General Hospital Corporation | Devices and arrangements for performing coherence range imaging using a common path interferometer |
| US8922781B2 (en) | 2004-11-29 | 2014-12-30 | The General Hospital Corporation | Arrangements, devices, endoscopes, catheters and methods for performing optical imaging by simultaneously illuminating and detecting multiple points on a sample |
| US8351665B2 (en)* | 2005-04-28 | 2013-01-08 | The General Hospital Corporation | Systems, processes and software arrangements for evaluating information associated with an anatomical structure by an optical coherence ranging technique |
| US9326682B2 (en) | 2005-04-28 | 2016-05-03 | The General Hospital Corporation | Systems, processes and software arrangements for evaluating information associated with an anatomical structure by an optical coherence ranging technique |
| US9060689B2 (en) | 2005-06-01 | 2015-06-23 | The General Hospital Corporation | Apparatus, method and system for performing phase-resolved optical frequency domain imaging |
| US9441948B2 (en) | 2005-08-09 | 2016-09-13 | The General Hospital Corporation | Apparatus, methods and storage medium for performing polarization-based quadrature demodulation in optical coherence tomography |
| US20070061323A1 (en)* | 2005-09-14 | 2007-03-15 | National Institute Of Information And Communications Technology | Apparatus and method for displaying data, and program thereof |
| US8289522B2 (en) | 2005-09-29 | 2012-10-16 | The General Hospital Corporation | Arrangements and methods for providing multimodality microscopic imaging of one or more biological structures |
| US8149418B2 (en) | 2005-09-29 | 2012-04-03 | The General Hospital Corporation | Method and apparatus for optical imaging via spectral encoding |
| US9304121B2 (en) | 2005-09-29 | 2016-04-05 | The General Hospital Corporation | Method and apparatus for optical imaging via spectral encoding |
| US8760663B2 (en) | 2005-09-29 | 2014-06-24 | The General Hospital Corporation | Method and apparatus for optical imaging via spectral encoding |
| US8928889B2 (en) | 2005-09-29 | 2015-01-06 | The General Hospital Corporation | Arrangements and methods for providing multimodality microscopic imaging of one or more biological structures |
| US9513276B2 (en) | 2005-09-29 | 2016-12-06 | The General Hospital Corporation | Method and apparatus for optical imaging via spectral encoding |
| US10827970B2 (en) | 2005-10-14 | 2020-11-10 | Aranz Healthcare Limited | Method of monitoring a surface feature and apparatus therefor |
| US9955910B2 (en) | 2005-10-14 | 2018-05-01 | Aranz Healthcare Limited | Method of monitoring a surface feature and apparatus therefor |
| US7889348B2 (en) | 2005-10-14 | 2011-02-15 | The General Hospital Corporation | Arrangements and methods for facilitating photoluminescence imaging |
| US7796270B2 (en) | 2006-01-10 | 2010-09-14 | The General Hospital Corporation | Systems and methods for generating data based on one or more spectrally-encoded endoscopy techniques |
| US20070165921A1 (en)* | 2006-01-17 | 2007-07-19 | Gad Agam | Method for enhancing diagnostic images using vessel reconstruction |
| US7783092B2 (en) | 2006-01-17 | 2010-08-24 | Illinois Institute Of Technology | Method for enhancing diagnostic images using vessel reconstruction |
| US8145018B2 (en) | 2006-01-19 | 2012-03-27 | The General Hospital Corporation | Apparatus for obtaining information for a structure using spectrally-encoded endoscopy techniques and methods for producing one or more optical arrangements |
| US9516997B2 (en) | 2006-01-19 | 2016-12-13 | The General Hospital Corporation | Spectrally-encoded endoscopy techniques, apparatus and methods |
| US9646377B2 (en) | 2006-01-19 | 2017-05-09 | The General Hospital Corporation | Methods and systems for optical imaging or epithelial luminal organs by beam scanning thereof |
| US9791317B2 (en) | 2006-01-19 | 2017-10-17 | The General Hospital Corporation | Spectrally-encoded endoscopy techniques and methods |
| US10987000B2 (en) | 2006-01-19 | 2021-04-27 | The General Hospital Corporation | Methods and systems for optical imaging or epithelial luminal organs by beam scanning thereof |
| US9087368B2 (en) | 2006-01-19 | 2015-07-21 | The General Hospital Corporation | Methods and systems for optical imaging or epithelial luminal organs by beam scanning thereof |
| US9186066B2 (en) | 2006-02-01 | 2015-11-17 | The General Hospital Corporation | Apparatus for applying a plurality of electro-magnetic radiations to a sample |
| US9186067B2 (en) | 2006-02-01 | 2015-11-17 | The General Hospital Corporation | Apparatus for applying a plurality of electro-magnetic radiations to a sample |
| US10426548B2 (en) | 2006-02-01 | 2019-10-01 | The General Hosppital Corporation | Methods and systems for providing electromagnetic radiation to at least one portion of a sample using conformal laser therapy procedures |
| US9777053B2 (en) | 2006-02-08 | 2017-10-03 | The General Hospital Corporation | Methods, arrangements and systems for obtaining information associated with an anatomical sample using optical microscopy |
| USRE46412E1 (en) | 2006-02-24 | 2017-05-23 | The General Hospital Corporation | Methods and systems for performing angle-resolved Fourier-domain optical coherence tomography |
| US7982879B2 (en) | 2006-02-24 | 2011-07-19 | The General Hospital Corporation | Methods and systems for performing angle-resolved fourier-domain optical coherence tomography |
| US8175685B2 (en) | 2006-05-10 | 2012-05-08 | The General Hospital Corporation | Process, arrangements and systems for providing frequency domain imaging of a sample |
| US9364143B2 (en) | 2006-05-10 | 2016-06-14 | The General Hospital Corporation | Process, arrangements and systems for providing frequency domain imaging of a sample |
| US10413175B2 (en) | 2006-05-10 | 2019-09-17 | The General Hospital Corporation | Process, arrangements and systems for providing frequency domain imaging of a sample |
| US7920271B2 (en) | 2006-08-25 | 2011-04-05 | The General Hospital Corporation | Apparatus and methods for enhancing optical coherence tomography imaging using volumetric filtering techniques |
| US9968245B2 (en) | 2006-10-19 | 2018-05-15 | The General Hospital Corporation | Apparatus and method for obtaining and providing imaging information associated with at least one portion of a sample, and effecting such portion(s) |
| US8838213B2 (en) | 2006-10-19 | 2014-09-16 | The General Hospital Corporation | Apparatus and method for obtaining and providing imaging information associated with at least one portion of a sample, and effecting such portion(s) |
| US7949019B2 (en) | 2007-01-19 | 2011-05-24 | The General Hospital | Wavelength tuning source based on a rotatable reflector |
| US9176319B2 (en) | 2007-03-23 | 2015-11-03 | The General Hospital Corporation | Methods, arrangements and apparatus for utilizing a wavelength-swept laser using angular scanning and dispersion procedures |
| US10534129B2 (en) | 2007-03-30 | 2020-01-14 | The General Hospital Corporation | System and method providing intracoronary laser speckle imaging for the detection of vulnerable plaque |
| US8045177B2 (en) | 2007-04-17 | 2011-10-25 | The General Hospital Corporation | Apparatus and methods for measuring vibrations using spectrally-encoded endoscopy |
| US9375158B2 (en) | 2007-07-31 | 2016-06-28 | The General Hospital Corporation | Systems and methods for providing beam scan patterns for high speed doppler optical frequency domain imaging |
| US7933021B2 (en) | 2007-10-30 | 2011-04-26 | The General Hospital Corporation | System and method for cladding mode detection |
| US8249696B2 (en) | 2007-12-19 | 2012-08-21 | Depuy Spine, Inc. | Smart pedicle tool |
| US7898656B2 (en) | 2008-04-30 | 2011-03-01 | The General Hospital Corporation | Apparatus and method for cross axis parallel spectroscopy |
| US8593619B2 (en) | 2008-05-07 | 2013-11-26 | The General Hospital Corporation | System, method and computer-accessible medium for tracking vessel motion during three-dimensional coronary artery microscopy |
| US9173572B2 (en) | 2008-05-07 | 2015-11-03 | The General Hospital Corporation | System, method and computer-accessible medium for tracking vessel motion during three-dimensional coronary artery microscopy |
| KR100963689B1 (en) | 2008-05-13 | 2010-06-15 | 대한민국 | How to classify human tissue |
| US8861910B2 (en) | 2008-06-20 | 2014-10-14 | The General Hospital Corporation | Fused fiber optic coupler arrangement and method for use thereof |
| US10835110B2 (en) | 2008-07-14 | 2020-11-17 | The General Hospital Corporation | Apparatus and method for facilitating at least partial overlap of dispersed ration on at least one sample |
| US20140350434A1 (en)* | 2008-10-03 | 2014-11-27 | Hlz Innovation, Llc | Adjustable pneumatic supporting surface |
| US9730585B2 (en)* | 2008-10-03 | 2017-08-15 | Hlz Innovation, Llc | Adjustable pneumatic supporting surface |
| US8937724B2 (en) | 2008-12-10 | 2015-01-20 | The General Hospital Corporation | Systems and methods for extending imaging depth range of optical coherence tomography through optical sub-sampling |
| US9615748B2 (en) | 2009-01-20 | 2017-04-11 | The General Hospital Corporation | Endoscopic biopsy apparatus, system and method |
| US8097864B2 (en) | 2009-01-26 | 2012-01-17 | The General Hospital Corporation | System, method and computer-accessible medium for providing wide-field superresolution microscopy |
| US9178330B2 (en) | 2009-02-04 | 2015-11-03 | The General Hospital Corporation | Apparatus and method for utilization of a high-speed optical wavelength tuning source |
| US11490826B2 (en) | 2009-07-14 | 2022-11-08 | The General Hospital Corporation | Apparatus, systems and methods for measuring flow and pressure within a vessel |
| US8770954B2 (en) | 2010-02-10 | 2014-07-08 | KickSmart International, Inc. | Human-powered irrigation pump |
| US10100818B2 (en) | 2010-02-10 | 2018-10-16 | Kickstart International, Inc. | Human powered irrigation pump |
| US9642531B2 (en) | 2010-03-05 | 2017-05-09 | The General Hospital Corporation | Systems, methods and computer-accessible medium which provide microscopic images of at least one anatomical structure at a particular resolution |
| US8804126B2 (en) | 2010-03-05 | 2014-08-12 | The General Hospital Corporation | Systems, methods and computer-accessible medium which provide microscopic images of at least one anatomical structure at a particular resolution |
| US10463254B2 (en) | 2010-03-05 | 2019-11-05 | The General Hospital Corporation | Light tunnel and lens which provide extended focal depth of at least one anatomical structure at a particular resolution |
| US9408539B2 (en) | 2010-03-05 | 2016-08-09 | The General Hospital Corporation | Systems, methods and computer-accessible medium which provide microscopic images of at least one anatomical structure at a particular resolution |
| US9069130B2 (en) | 2010-05-03 | 2015-06-30 | The General Hospital Corporation | Apparatus, method and system for generating optical radiation from biological gain media |
| US9951269B2 (en) | 2010-05-03 | 2018-04-24 | The General Hospital Corporation | Apparatus, method and system for generating optical radiation from biological gain media |
| US9557154B2 (en) | 2010-05-25 | 2017-01-31 | The General Hospital Corporation | Systems, devices, methods, apparatus and computer-accessible media for providing optical imaging of structures and compositions |
| US9795301B2 (en) | 2010-05-25 | 2017-10-24 | The General Hospital Corporation | Apparatus, systems, methods and computer-accessible medium for spectral analysis of optical coherence tomography images |
| US10939825B2 (en) | 2010-05-25 | 2021-03-09 | The General Hospital Corporation | Systems, devices, methods, apparatus and computer-accessible media for providing optical imaging of structures and compositions |
| US10285568B2 (en) | 2010-06-03 | 2019-05-14 | The General Hospital Corporation | Apparatus and method for devices for imaging structures in or at one or more luminal organs |
| US9510758B2 (en) | 2010-10-27 | 2016-12-06 | The General Hospital Corporation | Apparatus, systems and methods for measuring blood pressure within at least one vessel |
| US20120207360A1 (en)* | 2011-02-11 | 2012-08-16 | Courosh Mehanian | Systems and Methods for Object Identification |
| US20150186755A1 (en)* | 2011-02-11 | 2015-07-02 | Charles River Laboratories, Inc. | Systems and Methods for Object Identification |
| US9330092B2 (en) | 2011-07-19 | 2016-05-03 | The General Hospital Corporation | Systems, methods, apparatus and computer-accessible-medium for providing polarization-mode dispersion compensation in optical coherence tomography |
| US10241028B2 (en) | 2011-08-25 | 2019-03-26 | The General Hospital Corporation | Methods, systems, arrangements and computer-accessible medium for providing micro-optical coherence tomography procedures |
| US9341783B2 (en) | 2011-10-18 | 2016-05-17 | The General Hospital Corporation | Apparatus and methods for producing and/or providing recirculating optical delay(s) |
| US10874302B2 (en) | 2011-11-28 | 2020-12-29 | Aranz Healthcare Limited | Handheld skin measuring or monitoring device |
| US11850025B2 (en) | 2011-11-28 | 2023-12-26 | Aranz Healthcare Limited | Handheld skin measuring or monitoring device |
| US9629528B2 (en) | 2012-03-30 | 2017-04-25 | The General Hospital Corporation | Imaging system, method and distal attachment for multidirectional field of view endoscopy |
| US11490797B2 (en) | 2012-05-21 | 2022-11-08 | The General Hospital Corporation | Apparatus, device and method for capsule microscopy |
| US9415550B2 (en) | 2012-08-22 | 2016-08-16 | The General Hospital Corporation | System, method, and computer-accessible medium for fabrication miniature endoscope using soft lithography |
| US9968261B2 (en) | 2013-01-28 | 2018-05-15 | The General Hospital Corporation | Apparatus and method for providing diffuse spectroscopy co-registered with optical frequency domain imaging |
| US10893806B2 (en) | 2013-01-29 | 2021-01-19 | The General Hospital Corporation | Apparatus, systems and methods for providing information regarding the aortic valve |
| US11179028B2 (en) | 2013-02-01 | 2021-11-23 | The General Hospital Corporation | Objective lens arrangement for confocal endomicroscopy |
| US10478072B2 (en) | 2013-03-15 | 2019-11-19 | The General Hospital Corporation | Methods and system for characterizing an object |
| US9784681B2 (en) | 2013-05-13 | 2017-10-10 | The General Hospital Corporation | System and method for efficient detection of the phase and amplitude of a periodic modulation associated with self-interfering fluorescence |
| US10117576B2 (en) | 2013-07-19 | 2018-11-06 | The General Hospital Corporation | System, method and computer accessible medium for determining eye motion by imaging retina and providing feedback for acquisition of signals from the retina |
| US11452433B2 (en) | 2013-07-19 | 2022-09-27 | The General Hospital Corporation | Imaging apparatus and method which utilizes multidirectional field of view endoscopy |
| US10058250B2 (en) | 2013-07-26 | 2018-08-28 | The General Hospital Corporation | System, apparatus and method for utilizing optical dispersion for fourier-domain optical coherence tomography |
| US9733460B2 (en) | 2014-01-08 | 2017-08-15 | The General Hospital Corporation | Method and apparatus for microscopic imaging |
| US10736494B2 (en) | 2014-01-31 | 2020-08-11 | The General Hospital Corporation | System and method for facilitating manual and/or automatic volumetric imaging with real-time tension or force feedback using a tethered imaging device |
| US10228556B2 (en) | 2014-04-04 | 2019-03-12 | The General Hospital Corporation | Apparatus and method for controlling propagation and/or transmission of electromagnetic radiation in flexible waveguide(s) |
| US10912462B2 (en) | 2014-07-25 | 2021-02-09 | The General Hospital Corporation | Apparatus, devices and methods for in vivo imaging and diagnosis |
| US10777317B2 (en) | 2016-05-02 | 2020-09-15 | Aranz Healthcare Limited | Automatically assessing an anatomical surface feature and securely managing information related to the same |
| US10013527B2 (en) | 2016-05-02 | 2018-07-03 | Aranz Healthcare Limited | Automatically assessing an anatomical surface feature and securely managing information related to the same |
| US11250945B2 (en) | 2016-05-02 | 2022-02-15 | Aranz Healthcare Limited | Automatically assessing an anatomical surface feature and securely managing information related to the same |
| US11923073B2 (en) | 2016-05-02 | 2024-03-05 | Aranz Healthcare Limited | Automatically assessing an anatomical surface feature and securely managing information related to the same |
| US11116407B2 (en) | 2016-11-17 | 2021-09-14 | Aranz Healthcare Limited | Anatomical surface assessment methods, devices and systems |
| US12268472B2 (en) | 2016-11-17 | 2025-04-08 | ARANZ Medical Limited | Anatomical surface assessment methods, devices and systems |
| US11903723B2 (en) | 2017-04-04 | 2024-02-20 | Aranz Healthcare Limited | Anatomical surface assessment methods, devices and systems |
| US12279883B2 (en) | 2017-04-04 | 2025-04-22 | ARANZ Medical Limited | Anatomical surface assessment methods, devices and systems |
| US12039726B2 (en) | 2019-05-20 | 2024-07-16 | Aranz Healthcare Limited | Automated or partially automated anatomical surface assessment methods, devices and systems |
Also Published As
| Publication number | Publication date |
|---|---|
| WO2000079269A1 (en) | 2000-12-28 |
| CA2389220A1 (en) | 2000-12-28 |
| EP1194775A1 (en) | 2002-04-10 |
| AU5888000A (en) | 2001-01-09 |
| EP1194775A4 (en) | 2004-09-15 |
| US20040117343A1 (en) | 2004-06-17 |
| JP2003502669A (en) | 2003-01-21 |
| CA2389220C (en) | 2011-07-26 |
Similar Documents
| Publication | Publication Date | Title |
|---|---|---|
| US6611833B1 (en) | Methods for profiling and classifying tissue using a database that includes indices representative of a tissue population | |
| US6581011B1 (en) | Online database that includes indices representative of a tissue population | |
| Kendziorski et al. | The efficiency of pooling mRNA in microarray experiments | |
| Davis et al. | Psychosocial adjustment to and control of diabetes mellitus: differences by disease type and treatment. | |
| Michels et al. | Progression of familial and non-familial dilated cardiomyopathy: long term follow up | |
| WO2002044715A1 (en) | Methods for efficiently minig broad data sets for biological markers | |
| JP7527071B2 (en) | Automatic reporting system for gene mutation test results that is updated periodically | |
| US20240087677A1 (en) | Method for analysis of omics data | |
| CN113345592A (en) | Construction and diagnosis equipment for acute myeloid leukemia prognosis risk model | |
| Hopper | The epidemiology of genetic epidemiology | |
| Reiner-Benaim et al. | Associating quantitative behavioral traits with gene expression in the brain: searching for diamonds in the hay | |
| CN113838519B (en) | Gene selection method and system based on adaptive gene interaction regularization elastic network model | |
| Delmar et al. | Mixture model on the variance for the differential analysis of gene expression data | |
| Lee et al. | High-throughput clonogenic analysis of 3D-Cultured patient-derived cells with a micropillar and microwell chip | |
| US20020087511A1 (en) | Methods for profiling and manufacturing tissue using a database that includes indices representative of a tissue population | |
| Zhong et al. | Cell segmentation and gene imputation for imaging-based spatial transcriptomics | |
| Bolender et al. | Quantitative morphology of the nervous system: expanding horizons | |
| WO2000079270A1 (en) | Methods for profiling and manufacturing tissue using a database that includes indices representative of a tissue population | |
| US20190252075A1 (en) | Predicting Prostate Cancer Recurrence Using a Prognostic Model that Combines Immunohistochemical Staining and Gene Expression Profiling | |
| WO2021142625A1 (en) | Method for predicting cell spatial relation based on single-cell transcriptome sequencing data | |
| Stein et al. | Accurate tiling of spatial single-cell data with Tessera | |
| Galuzzi et al. | Coupling constrained-based flux sampling and clustering to tackle cancer metabolic heterogeneity | |
| Tao et al. | Benchmarking mapping algorithms for cell-type annotating in mouse brain by integrating single-nucleus RNA-seq and Stereo-seq data | |
| Luo et al. | MAST-Decon: smooth cell-type deconvolution method for spatial transcriptomics data | |
| US20240145035A1 (en) | Analyzing per-cell co-expression of cellular constituents |
Legal Events
| Date | Code | Title | Description |
|---|---|---|---|
| AS | Assignment | Owner name:TISSUEINFORMATICS, INC., PENNSYLVANIA Free format text:ASSIGNMENT OF ASSIGNORS INTEREST;ASSIGNOR:JOHNSON, PETER C.;REEL/FRAME:010249/0828 Effective date:19990826 | |
| AS | Assignment | Owner name:PNC BANK, NATIONAL ASSOCIATION D.B.A VENTUREBANK@P Free format text:ASSIGNMENT OF ASSIGNORS INTEREST;ASSIGNOR:TISSUEINFORMATICS.INC.;REEL/FRAME:012706/0385 Effective date:20010511 | |
| STCF | Information on status: patent grant | Free format text:PATENTED CASE | |
| AS | Assignment | Owner name:PARADIGM GENETICS, INC., NORTH CAROLINA Free format text:MERGER;ASSIGNOR:TISSUEINFORMATICS, INC.;REEL/FRAME:014669/0544 Effective date:20040311 | |
| AS | Assignment | Owner name:ICORIA, INC., NORTH CAROLINA Free format text:ASSIGNMENT OF ASSIGNORS INTEREST;ASSIGNOR:PARADIGM GENETICS, INC.;REEL/FRAME:015065/0876 Effective date:20040417 | |
| REMI | Maintenance fee reminder mailed | ||
| FPAY | Fee payment | Year of fee payment:4 | |
| SULP | Surcharge for late payment | ||
| AS | Assignment | Owner name:BIOIMAGENE, INC., CALIFORNIA Free format text:ASSIGNMENT OF ASSIGNORS INTEREST;ASSIGNOR:COGENICS, INC.;REEL/FRAME:021531/0746 Effective date:20080822 | |
| FPAY | Fee payment | Year of fee payment:8 | |
| AS | Assignment | Owner name:VENTANA MEDICAL SYSTEMS, INC., ARIZONA Free format text:MERGER;ASSIGNOR:BIOIMAGENE, INC.;REEL/FRAME:026015/0733 Effective date:20101221 | |
| FEPP | Fee payment procedure | Free format text:PAT HOLDER NO LONGER CLAIMS SMALL ENTITY STATUS, ENTITY STATUS SET TO UNDISCOUNTED (ORIGINAL EVENT CODE: STOL); ENTITY STATUS OF PATENT OWNER: LARGE ENTITY | |
| REFU | Refund | Free format text:REFUND - PAYMENT OF MAINTENANCE FEE, 12TH YR, SMALL ENTITY (ORIGINAL EVENT CODE: R2553); ENTITY STATUS OF PATENT OWNER: LARGE ENTITY | |
| FPAY | Fee payment | Year of fee payment:12 |