US6420108B2 - Computer-aided display for comparative gene expression - Google Patents
Computer-aided display for comparative gene expressionDownload PDFInfo
- Publication number
- US6420108B2 US6420108B2US09/020,743US2074398AUS6420108B2US 6420108 B2US6420108 B2US 6420108B2US 2074398 AUS2074398 AUS 2074398AUS 6420108 B2US6420108 B2US 6420108B2
- Authority
- US
- United States
- Prior art keywords
- axis
- sample
- expressed sequence
- probe
- code
- Prior art date
- Legal status (The legal status is an assumption and is not a legal conclusion. Google has not performed a legal analysis and makes no representation as to the accuracy of the status listed.)
- Expired - Lifetime
Links
Images


Classifications
- G—PHYSICS
- G16—INFORMATION AND COMMUNICATION TECHNOLOGY [ICT] SPECIALLY ADAPTED FOR SPECIFIC APPLICATION FIELDS
- G16B—BIOINFORMATICS, i.e. INFORMATION AND COMMUNICATION TECHNOLOGY [ICT] SPECIALLY ADAPTED FOR GENETIC OR PROTEIN-RELATED DATA PROCESSING IN COMPUTATIONAL MOLECULAR BIOLOGY
- G16B25/00—ICT specially adapted for hybridisation; ICT specially adapted for gene or protein expression
- G16B25/10—Gene or protein expression profiling; Expression-ratio estimation or normalisation
- G—PHYSICS
- G06—COMPUTING OR CALCULATING; COUNTING
- G06T—IMAGE DATA PROCESSING OR GENERATION, IN GENERAL
- G06T11/00—2D [Two Dimensional] image generation
- G06T11/20—Drawing from basic elements, e.g. lines or circles
- G06T11/206—Drawing of charts or graphs
- C—CHEMISTRY; METALLURGY
- C12—BIOCHEMISTRY; BEER; SPIRITS; WINE; VINEGAR; MICROBIOLOGY; ENZYMOLOGY; MUTATION OR GENETIC ENGINEERING
- C12N—MICROORGANISMS OR ENZYMES; COMPOSITIONS THEREOF; PROPAGATING, PRESERVING, OR MAINTAINING MICROORGANISMS; MUTATION OR GENETIC ENGINEERING; CULTURE MEDIA
- C12N15/00—Mutation or genetic engineering; DNA or RNA concerning genetic engineering, vectors, e.g. plasmids, or their isolation, preparation or purification; Use of hosts therefor
- C12N15/09—Recombinant DNA-technology
- C12N15/10—Processes for the isolation, preparation or purification of DNA or RNA
- C12N15/1034—Isolating an individual clone by screening libraries
- C12N15/1089—Design, preparation, screening or analysis of libraries using computer algorithms
- C—CHEMISTRY; METALLURGY
- C12—BIOCHEMISTRY; BEER; SPIRITS; WINE; VINEGAR; MICROBIOLOGY; ENZYMOLOGY; MUTATION OR GENETIC ENGINEERING
- C12Q—MEASURING OR TESTING PROCESSES INVOLVING ENZYMES, NUCLEIC ACIDS OR MICROORGANISMS; COMPOSITIONS OR TEST PAPERS THEREFOR; PROCESSES OF PREPARING SUCH COMPOSITIONS; CONDITION-RESPONSIVE CONTROL IN MICROBIOLOGICAL OR ENZYMOLOGICAL PROCESSES
- C12Q1/00—Measuring or testing processes involving enzymes, nucleic acids or microorganisms; Compositions therefor; Processes of preparing such compositions
- C12Q1/68—Measuring or testing processes involving enzymes, nucleic acids or microorganisms; Compositions therefor; Processes of preparing such compositions involving nucleic acids
- G—PHYSICS
- G16—INFORMATION AND COMMUNICATION TECHNOLOGY [ICT] SPECIALLY ADAPTED FOR SPECIFIC APPLICATION FIELDS
- G16B—BIOINFORMATICS, i.e. INFORMATION AND COMMUNICATION TECHNOLOGY [ICT] SPECIALLY ADAPTED FOR GENETIC OR PROTEIN-RELATED DATA PROCESSING IN COMPUTATIONAL MOLECULAR BIOLOGY
- G16B45/00—ICT specially adapted for bioinformatics-related data visualisation, e.g. displaying of maps or networks
- G—PHYSICS
- G16—INFORMATION AND COMMUNICATION TECHNOLOGY [ICT] SPECIALLY ADAPTED FOR SPECIFIC APPLICATION FIELDS
- G16B—BIOINFORMATICS, i.e. INFORMATION AND COMMUNICATION TECHNOLOGY [ICT] SPECIALLY ADAPTED FOR GENETIC OR PROTEIN-RELATED DATA PROCESSING IN COMPUTATIONAL MOLECULAR BIOLOGY
- G16B25/00—ICT specially adapted for hybridisation; ICT specially adapted for gene or protein expression
Definitions
- the present inventionrelates to the field of computer systems. More specifically, the present invention relates to computer systems for visualizing analysis results.
- an array of nucleic acid probesis fabricated at known locations on a substrate or chip.
- a fluorescently labeled nucleic acidis then brought into contact with the chip and a scanner generates an image file (which is processed into a cell file) indicating the locations where the labeled nucleic acids bound to the chip.
- image filewhich is processed into a cell file
- Such systemshave been used to form, for example, arrays of DNA that may be used to study and detect mutations relevant to cystic fibrosis, the P53 gene (relevant to certain cancers), HIV, and other genetic characteristics.
- the present inventionprovides innovative systems and methods for visualizing information collected from analyzing samples.
- the samplesmay include nucleic acids, proteins, or other polymers.
- Gene expression level as determined from analysis of a nucleic acid sampleis one possible analysis result that may be visualized.
- a computer systemmay display the expression levels of multiple genes simultaneously in a way that facilitates user identification of genes whose expression is significant to a characteristic such as disease or resistance to disease. Additionally, the computer system may facilitate display of further information about relevant genes once they are identified.
- a first aspect of the inventionprovides a computer-implemented method for presenting expression level information as collected from first and second samples.
- the methodincludes steps of: displaying a first axis corresponding to expression level in the first sample, and displaying a second axis substantially perpendicular to the first axis, the second axis corresponding to expression level in the second sample.
- the methodfurther includes a step of: for a selected expressed sequence, displaying a mark at a position. The position is selected relative to the first axis in accordance with an expression level of the selected expressed sequence in the first sample and relative to the second axis in accordance with an expression level of the selected expressed sequence in the second sample.
- a particularly useful applicationis displaying many marks simultaneously for many selected genes to discover which ones of the selected genes may be relevant to the characteristic.
- a second aspect of the inventionprovides a computer-implemented method of presenting sample analysis information.
- the methodincludes steps of: displaying a first axis corresponding to a concentration of a compound in a first sample as determined by monitoring binding of the compound to a selected polymer having binding affinity to the compound, and displaying a second axis substantially perpendicular to the first axis.
- the second axiscorresponds to a concentration of the compound in the second sample as determined by monitoring binding of the compound to the selected polymer.
- the methodfurther preferably includes a step of displaying a mark at a position. The position is selected relative to the first axis in accordance with the concentration in the first sample and relative to the second axis in accordance with the concentration in the second sample.
- FIG. 1illustrates an example of a computer system that may be used to execute software embodiments of the present invention.
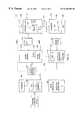
- FIG. 2shows a system block diagram of a typical computer system.
- FIG. 3illustrates an overall system for forming and analyzing arrays of polymers including biological materials such as DNA or RNA.
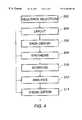
- FIG. 4is an illustration of an embodiment of software for the overall system.
- FIG. 5shows a flowchart of a process of monitoring the expression of a gene by comparing hybridization intensities of pairs of perfect match and mismatch probes.
- FIG. 6shows a screen display illustrating gene expression levels for multiple genes as collected from both normal and diseased tissue.
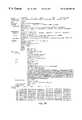
- FIGS. 7A-7Bshow screen displays illustrating information (SEQ ID NOS: 1 and 2) about a particular gene from the display of FIG. 6 .
- the present inventionprovides innovative methods of monitoring visualizing gene expression.
- the inventionwill be described in reference to preferred embodiments. However, the description is provided for purposes of illustration and not for limiting the spirit and scope of the invention.
- FIG. 1illustrates an example of a computer system that may be used to execute software embodiments of the present invention.
- FIG. 1shows a computer system 1 which includes a monitor 3 , screen 5 , cabinet 7 , keyboard 9 , and mouse 11 .
- Mouse 11may have one or more buttons such as mouse buttons 13 .
- Cabinet 7houses a CD-ROM drive 15 and a hard drive (not shown) that may be utilized to store and retrieve software programs including computer code incorporating the present invention.
- a CD-ROM 17is shown as the computer readable medium, other computer readable media including floppy disks, DRAM, hard drives, flash memory, tape, and the like may be utilized.
- Cabinet 7also houses familiar computer components (not shown) such as a processor, memory, and the like.
- FIG. 2shows a system block diagram of computer system 1 used to execute software embodiments of the present invention.
- computer system 1includes monitor 3 and keyboard 9 .
- Computer system 1further includes subsystems such as a central processor 50 , system memory 52 , I/O controller 54 , display adapter 56 , removable disk 58 , fixed disk 60 , network interface 62 , and speaker 64 .
- Removable disk 58is representative of removable computer readable media like floppies, tape, CD-ROM, removable hard drive, flash memory, and the like.
- Fixed disk 60is representative of an internal hard drive or the like.
- Other computer systems suitable for use with the present inventionmay include additional or fewer subsystems.
- another computer systemcould include more than one processor 50 (i.e., a multi-processor system) or memory cache.
- Arrows such as 66represent the system bus architecture of computer system 1 . However, these arrows are illustrative of any interconnection scheme serving to link the subsystems.
- display adapter 56may be connected to central processor 50 through a local bus or the system may include a memory cache.
- Computer system 1 shown in FIG. 2is but an example of a computer system suitable for use with the present invention. Other configurations of subsystems suitable for use with the present invention will be readily apparent to one of ordinary skill in the art. In one embodiment, the computer system is an IBM compatible personal computer.
- VLSIPSTM and GeneChipTM technologiesprovide methods of making and using very large arrays of polymers, such as nucleic acids, on very small chips. See U.S. Pat. No. 5,143,854 and PCT Pat. Publication Nos. WO 90/15070 and 92/10092, each of which is hereby incorporated by reference for all purposes. Nucleic acid probes on the chip are used to detect complementary nucleic acid sequences in a sample nucleic acid of interest (the “target” nucleic acid).
- probesneed not be nucleic acid probes but may also be other receptors, such as antibodies, or polymers such as peptides.
- Peptide probesmay be used to detect the concentration of other peptides, proteins, or other compounds in a sample. The probes must be carefully selected to have bonding affinity to the compound whose concentration they are to be used to measure.
- the present inventionprovides methods of visualizing information relating to the concentration of compounds in a sample as measured by monitoring affinity of the compounds to probes.
- the concentration informationis generated by analysis of hybridization intensity files for a chip containing hybridized nucleic acid probes.
- the hybridization of a nucleic acid sample to certain probesmay represent the expression level of one more genes or expressed sequence tags (ESTs).
- ESTsexpressed sequence tags
- Expression level information visualized by virtue of the present inventionneed not be obtained from probes but may originate from any source. If the expression information is collected from a probe array, the probe array need not meet any particular criteria for size and density. Furthermore, the present invention is not limited to visualizing fluorescent measurements of bondings such as hybridizations but may be readily utilized to visualize other measurements.
- a probe arraymay include peptide probes which may be exposed to protein samples, polypeptide samples, or other compounds which may or may not bond to the peptide probes. By appropriate selection of the peptide probes, one may detect the presence or absence of particular compounds which would bond to the peptide probes.
- the present inventionis described as being part of a system that designs a chip mask, synthesizes the probes on the chip, labels nucleic acids from a target sample, and scans the hybridized probes.
- a systemis set forth in U.S. Pat. No. 5,571,639 which is hereby incorporated by reference for all purposes.
- the present inventionmay be used separately from the overall system for analyzing data generated by such systems, such as at remote locations, or for visualizing the results of other systems for generating expression information, or for visualizing concentrations of polymers other than nucleic acids.
- FIG. 3illustrates a computerized system for forming and analyzing arrays of biological materials such as RNA or DNA.
- a computer 100is used to design arrays of biological polymers such as RNA or DNA.
- the computer 100may be, for example, an appropriately programmed IBM personal computer compatible running Windows NT including appropriate memory and a CPU as shown in FIGS. 1 and 2.
- the computer system 100obtains inputs from a user regarding characteristics of a gene of interest, and other inputs regarding the desired features of the array.
- the computer systemmay obtain information regarding a specific genetic sequence of interest from an external or internal database 102 such as GenBank.
- the output of the computer system 100is a set of chip design computer files 104 in the form of, for example, a switch matrix, as described in PCT application WO 92/10092, and other associated computer files.
- the chip design filesare provided to a system 106 that designs the lithographic masks used in the fabrication of arrays of molecules such as DNA.
- the system or process 106may include the hardware necessary to manufacture masks 110 and also the necessary computer hardware and software 108 necessary to lay the mask patterns out on the mask in an efficient manner. As with the other features in FIG. 3, such equipment may or may not be located at the same physical site, but is shown together for ease of illustration in FIG. 3 .
- the system 106generates masks 110 or other synthesis patterns such as chrome-on-glass masks for use in the fabrication of polymer arrays.
- Synthesis system 112includes the necessary hardware and software used to fabricate arrays of polymers on a substrate or chip 114 .
- synthesizer 112includes a light source 116 and a chemical flow cell 118 on which the substrate or chip 114 is placed.
- Mask 110is placed between the light source and the substrate/chip, and the two are translated relative to each other at appropriate times for deprotection of selected regions of the chip.
- Selected chemical reagentsare directed through flow cell 118 for coupling to deprotected regions, as well as for washing and other operations. All operations are preferably directed by an appropriately programmed computer 119 , which may or may not be the same computer as the computer(s) used in mask design and mask making.
- the substrates fabricated by synthesis system 112are optionally diced into smaller chips and exposed to marked targets.
- the targetsmay or may not be complementary to one or more of the molecules on the substrate.
- the targetsare marked with a label such as a fluorescein label (indicated by an asterisk in FIG. 3) and placed in scanning system 120 .
- Scanning system 120again operates under the direction of an appropriately programmed digital computer 122 , which also may or may not be the same computer as the computers used in synthesis, mask making, and mask design.
- the scanner 120includes a detection device 124 such as a confocal microscope or CCD (charge-coupled device) that is used to detect the location where labeled target has bound to the substrate.
- a detection device 124such as a confocal microscope or CCD (charge-coupled device) that is used to detect the location where labeled target has bound to the substrate.
- the output of scanner 120is an image file(s) 124 indicating, in the case of fluorescein labeled target, the fluorescence intensity (photon counts or other related measurements, such as voltage) as a function of position on the substrate. Since higher photon counts will be observed where the labeled target has bound more strongly to the array of polymers, and since the monomer sequence of the polymers on the substrate is known as a function of position, it becomes possible to determine the sequence(s) of polymer(s) on the substrate that are complementary to the target.
- the image file 124is provided as input to an analysis system 126 that incorporates the visualization and analysis methods of the present invention.
- the analysis systemmay be any one of a wide variety of computer system.
- the present inventionprovides various methods of analyzing and visualizing the chip design files and the image files, providing appropriate output 128 .
- the chip designneed not include any particular number of probes. It should be understood that the present invention does not require any particular source of expression level information.
- FIG. 4provides a simplified illustration of the overall software system used in the operation of one embodiment of the invention.
- the systemfirst identifies the nucleotide sequence(s) or targets that would be of interest in a particular expression level analysis at step 202 .
- the sequences of interestcorrespond to mRNA transcripts of one or more genes, ESTs or nucleic acids derived from the mRNA transcripts. Sequence selection may be provided via manual input of text files or may be from external sources such as GenBank.
- the systemevaluates the sequences of interest to determine or assist the user in determining which probes would be desirable on the chip, and provides an appropriate “layout” on the chip for the probes.
- the process of selecting probes for an expression level analysisis explained in PCT Publication No. WO 97/10365, the contents of which are herein incorporated by reference.
- An alternative probe selection process that does not require prior knowledge of sequences of interestis explained in PCT Publication No. WO97/27317, the contents of which are herein incorporated by reference. Further general background on probe selection is found in PCT Publication No. WO95/11995 and PCT Publication No. WO97/29212, the contents of which are herein incorporated by reference.
- perfect match proberefers to a probe that has a sequence that is perfectly complementary to a particular target sequence.
- the test probeis typically perfectly complementary to a portion (subsequence) of the target sequence.
- mismatch controlor “mismatch probe” refer to probes whose sequence is deliberately selected not to be perfectly complementary to a particular target sequence. For each mismatch (MM) control in an array there typically exists a corresponding perfect match (PM) probe that is perfectly complementary to the same particular target sequence.
- the processcompares hybridization intensities of pairs of perfect match and mismatch probes that are preferably covalently attached to the surface of a substrate or chip.
- the nucleic acid probeshave a density greater than about 60 different nucleic acid probes per 1 cm 2 of the substrate.
- nucleic acid probesare selected that are complementary to the target sequence. These probes are the perfect match probes. Another set of probes is specified that are intended to be not perfectly complementary to the target sequence. These probes are the mismatch probes and each mismatch probe includes at least one nucleotide mismatch from a perfect match probe. Accordingly, a mismatch probe and the perfect match probe to which it is identical except for one base make up a pair. As mentioned earlier, the nucleotide mismatch is preferably near the center of the mismatch probe.
- the probe lengths of the perfect match probesare typically chosen to exhibit detectably greater hybridization with the target sequence relative to the mismatch probes.
- the nucleic acid probesmay be all 20-mers.
- probes of varying lengthsmay also be synthesized on the substrate for any number of reasons including resolving ambiguities.
- the masks for the synthesisare designed.
- the softwareutilizes the mask design and layout information to make the DNA or other polymer chips. This step 208 will control, among other things, relative translation of a substrate and the mask, the flow of desired reagents through a flow cell, the synthesis temperature of the flow cell, and other parameters.
- another piece of softwareis used in scanning a chip thus synthesized and exposed to a labeled target. The software controls the scanning of the chip, and stores the data thus obtained in a file that may later be utilized to extract hybridization information.
- a computer systemutilizes the layout information and the fluorescence information to evaluate the hybridized nucleic acid probes on the chip.
- the important pieces of information obtained from DNA chipsare the relative fluorescent intensities obtained from the perfect match probes and mismatch probes. These intensity levels are used to estimate an expression level for a gene or EST.
- the computer system used for analysiswill preferably have available other details of the experiment including possibly the gene name, gene sequence, probe sequences, probe locations on the substrate, and the like.
- the same computer system used for analysis or another onedisplays the expression level information in a format useful for identifying genes of interest.
- the visualized expression level informationmay include information collected from multiple applications of one or more previous steps of FIG. 4 .
- FIG. 5is a flowchart describing steps of estimating an expression level for a particular gene and determining whether the expression level is sufficiently high to be displayed.
- the computer systemreceives raw scan data of N pairs of perfect match and mismatch probes.
- the hybridization intensitiesare photon counts from a fluorescein labeled target that has hybridized to the probes on the substrate.
- the hybridization intensity of a perfect match probewill be designed “I pm ” and the hybridization intensity of a mismatch probe will be designed “I mm .”
- Hybridization intensities for a pair of probesare retrieved at step 954 .
- the background signal intensityis subtracted from each of the hybridization intensities of the pair at step 956 . Background subtraction can also be performed on all the raw scan data at the same time.
- the hybridization intensities of the pair of probesare compared to a difference threshold (D) and a ratio threshold (R). It is determined if the difference between the hybridization intensities of the pair (I pm ⁇ I mm ) is greater than or equal to the difference threshold AND the quotient of the hybridization intensities of the pair (I pm /I mm ) is greater than or equal to the ratio threshold.
- the difference thresholdsare typically user defined values that have been determined to produce accurate expression monitoring of a gene or genes. In one embodiment, the difference threshold is 20 and the ratio threshold is 1.2.
- NPOSis a value that indicates the number of pairs of probes which have hybridization intensities indicating that the gene is likely expressed. NPOS is utilized in a determination of the expression of the gene.
- NNEGis a value that indicates the number of pairs of probes which have hybridization intensities indicating that the gene is likely not expressed.
- NNEGlike NPOS, is utilized in a determination of the expression of the gene.
- LRlog ratio value
- IDIFintensity difference value
- a decision matrixis utilized to indicate if the gene is expressed.
- the decision matrixutilizes the values N, NPOS, NNEG, LR (multiple LRs), and IDIF (multiple IDIFs). The following four assignments are performed:
- the expression level of a geneshould be displayed if:
- an average of the IDIF values for the probes that incremented NPOS or NNEGis calculated at step 975 , which is utilized as an expression level.
- other valuesincluding one of P 1 through P 4 could be used to indicate expression level.
- FIG. 5was described in reference to a single gene or EST.
- the visualization system of the present inventiondisplays expression results for many genes to facilitate discovery of genes of interest or ESTs.
- the present inventioncontemplates display of expression levels of a single gene or ESTs as collected from two or more different samples such as tissue samples.
- the sample sourcespreferably differ in some characteristic. It will be understood that when the term “sample” is used herein, measurements made on a single “sample” can be based on an aggregation of multiple sample collection events or even multiple organisms.
- FIG. 6shows a screen display illustrating gene expression levels for multiple genes as collected from two tissue samples.
- a displayed horizontal axis 1002represents expression level measured in one or more nucleic acid samples taken from the first tissue sample.
- a displayed vertical axis 1004represents expression level in one or more nucleic acid samples taken from the second tissue sample.
- Each of marks 1006represent a particular gene whose expression level has been measured in both the first and second tissue samples. Each mark 1006 is placed at a distance from vertical axis 1004 corresponding to expression level in the first tissue sample and at a distance from the horizontal axis 1002 corresponding to expression level in the second tissue sample.
- the expression levels used for determining the position of marks 1006are preferably taken from the result of step 975 .
- the position of each of marks 1006depends on two iterations of the steps of FIG. 5, once for the sample taken from the first tissue sample and once for the sample taken from the second tissue sample. However, a mark is preferably displayed only if one of the samples meets the threshold criteria at step 972 .
- the first tissue sampleis a cancerous tissue sample and the second tissue sample is a normal tissue sample.
- the individual marksrepresent the expression levels of selected genes in both cancerous and normal tissue.
- a first group of marks 1008represent genes that are neither tumor suppressors nor oncogenes since their expression levels are roughly similar for both normal and cancerous tissue. These marks 1008 fall roughly along a line which is rotated 45 degrees from each of the axes.
- a second group of marks 1010represent genes that are likely oncogenes since their expression levels are found to be significantly higher in cancerous tissue than in normal tissue.
- a third group of marks 1012represent genes that are likely tumor suppressors since their expression levels are found to be significantly higher in normal tissue than in cancerous tissue. It will be appreciated that expression levels for large numbers of genes can be reviewed at once to discover the oncogenes and tumor suppressors.
- tissue samplesare normal tissue and cancerous tissue
- the present inventionwould aid in the discovery of genes whose expression is associated with any characteristic that varies among tissue samples. For example, one can compare expression results from tissue from individuals who have been exposed to HIV but remain infected to tissue obtained from infected individuals to identify genes conferring resistance to HIV. One can compare expression results between tissue from plants that survive drought to plants that do not. One can compare expression levels among tissue samples at successive stages or severity levels of the same disease, among tissue samples where different ultimate outcomes of the disease (e.g., patient death or remission) are known, among diseased tissue samples that have been subject to different treatment regimes including e.g, chemotherapy, antisense RNA, etc. For cancers one can compare expression levels between malignant cells and non-malignant cells. Also expression levels can be compared among different organs, between species, and among different stages of development of an organ.
- a third visual dimensioncan be used to illustrate expression level from a third tissue sample.
- the time dimensioncan also be used to illustrate successive groups of two or three tissue samples at successive time periods.
- the time dimensioncan be also used to correspond to tissue samples obtained at, e.g, successive stages of a disease.
- sensescan also be incorporated within the presentation system of the present invention.
- the sensesmay correspond to additional dimensions.
- markscan be displayed in succession accompanies by a sound having characteristics corresponding to expression level in another tissue sample.
- the usercan employ a cursor 1014 to identify a particular mark as being of interest.
- Cursor 1014can be moved to a particular mark by use of, e.g., mouse 11 .
- the markcan be selected by, e.g., depression of one of mouse buttons 13 . Selection of a particular mark can be facilitated by use of a zoom display feature (not shown).
- a special mousecan transmit a tactile sensation back to the user corresponding to expression level in a tissue sample as the user passes the mouse over a corresponding mark.
- each markmay correspond to a different polymer, polypeptide, or other compound.
- the distance of the mark from each axiswould correspond to a measure of presence of the particular polymer in the sample corresponding to the axis.
- One possible measureis produced by fluorescently tagging polymer samples such as protein samples and exposing a probe array such as a peptide probe array to the protein samples. The fluorescent intensity of the probes will then correspond to the bonding affinity of the sample to the probes. The intensity measurement or a measurement derived from the intensity measurement may then be used to position the marks of FIG. 6 .
- FIG. 7Ashows a screen display giving information about a particular gene selected from the display of FIG. 6.
- a cluster number 702a GenBank accession number 704 , and a verbal description 706 for the selected gene are displayed.
- the usercan also select a number of marks 1006 by circling them with cursor 1014 . Then a list of information as shown in FIG. 7A is displayed for all the genes corresponding to the selected marks.
- GenBank accession number 704By selecting GenBank accession number 704 with another cursor (not shown), the user can direct retrieval of the GenBank information for the selected gene. If the GenBank information is not available locally, the retrieval process can include formulating a query and transmitting the query to a GenBank web site. Once the GenBank information is retrieved, it can also be displayed. FIG. 7B depicts the GenBank information for the gene identified in FIG. 7 A.
Landscapes
- Life Sciences & Earth Sciences (AREA)
- Engineering & Computer Science (AREA)
- Health & Medical Sciences (AREA)
- Chemical & Material Sciences (AREA)
- Physics & Mathematics (AREA)
- Genetics & Genomics (AREA)
- Bioinformatics & Cheminformatics (AREA)
- Organic Chemistry (AREA)
- Biotechnology (AREA)
- General Engineering & Computer Science (AREA)
- Biophysics (AREA)
- Zoology (AREA)
- Wood Science & Technology (AREA)
- General Health & Medical Sciences (AREA)
- Molecular Biology (AREA)
- Bioinformatics & Computational Biology (AREA)
- Theoretical Computer Science (AREA)
- Proteomics, Peptides & Aminoacids (AREA)
- Analytical Chemistry (AREA)
- Evolutionary Biology (AREA)
- Spectroscopy & Molecular Physics (AREA)
- Biochemistry (AREA)
- Medical Informatics (AREA)
- Microbiology (AREA)
- Biomedical Technology (AREA)
- Plant Pathology (AREA)
- Immunology (AREA)
- Data Mining & Analysis (AREA)
- Crystallography & Structural Chemistry (AREA)
- General Physics & Mathematics (AREA)
- Measuring Or Testing Involving Enzymes Or Micro-Organisms (AREA)
- Apparatus Associated With Microorganisms And Enzymes (AREA)
- Information Retrieval, Db Structures And Fs Structures Therefor (AREA)
- Medical Treatment And Welfare Office Work (AREA)
- Investigating Or Analysing Biological Materials (AREA)
Abstract
Description
Claims (50)
Priority Applications (7)
| Application Number | Priority Date | Filing Date | Title |
|---|---|---|---|
| US09/020,743US6420108B2 (en) | 1998-02-09 | 1998-02-09 | Computer-aided display for comparative gene expression |
| CA002259887ACA2259887A1 (en) | 1998-02-09 | 1999-01-22 | Computer-aided visualization of expression comparison |
| EP99300900AEP0935210A3 (en) | 1998-02-09 | 1999-02-08 | Computer aided visualisation of expression comparison |
| JP3064299AJPH11342000A (en) | 1998-02-09 | 1999-02-08 | Computer-assisted visualization of manifestation comparison |
| US10/028,748US20020150932A1 (en) | 1997-12-11 | 2001-12-21 | Computer-aided visualization of expression comparison |
| US11/489,292US20070067111A1 (en) | 1997-07-25 | 2006-07-18 | Computer-aided visualization of expression comparison |
| US13/626,773US20130169645A1 (en) | 1997-12-11 | 2012-09-25 | Computer-aided visualization of expression comparison |
Applications Claiming Priority (1)
| Application Number | Priority Date | Filing Date | Title |
|---|---|---|---|
| US09/020,743US6420108B2 (en) | 1998-02-09 | 1998-02-09 | Computer-aided display for comparative gene expression |
Related Child Applications (1)
| Application Number | Title | Priority Date | Filing Date |
|---|---|---|---|
| US10/028,748ContinuationUS20020150932A1 (en) | 1997-07-25 | 2001-12-21 | Computer-aided visualization of expression comparison |
Publications (2)
| Publication Number | Publication Date |
|---|---|
| US20020015948A1 US20020015948A1 (en) | 2002-02-07 |
| US6420108B2true US6420108B2 (en) | 2002-07-16 |
Family
ID=21800291
Family Applications (4)
| Application Number | Title | Priority Date | Filing Date |
|---|---|---|---|
| US09/020,743Expired - LifetimeUS6420108B2 (en) | 1997-07-25 | 1998-02-09 | Computer-aided display for comparative gene expression |
| US10/028,748AbandonedUS20020150932A1 (en) | 1997-07-25 | 2001-12-21 | Computer-aided visualization of expression comparison |
| US11/489,292AbandonedUS20070067111A1 (en) | 1997-07-25 | 2006-07-18 | Computer-aided visualization of expression comparison |
| US13/626,773AbandonedUS20130169645A1 (en) | 1997-12-11 | 2012-09-25 | Computer-aided visualization of expression comparison |
Family Applications After (3)
| Application Number | Title | Priority Date | Filing Date |
|---|---|---|---|
| US10/028,748AbandonedUS20020150932A1 (en) | 1997-07-25 | 2001-12-21 | Computer-aided visualization of expression comparison |
| US11/489,292AbandonedUS20070067111A1 (en) | 1997-07-25 | 2006-07-18 | Computer-aided visualization of expression comparison |
| US13/626,773AbandonedUS20130169645A1 (en) | 1997-12-11 | 2012-09-25 | Computer-aided visualization of expression comparison |
Country Status (4)
| Country | Link |
|---|---|
| US (4) | US6420108B2 (en) |
| EP (1) | EP0935210A3 (en) |
| JP (1) | JPH11342000A (en) |
| CA (1) | CA2259887A1 (en) |
Cited By (86)
| Publication number | Priority date | Publication date | Assignee | Title |
|---|---|---|---|---|
| US20030009294A1 (en)* | 2001-06-07 | 2003-01-09 | Jill Cheng | Integrated system for gene expression analysis |
| US20030044775A1 (en)* | 1999-02-22 | 2003-03-06 | Vialogy Corp. | Technique for quantiating biological markers using quantum resonance interferometry |
| US20030215867A1 (en)* | 2002-05-03 | 2003-11-20 | Sandeep Gulati | System and method for characterizing microarray output data |
| US6671625B1 (en) | 1999-02-22 | 2003-12-30 | Vialogy Corp. | Method and system for signal detection in arrayed instrumentation based on quantum resonance interferometry |
| US20040002817A1 (en)* | 2000-11-22 | 2004-01-01 | Affymetrix, Inc. | Computer software products for nucleic acid hybridization analysis |
| US20040105932A1 (en)* | 1996-04-17 | 2004-06-03 | Affymetrix, Inc. | Substrate preparation process |
| US20040111219A1 (en)* | 1999-02-22 | 2004-06-10 | Sandeep Gulati | Active interferometric signal analysis in software |
| US6780589B1 (en) | 1999-02-22 | 2004-08-24 | Vialogy Corp. | Method and system using active signal processing for repeatable signal amplification in dynamic noise backgrounds |
| US6801644B1 (en)* | 1999-03-30 | 2004-10-05 | Fuji Photo Film Co., Ltd. | Method and apparatus for selectively displaying measurement result and corresponding images |
| US20050027460A1 (en)* | 2003-07-29 | 2005-02-03 | Kelkar Bhooshan Prafulla | Method, program product and apparatus for discovering functionally similar gene expression profiles |
| US20050069863A1 (en)* | 2003-09-29 | 2005-03-31 | Jorge Moraleda | Systems and methods for analyzing gene expression data for clinical diagnostics |
| US20050071143A1 (en)* | 2003-09-29 | 2005-03-31 | Quang Tran | Knowledge-based storage of diagnostic models |
| US20050112757A1 (en)* | 2001-12-19 | 2005-05-26 | Affymetrix, Inc. | Apparatus and methods for constructing array plates |
| EP1564306A2 (en) | 2004-02-17 | 2005-08-17 | Affymetrix, Inc. | Methods for fragmenting and labeling DNA |
| US20060053005A1 (en)* | 2004-09-02 | 2006-03-09 | Sandeep Gulati | Detecting events of interest using quantum resonance interferometry |
| EP1645640A2 (en) | 2004-10-05 | 2006-04-12 | Affymetrix, Inc. (a Delaware Corporation) | Methods for amplifying and analyzing nucleic acids |
| EP1647600A2 (en) | 2004-09-17 | 2006-04-19 | Affymetrix, Inc. (A US Entity) | Methods for identifying biological samples by addition of nucleic acid bar-code tags |
| EP1652580A1 (en) | 2004-10-29 | 2006-05-03 | Affymetrix, Inc. | High throughput microarray, package assembly and methods of manufacturing arrays |
| EP1655598A2 (en) | 2004-10-29 | 2006-05-10 | Affymetrix, Inc. | System, method, and product for multiple wavelength detection using single source excitation |
| US20060110747A1 (en)* | 2004-07-26 | 2006-05-25 | Dow Global Technologies Inc. | Process for improved protein expression by strain engineering |
| US7060281B1 (en)* | 1999-06-18 | 2006-06-13 | Research Foundation Of The State University Of New York | Groups of barrelia burgdorferi and borrelia afzelii that cause lyme disease in humans |
| US20060276971A1 (en)* | 2005-06-03 | 2006-12-07 | Guenther Mohr | Method and device for comparative display of biological data |
| US20070067111A1 (en)* | 1997-07-25 | 2007-03-22 | Affymetrix, Inc. | Computer-aided visualization of expression comparison |
| US20070105103A1 (en)* | 2003-05-01 | 2007-05-10 | Kazuyoshi Takeda | Array having substances fixed on support arranged with chromosomal order or sequence position information added thereto, process for producing the same, analytical system using the array and use of these |
| US20070198653A1 (en)* | 2005-12-30 | 2007-08-23 | Kurt Jarnagin | Systems and methods for remote computer-based analysis of user-provided chemogenomic data |
| WO2008021290A2 (en) | 2006-08-09 | 2008-02-21 | Homestead Clinical Corporation | Organ-specific proteins and methods of their use |
| US20080232657A1 (en)* | 2006-06-27 | 2008-09-25 | Affymetrix, Inc. | Feature Intensity Reconstruction of Biological Probe Array |
| US20090062148A1 (en)* | 1996-04-17 | 2009-03-05 | Affymetrix, Inc. | Substrate preparation process |
| US20100137162A1 (en)* | 2007-04-27 | 2010-06-03 | Pfenex Biopharmaceuticals, Inc. | Method for Rapidly Screening Microbial Hosts to Identify Certain Strains with Improved Yield and/or Quality in the Expression of Heterologous Proteins |
| WO2011056688A2 (en) | 2009-10-27 | 2011-05-12 | Caris Life Sciences, Inc. | Molecular profiling for personalized medicine |
| US20110201008A1 (en)* | 2009-12-01 | 2011-08-18 | University Of Miami | Assays, methods and kits for measuring response to therapy and predicting clinical outcome in patients with b-cell lymphoma |
| WO2011139907A2 (en) | 2010-04-29 | 2011-11-10 | Atyr Pharma, Inc. | Innovative discovery of therapeutic, diagnostic, and antibody compositions related to protein fragments of valyl trna synthetases |
| WO2011140267A2 (en) | 2010-05-04 | 2011-11-10 | Atyr Pharma, Inc. | Innovative discovery of therapeutic, diagnostic, and antibody compositions related to protein fragments of p38 multi-trna synthetase complex |
| WO2011139854A2 (en) | 2010-04-29 | 2011-11-10 | Atyr Pharma, Inc. | Innovative discovery of therapeutic, diagnostic, and antibody compositions related to protein fragments of asparaginyl trna synthetases |
| WO2011139853A2 (en) | 2010-04-28 | 2011-11-10 | Atyr Pharma, Inc. | Innovative discovery of therapeutic, diagnostic, and antibody compositions related to protein fragments of alanyl trna synthetases |
| WO2011139799A2 (en) | 2010-04-27 | 2011-11-10 | Atyr Pharma, Inc. | Innovative discovery of therapeutic, diagnostic, and antibody compositions related to protein fragments of isoleucyl trna synthetases |
| WO2011140132A2 (en) | 2010-05-03 | 2011-11-10 | Atyr Pharma, Inc. | Innovative discovery of therapeutic, diagnostic, and antibody compositions related to protein fragments of phenylalanyl-alpha-trna synthetases |
| WO2011139986A2 (en) | 2010-05-03 | 2011-11-10 | Atyr Pharma, Inc. | Innovative discovery of therapeutic, diagnostic, and antibody compositions related to protein fragments of arginyl-trna synthetases |
| WO2011139714A2 (en) | 2010-04-26 | 2011-11-10 | Atyr Pharma, Inc. | Innovative discovery of therapeutic, diagnostic, and antibody compositions related to protein fragments of cysteinyl-trna synthetase |
| WO2011140135A2 (en) | 2010-05-03 | 2011-11-10 | Atyr Pharma, Inc. | Innovative discovery of therapeutic, diagnostic, and antibody compositions related to protein fragments of methionyl-trna synthetases |
| WO2011143482A2 (en) | 2010-05-14 | 2011-11-17 | Atyr Pharma, Inc. | Innovative discovery of therapeutic, diagnostic, and antibody compositions related to protein fragments of phenylalanyl-beta-trna synthetases |
| WO2011150279A2 (en) | 2010-05-27 | 2011-12-01 | Atyr Pharma, Inc. | Innovative discovery of therapeutic, diagnostic, and antibody compositions related to protein fragments of glutaminyl-trna synthetases |
| WO2011153277A2 (en) | 2010-06-01 | 2011-12-08 | Atyr Pharma, Inc. | Innovative discovery of therapeutic, diagnostic, and antibody compositions related to protein fragments of lysyl-trna synthetases |
| WO2012006447A2 (en) | 2010-07-07 | 2012-01-12 | Myriad Genetics, Inc. | Gene signatures for cancer prognosis |
| WO2012021247A2 (en) | 2010-07-12 | 2012-02-16 | Atyr Pharma, Inc. | Innovative discovery of therapeutic, diagnostic, and antibody compositions related to protein fragments of glycyl-trna synthetases |
| WO2012027611A2 (en) | 2010-08-25 | 2012-03-01 | Atyr Pharma, Inc. | INNOVATIVE DISCOVERY OF THERAPEUTIC, DIAGNOSTIC, AND ANTIBODY COMPOSITIONS RELATED TO PROTEIN FRAGMENTS OF TYROSYL-tRNA SYNTHETASES |
| EP2450456A2 (en) | 2006-11-02 | 2012-05-09 | Yale University | Assessment of oocyte competence |
| WO2012148477A1 (en) | 2010-12-15 | 2012-11-01 | Cellular Research, Inc. | Digital counting of individual molecules by stochastic attachment of diverse label-tags |
| WO2013123432A2 (en) | 2012-02-16 | 2013-08-22 | Atyr Pharma, Inc. | Histidyl-trna synthetases for treating autoimmune and inflammatory diseases |
| WO2013130674A1 (en) | 2012-02-27 | 2013-09-06 | Cellular Research, Inc. | Compositions and kits for molecular counting |
| WO2013130512A2 (en) | 2012-02-27 | 2013-09-06 | The University Of North Carolina At Chapel Hill | Methods and uses for molecular tags |
| WO2013186562A1 (en) | 2012-06-14 | 2013-12-19 | Cambridge Enterprise Limited | Biomarkers for psychotic disorders, like depression and anxiety disorder |
| WO2014078700A1 (en) | 2012-11-16 | 2014-05-22 | Myriad Genetics, Inc. | Gene signatures for cancer prognosis |
| WO2014085434A1 (en) | 2012-11-27 | 2014-06-05 | Pontificia Universidad Catolica De Chile | Compositions and methods for diagnosing thyroid tumors |
| US8977506B2 (en) | 2003-09-29 | 2015-03-10 | Response Genetics, Inc. | Systems and methods for detecting biological features |
| WO2015175692A1 (en) | 2014-05-13 | 2015-11-19 | Myriad Genetics, Inc. | Gene signatures for cancer prognosis |
| US9394571B2 (en) | 2007-04-27 | 2016-07-19 | Pfenex Inc. | Method for rapidly screening microbial hosts to identify certain strains with improved yield and/or quality in the expression of heterologous proteins |
| WO2016113570A1 (en) | 2015-01-16 | 2016-07-21 | Cambridge Enterprise Limited | Serum biomarker panels for bipolar disorder |
| US9453251B2 (en) | 2002-10-08 | 2016-09-27 | Pfenex Inc. | Expression of mammalian proteins in Pseudomonas fluorescens |
| EP3118328A1 (en) | 2009-01-07 | 2017-01-18 | Myriad Genetics, Inc. | Cancer biomarkers |
| WO2017023929A1 (en) | 2015-08-04 | 2017-02-09 | Cd Diagnostics, Inc. | Methods for detecting adverse local tissue reaction (altr) necrosis |
| WO2017087819A1 (en) | 2015-11-19 | 2017-05-26 | Myriad Genetics, Inc. | Signatures for predicting cancer immune therapy response |
| WO2017120456A1 (en) | 2016-01-06 | 2017-07-13 | Myriad Genetics, Inc. | Genes and gene signatures for diagnosis and treatment of melanoma |
| US9798855B2 (en) | 2010-01-07 | 2017-10-24 | Affymetrix, Inc. | Differential filtering of genetic data |
| WO2017193062A1 (en) | 2016-05-06 | 2017-11-09 | Myriad Genetics, Inc. | Gene signatures for renal cancer prognosis |
| EP3260123A1 (en) | 2008-11-06 | 2017-12-27 | University of Miami | Role of soluble upar in the pathogenesis of proteinuric kidney disease |
| EP3301446A1 (en) | 2009-02-11 | 2018-04-04 | Caris MPI, Inc. | Molecular profiling of tumors |
| EP3418397A1 (en) | 2012-01-24 | 2018-12-26 | CD Diagnostics, Inc. | System for detecting infection in synovial fluid |
| WO2019005763A1 (en) | 2017-06-26 | 2019-01-03 | Phase Genomics Inc. | A method for the clustering of dna sequences |
| US10197580B2 (en) | 2014-03-10 | 2019-02-05 | Cambridge Enterprises Limited | Biomarkers associated with schizophrenia |
| WO2019046832A1 (en) | 2017-09-01 | 2019-03-07 | Juno Therapeutics, Inc. | Gene expression and assessment of risk of developing toxicity following cell therapy |
| WO2019246160A2 (en) | 2018-06-18 | 2019-12-26 | Igenomix, S.L. | Methods, compositions, and kits for assessing endometrial transformation |
| WO2020002621A2 (en) | 2018-06-29 | 2020-01-02 | F. Hoffmann-La Roche Ag | Detection of microsatellite instability |
| US10527632B2 (en) | 2010-12-20 | 2020-01-07 | Cambridge Enterprise Limited | Treating schizophrenia based on a panel of biomarkers |
| US10535420B2 (en) | 2013-03-15 | 2020-01-14 | Affymetrix, Inc. | Systems and methods for probe design to detect the presence of simple and complex indels |
| WO2020113237A1 (en) | 2018-11-30 | 2020-06-04 | Caris Mpi, Inc. | Next-generation molecular profiling |
| WO2020212580A1 (en) | 2019-04-17 | 2020-10-22 | Igenomix, S.L. | Improved methods for the early diagnosis of uterine leiomyomas and leiomyosarcomas |
| WO2020252218A1 (en) | 2019-06-12 | 2020-12-17 | Juno Therapeutics, Inc. | Combination therapy of a cell-mediated cytotoxic therapy and an inhibitor of a prosurvival bcl2 family protein |
| WO2021035194A1 (en) | 2019-08-22 | 2021-02-25 | Juno Therapeutics, Inc. | Combination therapy of a t cell therapy and an enhancer of zeste homolog 2 (ezh2) inhibitor and related methods |
| EP3798316A2 (en) | 2013-03-15 | 2021-03-31 | Myriad Genetics, Inc. | Genes and gene signatures for diagnosis and treatment of melanoma |
| WO2021123830A1 (en) | 2019-12-20 | 2021-06-24 | Cambridge Enterprise Limited | Method of determining risk of fetal size abnormality |
| US11141423B2 (en) | 2010-01-25 | 2021-10-12 | Icahn School Of Medicine At Mount Sinai | Methods of screening compounds useful for treatment of a liver disease |
| EP4250299A2 (en) | 2014-07-02 | 2023-09-27 | Myriad myPath, LLC | Genes and gene signatures for diagnosis and treatment of melanoma |
| US11842805B2 (en) | 2019-12-02 | 2023-12-12 | Caris Mpi, Inc. | Pan-cancer platinum response predictor |
| US11851715B2 (en) | 2018-10-09 | 2023-12-26 | Genecentric Therapeutics, Inc. | Detecting cancer cell of origin |
| US12410478B2 (en) | 2012-06-06 | 2025-09-09 | Myriad Genetics, Inc. | Hereditary cancer genes |
Families Citing this family (17)
| Publication number | Priority date | Publication date | Assignee | Title |
|---|---|---|---|---|
| JP3451035B2 (en) | 1999-07-27 | 2003-09-29 | 日立ソフトウエアエンジニアリング株式会社 | Microarray information display method |
| JP4320112B2 (en)* | 2000-03-27 | 2009-08-26 | 日立ソフトウエアエンジニアリング株式会社 | Gene experiment data display method |
| US7363165B2 (en)* | 2000-05-04 | 2008-04-22 | The Board Of Trustees Of The Leland Stanford Junior University | Significance analysis of microarrays |
| US6789040B2 (en) | 2000-08-22 | 2004-09-07 | Affymetrix, Inc. | System, method, and computer software product for specifying a scanning area of a substrate |
| CA2425488A1 (en)* | 2000-10-12 | 2002-04-18 | Iconix Pharmaceuticals, Inc | Interactive correlation of compound information and genomic information |
| JPWO2002048915A1 (en)* | 2000-12-11 | 2004-07-02 | 東京大学長 | Methods for detecting associations between genes |
| US20020183936A1 (en)* | 2001-01-24 | 2002-12-05 | Affymetrix, Inc. | Method, system, and computer software for providing a genomic web portal |
| JP2003159074A (en)* | 2001-11-26 | 2003-06-03 | Kudo Norio | Cancer-related gene |
| JP3563394B2 (en)* | 2002-03-26 | 2004-09-08 | 株式会社日立製作所 | Screen display system |
| EP1588142A4 (en)* | 2002-11-21 | 2007-10-31 | Wyeth Corp | Methods for diagnosing rcc and other solid tumors |
| US7588892B2 (en) | 2004-07-19 | 2009-09-15 | Entelos, Inc. | Reagent sets and gene signatures for renal tubule injury |
| WO2006088208A1 (en)* | 2005-02-21 | 2006-08-24 | Dainippon Sumitomo Pharma Co., Ltd | Method of estimating physiological change in living body and apparatus tehrefor |
| JP2007034343A (en)* | 2005-07-21 | 2007-02-08 | Fujitsu Ltd | Gene information display device, gene information display method, gene information display program, and recording medium |
| WO2007062505A1 (en) | 2005-11-17 | 2007-06-07 | Socovar, Société En Commandite | Planar parallel mechanism and method |
| US7467118B2 (en) | 2006-01-12 | 2008-12-16 | Entelos Inc. | Adjusted sparse linear programming method for classifying multi-dimensional biological data |
| US7729874B2 (en)* | 2006-11-02 | 2010-06-01 | Redmere Technology Ltd. | System and method for calibrating a high-speed cable |
| JP6639054B2 (en)* | 2014-09-17 | 2020-02-05 | ヴイアイティーオー エヌヴイ | Methods and means for analyzing hybridization |
Citations (29)
| Publication number | Priority date | Publication date | Assignee | Title |
|---|---|---|---|---|
| US4683202A (en) | 1985-03-28 | 1987-07-28 | Cetus Corporation | Process for amplifying nucleic acid sequences |
| EP0235726A2 (en) | 1986-03-05 | 1987-09-09 | Miles Inc. | Rapid detection of nucleic acid sequences in a sample by labeling the sample |
| EP0307476A1 (en) | 1986-12-20 | 1989-03-22 | KUKITA, Takeshi | Bilirubin antigen, monoclonal antibody therefor, process for their preparation, and their use |
| WO1989011548A1 (en) | 1988-05-20 | 1989-11-30 | Cetus Corporation | Immobilized sequence-specific probes |
| EP0392546A2 (en) | 1989-04-14 | 1990-10-17 | Ro Institut Za Molekularnu Genetiku I Geneticko Inzenjerstvo | Process for determination of a complete or a partial contents of very short sequences in the samples of nucleic acids connected to the discrete particles of microscopic size by hybridization with oligonucleotide probes |
| WO1990015070A1 (en) | 1989-06-07 | 1990-12-13 | Affymax Technologies N.V. | Very large scale immobilized peptide synthesis |
| WO1992010588A1 (en) | 1990-12-06 | 1992-06-25 | Affymax Technologies N.V. | Sequencing by hybridization of a target nucleic acid to a matrix of defined oligonucleotides |
| WO1992010092A1 (en) | 1990-12-06 | 1992-06-25 | Affymax Technologies N.V. | Very large scale immobilized polymer synthesis |
| US5206137A (en) | 1988-09-08 | 1993-04-27 | Lifecodes Corporation | Compositions and methods useful for genetic analysis |
| WO1993022456A1 (en) | 1992-04-27 | 1993-11-11 | Trustees Of Dartmouth College | Detection of gene sequences in biological fluids |
| WO1995011995A1 (en) | 1993-10-26 | 1995-05-04 | Affymax Technologies N.V. | Arrays of nucleic acid probes on biological chips |
| US5492806A (en) | 1987-04-01 | 1996-02-20 | Hyseq, Inc. | Method of determining an ordered sequence of subfragments of a nucleic acid fragment by hybridization of oligonucleotide probes |
| US5525464A (en) | 1987-04-01 | 1996-06-11 | Hyseq, Inc. | Method of sequencing by hybridization of oligonucleotide probes |
| EP0717113A2 (en) | 1994-10-21 | 1996-06-19 | Affymax Technologies N.V. | Computer-aided visualization and analysis system for nucleic acid sequence evaluation |
| WO1996023078A1 (en) | 1995-01-27 | 1996-08-01 | Incyte Pharmaceuticals, Inc. | Computer system storing and analyzing microbiological data |
| US5571639A (en) | 1994-05-24 | 1996-11-05 | Affymax Technologies N.V. | Computer-aided engineering system for design of sequence arrays and lithographic masks |
| WO1997010365A1 (en) | 1995-09-15 | 1997-03-20 | Affymax Technologies N.V. | Expression monitoring by hybridization to high density oligonucleotide arrays |
| WO1997017317A1 (en) | 1995-11-03 | 1997-05-15 | Pharmacia & Upjohn S.P.A. | 4-phenyl-4-oxo-butanoic acid derivatives with kynurenine-3-hydroxylase inhibiting activity |
| WO1997019410A1 (en) | 1995-11-21 | 1997-05-29 | Advanced Micro Devices, Inc. | Bus arbiter including aging factor counters to dynamically vary arbitration priority |
| WO1997027317A1 (en) | 1996-01-23 | 1997-07-31 | Affymetrix, Inc. | Nucleic acid analysis techniques |
| WO1997029212A1 (en) | 1996-02-08 | 1997-08-14 | Affymetrix, Inc. | Chip-based speciation and phenotypic characterization of microorganisms |
| US5700637A (en) | 1988-05-03 | 1997-12-23 | Isis Innovation Limited | Apparatus and method for analyzing polynucleotide sequences and method of generating oligonucleotide arrays |
| US5707806A (en) | 1995-06-07 | 1998-01-13 | Genzyme Corporation | Direct sequence identification of mutations by cleavage- and ligation-associated mutation-specific sequencing |
| EP0848067A2 (en) | 1996-12-12 | 1998-06-17 | Affymetrix, Inc. (a California Corporation) | Computer-aided techniques for analyzing biological sequences |
| US5777888A (en) | 1995-08-09 | 1998-07-07 | Regents Of The University Of California | Systems for generating and analyzing stimulus-response output signal matrices |
| US5843767A (en)* | 1993-10-28 | 1998-12-01 | Houston Advanced Research Center | Microfabricated, flowthrough porous apparatus for discrete detection of binding reactions |
| US5871697A (en) | 1995-10-24 | 1999-02-16 | Curagen Corporation | Method and apparatus for identifying, classifying, or quantifying DNA sequences in a sample without sequencing |
| US6023659A (en)* | 1996-10-10 | 2000-02-08 | Incyte Pharmaceuticals, Inc. | Database system employing protein function hierarchies for viewing biomolecular sequence data |
| US6028593A (en)* | 1995-12-01 | 2000-02-22 | Immersion Corporation | Method and apparatus for providing simulated physical interactions within computer generated environments |
Family Cites Families (25)
| Publication number | Priority date | Publication date | Assignee | Title |
|---|---|---|---|---|
| US4617431A (en)* | 1983-12-02 | 1986-10-14 | Plantronics, Inc. | Voice tube assemblies for post-auricle headsets |
| US4845653A (en)* | 1987-05-07 | 1989-07-04 | Becton, Dickinson And Company | Method of displaying multi-parameter data sets to aid in the analysis of data characteristics |
| US6203977B1 (en)* | 1988-11-15 | 2001-03-20 | Yale University | Delineation of individual human chromosomes in metaphase and interphase cells by in situ suppression hybridization |
| US5800992A (en)* | 1989-06-07 | 1998-09-01 | Fodor; Stephen P.A. | Method of detecting nucleic acids |
| US5925525A (en)* | 1989-06-07 | 1999-07-20 | Affymetrix, Inc. | Method of identifying nucleotide differences |
| US5871928A (en)* | 1989-06-07 | 1999-02-16 | Fodor; Stephen P. A. | Methods for nucleic acid analysis |
| US6384847B1 (en)* | 1992-03-20 | 2002-05-07 | International Business Machines Corporation | Interactive graphical method for analyzing many-dimensional data sets |
| US6251920B1 (en)* | 1993-05-13 | 2001-06-26 | Neorx Corporation | Prevention and treatment of cardiovascular pathologies |
| US6395494B1 (en)* | 1993-05-13 | 2002-05-28 | Neorx Corporation | Method to determine TGF-β |
| US5524070A (en)* | 1992-10-07 | 1996-06-04 | The Research Foundation Of State University Of New York | Local adaptive contrast enhancement |
| US5632282A (en)* | 1993-07-20 | 1997-05-27 | Hay; S. Hutson | Ocular disease detection apparatus |
| EP0731971A1 (en)* | 1994-09-30 | 1996-09-18 | Koninklijke Philips Electronics N.V. | Multimedia system receptive for presentation of mass data comprising an application program inclusive of a multiplatform interpreter, and a platform subsystem arranged for interaction with said multiplatform interpreter, and mass memory for use with such system or subsystem |
| US5961923A (en)* | 1995-04-25 | 1999-10-05 | Irori | Matrices with memories and uses thereof |
| US5707808A (en)* | 1996-04-15 | 1998-01-13 | The Regents Of The University Of California | Optical selection and collection of DNA fragments |
| US5989835A (en)* | 1997-02-27 | 1999-11-23 | Cellomics, Inc. | System for cell-based screening |
| US5687972A (en)* | 1996-11-26 | 1997-11-18 | Petrak; Gregory H. | Unitary oil seal assembly |
| US6308170B1 (en)* | 1997-07-25 | 2001-10-23 | Affymetrix Inc. | Gene expression and evaluation system |
| US6420108B2 (en)* | 1998-02-09 | 2002-07-16 | Affymetrix, Inc. | Computer-aided display for comparative gene expression |
| US20030036855A1 (en)* | 1998-03-16 | 2003-02-20 | Praelux Incorporated, A Corporation Of New Jersey | Method and apparatus for screening chemical compounds |
| AU2342900A (en)* | 1998-09-23 | 2000-05-01 | Cleveland Clinic Foundation, The | Novel interferon stimulated and repressed genes |
| US6567570B1 (en)* | 1998-10-30 | 2003-05-20 | Hewlett-Packard Development Company, L.P. | Optical image scanner with internal measurement of point-spread function and compensation for optical aberrations |
| US6251601B1 (en)* | 1999-02-02 | 2001-06-26 | Vysis, Inc. | Simultaneous measurement of gene expression and genomic abnormalities using nucleic acid microarrays |
| US6284465B1 (en)* | 1999-04-15 | 2001-09-04 | Agilent Technologies, Inc. | Apparatus, systems and method for locating nucleic acids bound to surfaces |
| US6569615B1 (en)* | 2000-04-10 | 2003-05-27 | The United States Of America As Represented By The Department Of Veteran's Affairs | Composition and methods for tissue preservation |
| US7731904B2 (en)* | 2000-09-19 | 2010-06-08 | Canon Kabushiki Kaisha | Method for making probe support and apparatus used for the method |
- 1998
- 1998-02-09USUS09/020,743patent/US6420108B2/ennot_activeExpired - Lifetime
- 1999
- 1999-01-22CACA002259887Apatent/CA2259887A1/ennot_activeAbandoned
- 1999-02-08EPEP99300900Apatent/EP0935210A3/ennot_activeCeased
- 1999-02-08JPJP3064299Apatent/JPH11342000A/enactivePending
- 2001
- 2001-12-21USUS10/028,748patent/US20020150932A1/ennot_activeAbandoned
- 2006
- 2006-07-18USUS11/489,292patent/US20070067111A1/ennot_activeAbandoned
- 2012
- 2012-09-25USUS13/626,773patent/US20130169645A1/ennot_activeAbandoned
Patent Citations (35)
| Publication number | Priority date | Publication date | Assignee | Title |
|---|---|---|---|---|
| US4683202B1 (en) | 1985-03-28 | 1990-11-27 | Cetus Corp | |
| US4683202A (en) | 1985-03-28 | 1987-07-28 | Cetus Corporation | Process for amplifying nucleic acid sequences |
| EP0235726A2 (en) | 1986-03-05 | 1987-09-09 | Miles Inc. | Rapid detection of nucleic acid sequences in a sample by labeling the sample |
| EP0307476A1 (en) | 1986-12-20 | 1989-03-22 | KUKITA, Takeshi | Bilirubin antigen, monoclonal antibody therefor, process for their preparation, and their use |
| US5525464A (en) | 1987-04-01 | 1996-06-11 | Hyseq, Inc. | Method of sequencing by hybridization of oligonucleotide probes |
| US5695940A (en) | 1987-04-01 | 1997-12-09 | Hyseq, Inc. | Method of sequencing by hybridization of oligonucleotide probes |
| US5667972A (en) | 1987-04-01 | 1997-09-16 | Hyseg, Inc. | Method of sequencing of genoms by hybridization of oligonucleotide probes |
| US5492806A (en) | 1987-04-01 | 1996-02-20 | Hyseq, Inc. | Method of determining an ordered sequence of subfragments of a nucleic acid fragment by hybridization of oligonucleotide probes |
| US5700637A (en) | 1988-05-03 | 1997-12-23 | Isis Innovation Limited | Apparatus and method for analyzing polynucleotide sequences and method of generating oligonucleotide arrays |
| WO1989011548A1 (en) | 1988-05-20 | 1989-11-30 | Cetus Corporation | Immobilized sequence-specific probes |
| US5206137A (en) | 1988-09-08 | 1993-04-27 | Lifecodes Corporation | Compositions and methods useful for genetic analysis |
| EP0392546A2 (en) | 1989-04-14 | 1990-10-17 | Ro Institut Za Molekularnu Genetiku I Geneticko Inzenjerstvo | Process for determination of a complete or a partial contents of very short sequences in the samples of nucleic acids connected to the discrete particles of microscopic size by hybridization with oligonucleotide probes |
| US5445934A (en) | 1989-06-07 | 1995-08-29 | Affymax Technologies N.V. | Array of oligonucleotides on a solid substrate |
| US5143854A (en) | 1989-06-07 | 1992-09-01 | Affymax Technologies N.V. | Large scale photolithographic solid phase synthesis of polypeptides and receptor binding screening thereof |
| WO1990015070A1 (en) | 1989-06-07 | 1990-12-13 | Affymax Technologies N.V. | Very large scale immobilized peptide synthesis |
| WO1992010092A1 (en) | 1990-12-06 | 1992-06-25 | Affymax Technologies N.V. | Very large scale immobilized polymer synthesis |
| WO1992010588A1 (en) | 1990-12-06 | 1992-06-25 | Affymax Technologies N.V. | Sequencing by hybridization of a target nucleic acid to a matrix of defined oligonucleotides |
| WO1993022456A1 (en) | 1992-04-27 | 1993-11-11 | Trustees Of Dartmouth College | Detection of gene sequences in biological fluids |
| WO1995011995A1 (en) | 1993-10-26 | 1995-05-04 | Affymax Technologies N.V. | Arrays of nucleic acid probes on biological chips |
| US5843767A (en)* | 1993-10-28 | 1998-12-01 | Houston Advanced Research Center | Microfabricated, flowthrough porous apparatus for discrete detection of binding reactions |
| US5571639A (en) | 1994-05-24 | 1996-11-05 | Affymax Technologies N.V. | Computer-aided engineering system for design of sequence arrays and lithographic masks |
| US5593839A (en) | 1994-05-24 | 1997-01-14 | Affymetrix, Inc. | Computer-aided engineering system for design of sequence arrays and lithographic masks |
| EP0717113A2 (en) | 1994-10-21 | 1996-06-19 | Affymax Technologies N.V. | Computer-aided visualization and analysis system for nucleic acid sequence evaluation |
| WO1996023078A1 (en) | 1995-01-27 | 1996-08-01 | Incyte Pharmaceuticals, Inc. | Computer system storing and analyzing microbiological data |
| US5707806A (en) | 1995-06-07 | 1998-01-13 | Genzyme Corporation | Direct sequence identification of mutations by cleavage- and ligation-associated mutation-specific sequencing |
| US5777888A (en) | 1995-08-09 | 1998-07-07 | Regents Of The University Of California | Systems for generating and analyzing stimulus-response output signal matrices |
| WO1997010365A1 (en) | 1995-09-15 | 1997-03-20 | Affymax Technologies N.V. | Expression monitoring by hybridization to high density oligonucleotide arrays |
| US5871697A (en) | 1995-10-24 | 1999-02-16 | Curagen Corporation | Method and apparatus for identifying, classifying, or quantifying DNA sequences in a sample without sequencing |
| WO1997017317A1 (en) | 1995-11-03 | 1997-05-15 | Pharmacia & Upjohn S.P.A. | 4-phenyl-4-oxo-butanoic acid derivatives with kynurenine-3-hydroxylase inhibiting activity |
| WO1997019410A1 (en) | 1995-11-21 | 1997-05-29 | Advanced Micro Devices, Inc. | Bus arbiter including aging factor counters to dynamically vary arbitration priority |
| US6028593A (en)* | 1995-12-01 | 2000-02-22 | Immersion Corporation | Method and apparatus for providing simulated physical interactions within computer generated environments |
| WO1997027317A1 (en) | 1996-01-23 | 1997-07-31 | Affymetrix, Inc. | Nucleic acid analysis techniques |
| WO1997029212A1 (en) | 1996-02-08 | 1997-08-14 | Affymetrix, Inc. | Chip-based speciation and phenotypic characterization of microorganisms |
| US6023659A (en)* | 1996-10-10 | 2000-02-08 | Incyte Pharmaceuticals, Inc. | Database system employing protein function hierarchies for viewing biomolecular sequence data |
| EP0848067A2 (en) | 1996-12-12 | 1998-06-17 | Affymetrix, Inc. (a California Corporation) | Computer-aided techniques for analyzing biological sequences |
Non-Patent Citations (22)
Cited By (128)
| Publication number | Priority date | Publication date | Assignee | Title |
|---|---|---|---|---|
| US20050181396A1 (en)* | 1996-04-17 | 2005-08-18 | Affymetrix, Inc. | Substrate preparation process |
| US20060160099A1 (en)* | 1996-04-17 | 2006-07-20 | Affymetrix, Inc. | Substrate preparation process |
| US20090062148A1 (en)* | 1996-04-17 | 2009-03-05 | Affymetrix, Inc. | Substrate preparation process |
| US8067578B2 (en) | 1996-04-17 | 2011-11-29 | Affymetrix, Inc. | Substrate preparation process |
| US8309496B2 (en) | 1996-04-17 | 2012-11-13 | Affymetrix, Inc. | Methods for photolithographic synthesis of polymer arrays utilizing anti-reflective coatings |
| US8637434B2 (en) | 1996-04-17 | 2014-01-28 | Affymetrix, Inc. | System for photolithographic synthesis of polymer arrays |
| US20040105932A1 (en)* | 1996-04-17 | 2004-06-03 | Affymetrix, Inc. | Substrate preparation process |
| US20060008840A1 (en)* | 1996-04-17 | 2006-01-12 | Affymetrix, Inc. | Substrate preparation process |
| US20050181431A1 (en)* | 1996-04-17 | 2005-08-18 | Affymetrix, Inc. | Substrate preparation process |
| US20070067111A1 (en)* | 1997-07-25 | 2007-03-22 | Affymetrix, Inc. | Computer-aided visualization of expression comparison |
| US20040111219A1 (en)* | 1999-02-22 | 2004-06-10 | Sandeep Gulati | Active interferometric signal analysis in software |
| US20030044775A1 (en)* | 1999-02-22 | 2003-03-06 | Vialogy Corp. | Technique for quantiating biological markers using quantum resonance interferometry |
| US6671625B1 (en) | 1999-02-22 | 2003-12-30 | Vialogy Corp. | Method and system for signal detection in arrayed instrumentation based on quantum resonance interferometry |
| US6780589B1 (en) | 1999-02-22 | 2004-08-24 | Vialogy Corp. | Method and system using active signal processing for repeatable signal amplification in dynamic noise backgrounds |
| US6704662B2 (en) | 1999-02-22 | 2004-03-09 | Vialogy Corp. | Technique for quantiating biological markers using quantum resonance interferometry |
| US6801644B1 (en)* | 1999-03-30 | 2004-10-05 | Fuji Photo Film Co., Ltd. | Method and apparatus for selectively displaying measurement result and corresponding images |
| US7060281B1 (en)* | 1999-06-18 | 2006-06-13 | Research Foundation Of The State University Of New York | Groups of barrelia burgdorferi and borrelia afzelii that cause lyme disease in humans |
| US20060142951A1 (en)* | 2000-11-22 | 2006-06-29 | Affymetrix, Inc. | Computer software products for nucleic acid hybridization analysis |
| US6996475B2 (en) | 2000-11-22 | 2006-02-07 | Affymatrix, Inc | Computer software products for nucleic acid hybridization analysis |
| US20040002817A1 (en)* | 2000-11-22 | 2004-01-01 | Affymetrix, Inc. | Computer software products for nucleic acid hybridization analysis |
| US20030009294A1 (en)* | 2001-06-07 | 2003-01-09 | Jill Cheng | Integrated system for gene expression analysis |
| US20050112757A1 (en)* | 2001-12-19 | 2005-05-26 | Affymetrix, Inc. | Apparatus and methods for constructing array plates |
| US7466851B2 (en) | 2002-05-03 | 2008-12-16 | Vialogy Llc | Technique for extracting arrayed data |
| US7006680B2 (en) | 2002-05-03 | 2006-02-28 | Vialogy Corp. | System and method for characterizing microarray output data |
| US20030215867A1 (en)* | 2002-05-03 | 2003-11-20 | Sandeep Gulati | System and method for characterizing microarray output data |
| US20050105787A1 (en)* | 2002-05-03 | 2005-05-19 | Vialogy Corp., A Delaware Corporation | Technique for extracting arrayed data |
| US10041102B2 (en) | 2002-10-08 | 2018-08-07 | Pfenex Inc. | Expression of mammalian proteins in Pseudomonas fluorescens |
| US9453251B2 (en) | 2002-10-08 | 2016-09-27 | Pfenex Inc. | Expression of mammalian proteins in Pseudomonas fluorescens |
| US9458487B2 (en) | 2002-10-08 | 2016-10-04 | Pfenex, Inc. | Expression of mammalian proteins in pseudomonas fluorescens |
| US20070105103A1 (en)* | 2003-05-01 | 2007-05-10 | Kazuyoshi Takeda | Array having substances fixed on support arranged with chromosomal order or sequence position information added thereto, process for producing the same, analytical system using the array and use of these |
| US20050027460A1 (en)* | 2003-07-29 | 2005-02-03 | Kelkar Bhooshan Prafulla | Method, program product and apparatus for discovering functionally similar gene expression profiles |
| US8321137B2 (en) | 2003-09-29 | 2012-11-27 | Pathwork Diagnostics, Inc. | Knowledge-based storage of diagnostic models |
| US20050071143A1 (en)* | 2003-09-29 | 2005-03-31 | Quang Tran | Knowledge-based storage of diagnostic models |
| US8977506B2 (en) | 2003-09-29 | 2015-03-10 | Response Genetics, Inc. | Systems and methods for detecting biological features |
| US20050069863A1 (en)* | 2003-09-29 | 2005-03-31 | Jorge Moraleda | Systems and methods for analyzing gene expression data for clinical diagnostics |
| EP1564306A2 (en) | 2004-02-17 | 2005-08-17 | Affymetrix, Inc. | Methods for fragmenting and labeling DNA |
| US9109229B2 (en) | 2004-07-26 | 2015-08-18 | Pfenex Inc. | Process for improved protein expression by strain engineering |
| US20060110747A1 (en)* | 2004-07-26 | 2006-05-25 | Dow Global Technologies Inc. | Process for improved protein expression by strain engineering |
| US8603824B2 (en) | 2004-07-26 | 2013-12-10 | Pfenex, Inc. | Process for improved protein expression by strain engineering |
| EP2412816A2 (en) | 2004-07-26 | 2012-02-01 | Pfenex, Inc. | Process for improved protein expression by strain engineering |
| US20060053005A1 (en)* | 2004-09-02 | 2006-03-09 | Sandeep Gulati | Detecting events of interest using quantum resonance interferometry |
| US8484000B2 (en) | 2004-09-02 | 2013-07-09 | Vialogy Llc | Detecting events of interest using quantum resonance interferometry |
| EP1647600A2 (en) | 2004-09-17 | 2006-04-19 | Affymetrix, Inc. (A US Entity) | Methods for identifying biological samples by addition of nucleic acid bar-code tags |
| EP1645640A2 (en) | 2004-10-05 | 2006-04-12 | Affymetrix, Inc. (a Delaware Corporation) | Methods for amplifying and analyzing nucleic acids |
| EP1655598A2 (en) | 2004-10-29 | 2006-05-10 | Affymetrix, Inc. | System, method, and product for multiple wavelength detection using single source excitation |
| EP1652580A1 (en) | 2004-10-29 | 2006-05-03 | Affymetrix, Inc. | High throughput microarray, package assembly and methods of manufacturing arrays |
| US20060276971A1 (en)* | 2005-06-03 | 2006-12-07 | Guenther Mohr | Method and device for comparative display of biological data |
| US8121793B2 (en) | 2005-06-03 | 2012-02-21 | Eppendorf Ag | Method and device for comparative display of biological data |
| US20070198653A1 (en)* | 2005-12-30 | 2007-08-23 | Kurt Jarnagin | Systems and methods for remote computer-based analysis of user-provided chemogenomic data |
| US8369596B2 (en) | 2006-06-27 | 2013-02-05 | Affymetrix, Inc. | Feature intensity reconstruction of biological probe array |
| US8934689B2 (en) | 2006-06-27 | 2015-01-13 | Affymetrix, Inc. | Feature intensity reconstruction of biological probe array |
| US8009889B2 (en) | 2006-06-27 | 2011-08-30 | Affymetrix, Inc. | Feature intensity reconstruction of biological probe array |
| US9147103B2 (en) | 2006-06-27 | 2015-09-29 | Affymetrix, Inc. | Feature intensity reconstruction of biological probe array |
| US20080232657A1 (en)* | 2006-06-27 | 2008-09-25 | Affymetrix, Inc. | Feature Intensity Reconstruction of Biological Probe Array |
| WO2008021290A2 (en) | 2006-08-09 | 2008-02-21 | Homestead Clinical Corporation | Organ-specific proteins and methods of their use |
| EP2520935A2 (en) | 2006-08-09 | 2012-11-07 | Homestead Clinical Corporation | Organ-specific proteins and methods of their use |
| EP2450456A2 (en) | 2006-11-02 | 2012-05-09 | Yale University | Assessment of oocyte competence |
| US9580719B2 (en) | 2007-04-27 | 2017-02-28 | Pfenex, Inc. | Method for rapidly screening microbial hosts to identify certain strains with improved yield and/or quality in the expression of heterologous proteins |
| US20100137162A1 (en)* | 2007-04-27 | 2010-06-03 | Pfenex Biopharmaceuticals, Inc. | Method for Rapidly Screening Microbial Hosts to Identify Certain Strains with Improved Yield and/or Quality in the Expression of Heterologous Proteins |
| US9394571B2 (en) | 2007-04-27 | 2016-07-19 | Pfenex Inc. | Method for rapidly screening microbial hosts to identify certain strains with improved yield and/or quality in the expression of heterologous proteins |
| US10689640B2 (en) | 2007-04-27 | 2020-06-23 | Pfenex Inc. | Method for rapidly screening microbial hosts to identify certain strains with improved yield and/or quality in the expression of heterologous proteins |
| EP3260123A1 (en) | 2008-11-06 | 2017-12-27 | University of Miami | Role of soluble upar in the pathogenesis of proteinuric kidney disease |
| EP3118328A1 (en) | 2009-01-07 | 2017-01-18 | Myriad Genetics, Inc. | Cancer biomarkers |
| EP4328589A2 (en) | 2009-01-07 | 2024-02-28 | Myriad Genetics, Inc. | Cancer biomarkers |
| EP3524697A1 (en) | 2009-01-07 | 2019-08-14 | Myriad Genetics, Inc. | Cancer biomarkers |
| EP3301446A1 (en) | 2009-02-11 | 2018-04-04 | Caris MPI, Inc. | Molecular profiling of tumors |
| EP3722810A2 (en) | 2009-02-11 | 2020-10-14 | Caris MPI, Inc. | Molecular profiling of tumors |
| WO2011056688A2 (en) | 2009-10-27 | 2011-05-12 | Caris Life Sciences, Inc. | Molecular profiling for personalized medicine |
| US20110201008A1 (en)* | 2009-12-01 | 2011-08-18 | University Of Miami | Assays, methods and kits for measuring response to therapy and predicting clinical outcome in patients with b-cell lymphoma |
| US10872681B2 (en) | 2010-01-07 | 2020-12-22 | Affymetrix, Inc. | Differential filtering of genetic data |
| US9798855B2 (en) | 2010-01-07 | 2017-10-24 | Affymetrix, Inc. | Differential filtering of genetic data |
| US11141423B2 (en) | 2010-01-25 | 2021-10-12 | Icahn School Of Medicine At Mount Sinai | Methods of screening compounds useful for treatment of a liver disease |
| WO2011139714A2 (en) | 2010-04-26 | 2011-11-10 | Atyr Pharma, Inc. | Innovative discovery of therapeutic, diagnostic, and antibody compositions related to protein fragments of cysteinyl-trna synthetase |
| WO2011139799A2 (en) | 2010-04-27 | 2011-11-10 | Atyr Pharma, Inc. | Innovative discovery of therapeutic, diagnostic, and antibody compositions related to protein fragments of isoleucyl trna synthetases |
| WO2011139853A2 (en) | 2010-04-28 | 2011-11-10 | Atyr Pharma, Inc. | Innovative discovery of therapeutic, diagnostic, and antibody compositions related to protein fragments of alanyl trna synthetases |
| WO2011139854A2 (en) | 2010-04-29 | 2011-11-10 | Atyr Pharma, Inc. | Innovative discovery of therapeutic, diagnostic, and antibody compositions related to protein fragments of asparaginyl trna synthetases |
| WO2011139907A2 (en) | 2010-04-29 | 2011-11-10 | Atyr Pharma, Inc. | Innovative discovery of therapeutic, diagnostic, and antibody compositions related to protein fragments of valyl trna synthetases |
| WO2011140132A2 (en) | 2010-05-03 | 2011-11-10 | Atyr Pharma, Inc. | Innovative discovery of therapeutic, diagnostic, and antibody compositions related to protein fragments of phenylalanyl-alpha-trna synthetases |
| WO2011139986A2 (en) | 2010-05-03 | 2011-11-10 | Atyr Pharma, Inc. | Innovative discovery of therapeutic, diagnostic, and antibody compositions related to protein fragments of arginyl-trna synthetases |
| WO2011140135A2 (en) | 2010-05-03 | 2011-11-10 | Atyr Pharma, Inc. | Innovative discovery of therapeutic, diagnostic, and antibody compositions related to protein fragments of methionyl-trna synthetases |
| WO2011140267A2 (en) | 2010-05-04 | 2011-11-10 | Atyr Pharma, Inc. | Innovative discovery of therapeutic, diagnostic, and antibody compositions related to protein fragments of p38 multi-trna synthetase complex |
| WO2011143482A2 (en) | 2010-05-14 | 2011-11-17 | Atyr Pharma, Inc. | Innovative discovery of therapeutic, diagnostic, and antibody compositions related to protein fragments of phenylalanyl-beta-trna synthetases |
| WO2011150279A2 (en) | 2010-05-27 | 2011-12-01 | Atyr Pharma, Inc. | Innovative discovery of therapeutic, diagnostic, and antibody compositions related to protein fragments of glutaminyl-trna synthetases |
| WO2011153277A2 (en) | 2010-06-01 | 2011-12-08 | Atyr Pharma, Inc. | Innovative discovery of therapeutic, diagnostic, and antibody compositions related to protein fragments of lysyl-trna synthetases |
| EP3812469A1 (en) | 2010-07-07 | 2021-04-28 | Myriad Genetics, Inc. | Gene signatures for cancer prognosis |
| WO2012006447A2 (en) | 2010-07-07 | 2012-01-12 | Myriad Genetics, Inc. | Gene signatures for cancer prognosis |
| WO2012021247A2 (en) | 2010-07-12 | 2012-02-16 | Atyr Pharma, Inc. | Innovative discovery of therapeutic, diagnostic, and antibody compositions related to protein fragments of glycyl-trna synthetases |
| WO2012027611A2 (en) | 2010-08-25 | 2012-03-01 | Atyr Pharma, Inc. | INNOVATIVE DISCOVERY OF THERAPEUTIC, DIAGNOSTIC, AND ANTIBODY COMPOSITIONS RELATED TO PROTEIN FRAGMENTS OF TYROSYL-tRNA SYNTHETASES |
| WO2012148477A1 (en) | 2010-12-15 | 2012-11-01 | Cellular Research, Inc. | Digital counting of individual molecules by stochastic attachment of diverse label-tags |
| US10527632B2 (en) | 2010-12-20 | 2020-01-07 | Cambridge Enterprise Limited | Treating schizophrenia based on a panel of biomarkers |
| EP3418397A1 (en) | 2012-01-24 | 2018-12-26 | CD Diagnostics, Inc. | System for detecting infection in synovial fluid |
| WO2013123432A2 (en) | 2012-02-16 | 2013-08-22 | Atyr Pharma, Inc. | Histidyl-trna synthetases for treating autoimmune and inflammatory diseases |
| EP3311847A1 (en) | 2012-02-16 | 2018-04-25 | Atyr Pharma, Inc. | Histidyl-trna synthetases for treating autoimmune and inflammatory diseases |
| EP3321378A1 (en) | 2012-02-27 | 2018-05-16 | Cellular Research, Inc. | Compositions and kits for molecular counting |
| WO2013130512A2 (en) | 2012-02-27 | 2013-09-06 | The University Of North Carolina At Chapel Hill | Methods and uses for molecular tags |
| WO2013130674A1 (en) | 2012-02-27 | 2013-09-06 | Cellular Research, Inc. | Compositions and kits for molecular counting |
| US12410478B2 (en) | 2012-06-06 | 2025-09-09 | Myriad Genetics, Inc. | Hereditary cancer genes |
| US10101338B2 (en) | 2012-06-14 | 2018-10-16 | Cambridge Enterprise Limited | Biomarkers |
| WO2013186562A1 (en) | 2012-06-14 | 2013-12-19 | Cambridge Enterprise Limited | Biomarkers for psychotic disorders, like depression and anxiety disorder |
| EP4190918A1 (en) | 2012-11-16 | 2023-06-07 | Myriad Genetics, Inc. | Gene signatures for cancer prognosis |
| WO2014078700A1 (en) | 2012-11-16 | 2014-05-22 | Myriad Genetics, Inc. | Gene signatures for cancer prognosis |
| WO2014085434A1 (en) | 2012-11-27 | 2014-06-05 | Pontificia Universidad Catolica De Chile | Compositions and methods for diagnosing thyroid tumors |
| US10535420B2 (en) | 2013-03-15 | 2020-01-14 | Affymetrix, Inc. | Systems and methods for probe design to detect the presence of simple and complex indels |
| EP3798316A2 (en) | 2013-03-15 | 2021-03-31 | Myriad Genetics, Inc. | Genes and gene signatures for diagnosis and treatment of melanoma |
| EP4043580A1 (en) | 2013-03-15 | 2022-08-17 | Myriad myPath, LLC | Genes and gene signatures for diagnosis and treatment of melanoma |
| US10197580B2 (en) | 2014-03-10 | 2019-02-05 | Cambridge Enterprises Limited | Biomarkers associated with schizophrenia |
| WO2015175692A1 (en) | 2014-05-13 | 2015-11-19 | Myriad Genetics, Inc. | Gene signatures for cancer prognosis |
| EP3623482A1 (en) | 2014-05-13 | 2020-03-18 | Myriad Genetics, Inc. | Gene signatures for cancer prognosis |
| EP4250299A2 (en) | 2014-07-02 | 2023-09-27 | Myriad myPath, LLC | Genes and gene signatures for diagnosis and treatment of melanoma |
| WO2016113570A1 (en) | 2015-01-16 | 2016-07-21 | Cambridge Enterprise Limited | Serum biomarker panels for bipolar disorder |
| WO2017023929A1 (en) | 2015-08-04 | 2017-02-09 | Cd Diagnostics, Inc. | Methods for detecting adverse local tissue reaction (altr) necrosis |
| WO2017087819A1 (en) | 2015-11-19 | 2017-05-26 | Myriad Genetics, Inc. | Signatures for predicting cancer immune therapy response |
| WO2017120456A1 (en) | 2016-01-06 | 2017-07-13 | Myriad Genetics, Inc. | Genes and gene signatures for diagnosis and treatment of melanoma |
| WO2017193062A1 (en) | 2016-05-06 | 2017-11-09 | Myriad Genetics, Inc. | Gene signatures for renal cancer prognosis |
| WO2019005763A1 (en) | 2017-06-26 | 2019-01-03 | Phase Genomics Inc. | A method for the clustering of dna sequences |
| WO2019046832A1 (en) | 2017-09-01 | 2019-03-07 | Juno Therapeutics, Inc. | Gene expression and assessment of risk of developing toxicity following cell therapy |
| WO2019246160A2 (en) | 2018-06-18 | 2019-12-26 | Igenomix, S.L. | Methods, compositions, and kits for assessing endometrial transformation |
| WO2020002621A2 (en) | 2018-06-29 | 2020-01-02 | F. Hoffmann-La Roche Ag | Detection of microsatellite instability |
| US11851715B2 (en) | 2018-10-09 | 2023-12-26 | Genecentric Therapeutics, Inc. | Detecting cancer cell of origin |
| EP4369356A2 (en) | 2018-11-30 | 2024-05-15 | Caris MPI, Inc. | Next-generation molecular profiling |
| US11315673B2 (en) | 2018-11-30 | 2022-04-26 | Caris Mpi, Inc. | Next-generation molecular profiling |
| US12165759B2 (en) | 2018-11-30 | 2024-12-10 | Caris Mpi, Inc. | Classifying an entity for FOLFOX treatment |
| WO2020113237A1 (en) | 2018-11-30 | 2020-06-04 | Caris Mpi, Inc. | Next-generation molecular profiling |
| WO2020212580A1 (en) | 2019-04-17 | 2020-10-22 | Igenomix, S.L. | Improved methods for the early diagnosis of uterine leiomyomas and leiomyosarcomas |
| WO2020252218A1 (en) | 2019-06-12 | 2020-12-17 | Juno Therapeutics, Inc. | Combination therapy of a cell-mediated cytotoxic therapy and an inhibitor of a prosurvival bcl2 family protein |
| WO2021035194A1 (en) | 2019-08-22 | 2021-02-25 | Juno Therapeutics, Inc. | Combination therapy of a t cell therapy and an enhancer of zeste homolog 2 (ezh2) inhibitor and related methods |
| US11842805B2 (en) | 2019-12-02 | 2023-12-12 | Caris Mpi, Inc. | Pan-cancer platinum response predictor |
| WO2021123830A1 (en) | 2019-12-20 | 2021-06-24 | Cambridge Enterprise Limited | Method of determining risk of fetal size abnormality |
Also Published As
| Publication number | Publication date |
|---|---|
| US20130169645A1 (en) | 2013-07-04 |
| EP0935210A3 (en) | 2002-11-20 |
| JPH11342000A (en) | 1999-12-14 |
| EP0935210A2 (en) | 1999-08-11 |
| US20070067111A1 (en) | 2007-03-22 |
| US20020150932A1 (en) | 2002-10-17 |
| CA2259887A1 (en) | 1999-08-09 |
| US20020015948A1 (en) | 2002-02-07 |
Similar Documents
| Publication | Publication Date | Title |
|---|---|---|
| US6420108B2 (en) | Computer-aided display for comparative gene expression | |
| US6263287B1 (en) | Systems for the analysis of gene expression data | |
| US6600996B2 (en) | Computer-aided techniques for analyzing biological sequences | |
| US6308170B1 (en) | Gene expression and evaluation system | |
| US5733729A (en) | Computer-aided probability base calling for arrays of nucleic acid probes on chips | |
| EP1019536B1 (en) | Polymorphism detection utilizing clustering analysis | |
| US6361937B1 (en) | Computer-aided nucleic acid sequencing | |
| CN102349075B (en) | Discovery curve analysis system and its program | |
| US6502039B1 (en) | Mathematical analysis for the estimation of changes in the level of gene expression | |
| US7031843B1 (en) | Computer methods and systems for displaying information relating to gene expression data | |
| JP4320112B2 (en) | Gene experiment data display method | |
| Kincaid | VistaClara: an interactive visualization for exploratory analysis of DNA microarrays | |
| JP4557609B2 (en) | How to display splice variant sequence mapping | |
| EP1134687A2 (en) | Method for displaying results of hybridization experiments | |
| Wessel et al. | CorrXpression–identification of significant groups of genes and experiments by means of correspondence analysis and ratio analysis | |
| US20030220748A1 (en) | Computer-aided techniques for analyzing biological sequences | |
| EP1632579A2 (en) | Computer-aided techniques for analyzing biological sequences | |
| Yano et al. | Profiling the IgA nephropathy renal transcriptome: analysis by complementary DNA array hybridization | |
| Maziarz | Spotting error in cDNA microarray data | |
| Seo | Interactively Exploring |
Legal Events
| Date | Code | Title | Description |
|---|---|---|---|
| AS | Assignment | Owner name:AFFYMETRIX, INC., CALIFORNIA Free format text:ASSIGNMENT OF ASSIGNORS INTEREST;ASSIGNOR:MACK, DAVID H.;REEL/FRAME:009418/0370 Effective date:19980624 | |
| AS | Assignment | Owner name:AFFYMETRIX, INC., A CORP. OF DELAWARE, CALIFORNIA Free format text:MERGER;ASSIGNOR:AFFYMETRIX, INC., A CORP. OF CALIFORNIA;REEL/FRAME:010217/0377 Effective date:19980928 | |
| STCF | Information on status: patent grant | Free format text:PATENTED CASE | |
| FPAY | Fee payment | Year of fee payment:4 | |
| CC | Certificate of correction | ||
| FPAY | Fee payment | Year of fee payment:8 | |
| AS | Assignment | Owner name:GENERAL ELECTRIC CAPITAL CORPORATION, AS AGENT, MA Free format text:SECURITY AGREEMENT;ASSIGNOR:AFFYMETRIX, INC.;REEL/FRAME:028465/0541 Effective date:20120625 | |
| FPAY | Fee payment | Year of fee payment:12 | |
| AS | Assignment | Owner name:BANK OF AMERICA, N.A., AS ADMINISTRATIVE AGENT, TE Free format text:SECURITY INTEREST;ASSIGNOR:AFFYMETRIX, INC.;REEL/FRAME:036988/0166 Effective date:20151028 | |
| AS | Assignment | Owner name:AFFYMETRIX, INC., CALIFORNIA Free format text:RELEASE BY SECURED PARTY;ASSIGNOR:GENERAL ELECTRIC CAPITAL CORPORATION, AS AGENT;REEL/FRAME:037109/0132 Effective date:20151028 | |
| AS | Assignment | Owner name:AFFYMETRIX, INC., CALIFORNIA Free format text:NOTICE OF RELEASE;ASSIGNOR:BANK OF AMERICA, N.A.;REEL/FRAME:038361/0891 Effective date:20160328 |