US5999192A - Interactive data exploration apparatus and methods - Google Patents
Interactive data exploration apparatus and methodsDownload PDFInfo
- Publication number
- US5999192A US5999192AUS08/640,411US64041196AUS5999192AUS 5999192 AUS5999192 AUS 5999192AUS 64041196 AUS64041196 AUS 64041196AUS 5999192 AUS5999192 AUS 5999192A
- Authority
- US
- United States
- Prior art keywords
- data
- node
- graph
- operations
- segmentation
- Prior art date
- Legal status (The legal status is an assumption and is not a legal conclusion. Google has not performed a legal analysis and makes no representation as to the accuracy of the status listed.)
- Expired - Lifetime
Links
Images


Classifications
- G—PHYSICS
- G06—COMPUTING OR CALCULATING; COUNTING
- G06F—ELECTRIC DIGITAL DATA PROCESSING
- G06F16/00—Information retrieval; Database structures therefor; File system structures therefor
- G06F16/20—Information retrieval; Database structures therefor; File system structures therefor of structured data, e.g. relational data
- G06F16/26—Visual data mining; Browsing structured data
Definitions
- the inventionconcerns graphical user interfaces generally and more particularly concerns graphical user interfaces for data exploration systems.
- the computerhas permitted organizations to acquire, store, and access vast amounts of data about their operations, their suppliers, their customers, and their employees.
- the existence of this datahas in turn lead to the development of techniques for exploring and analyzing the data and the emergence of a new information specialist: the business data analyst or BDA.
- the business data analystis not without tools.
- Other toolsinclude ad-hoc query tools and report writers. New commercial tools continue to appear almost weekly.
- AT&T Corpmarkets a variety of telecommunications services.
- the marketing activitiesinclude promotions, on-going advertisement, new service offerings, new equipment offerings, bundled offerings, etc.
- AT&T's competitorsare engaged in the same kinds of activities.
- AT&Tis vitally interested in understanding the general market reaction to these efforts; doing so is surprisingly difficult.
- AT&Thas many large databases containing billing and customer premise equipment information, it is still difficult to find the right data and interpret it in the right context to glean the appropriate business insight. It is the task of the business data analyst to use this data to answer various business questions.
- a data filewhich combines data from many sources, might have 15 million records and take up 1/2 a gigabyte of storage. AT&T has many hundreds of such data files. For this reason, the data is not read into a relational data base. Instead, AT&T keeps most of the data files on 8 mm tape until they are needed, at which point they are read into flat files of the type used in the UNIX operating system for processing (UNIX is a trade mark of the X Open Foundation).
- a typical one to two hour exploration and analysis session at AT&Tinvolves operations like the following:
- the problemsare overcome by means of a graphical interface for specifying operations on data.
- the graphical interfacelets the user specify the operations as a directed graph of one or more nodes and edges, with each node representing an operation on the data and with an edge indicating that the node the edge comes from is a source of data for the operation represented by the node to which the edge goes.
- the directed graphthus provides a derivation history of the operations on the data.
- the userselects a node in the branch.
- the directed graphis a tree whose root is a node representing a source of data.
- the operations specified by the nodesinclude queries of the source of data represented by the incoming edge, segmentations of the source of data, aggregation operations on the source of data, a viewer operation which displays the data of the source, and an external tool operation which provides the data of the source to an external tool.
- the graphical interfacepermits the user to edit the graph and in some embodiments, the graphical interface will indicate whether a node of a given class can be added at that point of the graph.
- the graphical interfacealso provides directed graphs whose edges show subsumption connections between the nodes. There is a subsumption connection between two nodes if the data which results from the operation represented by the second node reveals more detail about the data which results from the operation represented by the first node. There are four kinds of subsumption connections which may be displayed in a preferred embodiment: query--query, segmentation--segmentation, query-segmentation, and segmentation-query.
- the graphical interfacedisplays the directed graph for the subsumption connection as an overlay on the directed graph for the derivation history.
- a client-server architecturein which the data base operations are performed in the server and the client displays the directed graphs, provides data base queries derived from the directed graphs to the server, and receives the tables resulting from those queries;
- FIG. 1shows a display window of the preferred embodiment
- FIG. 2is a table of the node types employed in the preferred embodiment
- FIG. 3is a first display window of a session in which the preferred embodiment is employed
- FIG. 4is a second display window of the session
- FIG. 5is a third display window of the session
- FIG. 6is a menu usable in a display window of the session
- FIG. 7is a fourth display window of the session
- FIG. 8is a fifth display window of the session
- FIG. 9is a sixth display window of the session.
- FIG. 10is a seventh display window of the session
- FIG. 11is an eighth display window of the session.
- FIG. 12is an overview of a preferred embodiment of the system
- FIG. 13is an overview of the data structure which represents a graph in the preferred embodiment.
- FIG. 14is a detail of a node object.
- FIGS. 1-11The User Interface of a Preferred Embodiment: FIGS. 1-11
- a business data analyst who uses the data exploration and analysis system disclosed hereininteracts with the system by means of input devices such as a keyboard and a pointing device (for example, a mouse), and an output device such as a display screen.
- input devicessuch as a keyboard and a pointing device (for example, a mouse)
- output devicesuch as a display screen.
- the displays on the display screenare produced by a windowing system, and the windowing system also handles inputs from the input devices.
- FIG. 1A Typical Display Window: FIG. 1
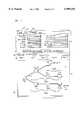
- FIG. 1shows a typical display window 101 for the data exploration and analysis system.
- the windowhas two main sections: bottom section 110 contains a directed graph 111 of nodes connected by edges 115. Directed graph 111 represents a sequence of data analysis operation.
- Top section 103is used to define nodes of graph 111.
- Each node in directed graph 111represents an operation; an edge 115 connecting a first node and a a second node indicates that the operation represented by the second node is done on the result of the operation represented by the first node.
- directed graph 111has a base node 113 as its root.
- Base node 113represents the data set to which the operations in the directed graph are to be applied.
- the operations represented by the nodesinclude query operations, segmentation operations, aggregation operations, and viewer operations.
- a query operation in the present contextspecifies a set of data to be returned to the business data analyst.
- the setis generally a subset of a larger set, and the query specifies the subset by limiting the larger set.
- the datamay include people of every age, and the query may define a subset of the data by restricting the ages people in the subset may have to the range 21-30 years.
- a segmentation operationdivides a set of data into non-overlapping groups according to values of an attribute of the data.
- the people in the subsetcan further be segmented by values of the attribute "sex" to produce a group of males and a group of females.
- Aggregation operationsprovide summary information about the data set. Aggregations include counts of members of segments, sums of the values of an attribute, or an average of the values of an attribute. An example aggregation operation would be finding the average age of the people in the subset 21-30. Viewer operations display the results of any foregoing operations. One example of a viewer operation is making a histogram.
- the first edge 115 in the branchleads to a segmentation node 117(b).
- the noderepresents a segmentation operation to be performed on the data set of node 113, and the label indicates the attribute whose values determine the segmentation, in this case, the geographic regions.
- the next edgeleads to an aggregation node 121(b) which performs an aggregation operation on the data in the segments produced by segmentation node 117(b).
- the aggregation operationis a count operation; it counts the number of people in each region.
- the next edgeleads to the last node in the branch, namely a viewer node 123(b).
- the labelindicates that viewer node 123(b) is a histogram node, so the counts produced by the count operation in node 121(b) are to be used to produce a histogram.
- branch 125(a)The other branch in directed graph 111 is branch 125(a), which has two subbranches, branch 125(c) and branch 125(d). Beginning at base node 113 and ending at the ends of each of the subbranches, branch 125(a) describes two distinct sequences of operations; in the case of subbranch 125(c), the operations first segment the data represented by base 113 by values of the attribute average international revenue (av -- i -- rev) (node 117(a)) and then query the segments with a query which limits the average international revenue to an amount greater than 75 (node 119).
- the operationsfirst segment as described above, then do a count (node 121(d)) on the segments, and thereupon make a histogram based on the count (node 123(a)).
- the path between the root of directed graph 111 and any node in directed graph 111describes a sequence of operations to be performed on the data represented by the root node 113.
- the business data analystemploys the mouse to right-click on a node.
- the systemresponds to the right-click by performing the operations specified in the nodes between the selected node and the root node on the data set specified by the root node, beginning with the root node.
- the systememploys lazy evaluation, that is, a query is not evaluated until the whole sequence of operations is evaluated.
- the systemfurther encaches the results of previous executions of sequences of operations, so that a new evaluation need be done only from the last node on the branch which has encached results. For example, if branch 121(d) of FIG. 1 has already been evaluated, then an evaluation of branch 125(c) will employ the results of the evaluation of node 117(a) which was done during the evaluation of branch 121(d).
- the business data analystbuilds graph 111 by defining nodes and adding them to the graph.
- a current nodewhich is either the last node to be added or a node explicitly selected as the current node by the business data analyst.
- query node 119is the current node.
- the current nodeis displayed in blue.
- Viewer nodesare defined by selecting Viewers from menu 108 and selecting the type of viewer node, for example a histogram node such as 103. The node is added as soon as the selection is made.
- Aggregation nodesare defined using the count, percent, and average buttons at 107. Menus which appear when the buttons are selected permit detailed definition of the aggregation operation.
- portion 105 of window 101to define query and segmentation nodes. Which type of node is being defined is determined by toggle button 102. In window 101, it is set to Query, and that is what is being defined.
- Portion 105contains a list of the attributes 106 of the data in the data set being analyzed. For example, the attribute Av -- i -- rev is the average international revenue.
- Each attribute on the listhas a dialog box 104 next to it in which a limitation on the value of the attribute may be specified. For example, the dialog box 104 for the Av -- i -- rev attribute contains >75, specifying that the query being defined will select data items for which the value of that attribute is greater than $75.
- segmentation nodesWith segmentation nodes, the segmentation is done on the basis of a single attribute, and the business data analyst puts the ranges for the segmentation in the dialog box 104 for the attribute 106 which is being used for the segmentation.
- the Up button in buttons 107permits the business data analyst to use the restriction or segment boundaries of the current query or segmentation node to define a new query or segmentation node.
- the Expand buttoncreates a query node corresponding to each group defined by a prior segmentation node. Once the business data analyst has defined the segmentation or query node, he or she adds it to the graph by pressing the Down button in button set 107.
- buttons 107permits the business data analyst to select a different data set to apply graph 111 to.
- a business data analystfirst defines graph 111 experimentally on a small data set and then applies graph 111 to a large data set whose data items have the same attributes as the data items of the small data set.
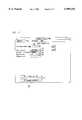
- FIG. 2is a table which shows the classes of nodes employed in graph 111 in a preferred embodiment.
- Each row of the tablecontains the information for one node class; the columns specify the diagram used for the node in graph 111 (203), the name of the node class (205), a description of the node class (207), and a description of the kinds of nodes whose output can serve as input for nodes of the type.
- a query node 119can receive its input from another query node 119, a segmentation node 117, or a data base node 113.
- the rules for the kind of input required for a nodemay be used to do consistency checks on the graph 111 as it is developed by the business data analyst.
- New node types 213 and 215represent operations involved in generating reports based on the results of a sequence of operations.
- a typical session with the systembegins as shown in FIG. 3 with data connection display 301, which the business data analyst uses to specify which data set he or she is going to examine.
- dialog box 303specifies the data base name; boxes 305-311 display information about the data base, including the name of whatever database (if any) it is derived from.
- a business data analystwill typically experiment with a small data base and then apply the sequences of operations that appear fruitful on the small data base to a large data base. To begin the analysis, the business data analyst pushes button 313.
- FIG. 4shows how in a preferred embodiment, dialog box 505 may be customized to provide a menu 601 for interesting set of segmentation choices. The same kind of customization may be done for any of the dialog boxes in portion 105 of display 101.
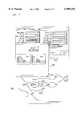
- FIG. 7shows a later stage of the investigation.
- Graph 703now has three branches, and the business data analyst has executed the branches ending in histogram nodes 705 and 707.
- the business data analystbegan by constructing branch 711 and executing it, resulting in histogram 709, which shows that the population as a whole calls the western European region (the bar marked "W”) most often and the Pacific region (the bar marked "P”) next most often.
- the analyst constructed branch 713in which the segments produced by node 704 are restricted by query node 706 to customers whose international revenue is >75 and the result of the query is again segmented by region (node 708), a count made on the basis of the segmentation (node 710), and a histogram made from the count (node 705).
- the histogramappears at 713.
- histogram 713is compared with histogram 709, it can be seen that the high-end customers isolated by the query represented by node 706 call the Pacific region more frequently than they call the western European region.
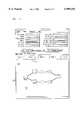
- Branch 815first makes a query (817) which separates out the data from the Pacific region and then segments it with a finer-grain segmentation on the attribute av -- i -- rev (819), does a count of the segmentation (821), and makes a histogram (823). The histogram is shown at 825.
- branch 803is similar except that the query 805 separates out the data from the western European region to produce histogram 813. Again, there are interesting differences. For the western European region, call frequency is very strongly related to call length, with longer calls being generally less frequent; in the Pacific region, on the other hand, call frequency increases with length at the left-hand side of the histogram.
- FIG. 9shows how this is done. As shown in display 901, a viewer node of the report type (node 903) is added to take the outputs of branches 823 and 803; the report, with histograms 825 and 813 appears in window 905.
- FIGS. 10 and 11show further features of the user interface.
- the business data analysthas made a copy 1005 of tree 1003. He or she has done so by using the mouse to highlight tree 1003 and then selecting "copy" from the Tree menu.
- Copy 1005can be attached to a different point of graph 1007 or moved to a different page of the display. Such a different page is shown in window 1101 of FIG. 11. As indicated by enlarged tab 1105, tree 1103 shown in the display is on page 2 of the window.
- the process of queryingis that of specifying conditions on one or more of the data attributes to extract "interesting" subsets of data.
- the result of queryingis a subset of the table; that is, a subset of the original set of records.
- SegmentationTo segment data is to divide the data into non-overlapping subsets based on the values of one or more attributes. Note that there are at least two kinds of segmentations: those based on attributes with a relatively small fixed set of possible values (for example, a State attribute restricted to state codes, i.e. ⁇ AL, . . . ⁇ ). We call these natural segmentations, because there is a natural way to divide the data up. On the other hand, quantitative attributes (like average revenue, or a person's age) require the user to specify a set of segment boundaries and an optional set of segment names. For example, a user may wish to segment the data on the Age attribute by specifying the following segments: for Age below 1, baby; for Age below 5 and above 1, toddler; for Age below 10 and above 5, child; for age below 13 and above 10, preteen; and so on.
- Age attributeby specifying the following segments: for Age below 1, baby; for Age below 5 and above 1, toddler; for Age below 10 and above 5, child; for age below 13 and above 10, preteen; and so
- Summary InformationQuerying and segmentation divide and group the data; the user must be able to compute and present various kinds of summary information (e.g., COUNT, AVERAGE) over various data attributes. These are the actual computations that will make up part of an analysis. These computations must be presented to the user in various graphical forms, e.g., bar charts.
- summary informatione.g., COUNT, AVERAGE
- History MechanismOne of the critical problems illustrated in the scenario in the Description of the Prior Art is the difficulty of keeping track of the operations performed.
- a comprehensive history mechanismwould maintain a record of all tasks performed by the analyst, infer semantic relationships between the various tasks, and make it convenient to reuse work.
- ibe the domain of attribute A i , 1 ⁇ i ⁇ n, i.e., the value of attribute A i in each record in table R is drawn from i .
- the BTN (billing telephone number) attribute in the BDA's datais drawn from the domain of ten digit positive integers (actually, with the additional ill-formed and also changing constraint of being a "legitimate telephone number"), and the total-minutes attribute is drawn from the non-negative integers.
- the data exploration and analysis apparatusallows a user to query R by specifying independent conditions for each of the attributes of R.
- a condition for attribute A i of R, denoted by C ican be one of the following.
- C ican be a finite collection of values from i ; a single value is a special case. This is specified by explicitly enumerating the set of values from i .
- C ican be a range of values from i ; specifying this requires that i be a totally ordered domain.
- a rangeis specified by its two end points, each of which is in i .
- C ican be the full domain i ; this is the default.
- the result of a query with conditions C 1 , . . . , C n on attributes A 1 , . . . , A nis a table R', with the same schema as R.
- a record r of Ris in R' if and only if the value of attribute A i , 1 ⁇ i ⁇ n, satisfies condition C i .
- a segmentation of table R on attribute A i using the partition i 1 , . . . , i m .sbsp.i of domain iis a collection of m i , possibly empty, tables R 1 , . . . , R m .sbsp.i, such that:
- each table R jincludes all the attributes of R, and one additional segment description attribute, D s .
- the value of attribute A i in each record in the table R jis drawn from i j , 1 ⁇ j ⁇ m i .
- the tables R 1 , . . . , R m .sbsp.iare referred to as segments of table R. ⁇
- the data exploration and analysis systemallows a user to segment a table R using attribute A i by specifying how the domain i should be partitioned. This can be specified in one of the following ways:
- a simple partition of domain iis a partition where each value in i is in a separate partition by itself; this is the default.
- the table Ris finite, the number of non-empty segments of a table is finite, even when the domain i is infinite.
- Such a simple partitioncan be used, for example, to segment customer data on the basis of the State attribute: one partition for each state (e.g., MA, ME, AL).
- Finite Collection PartitionA finite collection partition of domain i explicitly specifies the finite set of values in each partition of the domain; this can only be specified for finite domains.
- Such a range partition of the domaincan be used, for example, to segment customer data based on the Average-revenue attribute (say, by using the partition elements 10, 25, and 75).
- the BDAwould associate a name with each segment, such as low-revenue-customers, medium-revenue-customers, etc.
- Segmentation of a table R using multiple attributesis a straightforward extension of segmentation using a single attribute.
- the number of segments createdis the product of the number of partitions of each of the attribute domains. For example, the BDA might segment using both the above finite collection partition Region and the the above range partition on the Average -- revenue partition. If there were 6 regions, this would result in 24 segments. Note that the BDA might again wish to name these segments, i.e., NE-low-revenue-customer, NE-medium-revenue-customer, etc.
- Summary information, using aggregates such as COUNT and AVERAGE on an attribute of a tablecan be extremely useful in determining whether a given segmentation of a table R is suitable for subsequent analysis.
- the data exploration and analysis system of the preferred embodimentallows the user to perform the following operations.
- Summary informationcan be computed using any of the SQL aggregate functions on a given table or a given segmentation of a table.
- the userhas to specify the attribute of the table (or of the segmentation of the table) on which the aggregate function needs to be computed.
- the COUNT aggregate functionno additional attribute need be specified.
- the result of a summary computation on a tableis a unary table with a single record containing the aggregate value.
- the resultis a binary table with m records, one record for each table in the segmentation; the value of the first attribute in a record is the segment description of the corresponding segment of the table; the value of the second attribute in each record is the corresponding aggregate value.
- the computed summary informationcan be presented in any of a variety of ways, e.g., histograms, bar charts, and pie charts.
- the final output of an exploration and analysis sessionis a report, documenting in words and graphics the important findings, open questions, interesting relationships, etc. found in the session, using a report writing tool.
- a query on table R with conditions C 1 , . . . , C n on attributes A 1 , . . . , A nis translated into the following SQL code, where full domain conditions are dropped from the WHERE clause:
- auxiliary ternary table RS D(Id, Low, High), such that for each i j , 1 ⁇ j ⁇ m i , there is a record (d j , l j , r j ) in RS D, where d j is the identifier for i j , l j is the left end point of the range for i j and r j is the right end point of the range for i j .
- the following SQL codeis then generated to compute the segments of R.
- summary computationdepends on whether it is computed on a table or on a segmentation of a table.
- AGGbe the aggregate function that needs to be computed, on attribute A j of table R.
- SQL codeis generated for summary computation on a single table R.
- Embodiment 1201 of the systemis implemented using a client-server architecture. Both client and server are implemented using standard personal computers (PCs) connected by a network.
- PC server 1203is connected to a persistent storage device 1215, for example, a disk drive.
- the data being analyzed (1219) and persistent data (1217) representing the graphs made by the preferred embodimentare stored in data base files 1218 in persistent storage device 1215.
- the data being analyzed and the persistent dataare accessed by means of SQL queries received via network 1214 from PC client 1215.
- SQL query engine software 1207responds to those queries by performing the queries on data base files 1218 and returning the resulting tables of data via network 1214, as indicated by arrows 1213.
- PC client 1215is connected to input-output devices including display 1219, keyboard 1223, and mouse or other pointing device 1225.
- input-output devicesincluding display 1219, keyboard 1223, and mouse or other pointing device 1225.
- PC client 1215When PC client 1215 is operating as a part of system 1201, it produces displays like those of FIG. 1. Shown is a variation of window 101.
- the business data analyst who is using PC client 1215can perform the operations previously described for the displays by means of inputs from keyboard 1223 and mouse 1225.
- Directed graph 111 of the displayis represented in the memory 1216 of PC client 1215 by a graph structure 1221.
- Standard graphical user interface (GUI) software 1220generates the display of directed graph 111 from graph structure 1221, and when the business data analyst performs an operation which changes graph 111, graphical user interface 1220 responds to the input from the business data analyst by invoking routines in graph manager code 1222 which alter graph structure 1221 as required for the operation.
- Graph manager code 1222also uses query generator 1224 to initialize graph structure 1221 from history files 1217 in data base files 1218 and to store a representation of graph structure 1221 in history files 1217.
- query generator 1224reads graph structure 1221 to make an SQL query 1211 and then provides the query via network 1214 to PC server 1203, where SQL engine 1207 performs the query.
- the table 1213 returned by the queryis stored in graph structure 1221 and is used as specified by the user in graph 111.
- SQL engine 1207is WATCOM SQL 4.0, manufactured by WATCOM International Corporation, 415 Phillip St., Waterloo, Ontario.
- Graphical user interface 1220is implemented using Tool-Book, produced by Asymetrix Corporation, 110 110th Ave. N.E., Suite 700, Bellevue, Wash.
- the connection between server 1203 and client 1215 over network 1214employs the ODBC protocol on top of TCP/IP. Use of this protocol permits client 1215 to be used with a variety of data base servers 1203.
- All dataincluding: (a) the SQL code for querying, segmentation, and summary computation, (b) tables corresponding to the results of the various tasks performed by the BDA, and (c) the derivation and semantic relationships between the business data analyst's various tasks, are stored in database tables at the server.
- the SQL code that is evaluatedis parameterized by the data to be analyzed, so that the same SQL code can be used on different data sets. This in turn permits complete reuse of the business data analyst's efforts.
- the business data analystcurrently performs data exploration and analysis on a sample of the complete data; when satisfied, she repeats the entire sequence of analysis on the complete data set.
- Making the SQL code relative to the root tableenables the data exploration and analysis system to automatically perform this second phase of the analysis.
- Graph structure 1221represents the graph displayed in portion 110 of window 101 in the memory of PC client 1215.
- FIG. 13shows graph structure 1221 for graph 111 shown in FIG. 1.
- Graph structure 1221is made up of two kinds of objects: node objects 1301, which represent the nodes of the graph, and link objects 1303, which represent the links of the graph.
- node objects 1301which represent the nodes of the graph
- Each node object in FIG. 13is labeled with its type and with the reference number of the node in FIG. 1 that the node object corresponds to. Only three link objects are shown, namely those for the links connecting node 117(a) to the rest of graph 111, but it is to be understood that there is a similar link object for every other link in graph 111.
- the labels on the link nodesindicate the nodes which the link represented by the link node connect.
- Each objectprovides access to the information which graphical user interface 1220 requires to display the node or link it represents.
- Node objects 1301also provide access to the information required to perform the operation represented by the node.
- a given node object 1301includes pointers 1305 to the node objects 1301 representing any child nodes of the node represented by the given node object 1301 and pointers 1307 to any node objects 1301 representing a node which is a parent of the given node object.
- a given node object 1301also contains pointers to any link objects 1303 representing links which begin or terminate at the node represented by the given node object. These pointers are included so that when a subtree is moved, the links are moved with the subtree.
- FIG. 14gives a detailed view of the information which may be accessed via a node object 1301. Since node object 1301 is an object, internal details of how the information is represented are hidden and are of no interest to this discussion.
- the data structure which actually represents the node objectmay itself contain the information or may merely contain information by means of which the information may be located; what is important is that there are operations provided by the object for reading and writing the information.
- the information in node object 1301is divided into two classes of properties: system properties 1401, which are properties whose meaning and use is defined by graphical user interface 1220, and user properties 1409, which are properties whose meaning and use is defined by the user who defines the type of node object 1301.
- system properties 1401which are properties whose meaning and use is defined by graphical user interface 1220
- user properties 1409which are properties whose meaning and use is defined by the user who defines the type of node object 1301.
- the system propertiesinclude the color 1403 currently being used to display the node corresponding to node object 1301, the pattern 1405 currently being used, and the current location 1407 of the node in the display.
- User properties 1409include default color 1411, which is the color the node represented by node object 1301 is to have if it has not been selected as the current node, node type 1413, which specifies the type of the node represented by node object 1301, constraints 1415, which in the case of a query node or a segmentation node specifies the constraints for the query or the bounds of the segments, label 1417, which specifies the text label for the node, children 1419, which is a list of pointers 1305 to node objects representing children of the node represented by the present node object, parents 1421, which is a list of pointers 1307 to node objects representing parents, links 1423, which is a list of pointers 1309 to link objects for links to or from the node represented by the node object 1301, data 1425, which is the cached data resulting from performance of the operation represented by the node to which the node object corresponds, and node identifier 1427, which is an identifier that uniquely identifies the node.
- data 1425is limited to vectors of the values returned by aggregation nodes; however in other embodiments, data 1425 might include the table returned by a query node or the segments returned by a segmentation node.
- Subsumption connection pointers 1429are used to define graphs which show subsumption relationships between nodes. These graphs will be discussed in more detail later.
- graphical user interface 1220invokes graph manager 1222, which adds the node corresponding to new node object 1301 to graph 111, setting location information 1407 as it does so.
- graph manager 1222copies constraint information 1415 from node object 1301 corresponding to the current node in graph 111 to a new node object 1301.
- Deletion, moving, and copying nodes or subtreesis done by using graph manager 1222 to deleteg, move, or copy the corresponding node objects or subtrees in graph structure 1221, with GUI 1220 responding to the changes by displaying the graph 111 corresponding to the modified graph structure 1221.
- query generator 1224reads the node objects 1301 of graph structure 1221 from the node object 1301 corresponding to the selected node through the node objects corresponding to the nodes between the selected node and the base node and uses the node type information 1413 and the constraint information 1413 from the nodes to construct an SQL query which will perform the querying, segmentation, and aggregation operations specified by the nodes of graph 111. How one makes queries corresponding to these operations is explained in the section Translation to SQL supra.
- PC client 1215provides the query corresponding to the querying, segmentation, and aggregation operations via network 1214 to PC server 1203.
- SQL engine 1207executes the query on the data file specified by the root of the tree and returns the result table 1213 to PC client 1215 via network 1213.
- the sequence of operations selected by the business data analystincludes a viewer operation, the results are displayed in the form specified for the viewer operation.
- the result table 1213is a vector resulting from an aggregation operation
- the vectoris stored in the data information 1425 of the node object 1301 corresponding to the node in the graph which specified the aggregation operation. For example, in the graph structure 1221 shown in FIG.
- the node object 1301 labeled COUNT (121 (d))would contain a vector indicating the number of customers in each segment of the segmentation specified by the node object labeled SEGMENT (117(a)). If the business data analysis specified execution of that branch from histogram node 123(a), query generator 1224 would simply read graph structure 1221 from the node object labeled HISTO (123(a)) back to to the node object 1301 labeled COUNT (121(d)) and would use the vector in DATA 1425 of that node object to construct the histogram which it produces in response to the node object HISTO (123(a)).
- the foregoingshows how a preferred embodiment implements lazy evaluation of graph 111.
- the evaluationis lazy because the operation represented by a node is not performed at the time the node is created. Instead, the information associated with the node is used to make a query which based on the information associated with all of the segmentation, query, and aggregation nodes in the portion of graph 111 being evaluated.
- the constraints for the queryare thus more restrictive than the constraints specified in any of the nodes and the table 1213 returned by the query takes up far less space than the tables that would have been returned if the operation represented by the node had been performed when the node was created.
- the encachement of intermediate resultsmakes lazy evaluation even more efficient, since in many cases, only a few nodes of the sequence need be evaluated.
- graph 111 of FIG. 1shows the derivation history, which is a history of all of the actions performed by the business data analyst. As we have seen, the actions include querying and segmenting tables, computing and presenting summary information, and interacting with external tools. Note that the derivation history does not keep track of the temporal sequence of tasks performed, only the logical connections between the tasks.
- Another way in which the data exploration and analysis system can keep track of the tasks and their connectionsis by providing graphs which show subsumption connections between nodes representing query and segmentation operations.
- One such nodeis a subsumption of another such node if the data set resulting from the operation represented by the second node second such node reveals more detail about the data set defined resulting from the operation represented by the first node.
- the business data analystmay have initially computed a segmentation of table R using a simple partition on the domain of attribute State.
- shemay resegment R using two attributes: a simple partition on the domain of attribute State and a range partition on the domain of attribute Average-revenue.
- the second segmentationwas not derived from the first segmentation, there is a logical connection between the two: the second segmentation results in a finer partitioning of the original table than the first segmentation. Knowing about such relationships lets the computation be more efficient, as well as eases the task of the data analyst in preventing unnecessary repeated work.
- the history mechanismmaintains four such subsumption connections:
- Query--queryIf table R2 is a subset of table R1, the relationship from R1 to R2 is said to be a query--query subsumption relationship.
- Segmentation--segmentationIf a segmentation 52 is a finer partition of the records in table R than segmentation S1, the relationship from S1 to S2 is said to be a segmentation--segmentation subsumption relationship.
- Query-segmentationIf a segmentation S1 is made of a table R1 derived by a query from table R, the relationship from R1 to S1 is said to be a query-segmentation subsumption relationship.
- Segmentation-queryIf a segmentation SI is a partition with n segments of records in table R and a set of tables R2[0. . . n-1] is the tables resulting from a query which defines subsets of the segments, then the relationship from S1 to R2[0. . . n-1] is said to be a segmentation-query subsumption relationship.
- a graph representing the subsumption connections of the nodes in the derivation historyis displayed by "overlaying" a graph of the selected subsumption connection on the graph of the derivation history. Nodes of the derivation history which are also nodes of the subsumption connection are displayed in a different color, and the edges connecting the nodes of the subsumption connection are also displayed in a different color from the edges connecting the nodes of the derivation history. Nodes of the subsumption graph which have been materialized are highlighted.
- a nodeis materialized when the table or other result produced by the operation represented by the node is available either as a materialized view in data files 1219 or encached within the node data structure corresponding to the node.
- the graph of the subsumption connectionmay also be displayed by itself. Which subsumption connection graph is to be displayed is selected by means of a button or menu in upper portion 103 of the display, for example by means of a submenu entry from the main menu in menu 107.
- the only operation a user can perform on a subsumption graphis to request that a node be materialized. That is done by selecting the node with the mouse.
- the data exploration and analysis systemthen materializes the node in accordance with the sequence of operations specified in the derivation history graph for the node, that is, the system computes and stores a result which is equal to the result that would have been computed if all of the operations between the root of the derivation graph and the selected node had been executed.
- the resultmay be stored as a materialized view in data files 1219 or encached in the node object 1301 which represents the node. What operations will in fact be executed to materialize the node depends of course on what materialized results are already available.
- the subsumption connection graphsfurther permit optimization of the execution of portions of the derivation history graph.
- the subsumption connection graphsdo so by making it possible to use the result produced when a node has been materialized in another operation, instead of again doing the operation represented by the materialized node.
- the subsumption connection graphhas a materialized query node to which another query node is subsumed, there will be a materialized view corresponding to the materialized query node in data files 1219 and the query represented by the other query node can be performed on the materialized view, regardless of whether the other query node is a child of the materialized query node in the derivation history graph.
- node object 1301 for query and segmentation nodescontains subsumption connection pointers 1429, which are pointers that double link node objects 1301 belonging to the various subsumption connection graphs.
- subsumption connection pointers 1429are pointers that double link node objects 1301 belonging to the various subsumption connection graphs.
- graphical user interface 1220uses the pointers for the particular subsumption connection selected to locate the node objects 1301 required for the graph of the subsumption connection and uses the information in those node objects 1301 to draw the graph.
- the preferred embodimentuses the following algorithms:
- Query--queryFor tables R1 and R2, the pair (R1,R2) is in the query--query subsumption relationship table QQSR(Subsumer, Subsumed) if:
- both R1 and R2are tables generated by querying
- the conditions in the WHERE clause of R2are at least as strong as the conditions in the WHERE clause of R1.
- both R1 and R2will have only the root table in their FROM clauses; hence, no conditions on the FROM clauses of R1 and R2 are required.
- Segmentation--segmentationFor table segmentations R1' and R2', the pair (R1', R2') is in the segmentation--segmentation subsumption relationship table SSSR(Subsumer, Subsumed) if:
- the attributes along which R2 is segmentedincludes all the attributes along which R1 is segmented.
- persistent representations of the graphs produced in window 101are stored in history files 1217 of data base files 1218.
- Graph manager 1222makes the persistent representations in response to a save command by the business data analyst or automatically at the end of a session. Once a graph has been saved in a persistent representation, the business data analyst may then select one of the saved graphs for display in the same manner as one selects a file for editing. When the business data analyst has done so, graph manager 1222 uses the persistent representations to construct node objects 1301 for the graph.
- the graph of the derivation historyis maintained in three data base tables.
- Idcomes from Node ID 1427 of a node object and Type comes from node type 1413 of the node object
- a ternary edge tableDeriv -- edges(Parent -- Id, Child -- Id, Relative -- code) that maintains the derivation relationships, where Relatizve -- code is the code to perform the task corresponding to Child -- Id, given the table corresponding to Parent -- Id; when Child -- Id is a task that produces a table (e.g., querying, segmentation) this is SQL code; when Child -- Id is a task that produces a presentation, this is the presentation code.
- the database tables for the subsumption connectionsconsist of pairs of node IDs, one with the node ID of the subsuming node and the other with the node ID of the subsumed node.
- the systemwill know when the cached data is out of date, and indicate that to the user.
- the databaseincludes the ability to materialize views, then these views can be used to speed up computation by determining if a materialized view contains some or all the data needed for the computation.
- Our Report nodeis very crude.
- a more advanced Report nodecould be implemented as an an external tool like Microsoft Word (A registered trademark of Microsoft Corporation) and the system of the invention would properly format the data for the tool and then export the data to the tool.
- Also possibleare more intelligent nodes that perform some kinds of analysis, like comparing two graphs for "interesting" differences.
- the currently implemented Text Nodehas a piece of text associated with it. We have designed and implemented (but not integrated with the current prototype) a grammar for generating text from data. This text could appear in an automatically produced report. For example, if the input to the text node was a Count of a Segmentation by State, a "Smart Text" node could use information in the entire branch to produce text like this:
- the components of the system of the inventionmay be distributed among one or more machines in a fashion which differs from the client-server architecture disclosed herein and the machines might not be PCs.
- the graphsmight look different from the graphs displayed by the preferred embodiment and might include nodes for different operations.
- non-persistent and persistent representationsmay be used for the non-persistent and persistent representations, and some embodiments may only have the persistent representations or only the non-persistent representations.
- the persistent representationsmay be stored in data base systems other than SQL or even stored as flat files.
- lazy evaluation and encachingthere are many implementations of lazy evaluation and encaching. Other embodiments may be constructed which either encache or do lazy evaluation, but do not do both, and still others may do neither.
Landscapes
- Engineering & Computer Science (AREA)
- Databases & Information Systems (AREA)
- Theoretical Computer Science (AREA)
- Data Mining & Analysis (AREA)
- Physics & Mathematics (AREA)
- General Engineering & Computer Science (AREA)
- General Physics & Mathematics (AREA)
- Information Retrieval, Db Structures And Fs Structures Therefor (AREA)
- User Interface Of Digital Computer (AREA)
Abstract
Description
Claims (32)
Priority Applications (2)
| Application Number | Priority Date | Filing Date | Title |
|---|---|---|---|
| US08/640,411US5999192A (en) | 1996-04-30 | 1996-04-30 | Interactive data exploration apparatus and methods |
| CA002200924ACA2200924C (en) | 1996-04-30 | 1997-03-25 | Interactive data exploration apparatus and methods |
Applications Claiming Priority (1)
| Application Number | Priority Date | Filing Date | Title |
|---|---|---|---|
| US08/640,411US5999192A (en) | 1996-04-30 | 1996-04-30 | Interactive data exploration apparatus and methods |
Publications (1)
| Publication Number | Publication Date |
|---|---|
| US5999192Atrue US5999192A (en) | 1999-12-07 |
Family
ID=24568124
Family Applications (1)
| Application Number | Title | Priority Date | Filing Date |
|---|---|---|---|
| US08/640,411Expired - LifetimeUS5999192A (en) | 1996-04-30 | 1996-04-30 | Interactive data exploration apparatus and methods |
Country Status (2)
| Country | Link |
|---|---|
| US (1) | US5999192A (en) |
| CA (1) | CA2200924C (en) |
Cited By (110)
| Publication number | Priority date | Publication date | Assignee | Title |
|---|---|---|---|---|
| US6096095A (en)* | 1998-06-04 | 2000-08-01 | Microsoft Corporation | Producing persistent representations of complex data structures |
| US6151585A (en)* | 1998-04-24 | 2000-11-21 | Microsoft Corporation | Methods and apparatus for determining or inferring influential rumormongers from resource usage data |
| US6163774A (en)* | 1999-05-24 | 2000-12-19 | Platinum Technology Ip, Inc. | Method and apparatus for simplified and flexible selection of aggregate and cross product levels for a data warehouse |
| US6185561B1 (en)* | 1998-09-17 | 2001-02-06 | Affymetrix, Inc. | Method and apparatus for providing and expression data mining database |
| US6269325B1 (en)* | 1998-10-21 | 2001-07-31 | Unica Technologies, Inc. | Visual presentation technique for data mining software |
| US20010037228A1 (en)* | 2000-05-05 | 2001-11-01 | Iaf Consulting, Inc. | System and method for using metadata to flexibly analyze data |
| US20020008699A1 (en)* | 2000-05-10 | 2002-01-24 | Jou Stephan F. | Method for preemptive screen rendering |
| US6356285B1 (en)* | 1997-12-17 | 2002-03-12 | Lucent Technologies, Inc | System for visually representing modification information about an characteristic-dependent information processing system |
| US6356896B1 (en)* | 1999-08-16 | 2002-03-12 | International Business Machines Corporation | Data visualization of queries over joins |
| US20020129017A1 (en)* | 2001-03-07 | 2002-09-12 | David Kil | Hierarchical characterization of fields from multiple tables with one-to-many relations for comprehensive data mining |
| US20020162089A1 (en)* | 1999-02-04 | 2002-10-31 | Lewis Brad R. | Methods and systems for developing data flow programs |
| US20020167551A1 (en)* | 2001-05-09 | 2002-11-14 | Steele Michael S. | Methodology for viewing large strategies via a computer workstation |
| US20030050994A1 (en)* | 2001-07-27 | 2003-03-13 | Robert Pollack | Method of aggregating, classifying, reporting and cross-tabbing data in real time |
| US20030074352A1 (en)* | 2001-09-27 | 2003-04-17 | Raboczi Simon D. | Database query system and method |
| US20030120682A1 (en)* | 2001-12-11 | 2003-06-26 | International Business Machines Corporation | Database query optimization apparatus and method that represents queries as graphs |
| US6611216B1 (en) | 1999-02-02 | 2003-08-26 | Cisco Technology, Inc. | Fast look-up table based scheme for NRZI encoding/decoding and zero insertion/removal in serial bit streams |
| US20030167278A1 (en)* | 2002-02-28 | 2003-09-04 | Thomas Baudel | Interactive generation of graphical visualizations of large data structures |
| US6647394B1 (en)* | 1999-06-08 | 2003-11-11 | International Business Machines Corporation | Doing business employing linked trees having retrievable embedded information |
| US20030217079A1 (en)* | 2000-02-28 | 2003-11-20 | Reuven Bakalash | Customer relationship management (CRM) system with integrated data aggregation engine |
| US20030225752A1 (en)* | 1999-08-04 | 2003-12-04 | Reuven Bakalash | Central data warehouse with integrated data aggregation engine for performing centralized data aggregation operations |
| US20040012632A1 (en)* | 2002-07-22 | 2004-01-22 | Jason King | Disabling and conditionally compiling graphical code in a graphical program |
| US6684216B1 (en)* | 1999-09-29 | 2004-01-27 | Katherine A. Duliba | Method and computer system for providing input, analysis, and output capability for multidimensional information |
| US6690397B1 (en) | 2000-06-05 | 2004-02-10 | Advanced Neuromodulation Systems, Inc. | System for regional data association and presentation and method for the same |
| US6718336B1 (en) | 2000-09-29 | 2004-04-06 | Battelle Memorial Institute | Data import system for data analysis system |
| US20040103109A1 (en)* | 1999-07-29 | 2004-05-27 | Huras Matthew Albert | Dropped database table recovery |
| US6775819B1 (en)* | 1997-10-27 | 2004-08-10 | Kla-Tencor Corporation | Software system and method for graphically building customized recipe flowcharts |
| US6778193B2 (en) | 2001-02-07 | 2004-08-17 | International Business Machines Corporation | Customer self service iconic interface for portal entry and search specification |
| US6813611B1 (en)* | 1999-06-08 | 2004-11-02 | International Business Machines Corporation | Controlling, configuring, storing, monitoring and maintaining accounting of bookkeeping information employing trees with nodes having embedded information |
| US6867788B1 (en)* | 1998-07-15 | 2005-03-15 | International Business Machines Corporation | View composition system for synthesizing multiple visual representations of multiple data sets |
| US20050086208A1 (en)* | 2003-10-16 | 2005-04-21 | International Business Machines Corporation | Outer and exception join to inner join normalization |
| US20050096950A1 (en)* | 2003-10-29 | 2005-05-05 | Caplan Scott M. | Method and apparatus for creating and evaluating strategies |
| US6898530B1 (en) | 1999-09-30 | 2005-05-24 | Battelle Memorial Institute | Method and apparatus for extracting attributes from sequence strings and biopolymer material |
| US6931418B1 (en)* | 2001-03-26 | 2005-08-16 | Steven M. Barnes | Method and system for partial-order analysis of multi-dimensional data |
| US20050179684A1 (en)* | 2004-02-17 | 2005-08-18 | Wallace James H. | Data exploration system |
| US6940509B1 (en) | 2000-09-29 | 2005-09-06 | Battelle Memorial Institute | Systems and methods for improving concept landscape visualizations as a data analysis tool |
| US6973641B1 (en) | 1998-06-04 | 2005-12-06 | Microsoft Corporation | Persistent representations for complex data structures as interpreted programs |
| US6978262B2 (en)* | 1999-01-05 | 2005-12-20 | Tsai Daniel E | Distributed database schema |
| US20060010141A1 (en)* | 2004-04-23 | 2006-01-12 | Susumu Furukawa | Method, computer program product and data structure for representing two- or three-dimensional object modeling |
| US6990238B1 (en) | 1999-09-30 | 2006-01-24 | Battelle Memorial Institute | Data processing, analysis, and visualization system for use with disparate data types |
| US20060047640A1 (en)* | 2004-05-11 | 2006-03-02 | Angoss Software Corporation | Method and system for interactive decision tree modification and visualization |
| US7046246B2 (en)* | 1999-03-29 | 2006-05-16 | Fujitsu Limited | Graphic editing apparatus graphic editing method and storage medium on which is recorded a program for graphic editing |
| US7106329B1 (en) | 1999-09-30 | 2006-09-12 | Battelle Memorial Institute | Methods and apparatus for displaying disparate types of information using an interactive surface map |
| US20060268163A1 (en)* | 2005-05-27 | 2006-11-30 | Canon Kabushiki Kaisha | Digital Television Broadcasting Receiving Apparatus, Control Method for Digital Television Broadcasting Receiving Apparatus, and Control Program for the Same |
| US20070192283A1 (en)* | 2006-02-15 | 2007-08-16 | Microsoft Corporation | Maintenance of materialized outer-join views |
| US20070208722A1 (en)* | 2006-03-02 | 2007-09-06 | International Business Machines Corporation | Apparatus and method for modification of a saved database query based on a change in the meaning of a query value over time |
| US20070214107A1 (en)* | 2006-03-13 | 2007-09-13 | Oracle International Corporation | Dynamic materialized view ranging |
| US7277931B1 (en) | 1999-06-08 | 2007-10-02 | International Business Machines Corporation | Representing, configuring, administering, monitoring, and/or modeling connections using catalogs and matrixes |
| US20070244582A1 (en)* | 2004-06-04 | 2007-10-18 | Siemens Aktiengesellschaft | System for Operating an Installation by Editing Graphic Objects |
| US20070266029A1 (en)* | 2006-05-10 | 2007-11-15 | Baskey Michael E | Recovery segment identification in a computing infrastructure |
| US20080059563A1 (en)* | 2003-10-30 | 2008-03-06 | Lavastorm Technologies, Inc. | Methods and Systems for Automated Data Processing |
| US20080189345A1 (en)* | 2007-02-07 | 2008-08-07 | Microsoft Corporation | Efficient symbolic differentiation using derivative graph factorization |
| US20090064053A1 (en)* | 2007-08-31 | 2009-03-05 | Fair Isaac Corporation | Visualization of Decision Logic |
| US20090058859A1 (en)* | 2007-08-31 | 2009-03-05 | Crawford Stuart L | Construction of decision logic with graphs |
| US20090113322A1 (en)* | 2007-10-31 | 2009-04-30 | Rogers Steven W | Global Variable Structure in a Graphical Program |
| US20090307192A1 (en)* | 2008-06-10 | 2009-12-10 | Microsoft Corporation | Virtualizing objects within queries |
| US20100060643A1 (en)* | 2008-09-08 | 2010-03-11 | Kashyap Babu Rao Kolipaka | Algorithm For Drawing Directed Acyclic Graphs |
| US20100060642A1 (en)* | 2008-09-08 | 2010-03-11 | Gaurav Chhaparwal | Techniques For Drawing Curved Edges In Graphs |
| US20100063953A1 (en)* | 2008-09-08 | 2010-03-11 | Prasun Kumar | Converting unordered graphs to oblivious read once ordered graph representation |
| US20100188413A1 (en)* | 2009-01-23 | 2010-07-29 | Hao Ming C | Placement of cells in bins to provide non-overlapping visualization of data points of a scatter plot |
| US20100231594A1 (en)* | 2009-03-16 | 2010-09-16 | Hao Ming C | Constructing a cell-based cluster of data records of a scatter plot |
| US7805415B1 (en)* | 2003-06-10 | 2010-09-28 | Lockheed Martin Corporation | Systems and methods for sharing data between entities |
| US20100274785A1 (en)* | 2009-04-24 | 2010-10-28 | At&T Intellectual Property I, L.P. | Database Analysis Using Clusters |
| US7831526B1 (en) | 2006-08-25 | 2010-11-09 | Fair Isaac Corporation | Article and method for finding a compact representation to visualize complex decision trees |
| US20110066600A1 (en)* | 2009-09-15 | 2011-03-17 | At&T Intellectual Property I, L.P. | Forward decay temporal data analysis |
| US20110249002A1 (en)* | 2010-04-13 | 2011-10-13 | Microsoft Corporation | Manipulation and management of links and nodes in large graphs |
| US8041670B2 (en) | 1999-08-04 | 2011-10-18 | Yanicklo Technology Limited Liability Company | Data aggregation module supporting dynamic query responsive aggregation during the servicing of database query requests provided by one or more client machines |
| US20120158687A1 (en)* | 2010-12-17 | 2012-06-21 | Yahoo! Inc. | Display entity relationship |
| US8266090B2 (en) | 2007-08-31 | 2012-09-11 | Fair Isaac Corporation | Color-coded visual comparison of decision logic |
| US20120229466A1 (en)* | 2011-03-07 | 2012-09-13 | Microsoft Corporation | Interactive visualization for exploring multi-modal, multi-relational, and multivariate graph data |
| CN103019691A (en)* | 2012-11-20 | 2013-04-03 | 北京思特奇信息技术股份有限公司 | Transformation method for extract, transform and load (ETL) operation relation graph and implementation system thereof |
| US8572221B2 (en) | 2004-05-26 | 2013-10-29 | Facebook, Inc. | System and method for managing an online social network |
| US8666919B2 (en) | 2011-07-29 | 2014-03-04 | Accenture Global Services Limited | Data quality management for profiling, linking, cleansing and migrating data |
| US20140189650A1 (en)* | 2013-05-21 | 2014-07-03 | Concurix Corporation | Setting Breakpoints Using an Interactive Graph Representing an Application |
| US20140189651A1 (en)* | 2013-05-21 | 2014-07-03 | Concurix Corporation | Animated Highlights in a Graph Representing an Application |
| US20140292765A1 (en)* | 2013-03-29 | 2014-10-02 | International Business Machines Corporation | Aggregating graph structures |
| US9015165B1 (en)* | 2014-03-03 | 2015-04-21 | Michael L. Hamm | Text-SQL relational database |
| US20150286677A1 (en)* | 2007-11-01 | 2015-10-08 | Chi-Hsien Chiu | Analyzing event streams of user sessions |
| US9280612B2 (en) | 2012-12-14 | 2016-03-08 | Hewlett Packard Enterprise Development Lp | Visualizing a relationship of attributes using a relevance determination process to select from candidate attribute values |
| US20160103872A1 (en)* | 2014-10-10 | 2016-04-14 | Salesforce.Com, Inc. | Visual data analysis with animated informational morphing replay |
| US9600548B2 (en) | 2014-10-10 | 2017-03-21 | Salesforce.Com | Row level security integration of analytical data store with cloud architecture |
| US20170097990A1 (en)* | 2014-03-03 | 2017-04-06 | Michael L. Hamm | Text-sql relational database |
| US9658943B2 (en) | 2013-05-21 | 2017-05-23 | Microsoft Technology Licensing, Llc | Interactive graph for navigating application code |
| US9754396B2 (en) | 2013-07-24 | 2017-09-05 | Microsoft Technology Licensing, Llc | Event chain visualization of performance data |
| US20170277731A1 (en)* | 2016-03-28 | 2017-09-28 | International Business Machines Corporation | Hiding nodes in a tree containing shared subtrees |
| US9798771B2 (en) | 2010-08-06 | 2017-10-24 | At&T Intellectual Property I, L.P. | Securing database content |
| US9864672B2 (en) | 2013-09-04 | 2018-01-09 | Microsoft Technology Licensing, Llc | Module specific tracing in a shared module environment |
| US9923901B2 (en) | 2014-10-10 | 2018-03-20 | Salesforce.Com, Inc. | Integration user for analytical access to read only data stores generated from transactional systems |
| US20180089238A1 (en)* | 2016-09-23 | 2018-03-29 | International Business Machines Corporation | Interactive Visualization |
| US20180089295A1 (en)* | 2016-09-23 | 2018-03-29 | International Business Machines Corporation | Interactive Visualization |
| US10049141B2 (en) | 2014-10-10 | 2018-08-14 | salesforce.com,inc. | Declarative specification of visualization queries, display formats and bindings |
| US10089368B2 (en) | 2015-09-18 | 2018-10-02 | Salesforce, Inc. | Systems and methods for making visual data representations actionable |
| US10101889B2 (en) | 2014-10-10 | 2018-10-16 | Salesforce.Com, Inc. | Dashboard builder with live data updating without exiting an edit mode |
| US10115213B2 (en) | 2015-09-15 | 2018-10-30 | Salesforce, Inc. | Recursive cell-based hierarchy for data visualizations |
| US10311047B2 (en) | 2016-10-19 | 2019-06-04 | Salesforce.Com, Inc. | Streamlined creation and updating of OLAP analytic databases |
| US10331636B2 (en)* | 2016-09-23 | 2019-06-25 | International Business Machines Corporation | Interactive visualization |
| US10346292B2 (en) | 2013-11-13 | 2019-07-09 | Microsoft Technology Licensing, Llc | Software component recommendation based on multiple trace runs |
| US10366061B2 (en)* | 2016-09-23 | 2019-07-30 | International Business Machines Corporation | Interactive visualization |
| US10503751B2 (en)* | 2015-10-16 | 2019-12-10 | Sap Se | Fragmentation for rapid data visualization |
| AU2018223011A1 (en)* | 2018-08-30 | 2020-03-19 | Flamingo Ai Limited | Method and system for administering a network data structure |
| CN110990447A (en)* | 2019-12-19 | 2020-04-10 | 北京锐安科技有限公司 | Data probing method, device, equipment and storage medium |
| US10691304B1 (en)* | 2018-10-22 | 2020-06-23 | Tableau Software, Inc. | Data preparation user interface with conglomerate heterogeneous process flow elements |
| CN111782654A (en)* | 2020-07-01 | 2020-10-16 | 浪潮云信息技术股份公司 | Method for storing data in distributed database in partition mode |
| US11188556B2 (en) | 2016-11-07 | 2021-11-30 | Tableau Software, Inc. | Correlated incremental loading of multiple data sets for an interactive data prep application |
| US11250032B1 (en) | 2018-10-22 | 2022-02-15 | Tableau Software, Inc. | Data preparation user interface with conditional remapping of data values |
| US11301493B2 (en) | 2016-04-14 | 2022-04-12 | Ge Aviation Systems Llc | Systems and methods for providing data exploration techniques |
| US20220207086A1 (en)* | 2020-12-28 | 2022-06-30 | Atlassian Pty Ltd | Collaborative document graph-based user interfaces |
| US11853529B2 (en) | 2016-11-07 | 2023-12-26 | Tableau Software, Inc. | User interface to prepare and curate data for subsequent analysis |
| US20240153169A1 (en)* | 2022-11-03 | 2024-05-09 | Adobe Inc. | Changing coordinate systems for data bound objects |
| US12032994B1 (en) | 2021-10-18 | 2024-07-09 | Tableau Software, LLC | Linking outputs for automatic execution of tasks |
| US12387397B2 (en) | 2022-11-03 | 2025-08-12 | Adobe Inc. | Automatically generating axes for data visualizations including data bound objects |
Families Citing this family (4)
| Publication number | Priority date | Publication date | Assignee | Title |
|---|---|---|---|---|
| US10530661B2 (en) | 2016-06-30 | 2020-01-07 | At&T Intellectual Property I, L.P. | Systems and methods for modeling networks |
| US10223475B2 (en) | 2016-08-31 | 2019-03-05 | At&T Intellectual Property I, L.P. | Database evaluation of anchored length-limited path expressions |
| US10621236B2 (en) | 2016-09-16 | 2020-04-14 | At&T Intellectual Property I, L.P. | Concept based querying of graph databases |
| US10685063B2 (en) | 2016-09-16 | 2020-06-16 | At&T Intellectual Property I, L.P. | Time-based querying of graph databases |
Citations (3)
| Publication number | Priority date | Publication date | Assignee | Title |
|---|---|---|---|---|
| US5475851A (en)* | 1986-04-14 | 1995-12-12 | National Instruments Corporation | Method and apparatus for improved local and global variable capabilities in a graphical data flow program |
| US5611059A (en)* | 1994-09-02 | 1997-03-11 | Square D Company | Prelinked parameter configuration, automatic graphical linking, and distributed database configuration for devices within an automated monitoring/control system |
| US5627979A (en)* | 1994-07-18 | 1997-05-06 | International Business Machines Corporation | System and method for providing a graphical user interface for mapping and accessing objects in data stores |
- 1996
- 1996-04-30USUS08/640,411patent/US5999192A/ennot_activeExpired - Lifetime
- 1997
- 1997-03-25CACA002200924Apatent/CA2200924C/ennot_activeExpired - Fee Related
Patent Citations (3)
| Publication number | Priority date | Publication date | Assignee | Title |
|---|---|---|---|---|
| US5475851A (en)* | 1986-04-14 | 1995-12-12 | National Instruments Corporation | Method and apparatus for improved local and global variable capabilities in a graphical data flow program |
| US5627979A (en)* | 1994-07-18 | 1997-05-06 | International Business Machines Corporation | System and method for providing a graphical user interface for mapping and accessing objects in data stores |
| US5611059A (en)* | 1994-09-02 | 1997-03-11 | Square D Company | Prelinked parameter configuration, automatic graphical linking, and distributed database configuration for devices within an automated monitoring/control system |
Cited By (193)
| Publication number | Priority date | Publication date | Assignee | Title |
|---|---|---|---|---|
| US6775819B1 (en)* | 1997-10-27 | 2004-08-10 | Kla-Tencor Corporation | Software system and method for graphically building customized recipe flowcharts |
| US6356285B1 (en)* | 1997-12-17 | 2002-03-12 | Lucent Technologies, Inc | System for visually representing modification information about an characteristic-dependent information processing system |
| US6151585A (en)* | 1998-04-24 | 2000-11-21 | Microsoft Corporation | Methods and apparatus for determining or inferring influential rumormongers from resource usage data |
| US6973641B1 (en) | 1998-06-04 | 2005-12-06 | Microsoft Corporation | Persistent representations for complex data structures as interpreted programs |
| US6096095A (en)* | 1998-06-04 | 2000-08-01 | Microsoft Corporation | Producing persistent representations of complex data structures |
| US6867788B1 (en)* | 1998-07-15 | 2005-03-15 | International Business Machines Corporation | View composition system for synthesizing multiple visual representations of multiple data sets |
| US6185561B1 (en)* | 1998-09-17 | 2001-02-06 | Affymetrix, Inc. | Method and apparatus for providing and expression data mining database |
| US6269325B1 (en)* | 1998-10-21 | 2001-07-31 | Unica Technologies, Inc. | Visual presentation technique for data mining software |
| US6978262B2 (en)* | 1999-01-05 | 2005-12-20 | Tsai Daniel E | Distributed database schema |
| US6611216B1 (en) | 1999-02-02 | 2003-08-26 | Cisco Technology, Inc. | Fast look-up table based scheme for NRZI encoding/decoding and zero insertion/removal in serial bit streams |
| US20020162089A1 (en)* | 1999-02-04 | 2002-10-31 | Lewis Brad R. | Methods and systems for developing data flow programs |
| US7046246B2 (en)* | 1999-03-29 | 2006-05-16 | Fujitsu Limited | Graphic editing apparatus graphic editing method and storage medium on which is recorded a program for graphic editing |
| US6163774A (en)* | 1999-05-24 | 2000-12-19 | Platinum Technology Ip, Inc. | Method and apparatus for simplified and flexible selection of aggregate and cross product levels for a data warehouse |
| US7277931B1 (en) | 1999-06-08 | 2007-10-02 | International Business Machines Corporation | Representing, configuring, administering, monitoring, and/or modeling connections using catalogs and matrixes |
| US6813611B1 (en)* | 1999-06-08 | 2004-11-02 | International Business Machines Corporation | Controlling, configuring, storing, monitoring and maintaining accounting of bookkeeping information employing trees with nodes having embedded information |
| US6647394B1 (en)* | 1999-06-08 | 2003-11-11 | International Business Machines Corporation | Doing business employing linked trees having retrievable embedded information |
| US20040103109A1 (en)* | 1999-07-29 | 2004-05-27 | Huras Matthew Albert | Dropped database table recovery |
| US7188124B2 (en)* | 1999-07-29 | 2007-03-06 | International Business Machines Corporation | Method, system, computer product for recovering dropped database table specifying one or more table spaces, recovering the table space being restored using the dropped table history data structure |
| US7392248B2 (en) | 1999-08-04 | 2008-06-24 | Hyperroll Israel, Ltd. | Data aggregation server supporting rapid query response with sparse multi-dimensional data |
| US20030225752A1 (en)* | 1999-08-04 | 2003-12-04 | Reuven Bakalash | Central data warehouse with integrated data aggregation engine for performing centralized data aggregation operations |
| US8041670B2 (en) | 1999-08-04 | 2011-10-18 | Yanicklo Technology Limited Liability Company | Data aggregation module supporting dynamic query responsive aggregation during the servicing of database query requests provided by one or more client machines |
| US8463736B2 (en) | 1999-08-04 | 2013-06-11 | Yanicklo Technology Limited Liability Company | Relational database management system having integrated non-relational multi-dimensional data store of aggregated data elements |
| US8788453B2 (en) | 1999-08-04 | 2014-07-22 | Yanicklo Technology Limited Liability Company | Data aggregation module supporting dynamic query responsive aggregation during the servicing of database query requests provided by one or more client machines |
| US8799209B2 (en) | 1999-08-04 | 2014-08-05 | Yanicklo Technology Limited Liability Company | Data aggregation module supporting dynamic query responsive aggregation during the servicing of database query requests provided by one or more client machines |
| US6356896B1 (en)* | 1999-08-16 | 2002-03-12 | International Business Machines Corporation | Data visualization of queries over joins |
| US6684216B1 (en)* | 1999-09-29 | 2004-01-27 | Katherine A. Duliba | Method and computer system for providing input, analysis, and output capability for multidimensional information |
| US6990238B1 (en) | 1999-09-30 | 2006-01-24 | Battelle Memorial Institute | Data processing, analysis, and visualization system for use with disparate data types |
| US7106329B1 (en) | 1999-09-30 | 2006-09-12 | Battelle Memorial Institute | Methods and apparatus for displaying disparate types of information using an interactive surface map |
| US6898530B1 (en) | 1999-09-30 | 2005-05-24 | Battelle Memorial Institute | Method and apparatus for extracting attributes from sequence strings and biopolymer material |
| US8321373B2 (en) | 2000-02-28 | 2012-11-27 | Yanicklo Technology Limited Liability | Method of servicing query statements from a client machine using a database management system (DBMS) employing a relational datastore and a multi-dimensional database (MDDB) |
| US20030225736A1 (en)* | 2000-02-28 | 2003-12-04 | Reuven Bakalash | Enterprise-wide resource planning (ERP) system with integrated data aggregation engine |
| US7333982B2 (en) | 2000-02-28 | 2008-02-19 | Hyperroll Israel, Ltd. | Information system having a mode of operation in which queries form one or more clients are serviced using aggregated data retrieved from a plurality of different types of data storage structures for improved query performance |
| US7315849B2 (en) | 2000-02-28 | 2008-01-01 | Hyperroll Israel, Ltd. | Enterprise-wide data-warehouse with integrated data aggregation engine |
| US8473450B2 (en) | 2000-02-28 | 2013-06-25 | Yanicklo Technology Limited Liability Company | Relational database management system (RDBMS) employing multi-dimensional database (MDDB) for servicing query statements through one or more client machines |
| US8195602B2 (en) | 2000-02-28 | 2012-06-05 | Yanicklo Technology Limited Liability Company | Relational database management system (RDBMS) employing a relational datastore and a multi-dimensional database (MDDB) for serving query statements from client machines |
| US8170984B2 (en) | 2000-02-28 | 2012-05-01 | Yanicklo Technology Limited Liability Company | System with a data aggregation module generating aggregated data for responding to OLAP analysis queries in a user transparent manner |
| US8452804B2 (en) | 2000-02-28 | 2013-05-28 | Yanicklo Technology Limited Liability Company | Database management system (DBMS) employing a relational datastore and a multi-dimensional database (MDDB) for servicing query statements in a manner transparent to client machine |
| US20030217079A1 (en)* | 2000-02-28 | 2003-11-20 | Reuven Bakalash | Customer relationship management (CRM) system with integrated data aggregation engine |
| US20010037228A1 (en)* | 2000-05-05 | 2001-11-01 | Iaf Consulting, Inc. | System and method for using metadata to flexibly analyze data |
| US20020008699A1 (en)* | 2000-05-10 | 2002-01-24 | Jou Stephan F. | Method for preemptive screen rendering |
| US6853375B2 (en)* | 2000-05-10 | 2005-02-08 | Cognos Incorporated | Method for preemptive screen rendering |
| US20100141676A1 (en)* | 2000-06-05 | 2010-06-10 | Advanced Neuromodulation Systems, Inc. | System for regional data association and presentation and method for the same |
| US7928995B2 (en) | 2000-06-05 | 2011-04-19 | Advanced Neuromodulation Systems, Inc. | System for regional data association and presentation and method for the same |
| US7362334B2 (en) | 2000-06-05 | 2008-04-22 | Advanced Neuromodulation Systems, Inc. | System for regional data association and presentation and method for the same |
| US6690397B1 (en) | 2000-06-05 | 2004-02-10 | Advanced Neuromodulation Systems, Inc. | System for regional data association and presentation and method for the same |
| US20050192972A1 (en)* | 2000-06-05 | 2005-09-01 | Daignault Richard J.Jr. | System for regional data association and presentation and method for the same |
| US6718336B1 (en) | 2000-09-29 | 2004-04-06 | Battelle Memorial Institute | Data import system for data analysis system |
| US6940509B1 (en) | 2000-09-29 | 2005-09-06 | Battelle Memorial Institute | Systems and methods for improving concept landscape visualizations as a data analysis tool |
| US6778193B2 (en) | 2001-02-07 | 2004-08-17 | International Business Machines Corporation | Customer self service iconic interface for portal entry and search specification |
| US20020129017A1 (en)* | 2001-03-07 | 2002-09-12 | David Kil | Hierarchical characterization of fields from multiple tables with one-to-many relations for comprehensive data mining |
| US6931418B1 (en)* | 2001-03-26 | 2005-08-16 | Steven M. Barnes | Method and system for partial-order analysis of multi-dimensional data |
| US20020167551A1 (en)* | 2001-05-09 | 2002-11-14 | Steele Michael S. | Methodology for viewing large strategies via a computer workstation |
| US7000199B2 (en) | 2001-05-09 | 2006-02-14 | Fairisaac And Company Inc. | Methodology for viewing large strategies via a computer workstation |
| US20030050994A1 (en)* | 2001-07-27 | 2003-03-13 | Robert Pollack | Method of aggregating, classifying, reporting and cross-tabbing data in real time |
| US20030074352A1 (en)* | 2001-09-27 | 2003-04-17 | Raboczi Simon D. | Database query system and method |
| US6915290B2 (en)* | 2001-12-11 | 2005-07-05 | International Business Machines Corporation | Database query optimization apparatus and method that represents queries as graphs |
| US20030120682A1 (en)* | 2001-12-11 | 2003-06-26 | International Business Machines Corporation | Database query optimization apparatus and method that represents queries as graphs |
| US6928436B2 (en)* | 2002-02-28 | 2005-08-09 | Ilog Sa | Interactive generation of graphical visualizations of large data structures |
| US20030167278A1 (en)* | 2002-02-28 | 2003-09-04 | Thomas Baudel | Interactive generation of graphical visualizations of large data structures |
| US7543281B2 (en)* | 2002-07-22 | 2009-06-02 | National Instruments Corporation | Disabling and conditionally compiling graphical code in a graphical program |
| US20040012632A1 (en)* | 2002-07-22 | 2004-01-22 | Jason King | Disabling and conditionally compiling graphical code in a graphical program |
| US7805415B1 (en)* | 2003-06-10 | 2010-09-28 | Lockheed Martin Corporation | Systems and methods for sharing data between entities |
| US7171398B2 (en) | 2003-10-16 | 2007-01-30 | International Business Machines Corporation | Outer and exception join to inner join normalization |
| US20050086208A1 (en)* | 2003-10-16 | 2005-04-21 | International Business Machines Corporation | Outer and exception join to inner join normalization |
| US20050096950A1 (en)* | 2003-10-29 | 2005-05-05 | Caplan Scott M. | Method and apparatus for creating and evaluating strategies |
| US20080059563A1 (en)* | 2003-10-30 | 2008-03-06 | Lavastorm Technologies, Inc. | Methods and Systems for Automated Data Processing |
| US20050179684A1 (en)* | 2004-02-17 | 2005-08-18 | Wallace James H. | Data exploration system |
| US7587685B2 (en) | 2004-02-17 | 2009-09-08 | Wallace James H | Data exploration system |
| US20090216808A1 (en)* | 2004-02-17 | 2009-08-27 | James H. Wallace | Data exploration system |
| US20060010141A1 (en)* | 2004-04-23 | 2006-01-12 | Susumu Furukawa | Method, computer program product and data structure for representing two- or three-dimensional object modeling |
| US7557803B2 (en)* | 2004-04-23 | 2009-07-07 | Susumu Furukawa | Method, computer program product and data structure for representing two- or three-dimensional object modeling |
| EP1763795A4 (en)* | 2004-05-11 | 2007-09-05 | Angoss Software Corp | METHOD AND SYSTEM FOR MODIFYING AND VISUALIZING AN INTERACTIVE DECISION-MAKING TREE |
| US7873651B2 (en)* | 2004-05-11 | 2011-01-18 | Angoss Software Corporation | Method and system for interactive decision tree modification and visualization |
| US20060047640A1 (en)* | 2004-05-11 | 2006-03-02 | Angoss Software Corporation | Method and system for interactive decision tree modification and visualization |
| US9990430B2 (en) | 2004-05-26 | 2018-06-05 | Facebook, Inc. | Graph server querying for managing social network information flow |
| US9703879B2 (en) | 2004-05-26 | 2017-07-11 | Facebook, Inc. | Graph server querying for managing social network information flow |
| US10628502B2 (en) | 2004-05-26 | 2020-04-21 | Facebook, Inc. | Graph server querying for managing social network information flow |
| US9241027B2 (en) | 2004-05-26 | 2016-01-19 | Facebook, Inc. | System and method for managing an online social network |
| US8572221B2 (en) | 2004-05-26 | 2013-10-29 | Facebook, Inc. | System and method for managing an online social network |
| US20070244582A1 (en)* | 2004-06-04 | 2007-10-18 | Siemens Aktiengesellschaft | System for Operating an Installation by Editing Graphic Objects |
| US7734357B2 (en)* | 2004-06-04 | 2010-06-08 | Siemens Ag | System for operating an installation by editing graphic objects |
| US7847865B2 (en)* | 2005-05-27 | 2010-12-07 | Canon Kabushiki Kaisha | Digital television broadcasting receiving apparatus, control method for digital television broadcasting receiving apparatus, and control program for the same |
| US20060268163A1 (en)* | 2005-05-27 | 2006-11-30 | Canon Kabushiki Kaisha | Digital Television Broadcasting Receiving Apparatus, Control Method for Digital Television Broadcasting Receiving Apparatus, and Control Program for the Same |
| US20070192283A1 (en)* | 2006-02-15 | 2007-08-16 | Microsoft Corporation | Maintenance of materialized outer-join views |
| US7467128B2 (en)* | 2006-02-15 | 2008-12-16 | Microsoft Corporation | Maintenance of materialized outer-join views |
| US10599692B2 (en) | 2006-03-02 | 2020-03-24 | International Business Machines Corporation | Modification of a saved database query based on a change in the meaning of a query value over time |
| US20070208722A1 (en)* | 2006-03-02 | 2007-09-06 | International Business Machines Corporation | Apparatus and method for modification of a saved database query based on a change in the meaning of a query value over time |
| US20080301131A1 (en)* | 2006-03-02 | 2008-12-04 | International Business Machines Corporation | Modification of a saved database query based on a change in the meaning of a query value over time |
| US20080301110A1 (en)* | 2006-03-02 | 2008-12-04 | International Business Machines Corporation | Modification of a saved database query based on a change in the meaning of a query value over time |
| US20080301109A1 (en)* | 2006-03-02 | 2008-12-04 | International Business Machines Corporation | Modification of a saved database query based on a change in the meaning of a query value over time |
| US20070214107A1 (en)* | 2006-03-13 | 2007-09-13 | Oracle International Corporation | Dynamic materialized view ranging |
| US8204876B2 (en)* | 2006-03-13 | 2012-06-19 | Oracle International Corporation | Dynamic materialized view ranging |
| US20070266029A1 (en)* | 2006-05-10 | 2007-11-15 | Baskey Michael E | Recovery segment identification in a computing infrastructure |
| US7490265B2 (en)* | 2006-05-10 | 2009-02-10 | International Business Machines Corporation | Recovery segment identification in a computing infrastructure |
| US20080263082A1 (en)* | 2006-05-10 | 2008-10-23 | Baskey Michael E | Recovery segment identification in a computing infrastructure |
| US7831526B1 (en) | 2006-08-25 | 2010-11-09 | Fair Isaac Corporation | Article and method for finding a compact representation to visualize complex decision trees |
| US8149240B2 (en)* | 2007-02-07 | 2012-04-03 | Microsoft Corporation | Efficient symbolic differentiation using derivative graph factorization |
| US20080189345A1 (en)* | 2007-02-07 | 2008-08-07 | Microsoft Corporation | Efficient symbolic differentiation using derivative graph factorization |
| US8266090B2 (en) | 2007-08-31 | 2012-09-11 | Fair Isaac Corporation | Color-coded visual comparison of decision logic |
| US20090058859A1 (en)* | 2007-08-31 | 2009-03-05 | Crawford Stuart L | Construction of decision logic with graphs |
| US8200609B2 (en) | 2007-08-31 | 2012-06-12 | Fair Isaac Corporation | Construction of decision logic with graphs |
| US20090064053A1 (en)* | 2007-08-31 | 2009-03-05 | Fair Isaac Corporation | Visualization of Decision Logic |
| US8312389B2 (en)* | 2007-08-31 | 2012-11-13 | Fair Isaac Corporation | Visualization of decision logic |
| US20090113322A1 (en)* | 2007-10-31 | 2009-04-30 | Rogers Steven W | Global Variable Structure in a Graphical Program |
| US8392878B2 (en)* | 2007-10-31 | 2013-03-05 | National Instruments Corporation | In-place structure in a graphical program |
| US20150286677A1 (en)* | 2007-11-01 | 2015-10-08 | Chi-Hsien Chiu | Analyzing event streams of user sessions |
| US7917547B2 (en) | 2008-06-10 | 2011-03-29 | Microsoft Corporation | Virtualizing objects within queries |
| US20090307192A1 (en)* | 2008-06-10 | 2009-12-10 | Microsoft Corporation | Virtualizing objects within queries |
| US8730241B2 (en) | 2008-09-08 | 2014-05-20 | Fair Isaac Corporation | Techniques for drawing curved edges in graphs |
| US8280836B2 (en) | 2008-09-08 | 2012-10-02 | Fair Isaac Corporation | Converting unordered graphs to oblivious read once ordered graph representation |
| US8237716B2 (en) | 2008-09-08 | 2012-08-07 | Fair Isaac Corporation | Algorithm for drawing directed acyclic graphs |
| US20100060642A1 (en)* | 2008-09-08 | 2010-03-11 | Gaurav Chhaparwal | Techniques For Drawing Curved Edges In Graphs |
| US20100060643A1 (en)* | 2008-09-08 | 2010-03-11 | Kashyap Babu Rao Kolipaka | Algorithm For Drawing Directed Acyclic Graphs |
| US20100063953A1 (en)* | 2008-09-08 | 2010-03-11 | Prasun Kumar | Converting unordered graphs to oblivious read once ordered graph representation |
| US20100188413A1 (en)* | 2009-01-23 | 2010-07-29 | Hao Ming C | Placement of cells in bins to provide non-overlapping visualization of data points of a scatter plot |
| US9298789B2 (en) | 2009-01-23 | 2016-03-29 | Hewlett Packard Enterprise Development Lp | Placement of cells in bins to provide non-overlapping visualization of data points of a scatter plot |
| US8643646B2 (en)* | 2009-03-16 | 2014-02-04 | Hewlett-Packard Development Company, L.P. | Constructing a cell-based cluster of data records of a scatter plot |
| US20100231594A1 (en)* | 2009-03-16 | 2010-09-16 | Hao Ming C | Constructing a cell-based cluster of data records of a scatter plot |
| US8161048B2 (en) | 2009-04-24 | 2012-04-17 | At&T Intellectual Property I, L.P. | Database analysis using clusters |
| US20100274785A1 (en)* | 2009-04-24 | 2010-10-28 | At&T Intellectual Property I, L.P. | Database Analysis Using Clusters |
| US8595194B2 (en) | 2009-09-15 | 2013-11-26 | At&T Intellectual Property I, L.P. | Forward decay temporal data analysis |
| US20110066600A1 (en)* | 2009-09-15 | 2011-03-17 | At&T Intellectual Property I, L.P. | Forward decay temporal data analysis |
| US8810576B2 (en)* | 2010-04-13 | 2014-08-19 | Microsoft Corporation | Manipulation and management of links and nodes in large graphs |
| US20110249002A1 (en)* | 2010-04-13 | 2011-10-13 | Microsoft Corporation | Manipulation and management of links and nodes in large graphs |
| US9798771B2 (en) | 2010-08-06 | 2017-10-24 | At&T Intellectual Property I, L.P. | Securing database content |
| US9965507B2 (en) | 2010-08-06 | 2018-05-08 | At&T Intellectual Property I, L.P. | Securing database content |
| US20120158687A1 (en)* | 2010-12-17 | 2012-06-21 | Yahoo! Inc. | Display entity relationship |
| US9043360B2 (en)* | 2010-12-17 | 2015-05-26 | Yahoo! Inc. | Display entity relationship |
| US8743122B2 (en)* | 2011-03-07 | 2014-06-03 | Microsoft Corporation | Interactive visualization for exploring multi-modal, multi-relational, and multivariate graph data |
| US20120229466A1 (en)* | 2011-03-07 | 2012-09-13 | Microsoft Corporation | Interactive visualization for exploring multi-modal, multi-relational, and multivariate graph data |
| US8666919B2 (en) | 2011-07-29 | 2014-03-04 | Accenture Global Services Limited | Data quality management for profiling, linking, cleansing and migrating data |
| US8849736B2 (en) | 2011-07-29 | 2014-09-30 | Accenture Global Services Limited | Data quality management for profiling, linking, cleansing, and migrating data |
| US9082076B2 (en) | 2011-07-29 | 2015-07-14 | Accenture Global Services Limited | Data quality management for profiling, linking, cleansing, and migrating data |
| CN103019691B (en)* | 2012-11-20 | 2016-08-10 | 北京思特奇信息技术股份有限公司 | The method for transformation of a kind of ETL job relations figure and realize system |
| CN103019691A (en)* | 2012-11-20 | 2013-04-03 | 北京思特奇信息技术股份有限公司 | Transformation method for extract, transform and load (ETL) operation relation graph and implementation system thereof |
| US9280612B2 (en) | 2012-12-14 | 2016-03-08 | Hewlett Packard Enterprise Development Lp | Visualizing a relationship of attributes using a relevance determination process to select from candidate attribute values |
| US9563974B2 (en) | 2013-03-29 | 2017-02-07 | International Business Machines Corporation | Aggregating graph structures |
| US20140292765A1 (en)* | 2013-03-29 | 2014-10-02 | International Business Machines Corporation | Aggregating graph structures |
| US9311730B2 (en)* | 2013-03-29 | 2016-04-12 | International Business Machines Corporation | Aggregating graph structures |
| US20140189650A1 (en)* | 2013-05-21 | 2014-07-03 | Concurix Corporation | Setting Breakpoints Using an Interactive Graph Representing an Application |
| US9658943B2 (en) | 2013-05-21 | 2017-05-23 | Microsoft Technology Licensing, Llc | Interactive graph for navigating application code |
| US9734040B2 (en)* | 2013-05-21 | 2017-08-15 | Microsoft Technology Licensing, Llc | Animated highlights in a graph representing an application |
| US20140189651A1 (en)* | 2013-05-21 | 2014-07-03 | Concurix Corporation | Animated Highlights in a Graph Representing an Application |
| US9754396B2 (en) | 2013-07-24 | 2017-09-05 | Microsoft Technology Licensing, Llc | Event chain visualization of performance data |
| US9864672B2 (en) | 2013-09-04 | 2018-01-09 | Microsoft Technology Licensing, Llc | Module specific tracing in a shared module environment |
| US10346292B2 (en) | 2013-11-13 | 2019-07-09 | Microsoft Technology Licensing, Llc | Software component recommendation based on multiple trace runs |
| US20150248475A1 (en)* | 2014-03-03 | 2015-09-03 | Michael L. Hamm | Text-sql relational database |
| US9015165B1 (en)* | 2014-03-03 | 2015-04-21 | Michael L. Hamm | Text-SQL relational database |
| US20170097990A1 (en)* | 2014-03-03 | 2017-04-06 | Michael L. Hamm | Text-sql relational database |
| US10671751B2 (en) | 2014-10-10 | 2020-06-02 | Salesforce.Com, Inc. | Row level security integration of analytical data store with cloud architecture |
| US10852925B2 (en) | 2014-10-10 | 2020-12-01 | Salesforce.Com, Inc. | Dashboard builder with live data updating without exiting an edit mode |
| US11954109B2 (en) | 2014-10-10 | 2024-04-09 | Salesforce, Inc. | Declarative specification of visualization queries |
| US9923901B2 (en) | 2014-10-10 | 2018-03-20 | Salesforce.Com, Inc. | Integration user for analytical access to read only data stores generated from transactional systems |
| US9600548B2 (en) | 2014-10-10 | 2017-03-21 | Salesforce.Com | Row level security integration of analytical data store with cloud architecture |
| US10049141B2 (en) | 2014-10-10 | 2018-08-14 | salesforce.com,inc. | Declarative specification of visualization queries, display formats and bindings |
| US20160103872A1 (en)* | 2014-10-10 | 2016-04-14 | Salesforce.Com, Inc. | Visual data analysis with animated informational morphing replay |
| US10101889B2 (en) | 2014-10-10 | 2018-10-16 | Salesforce.Com, Inc. | Dashboard builder with live data updating without exiting an edit mode |
| US10963477B2 (en) | 2014-10-10 | 2021-03-30 | Salesforce.Com, Inc. | Declarative specification of visualization queries |
| US9767145B2 (en)* | 2014-10-10 | 2017-09-19 | Salesforce.Com, Inc. | Visual data analysis with animated informational morphing replay |
| US10115213B2 (en) | 2015-09-15 | 2018-10-30 | Salesforce, Inc. | Recursive cell-based hierarchy for data visualizations |
| US10877985B2 (en) | 2015-09-18 | 2020-12-29 | Salesforce.Com, Inc. | Systems and methods for making visual data representations actionable |
| US10089368B2 (en) | 2015-09-18 | 2018-10-02 | Salesforce, Inc. | Systems and methods for making visual data representations actionable |
| US10503751B2 (en)* | 2015-10-16 | 2019-12-10 | Sap Se | Fragmentation for rapid data visualization |
| US20170277731A1 (en)* | 2016-03-28 | 2017-09-28 | International Business Machines Corporation | Hiding nodes in a tree containing shared subtrees |
| US20170277728A1 (en)* | 2016-03-28 | 2017-09-28 | International Business Machines Corporation | Hiding nodes in a tree containing shared subtrees |
| US11301493B2 (en) | 2016-04-14 | 2022-04-12 | Ge Aviation Systems Llc | Systems and methods for providing data exploration techniques |
| US20180089295A1 (en)* | 2016-09-23 | 2018-03-29 | International Business Machines Corporation | Interactive Visualization |
| US10430436B2 (en)* | 2016-09-23 | 2019-10-01 | International Business Machines Corporation | Interactive visualization |
| US10423593B2 (en)* | 2016-09-23 | 2019-09-24 | International Business Machines Corporation | Interactive visualization |
| US20180089238A1 (en)* | 2016-09-23 | 2018-03-29 | International Business Machines Corporation | Interactive Visualization |
| US10366061B2 (en)* | 2016-09-23 | 2019-07-30 | International Business Machines Corporation | Interactive visualization |
| US10331636B2 (en)* | 2016-09-23 | 2019-06-25 | International Business Machines Corporation | Interactive visualization |
| US10956390B2 (en) | 2016-09-23 | 2021-03-23 | International Business Machines Corporation | Interactive visualization |
| US10311047B2 (en) | 2016-10-19 | 2019-06-04 | Salesforce.Com, Inc. | Streamlined creation and updating of OLAP analytic databases |
| US11126616B2 (en) | 2016-10-19 | 2021-09-21 | Salesforce.Com, Inc. | Streamlined creation and updating of olap analytic databases |
| US11188556B2 (en) | 2016-11-07 | 2021-11-30 | Tableau Software, Inc. | Correlated incremental loading of multiple data sets for an interactive data prep application |
| US11853529B2 (en) | 2016-11-07 | 2023-12-26 | Tableau Software, Inc. | User interface to prepare and curate data for subsequent analysis |
| US12430003B2 (en) | 2016-11-07 | 2025-09-30 | Tableau Software, Inc. | User interface to prepare and curate data for subsequent analysis |
| AU2018223011A1 (en)* | 2018-08-30 | 2020-03-19 | Flamingo Ai Limited | Method and system for administering a network data structure |
| US11966423B2 (en) | 2018-10-22 | 2024-04-23 | Tableau Software, Inc. | Data preparation user interface with conditional remapping of data values |
| US11061538B2 (en)* | 2018-10-22 | 2021-07-13 | Tableau Software, Inc. | Data preparation user interface with conglomerate heterogeneous process flow elements |
| US11460977B2 (en) | 2018-10-22 | 2022-10-04 | Tableau Software, Inc. | Data preparation user interface with conglomerate heterogeneous process flow elements |
| US10691304B1 (en)* | 2018-10-22 | 2020-06-23 | Tableau Software, Inc. | Data preparation user interface with conglomerate heterogeneous process flow elements |
| US11250032B1 (en) | 2018-10-22 | 2022-02-15 | Tableau Software, Inc. | Data preparation user interface with conditional remapping of data values |
| US11921979B2 (en)* | 2018-10-22 | 2024-03-05 | Tableau Software, Inc. | Data preparation user interface with configurable process flow elements |
| CN110990447B (en)* | 2019-12-19 | 2023-09-15 | 北京锐安科技有限公司 | Data exploration method, device, equipment and storage medium |
| CN110990447A (en)* | 2019-12-19 | 2020-04-10 | 北京锐安科技有限公司 | Data probing method, device, equipment and storage medium |
| CN111782654A (en)* | 2020-07-01 | 2020-10-16 | 浪潮云信息技术股份公司 | Method for storing data in distributed database in partition mode |
| US11567996B2 (en)* | 2020-12-28 | 2023-01-31 | Atlassian Pty Ltd | Collaborative document graph-based user interfaces |
| US20220207086A1 (en)* | 2020-12-28 | 2022-06-30 | Atlassian Pty Ltd | Collaborative document graph-based user interfaces |
| US12032994B1 (en) | 2021-10-18 | 2024-07-09 | Tableau Software, LLC | Linking outputs for automatic execution of tasks |
| US20240153169A1 (en)* | 2022-11-03 | 2024-05-09 | Adobe Inc. | Changing coordinate systems for data bound objects |
| US12387397B2 (en) | 2022-11-03 | 2025-08-12 | Adobe Inc. | Automatically generating axes for data visualizations including data bound objects |
Also Published As
| Publication number | Publication date |
|---|---|
| CA2200924A1 (en) | 1997-10-30 |
| CA2200924C (en) | 2001-02-13 |
Similar Documents
| Publication | Publication Date | Title |
|---|---|---|
| US5999192A (en) | Interactive data exploration apparatus and methods | |
| US8346811B2 (en) | System and method for analyzing and reporting extensible data from multiple sources in multiple formats | |
| US6831668B2 (en) | Analytical reporting on top of multidimensional data model | |
| US6397207B1 (en) | System and method for selectively preparing customized reports of query explain data | |
| US7171405B2 (en) | Systems and methods for organizing data | |
| US5960435A (en) | Method, system, and computer program product for computing histogram aggregations | |
| US7805440B2 (en) | System and method for simplifying and manipulating k-partite graphs | |
| US7644361B2 (en) | Method of using recommendations to visually create new views of data across heterogeneous sources | |
| US7856458B2 (en) | Online analytical processing (OLAP) | |
| AU780565B2 (en) | Method and apparatus for selecting aggregate levels and cross product levels for a data warehouse | |
| JP3049636B2 (en) | Data analysis method | |
| US20020091681A1 (en) | Report then query capability for a multidimensional database model | |
| US20050060647A1 (en) | Method for presenting hierarchical data | |
| Thomas et al. | A conceptual model and algebra for on-line analytical processing in decision support databases | |
| EP0697667A1 (en) | Method and apparatus for displaying structures and relationships of a relational database | |
| Selfridge et al. | Idea: Interactive data exploration and analysis | |
| US6684216B1 (en) | Method and computer system for providing input, analysis, and output capability for multidimensional information | |
| US9268817B2 (en) | Efficient evaluation of hierarchical cubes by non-blocking rollups and skipping levels | |
| Yahia et al. | Emulating a cooperative behavior in a generic association rule visualization tool | |
| Reiss et al. | The Bloom software visualziation system | |
| Lee et al. | A multi-dimensional data visualization tool for knowledge discovery in databases | |
| Seeling et al. | Analysing associations of textual and relational data with a multiple views system | |
| Chattratichat et al. | A visual language for internet-based data mining and data visualisation | |
| US20070299861A1 (en) | System and method for managing large OLAP in an analytical context | |
| Felipe et al. | Modeling of an Object-Oriented Data Mart for Knowledge Discovery in Multimedia Metadata. |
Legal Events
| Date | Code | Title | Description |
|---|---|---|---|
| AS | Assignment | Owner name:AT&T CORP., NEW YORK Free format text:ASSIGNMENT OF ASSIGNORS INTEREST;ASSIGNORS:SELFRIDGE, PETER GILMAN;SRIVASTAVA, DIVESH;REEL/FRAME:008017/0084 Effective date:19960429 | |
| STCF | Information on status: patent grant | Free format text:PATENTED CASE | |
| FEPP | Fee payment procedure | Free format text:PAYOR NUMBER ASSIGNED (ORIGINAL EVENT CODE: ASPN); ENTITY STATUS OF PATENT OWNER: LARGE ENTITY | |
| AS | Assignment | Owner name:THE CHASE MANHATTAN BANK, AS COLLATERAL AGENT, TEX Free format text:CONDITIONAL ASSIGNMENT OF AND SECURITY INTEREST IN PATENT RIGHTS;ASSIGNOR:LUCENT TECHNOLOGIES INC. (DE CORPORATION);REEL/FRAME:011722/0048 Effective date:20010222 | |
| FEPP | Fee payment procedure | Free format text:PAYER NUMBER DE-ASSIGNED (ORIGINAL EVENT CODE: RMPN); ENTITY STATUS OF PATENT OWNER: LARGE ENTITY Free format text:PAYOR NUMBER ASSIGNED (ORIGINAL EVENT CODE: ASPN); ENTITY STATUS OF PATENT OWNER: LARGE ENTITY | |
| FPAY | Fee payment | Year of fee payment:4 | |
| AS | Assignment | Owner name:LUCENT TECHNOLOGIES INC., NEW JERSEY Free format text:TERMINATION AND RELEASE OF SECURITY INTEREST IN PATENT RIGHTS;ASSIGNOR:JPMORGAN CHASE BANK, N.A. (FORMERLY KNOWN AS THE CHASE MANHATTAN BANK), AS ADMINISTRATIVE AGENT;REEL/FRAME:018590/0047 Effective date:20061130 | |
| FPAY | Fee payment | Year of fee payment:8 | |
| FPAY | Fee payment | Year of fee payment:12 | |
| AS | Assignment | Owner name:CREDIT SUISSE AG, NEW YORK Free format text:SECURITY INTEREST;ASSIGNOR:ALCATEL-LUCENT USA INC.;REEL/FRAME:030510/0627 Effective date:20130130 | |
| AS | Assignment | Owner name:ALCATEL-LUCENT USA INC., NEW JERSEY Free format text:RELEASE BY SECURED PARTY;ASSIGNOR:CREDIT SUISSE AG;REEL/FRAME:033950/0261 Effective date:20140819 |