US5982383A - System and method for generating graphics charts - Google Patents
System and method for generating graphics chartsDownload PDFInfo
- Publication number
- US5982383A US5982383AUS08/770,978US77097896AUS5982383AUS 5982383 AUS5982383 AUS 5982383AUS 77097896 AUS77097896 AUS 77097896AUS 5982383 AUS5982383 AUS 5982383A
- Authority
- US
- United States
- Prior art keywords
- graphics
- chart
- shapes
- shape
- grid
- Prior art date
- Legal status (The legal status is an assumption and is not a legal conclusion. Google has not performed a legal analysis and makes no representation as to the accuracy of the status listed.)
- Expired - Lifetime
Links
Images


Classifications
- G—PHYSICS
- G06—COMPUTING OR CALCULATING; COUNTING
- G06T—IMAGE DATA PROCESSING OR GENERATION, IN GENERAL
- G06T11/00—2D [Two Dimensional] image generation
- G06T11/20—Drawing from basic elements, e.g. lines or circles
- G06T11/206—Drawing of charts or graphs
- G—PHYSICS
- G06—COMPUTING OR CALCULATING; COUNTING
- G06F—ELECTRIC DIGITAL DATA PROCESSING
- G06F3/00—Input arrangements for transferring data to be processed into a form capable of being handled by the computer; Output arrangements for transferring data from processing unit to output unit, e.g. interface arrangements
- G06F3/01—Input arrangements or combined input and output arrangements for interaction between user and computer
- G06F3/048—Interaction techniques based on graphical user interfaces [GUI]
- G06F3/0484—Interaction techniques based on graphical user interfaces [GUI] for the control of specific functions or operations, e.g. selecting or manipulating an object, an image or a displayed text element, setting a parameter value or selecting a range
- G06F3/04845—Interaction techniques based on graphical user interfaces [GUI] for the control of specific functions or operations, e.g. selecting or manipulating an object, an image or a displayed text element, setting a parameter value or selecting a range for image manipulation, e.g. dragging, rotation, expansion or change of colour
- G—PHYSICS
- G06—COMPUTING OR CALCULATING; COUNTING
- G06F—ELECTRIC DIGITAL DATA PROCESSING
- G06F40/00—Handling natural language data
- G06F40/10—Text processing
- G06F40/166—Editing, e.g. inserting or deleting
- G06F40/177—Editing, e.g. inserting or deleting of tables; using ruled lines
- G06F40/18—Editing, e.g. inserting or deleting of tables; using ruled lines of spreadsheets
Definitions
- This inventionrelates to the field of graphics computer programs, and more particularly to a system and method for creating graphics.
- Graphicsare the easiest way to communicate information.
- the creation of graphic layouts or chartshas progressed from manual pen and paper generation techniques to computer aided techniques.
- Previously developed computer graphics programs or applicationsgenerally provide clean, professional graphics in a fraction of the time required for hand drawn graphics.
- these computer programscan be complicated and may require high-end computer systems in order to run the software program.
- previously developed computer graphics programsare generally not user friendly. Computer users of these systems may have to spend hours or days practicing with the system before becoming proficient in generating acceptable graphics. Also, many previously developed computer graphics programs may require the user to have artistic abilities in order to generate professional, clean graphics. Persons lacking artistic abilities may find using previously developed computer graphics systems intimidating.
- a user friendly computer graphics system and methodare provided that substantially eliminate or reduce disadvantages and problems associated with previously developed graphics systems and methods.
- One aspect of the present inventionprovides a computer graphics program executed by a processor for generating a plurality of types of graphics charts on a computer display.
- the programincludes instructions for generating an adjustable grid associated with each type of graphics chart. Each grid provides placements for text and shapes for each type of graphics chart.
- the present inventionfurther includes instructions for generating snap zones associated with each grid for controlling the orientation of the shapes and text placed within the grid.
- the present graphics system and methodprovides numerous technical advantages.
- One technical advantage of the present inventionis that is provides a user friendly computer graphics system.
- the present inventionuses intelligent templates and pre-drawn shapes that make creating graphics much simpler and quicker. This can increase the productivity of a person or persons using the present invention.
- Another technical advantage of the present inventionis that it can be used without extensive training or practice. This allows a user to nearly immediately begin creating professional, clean graphics.
- Yet another technical advantage of present inventionis that it comprises a computer program that runs on standard or commercially available computer equipment and does not require high-end workstations as may be required for some previously developed computer graphics programs. This maintains the computer platform costs for practicing the present invention relatively low.
- FIG. 1illustrates a schematic block diagram for a computer system that may be employed in practice of the present invention
- FIG. 2shows the template gallery dialog box generated in accordance with the present invention
- FIG. 3depicts an exemplary computer screen and graphics chart in accordance with the present invention
- FIG. 4illustrates a pyramid graphic generated in accordance with the present invention
- FIG. 5illustrates a target graphic generated in accordance with the present invention
- FIG. 6illustrates in process the pyramid graphic from FIG. 4 in accordance with the present invention
- FIG. 7depicts a Venn diagram graphic in accordance with the present invention.
- FIG. 8shows an exemplary organization chart graphic that may be generated in accordance with the present invention.
- FIG. 9illustrates a flow chart graphic generated in accordance with the present invention.
- FIG. 10illustrates a dialog box for controlling the shadows and three-dimensional outline of a shape in accordance with the present invention
- FIG. 11depicts a time line graphic generated in accordance with the present invention.
- FIG. 12shows a checklist graphic in accordance with the present invention
- FIG. 13shows a direction graphic generated in accordance with the present invention
- FIG. 14shows a netmap graphic generated in accordance with the present invention.
- FIG. 15illustrates a circle/spoke graphic generated in accordance with the present invention.
- FIGURESPreferred embodiments of the present invention are illustrated in the FIGURES, like numerals being used to refer to like and corresponding parts of the various drawings.
- FIG. 1illustrates computer system 10 for implementing the present invention.
- Computer system 10is adapted to execute any of the well-known, MS-DOS, PC-DOS, OS2, MAC-OSTM, or WindowsTM operating systems.
- Computer system 10includes microprocessor 12, random access memory (RAM) 14, read-only memory (ROM) 16, mouse 18, keyboard 20, and output devices, such as printer 22, disc drive 24, and display 26.
- RAMrandom access memory
- ROMread-only memory
- the present inventionprovides a software computer program that may be stored in RAM 14, ROM 16, or disk drives 24, that is executed by microprocessor 12.
- the present inventionis adapted for implementation in a computer language such as, for example, C or C ++ that may be compiled based on the instructions of the desired computer operating system.
- Computer system 10can be any computer running, for example, WindowsTM 3.1 operating system or higher.
- Microprocessor 12in the preferred embodiment, is an 80386TM microprocessor or higher, e.g., 80486TM or PentiumTM microprocessor.
- Disc drives 24should have storage capacity on the order of at least 8 megabytes (MB) and RAM 14 should have storage capacity on the order of at least 2 MB, while 4 MB are generally preferred.
- Display 26should be a video graphics array (VGA) or have a WindowsTM compatible graphics card.
- VGAvideo graphics array
- the present inventionprovides a computer graphics program that utilizes intelligent templates and pre-drawn shapes to allow a user to quickly and easily create clean and professional looking graphics.
- the present systemanticipates the types of graphics that may be required by the user and provides a number of templates for different graphic layouts or charts so that customized graphics can be created quickly and efficiently.
- the present inventionis currently available as the software package known as ABC SnapGraphicsTM available from Micrografx, Inc., of Richardson, Tex.
- FIG. 2illustrates dialog box 28 showing template gallery 30 in accordance with the present invention.
- system 10presents template gallery 30 on display 26 for the user to view.
- Template gallery 30presents the user of the present invention with a selection of graphics templates that can be used to create graphic layouts or charts. Selection of any one template presents the user with a template chart that includes preset tabs, shapes or a shape palette, tool bars, grids, and snap zones and other elements. Each of these elements will be described in more detail hereinafter.
- Template gallery 30 in FIG. 2includes: freestyle template 32, organizational chart template 34, checklist template 36, target template 40, flow chart template 42, timeline template 44, component template 46, drawform template 48, comparison template 50, tree template 52, drawbar template 54, connection template 56, cascade template 58, pyramid template 60, direction template 62, block template 64, netmap template 66, Venn diagram template 68, circle/spoke template 70, and custom template 72.
- freestyle template 32By using the well known point and click methodology associated with the WindowsTM operating system and other graphically based interfaces, the user of the present invention running on computer system 10 can select a template from template gallery 30 on display 26 with mouse 18 to initiate the generation of a graphics chart.
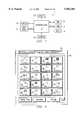
- FIG. 3illustrates example screen 74 on display 26 of computer system 10 when comparison template 50 on template gallery 30 in FIG. 2 is selected by the user.
- Comparison chart 76is displayed on display 26 by computer system 10.
- Comparison chart 76is bounded by top tool bar 78, left tool bar 80, bottom tool bar 82, and vertical scroll bar 84.
- Computer system 10may employ common WindowsTM interface techniques in generating screen 74 and to allow the user to select different features and operations for manipulating the information on screen 74.
- the tool bars and scroll barsaid the user of the present graphics program in preparing a graphics chart.
- Top tool bar 78provides the user with point-and-click access to a number of functions available with the present system.
- Line draw buttons 86allow the user to draw various line shapes on screen 74.
- Each intelligent template, as represented by template gallery 30,has a unique line drawing capability, so line draw buttons 86 for each template may be different.
- Insert/delete buttons 88allow the user to insert and delete shapes, rows, or columns into a chart.
- Shape border button 90presents the user with choices for the border of the shapes within chart 76.
- Shape fill pattern button 92allows the user to define the pattern that will be used to fill a given shape within chart 76.
- Three-dimensional and shadow button 94may be selected to allow the user to define the shadowing and configuration of three-dimensional shapes in comparison chart 76.
- Line 96 and arrow 98 buttonsmay be selected to allow the user to select the type of line and arrow to be generated on chart 76, respectively.
- Text style button 100may be selected to present to the user options available for adding text to chart 76.
- Bold button 102is selected when the text in chart 76 should be bold.
- Font size indicator 104 and font select button 106may be used to select the size and type of the font used in chart 76.
- Alignment indicator/select 108is used to define the alignment of text within a place holder or snap zone.
- Template indicator 110corresponds to the icon presented in template gallery 30 for the template selected. Therefore, template select indicator 110 in FIG. 3 corresponds to comparison template 50 in FIG. 2.
- Left tool bar 80also presents the user of the present invention with several settings for chart 76.
- Left tool bar 80includes template gallery select button 112 that may be used to return to template gallery 30 at any time while working in the chart shown on display 26.
- Select button 114is selected by the user so that shapes or text within chart 76 can be selected and moved or edited.
- Pencil icon button 116is selected when the user wishes to draw shapes or lines within chart 76.
- Text select button 118is selected in order to add text to chart 76.
- View select button 120is selected to zoom-in or zoom-out within the view of chart 76 presented on display 26.
- Eyedropper button 122is selected to copy style attributes between shapes in chart 76.
- the usermay also click in the lower part of color palette 124.
- Color palette 124provides the user with selections for different colors that may be used in chart 76. It is noted that the present system allows numerous colors to be used in generating chart 76 on display 26.
- Bottom tool bar 82 of screen 74includes help hints section 126 that prompts the user of the present invention to a likely next action.
- Snap off and on button 128turns the snap feature of the present invention off and on.
- the snap feature or snap zoneswill be described in more detail hereinafter.
- Show or hide template gridlines button 130is selected by the user in order to display or hide the gridlines within chart 76.
- Page and grid colors button 132may be selected by the user in order to present options for the colors displayed on screen 74.
- Show or hide shape palette button 134is selected by the user to set whether shape palette 136 is shown on screen 74.
- Browse buttons 138allow the user to cycle through the number of charts currently opened at a given time.
- Located above bottom tool bar 82is horizontal scroll bar 137 that allows the user to move horizontally in chart 76 while displayed in screen 74.
- Horizontal tab ribbon 139includes a plurality of tabs including inward tabs 140 and ribbon tabs 142. Inward tabs 140 define the size of columns 144, while ribbon tabs 142 define the margins for grid 146 of chart 76. Similarly, vertical tab ribbon 148 includes inward tabs 150 and ribbon tabs 152. Inward tabs 150 define the spacing of rows 151 of grid 146 while ribbon tabs 152 define the margins of grid 146 of chart 76.
- the tab settings in either horizontal tab ribbon 139 or vertical tab ribbon 148can be changed by clicking and dragging any one of the tabs.
- the present inventionalso provides slider lock or tab lock button 154 that can be used to lock and unlock the tabs of chart 76.
- tab lock 154When tab lock 154 is engaged, then moving a single tab, e.g., tab 140 in horizontal tab ribbon 138, causes all of the tabs to be changed by a like amount. The same holds true when tab lock 154 is engaged and a single tab within vertical tab ribbon 148 is moved. Unlocking tab lock 154 allows for individual tabs with a tab ribbon to be moved with respect to the other tabs in the tab ribbon.
- Grid 146presents to the user of chart 76 with a template for the graphics being generated.
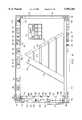
- a comparison chartWhen the user wishes to generate, for example, a comparison chart, then selecting comparison chart template 50 from template gallery 30 in FIG. 2 results in comparison chart 76 being displayed on display 26.
- the items being comparedcan be presented in column 156 with various features presented in rows 158 and 160.
- Grid 146has horizontal lines 162 and vertical lines 164 that define grid 146. When chart 76 is first created, grid 146 is presented on screen 76 to aid the user in generating a comparison graphics chart.
- Grid 146also includes text insert placeholders 166 that highlight to the user where to insert text into chart 76.
- Chart 74also has shapes 168 placed on grid 146.
- FIG. 3has been used to describe a number of the tools and features that may be used in generating a chart or graphics with the present systems. While these tools and features have been described in connection with comparison chart 76, it is understood that the function of these tools and features is not limited to chart 76.
- One of the advantages of the present systemis that it can use the same set of tools or features to generate many different types of graphics.
- FIG. 3illustrates the concept of slideable grids that facilitates generating graphics with the present system.
- Slideable gridsallows the user to adjust the grid for a selected template for generating graphics.
- the grids for each type of chartmay be modified by moving the tab controls for the chart.
- the tab controlsare located in two ribbon tabs outside the chart area.
- To change the grid spacinga user may click down on one of the tabs and drag it to a new position.
- the default modeis to maintain the tab spacing uniform so that when one tab is moved, all the tabs are moved.
- Tab lock button 154is provided to change modes so that the spacing of individual rows or columns within grid 146 can be modified.
- FIG. 3illustrates tab 170 that is being moved.
- indication line 172appears on screen 74.
- Indication line 172allows the user to visualize how grid 146 will be changed by the proposed movement of tab 170. Once tab 170 is released by the user, the spacing of grid 146 will change to where 170 is released.
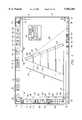
- FIG. 4illustrates pyramid chart 174.
- Pyramid chart 174displays pyramid 176 including pyramid sections 178.
- Horizontal tab ribbon 139 of chart 174includes centering tab 180 and angle tab 182. Moving center tab 180 changes the orientation of triangle 176 within chart 174. Moving angle tab 182 modifies the angle of the sides of pyramid 176. When angle tab 182 is selected and moved, indication line 184 appears so that the user can visualize how the movement of angle tab 182 will affect pyramid 176.
- Vertical tab ribbon 148 for pyramid chart 174includes ribbon tab 186 that defines the top of pyramid 176.
- Inward tabs 188 and 190define the spacing between pyramid sections 178. Therefore, increasing the separation between tabs 188 and 190 increases the spacing between pyramid sections 178 of pyramid 176.
- Pyramid chart 174also illustrates an additional tool not previously described in discussions related to FIG. 3.
- Flip button 191 in top tool bar 78can be toggled to flip pyramid 76 in FIG. 4.
- Some of the other templates provided with the present systemalso provide flip button 191.
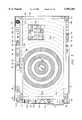
- FIG. 5illustrates target chart 192 that may be generated in accordance with the present invention.
- Target chart 192may be displayed on display 26 of computer system 10 by selecting target template 40 from template gallery 30 of FIG. 2. Selecting target template 40 presents the user with target chart 192 having a grid with a plurality of concentric circles 194. Concentric circles 194 may be filled by selecting shapes from shape palette 136 and placing the shapes in concentric circles 194.
- the size of concentric circles 194 in the grid of target chart 192are controlled by inward tabs 198 in horizontal tab ribbon 138. Moving, for example, inward tab 198 can increase or decrease the diameter of concentric circles 194.
- the position of target 200 within chart 192is controlled by horizontal tab 202 and vertical tab 204. By moving the tabs of chart 152 the grid of chart 192 can be easily modified to the desired shape for the target chart being created.
- the slidable grid functionintegrates the concept of an adjustable grid with graphics. By making the grids for each template adjustable, the templates available with the present invention can be easily tailored by the user to generate custom graphics charts. Pseudo-code for implementing slidable grids may be found under Table I below.
- Snap zones or place holdersare areas on a chart pre-designated for placing shapes on the chart. Snap zones ensure that a shape is placed on the chart in a location and orientation with the other shapes on the chart that gives the chart a professional, clean look.
- mouse 18When mouse 18 is used to select a shape to be placed in a snap zone on a chart, the position of the shape in the snap zone is automatically adjusted to the preset position in the snap zone depending on the shape snap type.
- the preset positions for a snap zonemay be, for example, centered, left justified, top aligned, or button aligned. Shapes may have independent horizontal and vertical snapping attributes.
- the shape of a snap zonemay be modified by changing the slidable grid for the chart.
- Shapes previously placed in a snap zoneare automatically adjusted to the new grid spacing and snap zones. Additionally, for some snap zones, shapes placed in the snap zone will be automatically sized to fill the entire snap zone. Different templates have different shapes and positioning snap zones depending on the anticipated placement of shapes within the chart.
- comparison chart 76uses snap zones to help in creating chart 76.
- Each block in grid 146 of chart 76represents a snap zone.
- snap zone 210 in chart 76has been highlighted to illustrate a typical snap zone defined by grid 146 in chart 76.
- Square shape 212has been placed within snap zone 210 and is perfectly centered within snap zone 210.
- Comparison template 50automatically sets the positioning of shapes within the snap zones of grid 146 to the center of each snap zone. This default positioning within snap zones is preset because shapes placed within a comparison chart, like chart 76, are generally centered in the blocks of grid 146 in order to prepare a professional looking chart.
- snap zone off and on button 128can be toggled turning off the snap zones within grid 146. This allows a user of the present system to place a shape anywhere on grid 146 without automatically snapping the shape to the center of one of the blocks in grid 146.
- FIG. 6illustrates pyramid chart 174 of FIG. 4 prior to placement of all pyramid sections 178 of pyramid 176.
- Pyramid sections 178are chosen from shape palette 136 and placed on pyramid 176.
- second section 214 of pyramid 176has still not been filled with an appropriate shape.
- Chart 174does show snap zone 216 outlined by a dark line indicating where second section 214 should be placed to complete pyramid 176.
- second section 214has now been completed by selecting the appropriate shape from shape template 136 and placing the shape in snap zone 216.
- Pyramid chart 174 in FIG. 6,therefore, illustrates another use for snap zones so that graphics may be quickly and cleanly created in accordance with the present invention.
- FIG. 5also illustrates the use of snap zones in accordance with the present invention to quickly and clearly generate graphics.
- Concentric circles 194 in target chart 192represent the snap zones for chart 192. Shapes selected from shape palette 136 automatically snap to concentric circles 194 thereby creating a neat clean target chart.
- FIGS. 1 through 6illustrate that snap zones can have many sizes, shapes, and positionings, and that the type of chart dictates the configuration of the snap zones.
- Cycle selectis a feature that allows the user to select multiple shapes from a shape palette and to switch easily between the shapes when placing the shapes on a chart.
- An example of cycle selectwill be described in referring to comparison chart 76 of FIG. 3.
- the userhas many shape choices available on shape palette 136.
- Shapesare placed on chart 76 without cycle select by selecting the first shape in shape palette 136 and placing the shape on grid 146. To place the second shape on grid 146 the user must return to shape palette 136 and select the second shape, and so on for the third shape.
- cycle selectthe user can select multiple shapes in shape palette 136 by depressing the "control" (CTRL) key while selecting a shape or range of shapes by holding down the "shift” key.
- CTRLcontrol
- the first mouse click in chart 716will draw one of the selected shapes in the same way shapes are usually drawn. What is different is that when the cursor is over that shape, e.g., hexagon 226 on grid 146, it will change to cycle select indicator 224. Clicking down within shape 226 again will replace that shape by the next selected shape, octagon 220, so that the user can repeatedly click down in the shape until the desired shape appears.
- Cycle selectprovides the advantage of eliminating the need to go back to shape palette 136 every time a different shape is desired.
- insert/delete buttons 88allow for deleting or adding rows, columns, or snap zones to a chart.
- the usermust first select one or more snap zones or place holders in a chart. Alternatively, a shape previously placed on a chart may be selected. Selecting a shape automatically selects the snap zone underneath the selected shape.
- the insert button (+)is selected, the user is presented with a dialogue box asking whether to insert rows, columns, or snap zones.
- snap zonesare to be inserted the user has the choice of moving existing shapes in the chart down or to the left. Deleting shapes or zones by selecting the delete button (-) works in a similar way. Insert/delete button 88, therefore, works similarly to the insert/delete row and column commands available with commercially available spreadsheet programs.
- shape 226in order to insert a row before hexagonal shape 226, shape 226 would first be selected with mouse 18 as shown. Then by selecting one of insert/delete buttons 88, grid 146 is appropriately modified so that a row, column, or shape is inserted into or deleted from grid 146 at hexagonal shape 226.
- FIG. 4also illustrates how insert/delete buttons 86 can be used to insert additional pyramid sections 178 into pyramid 176.
- section 228By selecting segment 228 and pressing the insert button (+), section 228 would be moved downward opening a new snap zone for placement of another shape. Deleting a pyramid section from pyramid 176 works in a reverse manner by selecting the delete (-) button.
- the present inventionprovides layered three-dimensional shapes so that the order shapes are painted onto a screen is adjusted automatically to the direction of the perspective of their three-dimensional effects. This prevents the sides of one shape from being drawn on top of the face of another shape.
- FIGS. 4 and 6illustrate how layered three-dimensional shapes are generated in accordance with the present system.
- FIG. 6illustrates incomplete pyramid 176 on chart 174 having snap zone 216 as yet not filled.
- top 232 of pyramid segment 234is fully shown because second section 214 has not been filled.
- FIG. 4when segment 236 is placed in snap zone 216, the majority of top 232 of segment 234 is shown appropriately covered by segment 236.
- top 238 of segment 236does not cover top segment 240, but instead is shown appropriately underneath top segment 240. Snap zone 216 is, therefore, completed without disturbing the proper three-dimensional shading for pyramid chart 174.
- Example pseudo-code for layered three-dimensional shapesmay be found below in Table III.
- FIG. 7shows Venn color chart 242.
- Venn color chart 242includes venn diagram 244 having overlapping shapes 246, 248 and 250.
- Shape 246overlaps with shape 248 in region 252.
- Shape 248overlaps with shape 250 in region 254.
- Shape 250overlaps with shape 246 in region 256.
- Regions 252, 254 and 256overlap at region 258.
- the present inventionautomatically determines the overlapping regions and provides color to the overlapping region that represents the average color of the intersecting shapes in the case where they have different colors.
- the color valueis determined by calculating the average value of the color components in the HSB color model.
- the userhas a choice of making the intersection lighter or darker. Hue and saturation of the intersection of shapes having the same color will be the same as those of the intersecting shapes.
- gray color schemessuch as that depicted in FIG. 7, the color scheme is converted to an appropriate shading pattern by standard techniques.
- Venn color mixprovides the present invention with the capability to display the actual color that would result from mixing the colors of the shapes.
- shading and patterning techniquesmay be employed so that the overlapping sections of the shapes in Venn diagram 244 are clearly shown.
- Venn color chart 242has some additional features in top tool bar 78 not previously described. Intersection shading button 259 can be selected to change (lighter or darker) the region of intersection between any two shapes. Flip button 191a in the venn color chart of FIG. 7 does not flip the chart, but rather rotates the chart clockwise a predetermined amount each time button 191a is selected.
- Example pseudo-code for Venn color mixmay be found in Table IV below.
- FIG. 8illustrates organizational chart 260 that may be generated by selecting organizational chart template 34 from template gallery 30 in FIG. 2.
- Organizational chart 260includes chart 262 having shapes 264, 266, 268, and 270. Draw connected allows the user to draw shapes that are automatically connected by lines. It allows creating organizational charts and other charts with a minimal number of mouse clicks.
- draw connected button 269 in top tool bar 78selects a shape in shape palette 136 and then clicks in the chart once to create the initial shape as the "anchor shape," for example, shape 264 in chart 262. All following mouse clicks in the chart will create shapes that are automatically connected to the anchor shape. For example, with shape 264 as the anchor shape, clicking in chart 260 automatically creates shapes 266, 268, and 290 coupled to shape 264 by line 271.
- the present systemwill also display an auxiliary line indicating the line routing that will be used to connect to a new shape to the anchor shape.
- the auxiliary linestarts from the anchor shape and ends at the current mouse point where the new shape will be created when the mouse is clicked.
- the auxiliary lineis automatically updated whenever the mouse is moved. For example, prior to placing shape 270 coupled to anchor shape 264, auxiliary line 271a will be shown on chart 262 indicating the proposed routing of the line connecting shapes 262 and 270.
- a new shapecan be selected as the anchor shape by clicking down on it. Clicking in the current anchor shape will finish the drawing of connected shapes allowing the user to either start again from the beginning or start connected drawing by clicking in an existing shape initiating a new anchor shape.
- draw shapes button 267 in top tool bar 78the user selects draw shapes button 267 in top tool bar 78.
- Example pseudo-code for draw connectedmay be found in Table V below.
- FIG. 9illustrates flow chart 272 that may be initiated by selecting flow chart template 42 in template gallery 30 of FIG. 2.
- Flow chart 272includes steps 274, having first step 276, second step 278, third step 280, and fourth step 282. Steps 274 are coupled by flow path 284.
- Line routing in accordance with the present inventionis done intelligently so that the lines always enter the next connected shape at a logical side.
- the line connecting the shapesis intelligently redrawn by the system such that entrance into the next shape remains logical.
- Line routing with the present systemalso automatically modifies the number of segments required to connect two shapes. With intelligent line routing, for example, if shape 282 is moved to the alternate position represented by shape 282a, line 286 between shape 280 and 282 would be redrawn automatically as line 286a as shown in dotted line format in FIG. 9.
- the present systemprovides intelligent and automatic line routing so that lines in the charts created in accordance with the present invention are routed intelligently and automatically redrawn when a shape to which they connect is moved.
- shape 268has line attach button 288 displayed thereon.
- the present systemsenses that the user may wish to draw a line from the existing shape when the mouse pointer is moved over the existing shape. For example, when the pointer goes over existing shape 268, the system automatically shifts to line drawing mode and line attach button 288 appears on shape 268. By clicking down over line attach button 268, a line can be drawn from shape 268 to any of the other shapes in chart 260 without selecting the line drawing feature 86. Alternatively, if the mouse pointer is moved out of shape 268 then line attach button 288 disappears from shape 268.
- This featureallows for entering line drawing mode without having to select line draw buttons 86 with the mouse pointer.
- flow chart 272illustrates the anchor and ship line indicator in accordance with the present invention.
- Anchor and ship iconsappear in the chart in line draw mode to indicate from where the line starts (anchor) to where it ends (ship).
- an auxiliary lineis drawn from the anchor shape to the current mouse point to indicate the line routing that will be used.
- the systemdisplays a ship icon in that shape. This indicates that the shape with the ship icon will be connected to the shape with the anchor icon when the left mouse button is clicked down at that destination shape.
- anchor icon 290is shown in shape 280 of chart 272.
- auxiliary line 292is drawn by the system.
- ship icon 294is displayed by the system.
- auxiliary line 292becomes a permanent line.
- Example pseudo-code for anchor and ship line indicatorsmay be found in Table VI below.
- Shapes in a graphics chart generated in accordance with the present inventioncan be given a special kind of three-dimensional look by choosing the plaque attribute feature.
- FIG. 8illustrates organizational chart 262 with shapes 264, 266, 268 and 270, all having the plaque attribute applied to them.
- shape 268has beveled surfaces 296 around its periphery that give shape 268 the appearance of a plaque.
- plaque attributecan be understood in the following way.
- the shapeis lifted out of the drawing plane in the direction of the viewer.
- a pointis selected above the center of the shape, i.e., towards the viewer.
- a lineis drawn from that point to each of the points of the shape outline and that line is cut-off at the drawing plane.
- Thiscreates a three-dimensional pyramid shape.
- the upper part of this pyramidis then cut-off, leaving only the part between the drawing plane and the plane into which the shape has been lifted.
- the present systemcreates lines parallel to the individual border segments of the two-dimensional shape at a fixed distance on the outside of the shape. These lines are cut-off where they intersect.
- Line segmentsare then drawn from the corners of the original shapes to those intersections. This creates the illusion that the shape has sides rather than just borders. Each side is chosen to be either lighter or darker than the shape depending on the direction it is facing. This provides the illusion of having a light source on one side.
- FIG. 10illustrates a three-dimensional dialogue box 298. Dialog box 298 is accessible by selecting three-dimensional shadow button 94 in top tool bar 78.
- the plaque attribute for a selected shapeis established by selecting plaque check box 300, and the depth of the beveled surfaces for the shape, e.g. surfaces 294 of shape 268 in FIG. 8, is controlled by moving depth control slider 302.
- Example pseudo-code for generating the plaque attributemay be found in Table VII below.
- For each edge segmentfind the line parallel to it at a distance D towards the outside of the shape. Assign a direction in which to loop through those segments.
- each faceis facing, i.e. the direction of a line perpendicular to the inside segment from the inside segment toward the outside segment. If it is facing northeast through southeast to southwest, then paint the side darker than the face of the shape, if it is facing northeast through northwest to southwest than paint it with a lighter color.
- the user of the present systemcan move branches within the structure as a unit by clicking on the top shape of a branch and dragging the shape with the mouse before releasing the top shape.
- shape 264 in organization chart 262would be the top shape of organizational chart 262.
- clicking on shape 264all of the shapes within organizational chart 262 can be moved simultaneously by moving shape 264. All the other shapes within chart 262 will move with shape 264.
- Example pseudo-code for tree movemay be found in Table VIII below.
- FIG. 11illustrates timeline chart 304 that may be generated by selecting timeline template 44 from template gallery 30 in FIG. 2.
- Timeline chart 304includes grid 306 having vertical and horizontal lines. The boxes defined by grid 306 are snap zones. Text place holders 308 are provided in the first left-hand column of grid 306 and text and date place holders 310 are provided along the top row of grid 306.
- Timeline chart 304 in FIG. 11illustrates many of the inventive concepts previously discussed. Slidable grids are incorporated in grid 306 so that the spacing and shape of grid 306 can be easily modified by manipulating the tabs in tab ribbons 139 and 148. Chart 304 also uses snap zones for placing shapes such as arrows 312, diamond 314, and bars 316 on grid 306. Top tool bar 78 in FIG. 11 includes some additional features not previously described. Date format buttons 315 is selected to change to the date format of the dates shown in date place holders 310. Show/hide dividers button 317 may be selected for showing or hiding grid 306 in chart 304. By using the present system, clear and professional looking timeline charts can be generated quickly and efficiently.
- FIG. 12illustrates checklist chart 318.
- Checklist chart 318includes checklist 320 that may be generated by selecting checklist template 36 from template gallery 30 in FIG. 2.
- Checklist chart 318includes grid 322 that has text place holders or snap zones 324 and shape place holders or snap zones 326.
- Checklist chart 318uses slidable grids in order to size grid 322 to the desired configuration.
- the configuration of grid 322can be modified using slideable grids as previously described.
- the snap zones in grid 322provide an example of snap zones where shapes and text will snap to the center of a snap zone within grid 322. These snap zones are preset by the system as it is anticipated that centering on a checklist grid is preferred. It is noted that shape snap zones can be turned off by toggling snap on and off button 128 and the orientation of the text with a snap zone can be modified with text orientation indicator select button 108. Snap zones in chart 318 allow the user of the present system to place shapes, such as check shape 327, as desired within shape snap zones 326 and text within text snap zones 324 with appropriate alignment as shown in FIG. 12.
- FIG. 13depicts direction chart 328 that may be generated by selecting direction template 62 from template gallery 30 in FIG. 2.
- Direction chart 328uses shape snap zones or place holders 330 and text snap zones or place holders 332 so that chart 328 can be quickly and cleanly generated.
- the shape and text place holderscan be modified using the slidable grid concept previously discussed above.
- arrow shapes 334have been placed in snap zones 330 and text 336 has been placed in text place holders 332 to create chart 328.
- FIG. 14illustrates netmap chart 338 that may be generated by selecting netmap template 66 on template gallery 30 in FIG. 2.
- Netmap chart 338includes netmap 339 having placeholder or snap zone 340 including shape snap zones 342 and connection line snap zones 344.
- Shape snap zones 342can be filled by selecting shapes from shape palette 136 and placing the shapes in the shape snap zones 342.
- the shapes within netmap 339can be connected using line attach buttons 86 to draw lines for connecting the shapes into the desired netmap configuration.
- FIG. 15illustrates circle/spoke chart 346 that may be generated by selecting circle/spoke template 70 from template gallery 30 in FIG. 2.
- Circle/spoke chart 346includes shape snap zones 348 and line snap zones 350 for generating a circle/spoke chart. By appropriately placing shapes within shape snap zones 348 and drawing lines in line snap zones 350, a circle/spoke chart such as chart 346 can be generated efficiently and accurately with the present system.
Landscapes
- Engineering & Computer Science (AREA)
- Theoretical Computer Science (AREA)
- Physics & Mathematics (AREA)
- General Engineering & Computer Science (AREA)
- General Physics & Mathematics (AREA)
- Health & Medical Sciences (AREA)
- Artificial Intelligence (AREA)
- Audiology, Speech & Language Pathology (AREA)
- Computational Linguistics (AREA)
- General Health & Medical Sciences (AREA)
- Human Computer Interaction (AREA)
- Processing Or Creating Images (AREA)
Abstract
Description
TABLE I ______________________________________ Slidable Grids ______________________________________ If user clicks down on tab in tab ribbon BEGIN If Slider Lock button is pressed Select all tabs Else Select single tab that was clicked While mouse is dragged (pressed down and moved) Give feedback how grid would change by displaying auxiliary lines or curves in chart When mouse is released BEGIN If Slider Lock button is pressed Update all grid lines Else Update single grid line spacing from previous tab to current tab Loop through all lines and shapes to update their current positions Repaint entire chart to display new grid and new shape and line positions END END ______________________________________
TABLE II ______________________________________ Cycle Select ______________________________________ Part I: Shape Palette When mouse clicked in shape palette over shape icon If neither Control key nor Shift key pressed BEGIN Select shape in palette, deselect all others END Else if Control key pressed BEGIN If shape already selected then deselect, unless it is the only selected shape Else select shape in addition to already selected shapes END Else if Shift key pressed BEGIN Select range of shapes END Display shape icons that are selected as pressed down, all others up Designate shape that was clicked on as the next to be drawn Switch to shape draw mode Part II: Shape Draw Mode While moving mouse BEGIN If not over shape Display shape draw cursor Else if over shape BEGIN If shape under cursor is one that is selected in the shape palette display cycle select cursor Else Display other cursor, depending on chart type and draw mode END END When mouse is clicked down BEGIN If not over shape Draw the next shape from the palette that is designated to be drawn Else if over shape BEGIN If shape selected in the shape palette BEGIN Replace shape with next shape from palette that is selected, or by first shape when shape was last selected shape Designate the new shape as the one that will be drawn next END ELSE Other action END END ______________________________________
TABLE III ______________________________________ Layered Three-Dimensional Shapes Paint List: Linked list of shapes to be painted, from first to last. When chart is painted the program iterates through the paint list. ______________________________________ Function: Insert_By_Perspective Iterate through Paint List: BEGIN Compare shape that is to be inserted with current shape to see which one has to be painted first, in order for the sides or shadows of one shape not to paint over the face of the other shape by checking the current perspective and the relative position of the shapes. If shape in paint list needs to be painted first Continue the iteration Else if inserted shape has to be painted first Insert before current shape in paint list and end iteration END If not already inserted Insert at the end of the paint list To add a new shape: Insert.sub.-- By.sub.-- Perspective into the Paint List To change the perspective of an individual shape: Remove from Paint List and Insert.sub.-- By.sub.-- Perspective To change the perspective of all shapes: Remove all shapes from the Paint List and do Insert.sub.-- By.sub.-- Perspective for each one. ______________________________________
TABLE V ______________________________________ Draw Connected ______________________________________ Beginning state: anchor shape designated variable Change_Anchor set to FALSE Line drawing not activated When mouse clicked in chart outside any existing shape create new shape on mouse and designate new shape as anchor shape LABEL: Display auxiliary line from anchor shape to current mouse point single line or polygon line, depending on current line routing, and update auxiliary line on any mouse move. If mouse clicked in anchor shape go to Label.sub.-- End If mouse clicked in other existing shape then BEGIN connect anchor shape to that shape by a line as indicated by auxiliary line If Change.sub.-- Anchor is TRUE designate clicked shape as new anchor shape Set Change.sub.-- Anchor to FALSE and go to LABEL END If mouse clicked outside any shape then set Change.sub.-- Anchor to TRUE, create shape on mouse up at current mouse position, and connect anchor shape and new shape with line, keep anchor shape, and go to Continue at LABEL Label.sub.-- End: Restore beginning state ______________________________________
TABLE VI ______________________________________ Anchor and Ship ______________________________________ If mouse clicked down in center of existing shape in line draw mode BEGIN Calculate center of shape and draw bitmap of anchor in center. Draw auxiliary line from center of shape to current mouse position, single line or polygon line depending on current line routing While mouse is moved BEGIN If mouse enters another shape then BEGIN Erase auxiliary 1ine Calculate center of that shape and draw bitmap of ship in the center of that shape Display exact outline of line that will be drawn from the initial shape to the current shape if mouse is clicked down Else Update auxiliary line END When mouse is clicked down in shape BEGIN If in anchor shape then end line drawing Otherwise remove anchor and ship and draw line as indicated by auxiliary outline END END ______________________________________
TABLE VIII ______________________________________ Tree Move ______________________________________ If user clicks on shape and starts dragging or holds down the mouse BEGIN If shape was previously selected keep current selection else if shape was not selected BEGIN deselect everything select clicked shape and the entire branch, i.e. all shapes that are connected by lines underneath it END When user releases mouse Move all currently selected shapes END ______________________________________
Claims (20)
Priority Applications (1)
| Application Number | Priority Date | Filing Date | Title |
|---|---|---|---|
| US08/770,978US5982383A (en) | 1994-09-27 | 1996-12-20 | System and method for generating graphics charts |
Applications Claiming Priority (2)
| Application Number | Priority Date | Filing Date | Title |
|---|---|---|---|
| US08/314,041US5588108A (en) | 1994-09-27 | 1994-09-27 | System and method for generating graphics charts |
| US08/770,978US5982383A (en) | 1994-09-27 | 1996-12-20 | System and method for generating graphics charts |
Related Parent Applications (1)
| Application Number | Title | Priority Date | Filing Date |
|---|---|---|---|
| US08/314,041ContinuationUS5588108A (en) | 1994-09-27 | 1994-09-27 | System and method for generating graphics charts |
Publications (1)
| Publication Number | Publication Date |
|---|---|
| US5982383Atrue US5982383A (en) | 1999-11-09 |
Family
ID=23218300
Family Applications (3)
| Application Number | Title | Priority Date | Filing Date |
|---|---|---|---|
| US08/314,041Expired - LifetimeUS5588108A (en) | 1994-09-27 | 1994-09-27 | System and method for generating graphics charts |
| US08/771,017Expired - LifetimeUS5844558A (en) | 1994-09-27 | 1996-12-20 | System and method for generating graphics charts |
| US08/770,978Expired - LifetimeUS5982383A (en) | 1994-09-27 | 1996-12-20 | System and method for generating graphics charts |
Family Applications Before (2)
| Application Number | Title | Priority Date | Filing Date |
|---|---|---|---|
| US08/314,041Expired - LifetimeUS5588108A (en) | 1994-09-27 | 1994-09-27 | System and method for generating graphics charts |
| US08/771,017Expired - LifetimeUS5844558A (en) | 1994-09-27 | 1996-12-20 | System and method for generating graphics charts |
Country Status (3)
| Country | Link |
|---|---|
| US (3) | US5588108A (en) |
| AU (1) | AU3734495A (en) |
| WO (1) | WO1996010231A1 (en) |
Cited By (33)
| Publication number | Priority date | Publication date | Assignee | Title |
|---|---|---|---|---|
| US6064401A (en)* | 1998-05-28 | 2000-05-16 | Ncr Corporation | User interface controls for adjusting the display of multi-dimensional graphical plots |
| US6390508B2 (en)* | 1997-12-31 | 2002-05-21 | Matthew Levine | Method of producing a customized chart |
| US6502011B2 (en)* | 1999-07-30 | 2002-12-31 | Gerhard Haag | Method and apparatus for presenting and managing information in an automated parking structure |
| US20030225879A1 (en)* | 2001-12-28 | 2003-12-04 | Jan Chipchase | Communication log for an electronic device |
| US20030227458A1 (en)* | 2002-06-05 | 2003-12-11 | Jeremy Page | Method of displaying data |
| US6690397B1 (en) | 2000-06-05 | 2004-02-10 | Advanced Neuromodulation Systems, Inc. | System for regional data association and presentation and method for the same |
| US20040049730A1 (en)* | 2002-09-05 | 2004-03-11 | Beacon Information Technology Inc. | Data management system, method, and recording medium |
| US6791572B1 (en)* | 1999-06-18 | 2004-09-14 | Phoenix Technologies Ltd. | Generating media output during BIOS boot-up |
| US6795098B1 (en)* | 2000-02-02 | 2004-09-21 | Edutainment, Inc. | Method and apparatus for bringing together separately created information blocks into a single information block for creating multiple hierarchies |
| US20040196310A1 (en)* | 2000-11-01 | 2004-10-07 | Microsoft Corporation | System and method for creating customizable nodes in a network diagram |
| US20050081146A1 (en)* | 2003-10-14 | 2005-04-14 | Fujitsu Limited | Relation chart-creating program, relation chart-creating method, and relation chart-creating apparatus |
| US6900807B1 (en)* | 2000-03-08 | 2005-05-31 | Accenture Llp | System for generating charts in a knowledge management tool |
| US20060167732A1 (en)* | 2005-01-27 | 2006-07-27 | International Business Machines Corporation | Method and system for planning and managing multiple projects on demand with critical chain and replenishment |
| US20060174568A1 (en)* | 2005-01-04 | 2006-08-10 | International Business Machines Corporation | Object editing system, object editing method and object editing program product |
| WO2006039451A3 (en)* | 2004-09-29 | 2007-02-22 | Ipac Acquisition Subsidiary I | Method and system for providing an adaptive magnifying cursor |
| US20070103468A1 (en)* | 2005-11-08 | 2007-05-10 | Microsoft Corporation | Smart shape insert |
| US20070115287A1 (en)* | 2005-11-23 | 2007-05-24 | Autodesk, Inc. | Stroked fill |
| US20070115283A1 (en)* | 2005-11-23 | 2007-05-24 | Autodesk, Inc. | Casting shadows |
| US7233341B1 (en)* | 1998-05-14 | 2007-06-19 | Autodesk, Inc. | Spacing objects within a constraint |
| US20080018650A1 (en)* | 2006-07-19 | 2008-01-24 | Autodesk, Inc. | Vector marker strokes |
| US20080049011A1 (en)* | 2003-07-28 | 2008-02-28 | Visualize It Ltd. | Surface Mapping Arrangement and Method |
| US20080055313A1 (en)* | 2006-08-31 | 2008-03-06 | Sap Aktiengesellschaft | Methods and apparatus for producing a chart |
| US20080266309A1 (en)* | 2007-04-27 | 2008-10-30 | Autodesk, Inc. | Edge effect |
| US20090237405A1 (en)* | 2008-03-03 | 2009-09-24 | Justsystems Corporation | Data processing apparatus and data processing method |
| US7809707B2 (en) | 2007-07-23 | 2010-10-05 | Sap Ag | System and method for identifying element usage in a deep element structure |
| US20110004839A1 (en)* | 2009-07-02 | 2011-01-06 | Derek Cha | User-customized computer display method |
| US8847983B1 (en) | 2009-02-03 | 2014-09-30 | Adobe Systems Incorporated | Merge tool for generating computer graphics |
| US20150029215A1 (en)* | 2013-07-29 | 2015-01-29 | Oracle International Corporation | Interactive intersection areas |
| US20160139760A1 (en)* | 2014-11-19 | 2016-05-19 | Beijing Lenovo Software Ltd. | Information processing method and electronic device |
| US9477650B2 (en) | 2011-08-30 | 2016-10-25 | Microsoft Technology Licensing, Llc | Underlying grid structure and animation of tables |
| US9582573B2 (en) | 2013-07-25 | 2017-02-28 | Sap Se | Interactive composite plot for visualizing multi-variable data |
| US10339681B2 (en) | 2013-11-22 | 2019-07-02 | Raytheon Company | Interactive multimedia process flow chart builder |
| US20220100360A1 (en)* | 2020-03-23 | 2022-03-31 | Shenzhen Futu Network Technology Co., Ltd. | Method and device for reference-diagram editing for chart and non-transitory computer-readable storage medium |
Families Citing this family (94)
| Publication number | Priority date | Publication date | Assignee | Title |
|---|---|---|---|---|
| US5649133A (en)* | 1995-06-13 | 1997-07-15 | Apple Computer, Inc. | Method for collision avoidance for user interface for object with multiple handles |
| JP3388655B2 (en)* | 1995-07-28 | 2003-03-24 | シャープ株式会社 | Data processing device |
| US5943062A (en)* | 1996-02-13 | 1999-08-24 | Micrografx, Inc. | System and method for automatically routing a line in a graphics chart |
| JP4094706B2 (en)* | 1996-08-15 | 2008-06-04 | ゼロックス コーポレイション | Computer controlled display system |
| US5798769A (en)* | 1996-08-15 | 1998-08-25 | Xerox Corporation | Method and apparatus for maintaining links between graphic objects in a free-form graphics display system |
| US6215502B1 (en)* | 1996-10-28 | 2001-04-10 | Cks Partners | Method and apparatus for automatically reconfiguring graphical objects relative to new graphical layouts |
| US6304272B1 (en)* | 1996-12-10 | 2001-10-16 | Micrografx, Inc. | Graphics system and method having objects conformed to a template |
| DE19807885A1 (en)* | 1997-02-27 | 1998-09-03 | Omega Engineering | Data recording method for tracing meteorological or other varying parameters |
| US6072484A (en)* | 1997-08-13 | 2000-06-06 | International Business Machines Corporation | Graphic user interface for tab setting with a re-sizeable scale |
| US6121965A (en)* | 1997-10-17 | 2000-09-19 | Lucent Technologies Inc. | User interface for graphical application tool |
| US6529217B1 (en)* | 1999-06-15 | 2003-03-04 | Microsoft Corporation | System and method for graphically displaying a set of data fields |
| US6486883B1 (en)* | 1999-06-18 | 2002-11-26 | Phoenix Technologies, Ltd. | Apparatus and method for updating images stored in non-volatile memory |
| WO2001059576A1 (en)* | 2000-02-12 | 2001-08-16 | Adobe Systems Incorporated | Text grid creation tools |
| US7305617B2 (en)* | 2000-02-12 | 2007-12-04 | Adobe Systems Incorporated | Method for aligning text to baseline grids and to CJK character grids |
| US7941756B1 (en)* | 2000-05-22 | 2011-05-10 | Realnetworks, Inc. | System and method for creating and displaying classes of graphical display objects |
| US6680675B1 (en) | 2000-06-21 | 2004-01-20 | Fujitsu Limited | Interactive to-do list item notification system including GPS interface |
| AU2002211419A1 (en)* | 2000-10-05 | 2002-04-15 | Ronald J. Kloss | Timeline publishing system |
| GB2371195B (en)* | 2000-11-20 | 2005-02-02 | Hewlett Packard Co | System and method for printing customized graphic compositions |
| US6826729B1 (en) | 2001-06-29 | 2004-11-30 | Microsoft Corporation | Gallery user interface controls |
| US7185313B1 (en)* | 2002-05-21 | 2007-02-27 | Microsoft Corporation | Method and system for designing and implementing shapes in a software module |
| US7131113B2 (en)* | 2002-12-12 | 2006-10-31 | International Business Machines Corporation | System and method on generating multi-dimensional trace files and visualizing them using multiple Gantt charts |
| US9715678B2 (en) | 2003-06-26 | 2017-07-25 | Microsoft Technology Licensing, Llc | Side-by-side shared calendars |
| US7707255B2 (en) | 2003-07-01 | 2010-04-27 | Microsoft Corporation | Automatic grouping of electronic mail |
| US8799808B2 (en) | 2003-07-01 | 2014-08-05 | Microsoft Corporation | Adaptive multi-line view user interface |
| US7716593B2 (en) | 2003-07-01 | 2010-05-11 | Microsoft Corporation | Conversation grouping of electronic mail records |
| US10437964B2 (en) | 2003-10-24 | 2019-10-08 | Microsoft Technology Licensing, Llc | Programming interface for licensing |
| US20050147950A1 (en)* | 2003-12-29 | 2005-07-07 | Ethicon Endo-Surgery, Inc. | Graphical representation, storage and dissemination of displayed thinking |
| US7472347B2 (en)* | 2004-06-30 | 2008-12-30 | Microsoft Corporation | Aligned behavior in templated lists |
| US9015621B2 (en) | 2004-08-16 | 2015-04-21 | Microsoft Technology Licensing, Llc | Command user interface for displaying multiple sections of software functionality controls |
| US8255828B2 (en) | 2004-08-16 | 2012-08-28 | Microsoft Corporation | Command user interface for displaying selectable software functionality controls |
| US8146016B2 (en) | 2004-08-16 | 2012-03-27 | Microsoft Corporation | User interface for displaying a gallery of formatting options applicable to a selected object |
| US7895531B2 (en) | 2004-08-16 | 2011-02-22 | Microsoft Corporation | Floating command object |
| DE102004039794A1 (en)* | 2004-08-16 | 2006-02-23 | Endress & Hauser Wetzer Gmbh + Co. Kg | Device for displaying and / or displaying different process and / or controlled variables |
| US7703036B2 (en) | 2004-08-16 | 2010-04-20 | Microsoft Corporation | User interface for displaying selectable software functionality controls that are relevant to a selected object |
| US8117542B2 (en) | 2004-08-16 | 2012-02-14 | Microsoft Corporation | User interface for displaying selectable software functionality controls that are contextually relevant to a selected object |
| US7747966B2 (en) | 2004-09-30 | 2010-06-29 | Microsoft Corporation | User interface for providing task management and calendar information |
| US7564458B2 (en)* | 2004-12-15 | 2009-07-21 | Microsoft Corporation | System and method for interactively linking data to shapes in a diagram |
| USD547322S1 (en)* | 2005-06-07 | 2007-07-24 | Ids Scheer Aktiengesellschaft | Icon for a display screen |
| US7886290B2 (en) | 2005-06-16 | 2011-02-08 | Microsoft Corporation | Cross version and cross product user interface |
| US8239882B2 (en) | 2005-08-30 | 2012-08-07 | Microsoft Corporation | Markup based extensibility for user interfaces |
| US8689137B2 (en)* | 2005-09-07 | 2014-04-01 | Microsoft Corporation | Command user interface for displaying selectable functionality controls in a database application |
| US9542667B2 (en) | 2005-09-09 | 2017-01-10 | Microsoft Technology Licensing, Llc | Navigating messages within a thread |
| US7739259B2 (en) | 2005-09-12 | 2010-06-15 | Microsoft Corporation | Integrated search and find user interface |
| US8627222B2 (en) | 2005-09-12 | 2014-01-07 | Microsoft Corporation | Expanded search and find user interface |
| US20070186183A1 (en)* | 2006-02-06 | 2007-08-09 | International Business Machines Corporation | User interface for presenting a palette of items |
| GB0608323D0 (en)* | 2006-04-27 | 2006-06-07 | Soft Image Systems Ltd | Codifying & reusing expertise in personal and organisation transformation |
| US9727989B2 (en) | 2006-06-01 | 2017-08-08 | Microsoft Technology Licensing, Llc | Modifying and formatting a chart using pictorially provided chart elements |
| US8605090B2 (en)* | 2006-06-01 | 2013-12-10 | Microsoft Corporation | Modifying and formatting a chart using pictorially provided chart elements |
| US8497874B2 (en)* | 2006-08-01 | 2013-07-30 | Microsoft Corporation | Pixel snapping for anti-aliased rendering |
| US8144166B2 (en)* | 2006-08-01 | 2012-03-27 | Microsoft Corporation | Dynamic pixel snapping |
| US20080062204A1 (en)* | 2006-09-08 | 2008-03-13 | Microsoft Corporation | Automated pixel snapping for anti-aliased rendering |
| US8508552B2 (en)* | 2006-09-08 | 2013-08-13 | Microsoft Corporation | Pixel snapping with relative guidelines |
| US9411903B2 (en) | 2007-03-05 | 2016-08-09 | Oracle International Corporation | Generalized faceted browser decision support tool |
| AR067297A1 (en)* | 2007-03-28 | 2009-10-07 | Avery Dennison Corp | TAPE TYPE USER INTERFACE FOR AN APPLICATION PROGRAM |
| US8739068B2 (en)* | 2007-06-15 | 2014-05-27 | Microsoft Corporation | Dynamic user interface for in-diagram shape selection |
| US8762880B2 (en) | 2007-06-29 | 2014-06-24 | Microsoft Corporation | Exposing non-authoring features through document status information in an out-space user interface |
| US8201103B2 (en) | 2007-06-29 | 2012-06-12 | Microsoft Corporation | Accessing an out-space user interface for a document editor program |
| US8484578B2 (en) | 2007-06-29 | 2013-07-09 | Microsoft Corporation | Communication between a document editor in-space user interface and a document editor out-space user interface |
| US8539367B2 (en)* | 2007-09-27 | 2013-09-17 | National Instruments Corporation | Automatic re-positioning of graphical program nodes during node placement or node movement |
| GB0719129D0 (en)* | 2007-10-01 | 2007-11-07 | Torridon Solutions Ltd | Improvements relating to graphical user interfaces |
| US8117557B2 (en)* | 2008-01-03 | 2012-02-14 | People Driven Performance, Inc. | Multi-mode viewer control for viewing a series of statistical values |
| US9324168B2 (en)* | 2008-01-31 | 2016-04-26 | Microsoft Technology Licensing, Llc | Constraint-based correction of shape positions in a diagram |
| US8762871B2 (en)* | 2008-02-03 | 2014-06-24 | Microsoft Corporation | Dynamic preview of diagram elements to be inserted into a diagram |
| US9588781B2 (en) | 2008-03-31 | 2017-03-07 | Microsoft Technology Licensing, Llc | Associating command surfaces with multiple active components |
| US20090278848A1 (en)* | 2008-05-12 | 2009-11-12 | Microsoft Corporation | Drawing familiar graphs while system determines suitable form |
| US9665850B2 (en) | 2008-06-20 | 2017-05-30 | Microsoft Technology Licensing, Llc | Synchronized conversation-centric message list and message reading pane |
| US20090319948A1 (en)* | 2008-06-20 | 2009-12-24 | Smartdraw.Com | Automated editing of graphics charts |
| US8402096B2 (en) | 2008-06-24 | 2013-03-19 | Microsoft Corporation | Automatic conversation techniques |
| US8826174B2 (en) | 2008-06-27 | 2014-09-02 | Microsoft Corporation | Using visual landmarks to organize diagrams |
| US20100058250A1 (en)* | 2008-08-28 | 2010-03-04 | Smartdraw.Com | Editing numeric charts |
| USD631060S1 (en)* | 2008-12-01 | 2011-01-18 | Deutsche Telekom Ag | Transitional user interface for a portion of a display screen |
| US8799353B2 (en) | 2009-03-30 | 2014-08-05 | Josef Larsson | Scope-based extensibility for control surfaces |
| US9046983B2 (en) | 2009-05-12 | 2015-06-02 | Microsoft Technology Licensing, Llc | Hierarchically-organized control galleries |
| USD630643S1 (en)* | 2009-11-03 | 2011-01-11 | Promethean Limited | Display screen with a voting wheel icon for a user interface |
| USD630644S1 (en)* | 2009-11-03 | 2011-01-11 | Promethean Limited | Display screen with a voting wheel icon for a user interface |
| US9665257B2 (en)* | 2009-12-28 | 2017-05-30 | Ancestry.Com Operations Inc. | Interactive modification of spacing constraints of genealogical charts with live feedback |
| CN102169434B (en)* | 2010-02-25 | 2016-08-24 | 微软技术许可有限责任公司 | The correction based on constraint of the shaped position in chart |
| US8302014B2 (en) | 2010-06-11 | 2012-10-30 | Microsoft Corporation | Merging modifications to user interface components while preserving user customizations |
| US9019275B2 (en) | 2010-10-01 | 2015-04-28 | Lucid Software, Inc. | Manipulating graphical objects |
| EP2678774A4 (en)* | 2011-02-24 | 2015-04-08 | Lexisnexis Division Of Reed Elsevier Inc | Methods for electronic document searching and graphically representing electronic document searches |
| US9792017B1 (en) | 2011-07-12 | 2017-10-17 | Domo, Inc. | Automatic creation of drill paths |
| US10001898B1 (en) | 2011-07-12 | 2018-06-19 | Domo, Inc. | Automated provisioning of relational information for a summary data visualization |
| US9202297B1 (en) | 2011-07-12 | 2015-12-01 | Domo, Inc. | Dynamic expansion of data visualizations |
| GB2499024A (en)* | 2012-02-03 | 2013-08-07 | Microgen Aptitude Ltd | 3D integrated development environment(IDE) display |
| KR102073024B1 (en)* | 2012-11-30 | 2020-02-04 | 삼성전자주식회사 | Apparatus and method for editing memo in a user terminal |
| JP5892094B2 (en)* | 2013-03-21 | 2016-03-23 | カシオ計算機株式会社 | Graph display control device, graph display control method, and graph display control program |
| JP6201712B2 (en)* | 2013-12-13 | 2017-09-27 | 富士通株式会社 | Drawing creation program, drawing creation method, and information processing apparatus |
| US9508158B2 (en)* | 2014-03-24 | 2016-11-29 | Apple Inc. | Palette generation using user-selected images |
| US10078411B2 (en) | 2014-04-02 | 2018-09-18 | Microsoft Technology Licensing, Llc | Organization mode support mechanisms |
| USD845993S1 (en)* | 2014-09-22 | 2019-04-16 | Rockwell Collins, Inc. | Avionics display screen with transitional icon set |
| GB2548223A (en)* | 2016-02-08 | 2017-09-13 | Prysm Inc | Browser based snap grid |
| USD886116S1 (en)* | 2016-04-14 | 2020-06-02 | Markup Llc | Display screen portion with graphical user interface |
| US10747927B2 (en) | 2017-08-18 | 2020-08-18 | StarSystems, Inc. | Electronics design automation |
| US11966575B2 (en) | 2020-03-09 | 2024-04-23 | Muchskills Ab | Method for retrieving user input via an interface based on selection of interactive shapes |
Citations (16)
| Publication number | Priority date | Publication date | Assignee | Title |
|---|---|---|---|---|
| US4797836A (en)* | 1986-11-19 | 1989-01-10 | The Grass Valley Group, Inc. | Image orientation and animation using quaternions |
| US4937761A (en)* | 1987-11-04 | 1990-06-26 | Blueprint Technologies Incorporated | Method and apparatus for enhanced speed graphic image processing |
| US5200740A (en)* | 1989-08-01 | 1993-04-06 | Adobe Systems Incorporated | Dropout-free center point fill method for displaying characters |
| US5214755A (en)* | 1989-04-25 | 1993-05-25 | Microsoft Corporation | Document processing method and system |
| US5249137A (en)* | 1990-03-23 | 1993-09-28 | Xerox Corporation | Computer-aided chemical illustration system |
| US5291587A (en)* | 1986-04-14 | 1994-03-01 | National Instruments, Inc. | Graphical system for executing a process and for programming a computer to execute a process, including graphical variable inputs and variable outputs |
| US5317681A (en)* | 1991-12-30 | 1994-05-31 | Xerox Corporation | Sequencing and scheduling moves for converting concave polyhedra to their convex hulls |
| US5333243A (en)* | 1992-05-04 | 1994-07-26 | Hewlett-Packard Company | Method for forming color images, using a hue-plus-gray color model and error diffusion |
| US5337404A (en)* | 1989-04-24 | 1994-08-09 | Digital Equipment International Limited | Process and system for making computer-aided drawings using a contour inclusion tree associated planar map data structure |
| US5361333A (en)* | 1992-06-04 | 1994-11-01 | Altsys Corporation | System and method for generating self-overlapping calligraphic images |
| US5367626A (en)* | 1989-11-08 | 1994-11-22 | Fujitsu Limited | Automatic icon generation system |
| US5396590A (en)* | 1992-09-17 | 1995-03-07 | Apple Computer, Inc. | Non-modal method and apparatus for manipulating graphical objects |
| US5416890A (en)* | 1991-12-11 | 1995-05-16 | Xerox Corporation | Graphical user interface for controlling color gamut clipping |
| US5646647A (en)* | 1994-11-14 | 1997-07-08 | International Business Machines Corporation | Automatic parking of cursor in a graphical environment |
| US5655094A (en)* | 1995-09-29 | 1997-08-05 | International Business Machines Corporation | Pop up scroll bar |
| US5664127A (en)* | 1992-04-08 | 1997-09-02 | Borland International, Inc. | System and methods for improved spreadsheet interface with user-familiar objects |
Family Cites Families (1)
| Publication number | Priority date | Publication date | Assignee | Title |
|---|---|---|---|---|
| US5367631A (en)* | 1992-04-14 | 1994-11-22 | Apple Computer, Inc. | Cursor control device with programmable preset cursor positions |
- 1994
- 1994-09-27USUS08/314,041patent/US5588108A/ennot_activeExpired - Lifetime
- 1995
- 1995-09-26WOPCT/US1995/012603patent/WO1996010231A1/enactiveApplication Filing
- 1995-09-26AUAU37344/95Apatent/AU3734495A/ennot_activeAbandoned
- 1996
- 1996-12-20USUS08/771,017patent/US5844558A/ennot_activeExpired - Lifetime
- 1996-12-20USUS08/770,978patent/US5982383A/ennot_activeExpired - Lifetime
Patent Citations (16)
| Publication number | Priority date | Publication date | Assignee | Title |
|---|---|---|---|---|
| US5291587A (en)* | 1986-04-14 | 1994-03-01 | National Instruments, Inc. | Graphical system for executing a process and for programming a computer to execute a process, including graphical variable inputs and variable outputs |
| US4797836A (en)* | 1986-11-19 | 1989-01-10 | The Grass Valley Group, Inc. | Image orientation and animation using quaternions |
| US4937761A (en)* | 1987-11-04 | 1990-06-26 | Blueprint Technologies Incorporated | Method and apparatus for enhanced speed graphic image processing |
| US5337404A (en)* | 1989-04-24 | 1994-08-09 | Digital Equipment International Limited | Process and system for making computer-aided drawings using a contour inclusion tree associated planar map data structure |
| US5214755A (en)* | 1989-04-25 | 1993-05-25 | Microsoft Corporation | Document processing method and system |
| US5200740A (en)* | 1989-08-01 | 1993-04-06 | Adobe Systems Incorporated | Dropout-free center point fill method for displaying characters |
| US5367626A (en)* | 1989-11-08 | 1994-11-22 | Fujitsu Limited | Automatic icon generation system |
| US5249137A (en)* | 1990-03-23 | 1993-09-28 | Xerox Corporation | Computer-aided chemical illustration system |
| US5416890A (en)* | 1991-12-11 | 1995-05-16 | Xerox Corporation | Graphical user interface for controlling color gamut clipping |
| US5317681A (en)* | 1991-12-30 | 1994-05-31 | Xerox Corporation | Sequencing and scheduling moves for converting concave polyhedra to their convex hulls |
| US5664127A (en)* | 1992-04-08 | 1997-09-02 | Borland International, Inc. | System and methods for improved spreadsheet interface with user-familiar objects |
| US5333243A (en)* | 1992-05-04 | 1994-07-26 | Hewlett-Packard Company | Method for forming color images, using a hue-plus-gray color model and error diffusion |
| US5361333A (en)* | 1992-06-04 | 1994-11-01 | Altsys Corporation | System and method for generating self-overlapping calligraphic images |
| US5396590A (en)* | 1992-09-17 | 1995-03-07 | Apple Computer, Inc. | Non-modal method and apparatus for manipulating graphical objects |
| US5646647A (en)* | 1994-11-14 | 1997-07-08 | International Business Machines Corporation | Automatic parking of cursor in a graphical environment |
| US5655094A (en)* | 1995-09-29 | 1997-08-05 | International Business Machines Corporation | Pop up scroll bar |
Cited By (55)
| Publication number | Priority date | Publication date | Assignee | Title |
|---|---|---|---|---|
| US6390508B2 (en)* | 1997-12-31 | 2002-05-21 | Matthew Levine | Method of producing a customized chart |
| US7233341B1 (en)* | 1998-05-14 | 2007-06-19 | Autodesk, Inc. | Spacing objects within a constraint |
| US6064401A (en)* | 1998-05-28 | 2000-05-16 | Ncr Corporation | User interface controls for adjusting the display of multi-dimensional graphical plots |
| US6791572B1 (en)* | 1999-06-18 | 2004-09-14 | Phoenix Technologies Ltd. | Generating media output during BIOS boot-up |
| US6502011B2 (en)* | 1999-07-30 | 2002-12-31 | Gerhard Haag | Method and apparatus for presenting and managing information in an automated parking structure |
| US6795098B1 (en)* | 2000-02-02 | 2004-09-21 | Edutainment, Inc. | Method and apparatus for bringing together separately created information blocks into a single information block for creating multiple hierarchies |
| US6900807B1 (en)* | 2000-03-08 | 2005-05-31 | Accenture Llp | System for generating charts in a knowledge management tool |
| US7928995B2 (en) | 2000-06-05 | 2011-04-19 | Advanced Neuromodulation Systems, Inc. | System for regional data association and presentation and method for the same |
| US6690397B1 (en) | 2000-06-05 | 2004-02-10 | Advanced Neuromodulation Systems, Inc. | System for regional data association and presentation and method for the same |
| US7362334B2 (en) | 2000-06-05 | 2008-04-22 | Advanced Neuromodulation Systems, Inc. | System for regional data association and presentation and method for the same |
| US20050192972A1 (en)* | 2000-06-05 | 2005-09-01 | Daignault Richard J.Jr. | System for regional data association and presentation and method for the same |
| US20100141676A1 (en)* | 2000-06-05 | 2010-06-10 | Advanced Neuromodulation Systems, Inc. | System for regional data association and presentation and method for the same |
| US7603632B1 (en)* | 2000-11-01 | 2009-10-13 | Microsoft Corporation | System and method for creating customizable nodes in a network diagram |
| US20040196310A1 (en)* | 2000-11-01 | 2004-10-07 | Microsoft Corporation | System and method for creating customizable nodes in a network diagram |
| US7458031B2 (en) | 2000-11-01 | 2008-11-25 | Microsoft Corporation | System and method for creating customizable nodes in a network diagram |
| US7174516B2 (en)* | 2001-12-28 | 2007-02-06 | Nokia Corporation | Communication log for an electronic device |
| US20030225879A1 (en)* | 2001-12-28 | 2003-12-04 | Jan Chipchase | Communication log for an electronic device |
| US6927772B2 (en)* | 2002-06-05 | 2005-08-09 | Jeremy Page | Method of displaying data |
| US20030227458A1 (en)* | 2002-06-05 | 2003-12-11 | Jeremy Page | Method of displaying data |
| US7165214B2 (en)* | 2002-09-05 | 2007-01-16 | Beacon Information Technology Inc. | Data management system, method, and recording medium |
| US20040049730A1 (en)* | 2002-09-05 | 2004-03-11 | Beacon Information Technology Inc. | Data management system, method, and recording medium |
| US20080049011A1 (en)* | 2003-07-28 | 2008-02-28 | Visualize It Ltd. | Surface Mapping Arrangement and Method |
| US20050081146A1 (en)* | 2003-10-14 | 2005-04-14 | Fujitsu Limited | Relation chart-creating program, relation chart-creating method, and relation chart-creating apparatus |
| US20070198942A1 (en)* | 2004-09-29 | 2007-08-23 | Morris Robert P | Method and system for providing an adaptive magnifying cursor |
| WO2006039451A3 (en)* | 2004-09-29 | 2007-02-22 | Ipac Acquisition Subsidiary I | Method and system for providing an adaptive magnifying cursor |
| US20060174568A1 (en)* | 2005-01-04 | 2006-08-10 | International Business Machines Corporation | Object editing system, object editing method and object editing program product |
| US8120604B2 (en)* | 2005-01-04 | 2012-02-21 | International Business Machines Corporation | Object editing system, object editing method and object editing program product |
| US7844480B2 (en)* | 2005-01-27 | 2010-11-30 | International Business Machines Corporation | Method and system for planning and managing multiple projects on demand with critical chain and replenishment |
| US20060167732A1 (en)* | 2005-01-27 | 2006-07-27 | International Business Machines Corporation | Method and system for planning and managing multiple projects on demand with critical chain and replenishment |
| US20070103468A1 (en)* | 2005-11-08 | 2007-05-10 | Microsoft Corporation | Smart shape insert |
| US7423646B2 (en)* | 2005-11-08 | 2008-09-09 | Microsoft Corporation | Smart shape insert |
| US7663638B2 (en) | 2005-11-23 | 2010-02-16 | Autodesk, Inc. | Stroked fill |
| US7616201B2 (en)* | 2005-11-23 | 2009-11-10 | Autodesk, Inc. | Casting shadows |
| US20070115283A1 (en)* | 2005-11-23 | 2007-05-24 | Autodesk, Inc. | Casting shadows |
| US20070115287A1 (en)* | 2005-11-23 | 2007-05-24 | Autodesk, Inc. | Stroked fill |
| US7714866B2 (en) | 2006-07-19 | 2010-05-11 | Autodesk, Inc. | Rendering a simulated vector marker stroke |
| US20080018650A1 (en)* | 2006-07-19 | 2008-01-24 | Autodesk, Inc. | Vector marker strokes |
| US8484554B2 (en)* | 2006-08-31 | 2013-07-09 | Sap Ag | Producing a chart |
| US20080055313A1 (en)* | 2006-08-31 | 2008-03-06 | Sap Aktiengesellschaft | Methods and apparatus for producing a chart |
| US20080266309A1 (en)* | 2007-04-27 | 2008-10-30 | Autodesk, Inc. | Edge effect |
| US7777745B2 (en) | 2007-04-27 | 2010-08-17 | Autodesk, Inc. | Edge effect |
| US7809707B2 (en) | 2007-07-23 | 2010-10-05 | Sap Ag | System and method for identifying element usage in a deep element structure |
| US20090237405A1 (en)* | 2008-03-03 | 2009-09-24 | Justsystems Corporation | Data processing apparatus and data processing method |
| US8847983B1 (en) | 2009-02-03 | 2014-09-30 | Adobe Systems Incorporated | Merge tool for generating computer graphics |
| US20110004839A1 (en)* | 2009-07-02 | 2011-01-06 | Derek Cha | User-customized computer display method |
| US9477650B2 (en) | 2011-08-30 | 2016-10-25 | Microsoft Technology Licensing, Llc | Underlying grid structure and animation of tables |
| US10733367B2 (en) | 2011-08-30 | 2020-08-04 | Microsoft Technology Licensing, Llc | Underlying grid structure and animation of tables |
| US9582573B2 (en) | 2013-07-25 | 2017-02-28 | Sap Se | Interactive composite plot for visualizing multi-variable data |
| US20150029215A1 (en)* | 2013-07-29 | 2015-01-29 | Oracle International Corporation | Interactive intersection areas |
| US9317943B2 (en)* | 2013-07-29 | 2016-04-19 | Oracle International Corporation | Interactive intersection areas |
| US10339681B2 (en) | 2013-11-22 | 2019-07-02 | Raytheon Company | Interactive multimedia process flow chart builder |
| US20160139760A1 (en)* | 2014-11-19 | 2016-05-19 | Beijing Lenovo Software Ltd. | Information processing method and electronic device |
| US9940010B2 (en)* | 2014-11-19 | 2018-04-10 | Beijing Lenovo Software Ltd. | Information processing method and electronic device |
| US20220100360A1 (en)* | 2020-03-23 | 2022-03-31 | Shenzhen Futu Network Technology Co., Ltd. | Method and device for reference-diagram editing for chart and non-transitory computer-readable storage medium |
| US11656750B2 (en)* | 2020-03-23 | 2023-05-23 | Shenzhen Futu Network Technology Co., Ltd. | Method and device for reference-diagram editing for chart and non-transitory computer-readable storage medium |
Also Published As
| Publication number | Publication date |
|---|---|
| AU3734495A (en) | 1996-04-19 |
| US5844558A (en) | 1998-12-01 |
| US5588108A (en) | 1996-12-24 |
| WO1996010231A1 (en) | 1996-04-04 |
Similar Documents
| Publication | Publication Date | Title |
|---|---|---|
| US5982383A (en) | System and method for generating graphics charts | |
| US5357603A (en) | Method and system for changing a shape type while maintaining existing graphic characteristics | |
| US5701499A (en) | Method and system for automatically entering a data series into contiguous cells of an electronic spreadsheet program or the like | |
| US8255814B2 (en) | Temporary text and graphic feedback for object manipulators | |
| US6304272B1 (en) | Graphics system and method having objects conformed to a template | |
| US5999190A (en) | Computer imaging using graphics components | |
| US5343401A (en) | Embroidery design system | |
| US5596691A (en) | Computer system and method for manipulating the display of drawings | |
| US5986670A (en) | Method and apparatus for producing a computer generated display that permits visualization of changes to the interior or exterior of a building structure shown in its actual environment | |
| US5425137A (en) | System and method for processing images using computer-implemented software objects representing lenses | |
| US20080282166A1 (en) | Method and system for designing a pastry | |
| JPH02250113A (en) | Graphic display | |
| JP3879677B2 (en) | Image replacement method for architectural images | |
| Cisco | Objective View Editor | |
| Cisco | Objective View Editor | |
| Cisco | Objective View Editor | |
| Cisco | Objective View Editor | |
| US20100076731A1 (en) | Method and system for designing a pastry | |
| JPH0620021A (en) | Method and device for graphic processing | |
| Adobe Systems | Adobe Photoshop 6.0 | |
| JP2710245B2 (en) | Graph editing processor | |
| JP3144235B2 (en) | Figure creation device | |
| JPH0470958A (en) | document processing device | |
| JPH044473A (en) | Drawing device | |
| JPH0814824B2 (en) | Document logical structure editing device |
Legal Events
| Date | Code | Title | Description |
|---|---|---|---|
| STCF | Information on status: patent grant | Free format text:PATENTED CASE | |
| FEPP | Fee payment procedure | Free format text:PAT HOLDER NO LONGER CLAIMS SMALL ENTITY STATUS, ENTITY STATUS SET TO UNDISCOUNTED (ORIGINAL EVENT CODE: STOL); ENTITY STATUS OF PATENT OWNER: LARGE ENTITY | |
| AS | Assignment | Owner name:CALGARY I ACQUISITION CORP., CANADA Free format text:ASSIGNMENT OF ASSIGNORS INTEREST;ASSIGNOR:MICROGRAFX, INC.;REEL/FRAME:012754/0270 Effective date:20011030 Owner name:COREL, INC., CANADA Free format text:ASSIGNMENT OF ASSIGNORS INTEREST;ASSIGNOR:CALGARY I ACQUISTION CORP.;REEL/FRAME:012754/0277 Effective date:20011030 Owner name:COREL INC., CANADA Free format text:CHANGE OF NAME;ASSIGNOR:COREL CORPORATION (USA);REEL/FRAME:012754/0284 Effective date:20011116 Owner name:COREL CORPORATION (USA), CANADA Free format text:MERGER;ASSIGNOR:COREL, INC.;REEL/FRAME:012754/0291 Effective date:20011116 | |
| FEPP | Fee payment procedure | Free format text:PAYOR NUMBER ASSIGNED (ORIGINAL EVENT CODE: ASPN); ENTITY STATUS OF PATENT OWNER: LARGE ENTITY | |
| FPAY | Fee payment | Year of fee payment:4 | |
| AS | Assignment | Owner name:WELLS FARGO FOOTHILL, INC., CALIFORNIA Free format text:SECURITY INTEREST;ASSIGNOR:COREL CORPORATION, AN ONTARIO CORPORATION;REEL/FRAME:014560/0455 Effective date:20030828 Owner name:WELLS FARGO FOOTHILL, INC.,CALIFORNIA Free format text:SECURITY INTEREST;ASSIGNOR:COREL CORPORATION, AN ONTARIO CORPORATION;REEL/FRAME:014560/0455 Effective date:20030828 | |
| AS | Assignment | Owner name:WELLS FARGO FOOTHILL, INC., CALIFORNIA Free format text:SECURITY INTEREST;ASSIGNOR:COREL CORPORATION;REEL/FRAME:015596/0932 Effective date:20040628 Owner name:WELLS FARGO FOOTHILL, INC.,CALIFORNIA Free format text:SECURITY INTEREST;ASSIGNOR:COREL CORPORATION;REEL/FRAME:015596/0932 Effective date:20040628 | |
| AS | Assignment | Owner name:COREL INC., CANADA Free format text:RELEASE OF SECURITY INTEREST;ASSIGNOR:WELLS FARGO FOOTHILL, INC.;REEL/FRAME:015687/0779 Effective date:20050216 Owner name:COREL CORPORATION, CANADA Free format text:RELEASE OF SECURITY INTEREST;ASSIGNOR:WELLS FARGO FOOTHILL, INC.;REEL/FRAME:015687/0779 Effective date:20050216 Owner name:COREL INC.,CANADA Free format text:RELEASE OF SECURITY INTEREST;ASSIGNOR:WELLS FARGO FOOTHILL, INC.;REEL/FRAME:015687/0779 Effective date:20050216 Owner name:COREL CORPORATION,CANADA Free format text:RELEASE OF SECURITY INTEREST;ASSIGNOR:WELLS FARGO FOOTHILL, INC.;REEL/FRAME:015687/0779 Effective date:20050216 | |
| AS | Assignment | Owner name:CREDIT SUISSE FIRST BOSTON TORONTO BRANCH, CANADA Free format text:SECURITY AGREEMENT;ASSIGNOR:COREL CORPORATION;REEL/FRAME:016309/0733 Effective date:20050216 Owner name:CREDIT SUISSE FIRST BOSTON TORONTO BRANCH,CANADA Free format text:SECURITY AGREEMENT;ASSIGNOR:COREL CORPORATION;REEL/FRAME:016309/0733 Effective date:20050216 | |
| AS | Assignment | Owner name:COREL CORPORATION, CANADA Free format text:ASSIGNMENT OF ASSIGNORS INTEREST;ASSIGNOR:COREL INC.;REEL/FRAME:016369/0020 Effective date:20041209 | |
| AS | Assignment | Owner name:CREDIT SUISSE FIRST BOSTON TORONTO BRANON,CANADA Free format text:SECOND LIEN SECURITY AGREEMENT;ASSIGNORS:COREL CORPORATION;COREL US HOLDINGS, LLC;REEL/FRAME:016784/0245 Effective date:20050216 Owner name:CREDIT SUISSE FIRST BOSTON TORONTO BRANON, CANADA Free format text:SECOND LIEN SECURITY AGREEMENT;ASSIGNORS:COREL CORPORATION;COREL US HOLDINGS, LLC;REEL/FRAME:016784/0245 Effective date:20050216 | |
| AS | Assignment | Owner name:COREL CORPORATION, CANADA Free format text:RELEASE OF SECURITY INTERESTS;ASSIGNOR:CREDIT SUISSE TORONTO BRANCH (FKA CREDIT SUISSE FIRST BOSTON TORONTO BRANCH);REEL/FRAME:017636/0417 Effective date:20060502 Owner name:COREL US HOLDINGS, LLC, CANADA Free format text:RELEASE OF SECURITY INTERESTS;ASSIGNOR:CREDIT SUISSE TORONTO BRANCH (FKA CREDIT SUISSE FIRST BOSTON TORONTO BRANCH);REEL/FRAME:017636/0417 Effective date:20060502 Owner name:COREL CORPORATION,CANADA Free format text:RELEASE OF SECURITY INTERESTS;ASSIGNOR:CREDIT SUISSE TORONTO BRANCH (FKA CREDIT SUISSE FIRST BOSTON TORONTO BRANCH);REEL/FRAME:017636/0417 Effective date:20060502 Owner name:COREL US HOLDINGS, LLC,CANADA Free format text:RELEASE OF SECURITY INTERESTS;ASSIGNOR:CREDIT SUISSE TORONTO BRANCH (FKA CREDIT SUISSE FIRST BOSTON TORONTO BRANCH);REEL/FRAME:017636/0417 Effective date:20060502 | |
| AS | Assignment | Owner name:MORGAN STANLEY & COMPANY INC.,NEW YORK Free format text:SECURITY AGREEMENT;ASSIGNORS:COREL CORPORATION;COREL INC.;COREL HOLDINGS CORPORATION;AND OTHERS;REEL/FRAME:017656/0072 Effective date:20060502 Owner name:MORGAN STANLEY & COMPANY INC., NEW YORK Free format text:SECURITY AGREEMENT;ASSIGNORS:COREL CORPORATION;COREL INC.;COREL HOLDINGS CORPORATION;AND OTHERS;REEL/FRAME:017656/0072 Effective date:20060502 | |
| AS | Assignment | Owner name:JPMORGAN CHASE BANK, N.A.,NEW YORK Free format text:ASSIGNMENT AND ASSUMPTION;ASSIGNOR:MORGAN STANLEY & COMPANY INCORPORATED;REEL/FRAME:018688/0422 Effective date:20061212 Owner name:JPMORGAN CHASE BANK, N.A., NEW YORK Free format text:ASSIGNMENT AND ASSUMPTION;ASSIGNOR:MORGAN STANLEY & COMPANY INCORPORATED;REEL/FRAME:018688/0422 Effective date:20061212 | |
| FPAY | Fee payment | Year of fee payment:8 | |
| FEPP | Fee payment procedure | Free format text:PAYOR NUMBER ASSIGNED (ORIGINAL EVENT CODE: ASPN); ENTITY STATUS OF PATENT OWNER: LARGE ENTITY Free format text:PAYER NUMBER DE-ASSIGNED (ORIGINAL EVENT CODE: RMPN); ENTITY STATUS OF PATENT OWNER: LARGE ENTITY | |
| FPAY | Fee payment | Year of fee payment:12 | |
| AS | Assignment | Owner name:COREL CORPORATION, CANADA Free format text:PARTIAL RELEASE OF SECURITY INTEREST IN INTELLECTUAL PROPERTY;ASSIGNOR:JPMORGAN CHASE BANK, N.A.;REEL/FRAME:026823/0234 Effective date:20110825 Owner name:WINZIP COMPUTING LP, CONNECTICUT Free format text:PARTIAL RELEASE OF SECURITY INTEREST IN INTELLECTUAL PROPERTY;ASSIGNOR:JPMORGAN CHASE BANK, N.A.;REEL/FRAME:026823/0234 Effective date:20110825 Owner name:COREL INC., CANADA Free format text:PARTIAL RELEASE OF SECURITY INTEREST IN INTELLECTUAL PROPERTY;ASSIGNOR:JPMORGAN CHASE BANK, N.A.;REEL/FRAME:026823/0234 Effective date:20110825 Owner name:WINZIP INTERNATIONAL LLC, CONNECTICUT Free format text:PARTIAL RELEASE OF SECURITY INTEREST IN INTELLECTUAL PROPERTY;ASSIGNOR:JPMORGAN CHASE BANK, N.A.;REEL/FRAME:026823/0234 Effective date:20110825 Owner name:WINZIP COMPUTING LLC, CONNECTICUT Free format text:PARTIAL RELEASE OF SECURITY INTEREST IN INTELLECTUAL PROPERTY;ASSIGNOR:JPMORGAN CHASE BANK, N.A.;REEL/FRAME:026823/0234 Effective date:20110825 Owner name:COREL HOLDINGS CORPORATION, CANADA Free format text:PARTIAL RELEASE OF SECURITY INTEREST IN INTELLECTUAL PROPERTY;ASSIGNOR:JPMORGAN CHASE BANK, N.A.;REEL/FRAME:026823/0234 Effective date:20110825 | |
| AS | Assignment | Owner name:COMERICA BANK, TEXAS Free format text:SECURITY AGREEMENT;ASSIGNOR:IGRAFX, LLC;REEL/FRAME:026835/0085 Effective date:20110825 | |
| AS | Assignment | Owner name:IGRAFX, LLC, OREGON Free format text:ASSIGNMENT OF ASSIGNORS INTEREST;ASSIGNOR:COREL CORPORATION;REEL/FRAME:027312/0837 Effective date:20110825 | |
| AS | Assignment | Owner name:IGRAFX, LLC, TEXAS Free format text:ASSIGNMENT OF ASSIGNORS INTEREST;ASSIGNOR:COREL CORPORATION;REEL/FRAME:029181/0232 Effective date:20120822 | |
| AS | Assignment | Owner name:IGRAFX, LLC, TEXAS Free format text:RELEASE BY SECURED PARTY;ASSIGNOR:COMERICA BANK;REEL/FRAME:053342/0519 Effective date:20200728 |