US5837896A - Detection of defects using resonant ultrasound spectroscopy at predicted high order modes - Google Patents
Detection of defects using resonant ultrasound spectroscopy at predicted high order modesDownload PDFInfo
- Publication number
- US5837896A US5837896AUS08/520,009US52000995AUS5837896AUS 5837896 AUS5837896 AUS 5837896AUS 52000995 AUS52000995 AUS 52000995AUS 5837896 AUS5837896 AUS 5837896A
- Authority
- US
- United States
- Prior art keywords
- sub
- frequency
- rus
- modes
- mode
- Prior art date
- Legal status (The legal status is an assumption and is not a legal conclusion. Google has not performed a legal analysis and makes no representation as to the accuracy of the status listed.)
- Expired - Lifetime
Links
- 238000004611spectroscopical analysisMethods0.000titleclaimsabstractdescription10
- 238000002604ultrasonographyMethods0.000titleclaimsabstractdescription10
- 230000007547defectEffects0.000titleclaimsdescription35
- 238000001514detection methodMethods0.000titleclaimsdescription8
- 238000000034methodMethods0.000claimsabstractdescription44
- 238000005259measurementMethods0.000claimsdescription33
- 230000001419dependent effectEffects0.000claimsdescription3
- 238000012360testing methodMethods0.000abstractdescription13
- 238000002405diagnostic procedureMethods0.000abstract1
- 238000004519manufacturing processMethods0.000description14
- 238000013459approachMethods0.000description12
- 238000010897surface acoustic wave methodMethods0.000description9
- 239000000463materialSubstances0.000description7
- 230000006870functionEffects0.000description5
- 238000001228spectrumMethods0.000description5
- 238000004422calculation algorithmMethods0.000description3
- 238000004364calculation methodMethods0.000description3
- 230000002596correlated effectEffects0.000description3
- 230000002950deficientEffects0.000description3
- 230000000694effectsEffects0.000description3
- 238000002474experimental methodMethods0.000description3
- 230000003595spectral effectEffects0.000description3
- 239000000919ceramicSubstances0.000description2
- 238000003384imaging methodMethods0.000description2
- 238000009659non-destructive testingMethods0.000description2
- 238000000053physical methodMethods0.000description2
- 238000012546transferMethods0.000description2
- 238000004458analytical methodMethods0.000description1
- 238000010420art techniqueMethods0.000description1
- 230000005540biological transmissionEffects0.000description1
- 238000011161developmentMethods0.000description1
- 238000005516engineering processMethods0.000description1
- 238000007689inspectionMethods0.000description1
- 238000007620mathematical functionMethods0.000description1
- 238000005070samplingMethods0.000description1
- 239000007787solidSubstances0.000description1
- 238000010408sweepingMethods0.000description1
Images


Classifications
- G—PHYSICS
- G01—MEASURING; TESTING
- G01N—INVESTIGATING OR ANALYSING MATERIALS BY DETERMINING THEIR CHEMICAL OR PHYSICAL PROPERTIES
- G01N29/00—Investigating or analysing materials by the use of ultrasonic, sonic or infrasonic waves; Visualisation of the interior of objects by transmitting ultrasonic or sonic waves through the object
- G01N29/44—Processing the detected response signal, e.g. electronic circuits specially adapted therefor
- G01N29/4472—Mathematical theories or simulation
- G—PHYSICS
- G01—MEASURING; TESTING
- G01N—INVESTIGATING OR ANALYSING MATERIALS BY DETERMINING THEIR CHEMICAL OR PHYSICAL PROPERTIES
- G01N29/00—Investigating or analysing materials by the use of ultrasonic, sonic or infrasonic waves; Visualisation of the interior of objects by transmitting ultrasonic or sonic waves through the object
- G01N29/34—Generating the ultrasonic, sonic or infrasonic waves, e.g. electronic circuits specially adapted therefor
- G01N29/348—Generating the ultrasonic, sonic or infrasonic waves, e.g. electronic circuits specially adapted therefor with frequency characteristics, e.g. single frequency signals, chirp signals
Definitions
- RUSresonant ultrasound spectroscopy
- RUSreactive ultrasound spectroscopy
- the term RUSis defined as: an application of a continuous sweep of frequencies as shown in U.S. Pat. No. 4,976,148 or in steps as shown in U.S. Pat. No. 5,408,880, and the measurement is observation of the response of the object to the frequency which is applied.
- Resonant Inspection using Resonant Ultrasound Spectroscopyuses higher order modes (high frequencies) to detect small defects. RI does this by transmitting CW energy to the object. The frequency is swept across the frequency range of interest. The part vibrates when the drive matches the frequency of one of its characteristic modes. Each mode is measured independently and RI uses sensitive receivers, to accurately measure hundreds of modes. As a result, RI can measure very small defects (or small changes in dimensions).
- Prior art systemsinclude ultrasonic time of flight, ultrasonic imaging, and use of impulse vibrations. Each of these are discussed below.
- Ultrasonic Time of Flightis essentially an acoustical radar (more properly, a sonar).
- a pulse of acoustical energyis transmitted into the object being tested.
- the pulsetravels through the object until it reaches a discontinuity, such as the other side of the object or a flaw within the object.
- the discontinuityreflects the pulse and the return (echo) is sensed.
- the time between the transmission of the pulse and its returnis proportional to the distance to the discontinuity.
- Application of this technique to a wall as the transmitter/receiver moves along the wallcan be effective for sensing the thickness of the wall, and can present a profile of the wall thickness.
- the techniqueis referred to by those in the art as ultrasonic because the pulse widths must be short compared to the propagation time, which corresponds to frequencies beyond human hearing (>20 kHz).
- Ultrasonic Imagingis where the receiver is placed on the other side of the object from the transmitter, that is opposite the transmitter. If the setup is such that the reflections off the surfaces can be ignored, and the transmitter and receiver are scanned in step, across the surface, then the signal obtained by receiver is an outline (image) of the discontinuity. Again practical considerations require that ultrasonic frequencies be used.
- Impulse Vibrationsapplies a pulse of acoustical energy, usually by striking a sharp blow to an object. This approximates a mathematical impulse function, so the response is the transfer function of the object.
- the objectvibrates in the form of a damped sinusoid which contains all of the frequencies in the transfer function, that is all of the object's vibrational modes. If a defect is present the modes should be effected. It is difficult to obtain any useful information about defects directly from the damped sinusoid.
- this time domain wave formis transformed to the frequency domain using a Fourier Transform.
- the amplitude of the sinusoidis dominated by the amplitude of the first resonant mode and the process is inherently noisy, so only the first few modes can be accurately computed. This is sometimes enough to detect large defects, but not small defects.
- RUSresonant ultrasound spectroscopy
- RUSrefers to the application to an object of acoustic waves having different frequencies within a predetermined frequency range wherein the step of applying the acoustic waves involves defining a response time interval which depends on the elastic properties of the material, defining a frequency step interval, sweeping the acoustic wave frequency at step intervals through the predetermined frequency range, and where each frequency is applied during the defined small response time interval.
- This inventionis an improvement in analysis of the detected response of an object to the application of RUS.
- Object responses to RUScan be classified as response modes, i.e., a response where the part exhibits a resonant response to the applied vibrations.
- Low order modes as used in this applicationrefers to modes where the frequency is low (within the first few resonances, such as 20), and high order modes refers to modes where the frequency is considered high (that is, where there are many closely spaced modes).
- Partsexhibit response peaks where the part resonates and produces a detectable vibration which is converted into an electrical signal. The magnitude of the converted electrical signal is proportional to the part resonance. Observation of part resonances leads to powerful tools used to analyze parts during nondestructive testing.
- the reason for measurement at higher order modesis so that part defects which are smaller, such as very small cracks, or other small defects, can be detected.
- the problem with high order mode testingis that in the higher order modes, there are many part responses which clutter response spectrum and make it difficult to identify specific high order mode responses which may be buried within the spectrum.
- speed of measurementcan be substantially increased if one knows where to look for the high order resonant modes. This allows the use of a narrower frequency band for the high order mode testing by RUS.
- applicanthas provided improvements in RUS parameter measurement which lead to even more powerful methods for determining whether a part is good or bad.
- applicantteaches a method of measurement wherein the resonant responses at low order modes is used to predict resonant response at higher order modes.
- the prediction of high order mode resonant responseallows the use of a narrow frequency band for the high order resonant test, thereby eliminating unnecessary testing and consequent time consumption scanning frequencies where there is no meaningful response.
- the approach of this inventionis to use higher frequencies, i.e., higher order modes. Detection of smaller defects requires shorter wavelengths and thus higher frequencies.
- the mode densityi.e., the number of modes per frequency window
- Each of these modesalso moves relative to its neighbors as the dimensions vary across a production run.
- RUScan measure literally hundreds of modes so a technique is needed to use these high order modes to detect small defects, despite the mode saturation.
- the use of a narrow frequency bandis possible because the location of a high order resonant mode is predicted in advance by the methods of this invention.
- an objectis measured by RUS at low order modes, then higher order mode frequencies are computed based upon the measured low order modes, and then measurement of the object by diagnostic RUS at the higher order mode frequencies where responses are predicted is completed.
- the use of RUSis combined with a surface acoustic wave measurement (SAW) in order to predict high order surface acoustic wave modes.
- SAWsurface acoustic wave measurement
- frequencies for selected low order modesare first computed based upon part geometry, and the measurement at low order modes is made.
- applicantprovides a method for the relationship between resonant frequency, specific response, density of an object where the density is not known.
- the basic relationshipsare first determined.
- measurement by RUS and the object at at least two lower order modesis performed.
- a comparison between the difference between the frequency at the lower order modesthen becomes independent of the part density because the part density function remains constant and is subtracted out.
- a plurality of parts known to not have any defectsis first measured by RUS to determine low order resonant mode(s).
- relationships between a resonant frequency mode, a specific resonant mode response, and dimensions of a partare determined.
- expected frequencies of a high frequency resonant modeare predicted by calculating coefficients of the relationships from the measurements of frequency at low order frequency modes.
- Measurement of an unknown part at high order frequency modes by RUScan then proceed with a narrow band width of applied RUS, and the part can be accepted or rejected based upon a criterion applied to measured RUS response at the high order mode.
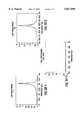
- FIG. 1ashows the spectrum for a small part in the vicinity of the diagnostic mode for a part which is smaller than normal.
- FIG. 1bshows the same spectral window for a part which is larger than normal.
- FIG. 2aillustrates the use of the technique disclosed here to compute the expected frequency of the diagnostic mode.
- FIG. 2bshows the same calculation for a defective part, showing the splitting of the diagnostic mode.
- FIGS. 3a and 3bshow the application of the expected frequency for testing using RUS shifts.
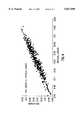
- FIG. 4is a graph comparing RUS measurement of length to the physical measurement.
- FIG. 5is a graph comparing a high order mode to the product of two lower order modes.
- This disclosuredescribes techniques for computing the expected frequency of a specific high order diagnostic mode, based on the measured frequency of related low order modes.
- the expected frequencyis defined as the frequency at which a given resonance would occur if there was no defect in the part.
- the measurementcan then be limited to the immediate vicinity of the expected frequency so that extraneous modes do not interfere with the measurement and the previously mentioned splits and shifts can then be used to detect the presence of any defect.
- the resonant frequency of a particular mode in a good partis determined by several parameters. These include the elastic constants of the material, the material density and the dimensions.
- the elastic constants of the materialare just that, constant. They do not vary, so they can be ignored for a given part.
- the densitymay vary from batch to batch, but is constant across a specific production run.
- the dimensionsvary from part to part within a production run depending on the tolerances in the production process.
- f nis the frequency of the n-th resonance and "L" and “D” are the length and diameter respectively of the cylinder.
- the constants A, B and Care specific to each resonant mode, but apply to all parts of this type. For a more complex shape, a term must be included in the equation for each dimension (e.g., a hollow cylinder or a rectangular parallelepiped each requires four terms).
- the constants A, B and Ccan be determined for mode "n" by measuring three parts “p", “q” and "r” and solving the simultaneous equations.
- equations 8 and 9provide values for L and D. Substituting another set of constants R, S and T allows equation 10 to be rewritten:
- the experimental procedureis to define the number "x", of variable dimensions for the part of interest. At least x+1 good parts are needed (for the x dimensional variables plus a constant term) whose dimensions vary over the range of interest. For each part x+1 low order modes are measured plus the high order mode of interest. An equation of the form of equation 11 is solved for the x+1 constants. Then, these constants can be used with the measured low order modes to compute the expected frequency of the high order mode for any part of this type. This approach has been found to predict the expected frequency with an accuracy better than 99%.
- the appropriate RUS defect detection algorithmcan be applied.
- An alternative approachis to use more parts and use a standard best fit technique to fit equation 11 to the data. This can be particularly valuable if exogenous variables (such as the quality of the part or its density) are present.
- FIG. 1ashows the spectrum for a small part (that is, within tolerances, but smaller than the mean) in the vicinity of the diagnostic mode.
- FIG. 1bshows the same spectral window for a large part. Both parts are within the acceptable manufacturing tolerance.
- a computeror an operator to consistently identify the small diagnostic mode in the presence of the other modes.
- FIG. 2aillustrates the use of the technique disclosed here to compute the expected frequency of the diagnostic mode.
- the frequency of the two lower order modes f 1 and f 2are measured using the first two windows. These frequencies are used with the equation:
- the lower end of the measurement windowis set to be 0.5% below the expected frequency and the upper end is 1% above the expected frequency. Now the diagnostic mode is isolated in the measurement window and is easily detected.
- FIG. 2bshows the same calculation for a defective part, showing the splitting of the diagnostic mode.
- FIGS. 3a and 3bshow the application of the expected frequency for testing using RUS shifts.
- the diagnostic modehas shifted out of the test window, so the part is defective.
- This examplealso shows another application of the expected frequency technique.
- the diagnostic modeoccurs at a lower frequency than one of the modes used to compute it.
- the diagnostic modeis adjacent to another unused mode, and it moves relative to that mode as the dimensions vary.
- the second modewhile it is at a higher frequency, is relatively isolated, and is always present.
- the expected frequency techniqueallows the diagnostic mode to be isolated so that its presence in the test window can be used to detect a defect.
- the low order modesso that at least one mode is used whose frequency correlates with each variable dimension. If two modes are used that each correlate only to the same dimension, then the relationships derived do not constitute simultaneous, independent equations and the solutions to the equations will not be meaningful. Most modes are driven primarily by a single dimension. For example, the first mode of a short cylinder (i.e., length to diameter ratio near one) is a torsional mode and it depends on length. For this type of mode the equation can be simplified to only two terms.
- Dis a dimension
- fis frequency
- Table 1contains correlations between modes and dimensions for a sample manufactured part. This type of data provides the basis for selecting the modes to be used to measure dimensions. In cases where a mode can be identified that correlates to only one dimension, then the other modes can be ignored for measuring that dimension.
- FIG. 4is a graph comparing RUS measurement of length to the physical measurement.
- High order SAW wavescan be used for RUS detection of surface defects in non homogenous parts.
- U.S. Pat. No. 5,355,731describes a technique for detecting surface defects in non-homogeneous parts such as ceramic ball bearings. That technique uses Surface Acoustic Waves (SAW) confined to the near surface of the part. The same RUS splits and shifts are used to detect the presence of a defect.
- SAWSurface Acoustic Waves
- a high order diagnostic modeIn order to confine the SAW to the surface, a high order diagnostic mode must be used. However, some of the physical parameters (dimensions and average density) that determine the precise frequency of the mode in a given part, can vary across a production run or from run to run. This causes the diagnostic mode to move relative to its neighboring modes. Since the SAW is always a high order mode, it lies in a spectral region of mode saturation. As a result it is difficult to track the diagnostic mode across a production run.
- a second approachis applicable to parts that have a simple geometry that allows the resonant modes to be computed using an analytical model (a ball). Assume the density and the elastic constants are known well enough so that the model can accurately predict the modes. The dimensions vary across the production run. To test such a part the modes are first computed using typical values for dimensions. Then the RUS spectra is obtained. The computed and measured frequencies for selected low order modes are compared for a given part. The differences between the computed and measured frequencies are used to adjust determine the dimensions. Now, the real dimensions are known so the model can be used to compute the expected frequency of the diagnostic high order mode. The RUS shifts and splits can be used to detect surface defects.
- This inventionallows for adjusting for density variations in parts during RUS measurements. Density variations among a group of parts also present a challenge for using RUS.
- the resonant modesmove with the inverse square root of the density. All of the modes move together, so this complicates the tracking of frequency shifts for both low order and high order modes. It also makes it difficult to track specific high order modes when using frequency shifts.
- the technique disclosed herecompensates for density effects based on the observation that the density variation affects all of the modes in the same direction, so the effect can be essentially eliminated by differencing similar modes. To illustrate this effect, rewrite equation 1 for a mode that depends only on length.
- equation 17is independent of density. Given at least two good parts of known length, the approach described above can be used to solve for Y and Z. The result is an expression that measures length and is unaffected by density. The same approach can be used for any other dimension and for parameters that depend on dimensions, such as weight.
- the accuracy of the measurementis degraded if the modes selected are not determined exclusively by the dimension of interest.
- the accuracyis also degraded if the variations are too large for the approximation of equation 1.
- the same mode differencing approachcan also be used to account for density variations when using RUS frequency shifts to detect defects.
- Equation 18which shows that the mode difference is independent of density.
- Chose modes f n and f osuch that f n is a diagnostic mode for defects of interest and f o either does not vary with dimensions, or more practically, depends on a dimension that does not vary significantly for the part of interest.
- the difference f n -f ois inversely proportional to the frequency shift of f n , and thus to the size of the defect. This assumes f n is larger than f o . If the converse is true, then the difference is proportional to the size of the defect.
- FIG. 5plots expected frequency for a high order mode vs the product of two other modes using equation 12.
- Datais provided for a range of dimensions for parts of one density and for average sized parts at 2 other densities. Each density establishes a unique line relating the variables. The density is unknown and the relationships are too complex to derive an adjustment that would make the relationship independent of density.
- the expected frequencycan be computed with acceptable accuracy (about 99%) by fitting equation 12 to the entire range of data. This can be done with a standard best fit algorithm, but care must be taken to assure that equal weight is given to both ends of the range of parts.
Landscapes
- General Physics & Mathematics (AREA)
- Physics & Mathematics (AREA)
- Life Sciences & Earth Sciences (AREA)
- Pathology (AREA)
- Immunology (AREA)
- General Health & Medical Sciences (AREA)
- Biochemistry (AREA)
- Analytical Chemistry (AREA)
- Chemical & Material Sciences (AREA)
- Health & Medical Sciences (AREA)
- Mathematical Optimization (AREA)
- Signal Processing (AREA)
- Engineering & Computer Science (AREA)
- Pure & Applied Mathematics (AREA)
- Mathematical Physics (AREA)
- Mathematical Analysis (AREA)
- Algebra (AREA)
- Investigating Or Analyzing Materials By The Use Of Ultrasonic Waves (AREA)
Abstract
Description
f.sub.n =A.sub.n *L+B.sub.n *D+C.sub.n (1)
f.sub.np =A.sub.n *L.sub.p +B.sub.n *D.sub.p +C.sub.n (2)
f.sub.nq =A.sub.n *L.sub.q +B.sub.n *D.sub.q +C.sub.n (3)
f.sub.nr =A.sub.n *L.sub.r +B.sub.n *D.sub.r +C.sub.n (4)
f.sub.m =A.sub.m *L+B.sub.m *D+C.sub.m (5)
f.sub.n =A.sub.n *L+B.sub.n *D+C.sub.n (6)
f.sub.o =A.sub.o *L+B.sub.o *D+C.sub.o (7)
L=U*f.sub.m +V*f.sub.n W*f.sub.o (8)
D=X*f.sub.m +Y*f.sub.n Z*f.sub.o (9)
f.sub.h =A.sub.h *L+B.sub.h *D+C.sub.h (10)
f.sub.h =R.sub.h *f.sub.m +S.sub.h *f.sub.n +T.sub.h *f.sub.o (11)
f.sub.h =A*f.sub.1 +B*f.sub.2 +C (13)
f.sub.h =A*f.sub.1 +B*f.sub.2 + . . . M*f.sub.n +C
f.sub.h =A*f.sub.m *f.sub.n +B (14)
f.sub.h =F(D.sub.1, D.sub.2, . . . f.sub.1, f.sub.2 . . . )
TABLE 1 ______________________________________ CORRELATlON OF MODES TO PHYSICAL PARAMETERS MODE (kHz) 115 135 205 210 215 235 ______________________________________ DIAMETER 48% 90% 87% 87% -67% -95% HOLE -58% -20% 0% -20% -40% 10% LENGTH 98% 30% 4% 35% 78% 2% THICKNESS 4% 91% 81% 89% -64% -95% WEIGHT 21% 98% 87% 96% -49% -97% ASPECT RATIO 49% -60% -74% -55% 95% 79% ______________________________________
f.sub.n =A.sub.n *L+C.sub.n (15)
f.sub.n -f.sub.o =Y*L+Z (18)
f.sub.n /f.sub.o =Y*L+Z (19)
Claims (13)
f.sub.h =F(D.sub.1, D.sub.2, . . . f.sub.1, f.sub.2, . . . )
f.sub.h =F(D.sub.1, D.sub.2, . . . f.sub.1, f.sub.2 . . . )
f.sub.h =A*f.sub.1 +B*f.sub.2 + . . . M*f.sub.n +C;
f.sub.h =a*f.sub.1 *f.sub.2 +c;
Priority Applications (2)
| Application Number | Priority Date | Filing Date | Title |
|---|---|---|---|
| US08/520,009US5837896A (en) | 1995-08-23 | 1995-08-23 | Detection of defects using resonant ultrasound spectroscopy at predicted high order modes |
| US09/184,876US5992234A (en) | 1995-08-23 | 1998-11-03 | Detection of defects using resonant ultrasound spectroscopy at predicted high order modes |
Applications Claiming Priority (1)
| Application Number | Priority Date | Filing Date | Title |
|---|---|---|---|
| US08/520,009US5837896A (en) | 1995-08-23 | 1995-08-23 | Detection of defects using resonant ultrasound spectroscopy at predicted high order modes |
Related Child Applications (1)
| Application Number | Title | Priority Date | Filing Date |
|---|---|---|---|
| US09/184,876ContinuationUS5992234A (en) | 1995-08-23 | 1998-11-03 | Detection of defects using resonant ultrasound spectroscopy at predicted high order modes |
Publications (1)
| Publication Number | Publication Date |
|---|---|
| US5837896Atrue US5837896A (en) | 1998-11-17 |
Family
ID=24070810
Family Applications (2)
| Application Number | Title | Priority Date | Filing Date |
|---|---|---|---|
| US08/520,009Expired - LifetimeUS5837896A (en) | 1995-08-23 | 1995-08-23 | Detection of defects using resonant ultrasound spectroscopy at predicted high order modes |
| US09/184,876Expired - LifetimeUS5992234A (en) | 1995-08-23 | 1998-11-03 | Detection of defects using resonant ultrasound spectroscopy at predicted high order modes |
Family Applications After (1)
| Application Number | Title | Priority Date | Filing Date |
|---|---|---|---|
| US09/184,876Expired - LifetimeUS5992234A (en) | 1995-08-23 | 1998-11-03 | Detection of defects using resonant ultrasound spectroscopy at predicted high order modes |
Country Status (1)
| Country | Link |
|---|---|
| US (2) | US5837896A (en) |
Cited By (17)
| Publication number | Priority date | Publication date | Assignee | Title |
|---|---|---|---|---|
| US6236049B1 (en) | 1999-09-16 | 2001-05-22 | Wayne State University | Infrared imaging of ultrasonically excited subsurface defects in materials |
| US6330827B1 (en)* | 1998-12-04 | 2001-12-18 | The Regents Of The University Of California | Resonant nonlinear ultrasound spectroscopy |
| US6399948B1 (en) | 1999-09-16 | 2002-06-04 | Wayne State University | Miniaturized contactless sonic IR device for remote non-destructive inspection |
| US6437334B1 (en) | 1999-09-16 | 2002-08-20 | Wayne State University | System and method for detecting cracks in a tooth by ultrasonically exciting and thermally imaging the tooth |
| US6593574B2 (en) | 1999-09-16 | 2003-07-15 | Wayne State University | Hand-held sound source gun for infrared imaging of sub-surface defects in materials |
| US6606909B2 (en) | 2001-08-16 | 2003-08-19 | Lockheed Martin Corporation | Method and apparatus to conduct ultrasonic flaw detection for multi-layered structure |
| US20060288756A1 (en)* | 2003-02-21 | 2006-12-28 | De Meurechy Guido D K | Method and apparatus for scanning corrosion and surface defects |
| US20100212427A1 (en)* | 2009-02-25 | 2010-08-26 | Heck David P | Resonant inspection using reconfigurable nest |
| WO2012177659A2 (en) | 2011-06-20 | 2012-12-27 | Vibrant Corporation | Part evaluation system/method using both resonance and surface vibration data |
| WO2013074881A1 (en) | 2011-11-17 | 2013-05-23 | Vibrant Corporation | Resonant ultrasound spectrocopy using surface acoustic wave analysis |
| US9310340B2 (en) | 2012-05-23 | 2016-04-12 | International Electronic Machines Corp. | Resonant signal analysis-based inspection of rail components |
| US9335300B2 (en) | 2013-03-15 | 2016-05-10 | Vibrant Corporation | Saw mode-based surface defect system/method |
| US9389205B2 (en) | 2012-05-23 | 2016-07-12 | International Electronic Machines Corp. | Resonant signal analysis-based inspection of rail components |
| US9927403B1 (en) | 2014-04-28 | 2018-03-27 | Vibrant Corporation | Resonance inspection sorting module array |
| CN109669075A (en)* | 2019-01-25 | 2019-04-23 | 电子科技大学 | The lossless reflectance measurement methods of medium complex dielectric permittivity based on open rectangle waveguide |
| US10481104B2 (en) | 2010-10-21 | 2019-11-19 | Vibrant Corporation | Utilizing resonance inspection of in-service parts |
| CN114280156A (en)* | 2021-12-28 | 2022-04-05 | 杭州电子科技大学 | Sub-surface crack length and depth measuring method based on laser ultrasound |
Families Citing this family (10)
| Publication number | Priority date | Publication date | Assignee | Title |
|---|---|---|---|---|
| US6446013B1 (en)* | 1999-07-20 | 2002-09-03 | United Technologies Corporation | Method for determining a peening element speed limit ratio when peening the internal surface of a hollow part |
| US7360462B2 (en)* | 2002-05-08 | 2008-04-22 | Sekisui Chemical Co., Ltd. | Method and equipment for inspecting reinforced concrete pipe |
| US20050216226A1 (en)* | 2003-06-26 | 2005-09-29 | Yancey Michael J | Method for determining physical properties of wood |
| US7317994B2 (en)* | 2005-08-10 | 2008-01-08 | General Electric Company | Method and apparatus for signal signature analysis for event detection in rotating machinery |
| US20090151456A1 (en)* | 2007-12-18 | 2009-06-18 | Baker Hughes Incorporated | Downhole tool damage detection system and method |
| US8429974B2 (en)* | 2009-09-08 | 2013-04-30 | Honeywell International Inc. | Lamb wave dispersion compensation for EUSR approach to ultrasonic beam steering |
| RU2477854C2 (en)* | 2011-06-22 | 2013-03-20 | Общество с ограниченной ответственностью "Газпром трансгаз Махачкала" | Method of inspecting materials by resonant ultrasound spectroscopy |
| CN102999037B (en)* | 2011-09-09 | 2014-12-17 | 中国航天科工集团第三研究院第八三五八研究所 | Loop bandwidth virtual testing method |
| US8903675B2 (en)* | 2011-10-14 | 2014-12-02 | Vibrant Corporation | Acoustic systems and methods for nondestructive testing of a part through frequency sweeps |
| US9304112B2 (en)* | 2013-04-05 | 2016-04-05 | George Wyatt Rhodes | Method for detecting the purity of gold bullion |
Citations (4)
| Publication number | Priority date | Publication date | Assignee | Title |
|---|---|---|---|---|
| US4446733A (en)* | 1981-08-17 | 1984-05-08 | Design Professionals Financial Corporation | Stress control in solid materials |
| US4926691A (en)* | 1986-03-11 | 1990-05-22 | Powertech Labs, Inc. | Apparatus and method for testing wooden poles |
| US5425272A (en)* | 1993-11-30 | 1995-06-20 | Quatro Corporation | Relative resonant frequency shifts to detect cracks |
| US5571966A (en)* | 1993-10-12 | 1996-11-05 | Iwatsu Electric Co., Ltd. | Method and apparatus for predicting lifetime of measured object |
Family Cites Families (6)
| Publication number | Priority date | Publication date | Assignee | Title |
|---|---|---|---|---|
| US4976148A (en)* | 1989-09-12 | 1990-12-11 | The United Stated Of America As Represented By The Department Of Energy | Resonant ultrasound spectrometer |
| US5144838A (en)* | 1989-10-04 | 1992-09-08 | Iwatsu Electric Co., Ltd. | Defect detecting method and apparatus |
| US5062296A (en)* | 1990-09-20 | 1991-11-05 | The United States Of America As Represented By The Department Of Energy | Resonant ultrasound spectroscopy |
| US5351543A (en)* | 1991-12-27 | 1994-10-04 | The Regents Of The University Of California, Office Of Technology Transfer | Crack detection using resonant ultrasound spectroscopy |
| US5355731A (en)* | 1992-05-08 | 1994-10-18 | The Regents Of The University Of California, Office Of Technology Transfer | Sphericity determination using resonant ultrasound spectroscopy |
| US5408880A (en)* | 1993-06-10 | 1995-04-25 | Quatro Corporation | Ultrasonic differential measurement |
- 1995
- 1995-08-23USUS08/520,009patent/US5837896A/ennot_activeExpired - Lifetime
- 1998
- 1998-11-03USUS09/184,876patent/US5992234A/ennot_activeExpired - Lifetime
Patent Citations (4)
| Publication number | Priority date | Publication date | Assignee | Title |
|---|---|---|---|---|
| US4446733A (en)* | 1981-08-17 | 1984-05-08 | Design Professionals Financial Corporation | Stress control in solid materials |
| US4926691A (en)* | 1986-03-11 | 1990-05-22 | Powertech Labs, Inc. | Apparatus and method for testing wooden poles |
| US5571966A (en)* | 1993-10-12 | 1996-11-05 | Iwatsu Electric Co., Ltd. | Method and apparatus for predicting lifetime of measured object |
| US5425272A (en)* | 1993-11-30 | 1995-06-20 | Quatro Corporation | Relative resonant frequency shifts to detect cracks |
Cited By (27)
| Publication number | Priority date | Publication date | Assignee | Title |
|---|---|---|---|---|
| US6330827B1 (en)* | 1998-12-04 | 2001-12-18 | The Regents Of The University Of California | Resonant nonlinear ultrasound spectroscopy |
| US6236049B1 (en) | 1999-09-16 | 2001-05-22 | Wayne State University | Infrared imaging of ultrasonically excited subsurface defects in materials |
| US6759659B2 (en) | 1999-09-16 | 2004-07-06 | Wayne State University | Thermal imaging system for detecting defects |
| US6437334B1 (en) | 1999-09-16 | 2002-08-20 | Wayne State University | System and method for detecting cracks in a tooth by ultrasonically exciting and thermally imaging the tooth |
| US6593574B2 (en) | 1999-09-16 | 2003-07-15 | Wayne State University | Hand-held sound source gun for infrared imaging of sub-surface defects in materials |
| US20030205671A1 (en)* | 1999-09-16 | 2003-11-06 | Wayne State University | Thermal imaging system for detecting defects |
| US6399948B1 (en) | 1999-09-16 | 2002-06-04 | Wayne State University | Miniaturized contactless sonic IR device for remote non-destructive inspection |
| US6606909B2 (en) | 2001-08-16 | 2003-08-19 | Lockheed Martin Corporation | Method and apparatus to conduct ultrasonic flaw detection for multi-layered structure |
| US20060288756A1 (en)* | 2003-02-21 | 2006-12-28 | De Meurechy Guido D K | Method and apparatus for scanning corrosion and surface defects |
| US8051715B2 (en)* | 2009-02-25 | 2011-11-08 | The Boeing Company | Resonant inspection using reconfigurable nest |
| US20100212427A1 (en)* | 2009-02-25 | 2010-08-26 | Heck David P | Resonant inspection using reconfigurable nest |
| US10718723B2 (en) | 2010-10-21 | 2020-07-21 | Vibrant Corporation | Utilizing resonance inspection of in-service parts |
| US10481104B2 (en) | 2010-10-21 | 2019-11-19 | Vibrant Corporation | Utilizing resonance inspection of in-service parts |
| WO2012177659A2 (en) | 2011-06-20 | 2012-12-27 | Vibrant Corporation | Part evaluation system/method using both resonance and surface vibration data |
| US10067094B2 (en) | 2011-06-20 | 2018-09-04 | Vibrant Corporation | Part evaluation system/method using both resonance and surface vibration data |
| US9157788B2 (en) | 2011-06-20 | 2015-10-13 | Vibrant Corporation | Part evaluation system/method using both resonance and surface vibration data |
| WO2013074881A1 (en) | 2011-11-17 | 2013-05-23 | Vibrant Corporation | Resonant ultrasound spectrocopy using surface acoustic wave analysis |
| US9228981B2 (en)* | 2011-11-17 | 2016-01-05 | Vibrant Corporation | Resonance inspection-based surface defect system/method |
| US20130269435A1 (en)* | 2011-11-17 | 2013-10-17 | Vibrant Corporation | Resonance inspection-based surface defect system/method |
| US9389205B2 (en) | 2012-05-23 | 2016-07-12 | International Electronic Machines Corp. | Resonant signal analysis-based inspection of rail components |
| US9310340B2 (en) | 2012-05-23 | 2016-04-12 | International Electronic Machines Corp. | Resonant signal analysis-based inspection of rail components |
| US10203306B2 (en) | 2012-05-23 | 2019-02-12 | International Electronic Machines Corp. | Resonant signal analysis-based inspection |
| US9335300B2 (en) | 2013-03-15 | 2016-05-10 | Vibrant Corporation | Saw mode-based surface defect system/method |
| US9927403B1 (en) | 2014-04-28 | 2018-03-27 | Vibrant Corporation | Resonance inspection sorting module array |
| CN109669075A (en)* | 2019-01-25 | 2019-04-23 | 电子科技大学 | The lossless reflectance measurement methods of medium complex dielectric permittivity based on open rectangle waveguide |
| CN114280156A (en)* | 2021-12-28 | 2022-04-05 | 杭州电子科技大学 | Sub-surface crack length and depth measuring method based on laser ultrasound |
| CN114280156B (en)* | 2021-12-28 | 2022-10-21 | 杭州电子科技大学 | Sub-surface crack length and depth measuring method based on laser ultrasound |
Also Published As
| Publication number | Publication date |
|---|---|
| US5992234A (en) | 1999-11-30 |
Similar Documents
| Publication | Publication Date | Title |
|---|---|---|
| US5837896A (en) | Detection of defects using resonant ultrasound spectroscopy at predicted high order modes | |
| Achenbach et al. | Self-calibrating ultrasonic technique for crack depth measurement | |
| US5351543A (en) | Crack detection using resonant ultrasound spectroscopy | |
| CA2258439C (en) | Ultrasonic lamb wave technique for measurement of pipe wall thickness at pipe supports | |
| US5425272A (en) | Relative resonant frequency shifts to detect cracks | |
| US3916699A (en) | Method and system for vibration testing of objects | |
| US6186006B1 (en) | Method for three-dimensional and non-destructive detection of structures | |
| US6125704A (en) | Ultrasonic technique for inspection of weld and heat-affected zone for localized high temperature hydrogen attack | |
| GB2232487A (en) | Ultrasonic measuring apparatus including a damped transducer probe | |
| US7117134B2 (en) | Method to optimize generation of ultrasound using mathematical modeling for laser ultrasound inspection | |
| US5216921A (en) | Method and apparatus for detecting defects and different-hardness portions of an object with protrusions | |
| US4524621A (en) | Method for measurement of velocity of surface acoustic wave | |
| WO2006110089A1 (en) | Method and apparatus for assessing quality of rivets using ultrasound | |
| US9329155B2 (en) | Method and device for determining an orientation of a defect present within a mechanical component | |
| EP3940338B1 (en) | Characterizing internal structures via ultrasound | |
| US5390544A (en) | Method and apparatus for non-destructive evaluation of composite materials with cloth surface impressions | |
| JPH04323553A (en) | Ultrasonic resonance flaw detection method and equipment | |
| RU2246724C1 (en) | Method of ultrasonic testing of material quality | |
| KR102116051B1 (en) | Pulse-echo nonlinear nondestructive inspection device using array type ultrasonic transducers | |
| RU2191376C2 (en) | Method measuring sizes of defects in process of ultrasonic inspection of articles | |
| KR102106940B1 (en) | Ultrasonic nondestructive inspection device using overtone vibrator | |
| KR101964758B1 (en) | Non-contact nonlinear ultrasonic diagnosis apparatus | |
| KR101963820B1 (en) | Reflection mode nonlinear ultrasonic diagnosis apparatus | |
| KR102786606B1 (en) | Method for measuring surface wave relative nonlinear parameter | |
| Marhenke et al. | Three dimensional sound field computation and optimization of the delamination detection based on the re-radiation |
Legal Events
| Date | Code | Title | Description |
|---|---|---|---|
| AS | Assignment | Owner name:QUATROSONICS, INC., NEW MEXICO Free format text:ASSIGNMENT OF ASSIGNORS INTEREST;ASSIGNORS:RHODES, GEORGE;SCHWARTZ, JAMES J.;THOMAS, DAVID E.;AND OTHERS;REEL/FRAME:008179/0973 Effective date:19950821 | |
| STCF | Information on status: patent grant | Free format text:PATENTED CASE | |
| AS | Assignment | Owner name:QUASAR INTERNATIONAL, NEW MEXICO Free format text:ASSIGNMENT OF ASSIGNORS INTEREST;ASSIGNOR:QUATROSONICS CORPORATION;REEL/FRAME:009845/0765 Effective date:19990326 | |
| FPAY | Fee payment | Year of fee payment:4 | |
| AS | Assignment | Owner name:VVII MANAGEMENT, L.L.C., AS AGENT FOR THE SECURED Free format text:SECURITY AGREEMENT;ASSIGNOR:QUASAR INTERNATIONAL, INC.;REEL/FRAME:014692/0517 Effective date:20030815 | |
| AS | Assignment | Owner name:SILICON VALLEY BANK, CALIFORNIA Free format text:SECURITY AGREEMENT;ASSIGNOR:QUASAR INTERNATIONAL, INC.;REEL/FRAME:014964/0535 Effective date:20040105 | |
| FPAY | Fee payment | Year of fee payment:8 | |
| AS | Assignment | Owner name:QUASAR INTERNATIONAL, INC., NEW MEXICO Free format text:RELEASE;ASSIGNOR:SILICON VALLEY BANK;REEL/FRAME:019009/0839 Effective date:20070301 Owner name:ILLINOIS TOOL WORKS INC., ILLINOIS Free format text:ASSIGNMENT OF ASSIGNORS INTEREST;ASSIGNOR:QUASAR INTERNATIONAL, INC.;REEL/FRAME:018989/0056 Effective date:20070228 | |
| FEPP | Fee payment procedure | Free format text:PAT HOLDER NO LONGER CLAIMS SMALL ENTITY STATUS, ENTITY STATUS SET TO UNDISCOUNTED (ORIGINAL EVENT CODE: STOL); ENTITY STATUS OF PATENT OWNER: LARGE ENTITY | |
| FPAY | Fee payment | Year of fee payment:12 |