US5822058A - Systems and methods for optically measuring properties of hydrocarbon fuel gases - Google Patents
Systems and methods for optically measuring properties of hydrocarbon fuel gasesDownload PDFInfo
- Publication number
- US5822058A US5822058AUS08/784,608US78460897AUS5822058AUS 5822058 AUS5822058 AUS 5822058AUS 78460897 AUS78460897 AUS 78460897AUS 5822058 AUS5822058 AUS 5822058A
- Authority
- US
- United States
- Prior art keywords
- gas
- light
- spectrograph
- natural gas
- determining
- Prior art date
- Legal status (The legal status is an assumption and is not a legal conclusion. Google has not performed a legal analysis and makes no representation as to the accuracy of the status listed.)
- Expired - Lifetime
Links
- 238000000034methodMethods0.000titleclaimsabstractdescription67
- 229930195733hydrocarbonNatural products0.000titleclaimsabstractdescription61
- 150000002430hydrocarbonsChemical class0.000titleclaimsabstractdescription60
- 239000004215Carbon black (E152)Substances0.000titleclaimsabstractdescription46
- 239000002737fuel gasSubstances0.000titleclaimsabstract11
- 239000007789gasSubstances0.000claimsabstractdescription72
- 238000005259measurementMethods0.000claimsabstractdescription63
- 239000000203mixtureSubstances0.000claimsabstractdescription47
- 230000003595spectral effectEffects0.000claimsabstractdescription32
- XUIMIQQOPSSXEZ-UHFFFAOYSA-NSiliconChemical compound[Si]XUIMIQQOPSSXEZ-UHFFFAOYSA-N0.000claimsabstractdescription25
- 229910052710siliconInorganic materials0.000claimsabstractdescription25
- 239000010703siliconSubstances0.000claimsabstractdescription25
- 230000003287optical effectEffects0.000claimsabstractdescription24
- VNWKTOKETHGBQD-UHFFFAOYSA-NmethaneChemical compoundCVNWKTOKETHGBQD-UHFFFAOYSA-N0.000claimsdescription173
- 238000001228spectrumMethods0.000claimsdescription69
- 239000003345natural gasSubstances0.000claimsdescription51
- 238000000862absorption spectrumMethods0.000claimsdescription15
- 238000002835absorbanceMethods0.000claimsdescription13
- 230000008569processEffects0.000claimsdescription10
- 238000012545processingMethods0.000claimsdescription8
- 239000000835fiberSubstances0.000claimsdescription7
- 239000012530fluidSubstances0.000claimsdescription5
- 230000005540biological transmissionEffects0.000claimsdescription3
- 238000004891communicationMethods0.000claimsdescription3
- 238000004880explosionMethods0.000claimsdescription3
- 230000001678irradiating effectEffects0.000claims3
- 230000008878couplingEffects0.000claims2
- 238000010168coupling processMethods0.000claims2
- 238000005859coupling reactionMethods0.000claims2
- 238000002347injectionMethods0.000claims1
- 239000007924injectionSubstances0.000claims1
- 239000000463materialSubstances0.000claims1
- 239000002184metalSubstances0.000claims1
- 238000013459approachMethods0.000abstractdescription7
- 238000009826distributionMethods0.000abstractdescription7
- 238000012544monitoring processMethods0.000abstractdescription4
- OFBQJSOFQDEBGM-UHFFFAOYSA-NPentaneChemical classCCCCCOFBQJSOFQDEBGM-UHFFFAOYSA-N0.000description32
- ATUOYWHBWRKTHZ-UHFFFAOYSA-NPropaneChemical compoundCCCATUOYWHBWRKTHZ-UHFFFAOYSA-N0.000description30
- NNPPMTNAJDCUHE-UHFFFAOYSA-NisobutaneChemical compoundCC(C)CNNPPMTNAJDCUHE-UHFFFAOYSA-N0.000description22
- IJDNQMDRQITEOD-UHFFFAOYSA-Nn-butaneChemical classCCCCIJDNQMDRQITEOD-UHFFFAOYSA-N0.000description21
- OTMSDBZUPAUEDD-UHFFFAOYSA-NEthaneChemical compoundCCOTMSDBZUPAUEDD-UHFFFAOYSA-N0.000description20
- 238000010521absorption reactionMethods0.000description20
- 239000001294propaneSubstances0.000description15
- 239000001282iso-butaneSubstances0.000description11
- QWTDNUCVQCZILF-UHFFFAOYSA-NisopentaneChemical compoundCCC(C)CQWTDNUCVQCZILF-UHFFFAOYSA-N0.000description10
- 238000002834transmittanceMethods0.000description10
- 238000012937correctionMethods0.000description9
- 238000005284basis setMethods0.000description8
- 238000009530blood pressure measurementMethods0.000description8
- 238000004364calculation methodMethods0.000description7
- 235000013405beerNutrition0.000description6
- 235000013844butaneNutrition0.000description6
- 239000011261inert gasSubstances0.000description6
- 238000002360preparation methodMethods0.000description6
- 238000004458analytical methodMethods0.000description5
- AFABGHUZZDYHJO-UHFFFAOYSA-Ndimethyl butaneNatural productsCCCC(C)CAFABGHUZZDYHJO-UHFFFAOYSA-N0.000description5
- 125000000524functional groupChemical group0.000description5
- 238000004519manufacturing processMethods0.000description5
- 230000008901benefitEffects0.000description4
- 230000000875corresponding effectEffects0.000description4
- 230000006870functionEffects0.000description4
- 230000004044responseEffects0.000description4
- 238000003860storageMethods0.000description4
- 239000000126substanceSubstances0.000description4
- 238000003491arrayMethods0.000description3
- 238000005516engineering processMethods0.000description3
- CKMDHPABJFNEGF-UHFFFAOYSA-Nethane methane propaneChemical compoundC.CC.CCCCKMDHPABJFNEGF-UHFFFAOYSA-N0.000description3
- 238000002474experimental methodMethods0.000description3
- 230000006872improvementEffects0.000description3
- 238000010586diagramMethods0.000description2
- 238000009434installationMethods0.000description2
- 238000012417linear regressionMethods0.000description2
- VLKZOEOYAKHREP-UHFFFAOYSA-Nn-HexaneChemical classCCCCCCVLKZOEOYAKHREP-UHFFFAOYSA-N0.000description2
- -1natural gasesChemical class0.000description2
- 230000009897systematic effectEffects0.000description2
- 238000011481absorbance measurementMethods0.000description1
- 230000003466anti-cipated effectEffects0.000description1
- 238000009529body temperature measurementMethods0.000description1
- 239000001273butaneSubstances0.000description1
- HOWJQLVNDUGZBI-UHFFFAOYSA-Nbutane;propaneChemical compoundCCC.CCCCHOWJQLVNDUGZBI-UHFFFAOYSA-N0.000description1
- 238000002485combustion reactionMethods0.000description1
- 230000002596correlated effectEffects0.000description1
- 230000001351cycling effectEffects0.000description1
- 238000000354decomposition reactionMethods0.000description1
- 238000001514detection methodMethods0.000description1
- 238000011161developmentMethods0.000description1
- 230000009365direct transmissionEffects0.000description1
- WIZOZORCIQKFQD-UHFFFAOYSA-Nethane methaneChemical compoundC.C.C.C.C.C.CCWIZOZORCIQKFQD-UHFFFAOYSA-N0.000description1
- MEKDPHXPVMKCON-UHFFFAOYSA-Nethane;methaneChemical compoundC.CCMEKDPHXPVMKCON-UHFFFAOYSA-N0.000description1
- 239000000284extractSubstances0.000description1
- 238000001914filtrationMethods0.000description1
- 239000000446fuelSubstances0.000description1
- 238000004817gas chromatographyMethods0.000description1
- 230000005484gravityEffects0.000description1
- 238000009499grossingMethods0.000description1
- 238000012423maintenanceMethods0.000description1
- 238000000691measurement methodMethods0.000description1
- 238000010926purgeMethods0.000description1
- 238000005070samplingMethods0.000description1
- 238000012546transferMethods0.000description1
Images


Classifications
- G—PHYSICS
- G01—MEASURING; TESTING
- G01N—INVESTIGATING OR ANALYSING MATERIALS BY DETERMINING THEIR CHEMICAL OR PHYSICAL PROPERTIES
- G01N21/00—Investigating or analysing materials by the use of optical means, i.e. using sub-millimetre waves, infrared, visible or ultraviolet light
- G01N21/17—Systems in which incident light is modified in accordance with the properties of the material investigated
- G01N21/25—Colour; Spectral properties, i.e. comparison of effect of material on the light at two or more different wavelengths or wavelength bands
- G01N21/31—Investigating relative effect of material at wavelengths characteristic of specific elements or molecules, e.g. atomic absorption spectrometry
- G01N21/35—Investigating relative effect of material at wavelengths characteristic of specific elements or molecules, e.g. atomic absorption spectrometry using infrared light
- G01N21/359—Investigating relative effect of material at wavelengths characteristic of specific elements or molecules, e.g. atomic absorption spectrometry using infrared light using near infrared light
- G—PHYSICS
- G01—MEASURING; TESTING
- G01N—INVESTIGATING OR ANALYSING MATERIALS BY DETERMINING THEIR CHEMICAL OR PHYSICAL PROPERTIES
- G01N21/00—Investigating or analysing materials by the use of optical means, i.e. using sub-millimetre waves, infrared, visible or ultraviolet light
- G01N21/17—Systems in which incident light is modified in accordance with the properties of the material investigated
- G01N21/25—Colour; Spectral properties, i.e. comparison of effect of material on the light at two or more different wavelengths or wavelength bands
- G01N21/31—Investigating relative effect of material at wavelengths characteristic of specific elements or molecules, e.g. atomic absorption spectrometry
- G01N21/35—Investigating relative effect of material at wavelengths characteristic of specific elements or molecules, e.g. atomic absorption spectrometry using infrared light
- G01N21/3504—Investigating relative effect of material at wavelengths characteristic of specific elements or molecules, e.g. atomic absorption spectrometry using infrared light for analysing gases, e.g. multi-gas analysis
- G—PHYSICS
- G01—MEASURING; TESTING
- G01N—INVESTIGATING OR ANALYSING MATERIALS BY DETERMINING THEIR CHEMICAL OR PHYSICAL PROPERTIES
- G01N33/00—Investigating or analysing materials by specific methods not covered by groups G01N1/00 - G01N31/00
- G01N33/0004—Gaseous mixtures, e.g. polluted air
- G01N33/0009—General constructional details of gas analysers, e.g. portable test equipment
- G01N33/0027—General constructional details of gas analysers, e.g. portable test equipment concerning the detector
- G01N33/0036—General constructional details of gas analysers, e.g. portable test equipment concerning the detector specially adapted to detect a particular component
- G01N33/0047—Organic compounds
- G—PHYSICS
- G01—MEASURING; TESTING
- G01N—INVESTIGATING OR ANALYSING MATERIALS BY DETERMINING THEIR CHEMICAL OR PHYSICAL PROPERTIES
- G01N33/00—Investigating or analysing materials by specific methods not covered by groups G01N1/00 - G01N31/00
- G01N33/26—Oils; Viscous liquids; Paints; Inks
- G01N33/28—Oils, i.e. hydrocarbon liquids
- G01N33/2829—Mixtures of fuels
- G—PHYSICS
- G01—MEASURING; TESTING
- G01N—INVESTIGATING OR ANALYSING MATERIALS BY DETERMINING THEIR CHEMICAL OR PHYSICAL PROPERTIES
- G01N33/00—Investigating or analysing materials by specific methods not covered by groups G01N1/00 - G01N31/00
- G01N33/22—Fuels; Explosives
Definitions
- a key requirement for efficient and cost-effective use of natural gasis the ability for real-time, on-line monitoring of its chemical composition and BTU (i.e., energy, caloric or thermal) content. Monitoring is required along the entire distribution network, from gas storage and distribution facilities to industrial consumers.
- BTUi.e., energy, caloric or thermal
- Calorimeters and gas chromatographsare currently used for this purpose; however, they require sheltering from the elements and removal of samples from the pipeline, they have a slow response (1 minute or greater), and they are expensive in terms of initial cost (around $20,000 each for a GC), installation, and required maintenance.
- calorimetersdo not measure the gas composition, which is needed to calculate such properties as the dew point, compressibility, and Wobbe index.
- the present inventionis directed to a rugged, inexpensive and maintenance-free optical sensor having a BTU measurement accuracy that matches currently-available systems.
- the present inventionrelates to a BTU and composition sensor for fluid hydrocarbons using an innovative optical approach.
- the approachinvolves a spectral measurement of absorption bands of the hydrocarbon components (principally methane and ethane, with smaller amounts of propane, butanes, and pentanes) at near-visible wavelengths with available, low-cost silicon detector technology.
- the spectral measurementyields both the total BTU content and compositional information, including the concentration of methane and combinations of the higher hydrocarbons.
- a preferred embodiment of the inventionis a sensor for natural gas pipelines that can be for either indoor or outdoor installation, has a fast time response (10 seconds or less), and complies with the Class 1, Division 1 safety requirements.
- the first advantageis low fabrication cost. Dramatic cost and performance improvements in silicon array detectors such as charge coupled devices (CCDs), CID and CMOS detectors and the associated processing electronics, which are mass-produced for video cameras, permit rugged, compact, and inexpensive spectrograph systems to be constructed that have excellent response and resolution at near-visible wavelengths (700-1000 nm). With this type of optical system, methane spectral structure can be resolved, providing an automatic wavelength reference. Furthermore, the absorption strengths in this spectral region are closely correlated with BTU content, making a complete compositional analysis unnecessary.
- Lower-resolution IR techniquesfor example, those employing multiple discrete detectors, light sources, or filters, can aid in lowering the manufacturing cost, but these techniques pose difficult and expensive calibration problems due to nonlinear dependencies of absorbance on number density as well as sensor-to-sensor differences in the response of each wavelength channel.
- a second advantage of the present inventionis simplicity of calibration.
- the 2 nm FWHM resolution of a CCD spectrographis sufficient to resolve the methane spectral structure, providing an automatic wavelength reference which eliminates calibration problems that have occurred in previous field instruments.
- the observed linearity of absorbance with number density(Beer's law behavior), which does not hold well at longer wavelengths and lower resolution, greatly simplifies both the development of the instrument and the calibration of individual sensors. For example, instead of requiring an empirical chemometric calibration, which involves preparing perhaps 50 different component mixtures and measuring each manufactured sensor at multiple pressures and temperatures, only one or two measurements for each-pure hydrocarbon at a given temperature are required to be performed only for one sensor to define a complete and robust calibration valid for all of the sensors. Small differences among individual sensors in a production run, which are related to the path length, wavelength registration, pressure reading, etc., can all be taken into account by calibrating each sensor on only one or two standard BTU gases.
- a third advantageis the operational simplicity afforded by using a two-dimensional detector array, which enables the simultaneous acquisition of both sample and reference spectra.
- prior art systems employing either linear arrays or multiple discrete detectorscan take only one spectrum at a time, and therefore require continuous cycling between sample and reference gases in order to generate an accurate absorbance measurement.
- a two-dimensional IR arrayavoids this sampling complication.
- Furthermore obtaining simultaneous sample and reference spectraobviates the requirement to maintain a constant detector array temperature during the cycle between separate sample and reference spectra.
- a preferred embodiment of the present inventionis directed to an apparatus and method for measuring properties of natural gases.
- the apparatus of the inventioncomprises a light source for generating light at near-visible wavelengths.
- a measurement cellin fluid communication with a pipeline and containing a hydrocarbon fuel natural gas sample is optically coupled to the light source.
- Light from the light sourceinterrogates the gas in the cell.
- a spectrographreceives the transmitted light and can include a grating for dispersing the light.
- a sensor responsive to the dispersed lightcollects an electronic spectral representation thereof. Electronics processes the collected representation to determine properties of the gas.
- the determined propertiesinclude BTU (energy) content and composition of the natural gas sample.
- the sensorpreferably comprises a silicon sensor array, for example a two-dimensional CCD array.
- the light generated by the sourceis preferably divided into a sample beam for interrogation of the sample and a reference beam for direct transmission into the spectrograph. Both beams are processed by the spectrograph and used for subsequent calculations.
- the wavelength of the light sourceis preferably in the range between 700 and 1000 nm.
- the spectral resolutionis preferably sufficient to resolve structure in the methane absorption band near 900 nm.
- FIG. 1is a schematic block diagram of a preferred embodiment of the present invention.
- FIGS. 2-6are graphical illustrations of absorption coefficients of methane, ethane, propane, n-butane and isobutane as a function of wavelength.
- FIGS. 7A-7Dare schematic diagrams of process flow sequences in accordance with the invention.
- FIG. 8is a graphical illustration of the absorption coefficient of N-pentane and a least squares fit in accordance with the invention.
- FIG. 9is a graphical illustration of the absorption coefficient of isopentane and a least squares fit in accordance with the invention.
- FIG. 10Agraphically illustrates results for an experiment conducted in accordance with the apparatus and method of the present invention.
- FIG. 10Bgraphically illustrates estimated BTU measurement errors.
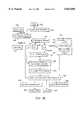
- the sensor apparatus of the present inventionis illustrated schematically in FIG. 1.
- the sensorcomprises two compact modules, an electronics module 20 and a sample module 22.
- the electronics module 20includes a light source 24, a spectrograph 26, and electronics 28 preferably in an explosion resistant housing 60.
- the sample module 22comprises a gas sample cell 30 that can also be included in housing 60. Fiber optics 32 optically link the sample module 22 to the electronics module 20. Natural gas is drawn from pipeline 41 into the cell 30.
- the gas flowcan be automatically controlled from module 20 via valve 45, or may be separately controlled, or may be controlled passively, such as with a pressure regulator or a flow constrictor.
- the gascan be directed out of the cell 30 through outflow line 55 which can have a second valve and/or pump.
- Valve 45can also be used to introduce a second gas for calibration or purging.
- the fiber optics 32can include two paths, a sample path 35 and a reference path 38.
- the sample path 35directs the light into the sample cell 30, which preferably has an absorption path length in the range of 50-150 cm.
- the sample path 35includes a transmission path 36 for transmitting light to the sample cell 30 and a return path 34 for returning the light transmitted through the sample, known as the sample beam, to the electronics module 20.
- the reference path 38returns emitted light directly back into the electronics module 20 to serve as a reference beam alongside the sample beam.
- a spectrograph 26 in the electronics module 20processes the reference beam and sample beam.
- the spectrograph 26preferably comprises a concave holographic grating 48 for dispersing the light and a CCD array 46 for detection of the dispersed light.
- the sample and reference spectrawhich fall on different portions of the array, are read out using the CCD array video electronics 46 and delivered to a microprocessor 28.
- the absorption spectrum of the sampleis calculated from the ratio of the sample and reference spectra and a pre-recorded ratio for the cell 30 filled with a non-absorbing gas or evacuated.
- a fitting methodprocesses the spectrum and determines the number densities of the distinguishable hydrocarbon components in the sample. This information is combined with temperature 40 and pressure 42 data, from which the sum of the non-absorbing species, typically O 2 , N 2 , CO 2 , and He is inferred.
- the temperature data 40are preferably collected at a temperature sensor such as a thermocouple or thermistor 50 at the input port of the cell 30 and the pressure data 42 are preferably collected at a pressure transducer 52 at the cell 30 output port.
- Sensor outputpreferably includes both the BTU content and chemical composition information including: mole fractions of methane, ethane, propane; total non-absorbing species; and combinations of the higher hydrocarbons.
- the system of the present inventionprovides on-line, optically-based sensors for natural gas BTU content and chemical composition which can be installed in storage, transmission, and distribution facilities in a cost-effective manner. Due to the wide variation in chemical composition of natural gas, the measurements of BTU at all major custody transfer points is essential for effective natural gas utilization. The economic value of the natural gas is determined by the BTU content and the volume transferred. To ensure accurate pricing and protection of small profit margins, the BTU measurement accuracy is preferably within a tolerance of 1%. In addition, knowledge of the composition enables calculation of other properties such as compressibility, dew point and the Wobbe index.
- the optically-based BTU and composition sensor of the present inventionaddresses this need by employing relatively inexpensive silicon CCD detector arrays and associated electronics.
- This low cost technologyallows for the production of accurate, reliable sensors at a fraction of the initial and operating costs of current BTU-measuring systems.
- the reduced costmakes it feasible to install many more sensors, for example a sensor at each feed line in a distribution system, and therefore monitor the calorific value of the natural gas at various locations along the distribution chain with greater precision. This leads to greater efficiency in gas production and more uniform BTU content for the end user.
- the measurement method of the present inventionincludes the step of first acquiring an absorption spectrum of a natural gas sample in a region around 900 nm using a broad-band light source and a small spectrograph having a silicon CCD array detector as shown in FIG. 1, described above. Following this, the spectrum is decomposed into distinguishable, known hydrocarbon component spectra. The component mole fractions or concentrations are calculated from the magnitudes of the component spectra with the aid of the temperature and pressure measurements, and the BTU value is calculated for the desired temperature and pressure condition using the mole fraction values.
- the absorbanceis essentially linear with the species number densities. It therefore follows that the spectra of hydrocarbon mixtures are the sum of the number density-weighted spectra of the pure species. Small corrections account for any deviation from linearity and for temperature-dependencies of the spectra.
- a preferred method of analyzing the datacan be described in the following manner.
- optical transmittanceis defined by the ratio of transmitted light intensities at a given wavelength over the same optical path with the sample present (I) and absent (I 0 )
- R/R 0can be replaced with a fit.
- the absorbance at each wavelengthis linearly related to the species number densities:
- Lis the path length
- ⁇ i and ⁇ iare respectively, the absorption coefficients and number densities of the species I
- ⁇denotes the sum over I.
- the number densityis related to the pressure P and Kelvin temperature T via the non-ideal gas law
- Ris the gas constant and Z is the compressibility function evaluated for the pressure, temperature, and composition conditions.
- Implicit in Eq. (3)is the assumption that the absorption coefficient for a given temperature does not depend on the number density (i.e., pressure). Accordingly, the determination of the sample composition (i.e., the ⁇ i ) and hence the BTU value is reduced to a decomposition of the absorbance spectrum into pure-species, spectra which have been separately measured.
- Eq. (3)provides an accurate approximation for all natural gas components in the 819-980 nm region except methane. For methane, which has a somewhat structured spectrum, there is some dependence of the structure on number density; however, there is no measurable density-dependence of the integrated absorption coefficient (see below). As a result, even for methane the number densities derived using Eq. (3) are not very sensitive to the conditions under which the pure component spectrum is taken.
- ⁇ Tis calculated from the sample pressure using Eq. (4) rather than by simply summing the optically determined hydrocarbon species densities because of the likely presence of "inert" gases such as He, N 2 , O 2 and CO 2
- the compressibility Z in Eq. (4)can be calculated from the measured pressure and temperature and the sample composition. With an unknown sample, an initial estimate of the hydrocarbon and total inert gas mole fractions can be made, then the Z value and species mole fractions can be iterated several times to converge the results.
- the species number densities ⁇ ican be obtained from the sample spectrum via a standard linear regression (least-squares) fit to Eq. (3).
- the pure methane reference spectrum measured at the nearest methane number densitycan be used.
- two alternate approachescan be employed. The first is to zero the average absorbance in the 816-830 nm region, where there is no appreciable absorption by any of the gas species. This approach can be used to generate accurate pure-species spectra.
- the second approach, which can be used in analyzing the mixed samples,is to include a baseline offset as an additional free parameter in the fit.
- the wavelength range of the fitcan be 840-960 nm, corresponding to the approximate limits of the main absorption bands. However, very similar results are obtained by fitting to a smaller range of 850-950 nm.
- a process for analyzing the datais illustrated in connection with the process flow sequences of FIGS. 7A-7D.
- the sampleis measured, and the resulting spectrum (or spectra) is electronically stored in memory.
- the spectrumis decomposed or deconvoluted into densities ⁇ i of discrete components, regression and/or correction subroutines are performed and temperature dependence of the spectra is accounted for as needed.
- Mole fractionsare determined by combining the ⁇ i , the pressure measurement, and a compressibility calculation.
- the energy (BTU) content of the sampleis then determined, and the composition and energy content are then displayed for the user, are recorded, or are forwarded from the remote collection site to a central site for further processing and storage.
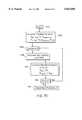
- a process 100 for performing the measurement and analyzing the datais illustrated in FIG. 7A.
- the softwareis initiated 102 by the user or automated to periodically or continuously sample the fluid flow. The choice is made between operating the system in sample or calibrate mode 104. If sample mode is chosen, the pipeline gas sample 106 is introduced into the sample cell of the sensor by the gas delivery system 108; if calibrate mode is chosen, the null (calibration) gas 110 is chosen, which is preferably a non-absorbing gas as such as air. The gas is measured 112 by the sensor, resulting in the measurement of the pressure and temperature 114, and the ratio I/R 116 of the sample path to reference path spectra. In calibrate mode, this ratio is stored in the computer memory 118 as I 0 /R 0 data 120.
- this ratiois combined with the prestored I 0 /R 0 to calculate the spectral absorbance A 126.
- the absorbanceis then decomposed 128 into the hydrocarbon component densities ⁇ i using pre-stored library spectra 122 at different temperatures and pressures. If desired as an output, the BTU content per unit volume at the measurement pressure and temperature can then be computed 130.
- the component mole fractionsare calculated 134. This calculation makes use of a method for calculating the compressibility, Z, at the measurement temperature and pressure for a given hydrocarbon component and inert gas mole fractions.
- This methodcan include the use of a look-up table or formula derived from a survey of natural gas composition for estimating mole fraction values for each inert gas from the hydrocarbon component mole fractions, the total inert gas mole fraction, or other factors, and a process for calculating Z from these estimates.
- the Z calculation procedureis preferably the 1992 American Gas Association Report No. 8 method, which is incorporated herein by reference.
- the mole fractionsare used to calculate 136 the BTU content under standard conditions, such as by using Eq. (5).
- the mole fraction composition 142, the BTU or thermal content 138, and the compressibility 140are then displayed for the user, recorded, or forwarded to another site for further processing and storage.
- FIG. 7Billustrates in detail the method for measuring the sample initiated at 200.
- the silicon detector array exposures for the sample and reference light beamsare acquired 202, digitized and stored 204 as images.
- the corresponding sample and reference dark exposuresi.e., with the light source turned off or blocked
- a preset number, Nof such exposures are performed 210 and are summed 212.
- the detector arraysare 2-dimensional, for each image the readings from the pixels in the "vertical", dimension (defined to be the dimension perpendicular to the axis along which the wavelengths are dispersed) are summed 214, to yield the corresponding spectrum.
- the ratio I/Ris calculated 216 from the ratio of the dark-spectrum-subtracted sample and reference spectra and output 222.
- the pressure P and temperature T in the sample cellare also measured 218 and output 220.
- the images to be summedare taken with differing exposure times, so as to maximize the signal to noise ratio and minimize the digitization bit noise.
- FIG. 7Cillustrates in detail the method 300 for decomposing the spectrum into hydrocarbon component number densities.
- the absorbance spectrumcan be pre-processed 302 by digital filtering, for example, to remove noise.
- the library spectrawhich are tabulated for different temperatures and (at least for methane) pressures are selected or interpolated 304 based on the measured temperature and pressure.
- a method for compensating 306 for any wavelength shift of the spectrograph relative to a trial spectrum generated from the libraryis then applied. This method can consist of a routine which locates methane spectral peaks and/or valleys in the measured spectrum, compares them with the library spectra, determines the shift, and applies the shift to the library spectra.
- the methodcan generate a component, consisting of the difference between two spectra shifted in different directions, which is then passed on to the least-squares fit algorithm.
- a correction 308 for absorbance non-linearityis applied if necessary.
- the resulting spectrum, the library spectra, and the optional difference spectrumare passed to a least-squares fitting routine 310 which extracts the hydrocarbon component number densities ⁇ i . If the trial spectrum used in the wavelength shift compensation and non-linearity corrections is very different from the actual spectrum, it may be necessary to perform one or more iterations 312 of the wavelength-compensation, non-linearity correction, and least-squares fitting steps.
- the component densitiesare then stored 314.
- FIG. 7Dillustrates in detail a method initiated at 400 for determining the component mole fractions.
- trial mole fraction value for the total "inert" gases(124 in FIG. 7A) is combined with the trial hydrocarbon species mole fractions which are calculated 402 as indicated.
- the resultsare used to compute the compressibility 404.
- the result 406is then used to calculate the total density, ⁇ 408.
- new mole fraction valuesare calculated 410 as shown.
- a decision on whether to iterate 412 the calculation of the compressibility and mole fractionsis made based on the differences between the new and trial mole fraction values.
- the final mole fraction and compressibility valuesare then output 414.
- the spectra of these five speciesare completely distinguishable from each other.
- the spectra of propane and the butanesdiffer from each other by virtue of their different numbers of the three molecular functional groups, CH 3 ; CH 2 CH, which absorb near 910 nm, 925 nm, and 935 nm, respectively.
- n-pentane and isopentanewhich are present in natural gas in small quantities (usually 1% or less), are shown in FIGS. 8 and 9.
- the relatively high noise levelsare due to the subatmospheric pressures of the samples, which were close to the room-temperature equilibrium vapor pressures.
- the pentanescontain the same functional groups as the five more abundant hydrocarbon species, and as a result their spectra cannot necessarily be distinguished from linear combinations of them.
- least-squares fits of the pentane spectrawere performed using the five abundant pure species spectra. The results are shown in FIGS. 8 and 9. Over virtually the entire wavelength range the fits agree with the data to within the noise level of the measurements.
- the combination coefficients of the fitsare listed in Table 1 below along with their corresponding BTU values (i.e., the sum of the coefficient-weighted pure-species BTU's).
- the near-zero coefficients for methaneindicate that methane remains completely distinguishable from the pentanes as well as from ethane, propane, and the butanes.
- the best-fit combination BTU valueis 8% below the actual BTU value of about 4006, while for isopentane it is 16% below the actual BTU value of about 3998.
- these differenceswill result in an underestimation of the BTU derived from a spectral fit to methane, ethane, propane, n-butane, and isobutane components.
- the errorscales with the pentane mole fraction, which is small.
- the erroris much smaller.
- the BTU errors resulting from the use of the five-species bases setis negligible due to the very low concentrations of these species.
- the above spectral measurementsindicate that the number of distinguishable spectral components that can be extracted from the sample spectrum, typically five, is fewer than the total number of hydrocarbon species that may be present in natural gas. Therefore, there is some ambiguity in the derived composition.
- the BTU valuecan still be calculated accurately as long as there is a direct correspondence between the spectrum and the BTU. Such a correspondence is indicated by observations that: (1) the spectra of the non-methane hydrocarbons can be approximated as sums of spectra of the three molecular functional groups, CH, CH 2 , CH 3 ; and (2) the hydrocarbon BTU values can be accurately represented as a sum of the functional group BTUs.
- a fifth spectral componentcan also be distinguished. Since linear combinations can be taken, an arbitrary basis set can be constructed from these components.
- An example of the basis setis the spectra of methane, ethane, and the CH, CH 2 , and CH 3 groups.
- the basis componentscan alternatively be considered to be the spectra of the five most abundant hydrocarbons, which are methane, ethane, propane, n-butane, and isobutane.
- the pentane and higher hydrocarbon number densitiesare expressed as linear combinations of ethane, propane, and the butanes (the methane coefficients are close to zero).
- This approachis more convenient than using the functional group basis set, since it directly yields an "effective" hydrocarbon composition, from which one can accurately calculate the sample compressibility.
- An alternative basis setwhich produces virtually identical compressibilities and BTUs but more realistic number densities for the higher hydrocarbons, can consist of the spectra of methane, ethane, propane, a combination of the higher linear hydrocarbons in specified relative proportions, and a combination of the higher branched hydrocarbons in specified relative proportions.
- the sample BTU, or thermal content, valueis calculated by summing the BTUs for the five basis species weighted by the measured mole fractions.
- the BTU values for the linear combinations that represent the pentanesare comparable to the actual BTU's, and similar results occur for the higher hydrocarbons.
- the best overall accuracy using the pure hydrocarbon basis setis achieved by small, empirical adjustment (by several percent) of the BTU values assigned to the n-butane and isobutane spectral components.
- both the methane and the "inert" gas mole fractionscan be provided with an accuracy comparable to that of the BTU value.
- the mole fraction accuracywill depend on the choice of basis set, and is estimated to be in the 0.10% mole fraction range.
- FIG. 10AOne example of a measured spectrum and the least-squares fit is shown in FIG. 10A. Above around 30 atm pressure, the data vs.-fit differences are almost entirely in the structured part of the methane band. At lower pressures, this part of the spectrum is more accurately fit, which tends to make the overall error smaller despite some loss of signal-to-noise due to the smaller absorption. The absorption can be increased by using a longer optical path, which further improves the measurement accuracy.
- the optically measured BTU valuesare seen to be in excellent absolute agreement (within an average of -0.3%) with that calculated from the preparation procedure.
- the measurement precisionis ⁇ 0.4%.
- the mole fraction accuracy and precisionare similar to these values. The former is well within the accuracy of the sample reparation, while the latter is consistent with a transmittance measurement precision of about 0.001.
- optically measured species mole fractionsagree with the "prepared" values to within 0.01 for propane and methane and within 0.004 or better for ethane and n-butane.
- most of the difference between the measured and "prepared" compositionmay be due to gas preparation error rather than optical measurement error.
- the sample composition reported by the supplieris 70.41% methane, 9.00% ethane, 6.01% propane, 3.00% n-butane, 3.00% isobutane, 1.01% n-pentane, 5.02% N 2 , 1.04% CO 2 , and 0.50% He.
- the optical analysisreports the pentanes in terms of other components; the "actual effective" mole fractions and BTU value in Table 4 assume that the pentanes are represented as the linear combinations given in Table 2. The differences between these values and the measured ones are due to measurement errors.
- the true BTU value for a natural gas sampleis approached by replacing the n-butane and isobutane BTU values with empirically adjusted ones.
- the resultis an average measured BTU value of 1286. This is 0.8% below the actual value of 1296.
- the main sources of error in this measurementare transmittance measurement error and pressure measurement error.
- the BTU error associated with the transmittance measurement accuracyis about 0.5%.
- the slightly larger observed errorsare not surprising when the pressure measurement accuracy is considered.
- the pressure measurementis accurate to within 1.5 psi, or 0.7% of the sample pressure.
- the sources of error in the optical BTU measurementcan be divided into (1) systematic errors that can be compensated by calibration of the sensor with reference gases, and (2) other errors inherent in the technique. Compensatable errors amount to less than 1% of the BTU value. They include measurement errors associated with the pure species spectra, possible deviations from Beer's law, and pressure gauge inaccuracy. The latter two errors are not expected to be sensitive to the sample composition, and all of them can be compensated by calibrating the sensor using one or two known BTU gas mixtures. The pressure measurement accuracy can be improved by proper selection of the gauge to match the range of sample pressures. The selection of the preferred sample pressure is discussed below. The remaining sources of error determine the ultimate performance of the sensor. They include:
- the transmittance measurement precisiondenoted d.sub. ⁇
- d.sub. ⁇The transmittance measurement precision
- Ais the peak absorbance, which is proportional to the optical path length and sample pressure.
- the erroris plotted as a function of sample pressure in FIG. 10B for two different path lengths, 0.6 m and 1.2 m; the peak absorption coefficient for a mostly-methane sample is assumed.
- the error estimated for the shorter path with pressures above 14 atm (around 200 psi)is 0.5% and is consistent with measurements on the binary and Certified Master Gas mixtures. With the longer path, the error is reduced except at very high pressures.
- Hydrocarbon ambiguity errorrefers to the BTU error associated with the presence of n>4 hydrocarbons which are not directly measured but are instead subsumed under the other components.
- Wecan roughly estimate this error based on (1) zeroing the BTU error for the mean pentane/butane ratio of about 1:3 by adjusting the n-butane and isobutane BTU's as discussed in Section 2.3, (2) assuming a maximum 50% deviation from this ratio over the range of natural gas samples, and (3) assuming a maximum 1.5% total concentration of butanes. The resulting fractional BTU error is 0.1%.
- natural gascontains small amounts of other, "inert” gases, chiefly N 2 , CO 2 , and He. Although these gases have no heat content, they do affect the compressibility, Z, which enters into the BTU calculation through Eq. (4). Different assumptions about their proportions lead to slightly different Z values, which in turn lead to slightly different calculated number densities at the pressure to which the BTU value is referenced.
- the worst-case uncertainty in Zis approximately ⁇ 0.01% per atm of the difference between the measurement pressure and the BTU reference pressure. Assuming that the BTU reference pressure is 1 atm, the BTU uncertainty is shown by the dashed line in FIG. 10B. For better accuracy, an auxiliary measurement of the CO 2 or specific gravity can be included. If the BTU value is to be referenced to the pressure of the measurement, there is no error due to Z uncertainty.
- the projected total BTU measurement erroris approximated as the RMS sum of the above three independent errors.
- the projectionis shown in FIG. 10B and it indicates that the optimum performance can be obtained at sample pressures of 15-25 atm (220-368 psi).
- the erroris 0.3%, matching the capability of the best on-line GC instruments.
- a worst-case estimate of the total erroris given by the direct sum of the errors, which is 0.6%. This is still well within the performance target of less than 1%.
- Table 6summarizes the error analysis at 14 atm.
Landscapes
- Chemical & Material Sciences (AREA)
- Physics & Mathematics (AREA)
- Health & Medical Sciences (AREA)
- Life Sciences & Earth Sciences (AREA)
- General Physics & Mathematics (AREA)
- Engineering & Computer Science (AREA)
- Biochemistry (AREA)
- General Health & Medical Sciences (AREA)
- Spectroscopy & Molecular Physics (AREA)
- Immunology (AREA)
- Pathology (AREA)
- Analytical Chemistry (AREA)
- Food Science & Technology (AREA)
- Medicinal Chemistry (AREA)
- Combustion & Propulsion (AREA)
- Chemical Kinetics & Catalysis (AREA)
- General Chemical & Material Sciences (AREA)
- Oil, Petroleum & Natural Gas (AREA)
- Investigating Or Analysing Materials By Optical Means (AREA)
Abstract
Description
τ=I/I.sub.0 (1)
τ=(I/I.sub.0)/(R/R.sub.0) (2)
A=LΣσ.sub.i ρ.sub.i (3)
ρRT=P/Z (4)
BTU Value=4.74 ΣX.sub.i H.sub.i /z.sub.o (5)
TABLE 1 ______________________________________ Coefficients of pentane spectra in terms of methane, ethane, propane, n-butane, and isobutane components. Values are averages of least-squares fits to three measurements Methane Ethane Propane N-butane Total BTU ______________________________________ N-pentane -0.007 -0.154 -0.180 0.045 1.021 3690 Isopentane -0.053 0.309 -0.241 0.542 1.082 3347 ______________________________________
TABLE 2 ______________________________________ Summary of BTU and Composition Measurements Sample BTU P/Z Range Mole Fraction Mean BTU BTU Mixture Value (psi) Accuracy.sup.a Accuracy Precision ______________________________________ methane + 1089.sup.b 330-782 0.006 0.3% 0.4% ethane methane + 1191.sup.b 248-904 .sup.c .sup.d 0.5% ethane + propane + n-butane GPA 1296.sup.e 192-218 0.005 0.8% 0.3% Reference ______________________________________ .sup.aRange of all measurements .sup.bCalculated from sample preparation procedure .sup.c0.012 including sample preparation uncertainty .sup.d1.1% including sample preparation uncertainty .sup.eComposition certified by GC analysis
TABLE 3 ______________________________________ Results from optical measurements on a prepared 89.5% methane/10.5% ethane mixture Mole Fractions P/Z (psi) Methane Ethane Total BTU Value ______________________________________ 782 0.890-0891.sup.a 0.102-0.103.sup.a 0.996-0.997.sup.a 1087.sup.a 690 0.894 0.104 1.000 1090 569 0.889 0.104 0.994 1082 450 0.890-0892.sup.b 0.102-0.104.sup.b 0.996-1001.sup.b 1085-1086.sup.b 330 0.901 0.100 1.001 1085 Prepared 0.895 0.105 1.000 1089 ______________________________________ .sup.a Range of three measurements. .sup.b Depending on pressure of methane component in fit.
TABLE 4 ______________________________________ Results from optical measurements on a prepared four-component mixture Mole Fractions BTU P/Z (psi) Methane Ethane Propane N-butane Total Value ______________________________________ 904 0.851 0.072 0.048 0.028 1.001 1206 903 0.851 0.070 0.049 0.029 1.001 1205 697 0.848 0.071 0.048 0.029 0.997 1199 528 0.847 0.072 0.044 0.032 0.997 1204 364 0.854 0.072 0.043 0.032 1.002 1202 248 0.853 0.072 0.038 0.035 1.002 1211 Prepared 0.859 0.072 0.037 0.032 1.000 1191 ______________________________________
TABLE 5 ______________________________________ Results from optical measurements on the GPA Reference Certified Master Gas Mole Fractions BTU P/Z (psi) Methane Ethane Propane N-butane Isobutane Value ______________________________________ 200. 0.701 0.090 0.054 0.046 0.041 1282 192. 0.704 0.087 0.052 0.045 0.041 1273 218. 0.708 0.086 0.057 0.043 0.039 1275 Actual 0.704 0.092 0.056 0.048 0.036 1286 effective ______________________________________
Percent BTU error=100 d.sub.τ exp(A)/A
TABLE 6 ______________________________________ BTU Error Analysis for Operation at 20 atm (294 psi) Pressure Source of Error Estimated Value ______________________________________ Transmittance Uncertainty (0.6 m path) 0.4% (1.2 m path) 0.3% Hydrocarbon Ambiguity 0.1% Inert Gas Ambiguity 0.2% Net Error (1.2 m path) Worst-Case (Direct Sum) 0.6% Probable (Total RMS) 0.3% ______________________________________
Claims (60)
Priority Applications (6)
| Application Number | Priority Date | Filing Date | Title |
|---|---|---|---|
| US08/784,608US5822058A (en) | 1997-01-21 | 1997-01-21 | Systems and methods for optically measuring properties of hydrocarbon fuel gases |
| PCT/US1997/021503WO1998032003A1 (en) | 1997-01-21 | 1997-11-20 | Systems and methods for optically measuring properties of hydrocarbon fuel gases |
| EP97946698AEP1009998A1 (en) | 1997-01-21 | 1997-11-20 | Systems and methods for optically measuring properties of hydrocarbon fuel gases |
| AU51814/98AAU5181498A (en) | 1997-01-21 | 1997-11-20 | Systems and methods for optically measuring properties of hydrocarbon fuel gases |
| BR9714293-0ABR9714293A (en) | 1997-01-21 | 1997-11-20 | System to measure properties of a gas and method to determine its properties |
| CA002278100ACA2278100A1 (en) | 1997-01-21 | 1997-11-20 | Systems and methods for optically measuring properties of hydrocarbon fuel gases |
Applications Claiming Priority (1)
| Application Number | Priority Date | Filing Date | Title |
|---|---|---|---|
| US08/784,608US5822058A (en) | 1997-01-21 | 1997-01-21 | Systems and methods for optically measuring properties of hydrocarbon fuel gases |
Publications (1)
| Publication Number | Publication Date |
|---|---|
| US5822058Atrue US5822058A (en) | 1998-10-13 |
Family
ID=25132984
Family Applications (1)
| Application Number | Title | Priority Date | Filing Date |
|---|---|---|---|
| US08/784,608Expired - LifetimeUS5822058A (en) | 1997-01-21 | 1997-01-21 | Systems and methods for optically measuring properties of hydrocarbon fuel gases |
Country Status (6)
| Country | Link |
|---|---|
| US (1) | US5822058A (en) |
| EP (1) | EP1009998A1 (en) |
| AU (1) | AU5181498A (en) |
| BR (1) | BR9714293A (en) |
| CA (1) | CA2278100A1 (en) |
| WO (1) | WO1998032003A1 (en) |
Cited By (72)
| Publication number | Priority date | Publication date | Assignee | Title |
|---|---|---|---|---|
| WO2000006979A1 (en)* | 1998-07-31 | 2000-02-10 | The Research Foundation Of State University Of New York | Sensors for detection and spectroscopy |
| WO2000040948A1 (en)* | 1999-01-05 | 2000-07-13 | Flowcomp Systemtechnik Gmbh | Method of determining the gas quality |
| US6157455A (en)* | 1997-06-06 | 2000-12-05 | Gaz De France | Method and apparatus for determining the calorific value of a natural gas optically and in real time |
| US6155160A (en)* | 1998-06-04 | 2000-12-05 | Hochbrueckner; Kenneth | Propane detector system |
| EP1154258A1 (en)* | 2000-05-13 | 2001-11-14 | Ruhrgas Aktiengesellschaft | Method and apparatus for combustionless determination of the calorific value or Wobbe index of natural gas |
| US6536946B1 (en)* | 1998-03-24 | 2003-03-25 | Schlumberger Industries, S.A. | Device and method for directly measuring calorific energy contained in a fuel gas |
| US6539775B2 (en)* | 2001-02-13 | 2003-04-01 | Wolfgang H. Driftmeier | Method and apparatus for the measurement of the interchangeability of LPG/air mixtures with natural gas |
| US6590647B2 (en)* | 2001-05-04 | 2003-07-08 | Schlumberger Technology Corporation | Physical property determination using surface enhanced raman emissions |
| US6588266B2 (en)* | 1997-05-02 | 2003-07-08 | Baker Hughes Incorporated | Monitoring of downhole parameters and tools utilizing fiber optics |
| US20030183766A1 (en)* | 2000-06-02 | 2003-10-02 | Hodgkinson Elizabeth Jane | Non-dispersive ir measurement of gases using an optical filter |
| US20040088113A1 (en)* | 2002-10-31 | 2004-05-06 | Eastman Kodak Company | Detecting natural gas pipeline failures |
| WO2005078412A1 (en)* | 2004-02-07 | 2005-08-25 | Rolls-Royce Plc | Gas composition monitoring arrangement |
| US6977179B2 (en) | 2004-03-19 | 2005-12-20 | Gas Technology Institute | Method and apparatus for measuring the heating value of a single or multi-component fuel gas |
| US20050279131A1 (en)* | 2004-06-16 | 2005-12-22 | Battiste David R | Noninvasive measurement and control system for use in hydrocarbon processing |
| US20060092423A1 (en)* | 2004-10-29 | 2006-05-04 | Gas Technology Institute | Method and apparatus for optically measuring the heating value of a multi-component fuel gas using nir absorption spectroscopy |
| US20070171413A1 (en)* | 2006-01-26 | 2007-07-26 | Schlumberger Technology Corporation | Method and Apparatus for Downhole Spectral Analysis of Fluids |
| US20070251298A1 (en)* | 2006-04-26 | 2007-11-01 | Gas Technology Institute | Apparatus and method for accurate, real-time measurement of pipeline gas |
| US20080288182A1 (en)* | 2007-05-15 | 2008-11-20 | Cline Richard L | Energy Flow Measurement In Gas Pipelines |
| US20090028209A1 (en)* | 2007-07-27 | 2009-01-29 | Alfred Feitisch | Energy Meter For Mixed Streams Of Combustible Compounds |
| US7764379B1 (en) | 2005-12-20 | 2010-07-27 | Axsun Technologies, Inc. | Semiconductor laser natural gas analysis system and method |
| US20110036146A1 (en)* | 2000-04-11 | 2011-02-17 | John Pope | In-Situ Detection and Analysis of Methane in Coal Bed Methane Formations with Spectrometers |
| US20110085164A1 (en)* | 2008-11-18 | 2011-04-14 | Chemlmage Corporation | Method and apparatus for automated spectral calibration |
| US20110112772A1 (en)* | 2008-05-16 | 2011-05-12 | University Of Washington Through Its Center For Commercialization | Transmission quantification of open path ftir spectra with temperature compensation |
| WO2011127484A1 (en)* | 2010-04-09 | 2011-10-13 | Tesoro Refining And Marketing Company | Direct match spectrographic determination of fuel properties |
| US20120290223A1 (en)* | 2010-04-09 | 2012-11-15 | Mertens Daniel C | Direct match spectrographic determination of fuel properties |
| US20140042323A1 (en)* | 2011-02-11 | 2014-02-13 | Halliburton Energy Services Inc. | Method and apparatus to use multiple spectroscopic envelopes to determine components with greater accuracy and dynamic range |
| US8686364B1 (en)* | 2012-09-17 | 2014-04-01 | Jp3 Measurement, Llc | Method and system for determining energy content and detecting contaminants in a fluid stream |
| US8760644B2 (en)* | 2012-10-31 | 2014-06-24 | Halliburton Energy Services, Inc. | Systems and methods for cleaning an inline optical fluid analyzer |
| CN104483269A (en)* | 2014-12-12 | 2015-04-01 | 东北石油大学 | Optical cavity for testing natural gas absorption spectrum |
| WO2016003877A1 (en) | 2014-06-30 | 2016-01-07 | Precisive, LLC | Systems, methods, and apparatus for optical hydrocarbon gas composition monitoring |
| US9322818B2 (en)* | 2011-03-07 | 2016-04-26 | Tohoku University | Fuel physical property determination method and fuel physical property determination device |
| US20170023538A1 (en)* | 2015-07-23 | 2017-01-26 | Tesoro Refining & Marketing Company LLC | Methods and Apparatuses for Spectral Qualification of Fuel Properties |
| ITUB20155382A1 (en)* | 2015-11-09 | 2017-05-09 | Luca Mucchi | SYSTEM FOR LEARNING FROM EXAMPLES FOR THE MODELING OF SENSORS |
| US20170370831A1 (en)* | 2015-07-22 | 2017-12-28 | Riken Keiki Co. Ltd. | Methane number calculation method and methane number measurement device |
| US10094781B2 (en) | 2014-04-14 | 2018-10-09 | General Electric Company | Methods and systems to analyze a gas-mixture |
| US10302609B2 (en) | 2014-02-07 | 2019-05-28 | Detector Electronics Corporation | Calibration for gas detection |
| EP3492908A1 (en)* | 2017-12-04 | 2019-06-05 | Kaiser Optical Systems Inc. | Augmented raman analysis of a gas mixture |
| US10495570B2 (en)* | 2016-10-03 | 2019-12-03 | Abb Schweiz Ag | Measurement of hydrocarbon fuel gas composition and properties from tunable diode laser absorption spectrometry |
| US10630061B2 (en)* | 2015-01-14 | 2020-04-21 | Abb Schweiz Ag | Method for determining a property of a fluid component of a fluid present in a compartment of an electrical apparatus |
| WO2021018465A1 (en) | 2019-07-30 | 2021-02-04 | Anton Paar Provetec Gmbh | Flame monitoring in flash point determination or fire point determination |
| WO2021055902A1 (en)* | 2019-09-20 | 2021-03-25 | Seekops Inc. | Spectral fitting of compact laser-based trace gas sensor measurements for high dynamic range (hdr) |
| CN115575443A (en)* | 2022-09-28 | 2023-01-06 | 石河子大学 | Biomass charcoal calorific value prediction method based on bivariate feature extraction strategy |
| US11614430B2 (en) | 2019-12-19 | 2023-03-28 | Seekops Inc. | Concurrent in-situ measurement of wind speed and trace gases on mobile platforms for localization and qualification of emissions |
| US11748866B2 (en) | 2020-07-17 | 2023-09-05 | Seekops Inc. | Systems and methods of automated detection of gas plumes using optical imaging |
| US11802257B2 (en) | 2022-01-31 | 2023-10-31 | Marathon Petroleum Company Lp | Systems and methods for reducing rendered fats pour point |
| US11860069B2 (en) | 2021-02-25 | 2024-01-02 | Marathon Petroleum Company Lp | Methods and assemblies for determining and using standardized spectral responses for calibration of spectroscopic analyzers |
| US11891581B2 (en) | 2017-09-29 | 2024-02-06 | Marathon Petroleum Company Lp | Tower bottoms coke catching device |
| US11898109B2 (en) | 2021-02-25 | 2024-02-13 | Marathon Petroleum Company Lp | Assemblies and methods for enhancing control of hydrotreating and fluid catalytic cracking (FCC) processes using spectroscopic analyzers |
| US11905468B2 (en) | 2021-02-25 | 2024-02-20 | Marathon Petroleum Company Lp | Assemblies and methods for enhancing control of fluid catalytic cracking (FCC) processes using spectroscopic analyzers |
| US11905479B2 (en) | 2020-02-19 | 2024-02-20 | Marathon Petroleum Company Lp | Low sulfur fuel oil blends for stability enhancement and associated methods |
| US11970664B2 (en) | 2021-10-10 | 2024-04-30 | Marathon Petroleum Company Lp | Methods and systems for enhancing processing of hydrocarbons in a fluid catalytic cracking unit using a renewable additive |
| US11975316B2 (en) | 2019-05-09 | 2024-05-07 | Marathon Petroleum Company Lp | Methods and reforming systems for re-dispersing platinum on reforming catalyst |
| US11988598B2 (en) | 2019-12-31 | 2024-05-21 | Seekops Inc. | Optical cell cleaner |
| US11994464B2 (en) | 2019-04-05 | 2024-05-28 | Seekops Inc. | Analog signal processing for a lightweight and compact laser-based trace gas sensor |
| US12000720B2 (en) | 2018-09-10 | 2024-06-04 | Marathon Petroleum Company Lp | Product inventory monitoring |
| US12015386B2 (en) | 2020-03-25 | 2024-06-18 | Seekops Inc. | Logarithmic demodulator for laser Wavelength-Modulaton Spectroscopy |
| US12031094B2 (en) | 2021-02-25 | 2024-07-09 | Marathon Petroleum Company Lp | Assemblies and methods for enhancing fluid catalytic cracking (FCC) processes during the FCC process using spectroscopic analyzers |
| US12031676B2 (en) | 2019-03-25 | 2024-07-09 | Marathon Petroleum Company Lp | Insulation securement system and associated methods |
| US12044666B2 (en) | 2018-07-30 | 2024-07-23 | Seekops Inc. | Ultra-lightweight, handheld gas leak detection device |
| US12055485B2 (en) | 2020-02-05 | 2024-08-06 | Seekops Inc. | Multispecies measurement platform using absorption spectroscopy for measurement of co-emitted trace gases |
| CN118518614A (en)* | 2024-07-02 | 2024-08-20 | 吉林大学 | Tunnel multicomponent high-risk harmful gas detection system and method based on spectrum technology |
| US12130204B2 (en) | 2019-08-05 | 2024-10-29 | Seekops Inc. | Rapidly deployable UAS system for autonomous inspection operations using a combined payload |
| US12188847B2 (en) | 2019-04-05 | 2025-01-07 | Seekops Inc. | Time-and data-efficient assurance of leak detection |
| US12197233B2 (en) | 2019-10-04 | 2025-01-14 | Seekops Inc. | Closed surface flight pattern generation for unmanned aerial vehicle (UAV) flux plane assessment of large facilities |
| US12216105B2 (en) | 2018-06-19 | 2025-02-04 | Seekops Inc. | Localization analytics algorithms and methods |
| US12276597B2 (en) | 2020-02-05 | 2025-04-15 | Seekops Inc. | Multiple path length optical cell for trace gas measurement |
| US12281983B2 (en) | 2018-10-22 | 2025-04-22 | Seekops Inc. | UAV-borne, high-bandwidth, lightweight point sensor for quantifying greenhouse gases in atmospheric strata |
| US12306076B2 (en) | 2023-05-12 | 2025-05-20 | Marathon Petroleum Company Lp | Systems, apparatuses, and methods for sample cylinder inspection, pressurization, and sample disposal |
| US12311305B2 (en) | 2022-12-08 | 2025-05-27 | Marathon Petroleum Company Lp | Removable flue gas strainer and associated methods |
| US12345416B2 (en) | 2019-05-30 | 2025-07-01 | Marathon Petroleum Company Lp | Methods and systems for minimizing NOx and CO emissions in natural draft heaters |
| US12399164B2 (en) | 2018-06-19 | 2025-08-26 | Seekops Inc. | Emissions estimate model algorithms and methods |
| US12415962B2 (en) | 2023-11-10 | 2025-09-16 | Marathon Petroleum Company Lp | Systems and methods for producing aviation fuel |
Families Citing this family (3)
| Publication number | Priority date | Publication date | Assignee | Title |
|---|---|---|---|---|
| DE19838301C2 (en)* | 1998-08-24 | 2001-03-01 | Fraunhofer Ges Forschung | Photometric device and photometric method for determining the calorific value of a test gas |
| DE102006055157B3 (en)* | 2006-11-22 | 2008-04-30 | Siemens Ag | Optical measuring cell for use in gas monitor, has light source for transferring light into measuring volume that is represented by inner volume of hollow fiber whose inner diameter is less than 1 millimeter |
| RU190943U1 (en)* | 2019-02-18 | 2019-07-16 | Федеральное государственное бюджетное образовательное учреждение высшего образования "Уфимский государственный нефтяной технический университет" | Flow analyzer to monitor the quality of hydrocarbon fractions |
Citations (29)
| Publication number | Priority date | Publication date | Assignee | Title |
|---|---|---|---|---|
| US4198859A (en)* | 1978-11-09 | 1980-04-22 | Holtermann Ludwig K | Heat flow probe |
| US4288062A (en)* | 1979-08-09 | 1981-09-08 | Holcroft | Apparatus for control and monitoring of the carbon potential of an atmosphere in a heat-processing furnace |
| US4303194A (en)* | 1980-02-28 | 1981-12-01 | U.S. Steel Corporation | Smoke prevention apparatus |
| US4306451A (en)* | 1980-04-24 | 1981-12-22 | Honeywell Inc. | Gas analyzer |
| US4315430A (en)* | 1980-02-21 | 1982-02-16 | Honeywell Inc. | Gas calorific content analyzing apparatus |
| US4359284A (en)* | 1981-03-17 | 1982-11-16 | Honeywell Inc. | Method and apparatus for determining the Wobbe index of gaseous fuels |
| US4386858A (en)* | 1979-12-20 | 1983-06-07 | Honeywell Inc. | Method and apparatus for determining the heat content of gaseous fuels |
| US4492862A (en)* | 1981-08-07 | 1985-01-08 | Mathematical Sciences Northwest, Inc. | Method and apparatus for analyzing components of hydrocarbon gases recovered from oil, natural gas and coal drilling operations |
| US4613482A (en)* | 1983-12-23 | 1986-09-23 | The Foxboro Company | Constant temperature heating value measurement apparatus |
| US4800279A (en)* | 1985-09-13 | 1989-01-24 | Indiana University Foundation | Methods and devices for near-infrared evaluation of physical properties of samples |
| US4951503A (en)* | 1990-01-23 | 1990-08-28 | Niagara Mohawk Power Corporation | Method and apparatus for determining the heating value of a gaseous fuel |
| US4958076A (en)* | 1989-02-10 | 1990-09-18 | Gas Research Institute | Selective natural gas detecting apparatus |
| US4994671A (en)* | 1987-12-23 | 1991-02-19 | Schlumberger Technology Corporation | Apparatus and method for analyzing the composition of formation fluids |
| US5078593A (en)* | 1990-07-03 | 1992-01-07 | Industrial Waste Management, Inc. | Method for recovery of energy values of oily refinery sludges |
| US5223714A (en)* | 1991-11-26 | 1993-06-29 | Ashland Oil, Inc. | Process for predicting properties of multi-component fluid blends |
| US5224776A (en)* | 1989-02-24 | 1993-07-06 | Precision Measurement, Inc. | Instrument and method for heating value measurement by stoichiometric combustion |
| US5235844A (en)* | 1991-10-23 | 1993-08-17 | Niagara Mohawk Power Corporation | Multiple gas property sensor |
| WO1994008226A1 (en)* | 1992-10-05 | 1994-04-14 | Shell Internationale Research Maatschappij B.V. | An apparatus for fuel quality monitoring |
| US5310335A (en)* | 1992-05-05 | 1994-05-10 | Robert A. Van Berkum | Trim system for fuel combustion systems |
| US5311447A (en)* | 1991-10-23 | 1994-05-10 | Ulrich Bonne | On-line combustionless measurement of gaseous fuels fed to gas consumption devices |
| US5349189A (en)* | 1990-04-09 | 1994-09-20 | Ashland Oil, Inc. | Process and apparatus for analysis of hydrocarbons by near-infrared spectroscopy |
| US5370790A (en)* | 1990-12-11 | 1994-12-06 | Ashland Oil, Inc. | Determination of aromatics in hydrocarbons by near infrared spectroscopy |
| US5412581A (en)* | 1992-11-05 | 1995-05-02 | Marathon Oil Company | Method for measuring physical properties of hydrocarbons |
| US5452232A (en)* | 1987-08-18 | 1995-09-19 | Bp Oil International Limited | Method and apparatus for determining a property or yield of a hydrocarbon product based on NIRA of the feedstock |
| US5475612A (en)* | 1987-08-18 | 1995-12-12 | Bp Oil International Limited | Method for the direct determination of physical properties of hydrocarbon products |
| US5490085A (en)* | 1987-02-27 | 1996-02-06 | Bp Oil International Limited | Method for optimizing control of a production unit |
| US5491344A (en)* | 1993-12-01 | 1996-02-13 | Tufts University | Method and system for examining the composition of a fluid or solid sample using fluorescence and/or absorption spectroscopy |
| US5494826A (en)* | 1994-04-18 | 1996-02-27 | Gas Research Institute, Inc. | Microcalorimeter sensor for the measurement of heat content of natural gas |
| US5572030A (en)* | 1994-04-22 | 1996-11-05 | Intevep, S.A. | Method for determining parameter of hydrocarbon |
- 1997
- 1997-01-21USUS08/784,608patent/US5822058A/ennot_activeExpired - Lifetime
- 1997-11-20EPEP97946698Apatent/EP1009998A1/ennot_activeWithdrawn
- 1997-11-20WOPCT/US1997/021503patent/WO1998032003A1/ennot_activeApplication Discontinuation
- 1997-11-20BRBR9714293-0Apatent/BR9714293A/ennot_activeApplication Discontinuation
- 1997-11-20CACA002278100Apatent/CA2278100A1/ennot_activeAbandoned
- 1997-11-20AUAU51814/98Apatent/AU5181498A/ennot_activeAbandoned
Patent Citations (30)
| Publication number | Priority date | Publication date | Assignee | Title |
|---|---|---|---|---|
| US4198859A (en)* | 1978-11-09 | 1980-04-22 | Holtermann Ludwig K | Heat flow probe |
| US4288062A (en)* | 1979-08-09 | 1981-09-08 | Holcroft | Apparatus for control and monitoring of the carbon potential of an atmosphere in a heat-processing furnace |
| US4386858A (en)* | 1979-12-20 | 1983-06-07 | Honeywell Inc. | Method and apparatus for determining the heat content of gaseous fuels |
| US4315430A (en)* | 1980-02-21 | 1982-02-16 | Honeywell Inc. | Gas calorific content analyzing apparatus |
| US4303194A (en)* | 1980-02-28 | 1981-12-01 | U.S. Steel Corporation | Smoke prevention apparatus |
| US4306451A (en)* | 1980-04-24 | 1981-12-22 | Honeywell Inc. | Gas analyzer |
| US4359284A (en)* | 1981-03-17 | 1982-11-16 | Honeywell Inc. | Method and apparatus for determining the Wobbe index of gaseous fuels |
| US4492862A (en)* | 1981-08-07 | 1985-01-08 | Mathematical Sciences Northwest, Inc. | Method and apparatus for analyzing components of hydrocarbon gases recovered from oil, natural gas and coal drilling operations |
| US4613482A (en)* | 1983-12-23 | 1986-09-23 | The Foxboro Company | Constant temperature heating value measurement apparatus |
| US4800279A (en)* | 1985-09-13 | 1989-01-24 | Indiana University Foundation | Methods and devices for near-infrared evaluation of physical properties of samples |
| US4800279B1 (en)* | 1985-09-13 | 1991-11-19 | Indiana University Foundation | |
| US5490085A (en)* | 1987-02-27 | 1996-02-06 | Bp Oil International Limited | Method for optimizing control of a production unit |
| US5475612A (en)* | 1987-08-18 | 1995-12-12 | Bp Oil International Limited | Method for the direct determination of physical properties of hydrocarbon products |
| US5452232A (en)* | 1987-08-18 | 1995-09-19 | Bp Oil International Limited | Method and apparatus for determining a property or yield of a hydrocarbon product based on NIRA of the feedstock |
| US4994671A (en)* | 1987-12-23 | 1991-02-19 | Schlumberger Technology Corporation | Apparatus and method for analyzing the composition of formation fluids |
| US4958076A (en)* | 1989-02-10 | 1990-09-18 | Gas Research Institute | Selective natural gas detecting apparatus |
| US5224776A (en)* | 1989-02-24 | 1993-07-06 | Precision Measurement, Inc. | Instrument and method for heating value measurement by stoichiometric combustion |
| US4951503A (en)* | 1990-01-23 | 1990-08-28 | Niagara Mohawk Power Corporation | Method and apparatus for determining the heating value of a gaseous fuel |
| US5349189A (en)* | 1990-04-09 | 1994-09-20 | Ashland Oil, Inc. | Process and apparatus for analysis of hydrocarbons by near-infrared spectroscopy |
| US5078593A (en)* | 1990-07-03 | 1992-01-07 | Industrial Waste Management, Inc. | Method for recovery of energy values of oily refinery sludges |
| US5370790A (en)* | 1990-12-11 | 1994-12-06 | Ashland Oil, Inc. | Determination of aromatics in hydrocarbons by near infrared spectroscopy |
| US5311447A (en)* | 1991-10-23 | 1994-05-10 | Ulrich Bonne | On-line combustionless measurement of gaseous fuels fed to gas consumption devices |
| US5235844A (en)* | 1991-10-23 | 1993-08-17 | Niagara Mohawk Power Corporation | Multiple gas property sensor |
| US5223714A (en)* | 1991-11-26 | 1993-06-29 | Ashland Oil, Inc. | Process for predicting properties of multi-component fluid blends |
| US5310335A (en)* | 1992-05-05 | 1994-05-10 | Robert A. Van Berkum | Trim system for fuel combustion systems |
| WO1994008226A1 (en)* | 1992-10-05 | 1994-04-14 | Shell Internationale Research Maatschappij B.V. | An apparatus for fuel quality monitoring |
| US5412581A (en)* | 1992-11-05 | 1995-05-02 | Marathon Oil Company | Method for measuring physical properties of hydrocarbons |
| US5491344A (en)* | 1993-12-01 | 1996-02-13 | Tufts University | Method and system for examining the composition of a fluid or solid sample using fluorescence and/or absorption spectroscopy |
| US5494826A (en)* | 1994-04-18 | 1996-02-27 | Gas Research Institute, Inc. | Microcalorimeter sensor for the measurement of heat content of natural gas |
| US5572030A (en)* | 1994-04-22 | 1996-11-05 | Intevep, S.A. | Method for determining parameter of hydrocarbon |
Non-Patent Citations (10)
| Title |
|---|
| Brown, Christopher B., et al., "Optical BTU Sensor Development", Final Report, Jul. 1993. |
| Brown, Christopher B., et al., Optical BTU Sensor Development , Final Report, Jul. 1993.* |
| Kelly, Jeffrey J., "Prediction of Gasoline Octane Numbers from Near-Infrared Spectral Features in the Range 660-1215nm", American Chemical Society, 1989. |
| Kelly, Jeffrey J., Prediction of Gasoline Octane Numbers from Near Infrared Spectral Features in the Range 660 1215nm , American Chemical Society, 1989.* |
| Schwab, Scott D., et al., "Versatile, Efficient Raman Sampling with Fiber Optics", Analytical Chemistry, 56 (1984) Oct. |
| Schwab, Scott D., et al., Versatile, Efficient Raman Sampling with Fiber Optics , Analytical Chemistry, 56 (1984) Oct.* |
| Swarin, J. Stephen and Drumm, Charlene A., "Predicting Gasoline Properties Using Near-IR Spectroscopy", Spectroscopy 7(7) 1992. |
| Swarin, J. Stephen and Drumm, Charlene A., Predicting Gasoline Properties Using Near IR Spectroscopy , Spectroscopy 7(7) 1992.* |
| Williamson, J., et al., "Near-Infrared Raman Spectroscopy with a 783-nm Diode Laser and CCD Array Detector", Applied Spectroscopy (vol. 43, No. 3, 1989). |
| Williamson, J., et al., Near Infrared Raman Spectroscopy with a 783 nm Diode Laser and CCD Array Detector , Applied Spectroscopy (vol. 43, No. 3, 1989).* |
Cited By (119)
| Publication number | Priority date | Publication date | Assignee | Title |
|---|---|---|---|---|
| US8789587B2 (en) | 1997-05-02 | 2014-07-29 | Baker Hughes Incorporated | Monitoring of downhole parameters and tools utilizing fiber optics |
| US6588266B2 (en)* | 1997-05-02 | 2003-07-08 | Baker Hughes Incorporated | Monitoring of downhole parameters and tools utilizing fiber optics |
| US20090188665A1 (en)* | 1997-05-02 | 2009-07-30 | Baker Hughes Incorporated | Monitoring of Downhole Parameters and Tools Utilizing Fiber Optics |
| US6157455A (en)* | 1997-06-06 | 2000-12-05 | Gaz De France | Method and apparatus for determining the calorific value of a natural gas optically and in real time |
| US6536946B1 (en)* | 1998-03-24 | 2003-03-25 | Schlumberger Industries, S.A. | Device and method for directly measuring calorific energy contained in a fuel gas |
| US6155160A (en)* | 1998-06-04 | 2000-12-05 | Hochbrueckner; Kenneth | Propane detector system |
| US6038023A (en)* | 1998-07-31 | 2000-03-14 | The Research Foundation Of State University Of New York | Sensors for detection and spectroscopy |
| WO2000006979A1 (en)* | 1998-07-31 | 2000-02-10 | The Research Foundation Of State University Of New York | Sensors for detection and spectroscopy |
| US6941230B1 (en) | 1999-01-05 | 2005-09-06 | Flowcomp Systemtechnik Gmbh | Method of determining the gas quality |
| WO2000040948A1 (en)* | 1999-01-05 | 2000-07-13 | Flowcomp Systemtechnik Gmbh | Method of determining the gas quality |
| US20110036146A1 (en)* | 2000-04-11 | 2011-02-17 | John Pope | In-Situ Detection and Analysis of Methane in Coal Bed Methane Formations with Spectrometers |
| EP1154258A1 (en)* | 2000-05-13 | 2001-11-14 | Ruhrgas Aktiengesellschaft | Method and apparatus for combustionless determination of the calorific value or Wobbe index of natural gas |
| US20030183766A1 (en)* | 2000-06-02 | 2003-10-02 | Hodgkinson Elizabeth Jane | Non-dispersive ir measurement of gases using an optical filter |
| US7091487B2 (en)* | 2000-06-02 | 2006-08-15 | Lattice Intellectual Property Limited | Non-dispersive ir measurement of gases using an optical filter |
| US6539775B2 (en)* | 2001-02-13 | 2003-04-01 | Wolfgang H. Driftmeier | Method and apparatus for the measurement of the interchangeability of LPG/air mixtures with natural gas |
| US6590647B2 (en)* | 2001-05-04 | 2003-07-08 | Schlumberger Technology Corporation | Physical property determination using surface enhanced raman emissions |
| US20040088113A1 (en)* | 2002-10-31 | 2004-05-06 | Eastman Kodak Company | Detecting natural gas pipeline failures |
| US7027924B2 (en)* | 2002-10-31 | 2006-04-11 | Itt Manufacturing Enterprises, Inc | Detecting natural gas pipeline failures |
| WO2005078412A1 (en)* | 2004-02-07 | 2005-08-25 | Rolls-Royce Plc | Gas composition monitoring arrangement |
| US20060286423A1 (en)* | 2004-02-07 | 2006-12-21 | Black John D | Gas Composition monitoring arrangement |
| US6977179B2 (en) | 2004-03-19 | 2005-12-20 | Gas Technology Institute | Method and apparatus for measuring the heating value of a single or multi-component fuel gas |
| US7213413B2 (en) | 2004-06-16 | 2007-05-08 | Conocophillips Company | Noninvasive measurement and control system for use in hydrocarbon processing |
| US20050279131A1 (en)* | 2004-06-16 | 2005-12-22 | Battiste David R | Noninvasive measurement and control system for use in hydrocarbon processing |
| US7248357B2 (en) | 2004-10-29 | 2007-07-24 | Gas Technology Institute | Method and apparatus for optically measuring the heating value of a multi-component fuel gas using nir absorption spectroscopy |
| US20060092423A1 (en)* | 2004-10-29 | 2006-05-04 | Gas Technology Institute | Method and apparatus for optically measuring the heating value of a multi-component fuel gas using nir absorption spectroscopy |
| US7764379B1 (en) | 2005-12-20 | 2010-07-27 | Axsun Technologies, Inc. | Semiconductor laser natural gas analysis system and method |
| US20070171413A1 (en)* | 2006-01-26 | 2007-07-26 | Schlumberger Technology Corporation | Method and Apparatus for Downhole Spectral Analysis of Fluids |
| WO2007085935A1 (en)* | 2006-01-26 | 2007-08-02 | Schlumberger Technology B.V. | Method and apparatus for calibrated downhole spectral analysis of fluids |
| US7379180B2 (en) | 2006-01-26 | 2008-05-27 | Schlumberger Technology Corporation | Method and apparatus for downhole spectral analysis of fluids |
| US7316151B2 (en) | 2006-04-26 | 2008-01-08 | Gas Technology Institute | Apparatus and method for accurate, real-time measurement of pipeline gas |
| US20070251298A1 (en)* | 2006-04-26 | 2007-11-01 | Gas Technology Institute | Apparatus and method for accurate, real-time measurement of pipeline gas |
| US7653497B2 (en) | 2007-05-15 | 2010-01-26 | Spectrasensors, Inc. | Energy flow measurement in gas pipelines |
| US20100107729A1 (en)* | 2007-05-15 | 2010-05-06 | Cline Richard L | Energy Flow Measurement In Gas Pipelines |
| WO2008144372A1 (en)* | 2007-05-15 | 2008-11-27 | Spectrasensors, Inc. | Energy flow measurement in gas pipelines |
| US20080288182A1 (en)* | 2007-05-15 | 2008-11-20 | Cline Richard L | Energy Flow Measurement In Gas Pipelines |
| US8073637B2 (en) | 2007-05-15 | 2011-12-06 | Spectrasensors, Inc. | Energy flow measurement in gas pipelines |
| US8064052B2 (en) | 2007-07-27 | 2011-11-22 | Spectrasensors, Inc. | Energy meter for mixed streams of combustible compounds |
| US20090028209A1 (en)* | 2007-07-27 | 2009-01-29 | Alfred Feitisch | Energy Meter For Mixed Streams Of Combustible Compounds |
| US9194744B2 (en)* | 2008-05-16 | 2015-11-24 | University Of Washington | Transmission quantification of open path FTIR spectra with temperature compensation |
| US20110112772A1 (en)* | 2008-05-16 | 2011-05-12 | University Of Washington Through Its Center For Commercialization | Transmission quantification of open path ftir spectra with temperature compensation |
| US20110085164A1 (en)* | 2008-11-18 | 2011-04-14 | Chemlmage Corporation | Method and apparatus for automated spectral calibration |
| US8440959B2 (en)* | 2008-11-18 | 2013-05-14 | Chemimage Corporation | Method and apparatus for automated spectral calibration |
| US20120290223A1 (en)* | 2010-04-09 | 2012-11-15 | Mertens Daniel C | Direct match spectrographic determination of fuel properties |
| US8735820B2 (en)* | 2010-04-09 | 2014-05-27 | Tesoro Refining And Marketing Company | Direct match spectrographic determination of fuel properties |
| US20140278141A1 (en)* | 2010-04-09 | 2014-09-18 | Tesoro Refining And Marketing Company | Direct match spectrographic determination of fuel properties |
| US8481942B2 (en) | 2010-04-09 | 2013-07-09 | Tesoro Refining And Marketing Company | Direct match spectrographic determination of fuel properties |
| WO2011127484A1 (en)* | 2010-04-09 | 2011-10-13 | Tesoro Refining And Marketing Company | Direct match spectrographic determination of fuel properties |
| US20140042323A1 (en)* | 2011-02-11 | 2014-02-13 | Halliburton Energy Services Inc. | Method and apparatus to use multiple spectroscopic envelopes to determine components with greater accuracy and dynamic range |
| US9863870B2 (en)* | 2011-02-11 | 2018-01-09 | Halliburton Energy Services, Inc. | Method and apparatus to use multiple spectroscopic envelopes to determine components with greater accuracy and dynamic range |
| US9322818B2 (en)* | 2011-03-07 | 2016-04-26 | Tohoku University | Fuel physical property determination method and fuel physical property determination device |
| US8686364B1 (en)* | 2012-09-17 | 2014-04-01 | Jp3 Measurement, Llc | Method and system for determining energy content and detecting contaminants in a fluid stream |
| US8760644B2 (en)* | 2012-10-31 | 2014-06-24 | Halliburton Energy Services, Inc. | Systems and methods for cleaning an inline optical fluid analyzer |
| US10302609B2 (en) | 2014-02-07 | 2019-05-28 | Detector Electronics Corporation | Calibration for gas detection |
| US10094781B2 (en) | 2014-04-14 | 2018-10-09 | General Electric Company | Methods and systems to analyze a gas-mixture |
| US10495578B2 (en) | 2014-04-14 | 2019-12-03 | General Electric Company | Methods and systems to analyze a gas-mixture |
| US9958380B2 (en) | 2014-06-30 | 2018-05-01 | Mks Instruments, Inc. | Systems, methods, and apparatus for optical hydrocarbon gas composition monitoring |
| WO2016003877A1 (en) | 2014-06-30 | 2016-01-07 | Precisive, LLC | Systems, methods, and apparatus for optical hydrocarbon gas composition monitoring |
| CN104483269A (en)* | 2014-12-12 | 2015-04-01 | 东北石油大学 | Optical cavity for testing natural gas absorption spectrum |
| US10630061B2 (en)* | 2015-01-14 | 2020-04-21 | Abb Schweiz Ag | Method for determining a property of a fluid component of a fluid present in a compartment of an electrical apparatus |
| US20170370831A1 (en)* | 2015-07-22 | 2017-12-28 | Riken Keiki Co. Ltd. | Methane number calculation method and methane number measurement device |
| US10132746B2 (en)* | 2015-07-22 | 2018-11-20 | Riken Keiki Co. Ltd. | Methane number calculation method and methane number measurement device |
| US9709545B2 (en)* | 2015-07-23 | 2017-07-18 | Tesoro Refining & Marketing Company LLC | Methods and apparatuses for spectral qualification of fuel properties |
| US20170023538A1 (en)* | 2015-07-23 | 2017-01-26 | Tesoro Refining & Marketing Company LLC | Methods and Apparatuses for Spectral Qualification of Fuel Properties |
| US10295521B2 (en) | 2015-07-23 | 2019-05-21 | Tesoro Refining & Marketing Llc | Methods and apparatuses for spectral qualification of fuel properties |
| ITUB20155382A1 (en)* | 2015-11-09 | 2017-05-09 | Luca Mucchi | SYSTEM FOR LEARNING FROM EXAMPLES FOR THE MODELING OF SENSORS |
| US10495570B2 (en)* | 2016-10-03 | 2019-12-03 | Abb Schweiz Ag | Measurement of hydrocarbon fuel gas composition and properties from tunable diode laser absorption spectrometry |
| US11891581B2 (en) | 2017-09-29 | 2024-02-06 | Marathon Petroleum Company Lp | Tower bottoms coke catching device |
| EP3492908A1 (en)* | 2017-12-04 | 2019-06-05 | Kaiser Optical Systems Inc. | Augmented raman analysis of a gas mixture |
| CN109946283A (en)* | 2017-12-04 | 2019-06-28 | 凯塞光学系统股份有限公司 | The enhancing Raman analysis of admixture of gas |
| US11592398B2 (en) | 2017-12-04 | 2023-02-28 | Endress+Hauser Optical Analysis, Inc. | Augmented Raman analysis of a gas mixture |
| US12399164B2 (en) | 2018-06-19 | 2025-08-26 | Seekops Inc. | Emissions estimate model algorithms and methods |
| US12216105B2 (en) | 2018-06-19 | 2025-02-04 | Seekops Inc. | Localization analytics algorithms and methods |
| US12044666B2 (en) | 2018-07-30 | 2024-07-23 | Seekops Inc. | Ultra-lightweight, handheld gas leak detection device |
| US12000720B2 (en) | 2018-09-10 | 2024-06-04 | Marathon Petroleum Company Lp | Product inventory monitoring |
| US12281983B2 (en) | 2018-10-22 | 2025-04-22 | Seekops Inc. | UAV-borne, high-bandwidth, lightweight point sensor for quantifying greenhouse gases in atmospheric strata |
| US12031676B2 (en) | 2019-03-25 | 2024-07-09 | Marathon Petroleum Company Lp | Insulation securement system and associated methods |
| US12188847B2 (en) | 2019-04-05 | 2025-01-07 | Seekops Inc. | Time-and data-efficient assurance of leak detection |
| US11994464B2 (en) | 2019-04-05 | 2024-05-28 | Seekops Inc. | Analog signal processing for a lightweight and compact laser-based trace gas sensor |
| US11975316B2 (en) | 2019-05-09 | 2024-05-07 | Marathon Petroleum Company Lp | Methods and reforming systems for re-dispersing platinum on reforming catalyst |
| US12345416B2 (en) | 2019-05-30 | 2025-07-01 | Marathon Petroleum Company Lp | Methods and systems for minimizing NOx and CO emissions in natural draft heaters |
| US12196694B2 (en) | 2019-07-30 | 2025-01-14 | Anton Paar Provetec Gmbh | Flame monitoring in a flash point determination or combustion point determination |
| DE102019120512A1 (en)* | 2019-07-30 | 2021-02-04 | Anton Paar Provetec Gmbh | Flame monitoring for flash point determination or fire point determination |
| DE102019120512B4 (en)* | 2019-07-30 | 2021-02-25 | Anton Paar Provetec Gmbh | Flame monitoring for flash point determination or fire point determination |
| WO2021018465A1 (en) | 2019-07-30 | 2021-02-04 | Anton Paar Provetec Gmbh | Flame monitoring in flash point determination or fire point determination |
| US12130204B2 (en) | 2019-08-05 | 2024-10-29 | Seekops Inc. | Rapidly deployable UAS system for autonomous inspection operations using a combined payload |
| US12392680B2 (en)* | 2019-09-20 | 2025-08-19 | Seekops Inc. | Spectral fitting of compact laser-based trace gas sensor measurements for high dynamic range (HDR) |
| US20220341806A1 (en)* | 2019-09-20 | 2022-10-27 | Seekops Inc. | Spectral fitting of compact laser-based trace gas sensor measurements for high dynamic range (hdr) |
| WO2021055902A1 (en)* | 2019-09-20 | 2021-03-25 | Seekops Inc. | Spectral fitting of compact laser-based trace gas sensor measurements for high dynamic range (hdr) |
| US12197233B2 (en) | 2019-10-04 | 2025-01-14 | Seekops Inc. | Closed surface flight pattern generation for unmanned aerial vehicle (UAV) flux plane assessment of large facilities |
| US12188912B2 (en) | 2019-12-19 | 2025-01-07 | Seekops Inc. | Concurrent in-situ measurement of wind speed and trace gases on mobile platforms for localization and qualification of emissions |
| US11614430B2 (en) | 2019-12-19 | 2023-03-28 | Seekops Inc. | Concurrent in-situ measurement of wind speed and trace gases on mobile platforms for localization and qualification of emissions |
| US11988598B2 (en) | 2019-12-31 | 2024-05-21 | Seekops Inc. | Optical cell cleaner |
| US12276597B2 (en) | 2020-02-05 | 2025-04-15 | Seekops Inc. | Multiple path length optical cell for trace gas measurement |
| US12055485B2 (en) | 2020-02-05 | 2024-08-06 | Seekops Inc. | Multispecies measurement platform using absorption spectroscopy for measurement of co-emitted trace gases |
| US11920096B2 (en) | 2020-02-19 | 2024-03-05 | Marathon Petroleum Company Lp | Low sulfur fuel oil blends for paraffinic resid stability and associated methods |
| US11905479B2 (en) | 2020-02-19 | 2024-02-20 | Marathon Petroleum Company Lp | Low sulfur fuel oil blends for stability enhancement and associated methods |
| US12421467B2 (en) | 2020-02-19 | 2025-09-23 | Marathon Petroleum Company Lp | Low sulfur fuel oil blends for stability enhancement and associated methods |
| US12015386B2 (en) | 2020-03-25 | 2024-06-18 | Seekops Inc. | Logarithmic demodulator for laser Wavelength-Modulaton Spectroscopy |
| US11748866B2 (en) | 2020-07-17 | 2023-09-05 | Seekops Inc. | Systems and methods of automated detection of gas plumes using optical imaging |
| US12217412B2 (en) | 2020-07-17 | 2025-02-04 | Seekops Inc. | Systems and methods of automated detection of gas plumes using optical imaging |
| US11860069B2 (en) | 2021-02-25 | 2024-01-02 | Marathon Petroleum Company Lp | Methods and assemblies for determining and using standardized spectral responses for calibration of spectroscopic analyzers |
| US12163878B2 (en) | 2021-02-25 | 2024-12-10 | Marathon Petroleum Company Lp | Methods and assemblies for determining and using standardized spectral responses for calibration of spectroscopic analyzers |
| US11905468B2 (en) | 2021-02-25 | 2024-02-20 | Marathon Petroleum Company Lp | Assemblies and methods for enhancing control of fluid catalytic cracking (FCC) processes using spectroscopic analyzers |
| US12031094B2 (en) | 2021-02-25 | 2024-07-09 | Marathon Petroleum Company Lp | Assemblies and methods for enhancing fluid catalytic cracking (FCC) processes during the FCC process using spectroscopic analyzers |
| US11906423B2 (en) | 2021-02-25 | 2024-02-20 | Marathon Petroleum Company Lp | Methods, assemblies, and controllers for determining and using standardized spectral responses for calibration of spectroscopic analyzers |
| US12221583B2 (en) | 2021-02-25 | 2025-02-11 | Marathon Petroleum Company Lp | Assemblies and methods for enhancing control of hydrotreating and fluid catalytic cracking (FCC) processes using spectroscopic analyzers |
| US11898109B2 (en) | 2021-02-25 | 2024-02-13 | Marathon Petroleum Company Lp | Assemblies and methods for enhancing control of hydrotreating and fluid catalytic cracking (FCC) processes using spectroscopic analyzers |
| US11885739B2 (en) | 2021-02-25 | 2024-01-30 | Marathon Petroleum Company Lp | Methods and assemblies for determining and using standardized spectral responses for calibration of spectroscopic analyzers |
| US11921035B2 (en) | 2021-02-25 | 2024-03-05 | Marathon Petroleum Company Lp | Methods and assemblies for determining and using standardized spectral responses for calibration of spectroscopic analyzers |
| US12338396B2 (en) | 2021-10-10 | 2025-06-24 | Marathon Petroleum Company Lp | Methods and systems for enhancing processing of hydrocarbons in a fluid catalytic cracking unit using a renewable additive |
| US11970664B2 (en) | 2021-10-10 | 2024-04-30 | Marathon Petroleum Company Lp | Methods and systems for enhancing processing of hydrocarbons in a fluid catalytic cracking unit using a renewable additive |
| US11802257B2 (en) | 2022-01-31 | 2023-10-31 | Marathon Petroleum Company Lp | Systems and methods for reducing rendered fats pour point |
| US12297403B2 (en) | 2022-01-31 | 2025-05-13 | Marathon Petroleum Company Lp | Systems and methods for reducing rendered fats pour point |
| CN115575443A (en)* | 2022-09-28 | 2023-01-06 | 石河子大学 | Biomass charcoal calorific value prediction method based on bivariate feature extraction strategy |
| US12311305B2 (en) | 2022-12-08 | 2025-05-27 | Marathon Petroleum Company Lp | Removable flue gas strainer and associated methods |
| US12306076B2 (en) | 2023-05-12 | 2025-05-20 | Marathon Petroleum Company Lp | Systems, apparatuses, and methods for sample cylinder inspection, pressurization, and sample disposal |
| US12415962B2 (en) | 2023-11-10 | 2025-09-16 | Marathon Petroleum Company Lp | Systems and methods for producing aviation fuel |
| CN118518614B (en)* | 2024-07-02 | 2025-06-17 | 吉林大学 | Tunnel multi-component high-risk harmful gas detection system and method based on spectral technology |
| CN118518614A (en)* | 2024-07-02 | 2024-08-20 | 吉林大学 | Tunnel multicomponent high-risk harmful gas detection system and method based on spectrum technology |
Also Published As
| Publication number | Publication date |
|---|---|
| EP1009998A1 (en) | 2000-06-21 |
| BR9714293A (en) | 2001-12-04 |
| CA2278100A1 (en) | 1998-07-23 |
| AU5181498A (en) | 1998-08-07 |
| WO1998032003A1 (en) | 1998-07-23 |
Similar Documents
| Publication | Publication Date | Title |
|---|---|---|
| US5822058A (en) | Systems and methods for optically measuring properties of hydrocarbon fuel gases | |
| Buchholz et al. | Absolute validation of a diode laser hygrometer via intercomparison with the German national primary water vapor standard | |
| US5464983A (en) | Method and apparatus for determining the concentration of a gas | |
| Hammer et al. | Assessment of a multi-species in situ FTIR for precise atmospheric greenhouse gas observations | |
| US6490908B2 (en) | Method and device for determining the gas properties of a combustible gas | |
| US7248357B2 (en) | Method and apparatus for optically measuring the heating value of a multi-component fuel gas using nir absorption spectroscopy | |
| Bowling et al. | Tunable diode laser absorption spectroscopy for stable isotope studies of ecosystem–atmosphere CO2 exchange | |
| US8139222B2 (en) | Pressure controlled spectroscopic heating value sensor | |
| Wahl et al. | Applications of cavity ring-down spectroscopy to high precision isotope ratio measurement of 13C/12C in carbon dioxide | |
| US9097583B2 (en) | Long-path infrared spectrometer | |
| EP0834725B1 (en) | Analyzing spectrometric data | |
| Buchholz et al. | Validation of an extractive, airborne, compact TDL spectrometer for atmospheric humidity sensing by blind intercomparison | |
| CN105628637B (en) | A kind of infrared gas analysis method and apparatus of three reference channels | |
| Hunsmann et al. | Absolute, high resolution water transpiration rate measurements on single plant leaves via tunable diode laser absorption spectroscopy (TDLAS) at 1.37 μm | |
| Lebegue et al. | Comparison of nitrous oxide (N 2 O) analyzers for high-precision measurements of atmospheric mole fractions | |
| US5272345A (en) | Calibration method and apparatus for measuring the concentration of components in a fluid | |
| US6941230B1 (en) | Method of determining the gas quality | |
| Ghysels et al. | Spectroscopy of CH4 with a difference-frequency generation laser at 3.3 micron for atmospheric applications | |
| Xiao et al. | Isobaric heat capacities of a methane (1)+ propane (2) mixture by differential scanning calorimetry at near-critical and supercritical conditions | |
| US7764379B1 (en) | Semiconductor laser natural gas analysis system and method | |
| Cai et al. | Experimental study of carbon dioxide spectroscopic parameters around 2.0 µm region for combustion diagnostic applications | |
| Qu et al. | Towards a dTDLAS-based spectrometer for absolute HCl measurements in combustion flue gases and a better evaluation of thermal boundary layer effects | |
| Mondelain et al. | Accurate Laboratory Measurement of the O2 Collision‐Induced Absorption Band Near 1.27 μm | |
| Basu et al. | In situ simultaneous measurements of temperature and water partial pressure in a PEM fuel cell under steady state and dynamic cycling | |
| Hammer et al. | Assessment of a multi-species in-situ FTIR for precise atmospheric greenhouse gas observations. |
Legal Events
| Date | Code | Title | Description |
|---|---|---|---|
| AS | Assignment | Owner name:SPECTRAL SCIENCES INC., MASSACHUSETTS Free format text:ASSIGNMENT OF ASSIGNORS INTEREST;ASSIGNORS:ADLER-GOLDEN, STEVEN;BERNSTEIN, LAWRENCE S.;BIEN, FRITZ;AND OTHERS;REEL/FRAME:008404/0282 Effective date:19970120 | |
| STCF | Information on status: patent grant | Free format text:PATENTED CASE | |
| FPAY | Fee payment | Year of fee payment:4 | |
| FEPP | Fee payment procedure | Free format text:PETITION RELATED TO MAINTENANCE FEES FILED (ORIGINAL EVENT CODE: PMFP); ENTITY STATUS OF PATENT OWNER: SMALL ENTITY | |
| FEPP | Fee payment procedure | Free format text:PETITION RELATED TO MAINTENANCE FEES GRANTED (ORIGINAL EVENT CODE: PMFG); ENTITY STATUS OF PATENT OWNER: SMALL ENTITY | |
| REMI | Maintenance fee reminder mailed | ||
| FPAY | Fee payment | Year of fee payment:8 | |
| PRDP | Patent reinstated due to the acceptance of a late maintenance fee | Effective date:20060613 | |
| AS | Assignment | Owner name:ENERGY, U.S. DEPARTMENT OF, DISTRICT OF COLUMBIA Free format text:CONFIRMATORY LICENSE;ASSIGNOR:SPECTRAL SCIENCES INCORPORATED;REEL/FRAME:018262/0147 Effective date:19971012 | |
| FPAY | Fee payment | Year of fee payment:12 | |
| FEPP | Fee payment procedure | Free format text:PAYOR NUMBER ASSIGNED (ORIGINAL EVENT CODE: ASPN); ENTITY STATUS OF PATENT OWNER: SMALL ENTITY |