US5746210A - Device and method for detection, localization, and characterization of inhomogeneities in turbid media - Google Patents
Device and method for detection, localization, and characterization of inhomogeneities in turbid mediaDownload PDFInfo
- Publication number
- US5746210A US5746210AUS08/024,278US2427893AUS5746210AUS 5746210 AUS5746210 AUS 5746210AUS 2427893 AUS2427893 AUS 2427893AUS 5746210 AUS5746210 AUS 5746210A
- Authority
- US
- United States
- Prior art keywords
- medium
- inhomogeneity
- region
- radiation
- path
- Prior art date
- Legal status (The legal status is an assumption and is not a legal conclusion. Google has not performed a legal analysis and makes no representation as to the accuracy of the status listed.)
- Expired - Lifetime
Links
- 238000000034methodMethods0.000titleclaimsabstractdescription53
- 238000001514detection methodMethods0.000titleclaimsabstractdescription44
- 238000012512characterization methodMethods0.000titleclaimsabstractdescription6
- 230000004807localizationEffects0.000titleabstractdescription14
- 230000000694effectsEffects0.000claimsabstractdescription63
- 238000005259measurementMethods0.000claimsabstractdescription34
- 230000003287optical effectEffects0.000claimsdescription76
- 238000007710freezingMethods0.000claimsdescription56
- 230000008014freezingEffects0.000claimsdescription56
- 230000008859changeEffects0.000claimsdescription33
- 230000005855radiationEffects0.000claimsdescription32
- 206010028980NeoplasmDiseases0.000claimsdescription23
- 238000000926separation methodMethods0.000claimsdescription10
- 238000005286illuminationMethods0.000claimsdescription9
- 230000008569processEffects0.000claimsdescription7
- 210000004204blood vesselAnatomy0.000claimsdescription5
- 230000000740bleeding effectEffects0.000claimsdescription4
- 238000012544monitoring processMethods0.000claimsdescription4
- 210000005036nerveAnatomy0.000claimsdescription3
- 230000000644propagated effectEffects0.000claims11
- 230000005670electromagnetic radiationEffects0.000claims7
- 238000010792warmingMethods0.000claims1
- 238000003384imaging methodMethods0.000abstractdescription27
- 230000002123temporal effectEffects0.000abstractdescription3
- 239000000523sampleSubstances0.000description43
- 238000002835absorbanceMethods0.000description30
- 230000006870functionEffects0.000description17
- 210000004556brainAnatomy0.000description12
- 239000000126substanceSubstances0.000description9
- 238000013459approachMethods0.000description8
- 238000011088calibration curveMethods0.000description8
- 238000002474experimental methodMethods0.000description8
- 239000012530fluidSubstances0.000description8
- 238000010257thawingMethods0.000description6
- XLYOFNOQVPJJNP-UHFFFAOYSA-NwaterSubstancesOXLYOFNOQVPJJNP-UHFFFAOYSA-N0.000description6
- 230000008901benefitEffects0.000description5
- 238000012986modificationMethods0.000description5
- 230000004048modificationEffects0.000description5
- 239000007787solidSubstances0.000description5
- 108010010803GelatinProteins0.000description4
- 241000234295MusaSpecies0.000description4
- 235000018290Musa x paradisiacaNutrition0.000description4
- 230000002745absorbentEffects0.000description4
- 239000002250absorbentSubstances0.000description4
- 230000015572biosynthetic processEffects0.000description4
- 239000013078crystalSubstances0.000description4
- 229920000159gelatinPolymers0.000description4
- 239000008273gelatinSubstances0.000description4
- 235000019322gelatineNutrition0.000description4
- 235000011852gelatine dessertsNutrition0.000description4
- 239000007788liquidSubstances0.000description4
- 230000035515penetrationEffects0.000description4
- 238000010521absorption reactionMethods0.000description3
- 235000013405beerNutrition0.000description3
- 230000005540biological transmissionEffects0.000description3
- 238000004422calculation algorithmMethods0.000description3
- 239000002775capsuleSubstances0.000description3
- 239000000463materialSubstances0.000description3
- 210000004761scalpAnatomy0.000description3
- 238000003325tomographyMethods0.000description3
- 208000024827Alzheimer diseaseDiseases0.000description2
- IJGRMHOSHXDMSA-UHFFFAOYSA-NAtomic nitrogenChemical compoundN#NIJGRMHOSHXDMSA-UHFFFAOYSA-N0.000description2
- 206010006187Breast cancerDiseases0.000description2
- 208000026310Breast neoplasmDiseases0.000description2
- 230000035508accumulationEffects0.000description2
- 238000009825accumulationMethods0.000description2
- 238000000149argon plasma sinteringMethods0.000description2
- 230000004888barrier functionEffects0.000description2
- 210000000481breastAnatomy0.000description2
- 238000004364calculation methodMethods0.000description2
- 201000011510cancerDiseases0.000description2
- 238000002681cryosurgeryMethods0.000description2
- 230000003247decreasing effectEffects0.000description2
- 238000013461designMethods0.000description2
- 238000010586diagramMethods0.000description2
- 239000003925fatSubstances0.000description2
- 210000003128headAnatomy0.000description2
- 238000010348incorporationMethods0.000description2
- 201000001441melanomaDiseases0.000description2
- 230000000149penetrating effectEffects0.000description2
- 238000010561standard procedureMethods0.000description2
- 238000001356surgical procedureMethods0.000description2
- 238000002604ultrasonographyMethods0.000description2
- 230000003245working effectEffects0.000description2
- 238000012935AveragingMethods0.000description1
- 241001590997Moolgarda engeliSpecies0.000description1
- 208000027418Wounds and injuryDiseases0.000description1
- 238000000333X-ray scatteringMethods0.000description1
- 230000002159abnormal effectEffects0.000description1
- 238000011481absorbance measurementMethods0.000description1
- 238000000862absorption spectrumMethods0.000description1
- 210000001367arteryAnatomy0.000description1
- QVGXLLKOCUKJST-UHFFFAOYSA-Natomic oxygenChemical compound[O]QVGXLLKOCUKJST-UHFFFAOYSA-N0.000description1
- 230000008033biological extinctionEffects0.000description1
- 239000012620biological materialSubstances0.000description1
- 238000001574biopsyMethods0.000description1
- 230000000903blocking effectEffects0.000description1
- 239000008280bloodSubstances0.000description1
- 210000004369bloodAnatomy0.000description1
- 210000005013brain tissueAnatomy0.000description1
- 230000000711cancerogenic effectEffects0.000description1
- 231100000315carcinogenicToxicity0.000description1
- 230000006835compressionEffects0.000description1
- 238000007906compressionMethods0.000description1
- 238000010276constructionMethods0.000description1
- 238000001816coolingMethods0.000description1
- 238000012937correctionMethods0.000description1
- 230000006378damageEffects0.000description1
- 230000001934delayEffects0.000description1
- 230000003111delayed effectEffects0.000description1
- 230000001419dependent effectEffects0.000description1
- 201000010099diseaseDiseases0.000description1
- 208000037265diseases, disorders, signs and symptomsDiseases0.000description1
- 239000003814drugSubstances0.000description1
- 210000005069earsAnatomy0.000description1
- 238000005516engineering processMethods0.000description1
- 238000011156evaluationMethods0.000description1
- 239000000835fiberSubstances0.000description1
- 230000012010growthEffects0.000description1
- 230000003760hair shineEffects0.000description1
- 230000036541healthEffects0.000description1
- 238000010438heat treatmentMethods0.000description1
- 230000006872improvementEffects0.000description1
- 208000014674injuryDiseases0.000description1
- 230000002452interceptive effectEffects0.000description1
- 238000005305interferometryMethods0.000description1
- 230000001788irregularEffects0.000description1
- 230000002147killing effectEffects0.000description1
- 230000000670limiting effectEffects0.000description1
- 210000004185liverAnatomy0.000description1
- 238000007620mathematical functionMethods0.000description1
- 239000011159matrix materialSubstances0.000description1
- 230000007246mechanismEffects0.000description1
- 229910052757nitrogenInorganic materials0.000description1
- 238000012634optical imagingMethods0.000description1
- 210000000056organAnatomy0.000description1
- 230000001151other effectEffects0.000description1
- 239000001301oxygenSubstances0.000description1
- 229910052760oxygenInorganic materials0.000description1
- 230000000704physical effectEffects0.000description1
- 244000144977poultrySpecies0.000description1
- 230000002028prematureEffects0.000description1
- 238000012545processingMethods0.000description1
- 230000001902propagating effectEffects0.000description1
- 230000002829reductive effectEffects0.000description1
- 238000013215result calculationMethods0.000description1
- 230000002441reversible effectEffects0.000description1
- 230000000630rising effectEffects0.000description1
- 239000011435rockSubstances0.000description1
- 238000004513sizingMethods0.000description1
- 239000008247solid mixtureSubstances0.000description1
- 230000003595spectral effectEffects0.000description1
- 230000008961swellingEffects0.000description1
- 238000013334tissue modelMethods0.000description1
- 238000011179visual inspectionMethods0.000description1
Images


Classifications
- A—HUMAN NECESSITIES
- A61—MEDICAL OR VETERINARY SCIENCE; HYGIENE
- A61B—DIAGNOSIS; SURGERY; IDENTIFICATION
- A61B5/00—Measuring for diagnostic purposes; Identification of persons
- A61B5/68—Arrangements of detecting, measuring or recording means, e.g. sensors, in relation to patient
- A61B5/6846—Arrangements of detecting, measuring or recording means, e.g. sensors, in relation to patient specially adapted to be brought in contact with an internal body part, i.e. invasive
- A61B5/6847—Arrangements of detecting, measuring or recording means, e.g. sensors, in relation to patient specially adapted to be brought in contact with an internal body part, i.e. invasive mounted on an invasive device
- A61B5/6848—Needles
- A—HUMAN NECESSITIES
- A61—MEDICAL OR VETERINARY SCIENCE; HYGIENE
- A61B—DIAGNOSIS; SURGERY; IDENTIFICATION
- A61B18/00—Surgical instruments, devices or methods for transferring non-mechanical forms of energy to or from the body
- A—HUMAN NECESSITIES
- A61—MEDICAL OR VETERINARY SCIENCE; HYGIENE
- A61B—DIAGNOSIS; SURGERY; IDENTIFICATION
- A61B5/00—Measuring for diagnostic purposes; Identification of persons
- A61B5/0059—Measuring for diagnostic purposes; Identification of persons using light, e.g. diagnosis by transillumination, diascopy, fluorescence
- A61B5/0075—Measuring for diagnostic purposes; Identification of persons using light, e.g. diagnosis by transillumination, diascopy, fluorescence by spectroscopy, i.e. measuring spectra, e.g. Raman spectroscopy, infrared absorption spectroscopy
- A—HUMAN NECESSITIES
- A61—MEDICAL OR VETERINARY SCIENCE; HYGIENE
- A61B—DIAGNOSIS; SURGERY; IDENTIFICATION
- A61B5/00—Measuring for diagnostic purposes; Identification of persons
- A61B5/0059—Measuring for diagnostic purposes; Identification of persons using light, e.g. diagnosis by transillumination, diascopy, fluorescence
- A61B5/0082—Measuring for diagnostic purposes; Identification of persons using light, e.g. diagnosis by transillumination, diascopy, fluorescence adapted for particular medical purposes
- A61B5/0084—Measuring for diagnostic purposes; Identification of persons using light, e.g. diagnosis by transillumination, diascopy, fluorescence adapted for particular medical purposes for introduction into the body, e.g. by catheters
- A—HUMAN NECESSITIES
- A61—MEDICAL OR VETERINARY SCIENCE; HYGIENE
- A61B—DIAGNOSIS; SURGERY; IDENTIFICATION
- A61B5/00—Measuring for diagnostic purposes; Identification of persons
- A61B5/145—Measuring characteristics of blood in vivo, e.g. gas concentration or pH-value ; Measuring characteristics of body fluids or tissues, e.g. interstitial fluid or cerebral tissue
- A61B5/1455—Measuring characteristics of blood in vivo, e.g. gas concentration or pH-value ; Measuring characteristics of body fluids or tissues, e.g. interstitial fluid or cerebral tissue using optical sensors, e.g. spectral photometrical oximeters
- A61B5/14551—Measuring characteristics of blood in vivo, e.g. gas concentration or pH-value ; Measuring characteristics of body fluids or tissues, e.g. interstitial fluid or cerebral tissue using optical sensors, e.g. spectral photometrical oximeters for measuring blood gases
- A61B5/14553—Measuring characteristics of blood in vivo, e.g. gas concentration or pH-value ; Measuring characteristics of body fluids or tissues, e.g. interstitial fluid or cerebral tissue using optical sensors, e.g. spectral photometrical oximeters for measuring blood gases specially adapted for cerebral tissue
- G—PHYSICS
- G01—MEASURING; TESTING
- G01N—INVESTIGATING OR ANALYSING MATERIALS BY DETERMINING THEIR CHEMICAL OR PHYSICAL PROPERTIES
- G01N21/00—Investigating or analysing materials by the use of optical means, i.e. using sub-millimetre waves, infrared, visible or ultraviolet light
- G01N21/17—Systems in which incident light is modified in accordance with the properties of the material investigated
- G01N21/47—Scattering, i.e. diffuse reflection
- G01N21/4795—Scattering, i.e. diffuse reflection spatially resolved investigating of object in scattering medium
- A—HUMAN NECESSITIES
- A61—MEDICAL OR VETERINARY SCIENCE; HYGIENE
- A61B—DIAGNOSIS; SURGERY; IDENTIFICATION
- A61B17/00—Surgical instruments, devices or methods
- A61B17/068—Surgical staplers, e.g. containing multiple staples or clamps
- A—HUMAN NECESSITIES
- A61—MEDICAL OR VETERINARY SCIENCE; HYGIENE
- A61B—DIAGNOSIS; SURGERY; IDENTIFICATION
- A61B18/00—Surgical instruments, devices or methods for transferring non-mechanical forms of energy to or from the body
- A61B18/04—Surgical instruments, devices or methods for transferring non-mechanical forms of energy to or from the body by heating
- A61B18/12—Surgical instruments, devices or methods for transferring non-mechanical forms of energy to or from the body by heating by passing a current through the tissue to be heated, e.g. high-frequency current
- A61B18/14—Probes or electrodes therefor
- A—HUMAN NECESSITIES
- A61—MEDICAL OR VETERINARY SCIENCE; HYGIENE
- A61B—DIAGNOSIS; SURGERY; IDENTIFICATION
- A61B17/00—Surgical instruments, devices or methods
- A61B2017/00017—Electrical control of surgical instruments
- A61B2017/00022—Sensing or detecting at the treatment site
- A—HUMAN NECESSITIES
- A61—MEDICAL OR VETERINARY SCIENCE; HYGIENE
- A61B—DIAGNOSIS; SURGERY; IDENTIFICATION
- A61B17/00—Surgical instruments, devices or methods
- A61B2017/00017—Electrical control of surgical instruments
- A61B2017/00115—Electrical control of surgical instruments with audible or visual output
- A61B2017/00119—Electrical control of surgical instruments with audible or visual output alarm; indicating an abnormal situation
- A61B2017/00123—Electrical control of surgical instruments with audible or visual output alarm; indicating an abnormal situation and automatic shutdown
- A—HUMAN NECESSITIES
- A61—MEDICAL OR VETERINARY SCIENCE; HYGIENE
- A61B—DIAGNOSIS; SURGERY; IDENTIFICATION
- A61B17/00—Surgical instruments, devices or methods
- A61B17/00491—Surgical glue applicators
- A61B2017/00504—Tissue welding
- A61B2017/00508—Tissue welding using laser
- A—HUMAN NECESSITIES
- A61—MEDICAL OR VETERINARY SCIENCE; HYGIENE
- A61B—DIAGNOSIS; SURGERY; IDENTIFICATION
- A61B17/00—Surgical instruments, devices or methods
- A61B2017/00535—Surgical instruments, devices or methods pneumatically or hydraulically operated
- A61B2017/00557—Surgical instruments, devices or methods pneumatically or hydraulically operated inflatable
- A—HUMAN NECESSITIES
- A61—MEDICAL OR VETERINARY SCIENCE; HYGIENE
- A61B—DIAGNOSIS; SURGERY; IDENTIFICATION
- A61B2560/00—Constructional details of operational features of apparatus; Accessories for medical measuring apparatus
- A61B2560/02—Operational features
- A61B2560/0266—Operational features for monitoring or limiting apparatus function
- A61B2560/0276—Determining malfunction
- A—HUMAN NECESSITIES
- A61—MEDICAL OR VETERINARY SCIENCE; HYGIENE
- A61B—DIAGNOSIS; SURGERY; IDENTIFICATION
- A61B2562/00—Details of sensors; Constructional details of sensor housings or probes; Accessories for sensors
- A61B2562/02—Details of sensors specially adapted for in-vivo measurements
- A61B2562/0233—Special features of optical sensors or probes classified in A61B5/00
- A61B2562/0242—Special features of optical sensors or probes classified in A61B5/00 for varying or adjusting the optical path length in the tissue
- A—HUMAN NECESSITIES
- A61—MEDICAL OR VETERINARY SCIENCE; HYGIENE
- A61B—DIAGNOSIS; SURGERY; IDENTIFICATION
- A61B2562/00—Details of sensors; Constructional details of sensor housings or probes; Accessories for sensors
- A61B2562/08—Sensors provided with means for identification, e.g. barcodes or memory chips
- A—HUMAN NECESSITIES
- A61—MEDICAL OR VETERINARY SCIENCE; HYGIENE
- A61B—DIAGNOSIS; SURGERY; IDENTIFICATION
- A61B5/00—Measuring for diagnostic purposes; Identification of persons
- A61B5/0059—Measuring for diagnostic purposes; Identification of persons using light, e.g. diagnosis by transillumination, diascopy, fluorescence
- A61B5/0073—Measuring for diagnostic purposes; Identification of persons using light, e.g. diagnosis by transillumination, diascopy, fluorescence by tomography, i.e. reconstruction of 3D images from 2D projections
Definitions
- the present inventionrelates to a device and method for detecting, localizing, and characterizing inhomogeneities in a turbid medium, and more particularly relates to an radiative device and method, in this embodiment an optical device and method, for measuring information regarding the course of a radiative wave taken through a medium between illumination and detection, and using said information to detect, localize, or characterize inhomogeneities in said medium.
- ultrasoundas taught in tomographic mode by Whiting et al. (U.S. Pat. No. 4,509,368), while able to be used to image in a turbid medium such as tissue, is not designed to function well when the scattering of radiation is large and no clear echo is received from the object to be imaged. Therefore, scattering remains a major barrier to effective detection and imaging.
- JobsisU.S. Pat. No. 4,805,623 teaches a method of using light to measure concentration, but this concentration is merely quantitated, but not localized, and the detection requires the presence of first and second substances, one of which must be dilute.
- Jobsis' techniquerequires a measurement of both an intensity as well as an "apparent effective pathlength,” which is ill defined.
- ChanceU.S. Pat. No. 5,119,815) also studied the manner in which light travels through tissue, and uses a rate of decay of intensity to determine characteristics of tissue.
- a salient feature of the present inventionis an incorporation of the observation that radiation, while both being scattered and absorbed by scattering media, can be made to penetrate such scattering media such as human tissue, the atmosphere, or even a suitcase in an airport scanner, and then be detected upon reemergence from that material in order to allow quantitation of characteristics of inhomogeneities in the interior of the medium, imaging of such inhomogeneities, or merely detection of such inhomogeneities, or even characterization of the media itself.
- an object of the present inventionis to provide a noninvasive method for detecting the presence of an object or inhomogeneity in a medium using an optical path effect, whether to merely detect such change, to quantify such change, or to localize the change.
- a second objectis to provide a noninvasive method for optically detecting the presence of a change in the state of a medium using an optical path effect, whether to merely detect such change, to quantify such change, or to localize the change.
- a third objectis that such detection can be performed using various types of scattered radiative waves, whether the radiative wave is electromagnetic, electrical, pressure, sound, or of other types of waves known to travel through scattering media.
- Additional objects of the inventionare to detect such inhomogeneity, or a change in such, either by a direct measurement of a change in the paths taken by the radiating wave through the medium, or to detect such effects by measurement of an effect caused by such changes in path, such as the decreased absorption seen when photons travel, on average, less far through a radiation attenuating medium due to the presence of an object which blocks the farthest traveling scattered waves from reaching a detector.
- Such a measurement of a path effect, rather than path itselfmay be more economical to achieve than direct measurement of path itself.
- this techniqueis not limited to the imaging of a medium from the outside (e.g., such as is commonly done in computed x-ray tomography), but also may be used to allow a probe to measure its surrounding medium, such as if a needle is to be inserted into a tumor, to allow sizing and measurement of said tumor from the inside, or if an underwater probe is to take note of objects nearby, such as rocks, when the water is cloudy, to allow better guidance.
- a probeto measure its surrounding medium, such as if a needle is to be inserted into a tumor, to allow sizing and measurement of said tumor from the inside, or if an underwater probe is to take note of objects nearby, such as rocks, when the water is cloudy, to allow better guidance.
- Another objectis that this data can be enhanced by collection over time.
- the value of a measurementis enhanced by determination of temporal characteristics. For example, the detection of an enlarging bleed in head tissue holds a different significance than the detection of a stable, but otherwise similar, bleed. In underwater applications, the ability to detect moving nearby objects may also be important.
- a final objectis that the detection, localization, or imaging information can be presented to the user in a number of ways, such as an image of object location or even an image of characteristics of the medium such as absorbance, in such a manner as to allow the user to gain an incremental understanding of the presence or location of inhomogeneities in the medium, or even an understanding of characteristics of the medium itself.
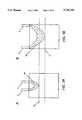
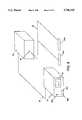
- FIG. 1illustrates the use of the apparatus to detect and localize a freezing interface in freezing tissue
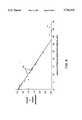
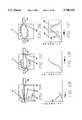
- FIG. 2is a graph of actual optical path length data during a tissue freezing experiment
- FIGS. 3A and 3Billustrate changes in depth of optical penetration with changes in emitter-detector spacing
- FIG. 4is a graph of actual optical absorbance obtained during a tissue freezing experiment
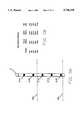
- FIGS. 5A and 5Billustrate optical localization of a freezing interface using an intra-tissue needle probe
- FIGS. 6A and 6B and 6Cillustrate optical detection of an object using a probe in turbid water
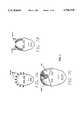
- FIGS. 7A, 7B and 7Cillustrate an actual experiment detecting and localizing fluid collections in a patient's brain
- FIG. 8is a perspective view of a preferred embodiment
- FIG. 9is a block diagram of the major sections of the spectrophotometer.
- FIG. 10illustrates the effect of scattering of light
- FIGS. 11A, 11B, 11C, 11D, 11E and 11Fillustrate a time-of-flight collection of scattered pulsed light
- FIGS. 12A, 12B, 12C, 12D, 12E and 12Fillustrate the effect of an object in turbid media upon time-of-flight curves
- FIG. 13illustrates a one dimensional scan of a turbid medium
- FIGS. 14A and 14Billustrate the formation of an image using data from a two-dimensional scan of a turbid medium.
- the detection of freezing, a change in state, in a turbid liquidmay be important in the monitoring of materials which must be frozen, such as with biologic samples. It may also be important to be able to detect when freezing has been completed, such as the potential use of an optical device to verify that poultry has been fully frozen, in order to minimize time of freezing before removal from a freezing bath, or that human tissue has been adequately frozen during a procedure known as cryosurgery. The reverse problem may also be important, such as verifying that thawing has started or been completed.
- Photons traveling between emitter 2 and detector 4take a range of paths through sample 5.
- the distribution of paths that the majority of photons takefall inside banana-shaped photon density region 12.
- the farthest traveling photons(those penetrating to the bottom of region 12) begin to pass into, and travel through, the frozen portion of the tissue.
- Frozen tissuescatters light differently than does unfrozen tissue, so there are changes in the optical paths taken by those photons entering into the frozen region.
- An increasing number of photons in region 12enter into the frozen tissue as the interface proceeds to mark 11, which is substantially inside region 12. These optical changes continue until the block is fully frozen, at which time all photons pass through frozen tissue.
- the onset of freezing within region 12is easily detected with such a method as a change in optical path length.
- No other method in the prior artwould be able to optically detect this process using a similar effect.
- the opposite processis also be measurable. That is, thawing can also be detected using a similar system.
- treatmentis achieved by freezing the tumor using a liquid nitrogen filled needle stuck into the tumor. This allows killing of the tumor without having to cut up tissue in order to remove it. This is important if the tumor is in an critical location in an important organ, such as the brain or liver. However, it can be difficult to detect when the correct amount of freezing has occurred. If too little tumor tissue is frozen, then the tumor lives and the treatment is ineffective; if too much tumor tissue is frozen, then complications may arise due to the injury of healthy tissue and blood vessels through the freezing process. Thus, localization of the extent of freezing, and not only detection of freezing, can be crucial to a patient's health.
- the freezing frontis about 23 mm away from the probes when the optical path length began to change, shown at point 14, and c) in this case, changes in optical path with changes in freezing depth, between the point changes are first detected and the point at which the tissue is fully frozen, are roughly linearly related (though there also does appear to be some nonlinear change at distances between 23 and 40 mm away from the probes, and in many cases such changes will be nonlinear).
- a calibration curvecan now be constructed by fitting a line to the data collected for mean optical path length versus freezing depth. Any measured optical path can now be converted to an estimated depth by finding an optical path length on the Y-axis of a graph such as shown in FIG.
- banana-shaped region 12is a function of the separation of emitter 2 and detector 4, as shown in FIG. 3.
- deeper banana-region 16illuminates deeper into the tissue in deeper, reaching into tissue to depth 17; whereas moving the probes closer makes for a shallow sample region 18 that illuminates tissue only down to depth 19.
- Path-effect curve 20 in FIG. 4is analogous to measured-path calibration curve 13A, shown in FIG. 3, only it may be simpler to generate absorbance data than path data.
- Such stability of factors other than pathmay not always be present.
- absorbancecan change during freezing, as changes in the absorption spectrum that occur with changes in temperature.
- absorbance, and scatteringmay all occur, such as when the color of the substance changes such as when blood turns more blue due to a lack of oxygen in the freezing tissue.
- a calibration curvewill allow not only detection of the freezing front, but localization of the front as well, such a curve can also be constructed for human tissue.
- a standard length probe sticking into the tissuecould be imaged, and used as an imaging "yardstick" from which depths are judged, or the depth of penetration at which light begins to escape out the other side of a limb may be used to standardize a depth curve.
- each increasing separation of emitter and detector probes a deeper into the mediumas was shown in FIG. 3, multiple depths can be probed by varying the emitter-detector separation. In addition, different areas of the medium can be probed by measuring at different surface locations.
- an imagecan be formed using a temporal or spatial series of such localizing data.
- multiple depthscan be probed using an emitters and detectors centered upon a specific location, while different regions of the medium can be probed by measuring at different surface locations.
- One method of identifying objects based upon a path effectis to calculate a ratio of optical path length to physical separation of emitter and detector.
- This path ratiois constant within a homogeneous medium (though it may vary near the edges), and such information may be abnormal in the presence of an inhomogeneity.
- the direction of the deviation(longer or shorter) may yield clues as to the depth of the detected inhomogeneity and its characteristics.
- This effect of direction of path length deviationoccurs because a shallow object obstructs short-traveling photons, increasing average optical path, whereas a deep object obstructs the long traveling photons, decreasing average optical path, both changes compared to a baseline with no object present at all.
- This "no object” baselinecould be determined from normal tissue (for example, the opposite breast for breast tumor imaging), or from nearby normal tissue, or simply from the average characteristics of all tissue measured.
- FIG. 5Athe deepest portion of the tissue is shown at the top of the illustration, while the skin surface is shown at mark 22A and the freezing interface is shown at mark 22B. Ideal results from such a probe are shown in the table in FIG. 5B.
- the optical average path divided by the physical separation between emitter and detectoris constant at 5.00.
- the path ratiochanges from 5.00 to as high as 10.50 in this example, due to scattering changes in the frozen tissue that must be traversed by photons traveling from emitter 2 to detectors 21C, 21D, and 21N.
- the point at which the path ratio begins to changecan be use to localize the freezing interface.
- Such a probecould also be used to detect tumors or nearby objects using disturbances in this path effect, based upon deviations from an expected or predicted path length.
- a simple proximity detectorcan be constructed from such a system as revealed in example 2, above.
- Proximity detectionsuch as the detection of nearby objects in turbid media can be expensive and complicated.
- the use of the path-effect of a nearby objectallows an inexpensive solution.
- capsule shaped object 22Cis studded with alternating emitters and detectors (FIG. 6A). At any one time, only one pair of emitters and detectors are on, selected from emitters 23A through 23N and detectors 24A through 24N. All possible pairs of emitters and detectors are, in turn, illuminated and detected. A baseline of average path lengths is thus obtained across multiple detector-emitter pairs. Whenever an object approaches, such as object 25 that moves in an axis perpendicular to the long axis of capsule 22C, heading directly for detector 24C, there will be path changes, as shown in the table in FIG. 6B.
- This approachcould be used to form an imaging probe that would be located on the surface of skin, yet able to visualize the structure and character of the tissue below it.
- Thiscould be used as an optical biopsy, characterizing tissue based upon optical properties to distinguish cancer, nerves, blood vessels, plaques on arteries, fat deposits, bleeding, air in tissues, bony growths, swelling, foreign objects, type of fluid in tissues or joints, normal tissue, or other inhomogeneities in tissue from one another.
- Preliminary datashows that the optical characteristics of brain with Alzheimer's disease is quite different from normal brain, and this may be detectable noninvasively using such a method.
- the result of the scan shown in FIG. 7could have been used to guide further medical evaluation or intervention, particularly if the resolution of such a scan can be improved.
- the ice forminghas a unique structure.
- radial ice crystals radiating out from the center of freezingmay form.
- Light traveling along the axis of these crystals, such as if the emitter and detector axis travels through the center of freezing,may undergo changes in absorbance more than changes in scattering as freezing occurs.
- light traveling across the radial ice crystalsmay find that absorbance changes little as freezing occurs, but that scattering changes markedly.
- This difference in effect upon photons during freezing, depending upon the angle of the ice crystals taken,can be used as further information to help localize the center or edges of an advancing ice ball in tissue, gelatin, or other scattering media.
- This effectcould be used, for example, to produce a cryosurgery (tissue freezing) probe studded with emitters and detectors, that allows optical imaging of the freezing front directly below the probe as the surgical procedure is in progress.
- the object being frozenis a tumor, such as a melanoma
- the melanomamay also be visualized, which would allow the surgeon to monitor when the tumor has been fully frozen, or when the freezing front is approaching blood vessels or other structures, or to monitor when the freezing has been irregular and part of the tumor has not yet been frozen.
- a surgical knifestudded with light emitting and detecting fibers.
- Such a knifewould be able to optically image tissue directly under the knife, allowing the surgeon to visualize the tissue and structures about to be cut. If effect, this could allow the surgeon to avoid large blood vessels or nerves, or to better visualize the margins of a tumor during surgery.
- this embodimentconsists of control unit 31, connected by cable 32 to remote processor 33, in turn connected to sensor source 34A and sensor detector 34B by cable 35. Power is controlled by switch 36A and adjustment of the device is provided by controls 36B and 36C. A display panel 37, consisting of one or more lines of readout or an image of the distribution of absorbance is on control unit 31. In addition, cable 35 connects to remote processor 33 by way of detachable plug 38, to allow different probes to be used with the same control unit 31 and remote processor 33 pair.
- controller 40sends signals to pulse generator 41, in turn controlling light output from selected light sources in emitter 43. With each pulsed output, controller 40 also sends a timing pulse to time of flight measurer 45 for use in processing detected signals. Signals returning from study medium 47 are picked up by detector unit 48 and sent to measurer 45 and multichannel recorder 46. Time of flight measurer 45 assesses the delay between emission of a light pulse by emitter 43 and the detection of each photon by detector 48. Time of flight information and distribution are stored in multichannel recorder 46, and output to parameter calculator 49 to localize, detect, or form images of the medium and inhomogeneities, which is made available to the user on output device 50.
- Methods of determining absorbance, derived from intensity or photon counting, and path lengths, derived from window gating,are multiple, but fall within the scope of this invention if used for the determination of a path effect for the purpose of calculating a spatial distribution of inhomogeneities within a medium that scatters radiative waves.
- path lengthsare estimated by directly measuring the time of flight through the study medium of each photon, but the effect can be achieved using an optical gate, modulated light signals, sound waves, pressure waves, or other types of radiative waves that exhibit path effects, which can then be used to measure and characterize inhomogeneities and the medium.
- Operation of the devicecan be illuminated more fully by studying typical waveforms encountered during data acquisition. These ⁇ typical ⁇ waveforms were taken from actual data obtained using one embodiment of the device. These waveforms are provided as examples only, and no limitation of design or operation of the device by the specific patterns discussed below is implied or intended.
- photon movementis shown from left to right, and upward or downward deviation of the photons is representative of scattering.
- timeis always shown on the x-axis and instantaneous intensity is shown on the y-axis, but neither axis is shown to scale as compression or expansion of each axis has been performed where needed for purpose of clarity.
- emitter 43emits a pulse of photons 51 into study medium 47. Scattering lengthens the distance traveled by photons between emitter 43 and detector 48, and thus delays arrival of the photons at the detector. Minimally scattering photons 55 travel the most direct line between emitter 43 and detector 48, and thus arrive first, while other photons scatter moderately 57 or greatly 59, and thus arrive later. Most of the initial pulse of photons 51 scatter moderately, and these photons arrive at detector 48 after the minimally scattering photons have arrived, but before the greatly scattering photons do so.
- FIG. 11the top figures (FIGS. 11A, 11C, and 11E) are similar to FIG. 10, and show the passage of a group of photons through a study medium over time, while the lower figures (FIGS. 11B, 11D, and 11F) show the voltage at output 61 from detector 48 at the same instant in time as the figure above.
- photon pulse 51consisting of a group of photons all emitted from emitter 43 at about the same instant, has already traveled into medium 47. Minimally scattering photons 55 have passed entirely through the medium, and are arriving at detector 48.
- Moderately scattering photons 57 and greatly scattering photons 59are all still traveling through the medium, as they have taken a longer route due to increased scattering.
- output 61 of detector 48is shown at the same time point as FIG. 11A. Output 61 is non-zero and rising, reflecting the arrival of minimally scattering photons 55 at detector 48. Moderately-scattering photons 57 and greatly-scattering photons 59 are still en route to the detector, and thus have not registered at this time. In FIGS. 11A and 11B only minimally scattering photons have had enough time to reach detector 48, whereas in FIG.
- FIG. 11Cmore time has elapsed such that moderately scattering photons 57 are now arriving at detector 48. Greatly scattering photons 59 still have not yet reached detector 48.
- FIG. 11Dshows that output 61 of detector 48 is now maximized. This is because the most of the photons from pulse 51 scatter moderately.
- FIG. 11Eyet more time has passed, and greatly-scattering photons 59 are now finally arriving at detector 48.
- FIG. 11Fthe intensity reflects the greatly scattering photons.
- Time-intensity curve 63represents the intensity of light at detector 48 over time in the absence of any object placed between emitter and detector, and will be referred to as reference time-intensity curve 63.
- Different portions of reference curve 63represent photons with different amounts of scattering.
- the left-most portion of the curverepresents intensity of minimally scattering photons 65; the middle portion represents intensity of moderately scattering photons 67; the right-most region represents intensity of greatly scattering photons 69.
- the earliest detected photons in reference waveform 63have traveled the least far, while the latest detected photons have traveled the furthest of all.
- time-intensity curvea reflection of when photons arrive at detector 48, can be modified by material through which the light passes (FIGS. 12A-12F).
- FIG. 12Alight-blocking solid rod 87 has been placed such that it blocks the direct path between source 43 and detector 48. Minimally scattering photons 55 are completely stopped by rod 87, while moderately scattering 57 and greatly scattering 59 photons pass unimpeded by traveling around the rod.
- FIG. 12Bshows up at then output of detector 48 as time-intensity curve 93, which is flattened in the early part as compared to reference wave 63.
- FIG. 12Crepresenting the same event as in FIG.
- time-intensity curve 91shows both moderately scattering photons 57 and greatly scattering photons 59 arriving normally at the detector, and thus the last half of time-intensity curve 91 is very similar to reference wave 63.
- time-intensity curve 93is studied in FIG. 12D, intensity of minimally scattering photons 65 is much less than in reference curve 63, while intensity of the moderately-scattering 67 and greatly scattering photons 69 are the same for both curves.
- FIG. 12Eshows the effect of rods 103 and 105 on dual-blocked time-intensity curve 107, as compared to reference waveform 63. Intensity of minimally scattered photons 65 is the same for both reference and rod-blocked waveforms, whereas intensity of moderately scattering photons 67 and greatly scattering photons 69 is reduced in curve 107 compared to reference curve 63.
- time-intensity curvesmay be obtained from a single object as a first step toward making an image.
- time-intensity curvesare measured at five locations on object 113.
- Object 113consists of mildly absorbent outside layer 115 surrounding highly scattering and absorbent core 117.
- emitter 43is positioned at 131 and detector 48 is positioned at 133.
- the resultis time-intensity curve 135, which is compared to reference curve 63 (shown as a dashed line).
- a narrow measurement windowis defined as the interval between time marks 137 and 138.
- This narrow windowrestricts optical path length measurement (in this example) to the early portion of the time-intensity curve, the portion that represents the arrival of the first 1% of the detected photons, which is primarily composed of minimally scattering photons 65.
- an objectmay be scanned in two or more dimensions.
- a two-dimensional scan of object 113could yield the data table of early photon optical path lengths shown in FIG. 14A.
- This data tablewould represent the change in optical path length for the early arriving photons, compared to a reference, and would be measured at multiple locations in two dimensions. Increasing the number of columns and rows measured improves resolution, while graphing the results, as shown in FIG. 14B facilitates interpretation of the image.
- This techniquecan easily be extended to three dimensions, using multiple axes of scanning and the effect of emitter-detector separation to influence measurement depth, to allow tomographic imaging.
- the resulting imagecan be related to the distribution of absorbance, concentration, scattering, or other features of the study medium.
- the length of the photon path traveled by certain groups of photons, such as the early photons,could serve as the basis for the image.
- an amplitude-modulated signalcould be introduced into the sample.
- the detected wavewould be offset in time by some amount.
- This offseta representation of some averaging function of all courses taken by the radiative wave, could be deduced by timing the offset of the wave.
- One method to do sois to measure the phase angle of the radiative wave, the offset in terms of degrees or radians, that the wave has been delayed. Knowing the delay angle, called the angle of phase delay or angular phase of the signal, and knowing both the modulation frequency and the speed of radiative wave travel in the medium, the time of offset may be calculated and converted into distance traveled.
- Such modulated wavesmay also be added and subtracted.
- phase thresholdsuch as the null-phase threshold at which the phase is exactly 90 degrees offset from each emitter, and monitor the location of this threshold.
- This null phase lineor any other phase line (such as the 45 degree phase line), can be used as a path effect function in order to estimate the location of inhomogeneities in the medium.
- the modulated signalcould also be frequency-modulated, as different frequencies of modulation would allow different structural information to be assessed, similar to the use of varying frequencies in radar or in ultrasound in order to gain additional structural information.
- This algorithm Pwhich will be used to perform detection or imaging, may be considered a function of the measured path effect F(x,y,z,t), as well as of other factors G(x,y,z,t).
- a calibration algorithmmay be written, just as was done in the preceding examples, and used to determine the presence, location, or structure of an inhomogeneity.
- the device or method usedmust provide the necessary structure or steps to perform such measurements, thus allowing the image or detection to be performed.
- the solution used in imagingmay not even be remotely mathematical in nature (for example, the solution could be achieved structurally), and the equational description above is provided simply for illustrative purposes of the fact that whatever physical property is measured, that this property should be at least a function of path effect; however, the use of such equations is not intended in any way to indicate that the method and apparatus described are reducible to structureless mathematical functions.
- the detection and localization of an inhomogeneityhave been disclosed.
- the presence, location, or structure of an inhomogeneitycan be disclosed to the user by presenting the data in an interpretable form, including but not limited to, presence, spatial location, radial direction, radial distance, shape, distribution, number, depth, distance, structure, absorbance, scattering coefficient, modified scattering coefficient, anisotropy factor, and coefficient of absorbance of at least one inhomogeneity.
- Absorbanceis a function specified by Beer's Law, where absorbance (A), related to the log of the ratio of intensity of the emitted signal divided by the intensity of the detected signal, is equal to a constant (called the extinction coefficient, ⁇ , which is known for many substances or can be measured) times the concentration of the substance (C) times the optical path length (L). Beer's law is not well suited to highly scattering media. In scattering substances, the intensity of the detected light falls off as the intensity of the emitted light times e to a negative number, with that number proportional to ⁇ a +(1-g)* ⁇ s . Mu with the ⁇ a ⁇ subscript is the coefficient of absorbance, while mu with an ⁇ s ⁇ subscript is the coefficient of scattering.
- the effective, or apparent, scattering in tissueis related to the anisotropy constant ⁇ g ⁇ that corrects for the tendency of photons to travel in a forward direction in tissue after scattering.
- ⁇ g ⁇anisotropy constant
- Each of these numberscan be determined and used as an imaging variable. For example, it is known that different kinds of tissue, such as tumors, have different optical properties than other kinds of tissue, and the above factors may each vary between different types of tissue, or between different media.
- Another modificationis to use the collection of multiple samples over time. Repeated measures can help average out noise in a sample measurement, and thus help give improved accuracy.
- the use of multiple measurementscan allow changes in the medium to be detected. For example, while imaging of the nearby medium may be complex, the detection of changes in the medium may prove a simpler calculation.
- changes in the calculated valuescan be used to identify changes in the nearby medium, or to allow cancellation of unknowns by determining the net change in a measured parameter.
- An example of the latter effectwould be the determination of change in absorbance ( ⁇ A) in a system in which this change will allow calculation of a change in concentration ( ⁇ C) using a Beer's Law approximation. In this case, it may not be important what the starting conditions are, only the a change has occurred.
- the collection of multiple samples over spacemay allow better image formation by allowing measurement of the medium at multiple locations.
- the measurements made with such a devicecan be made more accurate if corrections are made given information known about the medium.
- the known reference path lengthcan be used to determine the zero point for ⁇ L.
- a known measurement of some known concentrationmay allow fine-tuning of the estimate, such that all recorded changes could be computed in absolute terms, rather than in relative terms.
- the device as describedis capable of measuring the spatial distribution of light absorbing or other radiation absorbing substances contained in a radiation scattering media.
- the device as disclosedshould be able to operate using any radiative wave in a wave scattering medium.
- the technology cited in this embodimentis currently available to construct this device inexpensively, to make the device portable, and to have it operate in real time.
- construction and methods of this deviceare unique, distinct from other spectrophotometers in the art. Multiple, significant advantages of this design are inherent from an incorporation of both time of flight and absorbance measurements.
- the devicehas been built and tested in several configurations, and has immediate application to several important problems, both medical and industrial, and thus constitutes an important advance in the art.
Landscapes
- Health & Medical Sciences (AREA)
- Life Sciences & Earth Sciences (AREA)
- Physics & Mathematics (AREA)
- General Health & Medical Sciences (AREA)
- Surgery (AREA)
- Biomedical Technology (AREA)
- Engineering & Computer Science (AREA)
- Heart & Thoracic Surgery (AREA)
- Medical Informatics (AREA)
- Molecular Biology (AREA)
- Pathology (AREA)
- Animal Behavior & Ethology (AREA)
- Public Health (AREA)
- Veterinary Medicine (AREA)
- Biophysics (AREA)
- Optics & Photonics (AREA)
- Spectroscopy & Molecular Physics (AREA)
- Chemical & Material Sciences (AREA)
- Analytical Chemistry (AREA)
- Biochemistry (AREA)
- General Physics & Mathematics (AREA)
- Immunology (AREA)
- Neurology (AREA)
- Nuclear Medicine, Radiotherapy & Molecular Imaging (AREA)
- Otolaryngology (AREA)
- Investigating Or Analysing Materials By Optical Means (AREA)
Abstract
Description
______________________________________ 4,509,368 4/1985 Whiting et al. 73/624 4,765,736 8/1988 Gallagher et al. 356/300 4,773,097 9/1988 Suzaki et al. 382/6 4,805,623 2/1989 Jobsis 128/633 4,872,187 10/1989 Nakahata et al. 378/4 4,910,404 3/1990 Cho et al. 250/358 5,119,815 6/1992 Chance 128/633 ______________________________________
______________________________________ 2 emitter on tissue cube 4 detector on tissue cube 5 tissue sample 6 thermal heating/cooling plate 8 interface 35 mm from probes 9 interface 30 mm from probes 10 interface 25 mm from probes 11 interface 20 mm from probes 12 banana shaped photon path distribution 13A average photon path length calibration curve 13B first arriving photon path length curve 14 mark where path length changes appear 15 mark where tissue fully frozen 16 shallow traveling banana-shaped region 17 maximum shallow banana photon depth 18 deep traveling banana-shaped region 19 maximum deep banana photon depth 20 absorbance path-effect calibration curve 21A-N detector array 22A skin interface 22B freezing interface 22C sensing capsule 23A-N emitter array 24A-N detector array 25 object to be detected 26A-N marks on scalp from right to left ear 27A-N marks on right scalp from front to back 28A-N marks on left scalp from front to back 29L Fluid in left brain 29R Fluid in right brain 31 control unit 32 cable 33 remote processor 34A sensor source 34B sensor detector 35 cable 36A power switch 36B-C adjust 37 display panel 38 detachable plug 40 controller 41 pulse generator 43 light emitter(s) 45 time-of-flight measurer 46 multichannel recorder 47 study medium 48 light detector(s) 49 parameter calculator 50 output device 51 light pulse 55 minimally scattering photons 57 moderately scattering photons 59 greatly scattering photons 61 output from intensity calculator 46 63 reference time intensity curve 65 intensity of minimally scattering photons 67 intensity of moderately scattering photons 69 intensity of greatly scattering photons 87 light-blocking solid rod 93 time intensity curve w/central blocking rod 103 solid rods left of center of light beam 105 solid rod right of center of light beam 107 time intensity curve w/off-center rods 113 object to be measured 115 mildly light absorbent layer 117 highly absorbent core 131 initial emitter position 133 initial detector position 135 initial time-intensity curve 137 start of narrow measurement window 138 end of narrow measurement window 139 numerical result of initial scan 141 second emitter position 143 second detector position 144 region interrupting second scan 145 second time-intensity curve 149 numerical result of second scan 151 third emitter position 153 third detector position 155 third time-intensity curve 159 numerical result of third scan 161 fourth emitter position 163 fourth detector position 169 numerical result of fourth scan 171 last emitter position 173 last detector position 179 numerical result of last scan ______________________________________
Claims (15)
Priority Applications (8)
| Application Number | Priority Date | Filing Date | Title |
|---|---|---|---|
| US08/024,278US5746210A (en) | 1993-02-26 | 1993-02-26 | Device and method for detection, localization, and characterization of inhomogeneities in turbid media |
| US08/486,604US5807261A (en) | 1992-09-14 | 1995-06-07 | Noninvasive system for characterizing tissue in vivo |
| US08/474,263US5762609A (en) | 1992-09-14 | 1995-06-07 | Device and method for analysis of surgical tissue interventions |
| US08/473,004US5785658A (en) | 1992-09-14 | 1995-06-07 | In vivo tissue analysis methods and apparatus |
| US08/472,863US5769791A (en) | 1992-09-14 | 1995-06-07 | Tissue interrogating device and methods |
| US08/725,239US5752519A (en) | 1993-02-26 | 1996-10-04 | Device and method for detection, localization, and characterization of inhomogeneities in turbid media |
| US08/771,952US5987346A (en) | 1993-02-26 | 1996-12-23 | Device and method for classification of tissue |
| US09/012,602US6594518B1 (en) | 1993-02-26 | 1998-01-23 | Device and method for classification of tissue |
Applications Claiming Priority (1)
| Application Number | Priority Date | Filing Date | Title |
|---|---|---|---|
| US08/024,278US5746210A (en) | 1993-02-26 | 1993-02-26 | Device and method for detection, localization, and characterization of inhomogeneities in turbid media |
Related Child Applications (6)
| Application Number | Title | Priority Date | Filing Date |
|---|---|---|---|
| US07/944,516Continuation-In-PartUS5460182A (en) | 1992-09-14 | 1992-09-14 | Tissue penetrating apparatus and methods |
| US08/486,604Continuation-In-PartUS5807261A (en) | 1992-09-14 | 1995-06-07 | Noninvasive system for characterizing tissue in vivo |
| US08/473,004Continuation-In-PartUS5785658A (en) | 1992-09-14 | 1995-06-07 | In vivo tissue analysis methods and apparatus |
| US08/474,263Continuation-In-PartUS5762609A (en) | 1992-09-14 | 1995-06-07 | Device and method for analysis of surgical tissue interventions |
| US08/725,239ContinuationUS5752519A (en) | 1993-02-26 | 1996-10-04 | Device and method for detection, localization, and characterization of inhomogeneities in turbid media |
| US08/771,952Continuation-In-PartUS5987346A (en) | 1993-02-26 | 1996-12-23 | Device and method for classification of tissue |
Publications (1)
| Publication Number | Publication Date |
|---|---|
| US5746210Atrue US5746210A (en) | 1998-05-05 |
Family
ID=21819774
Family Applications (2)
| Application Number | Title | Priority Date | Filing Date |
|---|---|---|---|
| US08/024,278Expired - LifetimeUS5746210A (en) | 1992-09-14 | 1993-02-26 | Device and method for detection, localization, and characterization of inhomogeneities in turbid media |
| US08/725,239Expired - LifetimeUS5752519A (en) | 1993-02-26 | 1996-10-04 | Device and method for detection, localization, and characterization of inhomogeneities in turbid media |
Family Applications After (1)
| Application Number | Title | Priority Date | Filing Date |
|---|---|---|---|
| US08/725,239Expired - LifetimeUS5752519A (en) | 1993-02-26 | 1996-10-04 | Device and method for detection, localization, and characterization of inhomogeneities in turbid media |
Country Status (1)
| Country | Link |
|---|---|
| US (2) | US5746210A (en) |
Cited By (28)
| Publication number | Priority date | Publication date | Assignee | Title |
|---|---|---|---|---|
| US5941827A (en)* | 1996-04-02 | 1999-08-24 | U.S. Philips Corporation | Localization of an object in a turbid medium using radiation of different wavelengths |
| US20030002028A1 (en)* | 2001-05-17 | 2003-01-02 | Rice Bradley W. | Method and apparatus for determining target depth, brightness and size within a body region |
| US20040021771A1 (en)* | 2002-07-16 | 2004-02-05 | Xenogen Corporation | Method and apparatus for 3-D imaging of internal light sources |
| US20040264751A1 (en)* | 2003-06-27 | 2004-12-30 | Avinash Gopal B. | Systems and methods for correcting inhomogeneity in images |
| US20060268153A1 (en)* | 2005-05-11 | 2006-11-30 | Xenogen Corporation | Surface contruction using combined photographic and structured light information |
| US20070253908A1 (en)* | 2002-07-16 | 2007-11-01 | Xenogen Corporation | Fluorescent light tomography |
| US7298415B2 (en) | 2001-07-13 | 2007-11-20 | Xenogen Corporation | Structured light imaging apparatus |
| US20080052052A1 (en)* | 2006-08-24 | 2008-02-28 | Xenogen Corporation | Apparatus and methods for determining optical tissue properties |
| US7884933B1 (en) | 2010-05-05 | 2011-02-08 | Revolutionary Business Concepts, Inc. | Apparatus and method for determining analyte concentrations |
| US20120169848A1 (en)* | 2010-12-29 | 2012-07-05 | Samsung Electronics Co., Ltd. | Image Processing Systems |
| US8551088B2 (en) | 2008-03-31 | 2013-10-08 | Applied Medical Resources Corporation | Electrosurgical system |
| US20140142841A1 (en)* | 2011-07-15 | 2014-05-22 | Samsung Heavy Ind. Co., Ltd | Apparatus for measuring location of underwater vehicle and method thereof |
| US8792951B1 (en) | 2010-02-23 | 2014-07-29 | Vioptix, Inc. | Bone oxygenation measurement |
| US8821397B2 (en) | 2010-09-28 | 2014-09-02 | Masimo Corporation | Depth of consciousness monitor including oximeter |
| US9114226B1 (en) | 2009-07-08 | 2015-08-25 | Vioptix, Inc. | Devices and monitoring systems for locating a blood vessel |
| USD748259S1 (en) | 2014-12-29 | 2016-01-26 | Applied Medical Resources Corporation | Electrosurgical instrument |
| US9320563B2 (en) | 2010-10-01 | 2016-04-26 | Applied Medical Resources Corporation | Electrosurgical instruments and connections thereto |
| US9339221B1 (en) | 2009-03-24 | 2016-05-17 | Vioptix, Inc. | Diagnosing intestinal ischemia based on oxygen saturation measurements |
| US9775545B2 (en) | 2010-09-28 | 2017-10-03 | Masimo Corporation | Magnetic electrical connector for patient monitors |
| US10149713B2 (en) | 2014-05-16 | 2018-12-11 | Applied Medical Resources Corporation | Electrosurgical system |
| US10154815B2 (en) | 2014-10-07 | 2018-12-18 | Masimo Corporation | Modular physiological sensors |
| US10420603B2 (en) | 2014-12-23 | 2019-09-24 | Applied Medical Resources Corporation | Bipolar electrosurgical sealer and divider |
| US10792092B2 (en) | 2014-05-30 | 2020-10-06 | Applied Medical Resources Corporation | Electrosurgical seal and dissection systems |
| CN111836570A (en)* | 2018-01-09 | 2020-10-27 | 爱丁堡大学董事会 | Imaging systems and methods |
| US11331038B2 (en)* | 2012-03-08 | 2022-05-17 | Koninklijke Philips N.V. | Apparatus for determining a property of a tissue |
| US11696796B2 (en) | 2018-11-16 | 2023-07-11 | Applied Medical Resources Corporation | Electrosurgical system |
| US11730370B2 (en) | 2006-08-24 | 2023-08-22 | Xenogen Corporation | Spectral unmixing for in-vivo imaging |
| US11864812B2 (en) | 2018-09-05 | 2024-01-09 | Applied Medical Resources Corporation | Electrosurgical generator control system |
Families Citing this family (19)
| Publication number | Priority date | Publication date | Assignee | Title |
|---|---|---|---|---|
| US5353799A (en)* | 1991-01-22 | 1994-10-11 | Non Invasive Technology, Inc. | Examination of subjects using photon migration with high directionality techniques |
| GB9823452D0 (en)* | 1998-10-28 | 1998-12-23 | Rolfe Peter | Improvements to optical monitoring |
| US6285904B1 (en)* | 2000-03-27 | 2001-09-04 | Sandia Corporation | Method and apparatus for determining fat content of tissue |
| WO2002012869A1 (en)* | 2000-08-09 | 2002-02-14 | Türkiye Sise Ve Cam Farbrikalari A.S. | Method and apparatus for imaging inhomogeneity in a transparent solid medium |
| US7221969B2 (en)* | 2002-02-27 | 2007-05-22 | Neurophysics Corporation | Method and apparatus for determining cerebral oxygen saturation |
| US6871148B2 (en)* | 2002-07-02 | 2005-03-22 | Battelle Memorial Institute | Ultrasonic system and technique for fluid characterization |
| WO2005008195A2 (en)* | 2003-07-16 | 2005-01-27 | Mcgill University | Quantification of optical properties in scattering media using fractal analysis of photon distribution measurements |
| JP4517145B2 (en)* | 2004-09-02 | 2010-08-04 | 国立大学法人北海道大学 | Light scattering device, light scattering measurement method, light scattering analysis device, and light scattering measurement analysis method |
| US7446875B2 (en)* | 2004-11-15 | 2008-11-04 | Imaging Diagnostic Systems, Inc. | Apparatus and method for acquiring time-resolved measurements utilizing direct digitization of the temporal point spread function of the detected light |
| GB0426993D0 (en)* | 2004-12-09 | 2005-01-12 | Council Cent Lab Res Councils | Apparatus for depth-selective raman spectroscopy |
| GB0606891D0 (en)* | 2006-04-05 | 2006-05-17 | Council Cent Lab Res Councils | Raman Analysis Of Pharmaceutical Tablets |
| WO2007060467A1 (en)* | 2005-11-25 | 2007-05-31 | The Science And Technology Facilities Council | Security screening using raman analysis |
| US8352008B2 (en)* | 2009-06-10 | 2013-01-08 | Medtronic, Inc. | Active noise cancellation in an optical sensor signal |
| US8346332B2 (en)* | 2009-06-10 | 2013-01-01 | Medtronic, Inc. | Absolute calibrated tissue oxygen saturation and total hemoglobin volume fraction |
| WO2010144670A1 (en)* | 2009-06-10 | 2010-12-16 | Medtronic, Inc. | Device and method for monitoring of absolute oxygen saturation and tissue hemoglobin concentration |
| US9126049B2 (en)* | 2009-06-10 | 2015-09-08 | Medtronic, Inc. | Shock reduction using absolute calibrated tissue oxygen saturation and total hemoglobin volume fraction |
| US8571620B2 (en)* | 2009-06-10 | 2013-10-29 | Medtronic, Inc. | Tissue oxygenation monitoring in heart failure |
| US20110066017A1 (en)* | 2009-09-11 | 2011-03-17 | Medtronic, Inc. | Method and apparatus for post-shock evaluation using tissue oxygenation measurements |
| US9063074B2 (en)* | 2010-12-30 | 2015-06-23 | Empire Technology Development Llc | Analyzing tissue morphology in three dimensions |
Citations (25)
| Publication number | Priority date | Publication date | Assignee | Title |
|---|---|---|---|---|
| US3674008A (en)* | 1970-07-13 | 1972-07-04 | Battelle Development Corp | Quantitative pulsed transilluminator and method of operation |
| US4509368A (en)* | 1981-06-22 | 1985-04-09 | The Commonwealth Of Australia | Ultrasound tomography |
| US4555179A (en)* | 1982-11-08 | 1985-11-26 | John Langerholc | Detection and imaging of objects in scattering media by light irradiation |
| US4765736A (en)* | 1986-07-24 | 1988-08-23 | Electric Power Research Institute | Frequency modulation spectroscopy using dual frequency modulation and detection |
| US4773097A (en)* | 1984-05-31 | 1988-09-20 | Omron Tateisi Electronics Co. | Image analyzing apparatus |
| US4805623A (en)* | 1987-09-04 | 1989-02-21 | Vander Corporation | Spectrophotometric method for quantitatively determining the concentration of a dilute component in a light- or other radiation-scattering environment |
| US4810875A (en)* | 1987-02-02 | 1989-03-07 | Wyatt Technology Corporation | Method and apparatus for examining the interior of semi-opaque objects |
| US4872187A (en)* | 1987-02-27 | 1989-10-03 | Hitachi, Ltd. | X-ray tomographic imaging system and method |
| US4910404A (en)* | 1988-02-17 | 1990-03-20 | Sumitomo Electric Industries, Ltd. | CT computed tomograph |
| US4948974A (en)* | 1984-06-25 | 1990-08-14 | Nelson Robert S | High resolution imaging apparatus and method for approximating scattering effects |
| US5070874A (en)* | 1990-01-30 | 1991-12-10 | Biocontrol Technology, Inc. | Non-invasive determination of glucose concentration in body of patients |
| US5088493A (en)* | 1984-08-07 | 1992-02-18 | Sclavo, S.P.A. | Multiple wavelength light photometer for non-invasive monitoring |
| US5099123A (en)* | 1989-05-23 | 1992-03-24 | Biosensors Technology, Inc. | Method for determining by absorption of radiations the concentration of substances in absorbing and turbid matrices |
| US5119815A (en)* | 1988-12-21 | 1992-06-09 | Nim, Incorporated | Apparatus for determining the concentration of a tissue pigment of known absorbance, in vivo, using the decay characteristics of scintered electromagnetic radiation |
| US5137355A (en)* | 1988-06-08 | 1992-08-11 | The Research Foundation Of State University Of New York | Method of imaging a random medium |
| US5148022A (en)* | 1989-02-15 | 1992-09-15 | Hitachi, Ltd. | Method for optically inspecting human body and apparatus for the same |
| US5203339A (en)* | 1991-06-28 | 1993-04-20 | The Government Of The United States Of America As Represented By The Secretary Of The Department Health And Human Services | Method and apparatus for imaging a physical parameter in turbid media using diffuse waves |
| US5213105A (en)* | 1990-12-04 | 1993-05-25 | Research Corporation Technologies, Inc. | Frequency domain optical imaging using diffusion of intensity modulated radiation |
| US5257087A (en)* | 1990-05-21 | 1993-10-26 | Kowa Company Ltd. | Method and apparatus for measuring particles in a fluid |
| US5275168A (en)* | 1992-03-31 | 1994-01-04 | The United States Of America As Represented By The Secretary Of The Navy | Time-gated imaging through dense-scattering materials using stimulated Raman amplification |
| US5293210A (en)* | 1992-04-24 | 1994-03-08 | Becton, Dickinson And Company | Detection of bacteria in blood culture bottles by time-resolved light scattering and absorption measurement |
| US5333610A (en)* | 1991-03-27 | 1994-08-02 | Otsuka Electronics Co., Ltd. | Absorption spectrum determining method and spectrometric measuring apparatus for light-diffusive object using the method |
| US5371368A (en)* | 1992-07-23 | 1994-12-06 | Alfano; Robert R. | Ultrafast optical imaging of objects in a scattering medium |
| US5385143A (en)* | 1992-02-06 | 1995-01-31 | Nihon Kohden Corporation | Apparatus for measuring predetermined data of living tissue |
| US5447159A (en)* | 1993-02-03 | 1995-09-05 | Massachusetts Institute Of Technology | Optical imaging for specimens having dispersive properties |
- 1993
- 1993-02-26USUS08/024,278patent/US5746210A/ennot_activeExpired - Lifetime
- 1996
- 1996-10-04USUS08/725,239patent/US5752519A/ennot_activeExpired - Lifetime
Patent Citations (25)
| Publication number | Priority date | Publication date | Assignee | Title |
|---|---|---|---|---|
| US3674008A (en)* | 1970-07-13 | 1972-07-04 | Battelle Development Corp | Quantitative pulsed transilluminator and method of operation |
| US4509368A (en)* | 1981-06-22 | 1985-04-09 | The Commonwealth Of Australia | Ultrasound tomography |
| US4555179A (en)* | 1982-11-08 | 1985-11-26 | John Langerholc | Detection and imaging of objects in scattering media by light irradiation |
| US4773097A (en)* | 1984-05-31 | 1988-09-20 | Omron Tateisi Electronics Co. | Image analyzing apparatus |
| US4948974A (en)* | 1984-06-25 | 1990-08-14 | Nelson Robert S | High resolution imaging apparatus and method for approximating scattering effects |
| US5088493A (en)* | 1984-08-07 | 1992-02-18 | Sclavo, S.P.A. | Multiple wavelength light photometer for non-invasive monitoring |
| US4765736A (en)* | 1986-07-24 | 1988-08-23 | Electric Power Research Institute | Frequency modulation spectroscopy using dual frequency modulation and detection |
| US4810875A (en)* | 1987-02-02 | 1989-03-07 | Wyatt Technology Corporation | Method and apparatus for examining the interior of semi-opaque objects |
| US4872187A (en)* | 1987-02-27 | 1989-10-03 | Hitachi, Ltd. | X-ray tomographic imaging system and method |
| US4805623A (en)* | 1987-09-04 | 1989-02-21 | Vander Corporation | Spectrophotometric method for quantitatively determining the concentration of a dilute component in a light- or other radiation-scattering environment |
| US4910404A (en)* | 1988-02-17 | 1990-03-20 | Sumitomo Electric Industries, Ltd. | CT computed tomograph |
| US5137355A (en)* | 1988-06-08 | 1992-08-11 | The Research Foundation Of State University Of New York | Method of imaging a random medium |
| US5119815A (en)* | 1988-12-21 | 1992-06-09 | Nim, Incorporated | Apparatus for determining the concentration of a tissue pigment of known absorbance, in vivo, using the decay characteristics of scintered electromagnetic radiation |
| US5148022A (en)* | 1989-02-15 | 1992-09-15 | Hitachi, Ltd. | Method for optically inspecting human body and apparatus for the same |
| US5099123A (en)* | 1989-05-23 | 1992-03-24 | Biosensors Technology, Inc. | Method for determining by absorption of radiations the concentration of substances in absorbing and turbid matrices |
| US5070874A (en)* | 1990-01-30 | 1991-12-10 | Biocontrol Technology, Inc. | Non-invasive determination of glucose concentration in body of patients |
| US5257087A (en)* | 1990-05-21 | 1993-10-26 | Kowa Company Ltd. | Method and apparatus for measuring particles in a fluid |
| US5213105A (en)* | 1990-12-04 | 1993-05-25 | Research Corporation Technologies, Inc. | Frequency domain optical imaging using diffusion of intensity modulated radiation |
| US5333610A (en)* | 1991-03-27 | 1994-08-02 | Otsuka Electronics Co., Ltd. | Absorption spectrum determining method and spectrometric measuring apparatus for light-diffusive object using the method |
| US5203339A (en)* | 1991-06-28 | 1993-04-20 | The Government Of The United States Of America As Represented By The Secretary Of The Department Health And Human Services | Method and apparatus for imaging a physical parameter in turbid media using diffuse waves |
| US5385143A (en)* | 1992-02-06 | 1995-01-31 | Nihon Kohden Corporation | Apparatus for measuring predetermined data of living tissue |
| US5275168A (en)* | 1992-03-31 | 1994-01-04 | The United States Of America As Represented By The Secretary Of The Navy | Time-gated imaging through dense-scattering materials using stimulated Raman amplification |
| US5293210A (en)* | 1992-04-24 | 1994-03-08 | Becton, Dickinson And Company | Detection of bacteria in blood culture bottles by time-resolved light scattering and absorption measurement |
| US5371368A (en)* | 1992-07-23 | 1994-12-06 | Alfano; Robert R. | Ultrafast optical imaging of objects in a scattering medium |
| US5447159A (en)* | 1993-02-03 | 1995-09-05 | Massachusetts Institute Of Technology | Optical imaging for specimens having dispersive properties |
Non-Patent Citations (6)
| Title |
|---|
| Benaron, "2D and 3D Images of thick tissue . . .", SPIE 1641:35-45 (1992). |
| Benaron, "Imaging (NIRI) and quantitation (NIRS) in tissue . . ." SPIE 1888 (in press) (1993). |
| Benaron, "Optical time of Flight Imaging of Biologic Media", Science, in press (1993). |
| Benaron, 2D and 3D Images of thick tissue . . . , SPIE 1641:35 45 (1992).* |
| Benaron, Imaging (NIRI) and quantitation (NIRS) in tissue . . . SPIE 1888 (in press) (1993).* |
| Benaron, Optical time of Flight Imaging of Biologic Media , Science, in press (1993).* |
Cited By (92)
| Publication number | Priority date | Publication date | Assignee | Title |
|---|---|---|---|---|
| US5941827A (en)* | 1996-04-02 | 1999-08-24 | U.S. Philips Corporation | Localization of an object in a turbid medium using radiation of different wavelengths |
| US20070270697A1 (en)* | 2001-05-17 | 2007-11-22 | Xenogen Corporation | Method and apparatus for determining target depth, brightness and size within a body region |
| US20030002028A1 (en)* | 2001-05-17 | 2003-01-02 | Rice Bradley W. | Method and apparatus for determining target depth, brightness and size within a body region |
| US8825140B2 (en) | 2001-05-17 | 2014-09-02 | Xenogen Corporation | Imaging system |
| US8180435B2 (en)* | 2001-05-17 | 2012-05-15 | Xenogen Corporation | Method and apparatus for determining target depth, brightness and size within a body region |
| US20100262019A1 (en)* | 2001-05-17 | 2010-10-14 | Xenogen Corporation | Method and apparatus for determining target depth, brightness and size within a body region |
| US7764986B2 (en) | 2001-05-17 | 2010-07-27 | Xenogen Corporation | Method and apparatus for determining target depth, brightness and size within a body region |
| US7403812B2 (en)* | 2001-05-17 | 2008-07-22 | Xenogen Corporation | Method and apparatus for determining target depth, brightness and size within a body region |
| US7298415B2 (en) | 2001-07-13 | 2007-11-20 | Xenogen Corporation | Structured light imaging apparatus |
| US8279334B2 (en) | 2001-07-13 | 2012-10-02 | Xenogen Corporation | Structured light imaging apparatus |
| US20080079802A1 (en)* | 2001-07-13 | 2008-04-03 | Xenogen Corporation | Structured light imaging apparatus |
| US20100022872A1 (en)* | 2002-07-16 | 2010-01-28 | Xenogen Corporation | Method and apparatus for 3-d imaging of internal light sources |
| US8909326B2 (en) | 2002-07-16 | 2014-12-09 | Xenogen Corporation | Method and apparatus for 3-D imaging of internal light sources |
| US20040021771A1 (en)* | 2002-07-16 | 2004-02-05 | Xenogen Corporation | Method and apparatus for 3-D imaging of internal light sources |
| US20070253908A1 (en)* | 2002-07-16 | 2007-11-01 | Xenogen Corporation | Fluorescent light tomography |
| US7555332B2 (en) | 2002-07-16 | 2009-06-30 | Xenogen Corporation | Fluorescent light tomography |
| US7599731B2 (en) | 2002-07-16 | 2009-10-06 | Xenogen Corporation | Fluorescent light tomography |
| US7603167B2 (en) | 2002-07-16 | 2009-10-13 | Xenogen Corporation | Method and apparatus for 3-D imaging of internal light sources |
| US7616985B2 (en) | 2002-07-16 | 2009-11-10 | Xenogen Corporation | Method and apparatus for 3-D imaging of internal light sources |
| US20080018899A1 (en)* | 2002-07-16 | 2008-01-24 | Xenogen Corporation | Method and apparatus for 3-d imaging of internal light sources |
| US20110090316A1 (en)* | 2002-07-16 | 2011-04-21 | Xenogen Corporation | Method and apparatus for 3-d imaging of internal light sources |
| US7797034B2 (en) | 2002-07-16 | 2010-09-14 | Xenogen Corporation | 3-D in-vivo imaging and topography using structured light |
| US20050201614A1 (en)* | 2002-07-16 | 2005-09-15 | Xenogen Corporation | 3-D in-vivo imaging and topography using structured light |
| US7860549B2 (en) | 2002-07-16 | 2010-12-28 | Xenogen Corporation | Method and apparatus for 3-D imaging of internal light sources |
| US20080031494A1 (en)* | 2002-07-16 | 2008-02-07 | Xenogen Corporation | Fluorescent light tomography |
| US20040264751A1 (en)* | 2003-06-27 | 2004-12-30 | Avinash Gopal B. | Systems and methods for correcting inhomogeneity in images |
| US7359540B2 (en) | 2003-06-27 | 2008-04-15 | Ge Medical Systems Global Technology Company, Llc | Systems and methods for correcting inhomogeneity in images |
| US20060268153A1 (en)* | 2005-05-11 | 2006-11-30 | Xenogen Corporation | Surface contruction using combined photographic and structured light information |
| US8044996B2 (en) | 2005-05-11 | 2011-10-25 | Xenogen Corporation | Surface construction using combined photographic and structured light information |
| US20080052052A1 (en)* | 2006-08-24 | 2008-02-28 | Xenogen Corporation | Apparatus and methods for determining optical tissue properties |
| US10775308B2 (en) | 2006-08-24 | 2020-09-15 | Xenogen Corporation | Apparatus and methods for determining optical tissue properties |
| US11730370B2 (en) | 2006-08-24 | 2023-08-22 | Xenogen Corporation | Spectral unmixing for in-vivo imaging |
| US8568411B2 (en) | 2008-03-31 | 2013-10-29 | Applied Medical Resources Corporation | Electrosurgical system |
| US11660136B2 (en) | 2008-03-31 | 2023-05-30 | Applied Medical Resources Corporation | Electrosurgical system |
| US8579894B2 (en) | 2008-03-31 | 2013-11-12 | Applied Medical Resources Corporation | Electrosurgical system |
| US10888371B2 (en) | 2008-03-31 | 2021-01-12 | Applied Medical Resources Corporation | Electrosurgical system |
| US8562598B2 (en) | 2008-03-31 | 2013-10-22 | Applied Medical Resources Corporation | Electrosurgical system |
| US8551088B2 (en) | 2008-03-31 | 2013-10-08 | Applied Medical Resources Corporation | Electrosurgical system |
| US12295642B2 (en) | 2008-03-31 | 2025-05-13 | Applied Medical Resources Corporation | Electrosurgical system |
| US8915910B2 (en) | 2008-03-31 | 2014-12-23 | Applied Medical Resources Corporation | Electrosurgical system |
| US10342604B2 (en) | 2008-03-31 | 2019-07-09 | Applied Medical Resources Corporation | Electrosurgical system |
| US9566108B2 (en) | 2008-03-31 | 2017-02-14 | Applied Medical Resources Corporation | Electrosurgical system |
| US10674947B1 (en) | 2009-03-24 | 2020-06-09 | Vioptix, Inc. | Diagnosing intestinal ischemia based on oxygen saturation measurements |
| US9339221B1 (en) | 2009-03-24 | 2016-05-17 | Vioptix, Inc. | Diagnosing intestinal ischemia based on oxygen saturation measurements |
| US9445766B1 (en) | 2009-07-08 | 2016-09-20 | Vioptix, Inc. | Methods for locating a blood vessel |
| US11622715B1 (en) | 2009-07-08 | 2023-04-11 | Vioptix, Inc. | System for detecting and avoiding blood vessels |
| US12150781B1 (en) | 2009-07-08 | 2024-11-26 | Vioptix, Inc. | Blood vessel detection and avoidance |
| US12324684B1 (en) | 2009-07-08 | 2025-06-10 | Vioptix, Inc. | Detecting and avoiding blood vessels |
| US11432763B1 (en) | 2009-07-08 | 2022-09-06 | Vioptix, Inc. | Detecting and avoiding blood vessels |
| US9114226B1 (en) | 2009-07-08 | 2015-08-25 | Vioptix, Inc. | Devices and monitoring systems for locating a blood vessel |
| US9693729B1 (en) | 2009-07-08 | 2017-07-04 | Vioptix, Inc. | Detecting and avoiding blood vessels |
| US10667721B1 (en) | 2009-07-08 | 2020-06-02 | Vioptix, Inc. | System for detecting and avoiding blood vessels |
| US10456079B1 (en) | 2009-07-08 | 2019-10-29 | Vioptix, Inc. | Detecting and avoiding blood vessels |
| US9854993B1 (en) | 2009-07-08 | 2018-01-02 | Vioptix, Inc. | System for detecting and avoiding blood vessels |
| US10149650B1 (en) | 2009-07-08 | 2018-12-11 | Vioptix, Inc. | Detecting and avoiding blood vessels |
| US12076113B1 (en) | 2010-02-23 | 2024-09-03 | Vioptix, Inc. | Method of making a measurement probe |
| US10905332B1 (en) | 2010-02-23 | 2021-02-02 | Vioptix, Inc. | Method of making a bone oxygenation measurement probe |
| US11484209B1 (en) | 2010-02-23 | 2022-11-01 | Vioptix, Inc. | Method of making a bone oxygenation measurement probe |
| US9814393B1 (en) | 2010-02-23 | 2017-11-14 | Vioptix, Inc. | Bone oxygenation measurement |
| US8792951B1 (en) | 2010-02-23 | 2014-07-29 | Vioptix, Inc. | Bone oxygenation measurement |
| US7884933B1 (en) | 2010-05-05 | 2011-02-08 | Revolutionary Business Concepts, Inc. | Apparatus and method for determining analyte concentrations |
| US8199322B2 (en) | 2010-05-05 | 2012-06-12 | Revolutionary Business Concepts, Inc. | Apparatus and method for determining analyte concentrations |
| US11717210B2 (en) | 2010-09-28 | 2023-08-08 | Masimo Corporation | Depth of consciousness monitor including oximeter |
| US9538949B2 (en) | 2010-09-28 | 2017-01-10 | Masimo Corporation | Depth of consciousness monitor including oximeter |
| US9775545B2 (en) | 2010-09-28 | 2017-10-03 | Masimo Corporation | Magnetic electrical connector for patient monitors |
| US10531811B2 (en) | 2010-09-28 | 2020-01-14 | Masimo Corporation | Depth of consciousness monitor including oximeter |
| US8821397B2 (en) | 2010-09-28 | 2014-09-02 | Masimo Corporation | Depth of consciousness monitor including oximeter |
| US9320563B2 (en) | 2010-10-01 | 2016-04-26 | Applied Medical Resources Corporation | Electrosurgical instruments and connections thereto |
| US11864823B2 (en) | 2010-10-01 | 2024-01-09 | Applied Medical Resources Corporation | Electrosurgical instruments and connections thereto |
| US10874452B2 (en) | 2010-10-01 | 2020-12-29 | Applied Medical Resources Corporation | Electrosurgical instruments and connections thereto |
| US9962222B2 (en) | 2010-10-01 | 2018-05-08 | Applied Medical Resources Corporation | Electrosurgical instruments and connections thereto |
| US12357374B2 (en) | 2010-10-01 | 2025-07-15 | Applied Medical Resources Corporation | Electrosurgical instruments and connections thereto |
| US8953021B2 (en)* | 2010-12-29 | 2015-02-10 | Samsung Electronics Co., Ltd. | Image processing systems for increasing resolution of three-dimensional depth data |
| US20120169848A1 (en)* | 2010-12-29 | 2012-07-05 | Samsung Electronics Co., Ltd. | Image Processing Systems |
| US9335172B2 (en)* | 2011-07-15 | 2016-05-10 | Samsung Heavy Ind. Co., Ltd | Apparatus for measuring location of underwater vehicle and method thereof |
| US20140142841A1 (en)* | 2011-07-15 | 2014-05-22 | Samsung Heavy Ind. Co., Ltd | Apparatus for measuring location of underwater vehicle and method thereof |
| US11331038B2 (en)* | 2012-03-08 | 2022-05-17 | Koninklijke Philips N.V. | Apparatus for determining a property of a tissue |
| US11672589B2 (en) | 2014-05-16 | 2023-06-13 | Applied Medical Resources Corporation | Electrosurgical system |
| US10149713B2 (en) | 2014-05-16 | 2018-12-11 | Applied Medical Resources Corporation | Electrosurgical system |
| US12239359B2 (en) | 2014-05-30 | 2025-03-04 | Applied Medical Resources Corporation | Electrosurgical seal and dissection systems |
| US10792092B2 (en) | 2014-05-30 | 2020-10-06 | Applied Medical Resources Corporation | Electrosurgical seal and dissection systems |
| US10765367B2 (en) | 2014-10-07 | 2020-09-08 | Masimo Corporation | Modular physiological sensors |
| US10154815B2 (en) | 2014-10-07 | 2018-12-18 | Masimo Corporation | Modular physiological sensors |
| US11717218B2 (en) | 2014-10-07 | 2023-08-08 | Masimo Corporation | Modular physiological sensor |
| US12029472B2 (en) | 2014-12-23 | 2024-07-09 | Applied Medical Resources Corporation | Bipolar electrosurgical sealer and divider |
| US11540871B2 (en) | 2014-12-23 | 2023-01-03 | Applied Medical Resources Corporation | Bipolar electrosurgical sealer and divider |
| US10420603B2 (en) | 2014-12-23 | 2019-09-24 | Applied Medical Resources Corporation | Bipolar electrosurgical sealer and divider |
| USD748259S1 (en) | 2014-12-29 | 2016-01-26 | Applied Medical Resources Corporation | Electrosurgical instrument |
| CN111836570A (en)* | 2018-01-09 | 2020-10-27 | 爱丁堡大学董事会 | Imaging systems and methods |
| US12310556B2 (en) | 2018-01-09 | 2025-05-27 | The University Court Of The University Of Edinburgh | Imaging system and method |
| US11864812B2 (en) | 2018-09-05 | 2024-01-09 | Applied Medical Resources Corporation | Electrosurgical generator control system |
| US11696796B2 (en) | 2018-11-16 | 2023-07-11 | Applied Medical Resources Corporation | Electrosurgical system |
Also Published As
| Publication number | Publication date |
|---|---|
| US5752519A (en) | 1998-05-19 |
Similar Documents
| Publication | Publication Date | Title |
|---|---|---|
| US5746210A (en) | Device and method for detection, localization, and characterization of inhomogeneities in turbid media | |
| US8864669B2 (en) | Method and system for tissue imaging and analysis | |
| US7930015B2 (en) | Methods and sensors for monitoring internal tissue conditions | |
| US6594518B1 (en) | Device and method for classification of tissue | |
| Yodh et al. | Spectroscopy and imaging with diffusing light | |
| JP5463545B2 (en) | Concentration determination apparatus, concentration determination method and program | |
| WO1993013395A2 (en) | Path constrained spectrophotometer | |
| US8882672B2 (en) | Method and system for tissue imaging and analysis | |
| US7960707B2 (en) | Time-domain method and apparatus for determining the depth and concentration of a fluorophore in a turbid medium | |
| RU2727242C2 (en) | Method and device for non-invasive optical in vivo determination of glucose concentration in leaking blood | |
| US9259486B2 (en) | Method and system for calculating a quantification indicator for quantifying a dermal reaction on the skin of a living being | |
| RU2437089C2 (en) | Determining optical absorption coefficients | |
| JP2006516207A (en) | Photoacoustic analysis method and apparatus | |
| CN109662735B (en) | Method for measuring skin blood perfusion | |
| JP2011510312A (en) | Method for non-invasively and optically identifying the temperature of a medium | |
| CN101612034B (en) | Time-resolved measurement system and method for reconstructing optical parameters of turbid media | |
| US20060100489A1 (en) | Method and apparatus for determining tissue viability | |
| CN104188664B (en) | Blood sugar test scaling method and system | |
| EP0419573B1 (en) | A method of imaging a random medium | |
| Jeeva et al. | Reconstruction of optical scanned images of inhomogeneities in biological tissues by Monte Carlo simulation | |
| KR100866258B1 (en) | Skin thickness measuring device using linear image sensor and its measuring method | |
| WO2017098262A1 (en) | Processing optical coherency tomography scans | |
| JP2018512574A (en) | Optical coherence tomography scan processing | |
| US7565249B2 (en) | Method for the determination of a light transport parameter in a biological matrix | |
| US8204577B2 (en) | Process and device for deep-selective detection of spontaneous activities and general muscle activites |
Legal Events
| Date | Code | Title | Description |
|---|---|---|---|
| AS | Assignment | Owner name:BENARON, DAVID A., CALIFORNIA Free format text:ASSIGNMENT OF ASSIGNORS INTEREST;ASSIGNOR:SEXTANT MEDICAL CORPORATION;REEL/FRAME:008000/0627 Effective date:19960510 | |
| STCF | Information on status: patent grant | Free format text:PATENTED CASE | |
| REMI | Maintenance fee reminder mailed | ||
| FPAY | Fee payment | Year of fee payment:4 | |
| SULP | Surcharge for late payment | ||
| AS | Assignment | Owner name:SPECTROS CORPORATION, CALIFORNIA Free format text:ASSIGNMENT OF ASSIGNORS INTEREST;ASSIGNOR:BENARON, DAVID A.;REEL/FRAME:012958/0178 Effective date:20020418 | |
| FPAY | Fee payment | Year of fee payment:8 | |
| FPAY | Fee payment | Year of fee payment:12 | |
| AS | Assignment | Owner name:ALIPHCOM, CALIFORNIA Free format text:ASSIGNMENT OF ASSIGNORS INTEREST;ASSIGNOR:SPECTROS CORPORATION;REEL/FRAME:036630/0699 Effective date:20150917 | |
| AS | Assignment | Owner name:BLACKROCK ADVISORS, LLC, NEW JERSEY Free format text:SECURITY INTEREST;ASSIGNOR:ALIPHCOM;REEL/FRAME:037196/0229 Effective date:20150917 | |
| AS | Assignment | Owner name:JB IP ACQUISITION LLC, NEW YORK Free format text:ASSIGNMENT OF ASSIGNORS INTEREST;ASSIGNORS:ALIPHCOM, LLC;BODYMEDIA, INC.;REEL/FRAME:049805/0582 Effective date:20180205 | |
| AS | Assignment | Owner name:J FITNESS LLC, NEW YORK Free format text:UCC FINANCING STATEMENT;ASSIGNOR:JB IP ACQUISITION, LLC;REEL/FRAME:049825/0718 Effective date:20180205 Owner name:J FITNESS LLC, NEW YORK Free format text:UCC FINANCING STATEMENT;ASSIGNOR:JAWBONE HEALTH HUB, INC.;REEL/FRAME:049825/0659 Effective date:20180205 Owner name:J FITNESS LLC, NEW YORK Free format text:SECURITY INTEREST;ASSIGNOR:JB IP ACQUISITION, LLC;REEL/FRAME:049825/0907 Effective date:20180205 | |
| AS | Assignment | Owner name:ALIPHCOM LLC, NEW YORK Free format text:RELEASE BY SECURED PARTY;ASSIGNOR:BLACKROCK ADVISORS, LLC;REEL/FRAME:050005/0095 Effective date:20190529 | |
| AS | Assignment | Owner name:J FITNESS LLC, NEW YORK Free format text:RELEASE BY SECURED PARTY;ASSIGNORS:JAWBONE HEALTH HUB, INC.;JB IP ACQUISITION, LLC;REEL/FRAME:050067/0286 Effective date:20190808 |