US5739698A - Machine fault detection using slot pass frequency flux measurements - Google Patents
Machine fault detection using slot pass frequency flux measurementsDownload PDFInfo
- Publication number
- US5739698A US5739698AUS08/667,141US66714196AUS5739698AUS 5739698 AUS5739698 AUS 5739698AUS 66714196 AUS66714196 AUS 66714196AUS 5739698 AUS5739698 AUS 5739698A
- Authority
- US
- United States
- Prior art keywords
- amplitudes
- prior
- comparison
- spectrum
- flux
- Prior art date
- Legal status (The legal status is an assumption and is not a legal conclusion. Google has not performed a legal analysis and makes no representation as to the accuracy of the status listed.)
- Expired - Lifetime
Links
- 230000004907fluxEffects0.000titleclaimsabstractdescription157
- 238000005259measurementMethods0.000titleclaimsabstractdescription36
- 238000001514detection methodMethods0.000titleabstractdescription13
- 238000001228spectrumMethods0.000claimsabstractdescription162
- 238000000034methodMethods0.000claimsabstractdescription65
- 238000012360testing methodMethods0.000claimsdescription10
- 230000001360synchronised effectEffects0.000claimsdescription7
- 230000001131transforming effectEffects0.000claims11
- 238000010606normalizationMethods0.000claims8
- 230000008859changeEffects0.000abstractdescription9
- 238000004804windingMethods0.000abstractdescription9
- 230000002547anomalous effectEffects0.000abstractdescription4
- 230000006698inductionEffects0.000description18
- 238000004458analytical methodMethods0.000description14
- 238000004364calculation methodMethods0.000description7
- 238000007619statistical methodMethods0.000description6
- 238000013459approachMethods0.000description5
- 238000004519manufacturing processMethods0.000description5
- 230000003595spectral effectEffects0.000description5
- 238000012544monitoring processMethods0.000description3
- 230000008569processEffects0.000description3
- 238000010276constructionMethods0.000description2
- 238000013461designMethods0.000description2
- 230000000694effectsEffects0.000description2
- 230000014509gene expressionEffects0.000description2
- 238000012935AveragingMethods0.000description1
- 230000008901benefitEffects0.000description1
- 238000011109contaminationMethods0.000description1
- 238000007405data analysisMethods0.000description1
- 238000013480data collectionMethods0.000description1
- 230000007547defectEffects0.000description1
- 238000010292electrical insulationMethods0.000description1
- 230000006872improvementEffects0.000description1
- 238000012423maintenanceMethods0.000description1
- 230000007257malfunctionEffects0.000description1
- 238000012986modificationMethods0.000description1
- 230000004048modificationEffects0.000description1
- 230000003334potential effectEffects0.000description1
- 238000000926separation methodMethods0.000description1
- 238000010998test methodMethods0.000description1
- 230000009466transformationEffects0.000description1
Images


Classifications
- G—PHYSICS
- G01—MEASURING; TESTING
- G01R—MEASURING ELECTRIC VARIABLES; MEASURING MAGNETIC VARIABLES
- G01R31/00—Arrangements for testing electric properties; Arrangements for locating electric faults; Arrangements for electrical testing characterised by what is being tested not provided for elsewhere
- G01R31/34—Testing dynamo-electric machines
- G01R31/343—Testing dynamo-electric machines in operation
- G—PHYSICS
- G01—MEASURING; TESTING
- G01R—MEASURING ELECTRIC VARIABLES; MEASURING MAGNETIC VARIABLES
- G01R23/00—Arrangements for measuring frequencies; Arrangements for analysing frequency spectra
- G01R23/16—Spectrum analysis; Fourier analysis
- G01R23/20—Measurement of non-linear distortion
- H—ELECTRICITY
- H02—GENERATION; CONVERSION OR DISTRIBUTION OF ELECTRIC POWER
- H02P—CONTROL OR REGULATION OF ELECTRIC MOTORS, ELECTRIC GENERATORS OR DYNAMO-ELECTRIC CONVERTERS; CONTROLLING TRANSFORMERS, REACTORS OR CHOKE COILS
- H02P29/00—Arrangements for regulating or controlling electric motors, appropriate for both AC and DC motors
- H02P29/02—Providing protection against overload without automatic interruption of supply
- H02P29/024—Detecting a fault condition, e.g. short circuit, locked rotor, open circuit or loss of load
- G—PHYSICS
- G01—MEASURING; TESTING
- G01R—MEASURING ELECTRIC VARIABLES; MEASURING MAGNETIC VARIABLES
- G01R13/00—Arrangements for displaying electric variables or waveforms
- G01R13/02—Arrangements for displaying electric variables or waveforms for displaying measured electric variables in digital form
Definitions
- the present inventionrelates to nonintrusive on-line detection of faults in electric machines having a stator and a rotor. More particularly, it relates to a method of detecting faults in electric machines by using slot pass frequency flux measurements.
- Electric machinesincluding electric motors and generators, are at the heart of the production process for many industries. Proper maintenance of these machines is critical to the efficient and profitable operation of these industries. Complicating the detection of electric machine faults is the fact that many faults are subtle and somewhat insidious to the overall operation of the machine. Such faults are not readily observable and require unique fault detection and monitoring approaches to prevent the fault from escalating into a possibly catastrophic machine failure.
- fault detection and monitoringwill be nonintrusive and on-line (i.e., while the motor is operating) so as to not interfere with the normal operation of the machine. In this manner, fault monitoring will enhance maintainability while reducing downtime.
- a stored time series of the flux and current signalsare then transformed into the frequency domain by means of a fast Fourier transformation, producing a flux spectrum and a current spectrum.
- the frequencies of concern for this analysisinclude line frequency (LF) and harmonics of LF (does not look at slot pass).
- Line frequency and slip frequencyare determined, and the amplitudes of the current spectrum are compared at a set of rotor fault harmonic frequencies (all related to LF) with specified fault threshold criteria.
- a rotor faultis denoted if the amplitude of a predefined set of the current spectra exceed the corresponding fault threshold criteria.
- Sedding et al. in U.S. Pat. No. 5,252,915purports to describe a method and apparatus for detecting stator faults in rotary dynamoelectric machines.
- the approach taken in Seddingfocuses on the use of four search coils spaced symmetrically around the axis of the motor to collect flux signals. Selected frequencies (or harmonics) are evaluated from a summation of the four flux sensors. These selected frequencies are "related" to the line frequency peak and its harmonics. Changes in these selected frequencies can indicate inter-turn faults.
- Algebraic expressionsare used to calculate the angular position of the fault by comparing the overall flux value from each of the four flux coils. These algebraic expressions require a knowledge of the number of poles and the rotational speed of the machine.
- a recurring theme in the prior art methods of detecting rotor faults, as well as the Sedding method of detecting stator faults,is that these methods generally focus on low frequency components related to line frequency and harmonics of line frequency. More specifically, the prior art avoids analysis of higher frequency components, including the slot pass family of frequencies (which are not harmonics of line frequency), as a method for detecting stator faults.
- the present inventionprovides a method of detecting electrical anomalies in an electric machine having a stator and a rotor and producing leakage flux during operation of the motor.
- One embodiment of this methodinvolves producing a time series of measured flux signals containing slot pass family frequencies and associated amplitudes.
- the measured flux signalswhich are produced with a flux measurement sensor, are representative of the leakage flux produced by the machine.
- the time series of measured flux signalsis transformed into a measured spectrum representative of the slot pass family frequencies and associated amplitudes of the measured flux signals.
- One or more prior spectra representing leakage flux characteristics produced by a healthy machineare provided. At least one measured parameter is determined from the measured spectrum, and at least one prior parameter corresponding to the at least one measured parameter is determined from the prior spectra. Measured parameters are compared to prior parameters, and the presence of an electrical anomaly is determined when at least one measured parameter differs from one or more corresponding prior parameters by a threshold amount.
- Prior parametersmay be in the form of an amplitude of a single frequency within the slot pass family of frequencies of the prior spectra.
- a subset of amplitudesare summed or otherwise arithmetically combined to produce a prior parameter, which is compared to the summed amplitudes of a corresponding subset of the measured spectrum.
- An electrical anomalyis found to exist if one or more parameters of the measured spectrum differ from corresponding parameters of the prior spectra by a threshold amount.
- the threshold amountcan be either an absolute value or a delta change in the measured parameter over a prior parameter.
- the threshold amountis determined by statistical analysis of trend parameters. For example, if measured parameters differ from trend parameters by three standard deviations from the mean value of the trend parameters, a machine fault condition is known to exist. However, to perform this statistical analysis of the measured data at least three data points (prior spectra) must have been previously acquired.
- a method of detecting faults in an AC electric motor having a stator and a rotorincludes the step of generating a first time series of flux signals with a flux measurement sensor at a first time while the motor is operating in good condition.
- the first time series of flux signalscontains slot pass family frequencies and associated amplitudes representative of the leakage flux produced by the motor.
- the first time series of flux signalsis transformed into a first spectrum which is stored.
- the first spectrumis representative of the slot pass family frequencies and associated amplitudes of the first time series of flux signals.
- Second and third time series of flux signalsare generated at times that are later than when the first time series of flux signals were generated. These second and third time series of flux signals are also transformed into second and third spectra.
- a fourth time series of flux signalsis generated at a time later than when the first, second, and third time series of flux signals were generated, and transformed into a fourth spectrum.
- Parameters of the first, second, and third spectraare compared at the slot pass family frequencies with corresponding parameters of the fourth spectrum and if one or more parameters of the fourth spectrum differ from corresponding parameters of the prior spectra by a threshold amount as determined by three standard deviations from the mean value of the prior spectra, a fault condition is determined to exist.
- each time series of flux signalsis generated by a substantially identical flux measurement sensor (preferably the same sensor each time) that is consistently placed in the same location and orientation to the motor.
- Another method of detecting faults in an AC electric motorinvolves producing first, second, and third spectra as previously described.
- a reference spectrumis also provided which is representative of the slot pass family frequencies and associated amplitudes of leakage flux produced by the electric motor when no electrical anomalies exist.
- One or more parametersare calculated from corresponding amplitudes of the reference spectrum and each of the first, second, and third spectra.
- the one or more parameters of the first, second, and third spectraare collectively referred to as trend data.
- a comparison spectrumis produced from a time series of flux signals that are generated at a time later than when the first, second, and third time series of flux signals were generated. Comparison parameters are calculated from corresponding amplitudes of the comparison and reference spectra and compared to the trend data.
- a faultis determined to exist if one or more of the comparison parameters exceed corresponding ones of the trend data by a threshold amount. For example, a fault exists if a comparison parameter exceeds corresponding parameters of the trend data by three standard deviations from the mean value of the trend data parameters.
- FIG. 1is a somewhat diagrammatic illustration of an electric induction motor being monitored for faults by use of the present invention
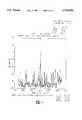
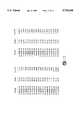
- FIG. 2is a leakage flux spectrum plot showing the slot pass family of peaks for an electric induction motor in good condition
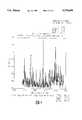
- FIG. 3is a leakage flux spectrum plot showing the slot pass family of peaks for an electric induction motor having a stator fault
- FIG. 4is a leakage flux spectrum plot showing running speed harmonic sidebands modulating about the principle slot pass frequency (PSP r ) plus two times line frequency (2 ⁇ LF) of an electric induction motor in good condition;
- PSP rprinciple slot pass frequency
- 2 ⁇ LFline frequency
- FIG. 5is a leakage flux spectrum plot showing running speed harmonic sidebands modulating about the PSP r +2 ⁇ LF peak of an electric induction motor having a stator fault;
- FIG. 6is a leakage flux spectrum plot showing line frequency sidebands of the PSP r +2 ⁇ LF peak for an electric induction motor in good condition
- FIG. 7is a leakage flux spectrum plot showing line frequency sidebands of the PSP r +2 ⁇ LF peak for an electric induction motor having a stator fault
- FIG. 8is a leakage flux spectrum plot showing running speed sidebands modulating about the PSP r 30 4 ⁇ LF peak of an electric induction motor in good condition
- FIG. 9is a leakage flux spectrum plot showing running speed sidebands modulating about the PSP r +4 ⁇ LF peak of an electric induction motor having a stator fault
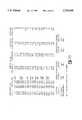
- FIG. 10is a table listing flux measurement data for a faulted motor, including the motor's slot pass family of frequencies, reference spectral data, comparison (measured) spectral data, and various comparisons thereof;
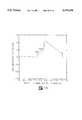
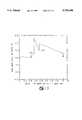
- FIG. 11is a trend plot of a 2 ⁇ LF parameter as measured over a 1.6 day period, during which time motor faults were induced;
- FIG. 12is a table which lists, in chronological order, the individual parameter measurements comprising the plot of FIG. 11;
- FIG. 13is a trend plot of a running speed parameter as measured over a 1.6 day period, during which time motor faults were induced.
- FIG. 14is a table which lists, in chronological order, the individual parameter measurements comprising the plot of FIG. 13.
- a time series of flux coil signalscan be analyzed in the frequency domain to yield a series of slot pass frequencies and associated sideband frequencies of varying amplitude.
- Stator winding faultsare not the only producers of magnetic leakage flux. Rotor faults, voltage imbalance, and airgap eccentricity can also effect leakage flux. Additionally, asymmetries are inherent to even healthy machines due to manufacturing imperfections that prevent precise cancellation of stator and rotor currents. Each individual machine will generally produce its own leakage flux spectral peaks, or amplitudes since manufacturing defects do not duplicate themselves exactly. In other words, each healthy machine will produce its own distinct leakage flux spectrum with its own distinct set of amplitudes.
- the amplitudeswill vary between machines of like design and construction, the frequencies themselves will generally vary little, being primarily determined not by manufacturing imperfections like their corresponding amplitudes, but rather, by their specific machine parameters such as the number of rotor bars, the number of stator slots, running speed, and line frequency. Additionally, the amplitudes of certain frequencies will change significantly when a stator fault or other anomalous condition occurs. Such faults are detectable by observing and analyzing changes in the amplitudes of certain frequencies.
- stator fault--a short between two windingscan be detected by analyzing, in the frequency domain, the amplitudes of the machine's slot pass family of frequencies.
- the principle "slot pass" frequency (PSP) of a machineoccurs at either the product of the number of rotor bars and running speed minus line frequency, as given by the following equation:
- #RBrepresents number of rotor bars
- RPSrepresents running speed in revolutions per second
- LFline frequency (Hz)
- #SSrepresents the number of stator slots.
- Modulating about each of the 2 ⁇ LF subset frequencieswill be multiples of running speed sidebands and multiples of slip frequency sidebands.
- Line frequency sidebandshave also been observed modulating about the 2 ⁇ LF subset of frequencies.
- These sideband frequenciesare collectively termed the "subset of slot pass sideband frequencies".
- the combination of the 2 ⁇ LF subset, the multiples of running speed and slip frequency sidebands, as well as the line frequency sidebands, and all amplitudes thereof,are collectively termed the "slot pass family of frequencies".
- Running speed and slip frequency of an electric machineare determined either mathematically or by direct measurement.
- Line frequencyis determined by direct measurement.
- an AC motorinternally employs a given number of magnetic poles, organized as pole pairs.
- the motor synchronous speed (RPS s )(maximum unloaded speed) is equal to the AC line frequency (LF) divided by the number of pole pairs (PP), as given by the following equation:
- the synchronous speed of a two-pole motor(one pole pair), having a line frequency of 60 Hz for example, is 60 revolutions per second, or 3600 revolutions per minute.
- the synchronous speed of a four-pole motorfor example is 30 revolutions per second or 1800 revolutions per minute.
- the actual running speed of a motor under loadis less than the synchronous speed, and the difference between synchronous speed (RPS s ) and running speed under load (RPS L ) is known as the slip frequency (SF), given by the following equation:
- any harmonic amplitude within the slot pass family of frequenciesis potentially capable of indicating a turn-to-turn short or any other electrical asymmetry in the stator, so a knowledge of the exact number of rotor bars or stator slots for purposes of calculating frequencies of interest is not necessary.
- Two suitable methods of identifying the slot pass family of peaksare, for example: First, using the machine's running speed, line frequency, and the number of rotor bars or stator slots, the principal slot pass frequency (PSP) is determined using either equation (1) or (2).
- PSPprincipal slot pass frequency
- Rated running speed at 100% loadis usually placarded onto the machine, line frequency is usually known or can be measured, and the number of rotor bars in large, electric machines is generally known to vary between about 30 and 200.
- the slot pass family of frequenciesis itself discernable in the flux spectrum. To find the slot pass family of frequencies, one need only look in the high frequency range from about 400 Hz to about 6,000 Hz. The slot pass family of frequencies will have prominent 2 ⁇ LF separation and will not be a multiple of line frequency.
- FIG. 1illustrates a preferred apparatus and method of detecting a fault, such as a stator winding fault, of an electric motor 22 drawing power from an AC power source 52.
- a standard tachometer 50can be used for measuring running speed of the motor 22.
- the line frequency of the power source 52, as well as the supplied current, voltage, and powercan all be measured by means of a multimeter 54 or other standard power source monitor(s).
- a flux coil 20is mounted axially to one end of the electric motor 22 while the motor 22 is operating to drive a load 24.
- the flux coil 20is made of wire wound into a coil of circular dimension. Generally, 100 to 200 turns are sufficient.
- a typical flux coil 20has a diameter of eight inches, but may be varied based on the size of the motor.
- the coil 20may be placed at any point on the motor 22 where leakage flux can be detected. Leakage flux is measured by the coil 20 which produces a flux signal in the form of an electrical current on line 26, the amplitude of which depends on the total number of turns used to make the coil since the more turns the flux coil 20 has, the larger the current signal that it will produce.
- the current signal on line 26is received by a spectrum analyzer 30, such as a CSI 2115 or 2120 analyzer, and converted to an analog voltage by measuring the voltage across an input impedance (not shown) that receives the current signal.
- the analog voltageis amplified by amplifier 32 and converted from analog to digital by A/D converter 34.
- a time series of digitized flux signalsare collected and then transformed to the frequency domain by means of a fast Fourier transform 36 (FFT).
- FFTfast Fourier transform
- Fault detectionmay be accomplished by a variety of analysis methods.
- analysisis accomplished by comparing a measured leakage flux spectrum with one or more previously measured and recorded spectra to determine when significant changes occur in the amplitudes of subsets of frequencies (which may include a single frequency) within the slot pass family of frequencies. These subsets are used to create parameters that are compared with absolute parametric values or with delta or statistical variances from corresponding parameters of one or more previously measured spectra to determine if a fault exists.
- Statistical thresholds or alarm limitsare set for observed changes in the parameters based on standard deviations from the mean values of previously measured parameters. Anything more than three standard deviations from the mean indicates a likely fault condition. For non-statistical analyses, thresholds are set as absolute values and as delta changes above or below the previously measured parameter values.
- the parameters discussed abovemay be created by summing or otherwise arithmetically combining the amplitudes of certain frequencies or subsets of frequencies within the slot pass family of frequencies for each of the measured leakage flux spectra (reference and comparison spectra).
- a parametermay be created by first subtracting all slot pass amplitudes of a previously measured spectrum (reference spectrum) from corresponding amplitudes of the measured (comparison) spectrum to produce difference values.
- the difference valuesrepresent + energy values for all values where the comparison amplitude is larger than its corresponding reference amplitude, and - energy values for all values for each comparison amplitude that is smaller than its corresponding reference amplitude.
- a + energy parameteris calculated by squaring all + energy values, summing the squared + energy values, and then taking the square root of the sum.
- a - energy parameteris calculated by squaring, summing, and taking the square root of all - energy values.
- the measured datais downloaded to a base computer 40.
- the computer 40receives the measured spectrum from the spectrum analyzer 30 and analyzes it by comparing various parameters of the measured spectrum with corresponding parameters of one or more flux spectra that have been previously acquired from the motor 22. For example, if the amplitudes of one or more of the slot pass family of frequencies of the measured spectrum differ from the same parameters of previously acquired spectra by more than three standard deviations from the mean value of the previously acquired spectral parameters, then a fault is likely. At least two previously acquired flux spectra are needed as trend data in order to perform a three standard deviation statistical calculation.
- a minimum of four spectraare required. More specifically, a reference spectrum and two previously acquired comparison spectra are needed to produce two previously acquired + energy or - energy parameters (trend data). These trend data are then used for statistical analysis with a comparison spectrum (fourth spectra) to determine if a fault condition exists. If insufficient trend data is available from previous measurements for statistical comparison to the measured data, another analysis method should be employed.
- Other analysis methodsinclude comparison of parameters of the measured spectrum to corresponding parameters of a "healthy machine", or reference spectrum.
- the healthy machine, or reference spectrum of the motor 22will have been measured and stored in the computer 40 when the motor 22 was known to have been healthy, such as when the motor 22 was first installed, or perhaps immediately after it was repaired from a prior malfunction.
- This reference spectrumis also included in the trend data to be used in statistical methods employed to detect faults in the motor 22.
- Each measurement of the flux spectrumcan be stored in the computer 40 as trend data to be statistically analyzed with future measurements of the flux spectrum. If a reference spectrum is unavailable, one may be determined or estimated in a variety of ways, such as from knowledge of typical flux spectra taken from healthy machines of similar design and construction. If the measured spectrum differs from the estimated reference by a threshold amount, which threshold may be either a delta change or an absolute amount, a fault condition is likely.
- spectra produced by the spectrum analyzer 30are evaluated after each measurement for significant changes from prior measurements by using repeatable and reliable test procedures and equipment. Consistency in the data collection and analysis process is an important factor in maintaining accurate analysis results. For example, inconsistent placement of the flux coil 20 from one measurement to the next could result in frequency amplitudes that vary, even though no anomalous conditions exist. It is important that flux measurements be taken at the same location, with the same spacing between the flux coil 20 and motor 22, and without swinging or twisting movement of the flux coil 20. To improve consistent placement of the flux coil 20 on a particular machine 22, the flux coil 20 is preferably secured to the outboard end of the motor 22 by magnets 21 or other mounting device preferably in a centered axial position, which position is clearly marked for repeatability. If the axial center position is not accessible, then an off-center, axial position will be acceptable as long as consistent placement of the flux coil 20 is maintained from measurement to measurement.
- the shape of the flux coil 20itself.
- the resulting flux coilis fairly flexible, and has the apparent advantage that the coil can be shaped to fit in and around many odd-shaped spaces. Even though subsequent measurements may be taken at the same location on a motor 22, significant differences in the flux coil 20 shape from one measurement to the next can cause changes in frequency amplitudes. This also limits the reliability of trend data and could result in false alarms. Therefore, a rigidly formed flux coil 20 that is resistant to geometric variations should be used.
- testing conducted to date on a variety of induction motorhas established a normal variation in amplitude of less than 10 dB for each peak within the slot pass family of frequencies.
- testinghas shown that an induction motor 22 will experience normal amplitude variations within the slot pass family of frequencies, resulting from normal load changes or other non-fault conditions, of not more than 10 dB per frequency.
- testinghas shown that when a fault does occur, it is usually accompanied by a 10 dB or greater change in amplitude for at least one of the slot pass family frequencies.
- anything more than a 10 dB variation in the amplitude of a slot pass family frequencyindicates the presence of a fault.
- test resultsare presented as examples to help illustrate how significant changes in slot pass family parameters are indicative of the presence of a stator fault or other electrical anomaly.
- Table 1Listed in Table 1 are the amplitudes for a subset of the slot pass family of frequencies (the 2 ⁇ LF family) plotted in FIGS. 2 and 3. Differences shown in Table 1 between the amplitudes for some of the 2 ⁇ LF family of slot pass frequencies in the good and faulted motor conditions are compared to determine if a fault exists. An alarm is signaled when the statistical trending, delta change, or absolute threshold methods previously described indicate that there is a significant difference in any of the 2 ⁇ LF peaks and/or the sum of a subset of peaks. Since any stator fault will in some way effect changes in the slot pass family of peaks, these methods need only be applied to the slot pass family of peaks. It should be noted that for purposes of this Example, no prior measurements were available to perform a statistical trending analysis, so significant changes are illustrated by way of delta thresholds only.
- FIG. 2The area around PSP r +2LF for the motor in good condition (FIG. 2) was expanded and plotted in FIG. 4 to reveal the various sideband families. Specifically, RPS sidebands are marked. As previously discussed, these sideband families include multiples of running speed sidebands, slip frequency sidebands, and line frequency sidebands.
- Running speed sideband families modulating about PSP r +2LF for the motor in faulted conditionare plotted in FIG. 5.
- FIGS. 6 and 7show sidebands of the PSP r +2LF frequency occurring at line frequency for the good and faulted conditions respectively.
- the running speed sideband family modulating about the PSP r +4LF peak with the motor in good conditionis plotted in FIG. 8, while a similar plot is shown in FIG. 9 for the motor in the faulted condition.
- Table 2Listed in Table 2 are the amplitudes for a subset of the various slot pass family of sideband frequencies shown plotted in FIGS. 4 through 9. As Table 2 illustrates, a stator fault can also produce changes in running speed and line frequency sidebands modulating about the 2 ⁇ LF family of peaks.
- the faulted motor amplitude difference between line frequency of the faulted motor and the PSP r -2 ⁇ LF amplitude of 50.39 dB shown in Table 5was arrived at by subtracting the faulted motor PSP r -2 ⁇ LF amplitude shown in Table 1 (-22.04 dB) from the faulted motor line frequency amplitude (28.35 dB).
- the good motor amplitude difference between line frequency of the good motor and the PSP r -2 ⁇ LF amplitude of 45.21 dBwas calculated by subtracting the PSP r -2 ⁇ LF amplitude of the motor in good condition as shown in Table 1 (-14.76 dB) from the line frequency amplitude with the motor in good condition (30.45 dB).
- Tables 7 and 8summarize the amplitude differences between the line frequency and individual peaks for the motor in good condition running at 71% and 83% load, where the line frequency amplitude of the good motor at 71% load was measured at 29.73 dB and the line frequency amplitude of the good motor at 83% load was 30.45 dB.
- Comparison Amplitudethe measured flux spectra amplitudes for frequencies within the slot pass family, and under the heading Reference Amplitude are previously measured spectra amplitudes.
- the Comparison and Reference amplitudesmay be normalized to the line frequency amplitude to reduce the potential effects on the data and analysis resulting from load changes. If one or more of the comparison amplitudes are significantly different than corresponding reference amplitudes, or if subsets of the comparison amplitudes have changed significantly, then a fault condition is likely.
- FIG. 10tabulates for each slot pass frequency a Reference Amplitude (dB) and the measured Comparison Amplitude (dB). Differences between individual ones of the comparison and reference amplitudes are calculated by two methods. First, a difference is calculated by subtracting the reference from the comparison. This calculation yields a difference value measured in dB units. Second, a difference is calculated and expressed as a simple ratio of the RMS value of comparison amplitudes to the RMS value of corresponding reference amplitudes, which is always greater than zero. Where a comparison spectrum amplitude differs from a corresponding reference spectrum amplitude by more than a threshold amount (percentage difference (delta) or absolute amplitude difference), a stator fault or other electrical anomaly is known to exist.
- a threshold amountpercentage difference (delta) or absolute amplitude difference
- a delta value of + or - 10 dBwas compared to each of the difference amplitudes shown in the Difference (Comp-Ref)(dB) column.
- Difference values for five members of the slot pass familyexceeded the threshold.
- the five frequencies of the slot pass family which exceeded the thresholdare at 520.8 Hz, 731.3 Hz, 789.9 Hz, 880.6 Hz, and 909.9 Hz. From this information, a fault condition is known to exist.
- slot pass family of frequenciesis grouped under the heading Slot Pass Family in two ways--2 ⁇ LF sidebands and running speed (RPS) sidebands.
- RPSrunning speed
- Four separate parameters calculated from four separate subsets of slot pass frequenciesare tabulated for each of the sideband groupings (total of eight parameters as further described below).
- Significant changes in any of the eight parametersare indicative of a fault.
- Comparison-Reference + Energy headingare numbers (measured in RMS units) calculated from a subset of slot pass family members that includes members whose comparison amplitude is larger than the corresponding reference amplitude. Within the 2 ⁇ LF sidebands, these members are at 520.8 Hz, 760.6 Hz, 880.6 Hz, 1240.4 Hz, and 1360.3 Hz.
- the + Energy members of the RPS sideband groupare at 731.3 Hz, 789.9 Hz, 909.9 Hz, and 971.2 Hz. The difference in amplitude of each such member is squared, then summed, and the square root of the sum is displayed.
- Parametersmay be normalized for analysis.
- normalized values (in RMS units) of the + Energy and - Energy parameterswere calculated from the ratio of numbers displayed in the Comparison-Reference + Energy and - Energy columns to the number (2.60) shown at the bottom of FIG. 10 in the Ref. Slot Pass Energy Sum field.
- the Ref. Slot Pass Energy Sumis an RMS value calculated by adding the squared amplitude of each identified slot pass family member in the reference spectrum, and taking the square root of the sum.
- Amplitudes associated with individual frequencies and groups of frequencies shown in FIG. 10can also be statistically compared to trend data for the motor to determine if a fault exists. For example, if the comparison data differs from the trend data for the motor by three standard deviations from the mean, a fault is known to exist.
- FIGS. 11-14vividly illustrate how trending can be used to identify the presence of a stator fault.
- FIG. 11is trend plot of the Normalized Comp-Ref Positive parameter for the 2 ⁇ LF family (shown in FIG. 10) as measured over a 1.6 day period
- FIG. 12is a chronological listing of individual parameter measurements that were used to create the plot shown in FIG. 11.
- experimental voltage phase imbalancewas induced in the motor.
- voltage imbalancewas induced with a significant (greater than three standard deviations from the mean) increase in amplitude.
- 0.6 day pointindicated generally in FIG. 11 at 102 and shown in FIG. 12 as the Mar.
- FIG. 13A similar plot of trended measurements of the Normalized Comp-Ref Positive parameter for RPS sidebands is shown in FIG. 13. Individual measurements for the plot of FIG. 13 are listed in FIG. 14. Significant increases in RMS amplitude occurring at points 100 and 102 are easily identified as indicative of the presence of an anomalous condition.
Landscapes
- Physics & Mathematics (AREA)
- General Physics & Mathematics (AREA)
- Nonlinear Science (AREA)
- Mathematical Physics (AREA)
- Engineering & Computer Science (AREA)
- Power Engineering (AREA)
- Tests Of Circuit Breakers, Generators, And Electric Motors (AREA)
Abstract
Description
PSP.sub.r =(#RB×RPS)-LF (1)
PSP.sub.s =(#SS ×RPS)-LF (2)
RPS.sub.s =LF/PP (3)
SF=RPS.sub.s -RPS.sub.L (4)
TABLE 1 ______________________________________ Amplitudes of the Two times Line Frequency Family of Slot Pass Frequencies for a Motor in a Good and Faulted Condition Principle Slot Pass and multiples of 2 × LF sidebands (dB) Sum of Condi- PSP.sub.r - PSP.sub.r + PSP.sub.r + PSP.sub.r + PSP.sub.r + Table 1 tion 2 × LFPSP.sub.r 2 ×LF 4 ×LF 6 ×LF 8 × LF Peaks ______________________________________ Faulted -22.04 -0.31 10.38 5.27 -7.29 -17.05 -31.04 83% load Good -14.76 -3.85 -12.53 7.31 -1.70 -23.99 -49.52 @ 83% load Dif- -7.27 3.54 22.92 -2.05 -5.59 6.94 18.48 ference ______________________________________ PSP.sub.r = Principle Slot Pass frequency as calculated using number of rotor bars ((#rotor bars × RPS) - LF) LF = line frequency (Hz)
TABLE 2 __________________________________________________________________________Amplitudes for Some of the Running Speed and Line Frequency Sidebands Associated with the Slot Pass Family of Peaks for a Motor in a Good and Faulted Condition Sum of Table 2 Various Slot Pass Family Sideband Frequencies (dB) RPS PSP.sub.r + PSP.sub.r + (PSP.sub.r + (PSP.sub.r + 4 × (PSP.sub.r + 4 × Related Condition 2LF - RPS 2LF + RPS 2LF) + LF LF) - RPS LF) + RPS Peaks __________________________________________________________________________Faulted @ -25.09 -16.92 -11.71 -18.47 -18.84 -79.30 83% load Good @ -23.48 -29.07 -25.16 -22.35 -15.86 -90.76 83% load Difference -1.61 12.15 13.45 3.88 -2.98 11.46 __________________________________________________________________________ PSP.sub.r = Principle Slot Pass frequency as calculated using number of rotor bars ((#rotor bars × RPS) - LF) LF = line frequency (Hz)
TABLE 3 ______________________________________ Amplitudes of the Two times Line Frequency Family of Slot Pass Frequencies for a Motor in a Good Condition Running at 71 and 83 Percent Load Principle Slot Pass and multiples of 2 × LF sidebands (dB) Sum of Condi- PSP.sub.r - PSP.sub.r + PSP.sub.r + PSP.sub.r + PSP.sub.r + Table 3 tion 2 × LF PSP.sub.r 2LF 4 ×LF 6 ×LF 8 × LF Peaks ______________________________________ Good -19.36 -6.38 -15.47 5.07 -3.84 -25.71 -65.69 71% load Good -14.76 -3.85 -12.53 7.31 -1.70 -23.99 -49.52 @ 83% load Dif- -4.60 -2.53 -2.94 -2.26 -2.14 -1.72 -16.17 ference ______________________________________ PSP.sub.r = Principle Slot Pass frequency as calculated using number of rotor bars ((#rotor bars × RPS) - LF) LF = line frequency (Hz)
TABLE 4 __________________________________________________________________________Amplitudes for Some of the Running Speed and Line Frequency Sidebands Associated with the Slot Pass Family of Peaks for a Motor in a Good Condition Running at 71 and 83 Percent Load Sum of Various Slot Pass Family Table 4 Sideband Frequencies (dB) RPS PSP.sub.r + PSP.sub.r + (PSP.sub.r + (PSP.sub.r + 4 × (PSP.sub.r + 4 × Related Condition 2LF - RPS 2LF + RPS 2LF) + LF LF) - RPS LF) + RPS Peaks __________________________________________________________________________Good @ -23.59 -30.55 -26.26 -24.37 -17.18 -95.69 71% load Good @ -23.48 -29.07 -25.16 -22.35 -15.86 -90.76 83% load Difference -0.11 -1.48 -1.10 -2.02 -1.32 -4.93 __________________________________________________________________________ PSP.sub.r = Principle Slot Pass frequency as calculated using number of rotor bars ((#rotor bars × RPS) - LF) LF = line frequency (Hz)
TABLE 5 ______________________________________ Amplitude Differences Between the Two times Line Frequency Family of Slot Pass Frequencies And Line Frequency for a Motor in a Good and Faulted Condition Amplitude Difference between the 2 × LF Family of Slot Pass Frequencies And Line Frequency (dB)* Sum of Condi- PSP.sub.r - PSP.sub.r + PSP.sub.r + PSP.sub.r + PSP.sub.r + Table 5 tion 2 × LFPSP.sub.r 2 ×LF 4 ×LF 6 ×LF 8 × LF Peaks ______________________________________ Faulted 50.39 28.66 17.97 23.09 35.64 45.40 201.15 83% load Good 45.21 34.29 42.98 23.14 32.14 54.44 232.20 @ 83% load Dif- 5.18 -5.63 -25.01 -0.05 3.50 -9.03 -31.05 ference ______________________________________ PSP.sub.r = Principle Slot Pass frequency as calculated using number of rotor bars ((#rotor bars × RPS) - LF) LF = line frequency (Hz) *The basic calculation is LF amplitude minus amplitude of the peak of interest Line frequency amplitude of faulted motor = 28.35 dB Line frequency amplitude of good motor running at 83% load = 30.45 dB
TABLE 6 __________________________________________________________________________Amplitude Differences between Some of the Running Speed and Line Frequency Sidebands Associated with the Slot Pass Family of Peaks And Line Frequency for a Motor in a Good and Faulted Condition Amplitude Difference between Various Sum of Slot Pass Family Sideband Table 6 Frequencies And Line Frequency (dB)* RPS (PSP.sub.r + (PSP.sub.r + (PSP.sub.r + (PSP.sub.r + 4 × (PSP.sub.r + 4 × Related Condition 2LF) - RPS 2LF) + RPS 2LF) + LF LF) - RPS LF) + RPS Peaks __________________________________________________________________________Faulted @ 53.45 45.27 40.10 46.82 47.19 192.73 83% load Good @ 53.93 59.52 55.65 52.79 46.31 212.55 83% load Difference -0.48 -14.25 -15.55 -5.97 0.88 -19.82 __________________________________________________________________________ PSP.sub.r = Principle Slot Pass frequency as calculated using number of rotor bars ((#rotor bars × RPS) - LF) LF = line frequency (Hz) *The basic calculation is LF amplitude minus amplitude of the peak of interest Line frequency amplitude of faulted motor = 28.35 dB Line frequency amplitude of good motor running at 83% load = 30.45 dB
TABLE 7 ______________________________________ Amplitude Differences between the Two times Line Frequency Family of Slot Pass Frequencies And Line Frequency for a Motor in a Good Condition Running at 71% and 83% Load Amplitude Difference between the 2 × LF Family of Slot Pass Frequencies And Line Frequency (dB)* Sum of PSP.sub.r - PSP.sub.r + PSP.sub.r + PSP.sub.r + PSP.sub.r + Table 7Condition 2 × LFPSP.sub.r 2 ×LF 4 ×LF 6 ×LF 8 × LF Peaks ______________________________________ Good 49.10 36.12 45.21 24.67 33.58 55.45 244.13 71% load Good 45.21 34.29 42.98 23.14 32.14 54.44 232.20 @ 83% load Dif- 3.89 1.83 2.23 1.53 1.44 1.01 11.93 ference ______________________________________ PSP.sub.r = Principle Slot Pass frequency as calculated using number of rotor bars ((#rotor bars × RPS) - LF) LF = line frequency (Hz) *The basic calculation is LF amplitude minus amplitude of the peak of interest Line frequency amplitude of good motor running at 71% load = 29.73 dB Line frequency amplitude of good motor running at 83% load = 30.45 dB
TABLE 8 __________________________________________________________________________Amplitude Differences between Some of the Running Speed and Line Frequency Sidebands Associated with the Slot Pass Family of Peaks And Line Frequency for a Motor in a Good Condition Running at 71 and 83 Percent Load Amplitude Difference between Various Sum of Slot Pass Family Sideband Table 8 Frequencies And Line Frequency (dB)* RPS (PSP.sub.r + (PSP.sub.r + (PSP.sub.r + (PSP.sub.r + 4 × (PSP.sub.r + 4 × Related Condition 2LF) - RPS 2LF) + RPS 2LF) + LF LF) - RPS LF) + RPS Peaks __________________________________________________________________________Good @ 53.33 60.29 56.00 54.11 46.92 214.65 71% load Good @ 53.93 59.52 55.65 52.79 46.31 212.55 83% load Difference -0.60 0.77 0.35 1.32 0.61 2.10 __________________________________________________________________________ PSP.sub.r = Principle Slot Pass frequency as calculated using number of rotor bars ((#rotor bars × RPS) - LF) LF = line frequency (Hz) *The basic calculation is LF amplitude minus amplitude of the peak of interest Line frequency amplitude of good motor running at 71% load = 29.73 dB Line frequency amplitude of good motor running at 83% load = 30.45 dB
Claims (37)
PSP=(RB×RPS.sub.L)-LF
SPFs=PSP±n×LF
RPS.sub.s =LF/PP
SF=RPS.sub.s -RPS.sub.L
PSP=(SS ×RPS)-LF
Priority Applications (1)
| Application Number | Priority Date | Filing Date | Title |
|---|---|---|---|
| US08/667,141US5739698A (en) | 1996-06-20 | 1996-06-20 | Machine fault detection using slot pass frequency flux measurements |
Applications Claiming Priority (1)
| Application Number | Priority Date | Filing Date | Title |
|---|---|---|---|
| US08/667,141US5739698A (en) | 1996-06-20 | 1996-06-20 | Machine fault detection using slot pass frequency flux measurements |
Publications (1)
| Publication Number | Publication Date |
|---|---|
| US5739698Atrue US5739698A (en) | 1998-04-14 |
Family
ID=24676968
Family Applications (1)
| Application Number | Title | Priority Date | Filing Date |
|---|---|---|---|
| US08/667,141Expired - LifetimeUS5739698A (en) | 1996-06-20 | 1996-06-20 | Machine fault detection using slot pass frequency flux measurements |
Country Status (1)
| Country | Link |
|---|---|
| US (1) | US5739698A (en) |
Cited By (56)
| Publication number | Priority date | Publication date | Assignee | Title |
|---|---|---|---|---|
| EP0961130A1 (en)* | 1998-05-28 | 1999-12-01 | DaimlerChrysler AG | Method and apparatus for early detection of faulty rotors in asynchronous machines |
| WO2000026633A1 (en)* | 1998-10-30 | 2000-05-11 | Caterpillar Inc. | Automatic stencil generation system and method |
| US6172509B1 (en) | 1999-02-11 | 2001-01-09 | The United States Of America As Represented By The Secretary Of The Air Force | Detecting polyphase machine faults via current deviation |
| US6262550B1 (en) | 1999-12-17 | 2001-07-17 | General Electric Company | Electrical motor monitoring system and method |
| US6308140B1 (en)* | 1996-05-20 | 2001-10-23 | Crane Nuclear, Inc. | Motor condition and performance analyzer |
| US6335631B2 (en)* | 1998-12-07 | 2002-01-01 | General Electric Company | Induction machine asymmetry detection instrument and method |
| KR100330258B1 (en)* | 2000-03-03 | 2002-03-25 | 윤행순 | Inspecting method for generator stator windings |
| WO2002056039A1 (en)* | 2001-01-08 | 2002-07-18 | Jurmain Richard N | Method and apparatus for monitoring the health of individual electrical devices |
| US6460013B1 (en) | 1999-05-06 | 2002-10-01 | Paul I. Nippes | Shaft voltage current monitoring system for early warning and problem detection |
| US20040019461A1 (en)* | 2002-04-22 | 2004-01-29 | Kai Bouse | Machine fault information detection and reporting |
| US20040050177A1 (en)* | 2002-09-13 | 2004-03-18 | Grosjean Dennis Francis | Motor based condition monitoring |
| US20040090197A1 (en)* | 2002-11-08 | 2004-05-13 | Schuchmann Russell P. | Method and apparatus of detecting disturbances in a centrifugal pump |
| US20040124844A1 (en)* | 2002-12-13 | 2004-07-01 | Andreas Gruhle | Process and device for testing electric motors, in particular fan motors, for functionality |
| DE10300051A1 (en)* | 2002-12-13 | 2004-07-15 | Daimlerchrysler Ag | Method and device for testing electric motors, in particular, fan motors for functionality |
| US6801031B1 (en)* | 1998-09-04 | 2004-10-05 | Wilo Gmbh | Method and apparatus for current measurement for electronically-controlled pump |
| US20050067991A1 (en)* | 2003-09-30 | 2005-03-31 | Yehia El-Ibiary | System and method for identifying operational parameters of a motor |
| US20050088271A1 (en)* | 2003-10-23 | 2005-04-28 | Siemens Westinghouse Power Corporation | Sensing apparatus for blown fuse of rectifying wheel and associated methods |
| KR100542893B1 (en)* | 2003-12-22 | 2006-01-11 | 재단법인 포항산업과학연구원 | Induction motor fault condition diagnosis device |
| US20060009932A1 (en)* | 2003-02-07 | 2006-01-12 | Hiroshi Koh | Harmonic diagnosing method for electric facility |
| US7034706B1 (en) | 1999-05-06 | 2006-04-25 | Nippes Paul I | Early warning and problem detection in rotating machinery by monitoring shaft voltage and/or grounding current |
| US20060193090A1 (en)* | 2005-02-25 | 2006-08-31 | International Rectifier Corp. | Synchronous motor startup lock detection circuit and method |
| US20070118307A1 (en)* | 2003-09-30 | 2007-05-24 | Yehia El-Ibiary | Motor parameter estimation method and apparatus |
| US20070182359A1 (en)* | 2004-06-22 | 2007-08-09 | Matthias Wahler | Intelligent drive |
| US20080206052A1 (en)* | 2004-07-28 | 2008-08-28 | Igus - Innovative Technische Systeme Gmbh | Method and Device for Monitoring the State of Rotor Blades on Wind Power Installations |
| US20090091289A1 (en)* | 2007-10-08 | 2009-04-09 | University Of Victoria Innovation And Development Corporation | Stator inter-turn fault detection of synchronous machines |
| WO2009127068A1 (en)* | 2008-04-14 | 2009-10-22 | Corporation Nuvolt Inc. | Electrical anomaly detection method and system |
| EP2112753A1 (en)* | 2008-04-24 | 2009-10-28 | Advanced Digital Design, S.A. | Method and device for determining the rotor rotation speed of an asynchronous electric induction motor |
| US20100207634A1 (en)* | 2009-02-13 | 2010-08-19 | Bae Systems Controls Inc. | Robust ac chassis fault detection using pwm sideband harmonics |
| CN101369004B (en)* | 2008-09-19 | 2011-04-06 | 中国电力科学研究院 | Micro-phase shift fast transformation method used for excitation system frequency spectrum analysis |
| US20110089883A1 (en)* | 2009-10-21 | 2011-04-21 | Gm Global Technology Operations, Inc. | Motor phase winding fault detection method and apparatus |
| US20110187304A1 (en)* | 2010-02-02 | 2011-08-04 | Gm Global Technology Operations, Inc. | Motor phase winding fault detection method and apparatus |
| US20110291850A1 (en)* | 2010-05-25 | 2011-12-01 | Yanxia Sun | Machine vibration monitoring |
| US20110313717A1 (en)* | 2010-06-16 | 2011-12-22 | Bin Lu | System and method of speed detection in an ac induction machine |
| US20120001580A1 (en)* | 2010-07-01 | 2012-01-05 | Pinjia Zhang | System and method for detecting fault in an ac machine |
| US20120076277A1 (en)* | 2010-09-23 | 2012-03-29 | Eric Bruce Biehr | Asynchronous motor with features creating magnetic field disturbance |
| US20160266207A1 (en)* | 2015-03-10 | 2016-09-15 | Mitsubishi Electric Research Laboratories, Inc. | Fault Detection in Induction Motors Based on Current Signature Analysis |
| US20170082692A1 (en)* | 2013-12-30 | 2017-03-23 | Abb Schweiz Ag | Method and system for detecting rotor fault |
| CN106597281A (en)* | 2016-12-16 | 2017-04-26 | 哈尔滨工业大学 | No-load parameter detection device of DC motor |
| US20170123007A1 (en)* | 2014-05-06 | 2017-05-04 | Siemens Aktiengesellschaft | Method and apparatus for detecting interturn faults, and electrical machine |
| CN107178514A (en)* | 2017-05-04 | 2017-09-19 | 山东大学 | Blower fan unit non-intrusion type efficiency diagnostic method and system |
| US20180011480A1 (en)* | 2015-01-20 | 2018-01-11 | Hitachi, Ltd. | Machine diagnostic apparatus and machine diagnostic method |
| US20180059656A1 (en)* | 2015-03-12 | 2018-03-01 | Hitachi, Ltd. | Machine Diagnostic Device and Machine Diagnostic Method |
| WO2019014435A1 (en)* | 2017-07-13 | 2019-01-17 | Itt Manufacturing Enterprises Llc | Technique for self learning motor load profile |
| WO2019014438A1 (en)* | 2017-07-13 | 2019-01-17 | Itt Manufacturing Enterprises Llc | Technique to detect motor leakage flux anomalies |
| EP2340608B1 (en)* | 2008-10-22 | 2019-06-12 | General Electric Technology GmbH | Device and method for monitoring and/or analyzing rotors of electric machines in operation |
| US10338143B2 (en) | 2016-08-09 | 2019-07-02 | Rolls-Royce Plc | Method and apparatus for diagnosing a fault condition in an electric machine |
| JP6656488B1 (en)* | 2019-03-12 | 2020-03-04 | 三菱電機株式会社 | Short circuit detection device and short circuit detection method |
| US10686394B1 (en)* | 2020-02-05 | 2020-06-16 | The Florida International University Board Of Trustees | Condition monitoring and fault detection in induction motors |
| US10698031B2 (en) | 2018-02-02 | 2020-06-30 | R. Gene Smiley | Systems and methods for obtaining and validating performance data on motors |
| EP3663880A4 (en)* | 2017-07-31 | 2021-04-28 | Kabushiki Kaisha Yaskawa Denki | POWER CONVERTER DEVICE, SERVER AND DATA GENERATION METHOD |
| CN112782580A (en)* | 2021-02-25 | 2021-05-11 | 上海弈格工程技术有限公司 | Fault assessment system of motor |
| US11067631B2 (en) | 2019-01-08 | 2021-07-20 | Panoramic Power Ltd. | Methods for determining an alternate current motor fault in a non-variable frequency device based on current analysis |
| US20210359702A1 (en)* | 2020-05-13 | 2021-11-18 | Computational Systems, Inc. | Machine Spectral Data Compression |
| CN114545296A (en)* | 2022-01-27 | 2022-05-27 | 国网电力科学研究院有限公司 | Transformer inter-turn fault protection device, method and storage medium |
| CN114563700A (en)* | 2022-02-25 | 2022-05-31 | 华北电力科学研究院有限责任公司 | Method and device for measuring dynamic frequency domain impedance of generator rotor |
| US20230396201A1 (en)* | 2020-05-08 | 2023-12-07 | Siemens Aktiengesellschaft | Arrangement and method for determining the operational performance of a rotating electric machine |
Citations (17)
| Publication number | Priority date | Publication date | Assignee | Title |
|---|---|---|---|---|
| US4136312A (en)* | 1976-12-30 | 1979-01-23 | Westinghouse Electric Corp. | Method and apparatus for detection of rotor faults in dynamoelectric machines |
| US4164705A (en)* | 1976-04-27 | 1979-08-14 | Westinghouse Electric Corp. | Brushless exciter fault indicator system |
| US4377784A (en)* | 1979-12-12 | 1983-03-22 | Hitachi, Ltd. | Fault detection apparatus for rotor winding of rotary machine |
| US4441065A (en)* | 1980-09-11 | 1984-04-03 | Siemens Ag | Method and apparatus for determining the rotor resistance of an asynchronous machine |
| US4442393A (en)* | 1982-03-04 | 1984-04-10 | Westinghouse Electric Corp. | Apparatus and method for determining the operation of an induction motor |
| US4495448A (en)* | 1981-11-06 | 1985-01-22 | Dumbeck Robert F | Means and method of sensing motor rotation speed from stray escaping flux |
| US4506218A (en)* | 1981-01-12 | 1985-03-19 | Rotron Incorporated | Condition sensing arrangement for ac machines |
| US4761703A (en)* | 1987-08-31 | 1988-08-02 | Electric Power Research Institute, Inc. | Rotor fault detector for induction motors |
| US4808932A (en)* | 1987-05-15 | 1989-02-28 | Electric Power Research Institute, Inc. | Rotor fault and location detector for induction motors |
| US4940932A (en)* | 1986-05-06 | 1990-07-10 | General Electric Company | Method and apparatus for testing dynamoelectric machine rotors |
| US5045779A (en)* | 1986-05-06 | 1991-09-03 | General Electric Company | Method and apparatus for testing dynamoelectric machine rotors |
| US5049815A (en)* | 1990-04-20 | 1991-09-17 | General Electric Company | Spectral analysis of induction motor current to detect rotor faults with reduced false alarms |
| US5252915A (en)* | 1992-01-23 | 1993-10-12 | Ontario Hydro | Method and apparatus for detecting stator faults in rotary dynamoelectric machines |
| US5461329A (en)* | 1992-01-21 | 1995-10-24 | Martin Marietta Energy Systems, Inc. | Method and apparatus for generating motor current spectra to enhance motor system fault detection |
| US5519337A (en)* | 1993-11-04 | 1996-05-21 | Martin Marietta Energy Systems, Inc. | Motor monitoring method and apparatus using high frequency current components |
| US5523701A (en)* | 1994-06-21 | 1996-06-04 | Martin Marietta Energy Systems, Inc. | Method and apparatus for monitoring machine performance |
| US5530343A (en)* | 1994-10-07 | 1996-06-25 | Computational Systems, Inc. | Induction motor speed determination by flux spectral analysis |
- 1996
- 1996-06-20USUS08/667,141patent/US5739698A/ennot_activeExpired - Lifetime
Patent Citations (17)
| Publication number | Priority date | Publication date | Assignee | Title |
|---|---|---|---|---|
| US4164705A (en)* | 1976-04-27 | 1979-08-14 | Westinghouse Electric Corp. | Brushless exciter fault indicator system |
| US4136312A (en)* | 1976-12-30 | 1979-01-23 | Westinghouse Electric Corp. | Method and apparatus for detection of rotor faults in dynamoelectric machines |
| US4377784A (en)* | 1979-12-12 | 1983-03-22 | Hitachi, Ltd. | Fault detection apparatus for rotor winding of rotary machine |
| US4441065A (en)* | 1980-09-11 | 1984-04-03 | Siemens Ag | Method and apparatus for determining the rotor resistance of an asynchronous machine |
| US4506218A (en)* | 1981-01-12 | 1985-03-19 | Rotron Incorporated | Condition sensing arrangement for ac machines |
| US4495448A (en)* | 1981-11-06 | 1985-01-22 | Dumbeck Robert F | Means and method of sensing motor rotation speed from stray escaping flux |
| US4442393A (en)* | 1982-03-04 | 1984-04-10 | Westinghouse Electric Corp. | Apparatus and method for determining the operation of an induction motor |
| US4940932A (en)* | 1986-05-06 | 1990-07-10 | General Electric Company | Method and apparatus for testing dynamoelectric machine rotors |
| US5045779A (en)* | 1986-05-06 | 1991-09-03 | General Electric Company | Method and apparatus for testing dynamoelectric machine rotors |
| US4808932A (en)* | 1987-05-15 | 1989-02-28 | Electric Power Research Institute, Inc. | Rotor fault and location detector for induction motors |
| US4761703A (en)* | 1987-08-31 | 1988-08-02 | Electric Power Research Institute, Inc. | Rotor fault detector for induction motors |
| US5049815A (en)* | 1990-04-20 | 1991-09-17 | General Electric Company | Spectral analysis of induction motor current to detect rotor faults with reduced false alarms |
| US5461329A (en)* | 1992-01-21 | 1995-10-24 | Martin Marietta Energy Systems, Inc. | Method and apparatus for generating motor current spectra to enhance motor system fault detection |
| US5252915A (en)* | 1992-01-23 | 1993-10-12 | Ontario Hydro | Method and apparatus for detecting stator faults in rotary dynamoelectric machines |
| US5519337A (en)* | 1993-11-04 | 1996-05-21 | Martin Marietta Energy Systems, Inc. | Motor monitoring method and apparatus using high frequency current components |
| US5523701A (en)* | 1994-06-21 | 1996-06-04 | Martin Marietta Energy Systems, Inc. | Method and apparatus for monitoring machine performance |
| US5530343A (en)* | 1994-10-07 | 1996-06-25 | Computational Systems, Inc. | Induction motor speed determination by flux spectral analysis |
Non-Patent Citations (21)
| Title |
|---|
| J. Penman and M.N. Dey, "Multi-Functional Monitoring and Protection Scheme for Electrical Machines," UPEC 19 Universities of Dundee and Aberdeen, U.K. unknown date. |
| J. Penman and M.N. Dey, Multi Functional Monitoring and Protection Scheme for Electrical Machines, UPEC 19 Universities of Dundee and Aberdeen, U.K. unknown date.* |
| J. Penman, H.G. Sedding, B.A. Lloyd, and W.T. Fink, "Detection and Location of Interturn Short Circuits in the Stator Windings of Operating Motors," 94 WM 105-7 EC, 1994 IEEE, pp. 1-7. unknown month. |
| J. Penman, H.G. Sedding, B.A. Lloyd, and W.T. Fink, Detection and Location of Interturn Short Circuits in the Stator Windings of Operating Motors, 94 WM 105 7 EC, 1994 IEEE, pp. 1 7. unknown month.* |
| J. Penman, H.G. Sedding, B.A. Lloyd, W.T. Fink, R. Boggia, and B. Horowitz, "On-Line Detection and Location of Stator Winding Interturn Faults." unknown date. |
| J. Penman, H.G. Sedding, B.A. Lloyd, W.T. Fink, R. Boggia, and B. Horowitz, On Line Detection and Location of Stator Winding Interturn Faults. unknown date.* |
| J. Penman, M.N. Dey, A.J. Tait, and W.E. Bryan, Condition Monitoring of Electrical drives, IEE Proceedings, vol. 1133, Part B, No. 3, May 1986.* |
| L.D. Berry, "How to Link Thermal and Vibration Data to Diagnose Mechanical Power Transmission Problems," P/PM Technology, Apr. 1993, pp. 12-14. |
| L.D. Berry, How to Link Thermal and Vibration Data to Diagnose Mechanical Power Transmission Problems, P/PM Technology, Apr. 1993, pp. 12 14.* |
| M.S. Erlicki, Y. Porat, and A. Alexandrovitz, "Leakage Field Changes of an Induction Motor as Indication of Nonsymmetric Supply," vol. IGA-7, No. 6, Nov./Dec. 1971, pp. 713-717. |
| M.S. Erlicki, Y. Porat, and A. Alexandrovitz, Leakage Field Changes of an Induction Motor as Indication of Nonsymmetric Supply, vol. IGA 7, No. 6, Nov./Dec. 1971, pp. 713 717.* |
| NEMA Standards Publication No. MG 1, Tests and Performance AC, NEMA MG 1 1987, Part 12, pp. 10 12.* |
| NEMA Standards Publication No. MG 1, Tests and Performance--AC, NEMA MG 1-1987, Part 12, pp. 10-12. |
| R.A. Leonard and W.T. Thomason, "Vibration and Stray Flux Monitoring for Unbalanced Supply and Inter-Turn Winding Fault Diagnosis in Induction Motors," British Journal of NDT, Jul. 1986, pp. 211-215. |
| R.A. Leonard and W.T. Thomason, Vibration and Stray Flux Monitoring for Unbalanced Supply and Inter Turn Winding Fault Diagnosis in Induction Motors, British Journal of NDT, Jul. 1986, pp. 211 215.* |
| S.V. Bowers and K.R. Piety, "Proactive Motor Monitoring Through Temperature, Shaft Current and Magnetic Flux Measurements," Computational Systems, Inc. User's Conference, Sep. 1994. |
| S.V. Bowers and K.R. Piety, Proactive Motor Monitoring Through Temperature, Shaft Current and Magnetic Flux Measurements, Computational Systems, Inc. User s Conference, Sep. 1994.* |
| S.V. Bowers, W.A. Davis, and K.R. Piety, "Proactive Motor Monitoring," Computational Systems, Inc. User's Conference, Sep. 1993. |
| S.V. Bowers, W.A. Davis, and K.R. Piety, Proactive Motor Monitoring, Computational Systems, Inc. User s Conference, Sep. 1993.* |
| W.T. Thomson, R.A. Leonard, A.J. Milne, and J. Penman, "Failure Identification of Offshore Induction Motor Systems Using On-Condition Monitoring," Proceedings of 4th National Reliability Conference, Birmingham, U.K., 1983 unknown month. |
| W.T. Thomson, R.A. Leonard, A.J. Milne, and J. Penman, Failure Identification of Offshore Induction Motor Systems Using On Condition Monitoring, Proceedings of 4th National Reliability Conference, Birmingham, U.K., 1983 unknown month.* |
Cited By (93)
| Publication number | Priority date | Publication date | Assignee | Title |
|---|---|---|---|---|
| US6308140B1 (en)* | 1996-05-20 | 2001-10-23 | Crane Nuclear, Inc. | Motor condition and performance analyzer |
| EP0961130A1 (en)* | 1998-05-28 | 1999-12-01 | DaimlerChrysler AG | Method and apparatus for early detection of faulty rotors in asynchronous machines |
| US6801031B1 (en)* | 1998-09-04 | 2004-10-05 | Wilo Gmbh | Method and apparatus for current measurement for electronically-controlled pump |
| WO2000026633A1 (en)* | 1998-10-30 | 2000-05-11 | Caterpillar Inc. | Automatic stencil generation system and method |
| US6236950B1 (en) | 1998-10-30 | 2001-05-22 | Caterpiller Inc. | Automatic stencil generation system and method |
| US6335631B2 (en)* | 1998-12-07 | 2002-01-01 | General Electric Company | Induction machine asymmetry detection instrument and method |
| US6172509B1 (en) | 1999-02-11 | 2001-01-09 | The United States Of America As Represented By The Secretary Of The Air Force | Detecting polyphase machine faults via current deviation |
| US6460013B1 (en) | 1999-05-06 | 2002-10-01 | Paul I. Nippes | Shaft voltage current monitoring system for early warning and problem detection |
| US7034706B1 (en) | 1999-05-06 | 2006-04-25 | Nippes Paul I | Early warning and problem detection in rotating machinery by monitoring shaft voltage and/or grounding current |
| US6262550B1 (en) | 1999-12-17 | 2001-07-17 | General Electric Company | Electrical motor monitoring system and method |
| KR100330258B1 (en)* | 2000-03-03 | 2002-03-25 | 윤행순 | Inspecting method for generator stator windings |
| WO2002056039A1 (en)* | 2001-01-08 | 2002-07-18 | Jurmain Richard N | Method and apparatus for monitoring the health of individual electrical devices |
| US20040019461A1 (en)* | 2002-04-22 | 2004-01-29 | Kai Bouse | Machine fault information detection and reporting |
| US7142990B2 (en) | 2002-04-22 | 2006-11-28 | Csi Technology, Inc. | Machine fault information detection and reporting |
| US6839660B2 (en) | 2002-04-22 | 2005-01-04 | Csi Technology, Inc. | On-line rotating equipment monitoring device |
| US20040050177A1 (en)* | 2002-09-13 | 2004-03-18 | Grosjean Dennis Francis | Motor based condition monitoring |
| US6993439B2 (en) | 2002-09-13 | 2006-01-31 | Innovative Scientific Solutions, Inc. | Motor based condition monitoring |
| US20040090197A1 (en)* | 2002-11-08 | 2004-05-13 | Schuchmann Russell P. | Method and apparatus of detecting disturbances in a centrifugal pump |
| US6933693B2 (en)* | 2002-11-08 | 2005-08-23 | Eaton Corporation | Method and apparatus of detecting disturbances in a centrifugal pump |
| DE10300051A1 (en)* | 2002-12-13 | 2004-07-15 | Daimlerchrysler Ag | Method and device for testing electric motors, in particular, fan motors for functionality |
| US7079039B2 (en) | 2002-12-13 | 2006-07-18 | Daimlerchrysler Ag | Process and device for testing electric motors, in particular fan motors, for functionality |
| US20040124844A1 (en)* | 2002-12-13 | 2004-07-01 | Andreas Gruhle | Process and device for testing electric motors, in particular fan motors, for functionality |
| US7275003B2 (en)* | 2003-02-07 | 2007-09-25 | Atec Co. Ltd. | Harmonic diagnosing method for electric facility |
| US20060009932A1 (en)* | 2003-02-07 | 2006-01-12 | Hiroshi Koh | Harmonic diagnosing method for electric facility |
| US7135830B2 (en)* | 2003-09-30 | 2006-11-14 | Reliance Electric Technologies, Llc | System and method for identifying operational parameters of a motor |
| US20070118307A1 (en)* | 2003-09-30 | 2007-05-24 | Yehia El-Ibiary | Motor parameter estimation method and apparatus |
| US20050067991A1 (en)* | 2003-09-30 | 2005-03-31 | Yehia El-Ibiary | System and method for identifying operational parameters of a motor |
| US20050088271A1 (en)* | 2003-10-23 | 2005-04-28 | Siemens Westinghouse Power Corporation | Sensing apparatus for blown fuse of rectifying wheel and associated methods |
| US6956459B2 (en)* | 2003-10-23 | 2005-10-18 | Siemens Westinghouse Power Corporation | Sensing apparatus for blown fuse of rectifying wheel and associated methods |
| KR100542893B1 (en)* | 2003-12-22 | 2006-01-11 | 재단법인 포항산업과학연구원 | Induction motor fault condition diagnosis device |
| US20070182359A1 (en)* | 2004-06-22 | 2007-08-09 | Matthias Wahler | Intelligent drive |
| US7659687B2 (en)* | 2004-06-22 | 2010-02-09 | Bosch Rexroth Ag | Intelligent drive |
| US7883319B2 (en)* | 2004-07-28 | 2011-02-08 | Igus-Innovative Technische Systeme Gmbh | Method and device for monitoring the state of rotor blades on wind power installations |
| US20080206052A1 (en)* | 2004-07-28 | 2008-08-28 | Igus - Innovative Technische Systeme Gmbh | Method and Device for Monitoring the State of Rotor Blades on Wind Power Installations |
| US7239103B2 (en)* | 2005-02-25 | 2007-07-03 | International Rectifier Corporation | Synchronous motor startup lock detection circuit and method |
| US20060193090A1 (en)* | 2005-02-25 | 2006-08-31 | International Rectifier Corp. | Synchronous motor startup lock detection circuit and method |
| US20090091289A1 (en)* | 2007-10-08 | 2009-04-09 | University Of Victoria Innovation And Development Corporation | Stator inter-turn fault detection of synchronous machines |
| US7592772B2 (en)* | 2007-10-08 | 2009-09-22 | University Of Victoria Innovation And Development Corporation | Stator inter-turn fault detection of synchronous machines |
| WO2009127068A1 (en)* | 2008-04-14 | 2009-10-22 | Corporation Nuvolt Inc. | Electrical anomaly detection method and system |
| EP2304452A4 (en)* | 2008-04-14 | 2014-12-03 | Corp Nuvolt Inc | Electrical anomaly detection method and system |
| US8566047B2 (en) | 2008-04-14 | 2013-10-22 | Corporation Nuvolt Inc. | Electrical anomaly detection method and system |
| US20110153236A1 (en)* | 2008-04-14 | 2011-06-23 | Michel Montreuil | Electrical anomaly detection method and system |
| AU2009238183B2 (en)* | 2008-04-14 | 2014-06-19 | Corporation Nuvolt Inc. | Electrical anomaly detection method and system |
| CN102066956B (en)* | 2008-04-14 | 2014-06-11 | 努沃尔特股份有限公司 | Electrical anomaly detection method and system |
| EP2112753A1 (en)* | 2008-04-24 | 2009-10-28 | Advanced Digital Design, S.A. | Method and device for determining the rotor rotation speed of an asynchronous electric induction motor |
| CN101369004B (en)* | 2008-09-19 | 2011-04-06 | 中国电力科学研究院 | Micro-phase shift fast transformation method used for excitation system frequency spectrum analysis |
| EP2340608B1 (en)* | 2008-10-22 | 2019-06-12 | General Electric Technology GmbH | Device and method for monitoring and/or analyzing rotors of electric machines in operation |
| US8278934B2 (en)* | 2009-02-13 | 2012-10-02 | Bae Systems Controls Inc. | Robust AC chassis fault detection using PWM sideband harmonics |
| US20100207634A1 (en)* | 2009-02-13 | 2010-08-19 | Bae Systems Controls Inc. | Robust ac chassis fault detection using pwm sideband harmonics |
| US20110089883A1 (en)* | 2009-10-21 | 2011-04-21 | Gm Global Technology Operations, Inc. | Motor phase winding fault detection method and apparatus |
| US8362732B2 (en)* | 2010-02-02 | 2013-01-29 | GM Global Technology Operations LLC | Motor phase winding fault detection method and apparatus |
| US20110187304A1 (en)* | 2010-02-02 | 2011-08-04 | Gm Global Technology Operations, Inc. | Motor phase winding fault detection method and apparatus |
| US9176003B2 (en)* | 2010-05-25 | 2015-11-03 | Siemens Energy, Inc. | Machine vibration monitoring |
| US20110291850A1 (en)* | 2010-05-25 | 2011-12-01 | Yanxia Sun | Machine vibration monitoring |
| US20110313717A1 (en)* | 2010-06-16 | 2011-12-22 | Bin Lu | System and method of speed detection in an ac induction machine |
| US8566056B2 (en)* | 2010-06-16 | 2013-10-22 | Eaton Corporation | System and method of speed detection in an AC induction machine |
| US9130499B2 (en) | 2010-06-16 | 2015-09-08 | Eaton Corporation | System and method of speed detection in an AC induction machine |
| US8405339B2 (en)* | 2010-07-01 | 2013-03-26 | Eaton Corporation | System and method for detecting fault in an AC machine |
| US20120001580A1 (en)* | 2010-07-01 | 2012-01-05 | Pinjia Zhang | System and method for detecting fault in an ac machine |
| US8542800B2 (en)* | 2010-09-23 | 2013-09-24 | General Electric Company | Asynchronous motor with features creating magnetic field disturbance |
| US20120076277A1 (en)* | 2010-09-23 | 2012-03-29 | Eric Bruce Biehr | Asynchronous motor with features creating magnetic field disturbance |
| US10353004B2 (en)* | 2013-12-30 | 2019-07-16 | Abb Schweiz Ag | Method and system for detecting rotor fault using triaxial magnetic field sensor |
| US20170082692A1 (en)* | 2013-12-30 | 2017-03-23 | Abb Schweiz Ag | Method and system for detecting rotor fault |
| US20170123007A1 (en)* | 2014-05-06 | 2017-05-04 | Siemens Aktiengesellschaft | Method and apparatus for detecting interturn faults, and electrical machine |
| US20180011480A1 (en)* | 2015-01-20 | 2018-01-11 | Hitachi, Ltd. | Machine diagnostic apparatus and machine diagnostic method |
| US10295995B2 (en)* | 2015-01-20 | 2019-05-21 | Hitachi, Ltd. | Machine diagnostic apparatus and machine diagnostic method |
| US20160266207A1 (en)* | 2015-03-10 | 2016-09-15 | Mitsubishi Electric Research Laboratories, Inc. | Fault Detection in Induction Motors Based on Current Signature Analysis |
| US9618583B2 (en)* | 2015-03-10 | 2017-04-11 | Mitsubishi Electric Research Laboratories, Inc | Fault detection in induction motors based on current signature analysis |
| US20180059656A1 (en)* | 2015-03-12 | 2018-03-01 | Hitachi, Ltd. | Machine Diagnostic Device and Machine Diagnostic Method |
| US10338143B2 (en) | 2016-08-09 | 2019-07-02 | Rolls-Royce Plc | Method and apparatus for diagnosing a fault condition in an electric machine |
| CN106597281A (en)* | 2016-12-16 | 2017-04-26 | 哈尔滨工业大学 | No-load parameter detection device of DC motor |
| CN107178514A (en)* | 2017-05-04 | 2017-09-19 | 山东大学 | Blower fan unit non-intrusion type efficiency diagnostic method and system |
| CN107178514B (en)* | 2017-05-04 | 2019-08-20 | 山东大学 | Method and system for non-intrusive energy efficiency diagnosis of fan unit |
| CN110998343A (en)* | 2017-07-13 | 2020-04-10 | Itt制造企业有限责任公司 | Technique for detecting leakage flux abnormality of motor |
| JP2020527017A (en)* | 2017-07-13 | 2020-08-31 | アイティーティー マニュファクチャーリング エンタープライジズ エルエルシー | Technology to detect abnormalities in motor leakage flux |
| WO2019014438A1 (en)* | 2017-07-13 | 2019-01-17 | Itt Manufacturing Enterprises Llc | Technique to detect motor leakage flux anomalies |
| US10514428B2 (en) | 2017-07-13 | 2019-12-24 | Itt Manufacturing Enterprises Llc | Technique to detect motor leakage flux anomalies |
| US10353005B2 (en) | 2017-07-13 | 2019-07-16 | Itt Manufacturing Enterprises Llc | Technique for self learning motor load profile |
| WO2019014435A1 (en)* | 2017-07-13 | 2019-01-17 | Itt Manufacturing Enterprises Llc | Technique for self learning motor load profile |
| US10976379B2 (en) | 2017-07-13 | 2021-04-13 | Itt Manufacturing Enterprises Llc | Technique to detect motor leakage flux anomalies |
| US11038454B2 (en) | 2017-07-31 | 2021-06-15 | Kabushiki Kaisha Yaskawa Denki | Power conversion device and server |
| EP3663880A4 (en)* | 2017-07-31 | 2021-04-28 | Kabushiki Kaisha Yaskawa Denki | POWER CONVERTER DEVICE, SERVER AND DATA GENERATION METHOD |
| US10698031B2 (en) | 2018-02-02 | 2020-06-30 | R. Gene Smiley | Systems and methods for obtaining and validating performance data on motors |
| US11067631B2 (en) | 2019-01-08 | 2021-07-20 | Panoramic Power Ltd. | Methods for determining an alternate current motor fault in a non-variable frequency device based on current analysis |
| WO2020183610A1 (en)* | 2019-03-12 | 2020-09-17 | 三菱電機株式会社 | Short circuit detection device and short circuit detection method |
| JP6656488B1 (en)* | 2019-03-12 | 2020-03-04 | 三菱電機株式会社 | Short circuit detection device and short circuit detection method |
| US10686394B1 (en)* | 2020-02-05 | 2020-06-16 | The Florida International University Board Of Trustees | Condition monitoring and fault detection in induction motors |
| US20230396201A1 (en)* | 2020-05-08 | 2023-12-07 | Siemens Aktiengesellschaft | Arrangement and method for determining the operational performance of a rotating electric machine |
| US20210359702A1 (en)* | 2020-05-13 | 2021-11-18 | Computational Systems, Inc. | Machine Spectral Data Compression |
| US11342932B2 (en)* | 2020-05-13 | 2022-05-24 | Computational Systems, Inc. | Machine spectral data compression |
| CN112782580A (en)* | 2021-02-25 | 2021-05-11 | 上海弈格工程技术有限公司 | Fault assessment system of motor |
| CN114545296A (en)* | 2022-01-27 | 2022-05-27 | 国网电力科学研究院有限公司 | Transformer inter-turn fault protection device, method and storage medium |
| CN114563700A (en)* | 2022-02-25 | 2022-05-31 | 华北电力科学研究院有限责任公司 | Method and device for measuring dynamic frequency domain impedance of generator rotor |
Similar Documents
| Publication | Publication Date | Title |
|---|---|---|
| US5739698A (en) | Machine fault detection using slot pass frequency flux measurements | |
| EP2728367B1 (en) | A method for detecting a fault condition in an electrical machine | |
| CA2739844C (en) | Device and method for monitoring and/or analyzing rotors of electric machines in operation | |
| US7042229B2 (en) | System and method for on line monitoring of insulation condition for DC machines | |
| US9945907B2 (en) | Method and system for determining a synchronous machine fault condition | |
| Sin et al. | Induction machine on-line condition monitoring and fault diagnosis-a survey | |
| EP2565658B1 (en) | Fault detection based on current signature analysis for a generator | |
| Pezzani et al. | Detecting broken rotor bars with zero-setting protection | |
| US7081760B2 (en) | Method of diagnosing a broken bar fault in an induction motor | |
| EP2919027A1 (en) | Fault detection in induction machines | |
| Rafaq et al. | Reliable airgap search coil based detection of induction motor rotor faults under false negative motor current signature analysis indications | |
| US20050218906A1 (en) | System and method for monitoring of insulation condition | |
| Sadeghi et al. | Online fault diagnosis of large electrical machines using vibration signal-a review | |
| EP2851698B1 (en) | A method for detecting a fault in an electrical machine | |
| Noureddine et al. | Rolling bearing failure detection in induction motors using stator current, vibration and stray flux analysis techniques | |
| Mehala et al. | Condition monitoring methods, failure identification and analysis for Induction machines | |
| Sadeghi et al. | Online condition monitoring of large synchronous generator under short circuit fault—A review | |
| Pusca et al. | Comparative study between two diagnostic techniques dedicated to the mechanical fault detection in induction motors | |
| Ehya et al. | Inter-turn short circuit fault identification of salient pole synchronous generators by descriptive paradigm | |
| KR20190099861A (en) | System and method for detecting damper bar breakage of 3-phase salient pole synchronous machines | |
| Widagdo et al. | Detection of Air Gap Eccentricity on Three-Phase Induction Motor Using 3-Axis Digital ELF Gaussmeter | |
| Drif et al. | Rotor cage fault diagnostics in three-phase induction motors, by the instantaneous non-active power signature analysis | |
| CN114062910B (en) | A motor online diagnosis system and method | |
| Ibragimov et al. | Exploration of the combined vibration parameters and external magnetic field in diagnosing asynchronous electric motors | |
| Bradiya et al. | Utilization of Signal Analysis Techniques in Investigation of Rotor Broken Bars and Misalignment Defects on low power Induction Machines |
Legal Events
| Date | Code | Title | Description |
|---|---|---|---|
| AS | Assignment | Owner name:COMPUTATIONAL SYSTEMS, INC., TENNESSEE Free format text:ASSIGNMENT OF ASSIGNORS INTEREST;ASSIGNORS:BOWERS, STEWART;PIETY, KENNETH R.;REEL/FRAME:008065/0687 Effective date:19960619 | |
| AS | Assignment | Owner name:CSI TECHNOLOGY, INC., DELAWARE Free format text:ASSIGNMENT OF ASSIGNORS INTEREST;ASSIGNOR:COMPUTATIONAL SYSTEMS, INC.;REEL/FRAME:008470/0559 Effective date:19970412 | |
| FEPP | Fee payment procedure | Free format text:PAT HLDR NO LONGER CLAIMS SMALL ENT STAT AS SMALL BUSINESS (ORIGINAL EVENT CODE: LSM2); ENTITY STATUS OF PATENT OWNER: LARGE ENTITY | |
| STCF | Information on status: patent grant | Free format text:PATENTED CASE | |
| FPAY | Fee payment | Year of fee payment:4 | |
| FPAY | Fee payment | Year of fee payment:8 | |
| FPAY | Fee payment | Year of fee payment:12 | |
| SULP | Surcharge for late payment | Year of fee payment:11 | |
| AS | Assignment | Owner name:COMPUTATIONAL SYSTEMS, INC., TENNESSEE Free format text:ASSIGNMENT OF ASSIGNORS INTEREST;ASSIGNOR:CSI TECHNOLOGY, INC.;REEL/FRAME:034716/0119 Effective date:20141229 |