US5632009A - Method and system for producing a table image showing indirect data representations - Google Patents
Method and system for producing a table image showing indirect data representationsDownload PDFInfo
- Publication number
- US5632009A US5632009AUS08/611,013US61101396AUS5632009AUS 5632009 AUS5632009 AUS 5632009AUS 61101396 AUS61101396 AUS 61101396AUS 5632009 AUS5632009 AUS 5632009A
- Authority
- US
- United States
- Prior art keywords
- data
- column
- graphical
- table image
- graphical display
- Prior art date
- Legal status (The legal status is an assumption and is not a legal conclusion. Google has not performed a legal analysis and makes no representation as to the accuracy of the status listed.)
- Expired - Lifetime
Links
Images


Classifications
- G—PHYSICS
- G06—COMPUTING OR CALCULATING; COUNTING
- G06F—ELECTRIC DIGITAL DATA PROCESSING
- G06F3/00—Input arrangements for transferring data to be processed into a form capable of being handled by the computer; Output arrangements for transferring data from processing unit to output unit, e.g. interface arrangements
- G06F3/01—Input arrangements or combined input and output arrangements for interaction between user and computer
- G06F3/02—Input arrangements using manually operated switches, e.g. using keyboards or dials
- G06F3/023—Arrangements for converting discrete items of information into a coded form, e.g. arrangements for interpreting keyboard generated codes as alphanumeric codes, operand codes or instruction codes
- G—PHYSICS
- G06—COMPUTING OR CALCULATING; COUNTING
- G06F—ELECTRIC DIGITAL DATA PROCESSING
- G06F40/00—Handling natural language data
- G06F40/10—Text processing
- G06F40/166—Editing, e.g. inserting or deleting
- G06F40/177—Editing, e.g. inserting or deleting of tables; using ruled lines
- G06F40/18—Editing, e.g. inserting or deleting of tables; using ruled lines of spreadsheets
- G—PHYSICS
- G06—COMPUTING OR CALCULATING; COUNTING
- G06T—IMAGE DATA PROCESSING OR GENERATION, IN GENERAL
- G06T11/00—2D [Two Dimensional] image generation
- G06T11/20—Drawing from basic elements, e.g. lines or circles
- G06T11/206—Drawing of charts or graphs
Definitions
- the present inventionis related to another invention that is the subject matter of a concurrently filed, commonly assigned U.S. patent application, Ser. No. 08/123,174, now abandoned, entitled “Method and System for Producing a Table Image Having Focus and Context Areas Showing Direct and Indirect Data Representations", which is hereby incorporated by reference herein.
- the present inventionrelates generally to the presentation of data in image form in processor-controlled systems, and more particularly to effectively presenting in a tabular image graphical representations of data capable of being structured as an array.
- a key objective of information systems designersis the presentation of information representing data stored in the memory device of a processor-controlled system to the human user of the system in an effective image format that conveys and enhances the understanding of the information in a spacially efficient and effective manner, and permits the system user to quickly and efficiently specify and locate information of particular interest.
- a familiar and effective information presentation form for certain types of structured informationis that of an image of a table, also referred to herein as a "table image".
- a "table”is an orderly, rectilinear arrangement of information, typically but not necessarily, ordered in a rectangular form of rows and columns and having identifiers, such as labels, arranged at the periphery of the table.
- the intersection of a row and column in a tabledefines a data location, typically called a "cell”, and may include alphabetic and numeric character data or arithmetic operators or formulas.
- a tableis distinguishable from various types of graphs which do not have all of the characteristics of the orderly, rectilinear arrangement of information found in a table.
- a popular application of a table imageis the "spreadsheet", the information presentation format used by a computer-implemented spreadsheet application program that presents a tabular image of underlying data stored in the memory of a system, and that provides a system user with access to the stored data via the manipulation of the character display features that visually represent the underlying data presented in the cells of the spreadsheet.
- Table imagesalso may be used in a wide variety of application program contexts where the information structure includes linear elements and is organized in, or is capable of being organized in, an n-dimensional "array data structure".
- a common problem that exists with the presentation of data in a table image format of any sizeinvolves the display of character, or non-graphical, display features such as text and numbers, in the table cells representing the data in the information structure. Rows and columns of text and numbers, even when sorted or ordered to reflect a particular information interest of the system user, do not necessarily present the information in the data structure in a form meaningful for detecting patterns in the information, or for seeing overall trends in the data. The ability to detect patterns and trends often facilitates for the system user both navigation through the data and rapid understanding of the key principles that the data conveys.
- Another problemspecifically involves the presentation of large table images representing a large information structure when there is too much data for all of the data to be clearly presented in a table image that fits in the display area of the system display device. This phenomenon is referred to as the table's wide or extreme aspect ratio.
- the application programtypically only presents a portion of the table image in the display area, and provides a function for the system user to scroll through the table image to reach portions not currently visible in the display area in order to access the data represented by the character images in the table cells.
- Two information presentation design strategiesare particularly useful for improving the presentation of information and make advantageous use of certain human perceptual abilities in order to maximize rapid and efficient understanding of information presented as an image in the workspace or display area of a display device.
- space strategyuses layout and graphic design techniques to present substantially all information in a data structure in one view in the workspace.
- This strategytypically involves the presentation of information in primarily graphical or pictorial form rather than in non-graphical or character (textual) form because of the size limitations of the workspace of a display device, and because of limitations on the amount of detail that a human user is actually able to perceive.
- the other design strategy of interest hereininvolves the presentation of specific information of particular interest to a system user while concurrently maintaining and displaying the global context and structure of the body of information from which the specific information was selected.
- the fundamental motivation of this strategyis to provide a balance of local detail and global context. Local detail is needed for the local interactions with the data.
- the global contextis needed to tell the system user what other parts of the data exist and where they are, and may also be important in more effective interpretation of the local detail.
- One common implementation of this strategypresents the global information in less detail than the local information. This strategy may be considered as a combination of the time and space strategies discussed earlier.
- Furnasdiscloses the application of "fisheye views" of information to the design of a computer interface for the display of large information structures, presenting a simple formalism for defining a fisheye view based on a "Degree of Interest" (hereafter also referred to as "DOI") function that allows fisheye views to be defined in any sort of information structure where the necessary components of the formalism can be defined.
- DOIDegree of Interest
- Furnasfurther discloses that the basic strategy for the display of a large structure uses the degree of Interest function to assign to each point in the information structure a number telling how interested the user is in seeing that point, given the current task. A display of any size, n, can then be made by simply showing the n "most interesting” points as described by the DOI function. Furnas also discloses the definition of fisheye DOI functions for tree structures, and illustrates the fisheye strategy as applied to a calendar showing the current day in "day-at-a-time” detail, the current week in "week-at-a-time” detail, and the rest of the month in "month-at-a-time” detail.
- Specialized hardware support for three dimensional (3D) interactive animationis used to fold wide two dimensional (2D) layouts into 3D visualizations that have a center panel for detail and two perspective panels for context, thereby integrating detailed and contextual views into a single workspace display, and allowing the ratio of detail and context to be smoothly adjusted.
- the Bifocal Displaycontains a detailed view of information positioned in a horizontal strip combined with two distorted views, where items on either side of the detailed view are distorted horizontally into narrow vertical strips. The combined views make the entire data structure visible to the system user.
- the Bifocal Display techniquemakes use of the visual display of graphical representations of data items to facilitate the identification and location of information of interest and permits that information to be pulled into a central "close-up" region for more detailed examination.
- Spence and Apperleydisclose that, by this action, the whole strip of data representing the information structure is moved across the display area, preserving the spatial relationships between individual items while retaining the overall view of the entire information structure.
- the displaypermits a zoom action to be carried out within the central region in order to increase the level of detail about a data item provided there.
- Spence and Apperleyfurther disclose that attributes suitable for encoding the data items in the information structure in the outer regions of the Bifocal Display include color, shape, size, tags, pulsed illumination, and position, and they suggest that the use of alphanumerics be restricted to possibly only a single character per item.
- Spence and Apperleyalso discuss the application of the Bifocal Display presentation technique to a personal diary, or calendar, information structure, where a 2D arrangement of diary pages allows for the horizontal scrolling of weeks and the vertical scrolling of days into and out of the central region from the outer regions.
- the diaryIn the central region the diary is considered to be a 2D arrangement of "pages", each representing one week, which can be scrolled through the central viewport both vertically (by days) and horizontally (by weeks) such that at a given time any seven contiguous days can be seen in detail.
- Baker et al. in U.S. Pat. No. 5,226,118discloses a data analysis computer system capable of storing measurement data from plural measured processes and definitions for many data analysis charts. There is further disclosed a data display gallery feature which divides the computer system's display into a two dimensional array of cells, called a graphical spreadsheet or gallery, having cell definitions assigned to at least a subset of the cells.
- Each cell definitionconsists of either a set of measurement data which can be displayed as a unit, or a mathematical combination of a plurality of specified sets of measurement data.
- each displayed cellcontains a data map depicting a set of data in accordance with a corresponding cell definition.
- Each cell in the galleryis a graphic image representing an independent data analysis unit, and data points for each cell are selected by the user from a currently displayed control or trend chart, allowing visual comparison of plural data maps. Since each cell is independent from other displayed cells, the user of the system may assign each cell a different type of display or data analysis function using data mapping and data analysis menus. If the number of cells in the gallery exceeds the number that can be viewed at any one time, the vertical and horizontal scroll bars on the edges of the gallery display can be used to scroll the display so as to bring any particular cell into view.
- the graphical spreadsheet disclosed by Bakermay not display all of the available data in one display area or workspace, and is not a spreadsheet, or table of data showing interrelated information by rows and columns in the more commonly understood sense.
- the 3D Perspective Wallrequires specialized processing hardware, and may be unsuited for the display of interrelated table data, where 3D distortion of cell region sizes may detract from information understanding.
- the graphical spreadsheet disclosed in Baker et al.is not actually suited for the type of interrelated data organization typically intended for display in table form, since each cell is independent from the others.
- the graphical mapping techniques disclosed in Bertindo not address the issues of simultaneously presenting both the global and local context of the interrelated information presented in a table image. Many of these information presentation examples do not provide mechanisms for shifting between the global and focus modes, and for efficiently navigating through, a table image to rapidly locate data of interest. Moreover, none of these examples of information presentation techniques address the problem of effectively displaying table images that are too large to fit in the display area while simultaneously providing a system user with efficient access to data in individual cells.
- the method and system of the present inventionaddress the above-described deficiencies of existing examples of information presentation techniques specifically for the domain of information structured in an n-dimensional (nD) data array that is suitable for display in a table or spreadsheet image structure where the positional relationship of data arranged by rows and columns conveys information about the data, and where the presentation of all of the detail contained in the sets of related information arranged in a row or column is necessary for a system user to accurately access the data in the underlying information data structure via interaction with the image.
- nDn-dimensional
- the method and systemaddress the problem of providing a general presentation method for the data in non-focal regions by making use of a novel graphical mapping technique for presenting a table image representing an information data structure utilizing graphic images in the data cells in place of and as representative of respectively paired non-graphical data in the information data structure.
- This graphical mapping techniqueprovides a powerful mechanism for visually inspecting patterns and trends in the underlying data.
- a well-designed user interfaceprovides a system user with facilities such as row or column sorting, row or column reordering, and row or column addition by defining a new row or column from existing row or columns in order to rearrange the graphical images to reveal additional patterns and trends in the underlying information data.
- the graphical mapping technique of the method and system of the present inventionis particularly effective for displaying table images that are otherwise too large to fit in the display area.
- the method and system of the present inventionmake use of a novel graphical mapping technique for presenting a table image representing an entire information data structure utilizing graphic images of the non-graphical data in cells that are not of interest to the user while simultaneously providing a system user with efficient access to data in individual cells of interest.
- the present inventionrequires very little specialized skill by the system user beyond the skills already acquired in using an application program that presents and allows manipulation of table images.
- the techniquetakes advantage of human cognition and perception capabilities by providing character data in a graphical form to permit inspection of the data for patterns and trends in a global context.
- the table image presentation technique of the present inventionprovides improved spatially and temporally efficient access to the data in the information data structure by maintaining a user-controlled focus plus global context view of the information.
- the techniquecan be easily integrated into conventional spreadsheet and other table-oriented application programs.
- the systemincludes an input signal source, such as a user input device, for producing signals indicating image display requests, output circuitry connected to a display having a display area for presenting images, a memory for storing data including instruction data indicating instructions a processor executes, and a processor connected for receiving the signals from the input signal source, for providing images to the output circuitry, and for accessing the data stored in the memory.
- the methodincludes operating the processor to receive request signal data from the input signal source indicating a display request to present an image, referred to as a table image, in the display area.
- the table imageincludes a plurality of column identifier regions, a plurality of row identifier regions, and a plurality of cell regions.
- the plurality of cell regionsis determined by the number of source data items included in an n-dimensional (nD) data array stored in the memory, where n is at least two, since each source data item is paired with a respective cell region in the table image.
- Data along each dimension of the nD data arrayindicates a set of related source data items indicating related information, and each source data item has a source data value indicating non-graphical information.
- Each source data itemalso indicates a cell presentation type data item indicating a cell presentation type of a graphical display object to be presented in the respectively paired cell of the table image.
- the processorresponds to the request signal data indicating the display request by determining cell region width and height dimensions for each one of the plurality of cell regions to be displayed in the table image in the display area such that the table image presented in the display area includes all of the required cell regions. Then, the processor produces image definition data defining the table image including the plurality of column identifier regions, the plurality of row identifier regions, and the plurality of cell regions each having the respective cell region width and height dimensions.
- the processoraccesses a respective source data item in the nD data array and obtains the source data value of the respective source data item and the cell presentation type of the cell presentation type data item indicated by the respective source data item, and produces image definition data defining a graphical display object having size dimensions suitable for presentation in the respective cell region of the table image.
- the graphical display objectincludes a first display feature determined by the cell presentation type indicated by the respective source data item, and a second display feature determined by the source data value of the respective source data item.
- the processorthen provides the image definition data defining the table image and each graphical display object representing the respective source data item to the output circuitry connected to the display so that the display presents the table image in the display area and presents each graphical display object in the respective one of the plurality of cell regions of the table image.
- the graphical display objects presented in the respective cell regionsrepresent both the cell presentation type and the source data value of the non-graphical information indicated by each respective source data item, and provide a graphical view of all of the data in the nD data array in the display area.
- a systemincluding input circuitry connected to a user input device for receiving signals indicating image display requests from a system user, output circuitry connected to a display having a display area for presenting images, a memory for storing data including instruction data indicating instructions a processor executes, and a processor connected for receiving the signals from the input signal source, for providing images to the output circuitry, and for accessing the data stored in the memory.
- the data stored in memoryalso includes an n-dimensional (nD) data array where data along each dimension indicates a set of related source data items indicating related non-graphical information.
- the processor of the systemin executing the instructions, receives request signal data from the input circuitry indicating an image display request from the system user to present a table image in the display area including a plurality of column identifier regions, a plurality of row identifier regions, and a plurality of cell regions each of which shows a respectively paired one of the plurality of source data items in the nD data array.
- the processorfurther, in executing the instructions, responds to the image display request by determining cell region width and height dimensions for each one of the plurality of cell regions to be displayed in the table image in the display area such that the table image presented in the display area includes all of the cell regions, and by producing image definition data defining the table image including the plurality of column identifier regions, the plurality of row identifier regions, and the plurality of cell regions each having the respective cell region width and height dimensions.
- the system's processorFor each respective cell region included in the table image, the system's processor then accesses a respectively paired source data item in the nD data array to obtain the source data value of the respectively paired source data item and a cell presentation type of a cell presentation type data item indicated by the respectively paired source data item, and produces image definition data defining a graphical display object having size dimensions suitable for presentation in the respective cell region of the table image.
- the graphical display objectincludes a first display feature determined by the cell presentation type indicated by the respective source data item, and a second display feature determined by the source data value of the respective source data item.
- the system's processorthen further provides the image definition data defining the table image and each graphical display object representing the respective source data item to the output circuitry connected to the display so that the display presents the table image in the display area and presents each graphical display object in the respective one of the plurality of cell regions of the table image.
- the present inventionalso provides an improvement to a processor-based system including a memory having instructions stored therein indicating instructions for a spreadsheet application program the processor executes, and including a display device having a display area for presenting an image of a spreadsheet having a plurality of cells arranged in a plurality of rows and columns, each of the cells including an image of character (non-graphical) information representing a respectively paired one of a plurality of data items stored in a data array in the memory of the system, each data item indicating character (non-graphical) information.
- the processorin executing the instructions, replaces each character information image included in one of the respective cells with a graphical display object image including first and second display features representing respectively a cell presentation type and a data value of the respectively paired data item stored in the memory of the system.
- the processorwhen the image of the spreadsheet produced using the plurality of data items stored in the memory of the system cannot be completely displayed in the display area using the images of character information representing respectively paired ones of the plurality of data items, the processor further determines a new cell size for each of the plurality of cells displayed in the image of the spreadsheet using the size of the display area and a number of cells of a complete spreadsheet image. The processor then produces the graphical display object image including the first and second display features for each respective cell according to the new cell size for the respective cell, and displays the complete spreadsheet image in the display area using the new cell size and including the graphical display object image in each cell.
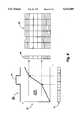
- FIG. 1illustrates an exemplary table image 10 produced by the method of the present invention showing a graphical display object in each of the cell regions;
- FIG. 2schematically illustrates the components and general organizational structure in memory of the data used by the method of the present invention
- FIG. 3schematically illustrates a variation of the nD data array shown in FIG. 2 for a more complex data organization
- FIG. 4is a flow chart illustrating the steps of producing a table image having a graphical representation of the underlying data in the cell regions according to the method of the present invention
- FIG. 5is a flow chart illustrating the steps of producing table image 10 of FIG. 1 according to the method of the present invention
- FIG. 6is a flow chart illustrating a variation of the method shown in FIG. 5 as applied in the context of a conventional spreadsheet application
- FIG. 7schematically illustrates an exemplary table image 80 produced by the method of the present invention showing differently-sized cell regions for focal and for context regions of the table image, produced according to another aspect of the method of the present invention
- FIG. 8illustrates the mapping of a degree of interest function from a natural cell region size to a focal region according to the method of the present invention
- FIG. 9graphically illustrates a three level degree of interest function
- FIGS. 10A, 10B and 10Cillustrate illustrates the affect on a single level degree of interest function from the manipulation of the focal region in the table image in three ways;
- FIG. 11is a flow chart illustrating the steps of producing a table image including a focal region according to the method of the present invention.
- FIG. 12is a flow chart illustrating the steps of producing a table image including a focal region and having a graphical representation of the underlying data in the cell regions according to the combined methods illustrated in FIGS. 4 and 11;
- FIG. 13is a graph illustrating the advance in the number of cell regions able to be represented in a single table image according to the methods illustrated in any of FIGS. 4, 5, or 6;
- FIG. 14is display screen showing a table image produced by the illustrated embodiment of the method of the present invention, according to the method illustrated in FIG. 12;
- FIG. 15is display screen showing a second table image produced by the illustrated embodiment of the method of the present invention, according to the method illustrated in FIG. 12;
- FIG. 16is a flow chart illustrating the steps of various user-controlled processing features of the user interface of the present invention.
- FIG. 17illustrates a dialogue box for changing cell presentation type parameters, as provided by the user interface of the illustrated embodiment of the method of the present invention
- FIG. 18illustrates a dialogue box for requesting the highlighting of certain source data values in the table image, as provided by the user interface of the illustrated embodiment of the method of the present invention
- FIG. 19is a simplified block diagram illustrating the system environment for operating any of the aspects of the method of the present invention.
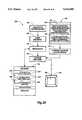
- FIG. 20is a simplified block diagram illustrating a system for operating, and software product for, any of the aspects of the method of the present invention.
- a degree of interest (DOI) functiondetermines the cell region sizes in table image 80.
- the present inventionrelates to method steps for operating a system including a processor, and to processing electrical or other physical signals to produce other desired physical signals.
- the detailed descriptions which followare presented largely in terms of display images and symbolic representations of operations of data within the memory of the system. These descriptions and representations, which are algorithmic in nature, are the techniques used by those skilled in the data processing arts to most effectively convey the substance of their work to others skilled in the art.
- An algorithmis here, and generally, conceived to be a self consistent sequence of acts leading to a desired result. These acts are those requiring physical manipulations of physical quantities such as electrical or magnetic signals that are capable of being stored, transferred, combined, compared, and otherwise manipulated.
- the manipulations performedare often referred to in terms, such as adding, comparing, or determining, which are commonly associated with mental operations performed by a human user.
- the capability of a human useris neither necessary nor desirable in the operations described herein which form part of the present invention.
- the system operationsare performed in response to operation request signals produced by a human user.
- the algorithmic descriptions presented herein of the acts of the present invention for operating a systemare not inherently related to any particular processor, machine, or other apparatus.
- Useful machines for performing the operations of the present inventioninclude general purpose digital computers or other similar devices configured as described below and in the claims.
- the present inventionalso relates to a system for performing these operations.
- This systemmay be specially constructed for the required purposes or it may comprise a general purpose computer selectively activated or reconfigured by a computer program stored in the computer.
- various general purpose machinesmay be used with programs in accordance with the teachings herein, or it may prove more convenient to construct more specialized apparatus to perform the required acts of the method. The required structure for a variety of these machines will appear from the description given below.
- datarefers herein to physical signals that indicate or include information.
- dataincludes data existing in any physical form, and includes data that are transitory or are being stored or transmitted.
- datacould exist as electromagnetic or other transmitted signals or as signals stored in electronic, magnetic, or other form.
- An “item of data” or a “data item”is a quantity of data that a processor can access or otherwise operate on as a unit. For example, an eight-bit byte is a data item in many data processing systems. Data can be combined into a "data structure". A “data structure” is any combination of interrelated data. A data structure may also include other data structures. An “array of data” or “data array” or “array” is a combination of data items that can be mapped into an array.
- a "processor-controlled machine”, “processor-controlled system” or “processor”is any machine, component or system that can process data, and may include one or more central processing units or other processing components. Any two components of a machine or system are “connected” when there is a combination of circuitry that can transfer data from one of the components to the other. The component from which the data is transferred "provides” the data, and the other component "receives” the data. For example, two processing units are “connected” by any combination of connections between them that permits transfer of data from one of the processing units to the other.
- a processor"accesses" an item of data in memory by any operation that retrieves or modifies the item, such as by reading or writing a location in memory that includes the item.
- a processorcan be "connected for accessing" an item of data by any combination of connections with local or remote memory or input/output devices that permits the processor to access the item.
- a processor"uses" data in performing an operation when the result of the operation depends on the value of the data.
- An “instruction”is an item of data that a processor can use to determine its own operation.
- a processor"executes" a set of instructions when it uses the instructions to determine its operations.
- Memoryis any component, combination of components, circuitry, or system that can store data, and may include local and remote memory and input/output devices.
- An example of memoryis a storage medium access device with a data storage medium that it can access.
- a “data storage medium” or “storage medium”is a physical medium that can store data. Examples of data storage media include magnetic media such as floppy disks and PCMCIA memory cards, optical media such as CD-ROMs, and semiconductor media such as semiconductor ROMs and RAMs. As used herein, “storage medium” covers one or more distinct units of a medium that together store a body of data. For example, a set of floppy disks storing a single body of data would be a storage medium.
- a “storage medium access device”is a device with circuitry that can access data on a data storage medium. Examples include floppy disk drives and CD-ROM readers.
- An item of data"indicates" a thing, an event, or a characteristic when the item has a value that depends on the existence or occurrence of the thing, event, or characteristic or on a measure of the thing, event, or characteristic.
- an item of datacan indicate one of a number of possible alternatives, the item of data has one of a number of "values".
- a first item of data"indicates" a second item of data when the second item of data can be obtained from the first item of data, when the second item of data can be accessible using the first item of data, when the second item of data can be obtained by decoding the first item of data, or when the first item of data can be an identifier of the second item of data.
- the source data itemindicates the data type data item.
- a relationship between the data in memoryis illustrated by an arrow from the first item of data to the second item of data, as shown, for example by arrow 818 in FIG. 2.
- An “image”is a pattern of light.
- An imagemay include characters, words, and text as well as other features such as graphics.
- An “image output device”is a device that can provide output defining an image.
- a “display” or “display device”is an image output device that provides information in a visible, human viewable form.
- a displaymay, for example, include a cathode ray tube; an array of light emitting, reflecting, or absorbing elements; a device or structure that presents marks on paper or another medium; or any other device or structure capable of defining an image in a visible form. To "present an image” on a display is to operate the display so that a viewer can perceive the image.
- a “display area”is the portion of the display in which an image is presented or the medium which receives an image.
- the display areamay include one or more "workspaces” wherein display features appear to have respective relative positions, and "presenting" a workspace in the display area that includes plural display features produces the human perceptions of the display features in respective positions relative to each other.
- a windowis an example of a workspace.
- Data“defines” an image when the data includes sufficient information to directly produce the image, such as by presenting the image on a display.
- Data defining an imagewill also be referred to herein as an "image definition” or “image definition data”.
- image definition dataFor example, a two-dimensional array is an image definition that can define all or any part of an image, with each item of data in the array providing a value indicating the color of a respective location of the image. Each such image location is typically called a "pixel”, and the two-dimensional array of data is typically called “image pixel data” or an "image pixel data structure”. While image pixel data is the most common type of image definition data, other image definitions, such as vector list data, are intended to be included within the meaning of data defining an image.
- display featurerefers to any human perception produced by a display in a processor-controlled machine or system.
- a "display object” or “object”is a display feature that is perceptible as a coherent unity.
- a “shape”is a display object that has a distinguishable and perceptible outline; for example, a circular display object is a shape. A shape having a bounded area may be called a "region”.
- An image“includes” a display feature or object if presentation of the image can produce perception of the feature or object.
- a display object“includes” a display feature if presentation of the display object can produce perception of the display feature. For example, display object 30 in FIG.
- 1is a rectangular display object having a black-filled interior of a certain height and width (or length) relative to the cell region 26 in which it is included.
- the rectangularity, the color of the interior space, the width, and the height of display object 30are all perceptible display features included in the display object.
- a display feature or display objectis not limited to a strictly pictorial representation.
- An imagemay include "character display features". When presented in image form in the display area of a display device, “characters” may be referred to as “character display features”.
- "Character” as used hereinmeans a discrete element that appears in a written or printed form of a particular language, and is a symbolic representation of information directly perceivable by a human who understands the particular language. Characters in the English language, for example, include alphabetic and numerical elements, punctuation marks, diacritical marks, mathematical and logical symbols, and other elements used in written or printed English. Character information is also often referred to generally as "text”.
- the "table image" produced by the method of the present inventionincludes a plurality of row identifier regions, a plurality of column identifier regions, and a plurality of cell regions.
- the cell regionsare arranged in the table image in row and column order such that the width of the cell region in any one column is the same as the width of the column's respective column identifier region; the height of the cell region in any one row is the same as the height of the row's respective row identifier region; the range of x locations of a cell region in the display area is the same as the range of x locations of the cell region's respective column identifier region; and the range of y locations of a cell region in the display area is the same as the range of y locations of the cell region's respective row identifier region in the display area.
- a common characteristic of processor-controlled systems operated by the method of the present inventionis a mapping between items of data within the system and display features included in images presented by the system.
- a display feature"represents" a body of data when the display feature can be mapped to one or more items of data in the body of data, or, stated in another way, a display feature "represents" the item or items of data to which it can be mapped.
- the character display features that are presented in the image as an entry in a cell regiontypically "directly represent", and can be mapped to, an item of data in a data structure such as a data array.
- the character display features in an image"directly represent" an item of data when each character display feature is a one-to-one mapping of an item of data, or a portion of an item of data, having a character data value to which it can be mapped; the character display features are a direct representation of the character data values.
- a conventional application programtypically produces a table image including character display features in the cell regions that directly represent the alphanumeric information included in the underlying data structure, as shown in FIG. 14.
- Cell regions 23shows character display features which are direct mappings from data items in the data array.
- a graphical display objectis an "indirect" representation of the information included in the underlying data structure.
- a graphical display objectwill include display features other than character display features when the underlying data from which the graphical display object is mapped is character information.
- Examples of graphical display objectsinclude, but are not limited to, circular, rectangular, and triangular shapes with or without interior fill color, lines of various thicknesses, combinations of shapes and lines, features perceivable as images of physical objects, and the like.
- a graphical display objectis more of a pictorial representation of information than the directly symbolic representation of information that is conveyed by characters.
- a graphical display objectthat includes character display features.
- a data itemis a composite object or a bit map or other complex data structure
- a single character display featuremay indirectly represent the complex data structure in the cell region of the table image.
- character display featuresare used as graphical elements in an essentially graphical image. Table 3 below and FIG. 3 provide examples of the use of character display features as indirect graphical representations of data items.
- mapping of one or more items of data to a display feature or objectis performed by an "operation" which is used herein to mean a set of instructions (instruction data items) accessible and executable by the processor in a system, defining the mapping relationship or function between one or more items of data (an input of the operation) and a display feature or object in an image (an output of the operation).
- An operation"produces" a display feature or object in an image when the operation begins without the data defining the display feature or object in the image and performing the operation results in the data defining the display feature or object in the image.
- the display feature or objectis "produced from" those input data items.
- a model-based operationuses “model data” as input and may produce image definition data defining an image as output.
- a data item other than image definition datafor example, a data item other than an image pixel data item, is an "information model data item” or "information data”.
- a combination of interrelated information data itemsis referred to herein as an "information model data structure", or a "information data structure”.
- a model-based operationmaps one or more information data items in an information data structure to a display feature included in the image produced by the operation.
- An information data structureis not limited to a combination of data items physically located in a substantially contiguous part of a system's memory, but may include individual model data items diversely located in memory and accessible by the processor when it performs the operation.
- a model-based operationis distinguishable from an image-based operation that maps one or more image definition data items, such as pixels, to a display feature included in the image produced by the operation.
- FIG. 1illustrates an example of a table image 10 produced by the method of the present invention.
- Table image 10is displayed in display area 180 of display device 170 (FIG. 20), and includes a number of column identifier regions 18, row identifier regions 22, an optional dimension identifier region 14, shown in dotted lines, and a number of cell regions 26.
- the wavy lines and breaks in the tableindicate that the size of table image 10 is not a fixed size, but is determined by several factors discussed in more detail below.
- Each of the row and column identifier regions 18 and 22may contain character label information respectively identifying the contents of the information in the row and columns.
- Dimension identifier region 14may contain character label information identifying a common characteristic or property about the information contained in the rows or in the columns, or the table generally.
- Each cell in the table imageis paired with a respective source data item stored in the memory of the system, and, in a conventional table image, the information in a respectively paired data item is presented in the respectively paired cell.
- Such informationtypically includes numeric data such as quantities and dates, text data, and various types of alphanumeric encoded data which, when decoded, indicates one of two or more categories of information.
- the data appearing in the group of cells in a single rowrepresents related elements of information governed by some relation or concerning a common subject (sometimes called the “invariant” or the “case") identified in the row identifier region
- the data appearing in the group of cells in a single columnare instances of the same type of information common to all subjects (sometimes called the "component” or the “variable") and identified in the column identifier region.
- the use of rows and columns in this mannermay of course be reversed depending on the organization of the underlying data.
- Each of the cell regions in table image 10 produced by the method of the present inventioncontains, in place of the character information typically presented in a conventional table image, a graphical display object, illustrated examples of which include, but are not limited to, black-filled bar 30, small rectangular black-filled object 32, color-filled bar 36, color-filled square 40, and black- or white-filled square 42.
- At least one of the display features of each graphical display object appearing in a cellrepresents a "cell presentation type" that has been determined by a data type associated with, or indicated by, the character, or nongraphical, data of the respectively paired source data item.
- all of the source data items in a single columnhave the same data type, and thus all of the graphical display objects in the column will be of the same presentation type.
- another display feature of each graphical display object appearing in a cellmay graphically represent the source data value of the respectively paired source data item, so that a single graphical display object will represent both the data type and data value of the underlying respectively paired source data item.
- variable display features, or parameters, of a graphical display object produced from a cell presentation typeinclude object length or width; object color variations, such as variations in hue, saturation, lightness or density; object position in the cell area; the area of the object; the slope of the object; and the angle of the object.
- the design of a cell presentation typeuses principles of graphic design to select the graphical features most suited for the particular data type and range of data values, and that take advantage of human cognitive skills for most effectively decoding graphical information.
- Table 3 belowprovides additional examples of cell presentation types for more complex data types and data values. Upon inspecting the examples in Table 3, it can be seen that many of the complex data structures contain combinations of quantity and category components.
- each graphical display object that is produced from a mapped cell presentation typehas at least two distinguishing display features: one display feature represents the data type of the source data item (discussed in more detail below), and another display feature represents the data value of the data item. In other implementations, each graphical display object produced from a selected presentation type has at least one distinguishing display feature representing the data type of the source data item.
- FIG. 2schematically illustrates the data structures used to produce table image 10 of FIG. 1 in the illustrated embodiment.
- the model datais organized in an n-dimensional ("nD") data array of at least two dimensions, shown by way of example in FIG. 2 as 2D data array 810.
- nDn-dimensional
- 2D data array 810the data organized in individual instances of one dimension, such as in row 812, represents related information about an instance of the invariant.
- Data appearing in individual instances of a second dimension, such as in column 814represents the same component type of information about each instance of invariant.
- Each individual data item in nD data array 810will be referred to herein as a "source data item".
- any model data having these characteristics and suitable for organizing in an n-dimensional (nD) data arraymay take advantage of the method of the present invention.
- any of a number of conventional array indexing programming techniquesmay be used by the system processor to access and obtain individual source data items in nD data array 810 for further processing, such as for display in a cell region 26 in table image 10.
- each source data itemis matched to a respective cell region 26 in table image 10 also using a conventional array indexing programming technique, and the source data item accessed and obtained via an indexing technique for a respective cell region 26 in table image 10 is referred to hereafter as a "respectively paired" source data item.
- Data array 810indicates, as shown via arrow 818, a data structure 820 of data type data items, each of which has a value that describes the data type of one or more source data items, such that each source data item indicates a respectively paired data type data item.
- the data typedescribes how to interpret the value of the data (called the "source data value") in the source data item.
- the source data values of the data in data array 810will typically directly include character information or include one or more signals (e.g., bits) that are able to be decoded into character information.
- data array 810may also include, as individual source data values, complex computer objects such as a simple or composite document object, a set, or a bit map.
- data array 810may define a collection of composite documents suitable for organizing in interrelated rows and columns, or a collection of bit maps representing pictures suitable for organizing in interrelated rows and columns.
- Data type informationwill vary according to the particular data in nD data array 810, and examples of data types are included in Table 2 above (e.g., "quantity” and "category”).
- Category datais typically implemented as an encoding scheme where a character, numeric, or bit value in the source data item indicates one of several possible data values a data item may take on. For example, in a nD array of baseball statistics about baseball players, a source data item may contain a value indicating one of nine field positions the player currently plays. This source data item would therefore have a data type equal to "category", with the nine possible values following a decoding scheme whereby each value indicates a field position.
- data type data structure 820will contain one data type per data component, or column, as illustrated by arrow 824 and the similar unmarked arrows in FIG. 2.
- table images produced from data in the nD data array organized so as to have one data type per column according to the method of the present inventionproduce very effective graphical overviews of the underlying data.
- the method of the present inventionmay also be useful for, and is therefore intended to encompass, the use of an input nD data array where each component (column) of data does not have a single data type and where each individual source data item indicates its own data type.
- cell presentation type data structure 830contains presentation type information for each defined presentation type sufficient to produce a graphical display object for display in a cell region 26 including the first and second display features determined respectively by the data type and source data value for a respectively paired source data item.
- pictorial elements of various graphical display objects representing presentation types and organized in a linear one-dimensional arrayare merely symbolic of cell presentation type data structure 830.
- cell presentation type data structure 830is actually a set of software routines, or pointers to software routines, entry to which is controlled by a one-to-one mapping of a data type to a presentation type routine, illustrated by arrow 850 in FIG. 2.
- arrow 850illustrated by arrow 850 in FIG. 2.
- data accessed by the systemmay also include row and column identifier data structure 840.
- This data structurecontains the optional heading or label information that appears in row identifier regions 22 and column identifier regions 18 of table image 10.
- label informationis routinely provided because of its critical nature in conveying valuable information about the invariant and component data in the table.
- the ability to control the display and suppression of visible label information, especially in the environment of large table imagesis a feature of the method of the present invention that further enhances the effective communication of the information in table image 10.
- Table 3presents examples of cell presentation types for source data items having more complex data structures, such as sets and composite data objects.
- FIG. 3schematically illustrates the mapping from data array 860 of source data items 816 and 817 which are sets of data items, and have a data type of "set".
- Set 816has n members, while set 817 has m members.
- Cell presentation type data structure 830contains the cell presentation type for a "set" data type.
- Cell regions 26 in table image 10show graphical display objects 44 and 46 as being character display features representing the number of members in each set.
- the entire complex source data item 816 of a set of member data itemsis indirectly and graphically represented in a cell region 26 of table image 10 as graphical display object 44.
- a relational data basemay supply the source data items from which table image 10 is constructed.
- Relational databasesprovide support for automatically maintaining multiple data relations and generating static snapshots of the data in table format.
- a relational data basehas one or more base tables associated with it consisting of a row of column identifiers (headings or labels) together with rows of data values.
- Data type informationis also generally available or may be easily derived.
- the method of the present inventionprovides a relational database application with tools for dynamically visualizing and manipulating the data presented.
- a spreadsheet data structuremay supply the source data items from which table image 10 is constructed.
- a spreadsheet data structureincludes row and column identifier information, data type information, and table image layout information as well as the source data values for the cell contents.
- Source data items in a typical spreadsheetmay include equations, and a cell presentation type for such cells may either graphically represent the source data value computed from the equation, or the equation itself.
- FIG. 4illustrates the general steps of method 200 of the present invention for producing table image 10 of FIG. 1.
- the overall table image layoutis determined and image definition data defining the table border or outline, the grid lines for the row and column identifier regions and for the cell regions, and the contents (labels) of the row and column identifier regions is produced.
- the source data items in nD data array 810are accessed, in box 280, and the data type and source data value of each source data item is obtained.
- the image definition data defining the graphical display objects to be presented in the included cell regionsare produced using the cell presentation type for the data type and data value of each respective source data item.
- the image definition data defining table image 10 and the graphical display objectsis then provided to the output circuitry of the system, in box 340 for presentation in display area 180 of the system's display device.
- FIG. 5is a flowchart illustrating an expanded set of steps, in method 202, for presenting table image 10 in such a manner that it presents a cell region and graphical representation for every source data item in nD data array 810 in a single image, in response to an input signal indicating an image display request to display table image 10.
- Method 200 of FIG. 4may be effectively used to display a portion of an entire table with indirect, graphical representations for the data in the included cell regions.
- an even more powerful use for the method of the present inventionis to take advantage of the display space compression offered by an indirect graphical representation of the source data items in nD data array 810 by computing the table layout of table image 10 so as to accommodate all of the cell regions necessary to display the complete table, as shown in box 250.
- Boxes 280, 310, 314 and 316then show the processing loop for accessing all source data items for every cell to be displayed and for producing the image definition data defining the graphical display object to be presented in the each cell region using the cell presentation type for the data type and data value of each respectively paired source data item. It will be clear to those of skill in the programming art that, when nD data array 810 is organized so that all of the source data items in each column 814 (FIG. 2) have the same data type, the efficiency and performance of the processing loop beginning with box 280 in FIG. 5 can be significantly improved by traversing nD data array 810 by row within column.
- FIG. 6illustrates still another aspect of the method of the present invention that is useful when integrating the present method into an existing spreadsheet or relational data base application or the like where conventional table images, showing directly represented data, are displayed.
- a conventional first table imageis displayed in box 220.
- a system useruses an input device to produce signals indicating an image display request to display table image 10.
- table image 10includes cell regions for indirectly representing every source data item in the underlying nD data array 810 of the application.
- image definition datais produced, in box 320, defining a second table image having graphical display objects in the cell regions as indirect representations of the respectively paired source data items in the underlying data structure such that all cell regions are displayable in one image.
- Method 204provides the system user of a conventional spreadsheet or relational data base program with the ability to compress an entire table that may require several table images to view by conventional scrolling or paging techniques into a single table image and to view the data in graphical form.
- the graphical viewprovides the ability to see patterns and trends in the data more easily and viewing the entire table in one image permits easier location of information of interest to the system user.
- Conventional table image processing applicationstypically provide roughly uniform amounts of display space for individual cells in the rows and columns.
- the amount of space for each cellis constrained by factors such as the space needed to adequately represent the data value of a respectively paired source data item and the total space available in the display area or workspace.
- the table layoutincluding the size of the cell regions, is often predefined and may not be easily varied by a system user. Roughly uniform cell regions provide few visual clues for quickly locating a particular cell region in the table image. In the case of a large table that occupies most of the display area, the area of each cell region may be necessarily computed to be small, and a system user may find the data representation in one or more cell regions of particular interest difficult to locate, access, read or understand.
- Still another aspect of the present inventionprovides for user control of the sizing of the cell regions of a table image to reflect the system user's level of interest in one or more cell regions.
- This aspect of the method of the present inventionwill be referred to herein as the "focus plus context" table image feature.
- Table image 80 in FIG. 7illustrates how the cell regions of a table image may be altered according to the focus plus context feature of the method of the present invention.
- the size of table image 80 prior to the operation of the focus plus context feature of the method of the present invention on table image 80will be referred to as its "natural" size, and is not necessarily shown in FIG. 7.
- the natural size of the table imagemay be predetermined by the application program or may be under the control of the system-user.
- the natural size of table image 80is relevant to the operation of the focus plus context feature of the method only to the extent that it provides a natural size for each cell region in which the respectively paired data from the underlying data array may be directly represented in a meaningful form.
- the "output" size of table image 80is a predetermined size used by the processing steps of the method to compute the proper allocation among the different types of cell regions.
- the output size of table image 80may be its natural size, the current window size, a system determined size, a user-determined size, or the size of the entire display area. In the illustrated embodiment, the output size of the table is governed by a current window size, shown as the size of display area 180.
- Area 84is the "focal region", having at least one cell region, called a “focal cell region” included therein; the size of each of the six focal cell regions in illustrated focal region 84 is computed using a number of factors, described in more detail below, including the natural size of each focal cell region and and the number of cell regions to be included in the focal region.
- Region 87is called a "context cell region” or “context region”; a context region is a cell region that is in a row and column that is not the same row or column of a cell region in the focal region.
- a context cell regionhas the smallest cell size of the four types of cell regions created by the focus plus context method.
- Region 85is a "row-focal region", having a cell width dimension along the x axis equal to the cell width of a context region located in the same column, and having a cell height dimension along the y axis equal to the cell height dimension of the focal cell region located in the same row.
- Region 86is a "column-focal region", having a cell height dimension along the y axis equal to the cell height of a context region located in the same row, and having a cell width dimension along the x axis equal to the cell width dimension of the focal cell region located in the same column.
- a degree of interest (DOI) functiondetermines the cell region sizes in table image 80.
- Cell regions selected to be in focal region 84are cell regions that have a higher "level of interest” than other cell regions. For example, a system user may select a focal region of cells because those cells have data represented therein that are of a higher level of interest to the system user than the other cell regions in the table image at a particular time.
- the level of interest in cell regionsis represented in each dimension by a "degree of interest" ("DOI") function that indicates the interest level of each cell region in that dimension.
- DOIdegree of interest
- the DOI functioncan be implemented in any manner suitable for taking as an argument a cell number in a given dimension and returning the interest level of that cell.
- a simple implementation of the DOI functionis an array that is as long as the number of cells in that dimension.
- each entryIn its initial state, each entry has an initial value of zero, indicating that each cell has the same interest level, and therefore the amount of space, in table image 80 in that dimension.
- the array representing the DOI function for each dimensionis changed to reflect the interest level for that cell. For example, the cells that are selected as part of the focal region are updated to have a value of one (1).
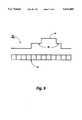
- FIG. 8schematically represents degree of interest function 90 for one dimension (the row dimension) of table image 92.
- DOI function 90is aligned with the x axis of graph 95.
- Table image 92has twelve rows, represented by region array 91, also aligned with DOI function 90 the x axis of graph 95.
- Pulse 93 of DOI function 90indicates the level of interest for a focal cell region in the row dimension of table image 92, and spans three rows.
- Graph 95represents a "transfer function" for allocating the proper size for each row focal cell region, and for determining the size of the remaining cell regions in the row. The results of the allocation can be seen in the single column 96, and table image 92 shows the results of the propagation of the allocated cell region sizes in column 96 across all columns.
- FIG. 9shows three-level DOI function 97 having interest levels 98 and 99 to be applied to the same 12-row table image represented by region array 91.
- the "level”corresponds to the number of different-sized "interest” cell regions that will be produced, plus one for the context, or non-focal, region.
- DOI function 90 in FIG. 8there are a total of two cell sizes in one dimension: focal and context.
- three-level DOI function 97there will be three cell sizes in the dimension to which the DOI function applies: the largest focal cells representing the highest level of interest, intermediate-sized focal cells for the second level of interest, and the smallest context or non-focal, cells for the third level of interest.
- DOI function 94is a square pulsed, single level DOI function similar to DOI function 90 in FIG. 8.
- a "zoom" focal region manipulation, represented by chart 500,changes the amount of space allocated to the focal region without changing the number of cell contained in the focal region, thus increasing the width and height of the focal region.
- a “slide” focal region manipulationrepresented by chart 504 in FIG. 10C, changes the position of the focal region within the table image while keeping the size, or amount of space allocated to, the focal region the same, thus giving the perception of "sliding" the focal region around the table image in the manner analogous to an optical magnifying lens.
- a coordinated adjust-zoom operatorhas also been implemented. It provides for increasing or decreasing the number of cells in the focal region without affecting their individual size, meaning that the total focal region expands or contracts sufficiently to fit a new number of focal cell regions each having the same size as before the operator was invoked.
- FIG. 11is a flowchart illustrating the general steps of the focus plus context method 520 of the present invention.
- the implementation illustrated in FIG. 11assumes that a first table image is displayed in the display area, and that an input signal interacts with the first table image for selecting at least one cell region to become the focal region.
- the focus plus context method of the present inventionmay operate independent of a prior-displayed table image.
- the identification of a single cell region that is to become the focal regionis sufficient input for operation of the method, and this may be accomplished without actual display of a first table image.
- the computations performed with respect to laying out the output table produced by the method of the present inventionmay be independent of a table layout for a currently displayed table, especially when a predetermined "natural" focal cell region size and output table size are assumed by the method.
- a signalis received from a signal source in box 522 indicating a request to display a second table image having a focal region selected by indicating at least one cell region of a first table image displayed in the display area.
- the DOI function data for each dimensionis updated, in box 526, to show the at least one selected cell region as having a first level of interest.
- the four cell region sizes for the new table layout of the second table imageare determined using the updated degree of interest function and natural cell size data for each dimension of the table, in box 530.
- the image definition data defining the new table layout including the selected focal regionis produced for the second table image.
- Box 538includes traversing the underlying nD data array and rendering the source data values in the focal cell regions of the second table image.
- the image definition data defining the second table imageis provided to the output circuitry of the system for display.
- non-focal cellsmay now be too small to adequately hold source data values rendered as character display features, and so they may be omitted on the assumption that the selection of the focal region indicated the only cells of interest. Or the character display features of the source data values may be revised in order to fit into the respective destination cell region size. Or as noted below in part B.2.d, focus plus context method 520 may be combined with any of the graphical representation methods 200, 202, or 204 in such a way as to render each source data value as a graphical representation in the non-focal cell regions.
- Table 4provides pseudo-code for the illustrated embodiment describing the component steps of box 530 for determining the cell sizes in one dimension according to the DOI function and the "natural" measurement of the cell in the given dimension. Essentially, the process described in table 4 allocates the cells proportionally across the dimension. First, how many cells at the focal level of interest is determined, and each of those cells is allocated its natural size. Then the total space required by the focal cell regions is subtracted from the total amount of space in the given dimension. The space remaining in the dimension is divided equally among the rest of the cells in that dimension.
- Table 5 belowprovides pseudo code for drawing the new table layout, as represented in box 534.
- Table 6provides pseudo code implementing a DOI function.
- focal regionscan be shown with a white background
- context areasmay have a medium to dark grey background
- the row- and column-focal regionsmay have a light to medium grey background.
- table image 10 of FIG. 1presenting graphical representations of the source data items in nD data array 810 may be further enhanced by integrating method 520 of FIG. 11 with any of methods 200, 202, and 204 of FIGS. 4, 5, and 6, respectively.
- the resulting methodshown in the flowchart of FIG. 12, provides a novel table image presentation technique having a wide variety of applications and contexts.
- the application of the method of the present invention combining the focus plus context technique with the use of graphical representations of datais particularly useful for large table images representing large nD data array structures, as is described in more detail in part B.3 below.
- the application of the combined methodmay also be useful for complex data structures, such as data structure 860 illustrated in FIG. 3, regardless of the size of the data structure, when the direct symbolic representation of the underlying data occupies more space than a single display area.
- the graphical representation of complex data structuresprovides a space-efficient utilization of the display area.
- the method of the present inventionis particularly suited for producing table images representing large bodies of data.
- table-processing applicationssuch as spreadsheet applications
- the data in a very large data arraycannot be completely represented in one image, and various techniques are provided to the system user to gain access to data in portions of the spreadsheet or table image that are not currently visible in the display area.
- Techniquessuch as scrolling through a table image to bring new cells into the display area or paging through multiple images require excessive amounts of time, and may result in the loss of column and row identifiers that provide navigational clues for efficiently locating a desired item of data.
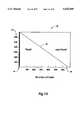
- a maximum of 660 cellscan be displayed on a 19-inch display.
- Graph 50 in FIG. 13shows the advance in the size of a table image as more cells become context cells and use an indirect graphical method for representing the underlying source data.
- the y axis 52shows the 660 cells computed for a typical 19-inch display.
- Grey strip 54shows the displayable regions of typical spreadsheet where all cells are focal, containing a direct representation of the underlying data.
- Line 56shows the progressive advancement in the number of displayable cells as more cells are converted from focal to non-focal. It can be seen from graph 50 that the method of the present invention can show about 68,400 cells in a single table image, or over two orders of magnitude more cells than in a conventional spreadsheet table image.
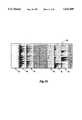
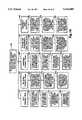
- FIGS. 14 and 15show table images 60 and 70, respectively, produced by the method of the present invention.
- Each tablecontains 323 rows by 23 columns, for a total of 7429 cells. This is 11 times, or an order of magnitude, more than the estimated maximum of 660 cells for a conventional table, as shown in graph 50 of FIG. 13.
- the data used and presented in table images 60 and 70are performance and classification baseball statistics for all major league baseball players from 1986 and 1987.
- FIG. 14shows table image 60 in display area 180 with several features of the user interface of the illustrated embodiment.
- Table Image 60shows several focal regions such as focal region 62.
- column identifier "Avg.” and row identifiers 23 showing player nameshave entries, while column identifiers and row identifiers are omitted in non-focal and semi-focal regions.
- Two cell regions 26 and 27are marked in FIG. 14 as examples of the direct symbolic representation of data in the cell region 27 of the focal region and the indirect, graphical representation of data in the cell region 26 of the context area.
- Table image 60also shows column 64 as a sorted column, sorted in descending order by "career average”.
- Table image 70 in FIG. 15illustrates some of the exploratory data analysis techniques that may be accomplished using the method of the present invention.
- the quantitative performance of the baseball playersis explored by sorting column 74 ("Hits") and then col. 72 ("Position”). This shows the distribution of hits within each field position.
- Hiitsthe quantitative performance of the baseball players
- Positionthe relationship between field position and hits is immediately apparent.
- other relationships in the data between field position and other componentsalso emerge, as can be seen by the aggregation of high numbers of "put outs” and “assists” in columns 78 and 79, respectively.
- the human perceptual and cognitive abilities of a system userpermit, or may even require, the aggregation of individual graphical display objects in individual cells into global patterns and shapes, typically but not necessarily by columns. If cell presentation types have been carefully designed and selected for the data types of the underlying data, the patterns and shapes will "emerge” from the display of the individual graphical display objects as the system user manipulates the arrangement of the rows or columns according to the facilities provided by the features of the user interface. This provides the system user with the ability to detect, understand, and appreciate information about the underlying data that in fact is likely not to be directly contained in the data.
- the graphical patterns that emerge from the aggregation of individual graphical display objectsin no way affect the basic definitions of display feature and display object as referring to any human perception produced by the display.
- the individual graphical display object in each cellmay not be directly perceptible by the system user because of the limits of human perceptual ability to perceive small details, but each display feature of each graphical object is physically represented by signals in the image, and thus the graphical display object and its associated display features are still "included" in the image.
- the illustrated embodiment of the method of the present inventionhas been implemented with a multi-functional user interface to enable the system user to manipulate components of table image 10 so as to reveal patterns in the data and to control the selection and location of focal regions within the table image.
- the combined user interface featuresenable the system user to perform exploratory data analysis in a highly interactive and natural manner.
- the user interface featuresalso permit fluidly adjustment of the single coherent view of the table between the symbolic, or direct, and graphical, or indirect, data representations, which is an especially important advantage with respect to large table applications.
- interactionis based on a small number of keyboard commands and a pointer gesture scheme.
- Two mouse buttonsare used respectively for touching functions and grasping functions.
- Pointer gesturesare performed using the touch button, and objects are dragged using the grasp button.
- Focal manipulationis supported using control points on the cells and pointer gestures.
- Table 7summarizes the major features of the user interface.
- the flowchart in FIG. 16presents the general processing steps for accomplishing five of the supported operations on table columns (or table rows if the rows contain the components, members, or variables of the data.) The processing steps shown in FIG. 16 will not be discussed in further detail here.
- Two additional focal manipulation techniquesare also provided.
- One, requested using keyboard commands,allows for hiding or removing all focal spans in each dimension.
- This coordinated adjust-zoom functionwas found to be a useful and very efficient operator thorugh actual use of the illustrated implementation of the present invention. It provides for increasing or decreasing the number of cells in the focal region without affecting their size, meaning that the total focal region expands or contracts sufficiently to fit a new number of focal cell regions each having the same size as before the operator was invoked.
- the function labeled "Change Column Display Parameter” in Table 7provides the system user with the ability to alter certain display features, or parameters, of the cell presentation type. For example, for quantity data types where the cell presentation type uses a black bar having a length representative of the source data value, the system user may choose how the bar is to be scaled to fit the available space in the cell region, including whether the left edge is set at zero or the minimum value of the source data values of the respectively paired source data items. For category data types, the user may, for example, control the number of colors used for the categories and how the colors are used to map from category values.
- the example popup dialogue box 460 in FIG. 17is produced in the illustrated embodiment for the baseball statistics table images 60 (FIG. 14) and 70 (FIG. 15) when the user initiates the change parameter function.
- spotlightin table 7 is used to identify a highlighting function permitting the system user to provide data value criteria or a computation specification that may be used to search the underlying data array for source data items having data values matching the data value criteria or computation specification.
- the matching source data itemsare then presented in respective cell regions using a new cell presentation type that is similar to but sufficiently different from the cell presentation type used for the remaining data of the same data type so as to provide a visual distinction between highlighted and nonhighlighted data in the table image.
- the system usermay search for quantity values that match some numerical specification provided, and, in response, the graphical representation of the source data values of the matching source data items will include a display feature that is changed from the graphical representation of the source data values of the non-matching source data items having the same data type.
- quantity data in a particular column of the table imageis displayed using a black bar
- quantity data matching quantities over one hundred (100)may be displayed with a red bar.
- special individual valuessuch as medians or quartiles in the data values may be "spotlighted" according to the system user's data value criteria or a computation specification.
- the example popup dialogue box 470 in FIG. 18is produced in the illustrated embodiment for the baseball statistics table images 60 (FIG. 14) and 70 (FIG. 15) when the user initiates the change parameter function.
- System 100includes input circuitry 152 for receiving input "request" signals from one or more signal sources 154 indicating image display requests.
- An image display requestmay include a request for an operation and information identifying the requested operation, wherein the signal or signals indicate one or more actions by a system user intended to cause performance of the operation.
- An operationis performed by the system "in response" to a request when the signals received are for indicating a valid request for a valid operation and for causing the operation to be performed.
- Signals indicating a single complete requestmay include a combination of any number of actions indicated by the user necessary for indicating a valid request for a valid operation and for causing the operation to be performed.
- Signals indicating user actionsmay also include signals indicating the selection or movement of a display object visible to the user in display area 180, signals indicating requests that result in operations being performed by processor 140, and signals that result in processor 140 providing data defining an image to output circuitry 160 for display in display area 180.
- Signal source 154may include any signal producing source that produces signals of the type needed by the method of the present invention. Such sources include a variety of input devices controllable by a human user that produce signals generated by the user, and may also include other devices connected to system 100 for providing such signals, including devices connected by wired or wireless communications facilities, such as through remote or local communications networks and infrared and radio connections. Signal source 154 may also include operations performed by system 100, such as the operating system of a digital computer, or other applications performed by the digital computer.
- Signal source 154connected to input circuitry 152, may include, for example, a keyboard or a pointing device, used by the system user to indicate actions. Suitable pointing devices include, but are not limited to, a mouse, a stylus or pen, and a trackball.
- the pointing devicehas circuitry (not shown) for controlling the interaction between the system user and display features and objects presented on display device 170. For example, the pointing device may have buttons (not shown) which when clicked or released result in signals being sent through input circuitry 152.
- signal source 154may be a pen-like or stylus device that can be moved over the display surface display area 180.
- a pressure sensitive tip switch(not shown) which results in signals being sent through input circuitry 152 when the user presses the tip switch against display area 180, such as, for example, when the system user uses the stylus to make gestures in display area 180.
- signal source 154may be a touch sensitive surface of display device 170, for example corresponding with display area 180, such that input circuitry 152 is included within display device 170.
- the method of the present inventionmay be implemented in a manner to receive signals indicating a display request from any of these signal sources.
- Processor 140is connected for receiving the signals from input circuitry 152.
- system 100also includes memory 110 for storing data.
- Processor 140is connected for accessing the data stored in memory 110, and for providing data for storing in memory 110.
- Memory 110stores instruction data indicating instructions the processor executes, including the instruction data indicating the instructions for operating system 100 according to the method of the present invention.
- Processor 140is also connected for providing data defining table image 10 to output circuitry 160 for presentation on display device 170 in display area 180.
- any two such componentsare "connected" when there is a combination of circuitry that can transfer data from one of the components to the other.
- Processor 140is further connected for providing data defining images, produced according to the method of the present invention, to output circuitry 160 for presentation on display 170 in display area 180.
- the display areacorresponds to the visible part of the display screen, and the method of the present invention provides for visibly displaying therein table image 10 having graphical display objects (e.g., as in FIG. 1) and table image 80 having a focal region plus context areas (e.g., as in FIGS. 7, 14, and 15).
- the method of the present inventioncould also provide for displaying the table images produced in a virtual screen or presentation space for a window, or to the area of a buffer for printing or facsimile transmission, or the like.
- memory 110may include memory that is physically connected to processor 140 as local memory, or that is remotely accessible to processor 140 by means of a wired or wireless communications facility.
- processor 140may access a particular data item
- that data itemmay be stored in a memory device that is remotely located from system 100 but which is accessible to processor 140 by means of the appropriate connections.
- system 100may vary considerably from a system that includes a very large display device 170 suitable, for example, for electronic whiteboard applications, to a system that includes much smaller desktop, laptop, and pocket-sized or smaller display devices, and the method of operating a system according to the present invention is intended to be operable on systems in each of these physical size ranges.
- One embodiment of the method of the present inventionhas been implemented in the Common Lisp programming language using the Common Lisp Interface Manager (a user interface programming interface), both of which are commercial software products available from Franz, Inc. of Berkeley, Calif., Lucid, Inc. of Menlo Park, Calif., and Apple Computer of Cupertino, Calif. The method has been demonstrated on a Sun Microsystems SparcStation computer running the Unix operating system and the XWindows environment. It will be apparent to those of skill in the art that a wide variety of programming languages and hardware configurations could readily be used in place of those used in the illustrated embodiment based on the description herein without departing from the scope of the invention.
- the system of the present inventionincludes a processor that is operated according to any of the methods previously described, and its components, characteristics, and configuration have been described above with respect to system 100 of FIG. 19.
- FIG. 20illustrates still another system configuration of the present invention.
- Components of system 102 in FIG. 20 that are functionally similar to system components in system 100have the same reference numerals, and will not be described further here.
- the system of the present inventionmay be a pen- (stylus-) based computing system, or a small, notebook- or palm-sized processor-controlled system having a small display area for which a keyboard component is not suitable or not included.
- System 102includes storage medium access device 115.
- Storage medium access device 115provides data from a data storage medium to processor 140.
- FIG. 20also shows software product 120, an article of manufacture that can be used in a system that includes components like those shown in FIG. 20.
- Software product 120includes data storage medium 122 that can be accessed by storage medium access device 115.
- Data storage medium 122could, for example, be a magnetic medium such as a set of one or more floppy disks or PCMCIA memory storage, an optical medium such as a set of one or more CD-ROMs, or any other appropriate medium for storing data.
- Data storage medium 122stores data that storage medium access device 115 can provide to processor 140.
- software product 120includes data stored on storage medium 122.
- the stored datainclude data indicating instructions 124 and 126, which can be executed to produce and display a table image similar in format to table images 60 (FIG. 14) and 70 (FIG. 15) in display area 180, as, for example, by the instructions represented in the boxes of FIG. 12.
- Each of the aspects of the method of the present inventionmay be applied in the domain of three dimensions (3D).
- a 3D cube of cell regionsmay be generated, whereby each pair of dimensions is capable of visualization and manipulation according to the techniques described above.
- 3D motion control techniquescan be used to navigate around the 3D table, or, alternatively, 3D object manipulation techniques can be used to move the 3D table, in order to view a different pair of dimensions.
- the method of the present inventionprovides a time- and space-efficient mechanism for visualizing and analyzing large bodies of data suitable for representation in a table format.
Landscapes
- Engineering & Computer Science (AREA)
- Theoretical Computer Science (AREA)
- Physics & Mathematics (AREA)
- General Engineering & Computer Science (AREA)
- General Physics & Mathematics (AREA)
- Health & Medical Sciences (AREA)
- Artificial Intelligence (AREA)
- Audiology, Speech & Language Pathology (AREA)
- Computational Linguistics (AREA)
- General Health & Medical Sciences (AREA)
- Human Computer Interaction (AREA)
- User Interface Of Digital Computer (AREA)
Abstract
Description
TABLE 2 __________________________________________________________________________FIG. 1 Columns 1-5: Cell Presentation Types Col. Data Type/Value Presentation Type __________________________________________________________________________1 Quantity Data; black-filled bar; bar length in cell determined by numeric quantity quantity data value;value 2 Category Data; black-filled rectangular object; size of object alphanumeric determined by number of categories; cell category value position of object determined by category data value; 3 Quantity and color-filled bar; bar length in cell determined by Category Data quantity data value; fill color determined by category value and number of categories; 4 Category Data color-filled square object (color swatch); fill color and cell position determined by category data value; object size determined by number of categories; 5 Category Data black- or white-filled square object; fill color (Boolean) determined by category data value __________________________________________________________________________
TABLE 3 __________________________________________________________________________Other Cell Presentation Type Examples Data Type/Value Cell Presentation Type Examples __________________________________________________________________________Date data (e.g., in form For practical year range (e.g., 10 year period), of mm/yy) color-filled square object (color swatch); fill color (Category data) determined by year (category) data value; cell position determined by month (category) data value; A set of data items, or 1. character display feature (numeral) represents objects; contains data type and number of items in set; cell individual set members position of character display feature determined each having a quantity by whether a certain set member exists in each value; number of items set (Boolean category value); in set isnumeric quantity 2. black- or white-filled square object; fill color that can be determined; determined by whether a certain set member exists in each set (Boolean category value); Composite Document Any one or more components of the composite data type; contains data document information may be graphically about author, title, date represented. For example: of publication, 1. color-filled bar; bar length in cell determined document type (e.g., by length of title (computed quantity data spreadsheet word value); fill color determined by author (category processing illustrator value); etc.) full text; multi- 2. black-filled bar; bar length in cell determined media components, etc. by length of document (computed quantity data value); OR numeric character display features, where number is computed length of document; 3. black-filled bar; bar length in cell determined by number of occurences of a keyword in document; 4. color-filled square object (color swatch); fill color and cell position determined by document type (category data value); object size in cell determined by total number of categories; __________________________________________________________________________
TABLE 4 ______________________________________ Pseudo Code For Laying Out A Dimension ______________________________________ doi-seqr: a DOI-seqr that describes the warping on a given axis. sizes(N): a vector of N cells, where N is the number of cells in the given dimension. The values contained are the "natural" measurement of the cell in the given dimension (i.e. width for horizontal and height for vertical) array(N): a vector of the position along the given axis that the cell should be positioned at. BODY: integrate the DOI function determine how to allocate area based on available space and user options assign a location to first cell for each cell in order examine the "natural" space requirement of the cell examine the level of interest in the cell determine how much space to give to the cell assign a location to the next cell at least this much space further on ______________________________________
TABLE 5 ______________________________________ Pseudo Code For Draw-Table Procedure ______________________________________ x-positions: a vector of length N + 1 widths: a vector of length N y-positions: a vector of length M + 1 heights: a vector of length M x-positions = layout-dimension(x-doi-seqr, widths(n)) y-positions = layout-dimension(y-doi-seqr, heights(m)) iterate x in x-positions draw-horizontal-line(x) iterate y in y-positions draw-vertical-line(y) iterate j from 1 to N iterate i from 1 to M draw.sub.-- cell(i,j,widths[i], widths[j] ______________________________________
TABLE 6 ______________________________________ Specific Implementation: 2-Level DOI ______________________________________ *The specific doi-seqr can keep track of location and size of each foci, and do straightforward integration, etc. DOI-Seqr: number.sub.-- of.sub.-- pixels.sub.-- available: number number.sub.-- of.sub.-- cells: number foci: list of (start,stop) Layout Procedure: determine the total space requirement of all focus cells subtract this from total space available divide this leftover by the number of context cells and truncate iterate through cells in order: give focus cell its requested space give context space the calculated amount for context cells ______________________________________
TABLE 7 __________________________________________________________________________Summary of User Interface Features in the Illustrated Embodiment Image Display Requests Function By User System Response __________________________________________________________________________Focal: Add Grasp a cell in the context; Displays New Focal region; re- system responds with displays Table Image permitting drag of control point; user drags control point for adjust-sooming new focal region; Focal touch any region in the Changes location of focal region change context area (slides current in Table Image; re-displays Table (slide) focus to new location;, touch Image any region in the context area (slides current focal region to new location) Zoom Grasp the control point at Recomputes cell size from a new Focal the upper-left corner cell of DOI function to zoom all Region the table image displayed cells; re-displays Table Image Adjust Grasp the control point on a Changes the number of cells Focal selected focal region viewed within selected focal Region region without changing focal region size; re-displays Table Image Column Hold down mouse button Resizes, hides, or makes visible Hide/Re- and drag mouse to left selected column and re-displays Size within a selected column Table Image reduce size or hide column; to right to enlarge or reveal hidden column Column User grasps column identifier Reorders Column to requested Reorder region and moves it to new new position and re-displays table position Table Image Column User initiates by entering cell Adds Column with specified con- Add contents specification data in tents in reqnested new position display area, and touching and re-displays Table Image requested column position Column User holds down mouse Sorts the selected column using Sort button and drag mouse requested sorting order and re- upwardly within a selected displays Table Image column for ascending order sort; downwardly for descending order sort Change User initiates by double Changes cell presentation type Column clicking on a column; for requested column using re- Display System presents Dialog Box quested parameter and re- Parameter showing parameter options; displays Table Image user selects parameters in box; see e.g, FIG. 17 Spotlight User initiates by double Searches data array for request- Data clicking on a column; ed data values; changes presen- System presents Dialog Box; tation type, and re-displays see e.g , FIG. 18 Table Image Spotlight Keyboard command to Performs focal routines for to Focal display spotlighted data in defining a new focal region and region focal region. re-displays Table Image. __________________________________________________________________________
Claims (26)
Priority Applications (4)
| Application Number | Priority Date | Filing Date | Title |
|---|---|---|---|
| US08/611,013US5632009A (en) | 1993-09-17 | 1996-03-05 | Method and system for producing a table image showing indirect data representations |
| US08/749,131US5880742A (en) | 1993-09-17 | 1996-11-14 | Spreadsheet image showing data items as indirect graphical representations |
| US08/749,474US5883635A (en) | 1993-09-17 | 1996-11-15 | Producing a single-image view of a multi-image table using graphical representations of the table data |
| US09/049,783US6085202A (en) | 1993-09-17 | 1998-03-27 | Method and system for producing a table image having focus and context regions |
Applications Claiming Priority (2)
| Application Number | Priority Date | Filing Date | Title |
|---|---|---|---|
| US12349693A | 1993-09-17 | 1993-09-17 | |
| US08/611,013US5632009A (en) | 1993-09-17 | 1996-03-05 | Method and system for producing a table image showing indirect data representations |
Related Parent Applications (1)
| Application Number | Title | Priority Date | Filing Date |
|---|---|---|---|
| US12349693AContinuation | 1993-09-17 | 1993-09-17 |
Related Child Applications (2)
| Application Number | Title | Priority Date | Filing Date |
|---|---|---|---|
| US08/749,131DivisionUS5880742A (en) | 1993-09-17 | 1996-11-14 | Spreadsheet image showing data items as indirect graphical representations |
| US08/749,474DivisionUS5883635A (en) | 1993-09-17 | 1996-11-15 | Producing a single-image view of a multi-image table using graphical representations of the table data |
Publications (1)
| Publication Number | Publication Date |
|---|---|
| US5632009Atrue US5632009A (en) | 1997-05-20 |
Family
ID=22409004
Family Applications (4)
| Application Number | Title | Priority Date | Filing Date |
|---|---|---|---|
| US08/611,013Expired - LifetimeUS5632009A (en) | 1993-09-17 | 1996-03-05 | Method and system for producing a table image showing indirect data representations |
| US08/749,131Expired - LifetimeUS5880742A (en) | 1993-09-17 | 1996-11-14 | Spreadsheet image showing data items as indirect graphical representations |
| US08/749,474Expired - LifetimeUS5883635A (en) | 1993-09-17 | 1996-11-15 | Producing a single-image view of a multi-image table using graphical representations of the table data |
| US09/049,783Expired - LifetimeUS6085202A (en) | 1993-09-17 | 1998-03-27 | Method and system for producing a table image having focus and context regions |
Family Applications After (3)
| Application Number | Title | Priority Date | Filing Date |
|---|---|---|---|
| US08/749,131Expired - LifetimeUS5880742A (en) | 1993-09-17 | 1996-11-14 | Spreadsheet image showing data items as indirect graphical representations |
| US08/749,474Expired - LifetimeUS5883635A (en) | 1993-09-17 | 1996-11-15 | Producing a single-image view of a multi-image table using graphical representations of the table data |
| US09/049,783Expired - LifetimeUS6085202A (en) | 1993-09-17 | 1998-03-27 | Method and system for producing a table image having focus and context regions |
Country Status (1)
| Country | Link |
|---|---|
| US (4) | US5632009A (en) |
Cited By (212)
| Publication number | Priority date | Publication date | Assignee | Title |
|---|---|---|---|---|
| US5694544A (en)* | 1994-07-01 | 1997-12-02 | Hitachi, Ltd. | Conference support system which associates a shared object with data relating to said shared object |
| US5745891A (en)* | 1995-09-28 | 1998-04-28 | Sharp Kabushiki Kaisha | Apparatus for rearranging the rows of information in a displayed table by highlighting a different column attribute |
| US5781900A (en)* | 1996-01-02 | 1998-07-14 | Sofmap Future Design, Inc. | Flexible hyperlink association system |
| US5848417A (en)* | 1996-01-02 | 1998-12-08 | Sofmap Future Design, Inc. | Flexible information input and operation selection system |
| US5880742A (en)* | 1993-09-17 | 1999-03-09 | Xerox-Corporation | Spreadsheet image showing data items as indirect graphical representations |
| US5926818A (en)* | 1997-06-30 | 1999-07-20 | International Business Machines Corporation | Relational database implementation of a multi-dimensional database |
| US5966139A (en)* | 1995-10-31 | 1999-10-12 | Lucent Technologies Inc. | Scalable data segmentation and visualization system |
| US5970493A (en)* | 1997-05-29 | 1999-10-19 | Oracle Corporation | Method, article of manufacture, and apparatus for generating a multi-dimensional record display |
| US6021215A (en)* | 1997-10-10 | 2000-02-01 | Lucent Technologies, Inc. | Dynamic data visualization |
| US6055550A (en)* | 1996-03-21 | 2000-04-25 | Oracle Corporation | Auto sizing of fields for displaying computer forms |
| US6108657A (en)* | 1997-05-29 | 2000-08-22 | Oracle Corporation | Method, article of manufacture, and apparatus for generating a multi-dimensional record layout mapping |
| US6191792B1 (en)* | 1997-02-10 | 2001-02-20 | Nippon Telegraph And Telephone Corporation | Scheme for automatic data conversion definition generation according to data feature in visual multidimensional data analysis tool |
| US6253264B1 (en)* | 1997-03-07 | 2001-06-26 | Intelligent Compression Technologies | Coding network grouping data of same data type into blocks using file data structure and selecting compression for individual block base on block data type |
| US6256649B1 (en)* | 1998-06-17 | 2001-07-03 | Xerox Corporation | Animated spreadsheet for dynamic display of constraint graphs |
| WO2001067300A1 (en)* | 2000-03-03 | 2001-09-13 | Robert Fish | Improved parameter-value databases |
| US6292809B1 (en)* | 1997-08-07 | 2001-09-18 | Adobe Systems Incorporated | Selecting cells in a table having individual cells and joined cells |
| US6327592B1 (en)* | 1997-07-04 | 2001-12-04 | Nec Corporation | Data calculator performing automatic recalculation based on data structure network |
| US20020073021A1 (en)* | 2000-05-01 | 2002-06-13 | Ginsberg Philip M. | Real-time interactive wagering on event outcomes |
| WO2001057744A3 (en)* | 2000-02-02 | 2002-07-18 | Roke Manor Research | Improvements in or relating to spreadsheets |
| US6429868B1 (en) | 2000-07-13 | 2002-08-06 | Charles V. Dehner, Jr. | Method and computer program for displaying quantitative data |
| US20020113823A1 (en)* | 2000-12-21 | 2002-08-22 | Card Stuart Kent | Navigation methods, systems, and computer program products for virtual three-dimensional books |
| US20020113802A1 (en)* | 2000-12-21 | 2002-08-22 | Card Stuart Kent | Methods, systems, and computer program products for the display and operation of virtual three-dimensional books |
| US20020118230A1 (en)* | 2000-12-21 | 2002-08-29 | Card Stuart Kent | Methods, systems, and computer program products for display of information relating to a virtual three-dimensional book |
| US6466211B1 (en) | 1999-10-22 | 2002-10-15 | Battelle Memorial Institute | Data visualization apparatuses, computer-readable mediums, computer data signals embodied in a transmission medium, data visualization methods, and digital computer data visualization methods |
| US20030038831A1 (en)* | 2001-08-22 | 2003-02-27 | Koninklijke Philips Electronics N.V. | Timeline display apparatus |
| US6581056B1 (en)* | 1996-06-27 | 2003-06-17 | Xerox Corporation | Information retrieval system providing secondary content analysis on collections of information objects |
| US20030128212A1 (en)* | 2002-01-09 | 2003-07-10 | Pitkow James E. | System for graphical display and interactive exploratory analysis of data and data relationships |
| US6604144B1 (en)* | 1997-06-30 | 2003-08-05 | Microsoft Corporation | Data format for multimedia object storage, retrieval and transfer |
| US20030156137A1 (en)* | 2002-02-21 | 2003-08-21 | Hartwig Von Essen | Method for selecting and representing objects in a plane and in N-dimensional space |
| US6628312B1 (en) | 1997-12-02 | 2003-09-30 | Inxight Software, Inc. | Interactive interface for visualizing and manipulating multi-dimensional data |
| US6654761B2 (en) | 1998-07-29 | 2003-11-25 | Inxight Software, Inc. | Controlling which part of data defining a node-link structure is in memory |
| US20040024532A1 (en)* | 2002-07-30 | 2004-02-05 | Robert Kincaid | Method of identifying trends, correlations, and similarities among diverse biological data sets and systems for facilitating identification |
| US20040027350A1 (en)* | 2002-08-08 | 2004-02-12 | Robert Kincaid | Methods and system for simultaneous visualization and manipulation of multiple data types |
| US20040061702A1 (en)* | 2002-08-08 | 2004-04-01 | Robert Kincaid | Methods and system for simultaneous visualization and manipulation of multiple data types |
| US20040078755A1 (en)* | 2002-10-21 | 2004-04-22 | Hitachi, Ltd. | System and method for processing forms |
| US6738079B1 (en)* | 2000-06-02 | 2004-05-18 | Sun Microsystems, Inc. | Graphical user interface layout customizer |
| EP1471438A1 (en)* | 2003-04-23 | 2004-10-27 | Hewlett-Packard Development Company, L.P. | Process for controlling the display of a two-dimensional table and graphic object for doing the same |
| US6826724B1 (en) | 1998-12-24 | 2004-11-30 | Ricoh Company, Ltd. | Document processor, document classification device, document processing method, document classification method, and computer-readable recording medium for recording programs for executing the methods on a computer |
| US20050010579A1 (en)* | 1997-05-29 | 2005-01-13 | Randall Shoup | Method, article of manufacture, and apparatus for generating a multi-dimensional record management index |
| US20050149254A1 (en)* | 2002-12-27 | 2005-07-07 | Fujitsu Limited | Action support method and apparatus |
| US6924822B2 (en) | 2000-12-21 | 2005-08-02 | Xerox Corporation | Magnification methods, systems, and computer program products for virtual three-dimensional books |
| US20050206644A1 (en)* | 2003-04-04 | 2005-09-22 | Robert Kincaid | Systems, tools and methods for focus and context viewving of large collections of graphs |
| US20050216459A1 (en)* | 2002-08-08 | 2005-09-29 | Aditya Vailaya | Methods and systems, for ontological integration of disparate biological data |
| US20050273408A1 (en)* | 2004-06-07 | 2005-12-08 | Bandman Jeffery M | System and method for managing financial market information |
| EP0965932A3 (en)* | 1998-06-17 | 2006-01-04 | Xerox Corporation | Speadsheet view enhancement system |
| US20060028471A1 (en)* | 2003-04-04 | 2006-02-09 | Robert Kincaid | Focus plus context viewing and manipulation of large collections of graphs |
| US20060074866A1 (en)* | 2004-09-27 | 2006-04-06 | Microsoft Corporation | One click conditional formatting method and system for software programs |
| US20060101324A1 (en)* | 2004-11-09 | 2006-05-11 | Oracle International Corporation, A California Corporation | Data viewer |
| US20060106907A1 (en)* | 2004-11-17 | 2006-05-18 | Sau-Ann Su | Method of analyzing correlations among four variables in two-dimension configuration and computer accessible medium |
| US7069518B2 (en) | 2000-12-21 | 2006-06-27 | Xerox Corporation | Indexing methods, systems, and computer program products for virtual three-dimensional books |
| EP1579013A4 (en)* | 2002-12-13 | 2007-02-28 | Gene Codes Forensics Inc | Method for profiling and identifying persons by using data samples |
| EP1758398A1 (en) | 2005-08-23 | 2007-02-28 | Syneola SA | Multilevel semiotic and fuzzy logic user and metadata interface means for interactive multimedia system having cognitive adaptive capability |
| US20070061369A1 (en)* | 2005-09-09 | 2007-03-15 | Microsoft Corporation | User interface for creating a spreadsheet data summary table |
| US20070112724A1 (en)* | 2005-10-10 | 2007-05-17 | Canon Kabushiki Kaisha | Method of applying a function to a data set |
| US20070118795A1 (en)* | 2005-11-23 | 2007-05-24 | Peter Noyes | A Method of Processing Annotations Using an Editable Multi-Dimensional Catalog |
| US20070136352A1 (en)* | 2005-12-09 | 2007-06-14 | Microsoft Corporation | Reporting row structure |
| US20070298871A1 (en)* | 2003-04-10 | 2007-12-27 | Asher Joseph M | Real-time interactive wagering on event outcomes |
| US20080005658A1 (en)* | 2003-12-01 | 2008-01-03 | International Business Machines Corporation | Table column spanning |
| US20080046808A1 (en)* | 2006-08-15 | 2008-02-21 | International Business Machines Corporation | Method and apparatus for visualizing multidimensional data sets using expandable grids with hierarchically-labeled axes |
| US7340677B2 (en) | 2002-03-26 | 2008-03-04 | Intel Corporation | Methods and apparatuses of presenting categorical programs in progressive levels of content details |
| US20080081684A1 (en)* | 2006-09-28 | 2008-04-03 | Lutnick Howard W | Products and processes for processing information related to weather and other events |
| US20080133213A1 (en)* | 2006-10-30 | 2008-06-05 | Noblis, Inc. | Method and system for personal information extraction and modeling with fully generalized extraction contexts |
| US20080180382A1 (en)* | 2007-01-31 | 2008-07-31 | Hao Ming C | Providing an automated visualization of a collection of data values divided into a number of bins depending upon a change feature of the data values |
| US20090049372A1 (en)* | 2004-11-09 | 2009-02-19 | Oracle International Corporation | Methods and systems for implementing a dynamic hierarchical data viewer |
| US20090164945A1 (en)* | 2007-12-21 | 2009-06-25 | Yan Li | Information processing device and integrated information system |
| US20090160861A1 (en)* | 2005-10-18 | 2009-06-25 | Kimiyasu Nakano | Spreadsheet In-Cell Range Graph Display Method |
| US20090217181A1 (en)* | 2008-02-22 | 2009-08-27 | Microsoft Corporation | Spectrum bar control |
| US20090254201A1 (en)* | 2008-04-08 | 2009-10-08 | Karlheinz Glaser-Seidnitzer | Method and user interface for implementation of a medical examination |
| US20090319882A1 (en)* | 2008-06-20 | 2009-12-24 | Microsoft Corporation | DataGrid User Interface Control With Row Details |
| US20100169299A1 (en)* | 2006-05-17 | 2010-07-01 | Mitretek Systems, Inc. | Method and system for information extraction and modeling |
| US20100251090A1 (en)* | 2006-02-27 | 2010-09-30 | Microsoft Corporation | Dynamic Thresholds for Conditional Formats |
| US7890396B2 (en) | 2005-06-07 | 2011-02-15 | Cfph, Llc | Enhanced system and method for managing financial market information |
| US7924283B1 (en) | 2006-09-19 | 2011-04-12 | Hewlett-Packard Development Company, L.P. | Time relevance-based visualization of data |
| US20110289397A1 (en)* | 2010-05-19 | 2011-11-24 | Mauricio Eastmond | Displaying Table Data in a Limited Display Area |
| US20120023445A1 (en)* | 2010-07-26 | 2012-01-26 | Baeuerle Stefan A | Managing extension projects with repository based tagging |
| US8126826B2 (en) | 2007-09-21 | 2012-02-28 | Noblis, Inc. | Method and system for active learning screening process with dynamic information modeling |
| US20130036346A1 (en)* | 2011-08-02 | 2013-02-07 | Cicerone Derek Michael | System and Method for Accessing Rich Objects Via Spreadsheets |
| US20130159832A1 (en)* | 2011-12-12 | 2013-06-20 | Black Point Technologies Llc | Systems and methods for trading using an embedded spreadsheet engine and user interface |
| US8549436B1 (en)* | 2007-06-04 | 2013-10-01 | RedZ, Inc. | Visual web search interface |
| US20140229512A1 (en)* | 2013-02-13 | 2014-08-14 | Luan O'Carrol | Discounted future value operations on a massively parallel processing system and methods thereof |
| US20140244668A1 (en)* | 2013-02-28 | 2014-08-28 | Ricoh Co., Ltd. | Sorting and Filtering a Table with Image Data and Symbolic Data in a Single Cell |
| US20140279698A1 (en)* | 2013-03-15 | 2014-09-18 | Trade Ideas, LLC | Systems and methods for multivariate sorting of financial data |
| US8868486B2 (en) | 2013-03-15 | 2014-10-21 | Palantir Technologies Inc. | Time-sensitive cube |
| US20140325329A1 (en)* | 2013-04-24 | 2014-10-30 | Hewlett-Packard Development Company, L.P. | Visual Analytics of Multivariate Data Using a Cell Based Calendar Matrix having a Visual Folding Mechanism |
| US8917274B2 (en) | 2013-03-15 | 2014-12-23 | Palantir Technologies Inc. | Event matrix based on integrated data |
| US8924872B1 (en) | 2013-10-18 | 2014-12-30 | Palantir Technologies Inc. | Overview user interface of emergency call data of a law enforcement agency |
| US20150026554A1 (en)* | 2010-01-06 | 2015-01-22 | Apple Inc. | Device, method, and graphical user interface for manipulating tables using multicontact gestures |
| US9009827B1 (en) | 2014-02-20 | 2015-04-14 | Palantir Technologies Inc. | Security sharing system |
| US20150109305A1 (en)* | 2013-10-22 | 2015-04-23 | Honywell International Inc. | Chart layout which highlights event occurrence patterns |
| US9021260B1 (en) | 2014-07-03 | 2015-04-28 | Palantir Technologies Inc. | Malware data item analysis |
| US9021384B1 (en) | 2013-11-04 | 2015-04-28 | Palantir Technologies Inc. | Interactive vehicle information map |
| US9043894B1 (en) | 2014-11-06 | 2015-05-26 | Palantir Technologies Inc. | Malicious software detection in a computing system |
| US9116975B2 (en) | 2013-10-18 | 2015-08-25 | Palantir Technologies Inc. | Systems and user interfaces for dynamic and interactive simultaneous querying of multiple data stores |
| US9123086B1 (en) | 2013-01-31 | 2015-09-01 | Palantir Technologies, Inc. | Automatically generating event objects from images |
| US9202249B1 (en) | 2014-07-03 | 2015-12-01 | Palantir Technologies Inc. | Data item clustering and analysis |
| US9223773B2 (en) | 2013-08-08 | 2015-12-29 | Palatir Technologies Inc. | Template system for custom document generation |
| US9223772B2 (en) | 2005-09-09 | 2015-12-29 | Microsoft Technology Licensing, Llc | Filtering user interface for a data summary table |
| US9256664B2 (en) | 2014-07-03 | 2016-02-09 | Palantir Technologies Inc. | System and method for news events detection and visualization |
| US9335897B2 (en) | 2013-08-08 | 2016-05-10 | Palantir Technologies Inc. | Long click display of a context menu |
| US9335911B1 (en) | 2014-12-29 | 2016-05-10 | Palantir Technologies Inc. | Interactive user interface for dynamic data analysis exploration and query processing |
| US20160154575A1 (en)* | 2014-12-02 | 2016-06-02 | Yingyu Xie | Gesture-Based Visualization of Data Grid on Mobile Device |
| USD758393S1 (en)* | 2012-01-06 | 2016-06-07 | Samsung Electronics Co., Ltd. | Display screen or portion thereof with graphical user interface |
| US9367872B1 (en) | 2014-12-22 | 2016-06-14 | Palantir Technologies Inc. | Systems and user interfaces for dynamic and interactive investigation of bad actor behavior based on automatic clustering of related data in various data structures |
| US9383911B2 (en) | 2008-09-15 | 2016-07-05 | Palantir Technologies, Inc. | Modal-less interface enhancements |
| US9392008B1 (en) | 2015-07-23 | 2016-07-12 | Palantir Technologies Inc. | Systems and methods for identifying information related to payment card breaches |
| US9424235B2 (en) | 2005-10-27 | 2016-08-23 | Microsoft Technology Licensing, Llc | Variable formatting of values |
| US9449035B2 (en) | 2014-05-02 | 2016-09-20 | Palantir Technologies Inc. | Systems and methods for active column filtering |
| US9454785B1 (en) | 2015-07-30 | 2016-09-27 | Palantir Technologies Inc. | Systems and user interfaces for holistic, data-driven investigation of bad actor behavior based on clustering and scoring of related data |
| US9454281B2 (en) | 2014-09-03 | 2016-09-27 | Palantir Technologies Inc. | System for providing dynamic linked panels in user interface |
| US9483162B2 (en) | 2014-02-20 | 2016-11-01 | Palantir Technologies Inc. | Relationship visualizations |
| US9501851B2 (en) | 2014-10-03 | 2016-11-22 | Palantir Technologies Inc. | Time-series analysis system |
| US9576015B1 (en) | 2015-09-09 | 2017-02-21 | Palantir Technologies, Inc. | Domain-specific language for dataset transformations |
| US9619557B2 (en) | 2014-06-30 | 2017-04-11 | Palantir Technologies, Inc. | Systems and methods for key phrase characterization of documents |
| US9646396B2 (en) | 2013-03-15 | 2017-05-09 | Palantir Technologies Inc. | Generating object time series and data objects |
| US9652117B2 (en) | 2009-02-18 | 2017-05-16 | International Business Machines Corporation | Displaying a representation of data in conditions of limited visual space |
| US20170143222A1 (en)* | 2015-11-23 | 2017-05-25 | Medicomp, Inc. | System and method for providing a gradient atrial fibrillation graph |
| US9727560B2 (en) | 2015-02-25 | 2017-08-08 | Palantir Technologies Inc. | Systems and methods for organizing and identifying documents via hierarchies and dimensions of tags |
| US9727622B2 (en) | 2013-12-16 | 2017-08-08 | Palantir Technologies, Inc. | Methods and systems for analyzing entity performance |
| US9767172B2 (en) | 2014-10-03 | 2017-09-19 | Palantir Technologies Inc. | Data aggregation and analysis system |
| US9785773B2 (en) | 2014-07-03 | 2017-10-10 | Palantir Technologies Inc. | Malware data item analysis |
| US9785317B2 (en) | 2013-09-24 | 2017-10-10 | Palantir Technologies Inc. | Presentation and analysis of user interaction data |
| US9785328B2 (en) | 2014-10-06 | 2017-10-10 | Palantir Technologies Inc. | Presentation of multivariate data on a graphical user interface of a computing system |
| US9817563B1 (en) | 2014-12-29 | 2017-11-14 | Palantir Technologies Inc. | System and method of generating data points from one or more data stores of data items for chart creation and manipulation |
| US9823818B1 (en) | 2015-12-29 | 2017-11-21 | Palantir Technologies Inc. | Systems and interactive user interfaces for automatic generation of temporal representation of data objects |
| US9857958B2 (en) | 2014-04-28 | 2018-01-02 | Palantir Technologies Inc. | Systems and user interfaces for dynamic and interactive access of, investigation of, and analysis of data objects stored in one or more databases |
| US9864493B2 (en) | 2013-10-07 | 2018-01-09 | Palantir Technologies Inc. | Cohort-based presentation of user interaction data |
| US9870205B1 (en) | 2014-12-29 | 2018-01-16 | Palantir Technologies Inc. | Storing logical units of program code generated using a dynamic programming notebook user interface |
| US9881066B1 (en) | 2016-08-31 | 2018-01-30 | Palantir Technologies, Inc. | Systems, methods, user interfaces and algorithms for performing database analysis and search of information involving structured and/or semi-structured data |
| US9880987B2 (en) | 2011-08-25 | 2018-01-30 | Palantir Technologies, Inc. | System and method for parameterizing documents for automatic workflow generation |
| US9886467B2 (en) | 2015-03-19 | 2018-02-06 | Plantir Technologies Inc. | System and method for comparing and visualizing data entities and data entity series |
| US9891808B2 (en) | 2015-03-16 | 2018-02-13 | Palantir Technologies Inc. | Interactive user interfaces for location-based data analysis |
| US9898528B2 (en) | 2014-12-22 | 2018-02-20 | Palantir Technologies Inc. | Concept indexing among database of documents using machine learning techniques |
| US9898335B1 (en) | 2012-10-22 | 2018-02-20 | Palantir Technologies Inc. | System and method for batch evaluation programs |
| US9946738B2 (en) | 2014-11-05 | 2018-04-17 | Palantir Technologies, Inc. | Universal data pipeline |
| US9953445B2 (en) | 2013-05-07 | 2018-04-24 | Palantir Technologies Inc. | Interactive data object map |
| US9965937B2 (en) | 2013-03-15 | 2018-05-08 | Palantir Technologies Inc. | External malware data item clustering and analysis |
| US9984133B2 (en) | 2014-10-16 | 2018-05-29 | Palantir Technologies Inc. | Schematic and database linking system |
| US9996229B2 (en) | 2013-10-03 | 2018-06-12 | Palantir Technologies Inc. | Systems and methods for analyzing performance of an entity |
| US9996595B2 (en) | 2015-08-03 | 2018-06-12 | Palantir Technologies, Inc. | Providing full data provenance visualization for versioned datasets |
| US10007674B2 (en) | 2016-06-13 | 2018-06-26 | Palantir Technologies Inc. | Data revision control in large-scale data analytic systems |
| US10037314B2 (en) | 2013-03-14 | 2018-07-31 | Palantir Technologies, Inc. | Mobile reports |
| US10037383B2 (en) | 2013-11-11 | 2018-07-31 | Palantir Technologies, Inc. | Simple web search |
| US10102369B2 (en) | 2015-08-19 | 2018-10-16 | Palantir Technologies Inc. | Checkout system executable code monitoring, and user account compromise determination system |
| US20190000335A1 (en)* | 2015-11-23 | 2019-01-03 | Medicomp, Inc | Heart monitor with diagnostic display and associated methods |
| US10180929B1 (en) | 2014-06-30 | 2019-01-15 | Palantir Technologies, Inc. | Systems and methods for identifying key phrase clusters within documents |
| US10180977B2 (en) | 2014-03-18 | 2019-01-15 | Palantir Technologies Inc. | Determining and extracting changed data from a data source |
| US10192333B1 (en) | 2015-10-21 | 2019-01-29 | Palantir Technologies Inc. | Generating graphical representations of event participation flow |
| US10198515B1 (en) | 2013-12-10 | 2019-02-05 | Palantir Technologies Inc. | System and method for aggregating data from a plurality of data sources |
| US10216801B2 (en) | 2013-03-15 | 2019-02-26 | Palantir Technologies Inc. | Generating data clusters |
| US10230746B2 (en) | 2014-01-03 | 2019-03-12 | Palantir Technologies Inc. | System and method for evaluating network threats and usage |
| US10229284B2 (en) | 2007-02-21 | 2019-03-12 | Palantir Technologies Inc. | Providing unique views of data based on changes or rules |
| US10268735B1 (en) | 2015-12-29 | 2019-04-23 | Palantir Technologies Inc. | Graph based resolution of matching items in data sources |
| US10290147B2 (en) | 2015-08-11 | 2019-05-14 | Microsoft Technology Licensing, Llc | Using perspective to visualize data |
| US10296617B1 (en) | 2015-10-05 | 2019-05-21 | Palantir Technologies Inc. | Searches of highly structured data |
| US10318630B1 (en) | 2016-11-21 | 2019-06-11 | Palantir Technologies Inc. | Analysis of large bodies of textual data |
| US10324609B2 (en) | 2016-07-21 | 2019-06-18 | Palantir Technologies Inc. | System for providing dynamic linked panels in user interface |
| US10331797B2 (en) | 2011-09-02 | 2019-06-25 | Palantir Technologies Inc. | Transaction protocol for reading database values |
| US10356032B2 (en) | 2013-12-26 | 2019-07-16 | Palantir Technologies Inc. | System and method for detecting confidential information emails |
| US10372879B2 (en) | 2014-12-31 | 2019-08-06 | Palantir Technologies Inc. | Medical claims lead summary report generation |
| US10403011B1 (en) | 2017-07-18 | 2019-09-03 | Palantir Technologies Inc. | Passing system with an interactive user interface |
| US10423582B2 (en) | 2011-06-23 | 2019-09-24 | Palantir Technologies, Inc. | System and method for investigating large amounts of data |
| US10437840B1 (en) | 2016-08-19 | 2019-10-08 | Palantir Technologies Inc. | Focused probabilistic entity resolution from multiple data sources |
| US10437612B1 (en) | 2015-12-30 | 2019-10-08 | Palantir Technologies Inc. | Composite graphical interface with shareable data-objects |
| US10444941B2 (en) | 2015-08-17 | 2019-10-15 | Palantir Technologies Inc. | Interactive geospatial map |
| US10452678B2 (en) | 2013-03-15 | 2019-10-22 | Palantir Technologies Inc. | Filter chains for exploring large data sets |
| US10460602B1 (en) | 2016-12-28 | 2019-10-29 | Palantir Technologies Inc. | Interactive vehicle information mapping system |
| US10475219B1 (en) | 2017-03-30 | 2019-11-12 | Palantir Technologies Inc. | Multidimensional arc chart for visual comparison |
| US10484407B2 (en) | 2015-08-06 | 2019-11-19 | Palantir Technologies Inc. | Systems, methods, user interfaces, and computer-readable media for investigating potential malicious communications |
| US10489391B1 (en) | 2015-08-17 | 2019-11-26 | Palantir Technologies Inc. | Systems and methods for grouping and enriching data items accessed from one or more databases for presentation in a user interface |
| US10552994B2 (en) | 2014-12-22 | 2020-02-04 | Palantir Technologies Inc. | Systems and interactive user interfaces for dynamic retrieval, analysis, and triage of data items |
| US10552436B2 (en) | 2016-12-28 | 2020-02-04 | Palantir Technologies Inc. | Systems and methods for retrieving and processing data for display |
| US10572487B1 (en) | 2015-10-30 | 2020-02-25 | Palantir Technologies Inc. | Periodic database search manager for multiple data sources |
| US10572496B1 (en) | 2014-07-03 | 2020-02-25 | Palantir Technologies Inc. | Distributed workflow system and database with access controls for city resiliency |
| US20200081968A1 (en)* | 2018-09-11 | 2020-03-12 | Apple Inc. | Exploded-range references |
| US10613722B1 (en) | 2015-10-27 | 2020-04-07 | Palantir Technologies Inc. | Distorting a graph on a computer display to improve the computer's ability to display the graph to, and interact with, a user |
| US10650558B2 (en) | 2016-04-04 | 2020-05-12 | Palantir Technologies Inc. | Techniques for displaying stack graphs |
| US10678860B1 (en) | 2015-12-17 | 2020-06-09 | Palantir Technologies, Inc. | Automatic generation of composite datasets based on hierarchical fields |
| US10685463B1 (en)* | 2019-02-26 | 2020-06-16 | Baker Hughes Oilfield Operations Llc | Systematic scenario visualization |
| US10698938B2 (en) | 2016-03-18 | 2020-06-30 | Palantir Technologies Inc. | Systems and methods for organizing and identifying documents via hierarchies and dimensions of tags |
| US10706434B1 (en) | 2015-09-01 | 2020-07-07 | Palantir Technologies Inc. | Methods and systems for determining location information |
| US10719188B2 (en) | 2016-07-21 | 2020-07-21 | Palantir Technologies Inc. | Cached database and synchronization system for providing dynamic linked panels in user interface |
| US10754822B1 (en) | 2018-04-18 | 2020-08-25 | Palantir Technologies Inc. | Systems and methods for ontology migration |
| US10795723B2 (en) | 2014-03-04 | 2020-10-06 | Palantir Technologies Inc. | Mobile tasks |
| US10817513B2 (en) | 2013-03-14 | 2020-10-27 | Palantir Technologies Inc. | Fair scheduling for mixed-query loads |
| US10853378B1 (en) | 2015-08-25 | 2020-12-01 | Palantir Technologies Inc. | Electronic note management via a connected entity graph |
| US10885021B1 (en) | 2018-05-02 | 2021-01-05 | Palantir Technologies Inc. | Interactive interpreter and graphical user interface |
| US10929476B2 (en) | 2017-12-14 | 2021-02-23 | Palantir Technologies Inc. | Systems and methods for visualizing and analyzing multi-dimensional data |
| US10956651B1 (en)* | 2019-09-19 | 2021-03-23 | International Business Machines Corporation | Data table display adjustment |
| US10956406B2 (en) | 2017-06-12 | 2021-03-23 | Palantir Technologies Inc. | Propagated deletion of database records and derived data |
| WO2021144656A1 (en)* | 2020-01-15 | 2021-07-22 | Monday.Com | Digital processing systems and methods for graphical dynamic table gauges in collaborative work systems |
| US11150917B2 (en) | 2015-08-26 | 2021-10-19 | Palantir Technologies Inc. | System for data aggregation and analysis of data from a plurality of data sources |
| US11301811B2 (en) | 2020-05-01 | 2022-04-12 | Monday.com Ltd. | Digital processing systems and methods for self-monitoring software recommending more efficient tool usage in collaborative work systems |
| US20220222361A1 (en)* | 2021-01-14 | 2022-07-14 | Monday.com Ltd. | Digital processing systems and methods for granular permission system for electronic documents in collaborative work systems |
| US11507738B2 (en) | 2019-11-18 | 2022-11-22 | Monday.Com | Digital processing systems and methods for automatic updates in collaborative work systems |
| US11599369B1 (en) | 2018-03-08 | 2023-03-07 | Palantir Technologies Inc. | Graphical user interface configuration system |
| US11698890B2 (en) | 2018-07-04 | 2023-07-11 | Monday.com Ltd. | System and method for generating a column-oriented data structure repository for columns of single data types |
| US11741071B1 (en) | 2022-12-28 | 2023-08-29 | Monday.com Ltd. | Digital processing systems and methods for navigating and viewing displayed content |
| US20230316400A1 (en)* | 2021-06-17 | 2023-10-05 | Futu Network Technology (shenzhen) Co., Ltd. | Data comparison method and apparatus, device and storage medium |
| US11829953B1 (en) | 2020-05-01 | 2023-11-28 | Monday.com Ltd. | Digital processing systems and methods for managing sprints using linked electronic boards |
| US11886683B1 (en) | 2022-12-30 | 2024-01-30 | Monday.com Ltd | Digital processing systems and methods for presenting board graphics |
| US11893381B1 (en) | 2023-02-21 | 2024-02-06 | Monday.com Ltd | Digital processing systems and methods for reducing file bundle sizes |
| US12020210B2 (en) | 2020-02-12 | 2024-06-25 | Monday.com Ltd. | Digital processing systems and methods for table information displayed in and accessible via calendar in collaborative work systems |
| US12056664B2 (en) | 2021-08-17 | 2024-08-06 | Monday.com Ltd. | Digital processing systems and methods for external events trigger automatic text-based document alterations in collaborative work systems |
| US12056255B1 (en) | 2023-11-28 | 2024-08-06 | Monday.com Ltd. | Digital processing systems and methods for facilitating the development and implementation of applications in conjunction with a serverless environment |
| US12105948B2 (en) | 2021-10-29 | 2024-10-01 | Monday.com Ltd. | Digital processing systems and methods for display navigation mini maps |
| US12169802B1 (en) | 2023-11-28 | 2024-12-17 | Monday.com Ltd. | Digital processing systems and methods for managing workflows |
| US12204845B2 (en) | 2016-07-21 | 2025-01-21 | Palantir Technologies Inc. | Cached database and synchronization system for providing dynamic linked panels in user interface |
| US12353678B2 (en) | 2019-10-17 | 2025-07-08 | Palantir Technologies Inc. | Object-centric data analysis system and associated graphical user interfaces |
| US12353419B2 (en) | 2018-07-23 | 2025-07-08 | Monday.com Ltd. | System and method for generating a tagged column-oriented data structure |
| US12367011B2 (en) | 2019-11-18 | 2025-07-22 | Monday.com Ltd. | Digital processing systems and methods for cell animations within tables of collaborative work systems |
| US12379835B2 (en) | 2023-06-13 | 2025-08-05 | Monday.com Ltd. | Digital processing systems and methods for enhanced data representation |
| US12443336B2 (en) | 2017-10-13 | 2025-10-14 | Palantir Technologies Inc. | Interactive user interface for dynamically updating data and data analysis and query processing |
Families Citing this family (139)
| Publication number | Priority date | Publication date | Assignee | Title |
|---|---|---|---|---|
| US5915257A (en)* | 1994-10-11 | 1999-06-22 | Brio Technology, Inc. | Cross tab analysis and reporting method |
| US6704744B1 (en)* | 1994-12-07 | 2004-03-09 | Next Computer, Inc. | Method and apparatus for mapping objects to multiple tables of a database |
| US5729665A (en)* | 1995-01-18 | 1998-03-17 | Varis Corporation | Method of utilizing variable data fields with a page description language |
| US6243172B1 (en)* | 1995-01-18 | 2001-06-05 | Varis Corporation | Method and system for merging variable text and images into bitmaps defined by a page description language |
| EP0811193B1 (en)* | 1995-02-22 | 1998-10-14 | Agust S. Egilsson | Graphical environment for managing and developing applications |
| US5874956A (en)* | 1995-11-13 | 1999-02-23 | Platinum Technology | Apparatus and method for three dimensional manipulation of point of view and object |
| US6397233B1 (en)* | 1995-11-22 | 2002-05-28 | Fujitsu Limited | Document processing apparatus and computer program product therefor |
| US6147670A (en) | 1997-03-13 | 2000-11-14 | Phone.Com, Inc. | Method of displaying elements having a width greater than a screen display width |
| US6006240A (en)* | 1997-03-31 | 1999-12-21 | Xerox Corporation | Cell identification in table analysis |
| US7302438B1 (en) | 1997-07-18 | 2007-11-27 | Tesseron Ltd. | Method and system for flowing data to an arbitrary path defined by a page description language |
| US6487568B1 (en)* | 1997-07-18 | 2002-11-26 | Tesseron, Ltd. | Method and system for flowing data to an arbitrary path defined by a page description language |
| JP3518266B2 (en)* | 1997-07-18 | 2004-04-12 | 富士ゼロックス株式会社 | Table editing device |
| JP4183311B2 (en) | 1997-12-22 | 2008-11-19 | 株式会社リコー | Document annotation method, annotation device, and recording medium |
| US7257589B1 (en)* | 1997-12-22 | 2007-08-14 | Ricoh Company, Ltd. | Techniques for targeting information to users |
| US20080028292A1 (en)* | 1997-12-22 | 2008-01-31 | Ricoh Company, Ltd. | Techniques to facilitate reading of a document |
| US6415305B1 (en)* | 1998-04-20 | 2002-07-02 | Microsoft Corporation | Method for displaying editable characters in a divided table cell |
| JP2000048087A (en)* | 1998-07-15 | 2000-02-18 | Internatl Business Mach Corp <Ibm> | View synthesizing system |
| US6266067B1 (en)* | 1998-07-28 | 2001-07-24 | International Business Machines Corporation | System and method for dynamically displaying data relationships between static charts |
| US6582475B2 (en)* | 1998-09-09 | 2003-06-24 | Ricoh Company Limited | Automatic adaptive document printing help system |
| US7007226B1 (en)* | 1998-09-15 | 2006-02-28 | Microsoft Corporation | High density visualizations for threaded information |
| US6370518B1 (en)* | 1998-10-05 | 2002-04-09 | Openwave Systems Inc. | Method and apparatus for displaying a record from a structured database with minimum keystrokes |
| US7315979B1 (en) | 1998-11-09 | 2008-01-01 | Tesseron Ltd. | Method and system for dynamic flowing data to an arbitrary path defined by a page description language |
| US6587102B2 (en)* | 1998-12-07 | 2003-07-01 | Adobe Systems Incorporated | Rendering panels in multiple display contexts |
| US6629097B1 (en) | 1999-04-28 | 2003-09-30 | Douglas K. Keith | Displaying implicit associations among items in loosely-structured data sets |
| US6590577B1 (en) | 1999-05-27 | 2003-07-08 | International Business Machines Corporation | System and method for controlling a dynamic display of data relationships between static charts |
| US6675351B1 (en)* | 1999-06-15 | 2004-01-06 | Sun Microsystems, Inc. | Table layout for a small footprint device |
| US7228492B1 (en)* | 1999-07-06 | 2007-06-05 | Ricoh Company, Ltd. | 2D graph displaying document locations of user-specified concept of interest |
| US6631380B1 (en) | 1999-07-29 | 2003-10-07 | International Business Machines Corporation | Counting and displaying occurrences of data records |
| CA2419624A1 (en) | 1999-08-01 | 2001-02-08 | Deep Video Imaging Limited | Interactive three dimensional display with layered screens |
| US7882426B1 (en)* | 1999-08-09 | 2011-02-01 | Cognex Corporation | Conditional cell execution in electronic spreadsheets |
| US7624339B1 (en)* | 1999-08-19 | 2009-11-24 | Puredepth Limited | Data display for multiple layered screens |
| EP1212745B1 (en)* | 1999-08-19 | 2006-02-08 | PureDepth Limited | Control of depth movement for visual display with layered screens |
| AU769103B2 (en) | 1999-08-19 | 2004-01-15 | Pure Depth Limited | Display method for multiple layered screens |
| KR100333676B1 (en)* | 1999-12-24 | 2002-04-24 | 오길록 | Method for generating multiple dataview screen control using single software program for data retrieval |
| JP2001188639A (en)* | 1999-12-28 | 2001-07-10 | Internatl Business Mach Corp <Ibm> | Method and device for displaying magnified and reduced areas |
| WO2001065404A1 (en)* | 2000-03-02 | 2001-09-07 | Mmc Webreporter Systems.Com, Inc. | System and method for creating a book of reports over a computer network |
| US6642945B1 (en)* | 2000-05-04 | 2003-11-04 | Microsoft Corporation | Method and system for optimizing a visual display for handheld computer systems |
| US7454695B1 (en)* | 2000-05-19 | 2008-11-18 | Renderx, Inc. | Methods for rendering tables |
| US9436667B2 (en) | 2000-05-19 | 2016-09-06 | Renderx, Inc. | Techniques for rendering media as layers |
| US7024621B1 (en) | 2000-05-19 | 2006-04-04 | Renderx | Methods and systems for rendering electronic data |
| US6971062B1 (en) | 2000-05-19 | 2005-11-29 | Renderx | Methods for rendering footnotes |
| US20020129342A1 (en)* | 2001-03-07 | 2002-09-12 | David Kil | Data mining apparatus and method with user interface based ground-truth tool and user algorithms |
| NZ511444A (en) | 2001-05-01 | 2004-01-30 | Deep Video Imaging Ltd | Information display |
| US7461077B1 (en) | 2001-07-31 | 2008-12-02 | Nicholas Greenwood | Representation of data records |
| US7107519B1 (en)* | 2001-08-16 | 2006-09-12 | Cognax Corporation | Spreadsheet-based user interface creation |
| US6944818B2 (en)* | 2001-09-10 | 2005-09-13 | Xerox Corporation | Method and apparatus for the viewing and exploration of the content of hierarchical information |
| US6976212B2 (en)* | 2001-09-10 | 2005-12-13 | Xerox Corporation | Method and apparatus for the construction and use of table-like visualizations of hierarchic material |
| NZ514119A (en)* | 2001-09-11 | 2004-06-25 | Deep Video Imaging Ltd | Improvement to instrumentation |
| US20040205523A1 (en)* | 2001-12-03 | 2004-10-14 | Methode Electronics, Inc. | Control chart with single display |
| NZ534945A (en)* | 2002-02-27 | 2006-06-30 | Compudigm Int Ltd | Data visualisation system and method |
| AU2003214726A1 (en)* | 2002-03-18 | 2003-09-29 | Compudigm International Limited | Credit data visualisation system and method |
| WO2003088063A1 (en)* | 2002-04-18 | 2003-10-23 | Adcheck (Pty) Ltd | A method of retrieving and viewing data from a database |
| US7120622B2 (en)* | 2002-06-10 | 2006-10-10 | Xerox Corporation | Authoring tools, including content-driven treetables, for fluid text |
| US7028036B2 (en)* | 2002-06-28 | 2006-04-11 | Microsoft Corporation | System and method for visualization of continuous attribute values |
| EP1380963A1 (en)* | 2002-07-10 | 2004-01-14 | Sap Ag | A method and computer based system for displaying of time variant tabular data |
| NZ521505A (en)* | 2002-09-20 | 2005-05-27 | Deep Video Imaging Ltd | Multi-view display |
| US7337398B1 (en)* | 2003-02-28 | 2008-02-26 | Adobe Systems Incorporated | Reconstitute tag-delimited tables in a graphics editing application |
| WO2004092977A2 (en)* | 2003-04-18 | 2004-10-28 | International Business Machines Corporation | System and method in a data table for creating recursive scalable template instances |
| NZ525956A (en)* | 2003-05-16 | 2005-10-28 | Deep Video Imaging Ltd | Display control system for use with multi-layer displays |
| US7259763B2 (en)* | 2003-11-13 | 2007-08-21 | International Business Machines Corporation | Embedded analytics in information visualization |
| ATE354144T1 (en)* | 2003-11-28 | 2007-03-15 | Koninkl Philips Electronics Nv | SYSTEM FOR DISPLAYING IMAGES WITH MULTIPLE ATTRIBUTES |
| US7385605B2 (en)* | 2003-12-04 | 2008-06-10 | International Business Machines Corporation | Computer display system for dynamically modifying stacked area line graphs to change the order or presence of a set of stacked areas in the graph respectively representative of the proportions contributed to a total by each of a set of time dependent variables |
| DE10361471A1 (en)* | 2003-12-23 | 2005-07-28 | Mainz, Nadine | Apparatus for color or image animation |
| US20050154974A1 (en)* | 2004-01-14 | 2005-07-14 | International Business Machines Corporation | Method, apparatus and program storage device for inline controlling of row and column sets in tabular displays |
| US8269774B2 (en) | 2004-03-31 | 2012-09-18 | Trading Technologies International, Inc. | Graphical display with integrated recent period zoom and historical period context data |
| US7218325B1 (en)* | 2004-03-31 | 2007-05-15 | Trading Technologies International, Inc. | Graphical display with integrated recent period zoom and historical period context data |
| US7665063B1 (en)* | 2004-05-26 | 2010-02-16 | Pegasystems, Inc. | Integration of declarative rule-based processing with procedural programming |
| US7299406B2 (en)* | 2004-06-02 | 2007-11-20 | Research In Motion Limited | Representing spreadsheet document content |
| DE602004014741D1 (en)* | 2004-06-02 | 2008-08-14 | Research In Motion Ltd | Presentation of spreadsheet documents |
| US8065629B1 (en)* | 2004-06-22 | 2011-11-22 | Apple Inc. | Displaying icon layouts in different resolutions |
| JP4484619B2 (en)* | 2004-07-30 | 2010-06-16 | 株式会社Access | Method, terminal device and program for image output by automatic recognition of table image |
| US20060033737A1 (en)* | 2004-08-16 | 2006-02-16 | Old William M | Methods and system for visualizing data sets |
| JP3734491B1 (en)* | 2004-12-21 | 2006-01-11 | 公靖 中野 | How to display in-cell graph of spreadsheet |
| US7685510B2 (en)* | 2004-12-23 | 2010-03-23 | Sap Ag | System and method for grouping data |
| US8045474B2 (en)* | 2005-01-26 | 2011-10-25 | Cisco Technology, Inc. | Method and apparatus for tracking layer-2 (L2) resource of a switch |
| US8335704B2 (en) | 2005-01-28 | 2012-12-18 | Pegasystems Inc. | Methods and apparatus for work management and routing |
| US7984371B2 (en)* | 2005-02-18 | 2011-07-19 | Andrew Joseph Zdenek | Method and system for the graphical modeling of data and calculations of a spreadsheet |
| US8151213B2 (en)* | 2005-03-25 | 2012-04-03 | International Business Machines Corporation | System, method and program product for tabular data with dynamic visual cells |
| US7571148B2 (en)* | 2005-06-02 | 2009-08-04 | Northrop Grumman Corporation | System and method for graphically representing uncertainty in an assisted decision-making system |
| CA2550532A1 (en)* | 2005-06-20 | 2006-12-20 | Richard Brath | System and method for visualizing contextual-numerical data of source documents as corresponding transformed documents |
| US8234293B2 (en)* | 2005-09-08 | 2012-07-31 | Microsoft Corporation | Autocompleting with queries to a database |
| US7805433B2 (en)* | 2005-10-14 | 2010-09-28 | Microsoft Corporation | Multidimensional cube functions |
| US8004527B2 (en)* | 2006-01-20 | 2011-08-23 | Newport Corporation | Self-centering zoom bar graph |
| US7634717B2 (en)* | 2006-01-23 | 2009-12-15 | Microsoft Corporation | Multiple conditional formatting |
| AU2007213336A1 (en)* | 2006-02-08 | 2007-08-16 | Dolphin Software Ltd. | Efficient display systems and methods |
| US8924335B1 (en) | 2006-03-30 | 2014-12-30 | Pegasystems Inc. | Rule-based user interface conformance methods |
| US20070233902A1 (en)* | 2006-03-30 | 2007-10-04 | Alan Trefler | User interface methods and apparatus for rules processing |
| US20080208785A1 (en)* | 2006-03-30 | 2008-08-28 | Pegasystems, Inc. | User interface methods and apparatus for rules processing |
| US20090132232A1 (en)* | 2006-03-30 | 2009-05-21 | Pegasystems Inc. | Methods and apparatus for implementing multilingual software applications |
| US8250525B2 (en) | 2007-03-02 | 2012-08-21 | Pegasystems Inc. | Proactive performance management for multi-user enterprise software systems |
| US8140549B2 (en)* | 2007-10-31 | 2012-03-20 | Juan Carlos Barinaga | Methods and arrangements of processing and presenting information |
| US9558172B2 (en)* | 2008-03-12 | 2017-01-31 | Microsoft Technology Licensing, Llc | Linking visual properties of charts to cells within tables |
| US8612438B2 (en) | 2008-06-13 | 2013-12-17 | Microsoft Corporation | Techniques for dynamic cross-filtering |
| US9164978B2 (en)* | 2008-06-17 | 2015-10-20 | Microsoft Technology Licensing, Llc | Identifying objects within a multidimensional array |
| JPWO2010018770A1 (en)* | 2008-08-11 | 2012-01-26 | コニカミノルタホールディングス株式会社 | Image display device |
| US8566359B1 (en)* | 2008-12-15 | 2013-10-22 | Pixar | Unfolding sparse data sets |
| US8843435B1 (en) | 2009-03-12 | 2014-09-23 | Pegasystems Inc. | Techniques for dynamic data processing |
| US8468492B1 (en) | 2009-03-30 | 2013-06-18 | Pegasystems, Inc. | System and method for creation and modification of software applications |
| US9665257B2 (en)* | 2009-12-28 | 2017-05-30 | Ancestry.Com Operations Inc. | Interactive modification of spacing constraints of genealogical charts with live feedback |
| US11410129B2 (en) | 2010-05-01 | 2022-08-09 | Monday.com Ltd. | Digital processing systems and methods for two-way syncing with third party applications in collaborative work systems |
| US20110295672A1 (en)* | 2010-05-25 | 2011-12-01 | Dimitriadis Christos K | Methods and a system for detecting fraud in betting and lottery games |
| US8959454B2 (en)* | 2010-08-09 | 2015-02-17 | International Business Machines Corporation | Table management |
| USD679285S1 (en)* | 2010-11-09 | 2013-04-02 | Estitech APS | Display screen or a portion thereof with a graphical user interface |
| USD694255S1 (en)* | 2011-01-22 | 2013-11-26 | Operational Transparency LLC | Portion of display screen with graphical user interface for visualizing data |
| US8880487B1 (en) | 2011-02-18 | 2014-11-04 | Pegasystems Inc. | Systems and methods for distributed rules processing |
| US9223488B1 (en)* | 2011-05-26 | 2015-12-29 | Lucasfilm Entertainment Company Ltd. | Navigable interfaces for graphical representations |
| US9195936B1 (en) | 2011-12-30 | 2015-11-24 | Pegasystems Inc. | System and method for updating or modifying an application without manual coding |
| US9501849B2 (en)* | 2012-05-11 | 2016-11-22 | Vmware, Inc. | Multi-dimensional visualization tool for browsing and troubleshooting at scale |
| USD684173S1 (en)* | 2012-06-11 | 2013-06-11 | Microsoft Corporation | Display screen with graphical user interface |
| USD684172S1 (en)* | 2012-06-11 | 2013-06-11 | Microsoft Corporation | Display screen with graphical user interface |
| JP5795559B2 (en)* | 2012-07-26 | 2015-10-14 | ジーイー・メディカル・システムズ・グローバル・テクノロジー・カンパニー・エルエルシー | Display device and image display system |
| US9152618B2 (en) | 2012-08-31 | 2015-10-06 | Microsoft Technology Licensing, Llc | Cell view mode for outsized cells |
| US9922018B2 (en) | 2012-11-12 | 2018-03-20 | Microsoft Technology Licensing, Llc | Scrollbar for zooming on rows and columns of a spreadsheet and interpreting cells |
| GB201300031D0 (en)* | 2013-01-02 | 2013-02-13 | Canonical Ltd | Ubuntu UX innovations |
| US20140214804A1 (en)* | 2013-01-31 | 2014-07-31 | Business Objects Software Ltd. | Methods, apparatus and system for a multi-resolution visual crosstab |
| US10775971B2 (en) | 2013-06-28 | 2020-09-15 | Successfactors, Inc. | Pinch gestures in a tile-based user interface |
| US9858292B1 (en)* | 2013-11-11 | 2018-01-02 | Tableau Software, Inc. | Systems and methods for semantic icon encoding in data visualizations |
| USD791797S1 (en)* | 2014-09-11 | 2017-07-11 | Express Scripts, Inc. | Display screen with a graphical user interface |
| USD801353S1 (en)* | 2014-09-11 | 2017-10-31 | Express Scripts, Inc. | Display screen with a graphical user interface |
| USD791796S1 (en)* | 2014-09-11 | 2017-07-11 | Express Scripts, Inc. | Display screen with a graphical user interface |
| USD791798S1 (en)* | 2014-09-11 | 2017-07-11 | Express Scripts, Inc. | Display screen with a graphical user interface |
| US10469396B2 (en) | 2014-10-10 | 2019-11-05 | Pegasystems, Inc. | Event processing with enhanced throughput |
| US10459608B2 (en) | 2014-12-01 | 2019-10-29 | Ebay Inc. | Mobile optimized shopping comparison |
| US10558742B2 (en) | 2015-03-09 | 2020-02-11 | Vinyl Development LLC | Responsive user interface system |
| US9400776B1 (en) | 2015-03-09 | 2016-07-26 | Vinyl Development LLC | Adaptive column selection |
| US10037574B2 (en) | 2015-04-28 | 2018-07-31 | Trading Technologies International, Inc. | Systems and methods to display chart bars with variable scaling and/or aggregation |
| US10025466B2 (en) | 2015-06-11 | 2018-07-17 | International Business Machines Corporation | Dynamically transforming a tabular object based on actions within a graphical user interface |
| US20170352167A1 (en)* | 2016-06-02 | 2017-12-07 | General Electric Company | System and method for layered visualization of evaluation results |
| US10698599B2 (en) | 2016-06-03 | 2020-06-30 | Pegasystems, Inc. | Connecting graphical shapes using gestures |
| US10698647B2 (en) | 2016-07-11 | 2020-06-30 | Pegasystems Inc. | Selective sharing for collaborative application usage |
| US10043296B2 (en)* | 2016-10-27 | 2018-08-07 | Sap Se | Visual relationship between table values |
| US11422833B1 (en)* | 2017-06-30 | 2022-08-23 | Cognex Corporation | System and method for automatic generation of human-machine interface in a vision system |
| US10697757B2 (en)* | 2017-12-22 | 2020-06-30 | Symbol Technologies, Llc | Container auto-dimensioning |
| US11423116B2 (en) | 2018-06-29 | 2022-08-23 | Microsoft Technology Licensing, Llc | Automatically creating lambda functions in spreadsheet applications |
| US11023669B2 (en)* | 2018-06-29 | 2021-06-01 | Microsoft Technology Licensing, Llc | Rendering lambda functions in spreadsheet applications |
| US11436359B2 (en) | 2018-07-04 | 2022-09-06 | Monday.com Ltd. | System and method for managing permissions of users for a single data type column-oriented data structure |
| US11048488B2 (en) | 2018-08-14 | 2021-06-29 | Pegasystems, Inc. | Software code optimizer and method |
| US11277361B2 (en) | 2020-05-03 | 2022-03-15 | Monday.com Ltd. | Digital processing systems and methods for variable hang-time for social layer messages in collaborative work systems |
| US11567945B1 (en) | 2020-08-27 | 2023-01-31 | Pegasystems Inc. | Customized digital content generation systems and methods |
Citations (16)
| Publication number | Priority date | Publication date | Assignee | Title |
|---|---|---|---|---|
| GB2139846A (en)* | 1983-05-09 | 1984-11-14 | Dainippon Screen Mfg | Magnifying or otherwise distorting selected portions of scanned image |
| EP0399663A1 (en)* | 1989-04-25 | 1990-11-28 | Quantel Limited | An electronic image progressing system |
| WO1991004541A1 (en)* | 1989-09-25 | 1991-04-04 | Axa Corporation | Graphic file directory and spreadsheet |
| EP0447095A2 (en)* | 1990-03-05 | 1991-09-18 | Xerox Corporation | Workspace displays |
| US5179646A (en)* | 1988-03-29 | 1993-01-12 | Brother Kogyo Kabushiki Kaisha | Frame processing system capable of expanding and contracting a frame |
| US5226118A (en)* | 1991-01-29 | 1993-07-06 | Prometrix Corporation | Data analysis system and method for industrial process control systems |
| US5228119A (en)* | 1990-09-28 | 1993-07-13 | Temple University | Multi-dimensional graphing in two-dimensional space |
| US5230040A (en)* | 1988-09-21 | 1993-07-20 | Fuji Xerox Co., Ltd. | Table calculating device |
| US5231577A (en)* | 1990-04-06 | 1993-07-27 | Microsoft Corporation | Method and system for processing formatting information in a spreadsheet |
| US5255363A (en)* | 1990-06-19 | 1993-10-19 | Mentor Graphics Corporation | Graph-based programming system and associated method |
| US5257349A (en)* | 1990-12-18 | 1993-10-26 | David Sarnoff Research Center, Inc. | Interactive data visualization with smart object |
| US5317686A (en)* | 1990-09-10 | 1994-05-31 | Lotus Development Corporation | Data processing apparatus and method for a reformattable multidimensional spreadsheet |
| US5333244A (en)* | 1990-11-29 | 1994-07-26 | Hitachi, Ltd. | Method of and system for displaying a scalar quantity distribution |
| EP0619549A1 (en)* | 1993-04-01 | 1994-10-12 | Gerhard Dipl.-Ing. Müller-Dorn | Processing of valves in an active combined textual and graphical form |
| US5396621A (en)* | 1991-05-10 | 1995-03-07 | Claris Corporation | Sorting a table by rows or columns in response to interactive prompting with a dialog box graphical icon |
| US5485567A (en)* | 1991-12-09 | 1996-01-16 | International Business Machines Corporation | Iconic table of database information |
Family Cites Families (3)
| Publication number | Priority date | Publication date | Assignee | Title |
|---|---|---|---|---|
| US5021976A (en)* | 1988-11-14 | 1991-06-04 | Microelectronics And Computer Technology Corporation | Method and system for generating dynamic, interactive visual representations of information structures within a computer |
| US5416895A (en)* | 1992-04-08 | 1995-05-16 | Borland International, Inc. | System and methods for improved spreadsheet interface with user-familiar objects |
| US5632009A (en)* | 1993-09-17 | 1997-05-20 | Xerox Corporation | Method and system for producing a table image showing indirect data representations |
- 1996
- 1996-03-05USUS08/611,013patent/US5632009A/ennot_activeExpired - Lifetime
- 1996-11-14USUS08/749,131patent/US5880742A/ennot_activeExpired - Lifetime
- 1996-11-15USUS08/749,474patent/US5883635A/ennot_activeExpired - Lifetime
- 1998
- 1998-03-27USUS09/049,783patent/US6085202A/ennot_activeExpired - Lifetime
Patent Citations (17)
| Publication number | Priority date | Publication date | Assignee | Title |
|---|---|---|---|---|
| GB2139846A (en)* | 1983-05-09 | 1984-11-14 | Dainippon Screen Mfg | Magnifying or otherwise distorting selected portions of scanned image |
| US5179646A (en)* | 1988-03-29 | 1993-01-12 | Brother Kogyo Kabushiki Kaisha | Frame processing system capable of expanding and contracting a frame |
| US5230040A (en)* | 1988-09-21 | 1993-07-20 | Fuji Xerox Co., Ltd. | Table calculating device |
| EP0399663A1 (en)* | 1989-04-25 | 1990-11-28 | Quantel Limited | An electronic image progressing system |
| US5093907A (en)* | 1989-09-25 | 1992-03-03 | Axa Corporation | Graphic file directory and spreadsheet |
| WO1991004541A1 (en)* | 1989-09-25 | 1991-04-04 | Axa Corporation | Graphic file directory and spreadsheet |
| EP0447095A2 (en)* | 1990-03-05 | 1991-09-18 | Xerox Corporation | Workspace displays |
| US5231577A (en)* | 1990-04-06 | 1993-07-27 | Microsoft Corporation | Method and system for processing formatting information in a spreadsheet |
| US5255363A (en)* | 1990-06-19 | 1993-10-19 | Mentor Graphics Corporation | Graph-based programming system and associated method |
| US5317686A (en)* | 1990-09-10 | 1994-05-31 | Lotus Development Corporation | Data processing apparatus and method for a reformattable multidimensional spreadsheet |
| US5228119A (en)* | 1990-09-28 | 1993-07-13 | Temple University | Multi-dimensional graphing in two-dimensional space |
| US5333244A (en)* | 1990-11-29 | 1994-07-26 | Hitachi, Ltd. | Method of and system for displaying a scalar quantity distribution |
| US5257349A (en)* | 1990-12-18 | 1993-10-26 | David Sarnoff Research Center, Inc. | Interactive data visualization with smart object |
| US5226118A (en)* | 1991-01-29 | 1993-07-06 | Prometrix Corporation | Data analysis system and method for industrial process control systems |
| US5396621A (en)* | 1991-05-10 | 1995-03-07 | Claris Corporation | Sorting a table by rows or columns in response to interactive prompting with a dialog box graphical icon |
| US5485567A (en)* | 1991-12-09 | 1996-01-16 | International Business Machines Corporation | Iconic table of database information |
| EP0619549A1 (en)* | 1993-04-01 | 1994-10-12 | Gerhard Dipl.-Ing. Müller-Dorn | Processing of valves in an active combined textual and graphical form |
Non-Patent Citations (18)
| Title |
|---|
| Bertin, "Semiology of Graphs", Univ of Wisonsin Press (1983). |
| Bertin, Jacques, Semiology of Graphics, University of Wisconson Press, 1983, translated by W. J. Berg, pp. v xi, 1 13, 191 231, 254 268.* |
| Bertin, Jacques, Semiology of Graphics, University of Wisconson Press, 1983, translated by W. J. Berg, pp. v-xi, 1-13, 191-231, 254-268. |
| Bertin, Semiology of Graphs , Univ of Wisonsin Press (1983).* |
| George W. Furnas, "Generalized Fisheye Views", Proceedings of the ACM SIGCHI Conference on Human Factors in Computing Systems, Apr. 1986, ACM, pp. 16-23. |
| George W. Furnas, Generalized Fisheye Views , Proceedings of the ACM SIGCHI Conference on Human Factors in Computing Systems, Apr. 1986, ACM, pp. 16 23.* |
| J. D. Mackinlay, G. G. Robertson, and S. K. Card, "The perspective wall: Dental and context smoothly integrated", Proceedings of the ACM SIGCHI Conference on Human Factors in Computing Systems, ACM, Apr. 1991, pp. 173-179. |
| J. D. Mackinlay, G. G. Robertson, and S. K. Card, The perspective wall: Dental and context smoothly integrated , Proceedings of the ACM SIGCHI Conference on Human Factors in Computing Systems, ACM, Apr. 1991, pp. 173 179.* |
| Manojit Sarkar and Marc H. Brown, "Graphical Fisheye Views of Graphs", Proceedings of the ACM SIGCHI Conference on Human Factors in Computing Systems, Apr. 1992, ACM, pp. 83-91. |
| Manojit Sarkar and Marc H. Brown, Graphical Fisheye Views of Graphs , Proceedings of the ACM SIGCHI Conference on Human Factors in Computing Systems, Apr. 1992, ACM, pp. 83 91.* |
| Mihalisin, Ted, et al., "Using Hierarchical Graphics to Visually Analize `Serial` and `Cerreal` Data," Publication Date and Source Unknown. |
| Mihalisin, Ted, et al., Using Hierarchical Graphics to Visually Analize Serial and Cerreal Data, Publication Date and Source Unknown.* |
| Mihalisin, Ted, Schwegler, J, and Timlin, J., "Hierarchical Multivariate Visualization," in Computer Science and Statistics: Proceedings of the 24th Symposium on the Interface, 1992, pp. 141-149. |
| Mihalisin, Ted, Schwegler, J, and Timlin, J., Hierarchical Multivariate Visualization, in Computer Science and Statistics: Proceedings of the 24th Symposium on the Interface, 1992, pp. 141 149.* |
| Robert Spence and Mark Apperley, "Database Navigation: An Office Environment for the Professional", Behavior and Information Technology, 1982, pp. 43-54. |
| Robert Spence and Mark Apperley, Database Navigation: An Office Environment for the Professional , Behavior and Information Technology, 1982, pp. 43 54.* |
| William S. Cleveland, The Elements of Graphing Data, Wadsworth Advanced Books and Software, Monterey California, 1985, pp. x xii, 1 2, 208 218, 229 240.* |
| William S. Cleveland, The Elements of Graphing Data, Wadsworth Advanced Books and Software, Monterey California, 1985, pp. x-xii, 1-2, 208-218, 229-240. |
Cited By (413)
| Publication number | Priority date | Publication date | Assignee | Title |
|---|---|---|---|---|
| US6085202A (en)* | 1993-09-17 | 2000-07-04 | Xerox Corporation | Method and system for producing a table image having focus and context regions |
| US5880742A (en)* | 1993-09-17 | 1999-03-09 | Xerox-Corporation | Spreadsheet image showing data items as indirect graphical representations |
| US5883635A (en)* | 1993-09-17 | 1999-03-16 | Xerox Corporation | Producing a single-image view of a multi-image table using graphical representations of the table data |
| US5694544A (en)* | 1994-07-01 | 1997-12-02 | Hitachi, Ltd. | Conference support system which associates a shared object with data relating to said shared object |
| US5745891A (en)* | 1995-09-28 | 1998-04-28 | Sharp Kabushiki Kaisha | Apparatus for rearranging the rows of information in a displayed table by highlighting a different column attribute |
| US5966139A (en)* | 1995-10-31 | 1999-10-12 | Lucent Technologies Inc. | Scalable data segmentation and visualization system |
| US5781900A (en)* | 1996-01-02 | 1998-07-14 | Sofmap Future Design, Inc. | Flexible hyperlink association system |
| US5848417A (en)* | 1996-01-02 | 1998-12-08 | Sofmap Future Design, Inc. | Flexible information input and operation selection system |
| US6055550A (en)* | 1996-03-21 | 2000-04-25 | Oracle Corporation | Auto sizing of fields for displaying computer forms |
| US6581056B1 (en)* | 1996-06-27 | 2003-06-17 | Xerox Corporation | Information retrieval system providing secondary content analysis on collections of information objects |
| US6191792B1 (en)* | 1997-02-10 | 2001-02-20 | Nippon Telegraph And Telephone Corporation | Scheme for automatic data conversion definition generation according to data feature in visual multidimensional data analysis tool |
| US6253264B1 (en)* | 1997-03-07 | 2001-06-26 | Intelligent Compression Technologies | Coding network grouping data of same data type into blocks using file data structure and selecting compression for individual block base on block data type |
| US20050010579A1 (en)* | 1997-05-29 | 2005-01-13 | Randall Shoup | Method, article of manufacture, and apparatus for generating a multi-dimensional record management index |
| US7774303B2 (en) | 1997-05-29 | 2010-08-10 | Oracle International Corporation | Method, article of manufacturing, and apparatus for generating a multi-dimensional record management index |
| US20050262120A1 (en)* | 1997-05-29 | 2005-11-24 | Randall Shoup | Method, article of manufacturing, and apparatus for generating a multi-dimensional record management index |
| US6108657A (en)* | 1997-05-29 | 2000-08-22 | Oracle Corporation | Method, article of manufacture, and apparatus for generating a multi-dimensional record layout mapping |
| US5970493A (en)* | 1997-05-29 | 1999-10-19 | Oracle Corporation | Method, article of manufacture, and apparatus for generating a multi-dimensional record display |
| US7076502B2 (en) | 1997-05-29 | 2006-07-11 | Oracle International Corporation | Method, article of manufacture, and apparatus for generating a multi-dimensional record management index |
| US6604144B1 (en)* | 1997-06-30 | 2003-08-05 | Microsoft Corporation | Data format for multimedia object storage, retrieval and transfer |
| US5926818A (en)* | 1997-06-30 | 1999-07-20 | International Business Machines Corporation | Relational database implementation of a multi-dimensional database |
| US6327592B1 (en)* | 1997-07-04 | 2001-12-04 | Nec Corporation | Data calculator performing automatic recalculation based on data structure network |
| US6292809B1 (en)* | 1997-08-07 | 2001-09-18 | Adobe Systems Incorporated | Selecting cells in a table having individual cells and joined cells |
| US6021215A (en)* | 1997-10-10 | 2000-02-01 | Lucent Technologies, Inc. | Dynamic data visualization |
| US6628312B1 (en) | 1997-12-02 | 2003-09-30 | Inxight Software, Inc. | Interactive interface for visualizing and manipulating multi-dimensional data |
| EP0965932A3 (en)* | 1998-06-17 | 2006-01-04 | Xerox Corporation | Speadsheet view enhancement system |
| US6256649B1 (en)* | 1998-06-17 | 2001-07-03 | Xerox Corporation | Animated spreadsheet for dynamic display of constraint graphs |
| US6654761B2 (en) | 1998-07-29 | 2003-11-25 | Inxight Software, Inc. | Controlling which part of data defining a node-link structure is in memory |
| US6826724B1 (en) | 1998-12-24 | 2004-11-30 | Ricoh Company, Ltd. | Document processor, document classification device, document processing method, document classification method, and computer-readable recording medium for recording programs for executing the methods on a computer |
| US20070136288A1 (en)* | 1998-12-24 | 2007-06-14 | Atsuo Shimada | Document processor, document classification device, document processing method, document classification method, and computer-readable recording medium for recording programs for executing the methods on a computer |
| US6466211B1 (en) | 1999-10-22 | 2002-10-15 | Battelle Memorial Institute | Data visualization apparatuses, computer-readable mediums, computer data signals embodied in a transmission medium, data visualization methods, and digital computer data visualization methods |
| WO2001057744A3 (en)* | 2000-02-02 | 2002-07-18 | Roke Manor Research | Improvements in or relating to spreadsheets |
| WO2001067300A1 (en)* | 2000-03-03 | 2001-09-13 | Robert Fish | Improved parameter-value databases |
| US11127249B2 (en) | 2000-05-01 | 2021-09-21 | Interactive Games Llc | Real-time interactive wagering on event outcomes |
| US8764553B2 (en) | 2000-05-01 | 2014-07-01 | Cfph, Llc | Real-time interactive wagering on event outcomes |
| US10475278B2 (en) | 2000-05-01 | 2019-11-12 | Interactive Games Llc | Real-time interactive wagering on event outcomes |
| US8641511B2 (en) | 2000-05-01 | 2014-02-04 | Cfph, Llc | Real-time interactive wagering on event outcomes |
| US8512129B2 (en) | 2000-05-01 | 2013-08-20 | Cfph, Llc | Real-time interactive wagering on event outcomes |
| US8088000B2 (en) | 2000-05-01 | 2012-01-03 | Cfph, Llc | Real-time interactive wagering on event outcomes |
| US20020073021A1 (en)* | 2000-05-01 | 2002-06-13 | Ginsberg Philip M. | Real-time interactive wagering on event outcomes |
| US6738079B1 (en)* | 2000-06-02 | 2004-05-18 | Sun Microsystems, Inc. | Graphical user interface layout customizer |
| US6429868B1 (en) | 2000-07-13 | 2002-08-06 | Charles V. Dehner, Jr. | Method and computer program for displaying quantitative data |
| US20020113802A1 (en)* | 2000-12-21 | 2002-08-22 | Card Stuart Kent | Methods, systems, and computer program products for the display and operation of virtual three-dimensional books |
| US20060033762A1 (en)* | 2000-12-21 | 2006-02-16 | Xerox Corporation | Magnification methods, systems, and computer program products for virtual three-dimensional books |
| US20020113823A1 (en)* | 2000-12-21 | 2002-08-22 | Card Stuart Kent | Navigation methods, systems, and computer program products for virtual three-dimensional books |
| US6924822B2 (en) | 2000-12-21 | 2005-08-02 | Xerox Corporation | Magnification methods, systems, and computer program products for virtual three-dimensional books |
| US7640513B2 (en) | 2000-12-21 | 2009-12-29 | Xerox Corporation | Navigation methods, systems, and computer program products for virtual three-dimensional books |
| US20020118230A1 (en)* | 2000-12-21 | 2002-08-29 | Card Stuart Kent | Methods, systems, and computer program products for display of information relating to a virtual three-dimensional book |
| US20050005246A1 (en)* | 2000-12-21 | 2005-01-06 | Xerox Corporation | Navigation methods, systems, and computer program products for virtual three-dimensional books |
| US7139982B2 (en) | 2000-12-21 | 2006-11-21 | Xerox Corporation | Navigation methods, systems, and computer program products for virtual three-dimensional books |
| US20050005245A1 (en)* | 2000-12-21 | 2005-01-06 | Card Stuart Kent | Navigation methods, systems, and computer program products for virtual three-dimensional books |
| US7493572B2 (en) | 2000-12-21 | 2009-02-17 | Xerox Corporation | Navigation methods, systems, and computer program products for virtual three-dimensional books |
| US7069518B2 (en) | 2000-12-21 | 2006-06-27 | Xerox Corporation | Indexing methods, systems, and computer program products for virtual three-dimensional books |
| US7015910B2 (en) | 2000-12-21 | 2006-03-21 | Xerox Corporation | Methods, systems, and computer program products for the display and operation of virtual three-dimensional books |
| US7248269B2 (en) | 2000-12-21 | 2007-07-24 | Xerox Corporation | Magnification methods, systems, and computer program products for virtual three-dimensional books |
| US7240291B2 (en) | 2000-12-21 | 2007-07-03 | Xerox Corporation | Methods, systems, and computer program products for display of information relating to a virtual three-dimensional book |
| US20030038831A1 (en)* | 2001-08-22 | 2003-02-27 | Koninklijke Philips Electronics N.V. | Timeline display apparatus |
| US20030128212A1 (en)* | 2002-01-09 | 2003-07-10 | Pitkow James E. | System for graphical display and interactive exploratory analysis of data and data relationships |
| US7038680B2 (en) | 2002-01-09 | 2006-05-02 | Xerox Corporation | System for graphical display and interactive exploratory analysis of data and data relationships |
| US7221357B2 (en)* | 2002-02-21 | 2007-05-22 | Kid-Systeme Gmbh | Method for selecting and representing objects in a plane and in N-dimensional space |
| US20030156137A1 (en)* | 2002-02-21 | 2003-08-21 | Hartwig Von Essen | Method for selecting and representing objects in a plane and in N-dimensional space |
| US7340677B2 (en) | 2002-03-26 | 2008-03-04 | Intel Corporation | Methods and apparatuses of presenting categorical programs in progressive levels of content details |
| US20040024532A1 (en)* | 2002-07-30 | 2004-02-05 | Robert Kincaid | Method of identifying trends, correlations, and similarities among diverse biological data sets and systems for facilitating identification |
| US20040061702A1 (en)* | 2002-08-08 | 2004-04-01 | Robert Kincaid | Methods and system for simultaneous visualization and manipulation of multiple data types |
| US20040027350A1 (en)* | 2002-08-08 | 2004-02-12 | Robert Kincaid | Methods and system for simultaneous visualization and manipulation of multiple data types |
| US20050216459A1 (en)* | 2002-08-08 | 2005-09-29 | Aditya Vailaya | Methods and systems, for ontological integration of disparate biological data |
| US8131471B2 (en) | 2002-08-08 | 2012-03-06 | Agilent Technologies, Inc. | Methods and system for simultaneous visualization and manipulation of multiple data types |
| US20040078755A1 (en)* | 2002-10-21 | 2004-04-22 | Hitachi, Ltd. | System and method for processing forms |
| EP1579013A4 (en)* | 2002-12-13 | 2007-02-28 | Gene Codes Forensics Inc | Method for profiling and identifying persons by using data samples |
| US20050149254A1 (en)* | 2002-12-27 | 2005-07-07 | Fujitsu Limited | Action support method and apparatus |
| US7254481B2 (en)* | 2002-12-27 | 2007-08-07 | Fujitsu Limited | Action support method and apparatus |
| US7750908B2 (en)* | 2003-04-04 | 2010-07-06 | Agilent Technologies, Inc. | Focus plus context viewing and manipulation of large collections of graphs |
| US20050206644A1 (en)* | 2003-04-04 | 2005-09-22 | Robert Kincaid | Systems, tools and methods for focus and context viewving of large collections of graphs |
| US20060028471A1 (en)* | 2003-04-04 | 2006-02-09 | Robert Kincaid | Focus plus context viewing and manipulation of large collections of graphs |
| US7825929B2 (en)* | 2003-04-04 | 2010-11-02 | Agilent Technologies, Inc. | Systems, tools and methods for focus and context viewing of large collections of graphs |
| US9805549B2 (en) | 2003-04-10 | 2017-10-31 | Cantor Index Llc | Real-time interactive wagering on event outcomes |
| US20090096165A1 (en)* | 2003-04-10 | 2009-04-16 | Joseph M Asher | Real-time interactive wagering on event outcomes |
| US10559164B2 (en)* | 2003-04-10 | 2020-02-11 | Cantor Index Llc | Real-time interactive wagering on event outcomes |
| US20180047250A1 (en)* | 2003-04-10 | 2018-02-15 | Cantor Index Llc | Real-time interactive wagering on event outcomes |
| US9406196B2 (en) | 2003-04-10 | 2016-08-02 | Cantor Index, Llc | Real-time interactive wagering on event outcomes |
| US20070298871A1 (en)* | 2003-04-10 | 2007-12-27 | Asher Joseph M | Real-time interactive wagering on event outcomes |
| US11263867B2 (en) | 2003-04-10 | 2022-03-01 | Cantor Index, Llc | Real-time interactive wagering on event outcomes |
| EP1471438A1 (en)* | 2003-04-23 | 2004-10-27 | Hewlett-Packard Development Company, L.P. | Process for controlling the display of a two-dimensional table and graphic object for doing the same |
| US8938667B2 (en) | 2003-12-01 | 2015-01-20 | International Business Machines Corporation | Table column spanning |
| US8214732B2 (en)* | 2003-12-01 | 2012-07-03 | International Business Machines Corporation | Table column spanning |
| US20150193419A1 (en)* | 2003-12-01 | 2015-07-09 | International Business Machines Corporation | Table column spanning |
| US20080005658A1 (en)* | 2003-12-01 | 2008-01-03 | International Business Machines Corporation | Table column spanning |
| US9645991B2 (en)* | 2003-12-01 | 2017-05-09 | International Business Machines Corporation | Table column spanning |
| US7801784B2 (en) | 2004-06-07 | 2010-09-21 | Cfph, Llc | System and method for managing financial market information |
| US8615456B2 (en) | 2004-06-07 | 2013-12-24 | Cfph, Llc | Enhanced system and method for managing financial market information |
| US20050273408A1 (en)* | 2004-06-07 | 2005-12-08 | Bandman Jeffery M | System and method for managing financial market information |
| US11205225B2 (en) | 2004-06-07 | 2021-12-21 | Cfph, Llc | System and method for managing transactions of financial instruments |
| US7937309B2 (en) | 2004-06-07 | 2011-05-03 | Cfph, Llc | System and method for managing financial market data with hidden information |
| US10410283B2 (en) | 2004-06-07 | 2019-09-10 | Cfph, Llc | System and method for managing transactions of financial instruments |
| US20100299632A1 (en)* | 2004-06-07 | 2010-11-25 | Bandman Jeffrey M | System and method for managing financial market data with hidden information |
| US20060074866A1 (en)* | 2004-09-27 | 2006-04-06 | Microsoft Corporation | One click conditional formatting method and system for software programs |
| US7933862B2 (en)* | 2004-09-27 | 2011-04-26 | Microsoft Corporation | One click conditional formatting method and system for software programs |
| JP2006092520A (en)* | 2004-09-27 | 2006-04-06 | Microsoft Corp | Method and system for conditional formatting of one click type concerning software program |
| RU2398271C2 (en)* | 2004-09-27 | 2010-08-27 | Майкрософт Корпорейшн | Method and system for formatting based on condition activated by one mouse click for programs |
| AU2005203670B2 (en)* | 2004-09-27 | 2010-09-02 | Microsoft Technology Licensing, Llc | One click conditional formatting method and system for software programs |
| US20090049372A1 (en)* | 2004-11-09 | 2009-02-19 | Oracle International Corporation | Methods and systems for implementing a dynamic hierarchical data viewer |
| US8402361B2 (en) | 2004-11-09 | 2013-03-19 | Oracle International Corporation | Methods and systems for implementing a dynamic hierarchical data viewer |
| US20060101324A1 (en)* | 2004-11-09 | 2006-05-11 | Oracle International Corporation, A California Corporation | Data viewer |
| US8060817B2 (en) | 2004-11-09 | 2011-11-15 | Oracle International Corporation | Data viewer |
| US20060106907A1 (en)* | 2004-11-17 | 2006-05-18 | Sau-Ann Su | Method of analyzing correlations among four variables in two-dimension configuration and computer accessible medium |
| US7890396B2 (en) | 2005-06-07 | 2011-02-15 | Cfph, Llc | Enhanced system and method for managing financial market information |
| US8131618B2 (en) | 2005-06-07 | 2012-03-06 | Cfph, Llc | Enhanced system and method for managing financial market information |
| US20090132441A1 (en)* | 2005-08-23 | 2009-05-21 | Syneola Sa | Multilevel semiotic and fuzzy logic user and metadata interface means for interactive multimedia system having cognitive adaptive capability |
| US8280827B2 (en) | 2005-08-23 | 2012-10-02 | Syneola Luxembourg Sa | Multilevel semiotic and fuzzy logic user and metadata interface means for interactive multimedia system having cognitive adaptive capability |
| EP1758398A1 (en) | 2005-08-23 | 2007-02-28 | Syneola SA | Multilevel semiotic and fuzzy logic user and metadata interface means for interactive multimedia system having cognitive adaptive capability |
| US8601383B2 (en) | 2005-09-09 | 2013-12-03 | Microsoft Corporation | User interface for creating a spreadsheet data summary table |
| US9223772B2 (en) | 2005-09-09 | 2015-12-29 | Microsoft Technology Licensing, Llc | Filtering user interface for a data summary table |
| US9529789B2 (en) | 2005-09-09 | 2016-12-27 | Microsoft Technology Licensing, Llc | User interface for creating a spreadsheet data summary table |
| US20070061369A1 (en)* | 2005-09-09 | 2007-03-15 | Microsoft Corporation | User interface for creating a spreadsheet data summary table |
| US10579723B2 (en) | 2005-09-09 | 2020-03-03 | Microsoft Technology Licensing, Llc | User interface for creating a spreadsheet data summary table |
| US9959267B2 (en) | 2005-09-09 | 2018-05-01 | Microsoft Technology Licensing, Llc | Filtering user interface for a data summary table |
| US20070112724A1 (en)* | 2005-10-10 | 2007-05-17 | Canon Kabushiki Kaisha | Method of applying a function to a data set |
| US8510645B2 (en)* | 2005-10-10 | 2013-08-13 | Canon Kabushiki Kaisha | Method of applying a function to a data set |
| US20090160861A1 (en)* | 2005-10-18 | 2009-06-25 | Kimiyasu Nakano | Spreadsheet In-Cell Range Graph Display Method |
| US9424235B2 (en) | 2005-10-27 | 2016-08-23 | Microsoft Technology Licensing, Llc | Variable formatting of values |
| US11295058B2 (en) | 2005-10-27 | 2022-04-05 | Microsoft Technology Licensing, Llc | Variable formatting of values |
| US20070118795A1 (en)* | 2005-11-23 | 2007-05-24 | Peter Noyes | A Method of Processing Annotations Using an Editable Multi-Dimensional Catalog |
| US8280896B2 (en)* | 2005-12-09 | 2012-10-02 | Microsoft Corporation | Reporting row structure for generating reports using focus areas |
| US20070136352A1 (en)* | 2005-12-09 | 2007-06-14 | Microsoft Corporation | Reporting row structure |
| US20100251090A1 (en)* | 2006-02-27 | 2010-09-30 | Microsoft Corporation | Dynamic Thresholds for Conditional Formats |
| US8914717B2 (en)* | 2006-02-27 | 2014-12-16 | Microsoft Corporation | Dynamic thresholds for conditional formats |
| US7890533B2 (en) | 2006-05-17 | 2011-02-15 | Noblis, Inc. | Method and system for information extraction and modeling |
| US20100169299A1 (en)* | 2006-05-17 | 2010-07-01 | Mitretek Systems, Inc. | Method and system for information extraction and modeling |
| US20080046808A1 (en)* | 2006-08-15 | 2008-02-21 | International Business Machines Corporation | Method and apparatus for visualizing multidimensional data sets using expandable grids with hierarchically-labeled axes |
| US20080235568A1 (en)* | 2006-08-15 | 2008-09-25 | International Business Machines Corporation | Method and apparatus for visualizing multidimensional data sets using expandable grids with hierarchically-labeled axes |
| US7924283B1 (en) | 2006-09-19 | 2011-04-12 | Hewlett-Packard Development Company, L.P. | Time relevance-based visualization of data |
| US10657772B2 (en) | 2006-09-28 | 2020-05-19 | Cfph, Llc | Products and processes for processing information related to weather and other events |
| US8562422B2 (en) | 2006-09-28 | 2013-10-22 | Cfph, Llc | Products and processes for processing information related to weather and other events |
| US10074244B2 (en) | 2006-09-28 | 2018-09-11 | Cfph, Llc | Products and processes for processing information related to weather and other events |
| US20080081684A1 (en)* | 2006-09-28 | 2008-04-03 | Lutnick Howard W | Products and processes for processing information related to weather and other events |
| US11562628B2 (en) | 2006-09-28 | 2023-01-24 | Cfph, Llc | Products and processes for processing information related to weather and other events |
| US9177051B2 (en) | 2006-10-30 | 2015-11-03 | Noblis, Inc. | Method and system for personal information extraction and modeling with fully generalized extraction contexts |
| US20080133213A1 (en)* | 2006-10-30 | 2008-06-05 | Noblis, Inc. | Method and system for personal information extraction and modeling with fully generalized extraction contexts |
| US7949629B2 (en) | 2006-10-30 | 2011-05-24 | Noblis, Inc. | Method and system for personal information extraction and modeling with fully generalized extraction contexts |
| US8963969B2 (en)* | 2007-01-31 | 2015-02-24 | Hewlett-Packard Development Company, L.P. | Providing an automated visualization of a collection of data values divided into a number of bins depending upon a change feature of the data values |
| US20080180382A1 (en)* | 2007-01-31 | 2008-07-31 | Hao Ming C | Providing an automated visualization of a collection of data values divided into a number of bins depending upon a change feature of the data values |
| US10229284B2 (en) | 2007-02-21 | 2019-03-12 | Palantir Technologies Inc. | Providing unique views of data based on changes or rules |
| US10719621B2 (en) | 2007-02-21 | 2020-07-21 | Palantir Technologies Inc. | Providing unique views of data based on changes or rules |
| US8549436B1 (en)* | 2007-06-04 | 2013-10-01 | RedZ, Inc. | Visual web search interface |
| US8126826B2 (en) | 2007-09-21 | 2012-02-28 | Noblis, Inc. | Method and system for active learning screening process with dynamic information modeling |
| US20090164945A1 (en)* | 2007-12-21 | 2009-06-25 | Yan Li | Information processing device and integrated information system |
| US20090217181A1 (en)* | 2008-02-22 | 2009-08-27 | Microsoft Corporation | Spectrum bar control |
| US8261201B2 (en) | 2008-02-22 | 2012-09-04 | Microsoft Corporation | Spectrum bar control |
| US8719689B2 (en)* | 2008-04-08 | 2014-05-06 | Siemens Aktiengesellschaft | Method and user interface for implementation of a medical examination |
| US20090254201A1 (en)* | 2008-04-08 | 2009-10-08 | Karlheinz Glaser-Seidnitzer | Method and user interface for implementation of a medical examination |
| US20090319882A1 (en)* | 2008-06-20 | 2009-12-24 | Microsoft Corporation | DataGrid User Interface Control With Row Details |
| US8166387B2 (en)* | 2008-06-20 | 2012-04-24 | Microsoft Corporation | DataGrid user interface control with row details |
| US10248294B2 (en) | 2008-09-15 | 2019-04-02 | Palantir Technologies, Inc. | Modal-less interface enhancements |
| US9383911B2 (en) | 2008-09-15 | 2016-07-05 | Palantir Technologies, Inc. | Modal-less interface enhancements |
| US10747952B2 (en) | 2008-09-15 | 2020-08-18 | Palantir Technologies, Inc. | Automatic creation and server push of multiple distinct drafts |
| US9652117B2 (en) | 2009-02-18 | 2017-05-16 | International Business Machines Corporation | Displaying a representation of data in conditions of limited visual space |
| US20150026554A1 (en)* | 2010-01-06 | 2015-01-22 | Apple Inc. | Device, method, and graphical user interface for manipulating tables using multicontact gestures |
| US20110289397A1 (en)* | 2010-05-19 | 2011-11-24 | Mauricio Eastmond | Displaying Table Data in a Limited Display Area |
| US9021392B2 (en)* | 2010-07-26 | 2015-04-28 | Sap Se | Managing extension projects with repository based tagging |
| US20120023445A1 (en)* | 2010-07-26 | 2012-01-26 | Baeuerle Stefan A | Managing extension projects with repository based tagging |
| US10423582B2 (en) | 2011-06-23 | 2019-09-24 | Palantir Technologies, Inc. | System and method for investigating large amounts of data |
| US11392550B2 (en) | 2011-06-23 | 2022-07-19 | Palantir Technologies Inc. | System and method for investigating large amounts of data |
| US9880993B2 (en) | 2011-08-02 | 2018-01-30 | Palantir Technologies, Inc. | System and method for accessing rich objects via spreadsheets |
| US9280532B2 (en)* | 2011-08-02 | 2016-03-08 | Palantir Technologies, Inc. | System and method for accessing rich objects via spreadsheets |
| US20130036346A1 (en)* | 2011-08-02 | 2013-02-07 | Cicerone Derek Michael | System and Method for Accessing Rich Objects Via Spreadsheets |
| US9880987B2 (en) | 2011-08-25 | 2018-01-30 | Palantir Technologies, Inc. | System and method for parameterizing documents for automatic workflow generation |
| US10706220B2 (en) | 2011-08-25 | 2020-07-07 | Palantir Technologies, Inc. | System and method for parameterizing documents for automatic workflow generation |
| US11138180B2 (en) | 2011-09-02 | 2021-10-05 | Palantir Technologies Inc. | Transaction protocol for reading database values |
| US10331797B2 (en) | 2011-09-02 | 2019-06-25 | Palantir Technologies Inc. | Transaction protocol for reading database values |
| US20130159832A1 (en)* | 2011-12-12 | 2013-06-20 | Black Point Technologies Llc | Systems and methods for trading using an embedded spreadsheet engine and user interface |
| USD758393S1 (en)* | 2012-01-06 | 2016-06-07 | Samsung Electronics Co., Ltd. | Display screen or portion thereof with graphical user interface |
| US11182204B2 (en) | 2012-10-22 | 2021-11-23 | Palantir Technologies Inc. | System and method for batch evaluation programs |
| US9898335B1 (en) | 2012-10-22 | 2018-02-20 | Palantir Technologies Inc. | System and method for batch evaluation programs |
| US10313833B2 (en) | 2013-01-31 | 2019-06-04 | Palantir Technologies Inc. | Populating property values of event objects of an object-centric data model using image metadata |
| US9123086B1 (en) | 2013-01-31 | 2015-09-01 | Palantir Technologies, Inc. | Automatically generating event objects from images |
| US9380431B1 (en) | 2013-01-31 | 2016-06-28 | Palantir Technologies, Inc. | Use of teams in a mobile application |
| US10743133B2 (en) | 2013-01-31 | 2020-08-11 | Palantir Technologies Inc. | Populating property values of event objects of an object-centric data model using image metadata |
| US20140229512A1 (en)* | 2013-02-13 | 2014-08-14 | Luan O'Carrol | Discounted future value operations on a massively parallel processing system and methods thereof |
| US9626397B2 (en)* | 2013-02-13 | 2017-04-18 | Business Objects Software Limited | Discounted future value operations on a massively parallel processing system and methods thereof |
| US9449031B2 (en)* | 2013-02-28 | 2016-09-20 | Ricoh Company, Ltd. | Sorting and filtering a table with image data and symbolic data in a single cell |
| US20140244668A1 (en)* | 2013-02-28 | 2014-08-28 | Ricoh Co., Ltd. | Sorting and Filtering a Table with Image Data and Symbolic Data in a Single Cell |
| US10037314B2 (en) | 2013-03-14 | 2018-07-31 | Palantir Technologies, Inc. | Mobile reports |
| US10817513B2 (en) | 2013-03-14 | 2020-10-27 | Palantir Technologies Inc. | Fair scheduling for mixed-query loads |
| US10997363B2 (en) | 2013-03-14 | 2021-05-04 | Palantir Technologies Inc. | Method of generating objects and links from mobile reports |
| US10452678B2 (en) | 2013-03-15 | 2019-10-22 | Palantir Technologies Inc. | Filter chains for exploring large data sets |
| US20140279698A1 (en)* | 2013-03-15 | 2014-09-18 | Trade Ideas, LLC | Systems and methods for multivariate sorting of financial data |
| US10264014B2 (en) | 2013-03-15 | 2019-04-16 | Palantir Technologies Inc. | Systems and user interfaces for dynamic and interactive investigation based on automatic clustering of related data in various data structures |
| US10482097B2 (en) | 2013-03-15 | 2019-11-19 | Palantir Technologies Inc. | System and method for generating event visualizations |
| US10216801B2 (en) | 2013-03-15 | 2019-02-26 | Palantir Technologies Inc. | Generating data clusters |
| US10453229B2 (en) | 2013-03-15 | 2019-10-22 | Palantir Technologies Inc. | Generating object time series from data objects |
| US9965937B2 (en) | 2013-03-15 | 2018-05-08 | Palantir Technologies Inc. | External malware data item clustering and analysis |
| US9779525B2 (en) | 2013-03-15 | 2017-10-03 | Palantir Technologies Inc. | Generating object time series from data objects |
| US12238136B2 (en) | 2013-03-15 | 2025-02-25 | Palantir Technologies Inc. | Malware data clustering |
| US8868486B2 (en) | 2013-03-15 | 2014-10-21 | Palantir Technologies Inc. | Time-sensitive cube |
| US9646396B2 (en) | 2013-03-15 | 2017-05-09 | Palantir Technologies Inc. | Generating object time series and data objects |
| US8917274B2 (en) | 2013-03-15 | 2014-12-23 | Palantir Technologies Inc. | Event matrix based on integrated data |
| US10977279B2 (en) | 2013-03-15 | 2021-04-13 | Palantir Technologies Inc. | Time-sensitive cube |
| US9852195B2 (en) | 2013-03-15 | 2017-12-26 | Palantir Technologies Inc. | System and method for generating event visualizations |
| US9852205B2 (en) | 2013-03-15 | 2017-12-26 | Palantir Technologies Inc. | Time-sensitive cube |
| US20140325329A1 (en)* | 2013-04-24 | 2014-10-30 | Hewlett-Packard Development Company, L.P. | Visual Analytics of Multivariate Data Using a Cell Based Calendar Matrix having a Visual Folding Mechanism |
| US9953445B2 (en) | 2013-05-07 | 2018-04-24 | Palantir Technologies Inc. | Interactive data object map |
| US10360705B2 (en) | 2013-05-07 | 2019-07-23 | Palantir Technologies Inc. | Interactive data object map |
| US12374011B2 (en) | 2013-05-07 | 2025-07-29 | Palantir Technologies Inc. | Interactive data object map |
| US9223773B2 (en) | 2013-08-08 | 2015-12-29 | Palatir Technologies Inc. | Template system for custom document generation |
| US10976892B2 (en) | 2013-08-08 | 2021-04-13 | Palantir Technologies Inc. | Long click display of a context menu |
| US9335897B2 (en) | 2013-08-08 | 2016-05-10 | Palantir Technologies Inc. | Long click display of a context menu |
| US9785317B2 (en) | 2013-09-24 | 2017-10-10 | Palantir Technologies Inc. | Presentation and analysis of user interaction data |
| US10732803B2 (en) | 2013-09-24 | 2020-08-04 | Palantir Technologies Inc. | Presentation and analysis of user interaction data |
| US9996229B2 (en) | 2013-10-03 | 2018-06-12 | Palantir Technologies Inc. | Systems and methods for analyzing performance of an entity |
| US10635276B2 (en) | 2013-10-07 | 2020-04-28 | Palantir Technologies Inc. | Cohort-based presentation of user interaction data |
| US9864493B2 (en) | 2013-10-07 | 2018-01-09 | Palantir Technologies Inc. | Cohort-based presentation of user interaction data |
| US8924872B1 (en) | 2013-10-18 | 2014-12-30 | Palantir Technologies Inc. | Overview user interface of emergency call data of a law enforcement agency |
| US9514200B2 (en) | 2013-10-18 | 2016-12-06 | Palantir Technologies Inc. | Systems and user interfaces for dynamic and interactive simultaneous querying of multiple data stores |
| US9116975B2 (en) | 2013-10-18 | 2015-08-25 | Palantir Technologies Inc. | Systems and user interfaces for dynamic and interactive simultaneous querying of multiple data stores |
| US10042524B2 (en) | 2013-10-18 | 2018-08-07 | Palantir Technologies Inc. | Overview user interface of emergency call data of a law enforcement agency |
| US10719527B2 (en) | 2013-10-18 | 2020-07-21 | Palantir Technologies Inc. | Systems and user interfaces for dynamic and interactive simultaneous querying of multiple data stores |
| US10877638B2 (en) | 2013-10-18 | 2020-12-29 | Palantir Technologies Inc. | Overview user interface of emergency call data of a law enforcement agency |
| US9305383B2 (en)* | 2013-10-22 | 2016-04-05 | Honeywell International Inc. | Chart layout which highlights event occurrence patterns |
| US20150109305A1 (en)* | 2013-10-22 | 2015-04-23 | Honywell International Inc. | Chart layout which highlights event occurrence patterns |
| US9021384B1 (en) | 2013-11-04 | 2015-04-28 | Palantir Technologies Inc. | Interactive vehicle information map |
| US10262047B1 (en) | 2013-11-04 | 2019-04-16 | Palantir Technologies Inc. | Interactive vehicle information map |
| US11100174B2 (en) | 2013-11-11 | 2021-08-24 | Palantir Technologies Inc. | Simple web search |
| US10037383B2 (en) | 2013-11-11 | 2018-07-31 | Palantir Technologies, Inc. | Simple web search |
| US11138279B1 (en) | 2013-12-10 | 2021-10-05 | Palantir Technologies Inc. | System and method for aggregating data from a plurality of data sources |
| US10198515B1 (en) | 2013-12-10 | 2019-02-05 | Palantir Technologies Inc. | System and method for aggregating data from a plurality of data sources |
| US9734217B2 (en) | 2013-12-16 | 2017-08-15 | Palantir Technologies Inc. | Methods and systems for analyzing entity performance |
| US10025834B2 (en) | 2013-12-16 | 2018-07-17 | Palantir Technologies Inc. | Methods and systems for analyzing entity performance |
| US9727622B2 (en) | 2013-12-16 | 2017-08-08 | Palantir Technologies, Inc. | Methods and systems for analyzing entity performance |
| US10356032B2 (en) | 2013-12-26 | 2019-07-16 | Palantir Technologies Inc. | System and method for detecting confidential information emails |
| US10230746B2 (en) | 2014-01-03 | 2019-03-12 | Palantir Technologies Inc. | System and method for evaluating network threats and usage |
| US10805321B2 (en) | 2014-01-03 | 2020-10-13 | Palantir Technologies Inc. | System and method for evaluating network threats and usage |
| US10402054B2 (en) | 2014-02-20 | 2019-09-03 | Palantir Technologies Inc. | Relationship visualizations |
| US9009827B1 (en) | 2014-02-20 | 2015-04-14 | Palantir Technologies Inc. | Security sharing system |
| US10873603B2 (en) | 2014-02-20 | 2020-12-22 | Palantir Technologies Inc. | Cyber security sharing and identification system |
| US9923925B2 (en) | 2014-02-20 | 2018-03-20 | Palantir Technologies Inc. | Cyber security sharing and identification system |
| US9483162B2 (en) | 2014-02-20 | 2016-11-01 | Palantir Technologies Inc. | Relationship visualizations |
| US10795723B2 (en) | 2014-03-04 | 2020-10-06 | Palantir Technologies Inc. | Mobile tasks |
| US10180977B2 (en) | 2014-03-18 | 2019-01-15 | Palantir Technologies Inc. | Determining and extracting changed data from a data source |
| US10871887B2 (en) | 2014-04-28 | 2020-12-22 | Palantir Technologies Inc. | Systems and user interfaces for dynamic and interactive access of, investigation of, and analysis of data objects stored in one or more databases |
| US12248671B2 (en) | 2014-04-28 | 2025-03-11 | Palantir Technologies Inc. | Systems and user interfaces for dynamic and interactive access of, investigation of, and analysis of data objects stored in one or more databases |
| US9857958B2 (en) | 2014-04-28 | 2018-01-02 | Palantir Technologies Inc. | Systems and user interfaces for dynamic and interactive access of, investigation of, and analysis of data objects stored in one or more databases |
| US9449035B2 (en) | 2014-05-02 | 2016-09-20 | Palantir Technologies Inc. | Systems and methods for active column filtering |
| US10019431B2 (en) | 2014-05-02 | 2018-07-10 | Palantir Technologies Inc. | Systems and methods for active column filtering |
| US9619557B2 (en) | 2014-06-30 | 2017-04-11 | Palantir Technologies, Inc. | Systems and methods for key phrase characterization of documents |
| US10180929B1 (en) | 2014-06-30 | 2019-01-15 | Palantir Technologies, Inc. | Systems and methods for identifying key phrase clusters within documents |
| US10162887B2 (en) | 2014-06-30 | 2018-12-25 | Palantir Technologies Inc. | Systems and methods for key phrase characterization of documents |
| US11341178B2 (en) | 2014-06-30 | 2022-05-24 | Palantir Technologies Inc. | Systems and methods for key phrase characterization of documents |
| US9344447B2 (en) | 2014-07-03 | 2016-05-17 | Palantir Technologies Inc. | Internal malware data item clustering and analysis |
| US9298678B2 (en) | 2014-07-03 | 2016-03-29 | Palantir Technologies Inc. | System and method for news events detection and visualization |
| US10798116B2 (en) | 2014-07-03 | 2020-10-06 | Palantir Technologies Inc. | External malware data item clustering and analysis |
| US9256664B2 (en) | 2014-07-03 | 2016-02-09 | Palantir Technologies Inc. | System and method for news events detection and visualization |
| US9998485B2 (en) | 2014-07-03 | 2018-06-12 | Palantir Technologies, Inc. | Network intrusion data item clustering and analysis |
| US10572496B1 (en) | 2014-07-03 | 2020-02-25 | Palantir Technologies Inc. | Distributed workflow system and database with access controls for city resiliency |
| US9202249B1 (en) | 2014-07-03 | 2015-12-01 | Palantir Technologies Inc. | Data item clustering and analysis |
| US10929436B2 (en) | 2014-07-03 | 2021-02-23 | Palantir Technologies Inc. | System and method for news events detection and visualization |
| US9785773B2 (en) | 2014-07-03 | 2017-10-10 | Palantir Technologies Inc. | Malware data item analysis |
| US9021260B1 (en) | 2014-07-03 | 2015-04-28 | Palantir Technologies Inc. | Malware data item analysis |
| US9880696B2 (en) | 2014-09-03 | 2018-01-30 | Palantir Technologies Inc. | System for providing dynamic linked panels in user interface |
| US10866685B2 (en) | 2014-09-03 | 2020-12-15 | Palantir Technologies Inc. | System for providing dynamic linked panels in user interface |
| US9454281B2 (en) | 2014-09-03 | 2016-09-27 | Palantir Technologies Inc. | System for providing dynamic linked panels in user interface |
| US12204527B2 (en) | 2014-09-03 | 2025-01-21 | Palantir Technologies Inc. | System for providing dynamic linked panels in user interface |
| US9767172B2 (en) | 2014-10-03 | 2017-09-19 | Palantir Technologies Inc. | Data aggregation and analysis system |
| US10360702B2 (en) | 2014-10-03 | 2019-07-23 | Palantir Technologies Inc. | Time-series analysis system |
| US9501851B2 (en) | 2014-10-03 | 2016-11-22 | Palantir Technologies Inc. | Time-series analysis system |
| US10664490B2 (en) | 2014-10-03 | 2020-05-26 | Palantir Technologies Inc. | Data aggregation and analysis system |
| US11004244B2 (en) | 2014-10-03 | 2021-05-11 | Palantir Technologies Inc. | Time-series analysis system |
| US10437450B2 (en) | 2014-10-06 | 2019-10-08 | Palantir Technologies Inc. | Presentation of multivariate data on a graphical user interface of a computing system |
| US9785328B2 (en) | 2014-10-06 | 2017-10-10 | Palantir Technologies Inc. | Presentation of multivariate data on a graphical user interface of a computing system |
| US11275753B2 (en) | 2014-10-16 | 2022-03-15 | Palantir Technologies Inc. | Schematic and database linking system |
| US9984133B2 (en) | 2014-10-16 | 2018-05-29 | Palantir Technologies Inc. | Schematic and database linking system |
| US10191926B2 (en) | 2014-11-05 | 2019-01-29 | Palantir Technologies, Inc. | Universal data pipeline |
| US10853338B2 (en) | 2014-11-05 | 2020-12-01 | Palantir Technologies Inc. | Universal data pipeline |
| US9946738B2 (en) | 2014-11-05 | 2018-04-17 | Palantir Technologies, Inc. | Universal data pipeline |
| US10728277B2 (en) | 2014-11-06 | 2020-07-28 | Palantir Technologies Inc. | Malicious software detection in a computing system |
| US9558352B1 (en) | 2014-11-06 | 2017-01-31 | Palantir Technologies Inc. | Malicious software detection in a computing system |
| US9043894B1 (en) | 2014-11-06 | 2015-05-26 | Palantir Technologies Inc. | Malicious software detection in a computing system |
| US10135863B2 (en) | 2014-11-06 | 2018-11-20 | Palantir Technologies Inc. | Malicious software detection in a computing system |
| US9904456B2 (en)* | 2014-12-02 | 2018-02-27 | Business Objects Software Ltd. | Gesture-based visualization of data grid on mobile device |
| US20160154575A1 (en)* | 2014-12-02 | 2016-06-02 | Yingyu Xie | Gesture-Based Visualization of Data Grid on Mobile Device |
| US9898528B2 (en) | 2014-12-22 | 2018-02-20 | Palantir Technologies Inc. | Concept indexing among database of documents using machine learning techniques |
| US9367872B1 (en) | 2014-12-22 | 2016-06-14 | Palantir Technologies Inc. | Systems and user interfaces for dynamic and interactive investigation of bad actor behavior based on automatic clustering of related data in various data structures |
| US9589299B2 (en) | 2014-12-22 | 2017-03-07 | Palantir Technologies Inc. | Systems and user interfaces for dynamic and interactive investigation of bad actor behavior based on automatic clustering of related data in various data structures |
| US10552994B2 (en) | 2014-12-22 | 2020-02-04 | Palantir Technologies Inc. | Systems and interactive user interfaces for dynamic retrieval, analysis, and triage of data items |
| US10447712B2 (en) | 2014-12-22 | 2019-10-15 | Palantir Technologies Inc. | Systems and user interfaces for dynamic and interactive investigation of bad actor behavior based on automatic clustering of related data in various data structures |
| US10157200B2 (en) | 2014-12-29 | 2018-12-18 | Palantir Technologies Inc. | Interactive user interface for dynamic data analysis exploration and query processing |
| US10127021B1 (en) | 2014-12-29 | 2018-11-13 | Palantir Technologies Inc. | Storing logical units of program code generated using a dynamic programming notebook user interface |
| US9335911B1 (en) | 2014-12-29 | 2016-05-10 | Palantir Technologies Inc. | Interactive user interface for dynamic data analysis exploration and query processing |
| US10838697B2 (en) | 2014-12-29 | 2020-11-17 | Palantir Technologies Inc. | Storing logical units of program code generated using a dynamic programming notebook user interface |
| US9817563B1 (en) | 2014-12-29 | 2017-11-14 | Palantir Technologies Inc. | System and method of generating data points from one or more data stores of data items for chart creation and manipulation |
| US10552998B2 (en) | 2014-12-29 | 2020-02-04 | Palantir Technologies Inc. | System and method of generating data points from one or more data stores of data items for chart creation and manipulation |
| US9870205B1 (en) | 2014-12-29 | 2018-01-16 | Palantir Technologies Inc. | Storing logical units of program code generated using a dynamic programming notebook user interface |
| US9870389B2 (en) | 2014-12-29 | 2018-01-16 | Palantir Technologies Inc. | Interactive user interface for dynamic data analysis exploration and query processing |
| US11030581B2 (en) | 2014-12-31 | 2021-06-08 | Palantir Technologies Inc. | Medical claims lead summary report generation |
| US10372879B2 (en) | 2014-12-31 | 2019-08-06 | Palantir Technologies Inc. | Medical claims lead summary report generation |
| US10474326B2 (en) | 2015-02-25 | 2019-11-12 | Palantir Technologies Inc. | Systems and methods for organizing and identifying documents via hierarchies and dimensions of tags |
| US9727560B2 (en) | 2015-02-25 | 2017-08-08 | Palantir Technologies Inc. | Systems and methods for organizing and identifying documents via hierarchies and dimensions of tags |
| US10459619B2 (en) | 2015-03-16 | 2019-10-29 | Palantir Technologies Inc. | Interactive user interfaces for location-based data analysis |
| US12147657B2 (en) | 2015-03-16 | 2024-11-19 | Palantir Technologies Inc. | Interactive user interfaces for location-based data analysis |
| US9891808B2 (en) | 2015-03-16 | 2018-02-13 | Palantir Technologies Inc. | Interactive user interfaces for location-based data analysis |
| US9886467B2 (en) | 2015-03-19 | 2018-02-06 | Plantir Technologies Inc. | System and method for comparing and visualizing data entities and data entity series |
| US9661012B2 (en) | 2015-07-23 | 2017-05-23 | Palantir Technologies Inc. | Systems and methods for identifying information related to payment card breaches |
| US9392008B1 (en) | 2015-07-23 | 2016-07-12 | Palantir Technologies Inc. | Systems and methods for identifying information related to payment card breaches |
| US10223748B2 (en) | 2015-07-30 | 2019-03-05 | Palantir Technologies Inc. | Systems and user interfaces for holistic, data-driven investigation of bad actor behavior based on clustering and scoring of related data |
| US9454785B1 (en) | 2015-07-30 | 2016-09-27 | Palantir Technologies Inc. | Systems and user interfaces for holistic, data-driven investigation of bad actor behavior based on clustering and scoring of related data |
| US11501369B2 (en) | 2015-07-30 | 2022-11-15 | Palantir Technologies Inc. | Systems and user interfaces for holistic, data-driven investigation of bad actor behavior based on clustering and scoring of related data |
| US9996595B2 (en) | 2015-08-03 | 2018-06-12 | Palantir Technologies, Inc. | Providing full data provenance visualization for versioned datasets |
| US10484407B2 (en) | 2015-08-06 | 2019-11-19 | Palantir Technologies Inc. | Systems, methods, user interfaces, and computer-readable media for investigating potential malicious communications |
| US10290147B2 (en) | 2015-08-11 | 2019-05-14 | Microsoft Technology Licensing, Llc | Using perspective to visualize data |
| US10489391B1 (en) | 2015-08-17 | 2019-11-26 | Palantir Technologies Inc. | Systems and methods for grouping and enriching data items accessed from one or more databases for presentation in a user interface |
| US10444941B2 (en) | 2015-08-17 | 2019-10-15 | Palantir Technologies Inc. | Interactive geospatial map |
| US10444940B2 (en) | 2015-08-17 | 2019-10-15 | Palantir Technologies Inc. | Interactive geospatial map |
| US10102369B2 (en) | 2015-08-19 | 2018-10-16 | Palantir Technologies Inc. | Checkout system executable code monitoring, and user account compromise determination system |
| US10922404B2 (en) | 2015-08-19 | 2021-02-16 | Palantir Technologies Inc. | Checkout system executable code monitoring, and user account compromise determination system |
| US10853378B1 (en) | 2015-08-25 | 2020-12-01 | Palantir Technologies Inc. | Electronic note management via a connected entity graph |
| US11150917B2 (en) | 2015-08-26 | 2021-10-19 | Palantir Technologies Inc. | System for data aggregation and analysis of data from a plurality of data sources |
| US11934847B2 (en) | 2015-08-26 | 2024-03-19 | Palantir Technologies Inc. | System for data aggregation and analysis of data from a plurality of data sources |
| US10706434B1 (en) | 2015-09-01 | 2020-07-07 | Palantir Technologies Inc. | Methods and systems for determining location information |
| US11080296B2 (en) | 2015-09-09 | 2021-08-03 | Palantir Technologies Inc. | Domain-specific language for dataset transformations |
| US9965534B2 (en) | 2015-09-09 | 2018-05-08 | Palantir Technologies, Inc. | Domain-specific language for dataset transformations |
| US9576015B1 (en) | 2015-09-09 | 2017-02-21 | Palantir Technologies, Inc. | Domain-specific language for dataset transformations |
| US10296617B1 (en) | 2015-10-05 | 2019-05-21 | Palantir Technologies Inc. | Searches of highly structured data |
| US10650560B2 (en) | 2015-10-21 | 2020-05-12 | Palantir Technologies Inc. | Generating graphical representations of event participation flow |
| US10192333B1 (en) | 2015-10-21 | 2019-01-29 | Palantir Technologies Inc. | Generating graphical representations of event participation flow |
| US10613722B1 (en) | 2015-10-27 | 2020-04-07 | Palantir Technologies Inc. | Distorting a graph on a computer display to improve the computer's ability to display the graph to, and interact with, a user |
| US10572487B1 (en) | 2015-10-30 | 2020-02-25 | Palantir Technologies Inc. | Periodic database search manager for multiple data sources |
| US20170143222A1 (en)* | 2015-11-23 | 2017-05-25 | Medicomp, Inc. | System and method for providing a gradient atrial fibrillation graph |
| US20190000335A1 (en)* | 2015-11-23 | 2019-01-03 | Medicomp, Inc | Heart monitor with diagnostic display and associated methods |
| US10678860B1 (en) | 2015-12-17 | 2020-06-09 | Palantir Technologies, Inc. | Automatic generation of composite datasets based on hierarchical fields |
| US10540061B2 (en) | 2015-12-29 | 2020-01-21 | Palantir Technologies Inc. | Systems and interactive user interfaces for automatic generation of temporal representation of data objects |
| US10970292B1 (en) | 2015-12-29 | 2021-04-06 | Palantir Technologies Inc. | Graph based resolution of matching items in data sources |
| US9823818B1 (en) | 2015-12-29 | 2017-11-21 | Palantir Technologies Inc. | Systems and interactive user interfaces for automatic generation of temporal representation of data objects |
| US10268735B1 (en) | 2015-12-29 | 2019-04-23 | Palantir Technologies Inc. | Graph based resolution of matching items in data sources |
| US10437612B1 (en) | 2015-12-30 | 2019-10-08 | Palantir Technologies Inc. | Composite graphical interface with shareable data-objects |
| US10698938B2 (en) | 2016-03-18 | 2020-06-30 | Palantir Technologies Inc. | Systems and methods for organizing and identifying documents via hierarchies and dimensions of tags |
| US10650558B2 (en) | 2016-04-04 | 2020-05-12 | Palantir Technologies Inc. | Techniques for displaying stack graphs |
| US11106638B2 (en) | 2016-06-13 | 2021-08-31 | Palantir Technologies Inc. | Data revision control in large-scale data analytic systems |
| US10007674B2 (en) | 2016-06-13 | 2018-06-26 | Palantir Technologies Inc. | Data revision control in large-scale data analytic systems |
| US10719188B2 (en) | 2016-07-21 | 2020-07-21 | Palantir Technologies Inc. | Cached database and synchronization system for providing dynamic linked panels in user interface |
| US12204845B2 (en) | 2016-07-21 | 2025-01-21 | Palantir Technologies Inc. | Cached database and synchronization system for providing dynamic linked panels in user interface |
| US10324609B2 (en) | 2016-07-21 | 2019-06-18 | Palantir Technologies Inc. | System for providing dynamic linked panels in user interface |
| US10698594B2 (en) | 2016-07-21 | 2020-06-30 | Palantir Technologies Inc. | System for providing dynamic linked panels in user interface |
| US10437840B1 (en) | 2016-08-19 | 2019-10-08 | Palantir Technologies Inc. | Focused probabilistic entity resolution from multiple data sources |
| US9881066B1 (en) | 2016-08-31 | 2018-01-30 | Palantir Technologies, Inc. | Systems, methods, user interfaces and algorithms for performing database analysis and search of information involving structured and/or semi-structured data |
| US10740342B2 (en) | 2016-08-31 | 2020-08-11 | Palantir Technologies Inc. | Systems, methods, user interfaces and algorithms for performing database analysis and search of information involving structured and/or semi-structured data |
| US10318630B1 (en) | 2016-11-21 | 2019-06-11 | Palantir Technologies Inc. | Analysis of large bodies of textual data |
| US10552436B2 (en) | 2016-12-28 | 2020-02-04 | Palantir Technologies Inc. | Systems and methods for retrieving and processing data for display |
| US10460602B1 (en) | 2016-12-28 | 2019-10-29 | Palantir Technologies Inc. | Interactive vehicle information mapping system |
| US10475219B1 (en) | 2017-03-30 | 2019-11-12 | Palantir Technologies Inc. | Multidimensional arc chart for visual comparison |
| US11282246B2 (en) | 2017-03-30 | 2022-03-22 | Palantir Technologies Inc. | Multidimensional arc chart for visual comparison |
| US10803639B2 (en) | 2017-03-30 | 2020-10-13 | Palantir Technologies Inc. | Multidimensional arc chart for visual comparison |
| US10956406B2 (en) | 2017-06-12 | 2021-03-23 | Palantir Technologies Inc. | Propagated deletion of database records and derived data |
| US10403011B1 (en) | 2017-07-18 | 2019-09-03 | Palantir Technologies Inc. | Passing system with an interactive user interface |
| US12443336B2 (en) | 2017-10-13 | 2025-10-14 | Palantir Technologies Inc. | Interactive user interface for dynamically updating data and data analysis and query processing |
| US10929476B2 (en) | 2017-12-14 | 2021-02-23 | Palantir Technologies Inc. | Systems and methods for visualizing and analyzing multi-dimensional data |
| US11599369B1 (en) | 2018-03-08 | 2023-03-07 | Palantir Technologies Inc. | Graphical user interface configuration system |
| US10754822B1 (en) | 2018-04-18 | 2020-08-25 | Palantir Technologies Inc. | Systems and methods for ontology migration |
| US10885021B1 (en) | 2018-05-02 | 2021-01-05 | Palantir Technologies Inc. | Interactive interpreter and graphical user interface |
| US11698890B2 (en) | 2018-07-04 | 2023-07-11 | Monday.com Ltd. | System and method for generating a column-oriented data structure repository for columns of single data types |
| US12353419B2 (en) | 2018-07-23 | 2025-07-08 | Monday.com Ltd. | System and method for generating a tagged column-oriented data structure |
| US10657321B2 (en)* | 2018-09-11 | 2020-05-19 | Apple Inc. | Exploded-range references |
| US20200081968A1 (en)* | 2018-09-11 | 2020-03-12 | Apple Inc. | Exploded-range references |
| US10685463B1 (en)* | 2019-02-26 | 2020-06-16 | Baker Hughes Oilfield Operations Llc | Systematic scenario visualization |
| US10956651B1 (en)* | 2019-09-19 | 2021-03-23 | International Business Machines Corporation | Data table display adjustment |
| US12353678B2 (en) | 2019-10-17 | 2025-07-08 | Palantir Technologies Inc. | Object-centric data analysis system and associated graphical user interfaces |
| US11526661B2 (en) | 2019-11-18 | 2022-12-13 | Monday.com Ltd. | Digital processing systems and methods for integrated communications module in tables of collaborative work systems |
| US12367011B2 (en) | 2019-11-18 | 2025-07-22 | Monday.com Ltd. | Digital processing systems and methods for cell animations within tables of collaborative work systems |
| US12141722B2 (en) | 2019-11-18 | 2024-11-12 | Monday.Com | Digital processing systems and methods for mechanisms for sharing responsibility in collaborative work systems |
| US11507738B2 (en) | 2019-11-18 | 2022-11-22 | Monday.Com | Digital processing systems and methods for automatic updates in collaborative work systems |
| US11727323B2 (en) | 2019-11-18 | 2023-08-15 | Monday.Com | Digital processing systems and methods for dual permission access in tables of collaborative work systems |
| US12014138B2 (en) | 2020-01-15 | 2024-06-18 | Monday.com Ltd. | Digital processing systems and methods for graphical dynamic table gauges in collaborative work systems |
| WO2021144656A1 (en)* | 2020-01-15 | 2021-07-22 | Monday.Com | Digital processing systems and methods for graphical dynamic table gauges in collaborative work systems |
| US12020210B2 (en) | 2020-02-12 | 2024-06-25 | Monday.com Ltd. | Digital processing systems and methods for table information displayed in and accessible via calendar in collaborative work systems |
| US11755827B2 (en) | 2020-05-01 | 2023-09-12 | Monday.com Ltd. | Digital processing systems and methods for stripping data from workflows to create generic templates in collaborative work systems |
| US11301811B2 (en) | 2020-05-01 | 2022-04-12 | Monday.com Ltd. | Digital processing systems and methods for self-monitoring software recommending more efficient tool usage in collaborative work systems |
| US11348070B2 (en) | 2020-05-01 | 2022-05-31 | Monday.com Ltd. | Digital processing systems and methods for context based analysis during generation of sub-board templates in collaborative work systems |
| US11410128B2 (en) | 2020-05-01 | 2022-08-09 | Monday.com Ltd. | Digital processing systems and methods for recommendation engine for automations in collaborative work systems |
| US11475408B2 (en) | 2020-05-01 | 2022-10-18 | Monday.com Ltd. | Digital processing systems and methods for automation troubleshooting tool in collaborative work systems |
| US11675972B2 (en) | 2020-05-01 | 2023-06-13 | Monday.com Ltd. | Digital processing systems and methods for digital workflow system dispensing physical reward in collaborative work systems |
| US11501255B2 (en) | 2020-05-01 | 2022-11-15 | Monday.com Ltd. | Digital processing systems and methods for virtual file-based electronic white board in collaborative work systems |
| US11301814B2 (en) | 2020-05-01 | 2022-04-12 | Monday.com Ltd. | Digital processing systems and methods for column automation recommendation engine in collaborative work systems |
| US11829953B1 (en) | 2020-05-01 | 2023-11-28 | Monday.com Ltd. | Digital processing systems and methods for managing sprints using linked electronic boards |
| US11886804B2 (en) | 2020-05-01 | 2024-01-30 | Monday.com Ltd. | Digital processing systems and methods for self-configuring automation packages in collaborative work systems |
| US11531966B2 (en) | 2020-05-01 | 2022-12-20 | Monday.com Ltd. | Digital processing systems and methods for digital sound simulation system |
| US11537991B2 (en) | 2020-05-01 | 2022-12-27 | Monday.com Ltd. | Digital processing systems and methods for pre-populating templates in a tablature system |
| US11301813B2 (en) | 2020-05-01 | 2022-04-12 | Monday.com Ltd. | Digital processing systems and methods for hierarchical table structure with conditional linking rules in collaborative work systems |
| US11907653B2 (en) | 2020-05-01 | 2024-02-20 | Monday.com Ltd. | Digital processing systems and methods for network map visualizations of team interactions in collaborative work systems |
| US11301812B2 (en) | 2020-05-01 | 2022-04-12 | Monday.com Ltd. | Digital processing systems and methods for data visualization extrapolation engine for widget 360 in collaborative work systems |
| US11687706B2 (en) | 2020-05-01 | 2023-06-27 | Monday.com Ltd. | Digital processing systems and methods for automatic display of value types based on custom heading in collaborative work systems |
| US11954428B2 (en) | 2020-05-01 | 2024-04-09 | Monday.com Ltd. | Digital processing systems and methods for accessing another's display via social layer interactions in collaborative work systems |
| US11587039B2 (en) | 2020-05-01 | 2023-02-21 | Monday.com Ltd. | Digital processing systems and methods for communications triggering table entries in collaborative work systems |
| US11928315B2 (en) | 2021-01-14 | 2024-03-12 | Monday.com Ltd. | Digital processing systems and methods for tagging extraction engine for generating new documents in collaborative work systems |
| US11893213B2 (en) | 2021-01-14 | 2024-02-06 | Monday.com Ltd. | Digital processing systems and methods for embedded live application in-line in a word processing document in collaborative work systems |
| US11531452B2 (en) | 2021-01-14 | 2022-12-20 | Monday.com Ltd. | Digital processing systems and methods for group-based document edit tracking in collaborative work systems |
| US20220222361A1 (en)* | 2021-01-14 | 2022-07-14 | Monday.com Ltd. | Digital processing systems and methods for granular permission system for electronic documents in collaborative work systems |
| US11782582B2 (en) | 2021-01-14 | 2023-10-10 | Monday.com Ltd. | Digital processing systems and methods for detectable codes in presentation enabling targeted feedback in collaborative work systems |
| US11481288B2 (en) | 2021-01-14 | 2022-10-25 | Monday.com Ltd. | Digital processing systems and methods for historical review of specific document edits in collaborative work systems |
| US11687216B2 (en) | 2021-01-14 | 2023-06-27 | Monday.com Ltd. | Digital processing systems and methods for dynamically updating documents with data from linked files in collaborative work systems |
| US11726640B2 (en)* | 2021-01-14 | 2023-08-15 | Monday.com Ltd. | Digital processing systems and methods for granular permission system for electronic documents in collaborative work systems |
| US20230316400A1 (en)* | 2021-06-17 | 2023-10-05 | Futu Network Technology (shenzhen) Co., Ltd. | Data comparison method and apparatus, device and storage medium |
| US12056664B2 (en) | 2021-08-17 | 2024-08-06 | Monday.com Ltd. | Digital processing systems and methods for external events trigger automatic text-based document alterations in collaborative work systems |
| US12105948B2 (en) | 2021-10-29 | 2024-10-01 | Monday.com Ltd. | Digital processing systems and methods for display navigation mini maps |
| US11741071B1 (en) | 2022-12-28 | 2023-08-29 | Monday.com Ltd. | Digital processing systems and methods for navigating and viewing displayed content |
| US11886683B1 (en) | 2022-12-30 | 2024-01-30 | Monday.com Ltd | Digital processing systems and methods for presenting board graphics |
| US11893381B1 (en) | 2023-02-21 | 2024-02-06 | Monday.com Ltd | Digital processing systems and methods for reducing file bundle sizes |
| US12379835B2 (en) | 2023-06-13 | 2025-08-05 | Monday.com Ltd. | Digital processing systems and methods for enhanced data representation |
| US12430825B2 (en) | 2023-06-13 | 2025-09-30 | Monday.com Ltd. | Digital processing systems and methods for enhanced data representation |
| US12197560B1 (en) | 2023-11-28 | 2025-01-14 | Monday.com Ltd. | Digital processing systems and methods for managing workflows |
| US12260190B1 (en) | 2023-11-28 | 2025-03-25 | Monday.com Ltd. | Digital processing systems and methods for managing workflows |
| US12271849B1 (en) | 2023-11-28 | 2025-04-08 | Monday.com Ltd. | Digital processing systems and methods for managing workflows |
| US12314882B1 (en) | 2023-11-28 | 2025-05-27 | Monday.com Ltd. | Digital processing systems and methods for managing workflows |
| US12175240B1 (en) | 2023-11-28 | 2024-12-24 | Monday.com Ltd. | Digital processing systems and methods for facilitating the development and implementation of applications in conjunction with a serverless environment |
| US12169802B1 (en) | 2023-11-28 | 2024-12-17 | Monday.com Ltd. | Digital processing systems and methods for managing workflows |
| US12118401B1 (en) | 2023-11-28 | 2024-10-15 | Monday.com Ltd. | Digital processing systems and methods for facilitating the development and implementation of applications in conjunction with a serverless environment |
| US12056255B1 (en) | 2023-11-28 | 2024-08-06 | Monday.com Ltd. | Digital processing systems and methods for facilitating the development and implementation of applications in conjunction with a serverless environment |
Also Published As
| Publication number | Publication date |
|---|---|
| US5883635A (en) | 1999-03-16 |
| US6085202A (en) | 2000-07-04 |
| US5880742A (en) | 1999-03-09 |
Similar Documents
| Publication | Publication Date | Title |
|---|---|---|
| US5632009A (en) | Method and system for producing a table image showing indirect data representations | |
| US5546529A (en) | Method and apparatus for visualization of database search results | |
| US5341466A (en) | Fractal computer user centerface with zooming capability | |
| Card et al. | The structure of the information visualization design space | |
| US5339390A (en) | Operating a processor to display stretched continuation of a workspace | |
| CA2124604C (en) | Method and apparatus for operating on an object-based model data structure to produce a second image in the spatial context of a first image | |
| US5652851A (en) | User interface technique for producing a second image in the spatial context of a first image using a model-based operation | |
| US5467441A (en) | Method for operating on objects in a first image using an object-based model data structure to produce a second contextual image having added, replaced or deleted objects | |
| US5729704A (en) | User-directed method for operating on an object-based model data structure through a second contextual image | |
| CN105339931B (en) | Method and apparatus for processing data containers | |
| Fekete et al. | Interactive information visualization of a million items | |
| Van Wijk et al. | Cushion treemaps: Visualization of hierarchical information | |
| US5479603A (en) | Method and apparatus for producing a composite second image in the spatial context of a first image | |
| US5848425A (en) | System and method for displaying alphanumeric data in a three dimensional grid | |
| EP0694878B1 (en) | A method and apparatus for increasing the displayed detail of a tree structure | |
| JP4122234B2 (en) | Data analysis system and data analysis method | |
| US6253218B1 (en) | Three dimensional data display method utilizing view point tracing and reduced document images | |
| JP2642021B2 (en) | Display systems | |
| Bederson et al. | Implementing a zooming user interface: experience building pad++ | |
| Ward et al. | Interaction spaces in data and information visualization. | |
| Maguire | A review of human factors guidelines and techniques for the design of graphical human-computer interfaces | |
| Steed | Interactive data visualization | |
| Marks et al. | ActiveGraph: A digital library visualization tool | |
| CA2128578C (en) | Method and system for producing a table image having focus and context areas showing direct and indirect data representations | |
| EP0644500B1 (en) | Method and system for producing a table image having focus and context areas showing direct and indirect data representations |
Legal Events
| Date | Code | Title | Description |
|---|---|---|---|
| STCF | Information on status: patent grant | Free format text:PATENTED CASE | |
| FPAY | Fee payment | Year of fee payment:4 | |
| AS | Assignment | Owner name:INXIGHT SOFTWARE, INC., CALIFORNIA Free format text:ASSIGNMENT OF ASSIGNORS INTEREST;ASSIGNOR:XEROX CORPORATION;REEL/FRAME:011653/0024 Effective date:20010212 | |
| AS | Assignment | Owner name:VANTAGEPOINT VENTURE PARTNERS III, L.P., CALIFORNI Free format text:SECURITY AGREEMENT;ASSIGNOR:INXIGHT SOFTWARE, INC.;REEL/FRAME:014926/0130 Effective date:20040728 Owner name:VANTAGEPOINT VENTURE PARTNERS III (Q), L.P., CALIF Free format text:SECURITY AGREEMENT;ASSIGNOR:INXIGHT SOFTWARE, INC.;REEL/FRAME:014926/0130 Effective date:20040728 Owner name:VANTAGEPOINT VENTURE PARTNERS IV (Q), L.P., CALIFO Free format text:SECURITY AGREEMENT;ASSIGNOR:INXIGHT SOFTWARE, INC.;REEL/FRAME:014926/0130 Effective date:20040728 Owner name:VANTAGEPOINT VENTURE PARTNERS IV, L.P., CALIFORNIA Free format text:SECURITY AGREEMENT;ASSIGNOR:INXIGHT SOFTWARE, INC.;REEL/FRAME:014926/0130 Effective date:20040728 Owner name:VANTAGEPOINT VENTURE PARTNERS IV PRINCIPALS FUND, Free format text:SECURITY AGREEMENT;ASSIGNOR:INXIGHT SOFTWARE, INC.;REEL/FRAME:014926/0130 Effective date:20040728 Owner name:DRESDNER KLEINWORT WASSERSTEIN PARTNERSHIP 2001 LP Free format text:SECURITY AGREEMENT;ASSIGNOR:INXIGHT SOFTWARE, INC.;REEL/FRAME:014926/0130 Effective date:20040728 Owner name:REED ELSEVIER VENTURES 2002 PARTNERSHIP L.P., NEW Free format text:SECURITY AGREEMENT;ASSIGNOR:INXIGHT SOFTWARE, INC.;REEL/FRAME:014926/0130 Effective date:20040728 Owner name:ABS VENTURES VIII L.P, MASSACHUSETTS Free format text:SECURITY AGREEMENT;ASSIGNOR:INXIGHT SOFTWARE, INC.;REEL/FRAME:014926/0130 Effective date:20040728 | |
| FPAY | Fee payment | Year of fee payment:8 | |
| FEPP | Fee payment procedure | Free format text:PAYOR NUMBER ASSIGNED (ORIGINAL EVENT CODE: ASPN); ENTITY STATUS OF PATENT OWNER: LARGE ENTITY | |
| AS | Assignment | Owner name:BUSINESS OBJECTS AMERICAS, CALIFORNIA Free format text:MERGER;ASSIGNOR:INXIGHT SOFTWARE, INC.;REEL/FRAME:020487/0541 Effective date:20071214 Owner name:BUSINESS OBJECTS AMERICAS,CALIFORNIA Free format text:MERGER;ASSIGNOR:INXIGHT SOFTWARE, INC.;REEL/FRAME:020487/0541 Effective date:20071214 | |
| FPAY | Fee payment | Year of fee payment:12 | |
| AS | Assignment | Owner name:SAP AMERICA, INC., PENNSYLVANIA Free format text:MERGER;ASSIGNOR:BUSINESS OBJECTS AMERICAS;REEL/FRAME:025484/0553 Effective date:20100701 |