US5606164A - Method and apparatus for biological fluid analyte concentration measurement using generalized distance outlier detection - Google Patents
Method and apparatus for biological fluid analyte concentration measurement using generalized distance outlier detectionDownload PDFInfo
- Publication number
- US5606164A US5606164AUS08/587,017US58701796AUS5606164AUS 5606164 AUS5606164 AUS 5606164AUS 58701796 AUS58701796 AUS 58701796AUS 5606164 AUS5606164 AUS 5606164A
- Authority
- US
- United States
- Prior art keywords
- calibration
- data
- sample
- samples
- radiation
- Prior art date
- Legal status (The legal status is an assumption and is not a legal conclusion. Google has not performed a legal analysis and makes no representation as to the accuracy of the status listed.)
- Expired - Lifetime
Links
- 238000000034methodMethods0.000titleclaimsabstractdescription93
- 239000012491analyteSubstances0.000titleclaimsabstractdescription57
- 238000005259measurementMethods0.000titleclaimsabstractdescription40
- 239000013060biological fluidSubstances0.000titleclaimsabstractdescription36
- 238000013450outlier detectionMethods0.000titledescription9
- 230000005855radiationEffects0.000claimsabstractdescription45
- 238000012628principal component regressionMethods0.000claimsabstractdescription19
- 238000000513principal component analysisMethods0.000claimsabstractdescription13
- 238000013528artificial neural networkMethods0.000claimsabstractdescription8
- 238000012417linear regressionMethods0.000claimsabstractdescription6
- 238000004590computer programMethods0.000claimsabstractdescription5
- 239000011159matrix materialSubstances0.000claimsdescription54
- 239000013598vectorSubstances0.000claimsdescription38
- 230000003595spectral effectEffects0.000claimsdescription34
- 238000004422calculation algorithmMethods0.000claimsdescription17
- 238000011068loading methodMethods0.000claimsdescription17
- 238000005315distribution functionMethods0.000claimsdescription12
- 230000005670electromagnetic radiationEffects0.000claimsdescription11
- 238000012545processingMethods0.000claimsdescription10
- 238000001134F-testMethods0.000claimsdescription8
- 238000011156evaluationMethods0.000claimsdescription8
- 238000012937correctionMethods0.000claimsdescription4
- 230000003247decreasing effectEffects0.000claimsdescription4
- 238000009499grossingMethods0.000claimsdescription4
- 102000004169proteins and genesHuman genes0.000claimsdescription4
- 108090000623proteins and genesProteins0.000claimsdescription4
- 150000003626triacylglycerolsChemical group0.000claimsdescription4
- 230000005540biological transmissionEffects0.000claimsdescription3
- 239000003638chemical reducing agentSubstances0.000claims5
- 241000124008MammaliaSpecies0.000claims4
- 239000012530fluidSubstances0.000claims2
- 230000001678irradiating effectEffects0.000claims2
- 238000005303weighingMethods0.000claims1
- 238000004458analytical methodMethods0.000abstractdescription11
- 238000000354decomposition reactionMethods0.000abstractdescription4
- 230000009467reductionEffects0.000abstractdescription3
- 230000001360synchronised effectEffects0.000abstractdescription3
- 238000006722reduction reactionMethods0.000abstract1
- 239000000523sampleSubstances0.000description99
- WQZGKKKJIJFFOK-GASJEMHNSA-NGlucoseNatural productsOC[C@H]1OC(O)[C@H](O)[C@@H](O)[C@@H]1OWQZGKKKJIJFFOK-GASJEMHNSA-N0.000description22
- 210000004369bloodAnatomy0.000description22
- 239000008280bloodSubstances0.000description22
- 239000008103glucoseSubstances0.000description22
- 238000012360testing methodMethods0.000description14
- 238000010200validation analysisMethods0.000description11
- 238000002835absorbanceMethods0.000description10
- 230000000694effectsEffects0.000description6
- 238000002360preparation methodMethods0.000description6
- 238000000862absorption spectrumMethods0.000description5
- 238000002329infrared spectrumMethods0.000description5
- 230000002596correlated effectEffects0.000description4
- 238000013144data compressionMethods0.000description4
- 230000008569processEffects0.000description4
- 238000001228spectrumMethods0.000description4
- UFTFJSFQGQCHQW-UHFFFAOYSA-NtriforminChemical compoundO=COCC(OC=O)COC=OUFTFJSFQGQCHQW-UHFFFAOYSA-N0.000description4
- 238000010276constructionMethods0.000description3
- 238000002790cross-validationMethods0.000description3
- 230000001419dependent effectEffects0.000description3
- 238000010586diagramMethods0.000description3
- 230000006870functionEffects0.000description3
- 230000003287optical effectEffects0.000description3
- 230000004044responseEffects0.000description3
- 210000002966serumAnatomy0.000description3
- 238000010183spectrum analysisMethods0.000description3
- 238000012951RemeasurementMethods0.000description2
- 238000003556assayMethods0.000description2
- HVYWMOMLDIMFJA-DPAQBDIFSA-NcholesterolChemical compoundC1C=C2C[C@@H](O)CC[C@]2(C)[C@@H]2[C@@H]1[C@@H]1CC[C@H]([C@H](C)CCCC(C)C)[C@@]1(C)CC2HVYWMOMLDIMFJA-DPAQBDIFSA-N0.000description2
- 230000007423decreaseEffects0.000description2
- 238000010790dilutionMethods0.000description2
- 239000012895dilutionSubstances0.000description2
- 238000007689inspectionMethods0.000description2
- 238000000691measurement methodMethods0.000description2
- 238000012986modificationMethods0.000description2
- 230000004048modificationEffects0.000description2
- 239000013074reference sampleSubstances0.000description2
- 238000011160researchMethods0.000description2
- 238000004611spectroscopical analysisMethods0.000description2
- 238000012549trainingMethods0.000description2
- 238000011179visual inspectionMethods0.000description2
- 102000004506Blood ProteinsHuman genes0.000description1
- 108010017384Blood ProteinsProteins0.000description1
- 206010053567CoagulopathiesDiseases0.000description1
- 102000008946FibrinogenHuman genes0.000description1
- 108010049003FibrinogenProteins0.000description1
- FAPWRFPIFSIZLT-UHFFFAOYSA-MSodium chlorideChemical compound[Na+].[Cl-]FAPWRFPIFSIZLT-UHFFFAOYSA-M0.000description1
- 230000008901benefitEffects0.000description1
- 230000015572biosynthetic processEffects0.000description1
- 238000004364calculation methodMethods0.000description1
- 238000005119centrifugationMethods0.000description1
- 235000012000cholesterolNutrition0.000description1
- 230000035602clottingEffects0.000description1
- 238000007405data analysisMethods0.000description1
- 230000000593degrading effectEffects0.000description1
- 230000001627detrimental effectEffects0.000description1
- 229940012952fibrinogenDrugs0.000description1
- 238000001727in vivoMethods0.000description1
- 238000012804iterative processMethods0.000description1
- 239000000463materialSubstances0.000description1
- 238000005457optimizationMethods0.000description1
- 238000010238partial least squares regressionMethods0.000description1
- 238000007781pre-processingMethods0.000description1
- 238000004445quantitative analysisMethods0.000description1
- 238000012950reanalysisMethods0.000description1
- 230000035945sensitivityEffects0.000description1
- 230000009897systematic effectEffects0.000description1
Images


Classifications
- G—PHYSICS
- G01—MEASURING; TESTING
- G01N—INVESTIGATING OR ANALYSING MATERIALS BY DETERMINING THEIR CHEMICAL OR PHYSICAL PROPERTIES
- G01N21/00—Investigating or analysing materials by the use of optical means, i.e. using sub-millimetre waves, infrared, visible or ultraviolet light
- G01N21/17—Systems in which incident light is modified in accordance with the properties of the material investigated
- G01N21/25—Colour; Spectral properties, i.e. comparison of effect of material on the light at two or more different wavelengths or wavelength bands
- G01N21/31—Investigating relative effect of material at wavelengths characteristic of specific elements or molecules, e.g. atomic absorption spectrometry
- G01N21/35—Investigating relative effect of material at wavelengths characteristic of specific elements or molecules, e.g. atomic absorption spectrometry using infrared light
- G01N21/359—Investigating relative effect of material at wavelengths characteristic of specific elements or molecules, e.g. atomic absorption spectrometry using infrared light using near infrared light
- G—PHYSICS
- G01—MEASURING; TESTING
- G01N—INVESTIGATING OR ANALYSING MATERIALS BY DETERMINING THEIR CHEMICAL OR PHYSICAL PROPERTIES
- G01N21/00—Investigating or analysing materials by the use of optical means, i.e. using sub-millimetre waves, infrared, visible or ultraviolet light
- G01N21/17—Systems in which incident light is modified in accordance with the properties of the material investigated
- G01N21/25—Colour; Spectral properties, i.e. comparison of effect of material on the light at two or more different wavelengths or wavelength bands
- G01N21/27—Colour; Spectral properties, i.e. comparison of effect of material on the light at two or more different wavelengths or wavelength bands using photo-electric detection ; circuits for computing concentration
- G01N21/274—Calibration, base line adjustment, drift correction
- G—PHYSICS
- G01—MEASURING; TESTING
- G01J—MEASUREMENT OF INTENSITY, VELOCITY, SPECTRAL CONTENT, POLARISATION, PHASE OR PULSE CHARACTERISTICS OF INFRARED, VISIBLE OR ULTRAVIOLET LIGHT; COLORIMETRY; RADIATION PYROMETRY
- G01J3/00—Spectrometry; Spectrophotometry; Monochromators; Measuring colours
- G01J3/28—Investigating the spectrum
- G01J2003/2866—Markers; Calibrating of scan
Definitions
- Spectral analysisis widely used in identifying and quantitating analytes in a sample of a material.
- One form of spectral analysismeasures the amount of electromagnetic radiation which is absorbed by a sample.
- an infrared spectrophotometerdirects a beam of infrared radiation towards a sample, and then measures the amount of radiation absorbed by the sample over a range of infrared wavelengths.
- An absorbance spectrummay then be plotted which depicts sample absorbance as a function of wavelength.
- the shape of the absorbance spectrumincluding relative magnitudes and wavelengths of peak absorbances, serves as a characteristic ⁇ fingerprint ⁇ of particular analytes in the sample.
- the absorbance spectrummay furnish information useful in identifying analytes present in a sample.
- the absorbance spectrumcan also be of use for quantitative analysis of the concentration of individual analytes in the sample.
- the absorbance of an analyte in a sampleis approximately proportional to the concentration of the analyte in the sample.
- the concentration of the analytemay be determined by comparing the absorbance of the sample to the absorbance of a reference sample at the same wavelengths, where the reference sample contains a known concentration of the analyte.
- a first source of erroris related to sample preparation.
- Blood serum samplesrequire a great deal of preparation before chemometric analysis. During this preparation, a number of factors can affect the sample. For example, the amount of time that blood samples are allowed to clot may affect sample continuity in terms of fibrinogen content. The level of clotting also impacts the quality of centrifugation and ultimately the decanting of serum from cells. Samples prepared for clinical assays determine the quality of the data used for reference and calibration, so that great care must be exercised with the samples since this data will ultimately define the limit of prediction abilities.
- a second source of errormay result from the spectral measurement process.
- the use of a flowcell for sample containment during data acquisitionis susceptible to problems such as bubbles in the optical path as well as dilution effects from reference saline solution carryover. These dilution effects are usually negligible, but bubbles in the optical path are not infrequent and have a severe impact on data quality.
- errors produced by mechanical or electronic problems occurring within the analysis instrumentationcan have important effects on data quality.
- a third source of erroris also related to the reference tests. Errors due to out-of-specification instrumental controls and low sample volume during clinical assays have similar effects to errors related to sample preparation, described above.
- a fourth source of errorand probably the most difficult to identify and control, relates to sources of the samples, that is, to the individuals providing the biological fluids.
- a sample taken from an individualmay at first seem to be quite unique with respect to a previously sampled population, but may in fact be an ordinary sample when a larger sample population is considered, that is, a putative unique sample may be only an artifact of undersampling.
- outliers from a data setcan be accomplished in a qualitative and subjective sense by graphical inspection of plotted data in those cases when the dimensionality is low, that is, where the number of data points associated with each measurement is small.
- outlier detectionmay be more quickly and efficiently be accomplished by a number of automatable procedures such as residual analysis.
- such proceduresare often subject to a number of errors, or at least subject to errors in interpretation, especially in the relatively high dimensional spaces that are typically associated with multifactorial chemometric analyses.
- chemometric applications for biological fluid analyte measurementrequire multiple measurements taken from a number of individual test subjects over a period of time.
- sample preparation and data acquisitionnatural variations in samples and unintended errors can diminish the accuracy of results. Further, these errors are magnified by the relatively small number of biological fluid samples that can economically be drawn and tested.
- Automated techniques for outlier detectionare necessary to assess the suitability of all acquired samples during both research phase and in final uses. The quality of data during clinical studies will define calibration models and the direction of subsequent research thrusts dependent upon results. In an end use, visual inspection of acquired data may or may not be possible. Even if inspection of the data is possible, independent objective methods of determination are needed which are not susceptible to subjective biases.
- the present inventionimproves the accuracy of biological fluid analyte concentration determination by identifying outlier values, and identifying and removing outliers from data before formation of a calibration model.
- the present inventionprovides a method and apparatus whereby the concentration of an analyte in a sample of a biological fluid may be investigated by spectral analysis of electromagnetic radiation applied to the sample, including collecting calibration data, analyzing the calibration data to identify and remove outliers using the calibration model, constructing a calibration model, collecting unknown sample data, analyzing the unknown sample data to identify and remove outliers, and predicting analyte concentration of non-outliers in the unknown sample data by using the calibration model.
- the analysis of the calibration data setmay include data pretreatment, data decomposition to remove redundant data, and identification and removal of outliers as having a low probability of class membership, using generalized distance methods.
- the construction of a calibration modelmay utilize principal component regression, partial least squares, multiple linear regression, or artificial neural networks, whereby the calibration data set may be reduced to significant factors using principal component analysis or partial least squares scores, enabling calculation of regression coefficients and artificial neural network weights.
- the unknown sample datamay be analyzed using data pretreatment, followed by projection into the space defined by the calibration model, and identification and removal of outliers in the unknown sample data as having a low probability of class membership.
- the prediction of analyte concentration of an unknown samplemay include projecting data from the unknown sample into the space defined by the calibration model, thereby enabling determination of the analyte concentration.
- a first embodiment of the apparatus of the present inventionincludes a pump into which a sample is introduced, the pump acting to circulate the sample through tubing to fill a flowcell, with the pump capable of both stopped flow and continuous flow operation.
- a sample compartment housing containing the flowcell and a detectoris temperature controlled by a temperature control unit.
- Light from relatively broad bandwidth near-infrared sourceis directed through a chopper wheel, and the chopper wheel is synchronized by a chopper synchronization unit with respect to the detector, facilitating the apparatus of the present invention to make both light and dark measurements to substantially eliminate electronic noise. Modulated light then passes through a monochrometer, allowing variance of the wavelength of radiation continuously over an appropriate range.
- the monochromatic lightpasses through the flowcell and strikes the detector, whereby the amount of light transmitted through the sample is measured.
- Measurement datais stored in a general purpose programmable computer having a general purpose microprocessor, available for further processing according to the present invention.
- the computermay also control operation of the pump, the temperature control unit, the chopper synchronization unit, the chopper wheel, and the monochrometer.
- light from the relatively broad bandwidth light sourceis directed through the chopper wheel, and thereafter modulated light is passed through a filter wheel, whereby discrete wavelengths of radiation may be selected and transmitted to the flowcell.
- a plurality of narrow bandwidth near-infrared sourcessuch as a plurality of laser diodes, is provided to produce near-infrared radiation at a preselected plurality of wavelengths.
- Light from a selected narrow bandwidth near-infrared sourcemay be pulsed by a driver in synchronization with the detector and directed into the flowcell 106. Synchronization of the selected narrow bandwidth near-infrared source and the detector permits the apparatus to make both light and dark measurements, thereby substantially eliminating significant electronic noise.
- Selection of each of the set of narrow bandwidth near-infrared sources for emission of light to be transmitted into the flowcellmay be selected in a convenient order, for instance in order of increasing or decreasing wavelength, by configuring the computer to sequentially pulse each of the set of narrow bandwidth near-infrared sources.
- variations in the intensity of transmitted light as a function of wavelengthare converted into digital signals by the detector, with the magnitude of the digital signals determined by the intensity of the transmitted radiation at the wavelength assigned to that particular signal. Thereafter, the digital signals are placed in the memory of the computer for processing as will be described.
- the steps of the method of the present inventionincludes as a first step collecting data to be used in constructing a calibration model.
- data pretreatmentmay be performed in order to remove or compensate for spectral artifacts such as scattering (multiplicative) effects, baseline shifts, and instrumental noise.
- Pretreatment of the calibration datamay be selected from the group of techniques including calculating nth order derivatives of spectral data, multiplicative scatter correction, n-point smoothing, mean centering, variance scaling, and the ratiometric method.
- near-infrared spectral calibration datamay be formed into a n ⁇ p matrix representing n samples, each measured at p wavelengths.
- the n ⁇ p matrixmay be decomposed by principal component analysis into a set of n,n-dimensional score vectors formed into a n ⁇ n score matrix, and a set of n,p-dimensional loading vectors formed into an n ⁇ p loading matrix.
- the score vectorsare orthogonal and represent projections of the n spectral samples into the space defined by the loading vectors and the major sources of variation.
- Principal component analysisgenerates a set of n eigenvectors and a set of n eigenvalues, ⁇ 1 ⁇ 2 ⁇ . . . ⁇ n .
- the eigenvaluesrepresent the variance explained by the associated eigenvectors and can be divided into two sets.
- the first q eigenvaluesare primary eigenvalues, ⁇ 1 ⁇ .sub. ⁇ . . . ⁇ q , and account for the significant sources of variations within the data.
- the remaining n-q secondary (error) eigenvalues ⁇ q+1 ⁇ q+2 ⁇ . . . ⁇ qaccount for residual variance or measurement noise.
- the number of primary eigenvalues qmay be determined by an iterative method which compares the q th eigenvalue's variance to the variance of the pooled error eigenvalues via an F-test. Further, reduced eigenvalues may be utilized, which weight the eigenvalues by an amount proportional to the information explained by the associated eigenvectors.
- the q score values for each sampleare used to represent the original data during outlier detection, with the original spectra projected into the n ⁇ q dimensioned principal component subspace defined by loading the matrix.
- Outliersmay be identified using generalized distances, such as Mahalanobis distance or Robust distance.
- a generalized distance between a sample and the centroid defined by a set of samplesmay be determined using the variance-covariance matrix of the set of samples. Where the true variance-covariance matrix and the true centroid of a complete set of samples are unknown, a subset of the complete set may be used to form an approximate variance-covariance matrix and an approximate centroid. Further, by using principal component scores to represent spectral data for each sample, independent variables maximizing the information content may be obtained, insuring an invertible approximate variance-covariance matrix.
- an approximate centroidmay be determined as the centroid of a multivariate normal distribution of the set of calibration samples and an approximate variance-covariance matrix of the set of calibration samples, whereby an approximate Mahalanobis distances in units of standard deviations measured between the centroid and each calibration sample may be found.
- Robust distanceby utilizing a minimum volume ellipsoid estimator (MVE), robust estimates of an approximate variance-covariance matrix and an approximate centroid may be obtained.
- MVEminimum volume ellipsoid estimator
- a projection algorithmmay be used to determine the Robust distance for each calibration sample.
- the probability of class membershipmay be determined by a number of techniques, including evaluation of a chi-squared distribution function or utilizing Hotelling's T-statistic. Outliers are identified as having relatively large generalized distance which results in a relatively low probability of class membership. Samples whose class membership can be rejected at a confidence level that is greater than approximately 3-5 ⁇ may be considered as outliers. Following identification, outliers in the calibration samples may be removed. The generalized distances of outliers removed from the calibration samples may be examined, to determine whether additional data pretreatment is necessary. In the event that a relatively large number of outliers have very large generalized distances, further pretreatment of the calibration data may be indicated. After such additional pretreatment, the calibration data may again be subjected to analysis. On the other hand, if relatively large numbers of outliers do not have very large generalized distances, then additional data pretreatment may not be appropriate.
- a calibration modelmay then be constructed utilizing any of a number of techniques, including principal component regression (PCR), partial least squares (PLS), multiple linear regression (MLR), and artificial neural networks (ANN).
- the calibration modelwill seek to correlate a set of independent variables representing absorbance values of n samples each measured at p wavelengths, with a set of dependent or response variables representing the concentration of an analyte in each of the n samples, by using a p-dimensional regression coefficient vector.
- a calibration modeldetermines regression coefficient vector and is used to predict the concentration of the analyte in other samples, given only the absorbances at the p wavelengths.
- near-infrared spectral data variablesare highly correlated and while careful selection of the measurement wavelengths may minimize singularity problems, the spectral regions of interest may suffer from severe overlap and a high number of wavelengths is needed to model a multicomponent system.
- Data compressionmay be used to address problems with collinearity to determining regression coefficient vector, so that redundant data may be reduced down to significant factors.
- Principal component regressionis one technique that incorporates a data compression method. The technique of partial least squares may also be used to address the problem of redundant data.
- the goal of selecting optimal number of factors for regressionis to obtain parsimonious models with robust predictive abilities. Including too few factors causes model performance to suffer due to inadequate information during calibration, while including too many factors may also degrade performance.
- Principal componentsare normally sorted into an order so that the amount of variation explained by each principal component monotonically decreases. Later ordered principal components associated with small eigenvalues may be considered as containing measurement noise. By utilizing only the first q factors and omitting remaining factors, a type of noise rejection may be incorporated within principal component regression.
- the number of principal component analysis or partial least squares scores or factors to use during the regression stepmay be determined using the standard error of prediction, a measure of the error associated with each set of predictions. By plotting standard error of prediction against the number of factors used in each of the respective sets of predictions, a piecewise continuous graphical representation may be obtained and utilized to determine the number of factors to retain.
- One criterion for factor selectionis to determine the first local minimum.
- Another technique for factor selectionuses an F-test to compare standard error of prediction from models using differing numbers of factors.
- data being analyzedmay not be amenable to being split into a calibration, training set and a validation, test set.
- the reasonmay be due to a limited number of available samples or that by splitting data into two sets, one or both of the resulting sets do not adequately represent the sample population.
- the iterative technique of leave one out cross validationmay be used where, during each iteration, a sample is excluded from the calibration set and is used as a test sample. Prediction models using factors determined from calibration samples are then used to make test sample predictions. The test sample is then returned to the calibration set and another sample is excluded. The same process is repeated until all samples have been excluded from the calibration set and predicted by models generated by the calibration samples. All predictions are accumulated to give a standard error of validation.
- the data set for the calibration modelmay be reduced to significant factors, and regression coefficients for the calibration model may be determined.
- the calibration modelmay be applied to data collected from samples where concentration of analytes of interest are unknown.
- the unknown sample datamay be appropriately pretreated and then projected into the principal component space defined by the calibration model.
- generalized distances for the unknown sample data setmay be found, using, for instance, either Mahalanobis or Robust distance as utilized with respect to the calibration data, and the probability of class membership may be estimated using the techniques described above, including evaluation of a chi-squared distribution function or utilizing Hotelling's T-statistic.
- Outliers in the unknown sample dataare then identified based upon rejecting class membership at a confidence level that is greater than approximately 3-5 ⁇ .
- the samplein the event that an unknown sample is not an outlier, the sample is projected into the space defined by the calibration model, and a prediction of the concentration of the analyte made.
- the unknown sampleif the unknown sample is an outlier, the unknown sample may be rejected and no prediction as to analyte concentration made, although if possible, remeasurement of the unknown sample may be made to verify that the sample is an outlier.
- the steps previously described with respect to the method of the present inventionmay be configured on the general purpose microprocessor of the computer by employing computer program code segments according to each of such steps.
- FIG. 1is a schematic block diagram of a first preferred embodiment of the apparatus for biological fluid analyte concentration measurement representing the present invention.
- FIG. 2is a schematic block diagram of a second preferred embodiment of the apparatus for biological fluid analyte concentration measurement representing the present invention.
- FIG. 3is a schematic block diagram of a third preferred embodiment of the apparatus for biological fluid analyte concentration measurement representing the present invention.
- FIG. 4is a flowchart representing initial steps of the method for biological fluid analyte concentration measurement representing the present invention.
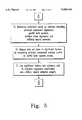
- FIG. 5is a flowchart representing intermediate steps of the method for biological fluid analyte concentration measurement representing the present invention.
- FIG. 6is a flowchart representing final steps of the method for biological fluid analyte concentration measurement representing the present invention.
- FIG. 7is a scatter plot of principal component 2 versus principal component 1 of near-infrared spectra from 111 blood glucose samples in the range of 1580 nm to 1848 nm.
- FIG. 8is a scatter plot of principal component 2 versus principal component 1 of near-infrared spectra from 111 blood glucose samples in the range of 2030 nm to 2398 nm.
- FIG. 9is a scatter plot of principal component 3 versus principal component 2 of near-infrared spectra from 111 blood glucose samples in the range of 2030 nm to 2398 nm.
- FIG. 10is a bar graph of calculated Mahalanobis distances for 103 blood glucose samples in the range of 1100 nm to 2398 nm taken from data depicted in FIGS. 7-9.
- FIG. 11is a scatter plot of predicted blood glucose concentrations from 103 samples using data derived from 2030 nm to 2398 nm, generated from a partial least squares model optimized with twelve factors attaining a standard error of validation of 64.10 mg/dL versus actual blood glucose concentrations.
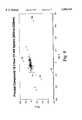
- FIG. 12is a scatter plot of predicted blood glucose concentrations from 100 samples using data derived from 2030 nm to 2398 nm, generated from a partial least squares model optimized with eight factors attaining a standard error of validation of 27.43 mg/dL versus actual blood glucose concentrations.
- FIG. 13is a bar graph of calculated Mahalanobis distances for 100 blood glucose samples in the range of 1580 nm to 1848 nm taken from data depicted in FIGS. 7-9.
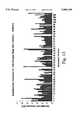
- FIG. 14is a bar graph of calculated Mahalanobis distances for 100 blood glucose samples in the range of 2030 nm to 2398 nm taken from data depicted in FIGS. 7-9.
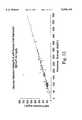
- FIG. 15is a scatter plot of predicted blood glucose concentrations from 95 samples using data derived from 2030 nm to 2398 nm, generated from a partial least squares model optimized with eight factors attaining a standard error of validation of 26.97 mg/dL versus actual blood glucose concentrations.
- FIG. 16is a table representing a summary of outlier detection results for 111 blood glucose samples over the spectral ranges 1580 nm to 1848 nm and 2030 nm to 2398 nm utilizing the present invention, and indicating possible causes of sample error.
- FIG. 17is a graph of the standard error of prediction versus the numbers of factors used during regression.
- FIG. 1depicting a first preferred embodiment of an apparatus for biological fluid analyte concentration measurement.
- a biological fluid samplemay be introduced into pump 102 which circulates the sample through tubing 104 to fill flowcell 106.
- Pump 102may be capable of both stopped flow and continuous flow operation.
- Sample compartment 108contains flowcell 106 and detector 110, and is temperature controlled by temperature control unit 112.
- Light from relatively broad bandwidth near-infrared source 114is directed through chopper wheel 116.
- Chopper wheel 116is synchronized by chopper synchronization unit 118 with respect to detector 116, facilitating apparatus 100 to make both light and dark measurements to substantially eliminate electronic noise.
- Modulated lightthen passes through monochrometer 120, allowing continuous variance of the wavelength of radiation over an appropriate range.
- the monochromatic lightpasses through flowcell 106 and strikes detector 110.
- Detector 110measures the amount of light transmitted through the sample. Measurement data is then stored in general purpose programmable computer 124 having a general purpose microprocessor, where the data will be available for further processing as will be described.
- computer 124may also control operation of pump 102, temperature control unit 112, chopper synchronization unit 118, chopper wheel 116, and monochrometer 120.
- light from relatively broad bandwidth source 114is directed through chopper wheel 116, and thereafter the modulated light is passed through filter wheel 130 whereby discrete wavelengths of radiation may be selected and transmitted to flowcell 106.
- a plurality of narrow bandwidth near-infrared sources 134such as a plurality of laser diodes, is provided to produce near-infrared radiation at a preselected plurality of wavelengths.
- Light from a selected narrow bandwidth near-infrared source 134may be pulsed by driver 138 in synchronization with detector 110 and directed into flowcell 106. Synchronization of the selected narrow bandwidth near-infrared source 134 and detector 110 permits apparatus 100 to make both light and dark measurements, thereby substantially eliminating electronic noise.
- Selection of each of the set of narrow bandwidth near-infrared sources 134 for emission of light to be transmitted into flowcell 106may be selected in a convenient order, for instance in order of increasing or decreasing wavelength, by configuring computer 124 to sequentially pulse each of the set of narrow bandwidth near-infrared sources.
- variations in the intensity of transmitted light as a function of wavelengthare converted into digital signals by the detector, with the magnitude of the digital signals determined by the intensity of the transmitted radiation at the wavelength assigned to that particular signal. Thereafter, the digital signals are placed in the memory of computer 124, for processing as will be described.
- step 1 in the method of the present inventionrefers to collecting data to be used in performing calibration and thereafter constructing a calibration model.
- data pretreatment of step 2may be performed, as it is often necessary to pretreat raw spectral data prior to data analysis or calibration model building in order to remove or compensate for spectral artifacts such as scattering (multiplicative) effects, baseline shifts, and instrumental noise.
- Pretreatment of the calibration datamay be selected from the group of techniques including calculating nth order derivatives of spectral data, multiplicative scatter correction, n-point smoothing, mean centering, variance scaling, and the ratiometric method.
- near-infrared spectral calibration datamay be formed into a n ⁇ p matrix X representing n samples, each measured at p wavelengths, and may be decomposed by principal component analysis into a set of n,n-dimensional score vectors formed into a n ⁇ n score matrix T, and a set of n,p-dimensional loading vectors formed into an n ⁇ p loading matrix L, with
- decompositionmay be considered decomposing matrix X of rank n into a sum of n rank 1 matrices.
- the score vectorsrepresent projections of the n spectral samples in X into the space defined by the loading vectors.
- the score matrix Trepresents the major sources of variation found within X, and the column vectors in T are orthogonal.
- principal component analysisgenerates a set of n eigenvectors and a set of n eigenvalues, ⁇ 1 ⁇ 2 ⁇ . . . ⁇ n .
- the eigenvaluesrepresent the variance explained by the associated eigenvectors.
- the eigenvaluesmay be divided into two sets.
- the first q eigenvaluesare primary eigenvalues ⁇ 1 ⁇ 2 ⁇ . . . ⁇ q and account for the significant sources of variations within the data.
- the remaining n-q secondary, or error, eigenvalues ⁇ q+1 ⁇ q+2 ⁇ . . . ⁇ naccount for residual variance or measurement noise.
- the number of primary eigenvalues qmay be determined by an iterative method which compares the q th eigenvalue's variance to the variance of the pooled error eigenvalues via an F-test, ##EQU1##
- reduced eigenvalueswhich weight the eigenvalues by an amount proportional to the information explained by the associated eigenvectors may be utilized with the reduced eigenvalue is defined as ##EQU2## so that equation 2 may be expressed as ##EQU3##
- the i th sample in the principal component subspaceis represented by the q score values of t i .
- the q score values for each sampleare used to represent the original data during outlier detection. In doing so, the original spectra are projected into the n ⁇ q dimensioned principal component subspace defined by loading matrix L.
- outliersmay be identified using generalized distances, such as Mahalanobis distance or Robust distance.
- generalized distancessuch as Mahalanobis distance or Robust distance.
- a generalized distance between a centroid ⁇ of a set of samples and the i th sample x imay be determined from
- ⁇is the variance-covariance matrix of the set of samples.
- a subset of the complete set of samplesmay be used to form an approximate variance-covariance matrix and an approximate centroid.
- independent variablesare orthogonal thus maximizing the information content and insuring an invertible approximate variance-covariance matrix.
- Generalized distancesmay be Mahalanobis distances as described in step 10a of FIG. 4, with an approximate centroid x determined as the centroid of a multivariate normal distribution of the set of calibration samples and an approximate variance-covariance matrix of the set of calibration samples S.
- An approximate Mahalanobis distances MD i in units of standard deviations measured between the centroid and an i th calibration sample x imay thus be determined from
- Mis a p-dimensional vector such that the r th component of M is given by the median of a set formed by the r th component of each of the n vectors x i .
- index j used in equations 10 and 11is determined from
- the probability of class membershipmay be determined by a number of techniques, including evaluation of a chi-squared distribution function or utilizing Hotelling's T-statistic. As depicted in step 12, outliers are identified as having relatively large generalized distance which results in a relatively low probability of class membership. Generally speaking, samples whose class membership can be rejected at a confidence level in the range of approximately 3-5 ⁇ may be considered as outliers. Following identification, outliers in the calibration samples may be removed as depicted in step 13. Further, as indicated in step 14, the generalized distances of outliers removed from the calibration samples may be examined to determine whether additional data pretreatment is necessary.
- a calibration modelmay be constructed utilizing any of a number of techniques, including principal component regression (PCR), partial least squares (PLS), multiple linear regression (MLR), and artificial neural networks (ANN).
- the calibration modelwill seek to correlate a set of independent variables representing absorbance values of n samples measured at p wavelengths, symbolically represented by the n ⁇ p matrix X, with a set of dependent or response variables representing the concentration of an analyte in each of the n samples, symbolically represented by vector y.
- yis an n-dimensional vector, or alternatively, may be considered to be an n ⁇ 1 matrix.
- brepresents a p-dimensional regression coefficient vector (p ⁇ 1) matrix) and s is an n-dimensional vector (n ⁇ 1 matrix) representing errors in y.
- the calibration modeldetermines vector b, using
- Knowledge of bis used to predict the concentration of the analyte, y, in unknown samples, given only absorbances at each of the p wavelengths.
- step 16the determination of (X t X) -1 may be difficult as collinearity is inherent in spectroscopic data. As described, near-infrared spectral data variables are highly correlated. While careful selection of the measurement wavelengths may minimize singularity problems, the spectral regions of interest may suffer from severe overlap and a high number of wavelengths is needed to model a multicomponent system. Data compression may be used to address problems with collinearity to determining regression coefficient vector b, so that redundant data may be reduced down to significant factors.
- Principal component regressionis one technique to determine vector b that incorporates a data compression method.
- the first step in principal component regressionis to perform principal component analysis on the calibration data as formed into matrix X.
- the score matrix Trepresents the major sources of variation found within X, and the column vectors in T are orthogonal.
- Tis used in place of X whereby an approximate value of b is found using
- partial least squaresmay also be used to address the problem of redundant data.
- One difference between partial least squares and principal component regressionis the way in which the score matrix T and the loading matrix L are generated.
- NPALSnon-linear iterative partial least squares
- loading vectorsare extracted one at a time in the order of their contribution to the variance in X. As each loading vector is determined, it is removed from X and the next loading vector is determined. This process is repeated until n loadings have been determined.
- concentration, y blockinformation is used during iterative decomposition of X. With concentration information incorporated into L, T values are related to concentration as well as placing useful predictive information into earlier factors as compared to principal component regression.
- the number of principal component analysis or partial least squares scores or factors, q, to use during the regression stepmay be determined as follows.
- n preliminary calibration modelsare built. Each preliminary calibration model uses a different number of score vectors selected from the range of 1 through n score vectors. Predictions are then made form the n preliminary calibration models using the standard error of prediction technique.
- the standard error of prediction (SEP)is a measure of the error associated with each set of predictions and is given by ##EQU8## where the number of test set samples is given by n and
- FIG. 17By plotting standard error of prediction against the number of factors (score vectors) used, denoted by k, in each of the respective sets of predictions, a piecewise continuous graphical representation such as FIG. 17 may be obtained and utilized to determine the number of factors to retain.
- One criterion for factor selectionis to determine the first local minimum. Applying a first local minimum criterion to the data graphed in FIG. 17, eight factors would be selected for the calibration model.
- a general interpretation of FIG. 17is that significant information is being incorporated into the calibration model in factors one through six. As factors seven and eight are included, subtleties in the data are included. For factors nine through fifteen, variations or measurement noise specific to the calibration set are being modeled, so errors increase.
- Another technique for factor selectionuses an F-test to compare standard error of prediction from models using differing numbers of factors.
- An F-test factor optimizationwould find that the standard error of prediction an eight factor model does not vary significantly from the standard error of prediction of a six factor model, whereby six factors is seen to be optimal.
- data being analyzedmay not be amenable to being split into a calibration, training set and a validation, test set.
- the reasonmay be due to a limited number of available samples or that by splitting data into two sets, one or both of the resulting sets do not adequately represent the sample population.
- the technique of leave one out cross validationmay be used in such a situation. Leave one out cross validation is an iterative process, where during each iteration, a sample is excluded from the calibration set and is used as a test sample. Prediction models using 1 through n-1 factors determined from n-1 calibration samples are then used to make test sample predictions. The test sample is then returned to the calibration set and another sample is excluded.
- step 17as depicted in FIG. 5, after determining the number of significant factors, data for the calibration model may be reduced to significant factors, and regression coefficients for the calibration model may be determined.
- the calibration model as described abovemay be applied to data collected from samples where concentration of analytes of interest are unknown, symbolically indicated in FIG. 6 as step 18.
- the unknown sample datamay be appropriately pretreated as indicated at step 19, with similar techniques to those described above with respect to pretreatment techniques capable of use with calibration data.
- the sample datamay be projected into the principal component space that was previously defined by the calibration model, as indicated in step 20.
- generalized distances for the unknown sampleis found using the generalized distance, such as Mahalanobis or Robust: distances, that was utilized with respect to the calibration data;
- the probability of class membershipmay be estimated using the techniques described above, including evaluation of a chi-squared distribution function or utilizing Hotelling's T-statistic.
- unknown sample outliersmay then identified based upon rejecting class membership at a confidence level that is in the approximate range of 3-5 ⁇ .
- the unknown samplemay be projected into the space defined by the calibration model, and a prediction of the concentration of the analyte may be made.
- the unknown sampleshould be rejected and no prediction as to analyte concentration is made, although if possible, remeasurement of the unknown sample may be made for reanalysis to verify that the unknown sample is indeed an outlier.
- the method and apparatus of the present inventionwas applied to blood glucose concentration data obtained from samples from 111 individuals.
- Six of the samplesdid not have enough serum to collect a near-infrared spectrum, so that vectors of zeros were used to fill their position within the data matrix in order to maintain succession number integrity during data manipulation.
- the six samples and the associated reference testswere omitted from future analyses. Two other samples were associated with reference test errors and were omitted, leaving 103 samples in the data set.
- FIGS. 7-9depict separate principal component analyses of two spectral regions performed.
- Vectors of zeros, indicated by reference numeral 200lie far from the main group of data, as expected.
- samples 28 and 44are seen to be potential outliers, as are samples 3 and 4 in FIG. 8.
- samples 3, 4, and 44are potential outliers.
- Mahalanobis distanceswere calculated for the 103 samples, as shown in FIG. 10, wherein samples 23, 67, and 83 are seen to have Mahalanobis distances much greater than the other samples. Further, in FIGS. 10, 13, and 14, omitted samples are depicted as having zero Mahalanobis distance. A number of additional samples appear in FIG. 10 to be outlier candidates, including samples 3, 4, and 44. The data were subjected to further analyses, as will be described, with samples 23, 67, and 83 omitted, leaving 100 samples in the data set.
- FIGS. 11 and 12depict a scatter plot of predicted blood glucose concentrations from 103 samples using data derived from 2030 nm to 2398 nm generated from a partial least squares model optimized with twelve factors attaining a standard error of validation of 64.10 mg/dL versus actual blood glucose concentrations.
- FIG. 12depicts a scatter plot of predicted blood glucose concentrations from 100 samples using data derived from 2030 nm to 2398 nm, generated from a partial least squares model optimized with eight factors attaining a standard error of validation of 27.43 mg/dL versus actual blood glucose concentrations.
- the partial least squares technique utilized in the method of the present inventionwas able to make better predictions and use a less complex model, that is, a model using fewer factors.
- the sample depicted in FIG. 11 having a predicted value of approximately 750 mg/dLcorresponded to sample indicated by reference numeral 83. If sample 83 in FIG. 11 is ignored and the remaining samples in FIG. 11 are compared with those in FIG. 12, it is apparent that there is a wider spread of data about the identity line in FIG. 11.
- Two spectral regions of the 100 sampleswere tested separately for outliers, with Mahalanobis distances for each of the regions shown in FIGS. 13 and 14.
- Nine sampleswere flagged as possible outliers in the 1580 nm to 1848 nm region, and six samples were flagged in the 2030 nm to 2398 nm region as possible outliers.
- the flagged sampleswere different in the two spectral regions.
- Outliersmay be selected to be those flagged samples that are excluded from class membership in either or both spectral ranges, at a confidence level selected to be in the range of 3-5 ⁇ .
- Four of the samples rejectedwere also identified as possible outliers from the principal component score plots, FIGS. 7-9. Identification of the fifth sample required examination in the higher dimensional space associated with Mahalanobis distances.
- FIG. 16sets forth a summary of 95 samples representing both major spectral regions examined using the method and apparatus of he present invention, and shows that blood glucose concentration predictions using the 95 and 100 sample data sets and the same spectral regions yielded very similar results.
- a slight reduction in prediction error to SEV of 26.97 mg/dL with respect to the 100 sample set depicted in FIG. 12resulted for the 95 sample set depicted in FIG. 15 for the 2030 nm to 2398 nm region, with the difference representing approximately a 1% reduction in error.
- An F-test at the 95% confidence leveldid not find this a significant difference.
- Comparison of the partial least squares results from other spectral regions with various forms of data preprocessingyielded similar findings.
- a set of 89 samplesresults.
- leave-one-out validation on the set of 89 samplesresulted in an SEV of 27.95 mg/dL, a slight increase over the 100 and 95 sample sets. It was separately determined that the six samples omitted in the 89 sample set with respect to the 95 sample set corresponded to samples having a high triglyceride concentration, a high total protein value, or both.
- the presence of the six outliersconstituted an artifact of undersampling, that is, if a greater number of representative samples with high triglyceride or total protein concentrations were present in the original set of samples, samples having high triglyceride or total protein concentrations would be less likely to be flagged as outliers.
- the method and apparatus of the present inventionencompasses alternative biological fluid analyte measurement techniques, including biological fluid analyte concentrations derived using light reflectance, light transmission, and other techniques used in conjunction with invasive, non-invasive, and in-vivo biological fluid analyte measurement techniques.
- measurements of biological fluid analytesmay also include triglycerides, cholesterol, and serum proteins, with outlier detection using the method and apparatus of the present invention.
Landscapes
- Physics & Mathematics (AREA)
- Spectroscopy & Molecular Physics (AREA)
- Health & Medical Sciences (AREA)
- Life Sciences & Earth Sciences (AREA)
- Chemical & Material Sciences (AREA)
- Analytical Chemistry (AREA)
- Biochemistry (AREA)
- General Health & Medical Sciences (AREA)
- General Physics & Mathematics (AREA)
- Immunology (AREA)
- Pathology (AREA)
- Engineering & Computer Science (AREA)
- Mathematical Physics (AREA)
- Theoretical Computer Science (AREA)
- Investigating Or Analysing Materials By Optical Means (AREA)
Abstract
Description
X=TL.sup.t. (1)
D.sub.i =[(x.sub.i -μ)Σ.sup.-1 (x.sub.i -μ).sup.t ].sup.1/2(5)
MD.sub.i =[(x.sub.i -x)S.sup.-1 (x.sub.i -x).sup.t ].sup.1/2(6)
RD.sub.i =[(x.sub.i -x.sub.Robust)S.sub.Robust.sup.-1 (x.sub.i -x.sub.Robust).sup.t ].sup.1/2. (8)
ν.sub.g =x.sub.g -M (12)
x.sub.j ν.sub.g.sup.t -x.sub.n-n/2 ν.sub.g.sup.t =min {x.sub.n/2+1 ν.sub.g.sup.t -x.sub.1 ν.sub.g.sup.t,x.sub.n/2+2 ν.sub.g.sup.t -x.sub.2 ν.sub.g.sup.t, . . . , x.sub.n ν.sub.g.sup.t -x.sub.n/2 ν.sub.g.sup.t } (13)y=Xb+ε (14)
b=(X.sup.t X).sup.-1 X.sup.t y. (15)
b=(T.sup.t T).sup.-1 T.sup.t y (16)
y.sub.i =y+(XL.sub.i)b.sub.i. (18)
Claims (42)
MD.sub.i =[(x.sub.i -x)S.sup.-1 (x.sub.i -x).sup.t ].sup.1/2
MD.sub.i =[(x.sub.i -x)S.sup.-1 (x.sub.i -x).sup.t ].sup.1/2
MD.sub.sample =[(x.sub.sample -x.sub.model)S.sup.-1 (x.sub.sample -x.sub.model).sup.t ].sup.1/2
MD.sub.i =[(x.sub.i -x)S.sup.-1 (x.sub.i -x).sup.t ].sup.1/2
MD.sub.i =[(x.sub.i -x)S.sup.-1 (x.sub.i -x).sup.t ].sup.1/2
Priority Applications (7)
| Application Number | Priority Date | Filing Date | Title |
|---|---|---|---|
| US08/587,017US5606164A (en) | 1996-01-16 | 1996-01-16 | Method and apparatus for biological fluid analyte concentration measurement using generalized distance outlier detection |
| CA002228844ACA2228844C (en) | 1995-08-07 | 1996-08-02 | Biological fluid analysis using distance outlier detection |
| EP96926226AEP0846253A4 (en) | 1995-08-07 | 1996-08-02 | Biological fluid analysis using distance outlier detection |
| PCT/US1996/012625WO1997006418A1 (en) | 1995-08-07 | 1996-08-02 | Biological fluid analysis using distance outlier detection |
| AU66448/96AAU711324B2 (en) | 1995-08-07 | 1996-08-02 | Biological fluid analysis using distance outlier detection |
| JP50854897AJP3323512B2 (en) | 1995-08-07 | 1996-08-02 | Biological fluid analysis using distance outlier detection |
| MXPA/A/1998/001056AMXPA98001056A (en) | 1995-08-07 | 1998-02-06 | Analysis of a biological fluid using the detection of results in aisla intervals |
Applications Claiming Priority (1)
| Application Number | Priority Date | Filing Date | Title |
|---|---|---|---|
| US08/587,017US5606164A (en) | 1996-01-16 | 1996-01-16 | Method and apparatus for biological fluid analyte concentration measurement using generalized distance outlier detection |
Publications (1)
| Publication Number | Publication Date |
|---|---|
| US5606164Atrue US5606164A (en) | 1997-02-25 |
Family
ID=24348001
Family Applications (1)
| Application Number | Title | Priority Date | Filing Date |
|---|---|---|---|
| US08/587,017Expired - LifetimeUS5606164A (en) | 1995-08-07 | 1996-01-16 | Method and apparatus for biological fluid analyte concentration measurement using generalized distance outlier detection |
Country Status (1)
| Country | Link |
|---|---|
| US (1) | US5606164A (en) |
Cited By (137)
| Publication number | Priority date | Publication date | Assignee | Title |
|---|---|---|---|---|
| WO1997041420A1 (en)* | 1996-04-29 | 1997-11-06 | Petrometrix Ltd. | Spectral information transmission through communication optical fibers |
| WO1998043070A1 (en)* | 1997-03-25 | 1998-10-01 | Foss Electric A/S | Measurement of acetone in milk using ir spectroscopy |
| US5822219A (en)* | 1996-05-13 | 1998-10-13 | Foss Nirsystems, Inc. | System for identifying materials by NIR spectrometry |
| WO1999009395A1 (en)* | 1997-08-14 | 1999-02-25 | Instrumentation Metrics, Inc. | Method and apparatus for generating basis sets for use in spectroscopic analysis |
| WO1999027849A1 (en)* | 1997-12-04 | 1999-06-10 | Roche Diagnostics Corporation | Instrument setup utility program |
| WO2000042907A1 (en)* | 1999-01-22 | 2000-07-27 | Instrumentation Metrics, Inc. | System and method for noninvasive blood analyte measurements |
| US6114699A (en)* | 1997-11-26 | 2000-09-05 | The United States Of America As Represented By The Secretary Of Agriculture | Prediction of total dietary fiber in cereal products using near-infrared reflectance spectroscopy |
| EP1022550A3 (en)* | 1999-01-25 | 2000-09-06 | Aquacheck Systems Inc. | Colorimeter apparatus and related process |
| WO2001016579A1 (en)* | 1999-08-31 | 2001-03-08 | Cme Telemetrix Inc. | Method of calibrating a spectroscopic device |
| US6280381B1 (en) | 1999-07-22 | 2001-08-28 | Instrumentation Metrics, Inc. | Intelligent system for noninvasive blood analyte prediction |
| US6341257B1 (en)* | 1999-03-04 | 2002-01-22 | Sandia Corporation | Hybrid least squares multivariate spectral analysis methods |
| WO2002026152A1 (en)* | 2000-09-25 | 2002-04-04 | Instrumentation Metrics, Inc. | A method for quantification of stratum corneum hydration using diffuse reflectance spectroscopy |
| US20020067476A1 (en)* | 2000-10-17 | 2002-06-06 | Sumio Kawano | Analytical method and apparatus for blood using near infrared spectroscopy |
| US6421614B1 (en)* | 1999-07-26 | 2002-07-16 | Donald S. Goldman | Photometer system for obtaining reliable data |
| US6477392B1 (en)* | 2000-07-14 | 2002-11-05 | Futrex Inc. | Calibration of near infrared quantitative measurement device using optical measurement cross-products |
| US20020171834A1 (en)* | 2001-04-11 | 2002-11-21 | Rowe Robert K. | Encoded variable filter spectrometer |
| US20020183624A1 (en)* | 2001-06-05 | 2002-12-05 | Rio Grande Medical Technologies, Inc. | Apparatus and method of biometric determination using specialized optical spectroscopy systems |
| US6493566B1 (en)* | 1999-01-22 | 2002-12-10 | Instrumentation Metrics, Inc. | Classification system for sex determination and tissue characterization |
| US20030043966A1 (en)* | 2001-09-03 | 2003-03-06 | Philippe Blin | Radiation emission device and method |
| US6549861B1 (en) | 2000-08-10 | 2003-04-15 | Euro-Celtique, S.A. | Automated system and method for spectroscopic analysis |
| US20030086073A1 (en)* | 2001-11-08 | 2003-05-08 | Braig James R. | Reagent-less whole-blood glucose meter |
| US20030086074A1 (en)* | 2001-11-08 | 2003-05-08 | Braig James R. | Device and method for in vitro determination of analyte concentrations within body fluids |
| US6574490B2 (en) | 2001-04-11 | 2003-06-03 | Rio Grande Medical Technologies, Inc. | System for non-invasive measurement of glucose in humans |
| US20030108976A1 (en)* | 2001-10-09 | 2003-06-12 | Braig James R. | Method and apparatus for improving clinical accuracy of analyte measurements |
| US20030143116A1 (en)* | 2001-11-21 | 2003-07-31 | Peng Zheng | Method for adjusting a blood analyte measurement |
| EP1335199A1 (en)* | 2002-02-11 | 2003-08-13 | Bayer Corporation | Non-invasive system for the determination of analytes in body fluids |
| US20030178569A1 (en)* | 2001-12-14 | 2003-09-25 | Sterling Bernhard B. | Pathlength-independent methods for optically determining material composition |
| US6654125B2 (en) | 2002-04-04 | 2003-11-25 | Inlight Solutions, Inc | Method and apparatus for optical spectroscopy incorporating a vertical cavity surface emitting laser (VCSEL) as an interferometer reference |
| US6675030B2 (en) | 2000-08-21 | 2004-01-06 | Euro-Celtique, S.A. | Near infrared blood glucose monitoring system |
| US20040019431A1 (en)* | 2001-12-14 | 2004-01-29 | Sterling Bernhard B. | Method of determining an analyte concentration in a sample from an absorption spectrum |
| US20040033617A1 (en)* | 2002-08-13 | 2004-02-19 | Sonbul Yaser R. | Topological near infrared analysis modeling of petroleum refinery products |
| US6696265B1 (en)* | 1999-08-17 | 2004-02-24 | Luminex Corporation | System and method for eliminating the effects of doublets and carryover |
| US20040059206A1 (en)* | 2001-11-09 | 2004-03-25 | Braig James R. | Method for transforming phase spectra to absorption spectra |
| US6718189B2 (en) | 1995-08-09 | 2004-04-06 | Rio Grande Medical Technologies, Inc. | Method and apparatus for non-invasive blood analyte measurement with fluid compartment equilibration |
| US6754543B1 (en)* | 1998-06-22 | 2004-06-22 | Umetri Aktiebolag | Method and arrangement for calibration of input data |
| US20040132168A1 (en)* | 2003-01-06 | 2004-07-08 | Peter Rule | Sample element for reagentless whole blood glucose meter |
| US20040130713A1 (en)* | 2000-05-16 | 2004-07-08 | O'mongain Eon | Photometric analysis of natural waters |
| US6774632B2 (en) | 2001-09-14 | 2004-08-10 | Ge Medical Systems Global Technology Company, Llc | Failure prediction apparatus for superconductive magnet and magnetic resonance imaging system |
| US6816605B2 (en) | 1999-10-08 | 2004-11-09 | Lumidigm, Inc. | Methods and systems for biometric identification of individuals using linear optical spectroscopy |
| US20040236735A1 (en)* | 2001-01-12 | 2004-11-25 | Microsoft Corporation | Database aggregation query result estimator |
| US20040240712A1 (en)* | 2003-04-04 | 2004-12-02 | Lumidigm, Inc. | Multispectral biometric sensor |
| US20050007582A1 (en)* | 2003-07-07 | 2005-01-13 | Lumidigm, Inc. | Methods and apparatus for collection of optical reference measurements for monolithic sensors |
| US20050014997A1 (en)* | 1997-08-14 | 2005-01-20 | Ruchti Timothy L. | Method of sample control and calibration adjustment for use with a noninvasive analyzer |
| US20050030657A1 (en)* | 2003-07-18 | 2005-02-10 | Maier John S. | Method and apparatus for multiwavelength imaging spectrometer |
| US20050033127A1 (en)* | 2003-01-30 | 2005-02-10 | Euro-Celtique, S.A. | Wireless blood glucose monitoring system |
| US20050036147A1 (en)* | 2003-04-15 | 2005-02-17 | Sterling Bernhard B. | Method of determining analyte concentration in a sample using infrared transmission data |
| US6862091B2 (en) | 2001-04-11 | 2005-03-01 | Inlight Solutions, Inc. | Illumination device and method for spectroscopic analysis |
| EP1315953A4 (en)* | 2000-08-10 | 2005-03-02 | Euro Celtique Sa | Automated system and method for spectroscopic analysis |
| US6865408B1 (en) | 2001-04-11 | 2005-03-08 | Inlight Solutions, Inc. | System for non-invasive measurement of glucose in humans |
| US20050074834A1 (en)* | 2001-09-12 | 2005-04-07 | The State Of Or Acting By & Through The State Board Of Higher Educ. On Behalf Of Or State Univ. | Method and system for classifying a scenario |
| US20050073690A1 (en)* | 2003-10-03 | 2005-04-07 | Abbink Russell E. | Optical spectroscopy incorporating a vertical cavity surface emitting laser (VCSEL) |
| US20050149300A1 (en)* | 2003-03-07 | 2005-07-07 | Ruchti Timothy L. | Method and apparatus for enhanced estimation of an analyte property through multiple region transformation |
| US6919566B1 (en) | 1999-08-31 | 2005-07-19 | Nir Diagnostics Inc. | Method of calibrating a spectroscopic device |
| US20050205667A1 (en)* | 2003-04-04 | 2005-09-22 | Lumidigm, Inc. | Combined total-internal-reflectance and tissue imaging systems and methods |
| US6958809B2 (en) | 2001-11-08 | 2005-10-25 | Optiscan Biomedical Corporation | Reagent-less whole-blood glucose meter |
| US20050265585A1 (en)* | 2004-06-01 | 2005-12-01 | Lumidigm, Inc. | Multispectral liveness determination |
| US20050271258A1 (en)* | 2004-06-01 | 2005-12-08 | Lumidigm, Inc. | Multispectral imaging biometrics |
| US6983176B2 (en) | 2001-04-11 | 2006-01-03 | Rio Grande Medical Technologies, Inc. | Optically similar reference samples and related methods for multivariate calibration models used in optical spectroscopy |
| US20060001867A1 (en)* | 2004-06-30 | 2006-01-05 | Maier John S | Method and apparatus for spectral modulation compensation |
| US20060001881A1 (en)* | 2004-06-30 | 2006-01-05 | Maier John S | Method and apparatus for peak compensation in an optical filter |
| US20060001869A1 (en)* | 2002-10-31 | 2006-01-05 | David Tuschel | Method and apparatus for dark field chemical imaging |
| US20060009875A1 (en)* | 2004-07-09 | 2006-01-12 | Simpson Michael B | Chemical mixing apparatus, system and method |
| US20060017923A1 (en)* | 1999-01-22 | 2006-01-26 | Ruchti Timothy L | Analyte filter method and apparatus |
| US20060023217A1 (en)* | 2004-05-28 | 2006-02-02 | Chemimage Corporation | Method and apparatus for producing a mosaic image |
| US20060062438A1 (en)* | 2003-04-04 | 2006-03-23 | Lumidigm, Inc. | Comparative texture analysis of tissue for biometric spoof detection |
| US7027848B2 (en) | 2002-04-04 | 2006-04-11 | Inlight Solutions, Inc. | Apparatus and method for non-invasive spectroscopic measurement of analytes in tissue using a matched reference analyte |
| US20060080041A1 (en)* | 2004-07-08 | 2006-04-13 | Anderson Gary R | Chemical mixing apparatus, system and method |
| US7043288B2 (en) | 2002-04-04 | 2006-05-09 | Inlight Solutions, Inc. | Apparatus and method for spectroscopic analysis of tissue to detect diabetes in an individual |
| US20060110015A1 (en)* | 2003-04-04 | 2006-05-25 | Lumidigm, Inc. | Systems and methods for improved biometric feature definition |
| US20060110038A1 (en)* | 2002-09-12 | 2006-05-25 | Knee Michael J | Image processing |
| US7061593B2 (en) | 2001-11-08 | 2006-06-13 | Optiscan Biomedical Corp. | Device and method for in vitro determination of analyte concentrations within body fluids |
| US7072770B1 (en) | 2004-03-29 | 2006-07-04 | Chemimage Corporation | Method for identifying components of a mixture via spectral analysis |
| US20060170916A1 (en)* | 2005-01-31 | 2006-08-03 | Voigt Thomas C | Method and apparatus for variable-field illumination |
| US20060200070A1 (en)* | 2005-02-14 | 2006-09-07 | Callicoat David N | Method and apparatus for calibrating an analyte detection system with a calibration sample |
| US20060203238A1 (en)* | 2003-07-18 | 2006-09-14 | Gardner Charles W Jr | Method and apparatus for compact spectrometer for detecting hazardous agents |
| US20060209301A1 (en)* | 2003-07-18 | 2006-09-21 | Gardner Charles W Jr | Method and apparatus for compact spectrometer for fiber array spectral translator |
| US20060268266A1 (en)* | 2003-07-18 | 2006-11-30 | Gardner Charles W Jr | Method and apparatus for compact spectrometer for multipoint sampling of an object |
| US20060276697A1 (en)* | 2005-06-07 | 2006-12-07 | Chemlmage Corporation | Non-invasive biochemical analysis |
| US20060276713A1 (en)* | 2005-06-07 | 2006-12-07 | Chemimage Corporation | Invasive chemometry |
| US20070030475A1 (en)* | 2003-04-04 | 2007-02-08 | Lumidigm, Inc. | White-light spectral biometric sensors |
| US7203345B2 (en) | 1999-10-08 | 2007-04-10 | Lumidigm, Inc. | Apparatus and method for identification of individuals by near-infrared spectrum |
| US20070116331A1 (en)* | 2004-06-01 | 2007-05-24 | Lumidigm, Inc. | System and method for robust fingerprint acquisition |
| US7263213B2 (en) | 2003-12-11 | 2007-08-28 | Lumidigm, Inc. | Methods and systems for estimation of personal characteristics from biometric measurements |
| US20070216898A1 (en)* | 2003-07-18 | 2007-09-20 | Gardner Charles W Jr | Sample container and system for a handheld spectrometer and method for using therefor |
| US20080084553A1 (en)* | 2005-07-14 | 2008-04-10 | Neiss Jason H | Method And Apparatus For Multimodal Detection |
| US20080088837A1 (en)* | 2003-07-18 | 2008-04-17 | Chemimage Corporation | Sample container and system for a handheld spectrometer and method for using therefor |
| US20080123712A1 (en)* | 2006-06-15 | 2008-05-29 | Spectrasensors, Inc. | Measuring water vapor in high purity gases |
| US7394542B2 (en) | 2004-08-18 | 2008-07-01 | Chemimage Corporation | Method and apparatus for chemical imaging in a microfluidic circuit |
| US7394919B2 (en) | 2004-06-01 | 2008-07-01 | Lumidigm, Inc. | Multispectral biometric imaging |
| US20080172141A1 (en)* | 2004-07-08 | 2008-07-17 | Simpson Michael B | Chemical Mixing Apparatus, System And Method |
| WO2006019991A3 (en)* | 2004-07-15 | 2008-07-31 | Cheminage Corp | Method and apparatus for multimodal detection |
| US20080192988A1 (en)* | 2006-07-19 | 2008-08-14 | Lumidigm, Inc. | Multibiometric multispectral imager |
| US20080232653A1 (en)* | 2007-03-21 | 2008-09-25 | Lumidigm, Inc. | Biometrics based on locally consistent features |
| US20080298649A1 (en)* | 2004-06-01 | 2008-12-04 | Lumidigm, Inc. | Hygienic biometric sensors |
| US20090035779A1 (en)* | 2007-06-29 | 2009-02-05 | Roche Molecular Systems, Inc. | Systems and methods for determining cross-talk coefficients in pcr and other data sets |
| US20090043514A1 (en)* | 2005-04-15 | 2009-02-12 | Robert Schweitzer | Method and apparatus for spectral mixture resolution |
| US20090040519A1 (en)* | 2007-08-07 | 2009-02-12 | Jingyun Zhang | Method and apparatus for reconfigurable field of view in a fast-based imaging system |
| US20090046903A1 (en)* | 2007-04-10 | 2009-02-19 | Lumidigm, Inc. | Biometric Detection Using Spatial, Temporal, And/Or Spectral Techniques |
| US20090062632A1 (en)* | 2005-04-15 | 2009-03-05 | Rebec Mihailo V | Non-Invasive System and Method for Measuring an Analyte in the Body |
| US20090080709A1 (en)* | 2006-07-19 | 2009-03-26 | Lumidigm, Inc. | Whole-Hand Multispectral Biometric Imaging |
| US7545963B2 (en) | 2003-04-04 | 2009-06-09 | Lumidigm, Inc. | Texture-biometrics sensor |
| US20090157430A1 (en)* | 2007-10-11 | 2009-06-18 | Peter Rule | Synchronization and configuration of patient monitoring devices |
| US20090245591A1 (en)* | 2006-07-19 | 2009-10-01 | Lumidigm, Inc. | Contactless Multispectral Biometric Capture |
| US7620212B1 (en) | 2002-08-13 | 2009-11-17 | Lumidigm, Inc. | Electro-optical sensor |
| US20090326343A1 (en)* | 2005-02-14 | 2009-12-31 | Optiscan Biomedical Corporation | Fluid handling cassette having a spectroscopic sample cell |
| US20100049444A1 (en)* | 2008-08-21 | 2010-02-25 | Bio-Red Laboratories, Inc. | Calibration surface method for determination of analyte ratios |
| US20100213376A1 (en)* | 2003-07-18 | 2010-08-26 | Chemimage Corporation | Method and Apparatus for Compact Spectrometer for Multipoint Sampling of an Object |
| US20100225899A1 (en)* | 2005-12-23 | 2010-09-09 | Chemimage Corporation | Chemical Imaging Explosives (CHIMED) Optical Sensor using SWIR |
| US7801339B2 (en) | 2006-07-31 | 2010-09-21 | Lumidigm, Inc. | Biometrics with spatiospectral spoof detection |
| US7801338B2 (en) | 2005-04-27 | 2010-09-21 | Lumidigm, Inc. | Multispectral biometric sensors |
| US7804984B2 (en) | 2006-07-31 | 2010-09-28 | Lumidigm, Inc. | Spatial-spectral fingerprint spoof detection |
| US20100246902A1 (en)* | 2009-02-26 | 2010-09-30 | Lumidigm, Inc. | Method and apparatus to combine biometric sensing and other functionality |
| US20110080577A1 (en)* | 2006-06-09 | 2011-04-07 | Chemlmage Corporation | System and Method for Combined Raman, SWIR and LIBS Detection |
| US20110085708A1 (en)* | 2009-08-26 | 2011-04-14 | Lumidigm. Inc. | Multiplexed biometric imaging |
| US20110089323A1 (en)* | 2009-10-06 | 2011-04-21 | Chemlmage Corporation | System and methods for explosives detection using SWIR |
| US20110139989A1 (en)* | 2006-09-13 | 2011-06-16 | Pawlak Andrzej M | Method and Apparatus for A Universal Infrared Analyzer |
| US7990532B2 (en) | 2007-01-16 | 2011-08-02 | Chemimage Corporation | Method and apparatus for multimodal detection |
| US20110237446A1 (en)* | 2006-06-09 | 2011-09-29 | Chemlmage Corporation | Detection of Pathogenic Microorganisms Using Fused Raman, SWIR and LIBS Sensor Data |
| US8054454B2 (en) | 2005-07-14 | 2011-11-08 | Chemimage Corporation | Time and space resolved standoff hyperspectral IED explosives LIDAR detector |
| US20120116689A1 (en)* | 2010-11-04 | 2012-05-10 | Agilent Technologies, Inc. | Peak correlation and clustering in fluidic sample separation |
| US8570149B2 (en) | 2010-03-16 | 2013-10-29 | Lumidigm, Inc. | Biometric imaging using an optical adaptive interface |
| US8597190B2 (en) | 2007-05-18 | 2013-12-03 | Optiscan Biomedical Corporation | Monitoring systems and methods with fast initialization |
| US8660968B2 (en) | 2011-05-25 | 2014-02-25 | Azure Vault Ltd. | Remote chemical assay classification |
| US8738303B2 (en) | 2011-05-02 | 2014-05-27 | Azure Vault Ltd. | Identifying outliers among chemical assays |
| WO2014110087A1 (en)* | 2013-01-09 | 2014-07-17 | Ppg Industries Ohio, Inc. | Systems and methods for statistical measurement control of spectrophotometric data |
| US8787630B2 (en) | 2004-08-11 | 2014-07-22 | Lumidigm, Inc. | Multispectral barcode imaging |
| US10338879B2 (en) | 2015-11-30 | 2019-07-02 | Huawei Technologies Co., Ltd. | Synchronization object determining method, apparatus, and system |
| CN110390478A (en)* | 2019-07-17 | 2019-10-29 | 江苏云脑数据科技有限公司 | Supervisory systems and monitoring and managing method after finance based on Internet of Things is borrowed |
| US10475529B2 (en) | 2011-07-19 | 2019-11-12 | Optiscan Biomedical Corporation | Method and apparatus for analyte measurements using calibration sets |
| CN110672552A (en)* | 2019-09-25 | 2020-01-10 | 南京林业大学 | A confidence estimation method for near-infrared spectroscopy detection results of vehicle fuel |
| CN110910021A (en)* | 2019-11-26 | 2020-03-24 | 上海华力集成电路制造有限公司 | Method for monitoring online defects based on support vector machine |
| CN111220565A (en)* | 2020-01-16 | 2020-06-02 | 东北大学秦皇岛分校 | CPLS-based infrared spectrum measuring instrument calibration migration method |
| EP3809118A1 (en)* | 2019-10-17 | 2021-04-21 | Evonik Operations GmbH | Method of prediction a property value of a material using principal component analysis |
| US20210257051A1 (en)* | 2018-06-08 | 2021-08-19 | Imperial College Of Science, Technology And Medicine | A method for analysis of real-time amplification data |
| US11288690B1 (en)* | 2001-12-28 | 2022-03-29 | Fannie Mae | Method for determining house price indices |
| CN115015131A (en)* | 2022-05-27 | 2022-09-06 | 四川启睿克科技有限公司 | Infrared spectroscopy training set sample screening method |
| US20220293227A1 (en)* | 2019-07-31 | 2022-09-15 | Somalogic Operating Co., Inc. | Method, apparatus, and computer-readable medium for adaptive normalization of analyte levels |
Citations (17)
| Publication number | Priority date | Publication date | Assignee | Title |
|---|---|---|---|---|
| US4660151A (en)* | 1983-09-19 | 1987-04-21 | Beckman Instruments, Inc. | Multicomponent quantitative analytical method and apparatus |
| US4661913A (en)* | 1984-09-11 | 1987-04-28 | Becton, Dickinson And Company | Apparatus and method for the detection and classification of articles using flow cytometry techniques |
| US4975581A (en)* | 1989-06-21 | 1990-12-04 | University Of New Mexico | Method of and apparatus for determining the similarity of a biological analyte from a model constructed from known biological fluids |
| US5047323A (en)* | 1986-01-22 | 1991-09-10 | Temple University Of The Commonwealth System Of Higher Education | Method for detecting human kininogen using monoclonal antibodies thereto |
| US5121338A (en)* | 1988-03-10 | 1992-06-09 | Indiana University Foundation | Method for detecting subpopulations in spectral analysis |
| US5199439A (en)* | 1990-01-16 | 1993-04-06 | Stanley Zimmerman | Medical statistical analyzing method |
| US5210778A (en)* | 1990-04-20 | 1993-05-11 | U.S. Philips Corporation | Analytical instrument and method of calibrating an analytical instrument |
| US5252489A (en)* | 1989-01-17 | 1993-10-12 | Macri James N | Down syndrome screening method utilizing dried blood samples |
| US5258907A (en)* | 1989-01-17 | 1993-11-02 | Macri James N | Method and apparatus for detecting down syndrome by non-invasive maternal blood screening |
| US5308982A (en)* | 1991-10-04 | 1994-05-03 | Perkin-Elmer Corporation | Method and apparatus for comparing spectra |
| US5316953A (en)* | 1989-01-17 | 1994-05-31 | Macri James N | Screening method for detecting fetal chromosal abnormalities |
| US5324667A (en)* | 1989-01-17 | 1994-06-28 | Macri James N | Method for detecting down sydrown by non-invasive maternal blood screening |
| US5324668A (en)* | 1989-01-17 | 1994-06-28 | Macri James N | Method for detecting trisomy 13 and Down syndrome by non-invasive maternal blood screening |
| US5348002A (en)* | 1992-04-23 | 1994-09-20 | Sirraya, Inc. | Method and apparatus for material analysis |
| US5348003A (en)* | 1992-09-03 | 1994-09-20 | Sirraya, Inc. | Method and apparatus for chemical analysis |
| US5355880A (en)* | 1992-07-06 | 1994-10-18 | Sandia Corporation | Reliable noninvasive measurement of blood gases |
| US5379764A (en)* | 1992-12-09 | 1995-01-10 | Diasense, Inc. | Non-invasive determination of analyte concentration in body of mammals |
- 1996
- 1996-01-16USUS08/587,017patent/US5606164A/ennot_activeExpired - Lifetime
Patent Citations (17)
| Publication number | Priority date | Publication date | Assignee | Title |
|---|---|---|---|---|
| US4660151A (en)* | 1983-09-19 | 1987-04-21 | Beckman Instruments, Inc. | Multicomponent quantitative analytical method and apparatus |
| US4661913A (en)* | 1984-09-11 | 1987-04-28 | Becton, Dickinson And Company | Apparatus and method for the detection and classification of articles using flow cytometry techniques |
| US5047323A (en)* | 1986-01-22 | 1991-09-10 | Temple University Of The Commonwealth System Of Higher Education | Method for detecting human kininogen using monoclonal antibodies thereto |
| US5121338A (en)* | 1988-03-10 | 1992-06-09 | Indiana University Foundation | Method for detecting subpopulations in spectral analysis |
| US5258907A (en)* | 1989-01-17 | 1993-11-02 | Macri James N | Method and apparatus for detecting down syndrome by non-invasive maternal blood screening |
| US5252489A (en)* | 1989-01-17 | 1993-10-12 | Macri James N | Down syndrome screening method utilizing dried blood samples |
| US5316953A (en)* | 1989-01-17 | 1994-05-31 | Macri James N | Screening method for detecting fetal chromosal abnormalities |
| US5324667A (en)* | 1989-01-17 | 1994-06-28 | Macri James N | Method for detecting down sydrown by non-invasive maternal blood screening |
| US5324668A (en)* | 1989-01-17 | 1994-06-28 | Macri James N | Method for detecting trisomy 13 and Down syndrome by non-invasive maternal blood screening |
| US4975581A (en)* | 1989-06-21 | 1990-12-04 | University Of New Mexico | Method of and apparatus for determining the similarity of a biological analyte from a model constructed from known biological fluids |
| US5199439A (en)* | 1990-01-16 | 1993-04-06 | Stanley Zimmerman | Medical statistical analyzing method |
| US5210778A (en)* | 1990-04-20 | 1993-05-11 | U.S. Philips Corporation | Analytical instrument and method of calibrating an analytical instrument |
| US5308982A (en)* | 1991-10-04 | 1994-05-03 | Perkin-Elmer Corporation | Method and apparatus for comparing spectra |
| US5348002A (en)* | 1992-04-23 | 1994-09-20 | Sirraya, Inc. | Method and apparatus for material analysis |
| US5355880A (en)* | 1992-07-06 | 1994-10-18 | Sandia Corporation | Reliable noninvasive measurement of blood gases |
| US5348003A (en)* | 1992-09-03 | 1994-09-20 | Sirraya, Inc. | Method and apparatus for chemical analysis |
| US5379764A (en)* | 1992-12-09 | 1995-01-10 | Diasense, Inc. | Non-invasive determination of analyte concentration in body of mammals |
Non-Patent Citations (10)
| Title |
|---|
| D. M. Haaland and E. V. Thomas, Partial Least Squares Methods for Spectral Analyses, 1, Relation to Other Quantitative Calibration Methods and the Extraction of Qualitative Information, Analytical Chemistry, 60, 1193 1202, (1988). No. Month.* |
| D. M. Haaland and E. V. Thomas, Partial Least-Squares Methods for Spectral Analyses, 1, Relation to Other Quantitative Calibration Methods and the Extraction of Qualitative Information, Analytical Chemistry, 60, 1193-1202, (1988). No. Month. |
| E. R. Malinowski, Theory of the Distribution of Error Eigenvalues Resulting from Principal Component Analysis with Application to Spectroscopic Data, Journal of Chemometrics, 1, 33 40, (1987). No Month.* |
| E. R. Malinowski, Theory of the Distribution of Error Eigenvalues Resulting from Principal Component Analysis with Application to Spectroscopic Data, Journal of Chemometrics, 1, 33-40, (1987). No Month. |
| H. L. Mark and D. Tunnell, Qualitative Near Infrared Reflectance Analysis Using Mahalanobis Distances, Analytical Chemistry 57, 1449 1456, (1985). No Month.* |
| H. L. Mark and D. Tunnell, Qualitative Near-Infrared Reflectance Analysis Using Mahalanobis Distances, Analytical Chemistry 57, 1449-1456, (1985). No Month. |
| N. K. Shah and P. J. Gemperline, Combination of the Mahalanobis Distance and Residual Variance Pattern Recognition Techniques for Classification of Near Infrared Reflectance Spectra, Analaytical Chemistry, 62, 465 470, (1990). No Month.* |
| N. K. Shah and P. J. Gemperline, Combination of the Mahalanobis Distance and Residual Variance Pattern Recognition Techniques for Classification of Near-Infrared Reflectance Spectra, Analaytical Chemistry, 62, 465-470, (1990). No Month. |
| S. Wold and M. Sjorstorm, article entitled SIMCA: A Method for Analyzing Chemical Data in Terms of Similarity and Analogy, in Chemometrics: Theory and Application, B. R. Kowalski, Ed., American Chemical Society, Washington, D.C. 242 282, (1977). No Month.* |
| S. Wold and M. Sjorstorm, article entitled SIMCA: A Method for Analyzing Chemical Data in Terms of Similarity and Analogy, in Chemometrics: Theory and Application, B. R. Kowalski, Ed., American Chemical Society, Washington, D.C. 242-282, (1977). No Month. |
Cited By (277)
| Publication number | Priority date | Publication date | Assignee | Title |
|---|---|---|---|---|
| US6718189B2 (en) | 1995-08-09 | 2004-04-06 | Rio Grande Medical Technologies, Inc. | Method and apparatus for non-invasive blood analyte measurement with fluid compartment equilibration |
| WO1997041420A1 (en)* | 1996-04-29 | 1997-11-06 | Petrometrix Ltd. | Spectral information transmission through communication optical fibers |
| US5822219A (en)* | 1996-05-13 | 1998-10-13 | Foss Nirsystems, Inc. | System for identifying materials by NIR spectrometry |
| WO1998043070A1 (en)* | 1997-03-25 | 1998-10-01 | Foss Electric A/S | Measurement of acetone in milk using ir spectroscopy |
| US6385549B1 (en) | 1997-03-25 | 2002-05-07 | Foss Electric A/S | Measurement of acetone in milk using IR spectroscopy |
| US9487398B2 (en) | 1997-06-09 | 2016-11-08 | Hid Global Corporation | Apparatus and method of biometric determination using specialized optical spectroscopy systems |
| US20080304712A1 (en)* | 1997-06-09 | 2008-12-11 | Lumidigm, Inc. | Apparatus and method of biometric determination using specialized optical spectroscopy systems |
| US20080146899A1 (en)* | 1997-08-14 | 2008-06-19 | Ruchti Timothy L | Method of sample control and calibration adjustment for use with a noninvasive analyzer |
| US6115673A (en)* | 1997-08-14 | 2000-09-05 | Instrumentation Metrics, Inc. | Method and apparatus for generating basis sets for use in spectroscopic analysis |
| US7383069B2 (en) | 1997-08-14 | 2008-06-03 | Sensys Medical, Inc. | Method of sample control and calibration adjustment for use with a noninvasive analyzer |
| US20050014997A1 (en)* | 1997-08-14 | 2005-01-20 | Ruchti Timothy L. | Method of sample control and calibration adjustment for use with a noninvasive analyzer |
| WO1999009395A1 (en)* | 1997-08-14 | 1999-02-25 | Instrumentation Metrics, Inc. | Method and apparatus for generating basis sets for use in spectroscopic analysis |
| EP1496350A3 (en)* | 1997-08-14 | 2005-06-22 | Sensys Medical, Inc. | Method and apparatus for generating basis sets for use in spectroscopic analysis |
| US6114699A (en)* | 1997-11-26 | 2000-09-05 | The United States Of America As Represented By The Secretary Of Agriculture | Prediction of total dietary fiber in cereal products using near-infrared reflectance spectroscopy |
| AU728964B2 (en)* | 1997-12-04 | 2001-01-25 | Roche Diagnostics Operations Inc. | Instrument setup utility program |
| US7401111B1 (en) | 1997-12-04 | 2008-07-15 | Roche Diagnostic Operations, Inc. | Instrument setup utility program |
| WO1999027849A1 (en)* | 1997-12-04 | 1999-06-10 | Roche Diagnostics Corporation | Instrument setup utility program |
| US6754543B1 (en)* | 1998-06-22 | 2004-06-22 | Umetri Aktiebolag | Method and arrangement for calibration of input data |
| US20060017923A1 (en)* | 1999-01-22 | 2006-01-26 | Ruchti Timothy L | Analyte filter method and apparatus |
| WO2000042907A1 (en)* | 1999-01-22 | 2000-07-27 | Instrumentation Metrics, Inc. | System and method for noninvasive blood analyte measurements |
| US6493566B1 (en)* | 1999-01-22 | 2002-12-10 | Instrumentation Metrics, Inc. | Classification system for sex determination and tissue characterization |
| EP1022550A3 (en)* | 1999-01-25 | 2000-09-06 | Aquacheck Systems Inc. | Colorimeter apparatus and related process |
| US6404500B1 (en) | 1999-01-25 | 2002-06-11 | Aqua Check Systems, Inc | Colorimeter apparatus and related process |
| US6341257B1 (en)* | 1999-03-04 | 2002-01-22 | Sandia Corporation | Hybrid least squares multivariate spectral analysis methods |
| US6442408B1 (en) | 1999-07-22 | 2002-08-27 | Instrumentation Metrics, Inc. | Method for quantification of stratum corneum hydration using diffuse reflectance spectroscopy |
| US6280381B1 (en) | 1999-07-22 | 2001-08-28 | Instrumentation Metrics, Inc. | Intelligent system for noninvasive blood analyte prediction |
| US6421614B1 (en)* | 1999-07-26 | 2002-07-16 | Donald S. Goldman | Photometer system for obtaining reliable data |
| US6696265B1 (en)* | 1999-08-17 | 2004-02-24 | Luminex Corporation | System and method for eliminating the effects of doublets and carryover |
| US6919566B1 (en) | 1999-08-31 | 2005-07-19 | Nir Diagnostics Inc. | Method of calibrating a spectroscopic device |
| WO2001016579A1 (en)* | 1999-08-31 | 2001-03-08 | Cme Telemetrix Inc. | Method of calibrating a spectroscopic device |
| US7203345B2 (en) | 1999-10-08 | 2007-04-10 | Lumidigm, Inc. | Apparatus and method for identification of individuals by near-infrared spectrum |
| US6816605B2 (en) | 1999-10-08 | 2004-11-09 | Lumidigm, Inc. | Methods and systems for biometric identification of individuals using linear optical spectroscopy |
| US7027149B2 (en)* | 2000-05-16 | 2006-04-11 | Jeacle Limited | Photometric analysis of natural waters |
| US20040130713A1 (en)* | 2000-05-16 | 2004-07-08 | O'mongain Eon | Photometric analysis of natural waters |
| US6477392B1 (en)* | 2000-07-14 | 2002-11-05 | Futrex Inc. | Calibration of near infrared quantitative measurement device using optical measurement cross-products |
| US6549861B1 (en) | 2000-08-10 | 2003-04-15 | Euro-Celtique, S.A. | Automated system and method for spectroscopic analysis |
| EP1315953A4 (en)* | 2000-08-10 | 2005-03-02 | Euro Celtique Sa | Automated system and method for spectroscopic analysis |
| US6675030B2 (en) | 2000-08-21 | 2004-01-06 | Euro-Celtique, S.A. | Near infrared blood glucose monitoring system |
| WO2002026152A1 (en)* | 2000-09-25 | 2002-04-04 | Instrumentation Metrics, Inc. | A method for quantification of stratum corneum hydration using diffuse reflectance spectroscopy |
| US6791674B2 (en)* | 2000-10-17 | 2004-09-14 | Japan As Represented By Director Of National Food Research Institute Ministry Of Agriculture Forestry And Fisheries | Analytical method and apparatus for blood using near infrared spectroscopy |
| US20020067476A1 (en)* | 2000-10-17 | 2002-06-06 | Sumio Kawano | Analytical method and apparatus for blood using near infrared spectroscopy |
| US7191181B2 (en)* | 2001-01-12 | 2007-03-13 | Microsoft Corporation | Database aggregation query result estimator |
| US20060053103A1 (en)* | 2001-01-12 | 2006-03-09 | Microsoft Corporation | Database aggregation query result estimator |
| US20060036600A1 (en)* | 2001-01-12 | 2006-02-16 | Microsoft Corporation | Database aggregation query result estimator |
| US7293037B2 (en)* | 2001-01-12 | 2007-11-06 | Microsoft Corporation | Database aggregation query result estimator |
| US7363301B2 (en)* | 2001-01-12 | 2008-04-22 | Microsoft Corporation | Database aggregation query result estimator |
| US20040236735A1 (en)* | 2001-01-12 | 2004-11-25 | Microsoft Corporation | Database aggregation query result estimator |
| US6862091B2 (en) | 2001-04-11 | 2005-03-01 | Inlight Solutions, Inc. | Illumination device and method for spectroscopic analysis |
| US20020171834A1 (en)* | 2001-04-11 | 2002-11-21 | Rowe Robert K. | Encoded variable filter spectrometer |
| US7126682B2 (en) | 2001-04-11 | 2006-10-24 | Rio Grande Medical Technologies, Inc. | Encoded variable filter spectrometer |
| US6983176B2 (en) | 2001-04-11 | 2006-01-03 | Rio Grande Medical Technologies, Inc. | Optically similar reference samples and related methods for multivariate calibration models used in optical spectroscopy |
| US6865408B1 (en) | 2001-04-11 | 2005-03-08 | Inlight Solutions, Inc. | System for non-invasive measurement of glucose in humans |
| US6574490B2 (en) | 2001-04-11 | 2003-06-03 | Rio Grande Medical Technologies, Inc. | System for non-invasive measurement of glucose in humans |
| US20020183624A1 (en)* | 2001-06-05 | 2002-12-05 | Rio Grande Medical Technologies, Inc. | Apparatus and method of biometric determination using specialized optical spectroscopy systems |
| US7890158B2 (en) | 2001-06-05 | 2011-02-15 | Lumidigm, Inc. | Apparatus and method of biometric determination using specialized optical spectroscopy systems |
| US7613504B2 (en) | 2001-06-05 | 2009-11-03 | Lumidigm, Inc. | Spectroscopic cross-channel method and apparatus for improved optical measurements of tissue |
| US20030043966A1 (en)* | 2001-09-03 | 2003-03-06 | Philippe Blin | Radiation emission device and method |
| US20050074834A1 (en)* | 2001-09-12 | 2005-04-07 | The State Of Or Acting By & Through The State Board Of Higher Educ. On Behalf Of Or State Univ. | Method and system for classifying a scenario |
| US6774632B2 (en) | 2001-09-14 | 2004-08-10 | Ge Medical Systems Global Technology Company, Llc | Failure prediction apparatus for superconductive magnet and magnetic resonance imaging system |
| US20030108976A1 (en)* | 2001-10-09 | 2003-06-12 | Braig James R. | Method and apparatus for improving clinical accuracy of analyte measurements |
| US7050157B2 (en) | 2001-11-08 | 2006-05-23 | Optiscan Biomedical Corp. | Reagent-less whole-blood glucose meter |
| US7872734B2 (en) | 2001-11-08 | 2011-01-18 | Optiscan Biomedical Corporation | In vitro determination of analyte levels within body fluids |
| US7480032B2 (en) | 2001-11-08 | 2009-01-20 | Optiscan Biomedical Corporation | Device and method for in vitro determination of analyte concentrations within body fluids |
| US20030086073A1 (en)* | 2001-11-08 | 2003-05-08 | Braig James R. | Reagent-less whole-blood glucose meter |
| US7738085B2 (en) | 2001-11-08 | 2010-06-15 | Optiscan Biomedical Corporation | Device and method for in vitro determination of analyte concentration within body fluids |
| US6989891B2 (en) | 2001-11-08 | 2006-01-24 | Optiscan Biomedical Corporation | Device and method for in vitro determination of analyte concentrations within body fluids |
| US7061593B2 (en) | 2001-11-08 | 2006-06-13 | Optiscan Biomedical Corp. | Device and method for in vitro determination of analyte concentrations within body fluids |
| US7999927B2 (en) | 2001-11-08 | 2011-08-16 | Optiscan Biomedical Corporation | In vitro determination of analyte levels within body fluids |
| US6958809B2 (en) | 2001-11-08 | 2005-10-25 | Optiscan Biomedical Corporation | Reagent-less whole-blood glucose meter |
| US20100249547A1 (en)* | 2001-11-08 | 2010-09-30 | Braig James R | Vitro determination of analyte levels within body fluids |
| US20060268258A1 (en)* | 2001-11-08 | 2006-11-30 | Braig James R | Device and method for in vitro determination of analyte concentrations within body fluids |
| US20090213360A1 (en)* | 2001-11-08 | 2009-08-27 | Optiscan Biomedical Corporation | Device and method for in vitro determination of analyte concentration within body fluids |
| US20110111449A1 (en)* | 2001-11-08 | 2011-05-12 | Braig James R | In vitro determination of analyte levels within body fluids |
| US20030086074A1 (en)* | 2001-11-08 | 2003-05-08 | Braig James R. | Device and method for in vitro determination of analyte concentrations within body fluids |
| US20040059206A1 (en)* | 2001-11-09 | 2004-03-25 | Braig James R. | Method for transforming phase spectra to absorption spectra |
| US6731961B2 (en) | 2001-11-09 | 2004-05-04 | Optiscan Biomedical Corp. | Method for transforming phase spectra to absorption spectra |
| US20030143116A1 (en)* | 2001-11-21 | 2003-07-31 | Peng Zheng | Method for adjusting a blood analyte measurement |
| US6825044B2 (en) | 2001-11-21 | 2004-11-30 | Optiscan Biomedical Corporation | Method for adjusting a blood analyte measurement |
| US7096124B2 (en) | 2001-12-14 | 2006-08-22 | Optiscan Biomedical Corporation | Method of determining an analyte concentration in a sample from an absorption spectrum |
| US20030178569A1 (en)* | 2001-12-14 | 2003-09-25 | Sterling Bernhard B. | Pathlength-independent methods for optically determining material composition |
| US20050197790A1 (en)* | 2001-12-14 | 2005-09-08 | Sterling Bernhard B. | Method of determining an analyte concentration in a sample from an absorption spectrum |
| US6862534B2 (en) | 2001-12-14 | 2005-03-01 | Optiscan Biomedical Corporation | Method of determining an analyte concentration in a sample from an absorption spectrum |
| US20040019431A1 (en)* | 2001-12-14 | 2004-01-29 | Sterling Bernhard B. | Method of determining an analyte concentration in a sample from an absorption spectrum |
| US7009180B2 (en) | 2001-12-14 | 2006-03-07 | Optiscan Biomedical Corp. | Pathlength-independent methods for optically determining material composition |
| US11288690B1 (en)* | 2001-12-28 | 2022-03-29 | Fannie Mae | Method for determining house price indices |
| US9554735B2 (en) | 2002-02-11 | 2017-01-31 | Ascensia Diabetes Care Holdings Ag | Method for building an algorithm for converting spectral information |
| US7299079B2 (en) | 2002-02-11 | 2007-11-20 | Bayer Healthcare Llc | Non-invasive system for the determination of analytes in body fluids |
| US20080045821A1 (en)* | 2002-02-11 | 2008-02-21 | Rebec Mihailo V | System for determining the concentration of an analyte |
| US8160666B2 (en) | 2002-02-11 | 2012-04-17 | Bayer Healthcare Llc | System for determining the concentration of an analyte |
| US20040092804A1 (en)* | 2002-02-11 | 2004-05-13 | Bayer Healthcare, Llc | Non-invasive system for the determination of analytes in body fluids |
| EP1335199A1 (en)* | 2002-02-11 | 2003-08-13 | Bayer Corporation | Non-invasive system for the determination of analytes in body fluids |
| US8452359B2 (en) | 2002-02-11 | 2013-05-28 | Bayer Healthcare Llc | Method for building an algorithm for converting spectral information |
| US6654125B2 (en) | 2002-04-04 | 2003-11-25 | Inlight Solutions, Inc | Method and apparatus for optical spectroscopy incorporating a vertical cavity surface emitting laser (VCSEL) as an interferometer reference |
| US7027848B2 (en) | 2002-04-04 | 2006-04-11 | Inlight Solutions, Inc. | Apparatus and method for non-invasive spectroscopic measurement of analytes in tissue using a matched reference analyte |
| US7043288B2 (en) | 2002-04-04 | 2006-05-09 | Inlight Solutions, Inc. | Apparatus and method for spectroscopic analysis of tissue to detect diabetes in an individual |
| US20040033617A1 (en)* | 2002-08-13 | 2004-02-19 | Sonbul Yaser R. | Topological near infrared analysis modeling of petroleum refinery products |
| US7620212B1 (en) | 2002-08-13 | 2009-11-17 | Lumidigm, Inc. | Electro-optical sensor |
| US6897071B2 (en) | 2002-08-13 | 2005-05-24 | Saudi Arabian Oil Company | Topological near infrared analysis modeling of petroleum refinery products |
| US20060110038A1 (en)* | 2002-09-12 | 2006-05-25 | Knee Michael J | Image processing |
| US7840068B2 (en)* | 2002-09-12 | 2010-11-23 | Snell Limited | System and method for video processing by image segmentation |
| US20060001869A1 (en)* | 2002-10-31 | 2006-01-05 | David Tuschel | Method and apparatus for dark field chemical imaging |
| US7408636B2 (en) | 2002-10-31 | 2008-08-05 | Chemimage Corporation | Method and apparatus for dark field chemical imaging |
| US20040132168A1 (en)* | 2003-01-06 | 2004-07-08 | Peter Rule | Sample element for reagentless whole blood glucose meter |
| US20050033127A1 (en)* | 2003-01-30 | 2005-02-10 | Euro-Celtique, S.A. | Wireless blood glucose monitoring system |
| US20050149300A1 (en)* | 2003-03-07 | 2005-07-07 | Ruchti Timothy L. | Method and apparatus for enhanced estimation of an analyte property through multiple region transformation |
| US7440597B2 (en) | 2003-04-04 | 2008-10-21 | Rowe Robert K | Liveness sensor |
| US20060002598A1 (en)* | 2003-04-04 | 2006-01-05 | Lumidigm, Inc. | Noninvasive alcohol sensor |
| US7386152B2 (en) | 2003-04-04 | 2008-06-10 | Lumidigm, Inc. | Noninvasive alcohol sensor |
| US20060202028A1 (en)* | 2003-04-04 | 2006-09-14 | Lumidigm, Inc. | Multispectral biometric sensor |
| US7668350B2 (en) | 2003-04-04 | 2010-02-23 | Lumidigm, Inc. | Comparative texture analysis of tissue for biometric spoof detection |
| US20050205667A1 (en)* | 2003-04-04 | 2005-09-22 | Lumidigm, Inc. | Combined total-internal-reflectance and tissue imaging systems and methods |
| US7147153B2 (en) | 2003-04-04 | 2006-12-12 | Lumidigm, Inc. | Multispectral biometric sensor |
| US20070030475A1 (en)* | 2003-04-04 | 2007-02-08 | Lumidigm, Inc. | White-light spectral biometric sensors |
| US7627151B2 (en) | 2003-04-04 | 2009-12-01 | Lumidigm, Inc. | Systems and methods for improved biometric feature definition |
| US20060002597A1 (en)* | 2003-04-04 | 2006-01-05 | Lumidigm, Inc. | Liveness sensor |
| US20060110015A1 (en)* | 2003-04-04 | 2006-05-25 | Lumidigm, Inc. | Systems and methods for improved biometric feature definition |
| US7735729B2 (en) | 2003-04-04 | 2010-06-15 | Lumidigm, Inc. | Biometric sensor |
| US20060210120A1 (en)* | 2003-04-04 | 2006-09-21 | Lumidigm, Inc. | Biometric sensor |
| US20040240712A1 (en)* | 2003-04-04 | 2004-12-02 | Lumidigm, Inc. | Multispectral biometric sensor |
| US8184873B2 (en) | 2003-04-04 | 2012-05-22 | Lumidigm, Inc. | White-light spectral biometric sensors |
| US7347365B2 (en) | 2003-04-04 | 2008-03-25 | Lumidigm, Inc. | Combined total-internal-reflectance and tissue imaging systems and methods |
| US7751594B2 (en) | 2003-04-04 | 2010-07-06 | Lumidigm, Inc. | White-light spectral biometric sensors |
| US7819311B2 (en) | 2003-04-04 | 2010-10-26 | Lumidigm, Inc. | Multispectral biometric sensor |
| US7545963B2 (en) | 2003-04-04 | 2009-06-09 | Lumidigm, Inc. | Texture-biometrics sensor |
| US20060062438A1 (en)* | 2003-04-04 | 2006-03-23 | Lumidigm, Inc. | Comparative texture analysis of tissue for biometric spoof detection |
| US20050036147A1 (en)* | 2003-04-15 | 2005-02-17 | Sterling Bernhard B. | Method of determining analyte concentration in a sample using infrared transmission data |
| US7593108B2 (en) | 2003-04-15 | 2009-09-22 | Optiscan Biomedical Corporation | Method of determining analyte concentration in a sample using infrared transmission data |
| US7271912B2 (en)* | 2003-04-15 | 2007-09-18 | Optiscan Biomedical Corporation | Method of determining analyte concentration in a sample using infrared transmission data |
| US20080212071A1 (en)* | 2003-04-15 | 2008-09-04 | Optiscan Biomedical Corporation | Method of determining analyte concentration in a sample using infrared transmission data |
| US20050007582A1 (en)* | 2003-07-07 | 2005-01-13 | Lumidigm, Inc. | Methods and apparatus for collection of optical reference measurements for monolithic sensors |
| US7307705B2 (en) | 2003-07-18 | 2007-12-11 | Chemimage Corporation | Method and apparatus for compact dispersive imaging spectrometer |
| US20060268266A1 (en)* | 2003-07-18 | 2006-11-30 | Gardner Charles W Jr | Method and apparatus for compact spectrometer for multipoint sampling of an object |
| US20070216898A1 (en)* | 2003-07-18 | 2007-09-20 | Gardner Charles W Jr | Sample container and system for a handheld spectrometer and method for using therefor |
| US7286222B2 (en) | 2003-07-18 | 2007-10-23 | Chemimage Corporation | Sample container and system for a handheld spectrometer and method for using therefor |
| US20050030657A1 (en)* | 2003-07-18 | 2005-02-10 | Maier John S. | Method and apparatus for multiwavelength imaging spectrometer |
| US20050030533A1 (en)* | 2003-07-18 | 2005-02-10 | Treado Patrick J. | Method and apparatus for compact dispersive imaging spectrometer |
| US7542138B2 (en) | 2003-07-18 | 2009-06-02 | Chemimage Corporation | Sample container and system for a handheld spectrometer and method for using therefor |
| US20080088837A1 (en)* | 2003-07-18 | 2008-04-17 | Chemimage Corporation | Sample container and system for a handheld spectrometer and method for using therefor |
| US7548310B2 (en) | 2003-07-18 | 2009-06-16 | Chemimage Corporation | Method and apparatus for compact spectrometer for multipoint sampling of an object |
| US7012695B2 (en) | 2003-07-18 | 2006-03-14 | Chemimage Corporation | Method and apparatus for multiwavelength imaging spectrometer |
| US20060007437A1 (en)* | 2003-07-18 | 2006-01-12 | Treado Patrick J | Method and apparatus for compact birefringent interference imaging spectrometer |
| US7262839B2 (en) | 2003-07-18 | 2007-08-28 | Chemlmage Corporation | Method and apparatus for compact birefringent interference imaging spectrometer |
| US20060209301A1 (en)* | 2003-07-18 | 2006-09-21 | Gardner Charles W Jr | Method and apparatus for compact spectrometer for fiber array spectral translator |
| US20060203238A1 (en)* | 2003-07-18 | 2006-09-14 | Gardner Charles W Jr | Method and apparatus for compact spectrometer for detecting hazardous agents |
| US20100213376A1 (en)* | 2003-07-18 | 2010-08-26 | Chemimage Corporation | Method and Apparatus for Compact Spectrometer for Multipoint Sampling of an Object |
| US7084972B2 (en) | 2003-07-18 | 2006-08-01 | Chemimage Corporation | Method and apparatus for compact dispersive imaging spectrometer |
| US20060146315A1 (en)* | 2003-07-18 | 2006-07-06 | Chemimage Corp. | Method and apparatus for compact dispersive imaging spectrometer |
| US6985233B2 (en) | 2003-07-18 | 2006-01-10 | Chemimage Corporation | Method and apparatus for compact Fabry-Perot imaging spectrometer |
| US7440096B2 (en) | 2003-07-18 | 2008-10-21 | Chemimage Corporation | Method and apparatus for compact spectrometer for fiber array spectral translator |
| US8269174B2 (en) | 2003-07-18 | 2012-09-18 | Chemimage Corporation | Method and apparatus for compact spectrometer for multipoint sampling of an object |
| US7738095B2 (en) | 2003-07-18 | 2010-06-15 | Chemimage Corporation | Method and apparatus for compact spectrometer for detecting hazardous agents |
| US20050073690A1 (en)* | 2003-10-03 | 2005-04-07 | Abbink Russell E. | Optical spectroscopy incorporating a vertical cavity surface emitting laser (VCSEL) |
| US7263213B2 (en) | 2003-12-11 | 2007-08-28 | Lumidigm, Inc. | Methods and systems for estimation of personal characteristics from biometric measurements |
| US7409299B2 (en) | 2004-03-29 | 2008-08-05 | Chemimage Corporation | Method for identifying components of a mixture via spectral analysis |
| US20070061091A1 (en)* | 2004-03-29 | 2007-03-15 | Robert Schweitzer | Method for identifying components of a mixture via spectral analysis |
| US7072770B1 (en) | 2004-03-29 | 2006-07-04 | Chemimage Corporation | Method for identifying components of a mixture via spectral analysis |
| US20060023217A1 (en)* | 2004-05-28 | 2006-02-02 | Chemimage Corporation | Method and apparatus for producing a mosaic image |
| US20090092290A1 (en)* | 2004-06-01 | 2009-04-09 | Lumidigm, Inc. | Multispectral Imaging Biometrics |
| US8913800B2 (en) | 2004-06-01 | 2014-12-16 | Lumidigm, Inc. | Optical biometrics imaging with films |
| US7460696B2 (en) | 2004-06-01 | 2008-12-02 | Lumidigm, Inc. | Multispectral imaging biometrics |
| US20080298649A1 (en)* | 2004-06-01 | 2008-12-04 | Lumidigm, Inc. | Hygienic biometric sensors |
| US20100067748A1 (en)* | 2004-06-01 | 2010-03-18 | Lumidigm, Inc. | Two camera biometric imaging |
| US20050265585A1 (en)* | 2004-06-01 | 2005-12-01 | Lumidigm, Inc. | Multispectral liveness determination |
| US8229185B2 (en) | 2004-06-01 | 2012-07-24 | Lumidigm, Inc. | Hygienic biometric sensors |
| US7835554B2 (en) | 2004-06-01 | 2010-11-16 | Lumidigm, Inc. | Multispectral imaging biometrics |
| US7539330B2 (en) | 2004-06-01 | 2009-05-26 | Lumidigm, Inc. | Multispectral liveness determination |
| US7831072B2 (en) | 2004-06-01 | 2010-11-09 | Lumidigm, Inc. | Multispectral imaging biometrics |
| US20050271258A1 (en)* | 2004-06-01 | 2005-12-08 | Lumidigm, Inc. | Multispectral imaging biometrics |
| US7508965B2 (en) | 2004-06-01 | 2009-03-24 | Lumidigm, Inc. | System and method for robust fingerprint acquisition |
| US20070116331A1 (en)* | 2004-06-01 | 2007-05-24 | Lumidigm, Inc. | System and method for robust fingerprint acquisition |
| US8165357B2 (en) | 2004-06-01 | 2012-04-24 | Lumidigm, Inc. | Two camera biometric imaging |
| US7394919B2 (en) | 2004-06-01 | 2008-07-01 | Lumidigm, Inc. | Multispectral biometric imaging |
| US20060001881A1 (en)* | 2004-06-30 | 2006-01-05 | Maier John S | Method and apparatus for peak compensation in an optical filter |
| US7239383B2 (en) | 2004-06-30 | 2007-07-03 | Chemimage Corporation | Method and apparatus for spectral modulation compensation |
| US7286231B2 (en) | 2004-06-30 | 2007-10-23 | Chemimage Corp. | Method and apparatus for peak compensation in an optical filter |
| US20060001867A1 (en)* | 2004-06-30 | 2006-01-05 | Maier John S | Method and apparatus for spectral modulation compensation |
| US7411672B2 (en) | 2004-06-30 | 2008-08-12 | Chemimage Corporation | Method and apparatus for chemical imaging in a microfluidic circuit |
| US20060080041A1 (en)* | 2004-07-08 | 2006-04-13 | Anderson Gary R | Chemical mixing apparatus, system and method |
| US20080172141A1 (en)* | 2004-07-08 | 2008-07-17 | Simpson Michael B | Chemical Mixing Apparatus, System And Method |
| US7281840B2 (en) | 2004-07-09 | 2007-10-16 | Tres-Ark, Inc. | Chemical mixing apparatus |
| US20060009875A1 (en)* | 2004-07-09 | 2006-01-12 | Simpson Michael B | Chemical mixing apparatus, system and method |
| WO2006019991A3 (en)* | 2004-07-15 | 2008-07-31 | Cheminage Corp | Method and apparatus for multimodal detection |
| US8787630B2 (en) | 2004-08-11 | 2014-07-22 | Lumidigm, Inc. | Multispectral barcode imaging |
| US7394542B2 (en) | 2004-08-18 | 2008-07-01 | Chemimage Corporation | Method and apparatus for chemical imaging in a microfluidic circuit |
| US20060170916A1 (en)* | 2005-01-31 | 2006-08-03 | Voigt Thomas C | Method and apparatus for variable-field illumination |
| US20070103678A1 (en)* | 2005-02-14 | 2007-05-10 | Sterling Bernhard B | Analyte detection system with interferent identification and correction |
| US20090326343A1 (en)* | 2005-02-14 | 2009-12-31 | Optiscan Biomedical Corporation | Fluid handling cassette having a spectroscopic sample cell |
| US8197770B2 (en) | 2005-02-14 | 2012-06-12 | Optiscan Biomedical Corporation | Fluid handling cassette having a spectroscopic sample cell |
| US20060200070A1 (en)* | 2005-02-14 | 2006-09-07 | Callicoat David N | Method and apparatus for calibrating an analyte detection system with a calibration sample |
| US20090171593A1 (en)* | 2005-04-15 | 2009-07-02 | Robert Schweitzer | System and Method for Partitioning Chemometric Analysis |
| US7933430B2 (en) | 2005-04-15 | 2011-04-26 | Chemimage Corporation | Method and apparatus for spectral mixture resolution |
| US10360995B2 (en) | 2005-04-15 | 2019-07-23 | Chemlmage Technologies LLC | System and method for partitioning chemometric analysis |
| US8180422B2 (en) | 2005-04-15 | 2012-05-15 | Bayer Healthcare Llc | Non-invasive system and method for measuring an analyte in the body |
| US20090062632A1 (en)* | 2005-04-15 | 2009-03-05 | Rebec Mihailo V | Non-Invasive System and Method for Measuring an Analyte in the Body |
| US20090043514A1 (en)* | 2005-04-15 | 2009-02-12 | Robert Schweitzer | Method and apparatus for spectral mixture resolution |
| US7801338B2 (en) | 2005-04-27 | 2010-09-21 | Lumidigm, Inc. | Multispectral biometric sensors |
| US20060276697A1 (en)* | 2005-06-07 | 2006-12-07 | Chemlmage Corporation | Non-invasive biochemical analysis |
| US20060276713A1 (en)* | 2005-06-07 | 2006-12-07 | Chemimage Corporation | Invasive chemometry |
| US7330746B2 (en) | 2005-06-07 | 2008-02-12 | Chem Image Corporation | Non-invasive biochemical analysis |
| US8532726B2 (en) | 2005-06-07 | 2013-09-10 | ChemImage Technologies, LLL | Invasive chemometry |
| US20080227142A1 (en)* | 2005-06-07 | 2008-09-18 | Chemimage Corporation | Invasive chemometry |
| US7363115B2 (en) | 2005-07-08 | 2008-04-22 | Tres-Ark, Inc. | Batch mixing method with first derivative homogeneity monitoring |
| US20070043473A1 (en)* | 2005-07-08 | 2007-02-22 | Anderson Gary R | Point-of-use mixing method with standard deviation homogeneity monitoring |
| US20070043472A1 (en)* | 2005-07-08 | 2007-02-22 | Anderson Gary R | Batch mixing method with first derivative homogeneity monitoring |
| US20070043471A1 (en)* | 2005-07-08 | 2007-02-22 | Anderson Gary R | Batch mixing method with standard deviation homogeneity monitoring |
| US20070106425A1 (en)* | 2005-07-08 | 2007-05-10 | Anderson Gary R | Point-of-use mixing method with first derivative homogeneity monitoring |
| US7363114B2 (en) | 2005-07-08 | 2008-04-22 | Tres-Ark, Inc. | Batch mixing method with standard deviation homogeneity monitoring |
| US8054454B2 (en) | 2005-07-14 | 2011-11-08 | Chemimage Corporation | Time and space resolved standoff hyperspectral IED explosives LIDAR detector |
| US20080084553A1 (en)* | 2005-07-14 | 2008-04-10 | Neiss Jason H | Method And Apparatus For Multimodal Detection |
| US7679740B2 (en)* | 2005-07-14 | 2010-03-16 | Chemimage Corporation | Method and apparatus for multimodal detection |
| US20100225899A1 (en)* | 2005-12-23 | 2010-09-09 | Chemimage Corporation | Chemical Imaging Explosives (CHIMED) Optical Sensor using SWIR |
| US8368880B2 (en) | 2005-12-23 | 2013-02-05 | Chemimage Corporation | Chemical imaging explosives (CHIMED) optical sensor using SWIR |
| US20110237446A1 (en)* | 2006-06-09 | 2011-09-29 | Chemlmage Corporation | Detection of Pathogenic Microorganisms Using Fused Raman, SWIR and LIBS Sensor Data |
| US20110080577A1 (en)* | 2006-06-09 | 2011-04-07 | Chemlmage Corporation | System and Method for Combined Raman, SWIR and LIBS Detection |
| US8582089B2 (en) | 2006-06-09 | 2013-11-12 | Chemimage Corporation | System and method for combined raman, SWIR and LIBS detection |
| US20080123712A1 (en)* | 2006-06-15 | 2008-05-29 | Spectrasensors, Inc. | Measuring water vapor in high purity gases |
| US20110235872A1 (en)* | 2006-07-19 | 2011-09-29 | Lumidigm, Inc. | Contactless multispectral biometric capture |
| US8781181B2 (en) | 2006-07-19 | 2014-07-15 | Lumidigm, Inc. | Contactless multispectral biometric capture |
| US8175346B2 (en) | 2006-07-19 | 2012-05-08 | Lumidigm, Inc. | Whole-hand multispectral biometric imaging |
| US7995808B2 (en) | 2006-07-19 | 2011-08-09 | Lumidigm, Inc. | Contactless multispectral biometric capture |
| US8831297B2 (en) | 2006-07-19 | 2014-09-09 | Lumidigm, Inc. | Contactless multispectral biometric capture |
| US20080192988A1 (en)* | 2006-07-19 | 2008-08-14 | Lumidigm, Inc. | Multibiometric multispectral imager |
| US7899217B2 (en) | 2006-07-19 | 2011-03-01 | Lumidign, Inc. | Multibiometric multispectral imager |
| US20090245591A1 (en)* | 2006-07-19 | 2009-10-01 | Lumidigm, Inc. | Contactless Multispectral Biometric Capture |
| US20090080709A1 (en)* | 2006-07-19 | 2009-03-26 | Lumidigm, Inc. | Whole-Hand Multispectral Biometric Imaging |
| US7804984B2 (en) | 2006-07-31 | 2010-09-28 | Lumidigm, Inc. | Spatial-spectral fingerprint spoof detection |
| US7801339B2 (en) | 2006-07-31 | 2010-09-21 | Lumidigm, Inc. | Biometrics with spatiospectral spoof detection |
| US20110139989A1 (en)* | 2006-09-13 | 2011-06-16 | Pawlak Andrzej M | Method and Apparatus for A Universal Infrared Analyzer |
| US8164061B2 (en) | 2006-09-13 | 2012-04-24 | Delphi Technologies, Inc. | Method and apparatus for a universal infrared analyzer |
| US7990532B2 (en) | 2007-01-16 | 2011-08-02 | Chemimage Corporation | Method and apparatus for multimodal detection |
| US20080232653A1 (en)* | 2007-03-21 | 2008-09-25 | Lumidigm, Inc. | Biometrics based on locally consistent features |
| US8285010B2 (en) | 2007-03-21 | 2012-10-09 | Lumidigm, Inc. | Biometrics based on locally consistent features |
| US20090046903A1 (en)* | 2007-04-10 | 2009-02-19 | Lumidigm, Inc. | Biometric Detection Using Spatial, Temporal, And/Or Spectral Techniques |
| US8355545B2 (en) | 2007-04-10 | 2013-01-15 | Lumidigm, Inc. | Biometric detection using spatial, temporal, and/or spectral techniques |
| US8597190B2 (en) | 2007-05-18 | 2013-12-03 | Optiscan Biomedical Corporation | Monitoring systems and methods with fast initialization |
| US8095322B2 (en)* | 2007-06-29 | 2012-01-10 | Roche Molecular Systems, Inc. | Systems and methods for determining cross-talk coefficients in PCR and other data sets |
| US20090035779A1 (en)* | 2007-06-29 | 2009-02-05 | Roche Molecular Systems, Inc. | Systems and methods for determining cross-talk coefficients in pcr and other data sets |
| CN101688841B (en)* | 2007-06-29 | 2011-12-07 | 霍夫曼-拉罗奇有限公司 | Systems and methods for determining crosstalk coefficients in PCR and other data sets |
| US7626696B2 (en) | 2007-08-07 | 2009-12-01 | Chemimage Corporation | Method and apparatus for reconfigurable field of view in a FAST-based imaging system |
| US20090040519A1 (en)* | 2007-08-07 | 2009-02-12 | Jingyun Zhang | Method and apparatus for reconfigurable field of view in a fast-based imaging system |
| US20090157430A1 (en)* | 2007-10-11 | 2009-06-18 | Peter Rule | Synchronization and configuration of patient monitoring devices |
| US20100049444A1 (en)* | 2008-08-21 | 2010-02-25 | Bio-Red Laboratories, Inc. | Calibration surface method for determination of analyte ratios |
| WO2010021914A3 (en)* | 2008-08-21 | 2010-05-14 | Bio-Rad Laboratories, Inc. | Calibration surface method for determination of analyte ratios |
| US8260556B2 (en) | 2008-08-21 | 2012-09-04 | Bio-Rad Laboratories, Inc. | Calibration surface method for determination on of analyte ratios |
| CN102159947B (en)* | 2008-08-21 | 2014-11-19 | 生物辐射实验室股份有限公司 | Calibration surface method for determination of analyte ratios |
| CN102159947A (en)* | 2008-08-21 | 2011-08-17 | 生物辐射实验室股份有限公司 | Calibration surface method for determination of analyte ratios |
| US20100246902A1 (en)* | 2009-02-26 | 2010-09-30 | Lumidigm, Inc. | Method and apparatus to combine biometric sensing and other functionality |
| US8731250B2 (en) | 2009-08-26 | 2014-05-20 | Lumidigm, Inc. | Multiplexed biometric imaging |
| US20110211055A1 (en)* | 2009-08-26 | 2011-09-01 | Lumidigm, Inc. | Dual-imager biometric sensor |
| US8872908B2 (en) | 2009-08-26 | 2014-10-28 | Lumidigm, Inc | Dual-imager biometric sensor |
| US20110085708A1 (en)* | 2009-08-26 | 2011-04-14 | Lumidigm. Inc. | Multiplexed biometric imaging |
| US9103714B2 (en) | 2009-10-06 | 2015-08-11 | Chemimage Corporation | System and methods for explosives detection using SWIR |
| US20110089323A1 (en)* | 2009-10-06 | 2011-04-21 | Chemlmage Corporation | System and methods for explosives detection using SWIR |
| US8570149B2 (en) | 2010-03-16 | 2013-10-29 | Lumidigm, Inc. | Biometric imaging using an optical adaptive interface |
| US20120116689A1 (en)* | 2010-11-04 | 2012-05-10 | Agilent Technologies, Inc. | Peak correlation and clustering in fluidic sample separation |
| US9792416B2 (en)* | 2010-11-04 | 2017-10-17 | Agilent Technologies, Inc. | Peak correlation and clustering in fluidic sample separation |
| US8738303B2 (en) | 2011-05-02 | 2014-05-27 | Azure Vault Ltd. | Identifying outliers among chemical assays |
| US8660968B2 (en) | 2011-05-25 | 2014-02-25 | Azure Vault Ltd. | Remote chemical assay classification |
| US9026481B2 (en) | 2011-05-25 | 2015-05-05 | Azure Vault Ltd. | Remote chemical assay system |
| US10475529B2 (en) | 2011-07-19 | 2019-11-12 | Optiscan Biomedical Corporation | Method and apparatus for analyte measurements using calibration sets |
| CN105899940A (en)* | 2013-01-09 | 2016-08-24 | Ppg工业俄亥俄公司 | Systems and methods for statistical measurement control of spectrophotometric data |
| CN105899940B (en)* | 2013-01-09 | 2018-09-28 | Ppg工业俄亥俄公司 | Systems and methods for statistical measurement control of spectrophotometric data |
| US9606055B2 (en) | 2013-01-09 | 2017-03-28 | Ppg Industries Ohio, Inc. | Systems and methods for statistical measurement control of spectrophotometric data |
| WO2014110087A1 (en)* | 2013-01-09 | 2014-07-17 | Ppg Industries Ohio, Inc. | Systems and methods for statistical measurement control of spectrophotometric data |
| US10338879B2 (en) | 2015-11-30 | 2019-07-02 | Huawei Technologies Co., Ltd. | Synchronization object determining method, apparatus, and system |
| US20210257051A1 (en)* | 2018-06-08 | 2021-08-19 | Imperial College Of Science, Technology And Medicine | A method for analysis of real-time amplification data |
| CN110390478A (en)* | 2019-07-17 | 2019-10-29 | 江苏云脑数据科技有限公司 | Supervisory systems and monitoring and managing method after finance based on Internet of Things is borrowed |
| US20220293227A1 (en)* | 2019-07-31 | 2022-09-15 | Somalogic Operating Co., Inc. | Method, apparatus, and computer-readable medium for adaptive normalization of analyte levels |
| CN110672552A (en)* | 2019-09-25 | 2020-01-10 | 南京林业大学 | A confidence estimation method for near-infrared spectroscopy detection results of vehicle fuel |
| CN110672552B (en)* | 2019-09-25 | 2022-06-07 | 南京林业大学 | A confidence estimation method for near-infrared spectroscopy detection results of vehicle fuel |
| WO2021073908A1 (en)* | 2019-10-17 | 2021-04-22 | Evonik Operations Gmbh | Method for predicting a property value of interest of a material |
| EP3809118A1 (en)* | 2019-10-17 | 2021-04-21 | Evonik Operations GmbH | Method of prediction a property value of a material using principal component analysis |
| US12055480B2 (en) | 2019-10-17 | 2024-08-06 | Evonik Operations Gmbh | Method for predicting a property value of interest of a material |
| CN110910021A (en)* | 2019-11-26 | 2020-03-24 | 上海华力集成电路制造有限公司 | Method for monitoring online defects based on support vector machine |
| CN111220565A (en)* | 2020-01-16 | 2020-06-02 | 东北大学秦皇岛分校 | CPLS-based infrared spectrum measuring instrument calibration migration method |
| CN111220565B (en)* | 2020-01-16 | 2022-07-29 | 东北大学秦皇岛分校 | CPLS-based infrared spectrum measuring instrument calibration migration method |
| CN115015131A (en)* | 2022-05-27 | 2022-09-06 | 四川启睿克科技有限公司 | Infrared spectroscopy training set sample screening method |
Similar Documents
| Publication | Publication Date | Title |
|---|---|---|
| US5606164A (en) | Method and apparatus for biological fluid analyte concentration measurement using generalized distance outlier detection | |
| CA2228844C (en) | Biological fluid analysis using distance outlier detection | |
| JP3130931B2 (en) | Methods for estimating the properties and / or composition of test samples | |
| US6280381B1 (en) | Intelligent system for noninvasive blood analyte prediction | |
| US6876931B2 (en) | Automatic process for sample selection during multivariate calibration | |
| Pizarro et al. | Determination of the peroxide value in extra virgin olive oils through the application of the stepwise orthogonalisation of predictors to mid-infrared spectra | |
| EP0552300B1 (en) | Spectral data measurement and correction | |
| Yuan et al. | Models fused with successive CARS-PLS for measurement of the soluble solids content of Chinese bayberry by vis-NIRS technology | |
| AU754677B2 (en) | System and method for noninvasive blood analyte measurements | |
| EP0954744B1 (en) | Calibration method for spectrographic analyzing instruments | |
| Sun | Statistical analysis of NIR data: Data pretreatment | |
| EP4306919B1 (en) | Spectroscopic analysis system and spectroscopic analysis method | |
| US6629041B1 (en) | Methods to significantly reduce the calibration cost of multichannel measurement instruments | |
| González et al. | Fingermark analysis by fourier transform infrared microscopy using chemometric tools | |
| Bjørsvik et al. | Data analysis: calibration of NIR instruments by PLS regression | |
| JP2002506991A (en) | Automatic calibration method | |
| Ruckebusch et al. | On-line mid-infrared spectroscopic data and chemometrics for the monitoring of an enzymatic hydrolysis | |
| MXPA98001056A (en) | Analysis of a biological fluid using the detection of results in aisla intervals | |
| Mirghani et al. | Multivariate calibration of Fourier transform infrared spectra for determining thiobarbituric acid-reactive substance content in palm oil | |
| Azcarate et al. | Classification and Modeling Methods | |
| Liu et al. | Estimation of the age of bloodstains under the simulated crime scene by ATR-FTIR spectroscopy and machine learning | |
| Zhou et al. | Non‐Destructive Measurement of Sugar Content in Litchis Using Visible and Near‐Infrared Spectroscopy and Fuzzy Stochastic Configuration Network | |
| CN119688642A (en) | A method for detecting xylose content based on near infrared spectroscopy and a readable storage medium | |
| Weiling et al. | Application of GA-PLS for Feature Selection and Calibration in Biological Sample | |
| Huang et al. | Feature Wavelengths Selection Using Successive Projections Algorithm for Prediction of Apple Firmness and Soluble Solids Content |
Legal Events
| Date | Code | Title | Description |
|---|---|---|---|
| AS | Assignment | Owner name:BOEHRINGER MANNHEIM CORPORATION, INDIANA Free format text:ASSIGNMENT OF ASSIGNORS INTEREST;ASSIGNORS:PRICE, JOHN F.;LONG, JAMES R.;REEL/FRAME:007845/0665 Effective date:19960112 | |
| STCF | Information on status: patent grant | Free format text:PATENTED CASE | |
| CC | Certificate of correction | ||
| AS | Assignment | Owner name:ROCHE DIAGNOSTICS CORPORATION, INDIANA Free format text:CHANGE OF NAME;ASSIGNOR:BOEHRINGER MANNHEIM CORPORATION;REEL/FRAME:009731/0864 Effective date:19981211 | |
| FEPP | Fee payment procedure | Free format text:PAYOR NUMBER ASSIGNED (ORIGINAL EVENT CODE: ASPN); ENTITY STATUS OF PATENT OWNER: LARGE ENTITY | |
| FPAY | Fee payment | Year of fee payment:4 | |
| FPAY | Fee payment | Year of fee payment:8 | |
| AS | Assignment | Owner name:ROCHE DIAGNOSTICS OPERATIONS, INC., INDIANA Free format text:ASSIGNMENT OF ASSIGNORS INTEREST;ASSIGNOR:ROCHE DIAGNOSTICS CORPORATION;REEL/FRAME:015215/0061 Effective date:20040101 Owner name:ROCHE DIAGNOSTICS OPERATIONS, INC.,INDIANA Free format text:ASSIGNMENT OF ASSIGNORS INTEREST;ASSIGNOR:ROCHE DIAGNOSTICS CORPORATION;REEL/FRAME:015215/0061 Effective date:20040101 | |
| FPAY | Fee payment | Year of fee payment:12 | |
| AS | Assignment | Owner name:ROCHE DIABETES CARE, INC., INDIANA Free format text:ASSIGNMENT OF ASSIGNORS INTEREST;ASSIGNOR:ROCHE DIAGNOSTICS OPERATIONS, INC.;REEL/FRAME:036008/0670 Effective date:20150302 |