US5537541A - System independent interface for performance counters - Google Patents
System independent interface for performance countersDownload PDFInfo
- Publication number
- US5537541A US5537541AUS08/291,240US29124094AUS5537541AUS 5537541 AUS5537541 AUS 5537541AUS 29124094 AUS29124094 AUS 29124094AUS 5537541 AUS5537541 AUS 5537541A
- Authority
- US
- United States
- Prior art keywords
- events
- counters
- event
- performance
- routine
- Prior art date
- Legal status (The legal status is an assumption and is not a legal conclusion. Google has not performed a legal analysis and makes no representation as to the accuracy of the status listed.)
- Expired - Lifetime
Links
Images


Classifications
- G—PHYSICS
- G06—COMPUTING OR CALCULATING; COUNTING
- G06F—ELECTRIC DIGITAL DATA PROCESSING
- G06F11/00—Error detection; Error correction; Monitoring
- G06F11/30—Monitoring
- G06F11/34—Recording or statistical evaluation of computer activity, e.g. of down time, of input/output operation ; Recording or statistical evaluation of user activity, e.g. usability assessment
- G06F11/3466—Performance evaluation by tracing or monitoring
- G06F11/348—Circuit details, i.e. tracer hardware
- G—PHYSICS
- G06—COMPUTING OR CALCULATING; COUNTING
- G06F—ELECTRIC DIGITAL DATA PROCESSING
- G06F11/00—Error detection; Error correction; Monitoring
- G06F11/30—Monitoring
- G06F11/34—Recording or statistical evaluation of computer activity, e.g. of down time, of input/output operation ; Recording or statistical evaluation of user activity, e.g. usability assessment
- G06F11/3409—Recording or statistical evaluation of computer activity, e.g. of down time, of input/output operation ; Recording or statistical evaluation of user activity, e.g. usability assessment for performance assessment
- G—PHYSICS
- G06—COMPUTING OR CALCULATING; COUNTING
- G06F—ELECTRIC DIGITAL DATA PROCESSING
- G06F2201/00—Indexing scheme relating to error detection, to error correction, and to monitoring
- G06F2201/86—Event-based monitoring
- G—PHYSICS
- G06—COMPUTING OR CALCULATING; COUNTING
- G06F—ELECTRIC DIGITAL DATA PROCESSING
- G06F2201/00—Indexing scheme relating to error detection, to error correction, and to monitoring
- G06F2201/88—Monitoring involving counting
Definitions
- the present inventionrelates generally to computer systems, and more particularly to monitoring a performance of computer systems.
- Performance datacan identify how efficiently software uses hardware, and can be helpful in identifying potential hardware problems.
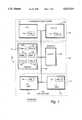
- FIG. 1shows a possible prior art arrangement of a computer system 100 to be monitored for performance.
- the system 100includes a processor sub-system 110, a memory sub-system 120, and an input/output (I/O) sub-system 130 connected to each other by a communications bus 140.
- the processor sub-system 110can include one or more central processing units (CPUs) 111-112. The CPUs can be of different designs, each executing instructions substantially in parallel.
- the memory sub-system 120can include a main memory 121 and one or more caches 122 to accelerate data access.
- the I/O sub-system 130can include I/O units 131-132 for supplying and persistently storing data.
- the CPUs 111-112include on-board performance monitoring logic PML-A 113 and PML-B 114.
- the I/O units 131-132include performance monitoring logic PML-C 133 and PML-D 134.
- operating system software stored in the main memory 121can include software maintained performance monitoring logic PML-E 123.
- each of the performance monitoring logic 113-114, 133-134, and 123includes one or more "counters" for counting "events" which are indicative of system performance. Events can be, for example, cache misses, instructions executed, I/O data transfer requests, and so forth.
- Known hardware and software performance monitoring systemstypically include performance monitoring routines specifically designed for particular performance logic designs.
- the performance monitoring routines PMR-A 125only operate in conjunction with PML-A 113.
- Each of the performance monitoring routinesis typically associated with data buffers designed for collecting specific performance data of the associated routines.
- the performance monitoring routines 125-129are not easily extensible when the hardware and architecture are modified. Re-engineering performance systems takes time and consumes resources. Furthermore, the specific design characteristics of known monitoring routines typically inhibits their transportability to completely different components of the system. For example, the PMR-A 125 and PMR-B 126, designed for collecting performance data from processors, can generally not be used to collect I/O performance data generated by the I/O performance logic PML-C 133. Similarly, only the PMR-E 129 can collect performance data from the software maintained logic PML-E 123.
- known monitoring systemsare designed to work with a specific operating system. Therefore, multiple versions of the monitoring systems are required in situations where a single processor can execute with different operating systems. Also, known monitoring systems tend to use data structures which are difficult to access by application programs. Direct access to the performance data by application software is generally precluded.
- the interfaceshould be independent of the hardware and software of the system. Additionally, the performance data collected should be easily accessible to application programs.
- events indicative of the performance of the systemare generated by system hardware and software programs.
- a plurality of countersare available to count the events.
- a single countermay, at any one time, count one of a list of associated events.
- the design of the countersmay be different. It is desired to count the events without knowing specifically which counters can count which events.
- a userrequests control of the counters. If the request for control of the counters is granted, a set of events is selected for monitoring from all of the events which can be monitored. Attributes which characterize the events and counters are maintained in an attribute table. A determination is made if the events of the set of events are valid. If the set of events are determined to be valid, each event of the set are coupled to a corresponding one of the counters. The counters are then enabled to count the events of the set according to selected attributes.
- FIG. 1is a block diagram of a computer system including prior art performance monitoring systems
- FIG. 2is a block diagram of a performance monitoring system arranged according to principles of the invention
- FIG. 3is a block diagram of a performance monitoring logic including event counters
- FIG. 4is a top level flow diagram of a processor independent interface according to a preferred embodiment of the invention.
- FIG. 5is a block diagram of performance monitoring routines
- FIG. 6is a block diagram of counter routines
- FIG. 7is a block diagram of sample buffers
- FIG. 8is flow diagram of a performance monitoring process according to the principles of the invention.
- FIG. 2shows a computer system 200 that can be monitored according to the principles of the invention.
- the computer system 200can be a personal computer, a work-station, a main-frame, or part of a network of computers executing process steps independently, or in parallel.
- the computer system 200can include a processor sub-system 210, a memory sub-system 220, and an input/output (I/O) sub-system 230 connected to each other by a communications bus 240.
- the processor sub-system 210includes CPUs 211-212.
- the memory sub-system 220includes a main memory 221, and one or more caches 222.
- the I/O subsystem 230can include an input I/O unit 231, and an output I/O unit 232.
- the operation of the system 200is controlled by machine instructions stored in the memory sub-system 220 as operating system and application software.
- datacan be read from the I/O sub-system 230 for processing by the processing sub-system 210. After processing, the data are written to the I/O sub-system 230 for persistent storage.
- the instructions of the processescan be executed in different processor modes.
- the CPU 211can execute instructions of a process in a kemel, executive, supervisor, or user mode, each mode having an associated level of data security and processing restrictions, the kernel mode the least, and the user mode the most.
- performance monitoring logic 300It is desirable to monitor the performance of the computer system 200 while the system is operating. Analysis of performance data can be used to optimize the design of the hardware and software components of the system 200. In one embodiment of the invention, some of the performance data are generated by a performance monitoring logic (PML) 300.
- PMLperformance monitoring logic
- the sub-systems 220 and 230also incorporate performance monitoring logic 301 and 302. Typically, the logics 300-302 are of different design.
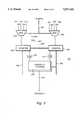
- FIG. 3shows the PML 300.
- Signals or "events” representing various operating characteristics of the components being monitoredare presented on lines 311-215, and lines 321-215.
- the exact events which are signaledare usually component specific. Typical events which can be signaled are described in greater detail below. Some of the events may be signaled on more than one line. For example, an event "instructions issued” can be signaled both on line 315 and 325.
- the event linesare connected to multiplexers 310 and 320 so that they may be individually selected. It should be understood that the events signalled for the PML 301 and PML 302 cart be different than the events of PML 300.
- the multiplexers 310 and 320are respectively connected to corresponding counter 330 and 340.
- the exact number of counters for the different performance logics 300-302can vary. Therefore, not only are the number and types of events different for the PML 300-302, but so are the number of counters that are available to accumulate event occurrences or counts. In addition, the total number of occurrences of a specific event that can be accumulated in any one counter can vary, depending on the "size", or number of bits of the counters.
- the counters 330 and 340are respectively connected to lines 350 and 360 for reading and writing data. For some types of counters, data may only be read from the counters. Other types of counters permit reading and writing counter data on lines 350 and 360. Yet, other types of counters can not be read or written.
- the counters 330 and 340may also be connected to an interrupt control circuit 370. Associated with the counter 330-340 can be InterruptValidBits 331 and 341, respectively, described in greater detail below, for indicating whether interrupts should be serviced.
- events which can be monitoredare signaled on the lines 311-315 and the lines 321-325. Specific events to be monitored are selected by a configuration (CONFIG) signal on line 331. Some of the events, for example processor cycles, are time related, and can therefore indicate elapsed time during performance data collection. At any one time, each counter can accumulate counts for one selected event.
- the counters 330 and 340can be cleared and set by signals on lines 332 and 333, respectively.
- an interrupt signalis generated on line 304 by the interrupt control circuit 370.
- the state of the system 200can be sampled and collected in the counters 330 and 340.
- the state of the systemcan be sampled selectively as determined by other conditions, such as a process executing instructions within a predetermined address range.
- the sampled valuescan be further processed to produce, for example, execution profiles, histograms, and other statistical data to analyze the performance of the system 200.
- the software for collecting and analyzing the performance datahas generally been tailored for specific system hardware and operating system software, and known designs of performance monitoring logic. This approach has generally made it difficult to adapt performance monitoring systems to hardware and software of different designs.
- a system independent interface 400is provided so that the design of the hardware, software, and performance monitoring logics 300-302 can change without requiring modifications of the interface 400.
- the interface 400can easily be transported to computer systems using other hardware and software designs, and different types of performance monitoring logics.
- the singular interface 400makes it possible for a single process to monitor all the performance monitoring logics 300-302, even if the logics 300-302 are of different design.
- System independenceis achieved, in part, by making general assumptions about the different designs of the performance monitoring logics. These assumptions are reduced to attributes for generally characterizing the performance monitoring logics 300-302. The attributes are generally independent of each other.
- Event attributesdescribe the events which may be monitored in the hardware and software of the system 200, for example, cache misses, branch prediction, pipeline stalls, instructions issued, arithmetic operations, processor cycles, replay traps, translation buffer misses, I/O requests, processes active, and so forth. Event attributes also indicate any dependencies which may exist among events. For example, an event which signals branch misprediction may only be monitored in conjunction with an event which signals conditional branch instructions issued.
- Frequency attributesdescribe the frequency at which any one of the events can interrupt.
- the frequencycan simply be an integer number which is a power of two, e.g., 256, 32,768, or 65536.
- the interrupt signal on line 304can be generated on an overflow of a specified bit of one of the counters 330 and 340. Samples can be taken at some multiple of the number of interrupts.
- the frequency of interrupts for one eventcan be independent of the frequency at which another event interrupts.
- Function attributesgenetically describe the operations which can be performed on the counters during performance monitoring.
- the generic operationsdescribed in detail below, can include: enabling, disabling, pausing, resuming, reading, writing, and setting counters.
- Mode attributesdescribe which processor modes are to be monitored, and whether or not selected processes are to be monitored.
- Processor modes in which processes can executelisted in an increasing order of execution restrictions, can include kemel, executive, supervisor, and user modes.
- Processes to be monitoredcan include the controlling process, other selected processes, or all processes.
- Characterizing the performance monitoring logics 300-302 of different designs in terms of general high-level attributesallows performance monitoring without knowing, a priori, which events are signaled, what interdependencies exist between events, how frequently events are signaling, how many counters are available for accumulating event counts, how the counters are coupled to the lines carrying event signals and what functions can be performed.
- high-level attributespermit the user to monitor different events, frequencies, functions, and modes without specifically knowing what counters are associated with which events and frequencies.
- the interface 400in response to a query, can signal whether a combination of events is permissible.
- the interface 400provides a flexible interface between the performance monitoring logics 300-302 and user software.
- FIG. 4shows the structure and operation of the system independent interface 400 in greater detail.
- Softwarein the form of application programs 401-403, desires to monitor the performance of system 200 using performance monitoring logics 300-302 of different and unknown design.
- the logics 300-302are, respectively, connected by lines 420-422 to the sub-systems 210, 220 and 230 for monitoring events characteristic of the performance of the system 200.
- the application programs 401-403include calls 411 to the interface 400 to query and manipulate the performance monitoring logics 300-302.
- the calls 411can include input arguments to be supplied to the interface 400 to specify exactly what attribute information is desired, and which operations should be performed.
- the attribute information, which describes the PML 300-302can be stored, for example, in an attribute table 800 when the interface 400 is initialized for operation.
- the interface 400in response to query and operational calls, supplies selected attribute information from the table 800 to the application programs 401-403, and performs the requested operations.
- the attribute informationcan be returned to the calling programs in the form of output arguments.
- the output argumentscan also include status information indicative of the requested operations, and performance data collected.
- the system independent interface 400includes performance monitoring routines (Pfm) 500 and counter routines (Ctr) 600.
- the Pfm routines 500are executed in response to the calls 411, and the Pfm routines 500 call the Ctr routines 600.
- the Ctr routines 600in ram, manipulate the PML 300-302 to collect performance data.
- the PML 300-302are associated with firmware or software, and registers for performing primitive functions, such as enabling interrupts and reading counter data in response to a interrupt signals. It is desired that the programs 401-403 can collect performance data without having detailed knowledge of structures and operations of the PML 300-302.
- the events which are actually being monitoredcan be maintained as an event set 450, stored in the memory 221.
- buffers 700for storing performance data while the interface 400 is operating.
- the buffers 700Can be allocated from the memory 221 of FIG. 2.
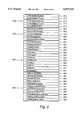
- the performance monitoring (Pfm) routines 500include general control routines 510, buffer manipulation routines 520, counter control routines 530, and event set manipulation routines 550.
- the general control routines 510include a PfmAllocate routine 511.
- This routineis used by an executing process, for example application program 401, to establish control or ownership of the PML 300-302.
- the performance monitoring logics 300-302are treated as shareable devices, which must be "owned” or allocated to a process before they can be operated.
- the PfmAllocate routine 511is a request to control the performance monitoring logics 300-302. ff one of the other processes already controls the logics 300-302, the request for control will be denied.
- the program 401gains control of the PML 300-302, the program 401 is known as the "controlling" process. While the PML 300-302 are allocated to the controlling process 401, the logics can not be used by the other process 402-403. The controlling process 401 can release ownership of the PML 300-302 with a PfmDeallocate routine 512. Both of these two routines 511-512 have as an output argument status information which indicates whether the allocation or deallocation was successful.
- the controlling process 401can specify a specific process to be monitored, instead of monitoring the performance of the entire system.
- the specific process to be monitoredcan be selected with a PfmSetPMEBit routine 513.
- the monitored processcan be the controlling process 401 or any of the other processes 402-403 identified in an input argument supplied to the PfmSetPMEBit routine 513.
- a PfmClearPMEBit routine 514disables the performance monitoring of the specified monitored process.
- the performance dataare collected, for example, in the buffers 700.
- the buffer manipulation routines 520are available to create, format, and delete the buffers 700.
- the buffers 700are described in greater detail with reference to FIG. 7.
- a PfmCreateSampleBuffer routine 521can be used to create sample buffers 700 for storing performance data during a monitoring session.
- This routinetakes as input arguments the number of buffers to create, the size of the buffers, the performance data to be collected, and actions to be taken when certain conditions arise. For example, as an action on a buffer full condition, the caller may choose: to notify the controlling process; to call a specific routine; or to do nothing. In the later case, the controlling process may take responsibility for checking the fullness of the buffers 700.
- the PML 300-302should be allocated to a process, e.g. controlled, before the buffers 700 can be created, and the PML 300-302 should not be operating, e.g., collecting samples.
- a PfmSetSampleSkip routine 522can be used to specify the number of interrupts that need to be generated before a sample is collected. This routine enables sampling at relatively slower rates. For example, if an input argument is ten, samples are taken every ten interrupts, instead of sampling for every interrupt, as is normally done.
- a PfmSetValidCounters routine 523indicates, in the InterruptValid Bit 231 or 241 of FIG. 2, for a specified counter, whether or not samples should be collected whenever an interrupt signal is generated. If the associated InterruptValidBit is set to a logical one, samples are collected in response to an interrupt. Otherwise, if the associated bit is set to a logical zero, samples are not collected.
- This routineis useful for processors and performance monitoring logic of the type which cannot selectively enable and disable interrupt signaling for selected counters. Thus, the collection of spurious performance data is avoided.
- a PfmCreateHistogramBuffers routine 524can be used to create specialized buffers for accumulating performance data in histogram form. For example, a range of instruction addresses can be supplied as an input argument. Then, every time an event is signalled, the event can be associated with a memory address or a range of memory addresses. Granularity of the address values can be provided by an input argument which causes the bits of the instruction address to be shifted to discard insignificant bits. This is useful to compress performance data of a large address space into smaller histogram segments.
- a related routine PfmAddAddressHistogramBuffer 525can be used to create additional histogram buffers, perhaps for different or overlapping instruction address ranges.
- a PfmDeleteBuffers routine 526deletes buffers specified in the input argument.
- the performance datacan be read from the histogram buffers with a PfmReadHistogram routine 527.
- the routine 527takes as an input parameter an address of a user specified array which can be used to store the performance data read from the histogram buffer.
- a PfmClearHistogram routine 528can be used, for example, after the performance data are read, to clear or "initialize" the specified histogram buffers.
- a PfmWriteSampleBuffers routine 529can be used to write the data of the sample buffers 700 to a file specified in an input argument of the routine.
- the counter control routines 630include a PfmSelectEvents routine 531 to select specific events, e.g., the "event set" 450 of FIG. 4, to be monitored, and the frequency at which the events of the event set 450 are to be monitored.
- the routine 531can be called repeatedly to select different events having different sampling frequencies. The events and frequencies are supplied as input arguments to the routine 531. If the requested event can not be monitored, or if there are conflicts or dependencies among the selected events, the calling process will be notified in an output argument.
- the PfmSetEvents routine 532can request the coupling of the event lines 311-315, and 321-325 with the counters 330-340 via, for example, the multiplexers 320 and 330. It should be noted in the interface 400 of the present invention, in contrast with the prior art, that the controlling process 401 which is performing the monitoring is not required to know which counter is assigned to which event. The controlling process 401 merely selects the set of events 450 to be monitored. The coupling between the events, their attributes and the corresponding counters is handled by the interface 400.
- a PfmSetModes routine 533can be used to select the process mode to be monitored. For example, monitoring can be selectively enabled only for specific processing modes, e.g., kernel, executive, supervisory, user. This routine can also be used to specify which processes are to be monitored.
- a routine PfmEventCounterMap 534can be used to determine, after the fact, which counters are monitoring which events. This information is supplied, for example, in an output argument as an array, where the index to an array element is an identifying number associated with a counter, and the contents of the indexed array element describes the associated event. For example, an array "(313, 323)" would indicate that a first counter, for example counter 330 of FIG. 3, is coupled to line 313, and a second counter is coupled to event line 323.
- a PfmStart routine 535is used to start a performance monitoring session for one or more selected events.
- the selected eventswere identified, for example, with the PfmSelectEvents routine 531.
- the countersmust be allocated. Monitoring can be stopped with a PfmStop routine 536. Counters can, respectively, be paused, and resumed by a PfmPause 537 and PfmResume 538 routine. While a specified counter is paused, the value maintained in the counter is not altered.
- the data or "counts" stored in counterscan be read by using a PfmRead routine 539.
- a PfmReadAll routine 540can be used.
- Datamay be written to the counter by using a PfmWrite 541 routine.
- the data and counters to be read and writtenare specified as input arguments to the routines 539-541.
- the PfmClear routine 542can be used.
- a PfmCounterNumber routine 543can be used. The routine 543 takes as an input argument an event number and returns the associated counter number as an output argument.
- the event set manipulation routines 551-561are used to clear, insert, delete, mask, remove, verify, expand, and merge events and sets of events. These routines 551-561, one-by-one can provide a user level interface to corresponding Ctr routines 651-661, described below, with reference to FIG. 6.
- the Ctr routines 600provide the interface between the Pfm routines 500 and the PML 300-302.
- the Ctr routines 600include query counter routines 610, query current counter state routines 620, control routines 630, and counter event set manipulation routines 650.
- a CtrAvailableEvents routine 611can be used to accumulate events to be monitored into the event set 450. The available events are returned as an output argument, and another output argument indicates whether or not the combination of events in the event set 450 are valid.
- a CtrAvailableFreq routine 612can be used to determine what interrupt frequencies are associated with a selected event.
- the routinetakes as an input an event number.
- the frequency attributes for the eventare returned as an output argument. This means that the user of the performance counters, without knowing counting frequencies, can select an event to monitor, and once the events have been selected and coupled to a counter, the user can query the interface 400 for frequency attributes associated with the selected counter to determine sampling rates.
- a CtrAvailableModes routine 613can be used to determine the available processor modes. The mode attributes are passed back as an output argument.
- a CtrAvailableFuncs routine 614returns as an output argument the function attributes.
- a CtrNumCounter routine 615returns the number of counters that are available.
- a CtrCurrentEvents routine 621can be used to determine what events are currently being monitored.
- the routine 621takes as an input argument a counter number, and returns as an output argument the event set associated with the specified counter.
- a CtrCurrentFreq routine 622when supplied with an event number, will return the frequency at which the specified event is being monitored.
- the value resumed by the routinewill be the actual number of events counted for each interrupt, unless the counter is of the non-interrupting type, or if interrupts for the counter are disabled, in which case the returned value will be zero.
- a CtrCurrentModes routine 623can be used to determine which processor modes are currently being monitored by the counter specified in the input argument.
- a CtrCurrentState routine 624can be used. The routine takes as an input argument the counter and event number, and returns as an output argument values which indicate if samples are being collected for the specified event, and if the counter is generating interrupts.
- a CtrCounterNumber routine 625returns a counter number for the event specified in the input argument.
- the counter control routines 630are used to operate the counters.
- a CtrClearContext routine 631is used to clear or initialize the counter specified in the input argument.
- a CtrSelectEvents routine 632can be used to select events to be monitored, and the frequency at which each of the selected events should be monitored. The routine takes as an input argument an event set and frequencies to be associated with the events of the set.
- CtrSelectEvents routine 632The events and frequencies selected by the CtrSelectEvents routine 632 are actually written to the counters by a CtrSetEvents routine 633.
- the processor modes during which event samples are to be collectedare set with a CtrSetModes routine 634.
- a CtrEnable routine 635is used to start the actual counting of events selected with the CtrSelectRoutine 632, and set with the CtrSetEvents routine 633. Counting is stopped by a CtrDisable routine 636.
- the CtrPause routine 637can be used to temporarily pause a specified counter without resetting the count value. Counting is resumed with the CtrResume routine 637. The counts of a specified counter can be set to zero with the CtrClear routine 639. Counter values can be written and read by a CtrWrite and CtrRead routine, respectively 640 and 641. A CtrReadAll routine 632 is also provided to read all of the counters.
- the counter event set manipulation routines 650can be used for directly manipulating event sets. These routines remove the need by the user of the routines to know how events sets are implemented.
- a CtrEventSetSize routine 651returns as an output argument the size of an event set 450, expressed as the number of bytes.
- the size of the event set 450can be passed as a parameter to a memory allocation routine to set aside storage space for the event set 450.
- a CtrClearEventSet routine 652removes all events in an event set.
- a CtrInsertEvent routine 653can be used to add an event to an existing event set.
- a CtrDeleteEvent routine 654will remove a specified event from an event set.
- a CtrMaskEvent routine 655takes as input arguments pointers to a valid event set and a destination event set. All events which are not members of the valid event set are removed from the destination event set.
- a CtrRemoveEventSet routine 656takes as in put arguments a first event set and a second event set. The routine 656 removes all events that are members of the first event set from the second event set.
- a CtrVerifyEventlnSet routine 657takes as input arguments an event set and an event number. The routine 657 returns as an output argument a TRUE logical condition if the specified event is a member of the event set; otherwise, a logical FALSE is returned.
- a CtrEventToNumber routine 658for a specified event set, returns the event having the lowest event number. If the value returned is zero, the event set is empty.
- a CtrNumberEventslnSet routine 659when supplied with an event set as an input argument, returns the number events that are included in the event set.
- a CtrExpandEventSet routine 660takes as input arguments an event set and an array. The routine 660 places the event number of the events which are members of the event set in the set in the specified array.
- a CtrMergeEventSet routine 661takes as input arguments a source event set, and a destination event set. All of the events of the source set are added to the destination set by the routine 661.
- FIG. 7shows the structure of the sample buffers 700.
- the sample buffers 700include a buffer descriptor 710, one or more sample buffers 720, and one or more histogram buffers 730.
- the buffer descriptor 710includes the following fields.
- a Number -- Counter field 701storing the number of counters that are available for performance monitoring.
- a Sample -- Buffer -- Pointer field 702stores a pointer to a current sample buffer 720 to be used for storing sample data. If the pointer is not stored in this field, sampling is not done.
- a Routine -- Full field 704stores a pointer to a routine that can be executed when the buffer reaches a full state.
- a Sample -- Action field 705indicates what action should be taken when a particular sampling condition is reached. Actions taken can include, do nothing, execute the routine pointed to in the Routine -- Full field 704, or notify the controlling process.
- a Sample -- Action field 705,indicates what specific action, e.g., do nothing, process, etc., to take for individual samples.
- a Full -- Actionindicates what action to take on a buffer full condition.
- a Process -- ID field 707identifies a process to be notified for any action indicated in the Sample -- Action and Full -- Action fields, respectively, 705 and 706.
- a Number -- Ranges field 708indicates the instruction address ranges, e.g. program counter values, that are active while collecting performance data.
- the starting and ending addresses of the rangesare stored in the field pair Start -- 0 and End -- 0 709-710 to Start -- n and End -- n 711-712, and so forth.
- a Number -- Interrupt field 713stores the number of interrupts that should occur before a sample of the counter values should be collected.
- a Int -- Since -- Last field 714stores the number of interrupts that have occurred since the last sample was collected.
- Each sample buffer 720can include the following fields.
- a Size field 721stores the size of the buffer, e.g., the number of bytes consumed.
- a Full field 722stores a flag which indicates if the buffer 720 is full.
- a Time field 723stores the time when sampling of performance data stored in this buffer was initiated.
- a Next field 724stores a pointer to a next sample buffer 720.
- the sample buffers 720can be arranged in a ring, with the Next field 724 of the last sample buffer 720 pointing to the first sample buffer.
- a Missed field 725stores the number of samples which were missed while other buffers are serviced.
- An Offset field 726stores an offset to a location in a Data field 727 where the next sample can be stored. The actual sampled data are stored in the Data field 727.
- Each histogram buffer 730can include the following fields.
- a Number -- Elements field 731indicates the number of instruction address ranges associated with this buffer.
- a Type field 732stores an indication of what type of histogram is being collected. Types can include total samples collected, samples per address within the address range, samples per processor mode, and so forth.
- a Minimum field 733stores the minimum data value stored in the buffer.
- a Maximum field 734stores the maximum data value represented in the histogram buffer.
- a Next field 735 of each histogram buffer 730points to the next histogram buffer arranged, for example, in a ring.
- a Granularity field 736indicates the granularity of the instruction address ranges, see the PfinCreateHistogramBuffers routine 524.
- the Data field 737includes counting cells arranged in a two dimensional array, a first dimension for each counter, and the second dimension corresponding to the value stored in the Number -- Element field 731. The cells are incremented when an interrupt occurs and pertinent performance data falls within the ranges specified.
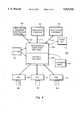
- FIG. 8shows an example user procedure 800 which can use the interface 400 for collecting performance data of the system 100.
- control of the performance countersis requested using, for example, the PfmAllocate routine 511.
- Buffers for storing performance dataare created using the PfmCreateSampleBuffer routine 521 in step 820.
- the events to be monitoredare selected in step 830 by calling the PfmSelectEvents routine 531.
- the event setcan be validated in step 830 with exceptions handled in step 841.
- the events and countersare coupled and initialized in step 850. Collection of performance data is started in step 860.
- step 870sampling is stopped by calling the PfmStop routine 536.
- step 880the buffers are deleted in step 890, and ownership of the performance is released in step 895 by calling the PfmDeallocate routine.
- the PfmCreateHistogramBuffers routine 524is called in step 820, the performance data can be collected in histogram format. If the PfmSetPMEBit and PfmSetModes routines are called after step 840, performance data for a specific process and processor mode can be collected.
Landscapes
- Engineering & Computer Science (AREA)
- General Engineering & Computer Science (AREA)
- Theoretical Computer Science (AREA)
- Computer Hardware Design (AREA)
- Quality & Reliability (AREA)
- Physics & Mathematics (AREA)
- General Physics & Mathematics (AREA)
- Debugging And Monitoring (AREA)
Abstract
Description
Claims (9)
Priority Applications (1)
| Application Number | Priority Date | Filing Date | Title |
|---|---|---|---|
| US08/291,240US5537541A (en) | 1994-08-16 | 1994-08-16 | System independent interface for performance counters |
Applications Claiming Priority (1)
| Application Number | Priority Date | Filing Date | Title |
|---|---|---|---|
| US08/291,240US5537541A (en) | 1994-08-16 | 1994-08-16 | System independent interface for performance counters |
Publications (1)
| Publication Number | Publication Date |
|---|---|
| US5537541Atrue US5537541A (en) | 1996-07-16 |
Family
ID=23119501
Family Applications (1)
| Application Number | Title | Priority Date | Filing Date |
|---|---|---|---|
| US08/291,240Expired - LifetimeUS5537541A (en) | 1994-08-16 | 1994-08-16 | System independent interface for performance counters |
Country Status (1)
| Country | Link |
|---|---|
| US (1) | US5537541A (en) |
Cited By (79)
| Publication number | Priority date | Publication date | Assignee | Title |
|---|---|---|---|---|
| US5615135A (en)* | 1995-06-01 | 1997-03-25 | International Business Machines Corporation | Event driven interface having a dynamically reconfigurable counter for monitoring a high speed data network according to changing traffic events |
| US5691920A (en)* | 1995-10-02 | 1997-11-25 | International Business Machines Corporation | Method and system for performance monitoring of dispatch unit efficiency in a processing system |
| US5710724A (en)* | 1995-04-20 | 1998-01-20 | Digital Equipment Corp. | Dynamic computer performance monitor |
| US5729726A (en)* | 1995-10-02 | 1998-03-17 | International Business Machines Corporation | Method and system for performance monitoring efficiency of branch unit operation in a processing system |
| US5748498A (en)* | 1995-07-05 | 1998-05-05 | Compal Electronics, Inc. | Method and a device for detecting execution efficiency of a CPU in computer system |
| US5748855A (en)* | 1995-10-02 | 1998-05-05 | Iinternational Business Machines Corporation | Method and system for performance monitoring of misaligned memory accesses in a processing system |
| US5752062A (en)* | 1995-10-02 | 1998-05-12 | International Business Machines Corporation | Method and system for performance monitoring through monitoring an order of processor events during execution in a processing system |
| US5751945A (en)* | 1995-10-02 | 1998-05-12 | International Business Machines Corporation | Method and system for performance monitoring stalls to identify pipeline bottlenecks and stalls in a processing system |
| US5796939A (en)* | 1997-03-10 | 1998-08-18 | Digital Equipment Corporation | High frequency sampling of processor performance counters |
| US5797019A (en)* | 1995-10-02 | 1998-08-18 | International Business Machines Corporation | Method and system for performance monitoring time lengths of disabled interrupts in a processing system |
| US5809450A (en)* | 1997-11-26 | 1998-09-15 | Digital Equipment Corporation | Method for estimating statistics of properties of instructions processed by a processor pipeline |
| US5835702A (en)* | 1996-10-21 | 1998-11-10 | International Business Machines Corporation | Performance monitor |
| US5835705A (en)* | 1997-03-11 | 1998-11-10 | International Business Machines Corporation | Method and system for performance per-thread monitoring in a multithreaded processor |
| US5845310A (en)* | 1993-12-15 | 1998-12-01 | Hewlett-Packard Co. | System and methods for performing cache latency diagnostics in scalable parallel processing architectures including calculating CPU idle time and counting number of cache misses |
| US5878208A (en)* | 1996-11-25 | 1999-03-02 | International Business Machines Corporation | Method and system for instruction trace reconstruction utilizing limited output pins and bus monitoring |
| US5881223A (en)* | 1996-09-06 | 1999-03-09 | Intel Corporation | Centralized performance monitoring architecture |
| WO1999028825A1 (en)* | 1997-12-01 | 1999-06-10 | Telefonaktiebolaget Lm Ericsson (Publ) | Method and apparatus for implementing counters in a system with limited primary memory |
| US5923872A (en)* | 1997-11-26 | 1999-07-13 | Digital Equipment Corporation | Apparatus for sampling instruction operand or result values in a processor pipeline |
| EP0897152A3 (en)* | 1997-08-11 | 1999-08-25 | Digital Equipment Corporation | Performance counters controlled by programmable logic |
| US5949971A (en)* | 1995-10-02 | 1999-09-07 | International Business Machines Corporation | Method and system for performance monitoring through identification of frequency and length of time of execution of serialization instructions in a processing system |
| US5964867A (en)* | 1997-11-26 | 1999-10-12 | Digital Equipment Corporation | Method for inserting memory prefetch operations based on measured latencies in a program optimizer |
| US5974573A (en)* | 1996-01-16 | 1999-10-26 | Dell Usa, L.P. | Method for collecting ECC event-related information during SMM operations |
| EP0864979A3 (en)* | 1997-03-10 | 1999-12-01 | Digital Equipment Corporation | Processor performance counter for sampling the execution frequency of individual instructions |
| US6000044A (en)* | 1997-11-26 | 1999-12-07 | Digital Equipment Corporation | Apparatus for randomly sampling instructions in a processor pipeline |
| US6067643A (en)* | 1997-12-24 | 2000-05-23 | Intel Corporation | Programmable observation system for monitoring the performance of a graphics controller |
| US6067644A (en)* | 1998-04-15 | 2000-05-23 | International Business Machines Corporation | System and method monitoring instruction progress within a processor |
| US6070009A (en)* | 1997-11-26 | 2000-05-30 | Digital Equipment Corporation | Method for estimating execution rates of program execution paths |
| US6079032A (en)* | 1998-05-19 | 2000-06-20 | Lucent Technologies, Inc. | Performance analysis of computer systems |
| US6085338A (en)* | 1996-12-17 | 2000-07-04 | International Business Machines Corporation | CPI infinite and finite analysis |
| US6092180A (en)* | 1997-11-26 | 2000-07-18 | Digital Equipment Corporation | Method for measuring latencies by randomly selected sampling of the instructions while the instruction are executed |
| US6115682A (en)* | 1997-12-24 | 2000-09-05 | Intel Corporation | Apparatus for analyzing the performance of a computer system |
| US6119075A (en)* | 1997-11-26 | 2000-09-12 | Digital Equipment Corporation | Method for estimating statistics of properties of interactions processed by a processor pipeline |
| US6148396A (en)* | 1997-11-26 | 2000-11-14 | Compaq Computer Corporation | Apparatus for sampling path history in a processor pipeline |
| US6154857A (en)* | 1997-04-08 | 2000-11-28 | Advanced Micro Devices, Inc. | Microprocessor-based device incorporating a cache for capturing software performance profiling data |
| US6163840A (en)* | 1997-11-26 | 2000-12-19 | Compaq Computer Corporation | Method and apparatus for sampling multiple potentially concurrent instructions in a processor pipeline |
| US6195748B1 (en) | 1997-11-26 | 2001-02-27 | Compaq Computer Corporation | Apparatus for sampling instruction execution information in a processor pipeline |
| US6237059B1 (en) | 1997-11-26 | 2001-05-22 | Compaq Computer Corporation | Method for estimating statistics of properties of memory system interactions among contexts in a computer system |
| US6332178B1 (en) | 1997-11-26 | 2001-12-18 | Compaq Computer Corporation | Method for estimating statistics of properties of memory system transactions |
| US6374367B1 (en) | 1997-11-26 | 2002-04-16 | Compaq Computer Corporation | Apparatus and method for monitoring a computer system to guide optimization |
| US6442585B1 (en) | 1997-11-26 | 2002-08-27 | Compaq Computer Corporation | Method for scheduling contexts based on statistics of memory system interactions in a computer system |
| US6463553B1 (en)* | 1999-10-01 | 2002-10-08 | Stmicroelectronics, Ltd. | Microcomputer debug architecture and method |
| EP1024432A3 (en)* | 1999-01-27 | 2002-11-06 | Sun Microsystems, Inc. | Performance counter for monitoring multiple events |
| WO2002093381A1 (en)* | 2001-05-16 | 2002-11-21 | Sharewave, Inc. | Performance measurement for embedded systems |
| US6487683B1 (en)* | 1999-10-01 | 2002-11-26 | Stmicroelectronics Limited | Microcomputer debug architecture and method |
| US20020188883A1 (en)* | 2001-06-12 | 2002-12-12 | Hanna Stephen Dale | Timer/timeout evaluation system |
| US6502210B1 (en)* | 1999-10-01 | 2002-12-31 | Stmicroelectronics, Ltd. | Microcomputer debug architecture and method |
| US20030036883A1 (en)* | 2001-08-16 | 2003-02-20 | International Business Machines Corp. | Extending width of performance monitor counters |
| US6549930B1 (en) | 1997-11-26 | 2003-04-15 | Compaq Computer Corporation | Method for scheduling threads in a multithreaded processor |
| US6557119B1 (en)* | 1999-10-01 | 2003-04-29 | Stmicroelectronics Limited | Microcomputer debug architecture and method |
| US6675374B2 (en) | 1999-10-12 | 2004-01-06 | Hewlett-Packard Development Company, L.P. | Insertion of prefetch instructions into computer program code |
| US6708296B1 (en)* | 1995-06-30 | 2004-03-16 | International Business Machines Corporation | Method and system for selecting and distinguishing an event sequence using an effective address in a processing system |
| US6721898B1 (en)* | 1999-02-03 | 2004-04-13 | William H. Gates, III | Method and system for tracking software components |
| US20040111705A1 (en)* | 2002-12-06 | 2004-06-10 | Tetsuro Motoyama | Software development environment with design specification verification tool |
| US6775640B1 (en) | 2000-04-28 | 2004-08-10 | Hewlett-Packard Development Company, L.P. | Performance adder for tracking occurrence of events within a circuit |
| US20040162750A1 (en)* | 2001-06-13 | 2004-08-19 | Tetsuro Motoyama | Automated management of development project files over a network |
| US20040168005A1 (en)* | 2003-02-21 | 2004-08-26 | Sun Microsystems, Inc. | Methods for interrupting a program and for obtaining program execution acquisition |
| US20050050513A1 (en)* | 2003-08-28 | 2005-03-03 | Tetsuro Motoyama | Data structure used for directory structure navigation in a skeleton code creation tool |
| US20050060694A1 (en)* | 2003-09-16 | 2005-03-17 | Sun Microsystems, Inc. | Methods and hardware for safe memory allocation in arbitrary program environments |
| US6961930B1 (en) | 1999-09-22 | 2005-11-01 | Hewlett-Packard Development Company, L.P. | Efficient, transparent and flexible latency sampling |
| US20060212263A1 (en)* | 2004-11-18 | 2006-09-21 | International Business Machines Corporation | Derivative performance counter mechanism |
| US20070006040A1 (en)* | 2005-06-30 | 2007-01-04 | Microsoft Corporation | Observing debug counter values during system operation |
| US20070139421A1 (en)* | 2005-12-21 | 2007-06-21 | Wen Chen | Methods and systems for performance monitoring in a graphics processing unit |
| US20070220483A1 (en)* | 2003-08-28 | 2007-09-20 | Tetsuro Motoyama | Approach for automatically generating program code |
| US20070288290A1 (en)* | 2006-06-07 | 2007-12-13 | Tetsuro Motoyama | Use of a database in a network-based project schedule management system |
| US20070288289A1 (en)* | 2006-06-07 | 2007-12-13 | Tetsuro Motoyama | Consolidation of member schedules with a project schedule in a network-based project schedule management system |
| US20070288288A1 (en)* | 2006-06-07 | 2007-12-13 | Tetsuro Motoyama | Use of schedule editors in a network-based project schedule management system |
| US20080162592A1 (en)* | 2006-12-28 | 2008-07-03 | Arcsight, Inc. | Storing log data efficiently while supporting querying to assist in computer network security |
| US7406432B1 (en) | 2001-06-13 | 2008-07-29 | Ricoh Company, Ltd. | Project management over a network with automated task schedule update |
| US20080229332A1 (en)* | 2007-03-16 | 2008-09-18 | Lloyd Matthew I | Registering an Event |
| US20080282263A1 (en)* | 2005-12-30 | 2008-11-13 | Qingjian Song | Virtual Event Interface to Support Platform-Wide Performance Optimization |
| US20100011031A1 (en)* | 2006-12-28 | 2010-01-14 | Arcsight, Inc. | Storing log data efficiently while supporting querying |
| US7809928B1 (en) | 2005-11-29 | 2010-10-05 | Nvidia Corporation | Generating event signals for performance register control using non-operative instructions |
| US8253748B1 (en)* | 2005-11-29 | 2012-08-28 | Nvidia Corporation | Shader performance registers |
| US8264491B1 (en)* | 2007-04-09 | 2012-09-11 | Nvidia Corporation | System, method, and computer program product for controlling a shader to gather statistics |
| US8381037B2 (en)* | 2003-10-09 | 2013-02-19 | International Business Machines Corporation | Method and system for autonomic execution path selection in an application |
| US8510465B2 (en) | 1999-02-03 | 2013-08-13 | Microsoft Corporation | Method and system for distributing art |
| US8615619B2 (en) | 2004-01-14 | 2013-12-24 | International Business Machines Corporation | Qualifying collection of performance monitoring events by types of interrupt when interrupt occurs |
| US8689190B2 (en) | 2003-09-30 | 2014-04-01 | International Business Machines Corporation | Counting instruction execution and data accesses |
| US8782664B2 (en) | 2004-01-14 | 2014-07-15 | International Business Machines Corporation | Autonomic hardware assist for patching code |
Citations (5)
| Publication number | Priority date | Publication date | Assignee | Title |
|---|---|---|---|---|
| US4435759A (en)* | 1981-06-15 | 1984-03-06 | International Business Machines Corporation | Hardware monitor for obtaining processor software/hardware interrelationships |
| US4488227A (en)* | 1982-12-03 | 1984-12-11 | Honeywell Information Systems Inc. | Program counter stacking method and apparatus for nested subroutines and interrupts |
| US5375199A (en)* | 1991-06-04 | 1994-12-20 | Digital Equipment Corporation | System monitoring method and device including a graphical user interface to view and manipulate system information |
| US5426741A (en)* | 1991-02-20 | 1995-06-20 | Digital Equipment Corporation | Bus event monitor |
| US5450349A (en)* | 1992-10-27 | 1995-09-12 | Digital Equipment Corporation | Computer system performance evaluation system and method |
- 1994
- 1994-08-16USUS08/291,240patent/US5537541A/ennot_activeExpired - Lifetime
Patent Citations (5)
| Publication number | Priority date | Publication date | Assignee | Title |
|---|---|---|---|---|
| US4435759A (en)* | 1981-06-15 | 1984-03-06 | International Business Machines Corporation | Hardware monitor for obtaining processor software/hardware interrelationships |
| US4488227A (en)* | 1982-12-03 | 1984-12-11 | Honeywell Information Systems Inc. | Program counter stacking method and apparatus for nested subroutines and interrupts |
| US5426741A (en)* | 1991-02-20 | 1995-06-20 | Digital Equipment Corporation | Bus event monitor |
| US5375199A (en)* | 1991-06-04 | 1994-12-20 | Digital Equipment Corporation | System monitoring method and device including a graphical user interface to view and manipulate system information |
| US5450349A (en)* | 1992-10-27 | 1995-09-12 | Digital Equipment Corporation | Computer system performance evaluation system and method |
Non-Patent Citations (15)
| Title |
|---|
| "Performance Monitoring", Chapter 66, Microsoft Win32 Programmer's Reference, vol. 2, pp. 459-487. |
| Dongarra, J. et al., Scientific benchmark characterizations, 1993, Computer Benchmarks, Elsevier Science Pub., pp. 127 140.* |
| Dongarra, J. et al., Scientific benchmark characterizations, 1993, Computer Benchmarks, Elsevier Science Pub., pp. 127-140. |
| J. Dongarra & J. Martin, Computer benchmarking: paths and pitfalls, IEEE pp. 38 43, Jul. 1987.* |
| J. Dongarra & J. Martin, Computer benchmarking: paths and pitfalls, IEEE pp. 38-43, Jul. 1987. |
| LeDoux, C., Saving Traces for ADA Debugging, ADA in use proceedings of ADA International Conference, 1985.* |
| McDowell, C., Debugging Concurrent Programs, 1989, IEEE pp. 25 34.* |
| McDowell, C., Debugging Concurrent Programs, 1989, IEEE pp. 25-34. |
| Performance Monitoring , Chapter 66, Microsoft Win32 Programmer s Reference, vol. 2, pp. 459 487.* |
| R. Weicker, An overview of Common Benchmarks, Dec. 1990, IEEE pp. 65 75.* |
| R. Weicker, An overview of Common Benchmarks, Dec. 1990, IEEE pp. 65-75. |
| Smith, J., Characterizing Computer Performance w/a single number, ACM, 1988, pp. 1203 1206.* |
| Smith, J., Characterizing Computer Performance w/a single number, ACM, 1988, pp. 1203-1206. |
| Snodgrass, R., Monitoring in a software development environment, 1984 ACM SIGSOFT, pp. 124 129.* |
| Snodgrass, R., Monitoring in a software development environment, 1984 ACM SIGSOFT, pp. 124-129. |
Cited By (118)
| Publication number | Priority date | Publication date | Assignee | Title |
|---|---|---|---|---|
| US5845310A (en)* | 1993-12-15 | 1998-12-01 | Hewlett-Packard Co. | System and methods for performing cache latency diagnostics in scalable parallel processing architectures including calculating CPU idle time and counting number of cache misses |
| US5710724A (en)* | 1995-04-20 | 1998-01-20 | Digital Equipment Corp. | Dynamic computer performance monitor |
| US5615135A (en)* | 1995-06-01 | 1997-03-25 | International Business Machines Corporation | Event driven interface having a dynamically reconfigurable counter for monitoring a high speed data network according to changing traffic events |
| US6708296B1 (en)* | 1995-06-30 | 2004-03-16 | International Business Machines Corporation | Method and system for selecting and distinguishing an event sequence using an effective address in a processing system |
| US5748498A (en)* | 1995-07-05 | 1998-05-05 | Compal Electronics, Inc. | Method and a device for detecting execution efficiency of a CPU in computer system |
| US5748855A (en)* | 1995-10-02 | 1998-05-05 | Iinternational Business Machines Corporation | Method and system for performance monitoring of misaligned memory accesses in a processing system |
| US5729726A (en)* | 1995-10-02 | 1998-03-17 | International Business Machines Corporation | Method and system for performance monitoring efficiency of branch unit operation in a processing system |
| US5751945A (en)* | 1995-10-02 | 1998-05-12 | International Business Machines Corporation | Method and system for performance monitoring stalls to identify pipeline bottlenecks and stalls in a processing system |
| US5949971A (en)* | 1995-10-02 | 1999-09-07 | International Business Machines Corporation | Method and system for performance monitoring through identification of frequency and length of time of execution of serialization instructions in a processing system |
| US5797019A (en)* | 1995-10-02 | 1998-08-18 | International Business Machines Corporation | Method and system for performance monitoring time lengths of disabled interrupts in a processing system |
| US5691920A (en)* | 1995-10-02 | 1997-11-25 | International Business Machines Corporation | Method and system for performance monitoring of dispatch unit efficiency in a processing system |
| US5752062A (en)* | 1995-10-02 | 1998-05-12 | International Business Machines Corporation | Method and system for performance monitoring through monitoring an order of processor events during execution in a processing system |
| US5974573A (en)* | 1996-01-16 | 1999-10-26 | Dell Usa, L.P. | Method for collecting ECC event-related information during SMM operations |
| US5881223A (en)* | 1996-09-06 | 1999-03-09 | Intel Corporation | Centralized performance monitoring architecture |
| US5835702A (en)* | 1996-10-21 | 1998-11-10 | International Business Machines Corporation | Performance monitor |
| US5878208A (en)* | 1996-11-25 | 1999-03-02 | International Business Machines Corporation | Method and system for instruction trace reconstruction utilizing limited output pins and bus monitoring |
| US6085338A (en)* | 1996-12-17 | 2000-07-04 | International Business Machines Corporation | CPI infinite and finite analysis |
| EP0864979A3 (en)* | 1997-03-10 | 1999-12-01 | Digital Equipment Corporation | Processor performance counter for sampling the execution frequency of individual instructions |
| EP0864978A3 (en)* | 1997-03-10 | 1999-11-03 | Digital Equipment Corporation | High frequency sampling of performance counters |
| US5796939A (en)* | 1997-03-10 | 1998-08-18 | Digital Equipment Corporation | High frequency sampling of processor performance counters |
| US5835705A (en)* | 1997-03-11 | 1998-11-10 | International Business Machines Corporation | Method and system for performance per-thread monitoring in a multithreaded processor |
| GB2324393B (en)* | 1997-03-11 | 2002-03-13 | Ibm | Method and system for performance monitoring in a multithreaded processor |
| US6154857A (en)* | 1997-04-08 | 2000-11-28 | Advanced Micro Devices, Inc. | Microprocessor-based device incorporating a cache for capturing software performance profiling data |
| EP0897152A3 (en)* | 1997-08-11 | 1999-08-25 | Digital Equipment Corporation | Performance counters controlled by programmable logic |
| US6092180A (en)* | 1997-11-26 | 2000-07-18 | Digital Equipment Corporation | Method for measuring latencies by randomly selected sampling of the instructions while the instruction are executed |
| US6442585B1 (en) | 1997-11-26 | 2002-08-27 | Compaq Computer Corporation | Method for scheduling contexts based on statistics of memory system interactions in a computer system |
| US5809450A (en)* | 1997-11-26 | 1998-09-15 | Digital Equipment Corporation | Method for estimating statistics of properties of instructions processed by a processor pipeline |
| US6549930B1 (en) | 1997-11-26 | 2003-04-15 | Compaq Computer Corporation | Method for scheduling threads in a multithreaded processor |
| US6070009A (en)* | 1997-11-26 | 2000-05-30 | Digital Equipment Corporation | Method for estimating execution rates of program execution paths |
| US6374367B1 (en) | 1997-11-26 | 2002-04-16 | Compaq Computer Corporation | Apparatus and method for monitoring a computer system to guide optimization |
| US6000044A (en)* | 1997-11-26 | 1999-12-07 | Digital Equipment Corporation | Apparatus for randomly sampling instructions in a processor pipeline |
| US5923872A (en)* | 1997-11-26 | 1999-07-13 | Digital Equipment Corporation | Apparatus for sampling instruction operand or result values in a processor pipeline |
| US6332178B1 (en) | 1997-11-26 | 2001-12-18 | Compaq Computer Corporation | Method for estimating statistics of properties of memory system transactions |
| US6119075A (en)* | 1997-11-26 | 2000-09-12 | Digital Equipment Corporation | Method for estimating statistics of properties of interactions processed by a processor pipeline |
| US6148396A (en)* | 1997-11-26 | 2000-11-14 | Compaq Computer Corporation | Apparatus for sampling path history in a processor pipeline |
| US5964867A (en)* | 1997-11-26 | 1999-10-12 | Digital Equipment Corporation | Method for inserting memory prefetch operations based on measured latencies in a program optimizer |
| US6163840A (en)* | 1997-11-26 | 2000-12-19 | Compaq Computer Corporation | Method and apparatus for sampling multiple potentially concurrent instructions in a processor pipeline |
| US6195748B1 (en) | 1997-11-26 | 2001-02-27 | Compaq Computer Corporation | Apparatus for sampling instruction execution information in a processor pipeline |
| US6237059B1 (en) | 1997-11-26 | 2001-05-22 | Compaq Computer Corporation | Method for estimating statistics of properties of memory system interactions among contexts in a computer system |
| US6065130A (en)* | 1997-12-01 | 2000-05-16 | Telefonaktiebolaget Lm Ericsson | Implementing counters in a system with limited primary memory |
| WO1999028825A1 (en)* | 1997-12-01 | 1999-06-10 | Telefonaktiebolaget Lm Ericsson (Publ) | Method and apparatus for implementing counters in a system with limited primary memory |
| US6067643A (en)* | 1997-12-24 | 2000-05-23 | Intel Corporation | Programmable observation system for monitoring the performance of a graphics controller |
| US6115682A (en)* | 1997-12-24 | 2000-09-05 | Intel Corporation | Apparatus for analyzing the performance of a computer system |
| CN1332314C (en)* | 1997-12-24 | 2007-08-15 | 英特尔公司 | System for analysing figure contrller property |
| EP1040417A4 (en)* | 1997-12-24 | 2002-06-19 | Intel Corp | System for analyzing graphics controller performance |
| US6067644A (en)* | 1998-04-15 | 2000-05-23 | International Business Machines Corporation | System and method monitoring instruction progress within a processor |
| US6079032A (en)* | 1998-05-19 | 2000-06-20 | Lucent Technologies, Inc. | Performance analysis of computer systems |
| EP1024432A3 (en)* | 1999-01-27 | 2002-11-06 | Sun Microsystems, Inc. | Performance counter for monitoring multiple events |
| US8510465B2 (en) | 1999-02-03 | 2013-08-13 | Microsoft Corporation | Method and system for distributing art |
| US6721898B1 (en)* | 1999-02-03 | 2004-04-13 | William H. Gates, III | Method and system for tracking software components |
| US7529978B2 (en) | 1999-02-03 | 2009-05-05 | Microsoft Corporation | Method and system for tracking software components |
| US9438660B2 (en) | 1999-02-03 | 2016-09-06 | William H. Gates, III | Method and system for distributing art |
| US20040153832A1 (en)* | 1999-02-03 | 2004-08-05 | William H. Gates, Iii | Method and system for tracking software components |
| US7159147B2 (en) | 1999-02-03 | 2007-01-02 | Microsoft Corporation | Method and system for tracking software components |
| US20070016830A1 (en)* | 1999-02-03 | 2007-01-18 | Microsoft Corporation | Method and system for tracking software components |
| US6961930B1 (en) | 1999-09-22 | 2005-11-01 | Hewlett-Packard Development Company, L.P. | Efficient, transparent and flexible latency sampling |
| US6502210B1 (en)* | 1999-10-01 | 2002-12-31 | Stmicroelectronics, Ltd. | Microcomputer debug architecture and method |
| US6557119B1 (en)* | 1999-10-01 | 2003-04-29 | Stmicroelectronics Limited | Microcomputer debug architecture and method |
| US6487683B1 (en)* | 1999-10-01 | 2002-11-26 | Stmicroelectronics Limited | Microcomputer debug architecture and method |
| US6463553B1 (en)* | 1999-10-01 | 2002-10-08 | Stmicroelectronics, Ltd. | Microcomputer debug architecture and method |
| US6675374B2 (en) | 1999-10-12 | 2004-01-06 | Hewlett-Packard Development Company, L.P. | Insertion of prefetch instructions into computer program code |
| US6775640B1 (en) | 2000-04-28 | 2004-08-10 | Hewlett-Packard Development Company, L.P. | Performance adder for tracking occurrence of events within a circuit |
| US20040223520A1 (en)* | 2000-04-28 | 2004-11-11 | Swanson Jeffrey C. | Performance adder for tracking occurrence of events within a circuit |
| US7480590B2 (en) | 2000-04-28 | 2009-01-20 | Hewlett-Packard Development Company, L.P. | Performance adder for tracking occurrence of events within a circuit |
| US6643609B2 (en) | 2001-05-16 | 2003-11-04 | Sharewave, Inc | Performance measurement for embedded systems |
| WO2002093381A1 (en)* | 2001-05-16 | 2002-11-21 | Sharewave, Inc. | Performance measurement for embedded systems |
| US6826706B2 (en)* | 2001-06-12 | 2004-11-30 | International Buniess Machines Corporation | Timer/timeout evaluation system that saves the counts of all timers when at least one timer has timed out |
| US20020188883A1 (en)* | 2001-06-12 | 2002-12-12 | Hanna Stephen Dale | Timer/timeout evaluation system |
| US20040162750A1 (en)* | 2001-06-13 | 2004-08-19 | Tetsuro Motoyama | Automated management of development project files over a network |
| US7536313B2 (en) | 2001-06-13 | 2009-05-19 | Ricoh Company, Ltd. | Automated management of development project files over a network |
| US7191141B2 (en) | 2001-06-13 | 2007-03-13 | Ricoh Company, Ltd. | Automated management of development project files over a network |
| US20070112776A1 (en)* | 2001-06-13 | 2007-05-17 | Tetsuro Motoyama | Automated management of development project files over a network |
| US7406432B1 (en) | 2001-06-13 | 2008-07-29 | Ricoh Company, Ltd. | Project management over a network with automated task schedule update |
| US7225110B2 (en)* | 2001-08-16 | 2007-05-29 | International Business Machines Corporation | Extending width of performance monitor counters |
| US20030036883A1 (en)* | 2001-08-16 | 2003-02-20 | International Business Machines Corp. | Extending width of performance monitor counters |
| US20040111705A1 (en)* | 2002-12-06 | 2004-06-10 | Tetsuro Motoyama | Software development environment with design specification verification tool |
| US7171652B2 (en)* | 2002-12-06 | 2007-01-30 | Ricoh Company, Ltd. | Software development environment with design specification verification tool |
| US7861227B2 (en) | 2002-12-06 | 2010-12-28 | Ricoh Company Ltd. | Software development environment with design specification validation tool |
| US20060265690A1 (en)* | 2002-12-06 | 2006-11-23 | Tetsuro Motoyama | Software development environment with design specification validation tool |
| US20040168005A1 (en)* | 2003-02-21 | 2004-08-26 | Sun Microsystems, Inc. | Methods for interrupting a program and for obtaining program execution acquisition |
| US20070214450A1 (en)* | 2003-08-28 | 2007-09-13 | Tetsuro Motoyama | Data structure used for directory structure navigation in a skeleton code creation tool |
| US7308675B2 (en) | 2003-08-28 | 2007-12-11 | Ricoh Company, Ltd. | Data structure used for directory structure navigation in a skeleton code creation tool |
| US20070220483A1 (en)* | 2003-08-28 | 2007-09-20 | Tetsuro Motoyama | Approach for automatically generating program code |
| US8219969B2 (en) | 2003-08-28 | 2012-07-10 | Ricoh Company, Ltd. | Data structure used for directory structure navigation in a skeleton code creation tool |
| US7987447B2 (en) | 2003-08-28 | 2011-07-26 | Ricoh Company, Ltd. | Approach for automatically generating program code |
| US20050050513A1 (en)* | 2003-08-28 | 2005-03-03 | Tetsuro Motoyama | Data structure used for directory structure navigation in a skeleton code creation tool |
| US7269830B2 (en)* | 2003-09-16 | 2007-09-11 | Sun Microsystems, Inc. | Methods and hardware for safe memory allocation in arbitrary program environments |
| US20050060694A1 (en)* | 2003-09-16 | 2005-03-17 | Sun Microsystems, Inc. | Methods and hardware for safe memory allocation in arbitrary program environments |
| US8689190B2 (en) | 2003-09-30 | 2014-04-01 | International Business Machines Corporation | Counting instruction execution and data accesses |
| US8381037B2 (en)* | 2003-10-09 | 2013-02-19 | International Business Machines Corporation | Method and system for autonomic execution path selection in an application |
| US8615619B2 (en) | 2004-01-14 | 2013-12-24 | International Business Machines Corporation | Qualifying collection of performance monitoring events by types of interrupt when interrupt occurs |
| US8782664B2 (en) | 2004-01-14 | 2014-07-15 | International Business Machines Corporation | Autonomic hardware assist for patching code |
| US7519510B2 (en)* | 2004-11-18 | 2009-04-14 | International Business Machines Corporation | Derivative performance counter mechanism |
| US20060212263A1 (en)* | 2004-11-18 | 2006-09-21 | International Business Machines Corporation | Derivative performance counter mechanism |
| US7650539B2 (en)* | 2005-06-30 | 2010-01-19 | Microsoft Corporation | Observing debug counter values during system operation |
| US20070006040A1 (en)* | 2005-06-30 | 2007-01-04 | Microsoft Corporation | Observing debug counter values during system operation |
| US7809928B1 (en) | 2005-11-29 | 2010-10-05 | Nvidia Corporation | Generating event signals for performance register control using non-operative instructions |
| US8253748B1 (en)* | 2005-11-29 | 2012-08-28 | Nvidia Corporation | Shader performance registers |
| US20070139421A1 (en)* | 2005-12-21 | 2007-06-21 | Wen Chen | Methods and systems for performance monitoring in a graphics processing unit |
| US20080282263A1 (en)* | 2005-12-30 | 2008-11-13 | Qingjian Song | Virtual Event Interface to Support Platform-Wide Performance Optimization |
| US20070288289A1 (en)* | 2006-06-07 | 2007-12-13 | Tetsuro Motoyama | Consolidation of member schedules with a project schedule in a network-based project schedule management system |
| US20070288290A1 (en)* | 2006-06-07 | 2007-12-13 | Tetsuro Motoyama | Use of a database in a network-based project schedule management system |
| US8050953B2 (en) | 2006-06-07 | 2011-11-01 | Ricoh Company, Ltd. | Use of a database in a network-based project schedule management system |
| US8799043B2 (en) | 2006-06-07 | 2014-08-05 | Ricoh Company, Ltd. | Consolidation of member schedules with a project schedule in a network-based management system |
| US20070288288A1 (en)* | 2006-06-07 | 2007-12-13 | Tetsuro Motoyama | Use of schedule editors in a network-based project schedule management system |
| US20080162592A1 (en)* | 2006-12-28 | 2008-07-03 | Arcsight, Inc. | Storing log data efficiently while supporting querying to assist in computer network security |
| US9031916B2 (en)* | 2006-12-28 | 2015-05-12 | Hewlett-Packard Development Company, L.P. | Storing log data efficiently while supporting querying to assist in computer network security |
| US9166989B2 (en)* | 2006-12-28 | 2015-10-20 | Hewlett-Packard Development Company, L.P. | Storing log data efficiently while supporting querying |
| US9762602B2 (en) | 2006-12-28 | 2017-09-12 | Entit Software Llc | Generating row-based and column-based chunks |
| US20100011031A1 (en)* | 2006-12-28 | 2010-01-14 | Arcsight, Inc. | Storing log data efficiently while supporting querying |
| US8015571B2 (en) | 2007-03-16 | 2011-09-06 | Google Inc. | Registering an event |
| CN101669094B (en)* | 2007-03-16 | 2013-09-11 | 谷歌公司 | Registration issue |
| US8402476B2 (en) | 2007-03-16 | 2013-03-19 | Google Inc. | Registering an event |
| CN103593278B (en)* | 2007-03-16 | 2016-03-23 | 谷歌公司 | Registered events |
| EP3032424A1 (en)* | 2007-03-16 | 2016-06-15 | Google, Inc. | Registering an event |
| WO2008115728A3 (en)* | 2007-03-16 | 2008-12-04 | Google Inc | Registering an event |
| US20080229332A1 (en)* | 2007-03-16 | 2008-09-18 | Lloyd Matthew I | Registering an Event |
| US8264491B1 (en)* | 2007-04-09 | 2012-09-11 | Nvidia Corporation | System, method, and computer program product for controlling a shader to gather statistics |
Similar Documents
| Publication | Publication Date | Title |
|---|---|---|
| US5537541A (en) | System independent interface for performance counters | |
| US7962314B2 (en) | Mechanism for profiling program software running on a processor | |
| US6112317A (en) | Processor performance counter for sampling the execution frequency of individual instructions | |
| US8839271B2 (en) | Call stack sampling to obtain information for analyzing idle states in a data processing system | |
| JP4371452B2 (en) | Apparatus for spatial and temporal sampling in a computer memory system | |
| US6009514A (en) | Computer method and apparatus for analyzing program instructions executing in a computer system | |
| US5594864A (en) | Method and apparatus for unobtrusively monitoring processor states and characterizing bottlenecks in a pipelined processor executing grouped instructions | |
| US6442585B1 (en) | Method for scheduling contexts based on statistics of memory system interactions in a computer system | |
| EP0919923B1 (en) | Method for estimating statistics of properties of memory system interactions among contexts in a computer system | |
| US6098169A (en) | Thread performance analysis by monitoring processor performance event registers at thread switch | |
| US6961930B1 (en) | Efficient, transparent and flexible latency sampling | |
| US6374367B1 (en) | Apparatus and method for monitoring a computer system to guide optimization | |
| KR100390610B1 (en) | Method and system for counting non-speculative events in a speculative processor | |
| US8245199B2 (en) | Selectively marking and executing instrumentation code | |
| EP2230602B1 (en) | Processing apparatus and method for acquiring log information | |
| EP0919920B1 (en) | Method for estimating statistics of properties of memory system transactions | |
| US8132170B2 (en) | Call stack sampling in a data processing system | |
| US20100333071A1 (en) | Time Based Context Sampling of Trace Data with Support for Multiple Virtual Machines | |
| US20040230706A1 (en) | Extended input/output measurement facilities | |
| US20070260849A1 (en) | Method and apparatus for executing instrumentation code using a target processor | |
| US20070261034A1 (en) | Method and apparatus for graphically marking instructions for instrumentation with hardware assistance | |
| US20070261032A1 (en) | Method and apparatus for hardware assisted profiling of code | |
| US7865703B2 (en) | Method and apparatus for executing instrumentation code within alternative processor resources | |
| JP2023526554A (en) | Profiling sample manipulations processed by the processing circuit | |
| US7962692B2 (en) | Method and system for managing performance data |
Legal Events
| Date | Code | Title | Description |
|---|---|---|---|
| AS | Assignment | Owner name:DIGITAL EQUIPMENT CORPORATION, MASSACHUSETTS Free format text:ASSIGNMENT OF ASSIGNORS INTEREST;ASSIGNOR:WIBECAN, BRIAN F.;REEL/FRAME:007128/0589 Effective date:19940816 | |
| STCF | Information on status: patent grant | Free format text:PATENTED CASE | |
| FPAY | Fee payment | Year of fee payment:4 | |
| AS | Assignment | Owner name:COMPAQ INFORMATION TECHNOLOGIES GROUP, L.P., TEXAS Free format text:ASSIGNMENT OF ASSIGNORS INTEREST;ASSIGNORS:DIGITAL EQUIPMENT CORPORATION;COMPAQ COMPUTER CORPORATION;REEL/FRAME:012447/0903;SIGNING DATES FROM 19991209 TO 20010620 | |
| AS | Assignment | Owner name:HEWLETT-PACKARD DEVELOPMENT COMPANY, L.P., TEXAS Free format text:CHANGE OF NAME;ASSIGNOR:COMPAQ INFORMANTION TECHNOLOGIES GROUP LP;REEL/FRAME:014102/0224 Effective date:20021001 | |
| FPAY | Fee payment | Year of fee payment:8 | |
| FPAY | Fee payment | Year of fee payment:12 | |
| REMI | Maintenance fee reminder mailed | ||
| AS | Assignment | Owner name:SAMSUNG ELECTRONICS CO., LTD., KOREA, REPUBLIC OF Free format text:ASSIGNMENT OF ASSIGNORS INTEREST;ASSIGNORS:HEWLETT-PACKARD DEVELOPMENT COMPANY, L.P.;HEWLETT-PACKARD COMPANY;REEL/FRAME:026008/0690 Effective date:20100625 |