US5321800A - Graphical language methodology for information display - Google Patents
Graphical language methodology for information displayDownload PDFInfo
- Publication number
- US5321800A US5321800AUS07/989,462US98946292AUS5321800AUS 5321800 AUS5321800 AUS 5321800AUS 98946292 AUS98946292 AUS 98946292AUS 5321800 AUS5321800 AUS 5321800A
- Authority
- US
- United States
- Prior art keywords
- datapoint
- display
- indicate
- icons
- icon
- Prior art date
- Legal status (The legal status is an assumption and is not a legal conclusion. Google has not performed a legal analysis and makes no representation as to the accuracy of the status listed.)
- Expired - Lifetime
Links
Images


Classifications
- G—PHYSICS
- G06—COMPUTING OR CALCULATING; COUNTING
- G06F—ELECTRIC DIGITAL DATA PROCESSING
- G06F3/00—Input arrangements for transferring data to be processed into a form capable of being handled by the computer; Output arrangements for transferring data from processing unit to output unit, e.g. interface arrangements
- G06F3/01—Input arrangements or combined input and output arrangements for interaction between user and computer
- G06F3/048—Interaction techniques based on graphical user interfaces [GUI]
- G06F3/0481—Interaction techniques based on graphical user interfaces [GUI] based on specific properties of the displayed interaction object or a metaphor-based environment, e.g. interaction with desktop elements like windows or icons, or assisted by a cursor's changing behaviour or appearance
- G06F3/04817—Interaction techniques based on graphical user interfaces [GUI] based on specific properties of the displayed interaction object or a metaphor-based environment, e.g. interaction with desktop elements like windows or icons, or assisted by a cursor's changing behaviour or appearance using icons
- G—PHYSICS
- G16—INFORMATION AND COMMUNICATION TECHNOLOGY [ICT] SPECIALLY ADAPTED FOR SPECIFIC APPLICATION FIELDS
- G16H—HEALTHCARE INFORMATICS, i.e. INFORMATION AND COMMUNICATION TECHNOLOGY [ICT] SPECIALLY ADAPTED FOR THE HANDLING OR PROCESSING OF MEDICAL OR HEALTHCARE DATA
- G16H15/00—ICT specially adapted for medical reports, e.g. generation or transmission thereof
- G—PHYSICS
- G16—INFORMATION AND COMMUNICATION TECHNOLOGY [ICT] SPECIALLY ADAPTED FOR SPECIFIC APPLICATION FIELDS
- G16H—HEALTHCARE INFORMATICS, i.e. INFORMATION AND COMMUNICATION TECHNOLOGY [ICT] SPECIALLY ADAPTED FOR THE HANDLING OR PROCESSING OF MEDICAL OR HEALTHCARE DATA
- G16H10/00—ICT specially adapted for the handling or processing of patient-related medical or healthcare data
- G16H10/60—ICT specially adapted for the handling or processing of patient-related medical or healthcare data for patient-specific data, e.g. for electronic patient records
- G—PHYSICS
- G16—INFORMATION AND COMMUNICATION TECHNOLOGY [ICT] SPECIALLY ADAPTED FOR SPECIFIC APPLICATION FIELDS
- G16H—HEALTHCARE INFORMATICS, i.e. INFORMATION AND COMMUNICATION TECHNOLOGY [ICT] SPECIALLY ADAPTED FOR THE HANDLING OR PROCESSING OF MEDICAL OR HEALTHCARE DATA
- G16H70/00—ICT specially adapted for the handling or processing of medical references
- G16H70/60—ICT specially adapted for the handling or processing of medical references relating to pathologies
- Y—GENERAL TAGGING OF NEW TECHNOLOGICAL DEVELOPMENTS; GENERAL TAGGING OF CROSS-SECTIONAL TECHNOLOGIES SPANNING OVER SEVERAL SECTIONS OF THE IPC; TECHNICAL SUBJECTS COVERED BY FORMER USPC CROSS-REFERENCE ART COLLECTIONS [XRACs] AND DIGESTS
- Y10—TECHNICAL SUBJECTS COVERED BY FORMER USPC
- Y10S—TECHNICAL SUBJECTS COVERED BY FORMER USPC CROSS-REFERENCE ART COLLECTIONS [XRACs] AND DIGESTS
- Y10S715/00—Data processing: presentation processing of document, operator interface processing, and screen saver display processing
- Y10S715/961—Operator interface with visual structure or function dictated by intended use
- Y10S715/965—Operator interface with visual structure or function dictated by intended use for process control and configuration
- Y10S715/97—Instrumentation and component modelling, e.g. interactive control panel
Definitions
- the present inventionseeks to overcome these problems by further processing information, characterized in standard datasets, into displays, or "Lessergrams,” comprised of those datasets translated into symbol or icon based images, or “Charlottes,” so as to facilitate the user's ability to assimilate large amounts of interrelated information directly into conscious understanding.
- the present inventionsets forth information in a display with details of the information identified by features of the display such as location, color, size, form, and intensity. With this display methodology, barriers to information acquisition are substantially reduced.
- the advantages of this display methodologyare enhanced. If different image representations for the same knowledge base were utilized, then the resulting displays would merely exchange alphanumeric language differences for image based language differences. As a result, much of the inherent advantage of image based display methodologies would be lost. Therefore, the present invention also seeks to create standards of image creation so as to avoid barriers of image translation associated with language differences.
- the present inventionis, thus, a method of icon based information presentation.
- An embodiment of the invention as applied to a medical information display system for use, for example, in a medical intensive care unitis described; however, other embodiments and applications are within the scope of the invention.
- the described embodimentsolves problems created by the necessity for the modern physician to assimilate the tremendous amounts of information developed in modern intensive care units during the daily care of a patient and the additional requirement that this information typically must be assimilated by numerous care givers in this environment.
- typically informationmust be acquired from a large number of sources including, for example, the patient, nurses, laboratory sources, support equipment, and various patient monitoring devices.
- the methodologycreates a single display that can almost instantaneously transmit tremendous amounts of information regarding the patient's status and therapies that otherwise would be presented in alphanumeric and/or binary form. If desired, to ease the learning process associated with understanding the patient information presented in image form in accordance with the present invention, the visual images can be accompanied by alphanumeric information.
- a complete displayis constructed from icon-based images of standard medical datasets, including for example monitoring device data (blood pressure, pulse rate, etc.), electrolyte levels, arterial blood gas levels, liver function tests, etc.
- An imageis developed for each dataset based on the specific values assigned to individual datapoints in each dataset, or, in the case of binary information (e.g., therapeutic treatment such as the presence or absence of an intravenous line, or other corrective intervention), based on the presence or absence of that particular device.
- the imagesare subsequently plotted into standard locations on the display to create a complete display for visualization and analysis by a physician.
- the patient condition informationcan be keyed into a microcomputer at the patient's bedside, either as alphanumeric information for subsequent processing and image translation or directly as image information using physicians or paramedical personnel to process the information and create the correct image by entering the necessary commands directly from the keyboard.
- FIGS. 1A-1Edepict illustrative icons, including modulated icons, usable in a display system and method in accordance with a preferred embodiment of the present invention
- FIG. 2illustrates general image locations for a display presenting various anatomical datasets in accordance with a preferred embodiment of the present invention
- FIG. 3illustrates a dataset of the head region usable in the display of FIG. 2;
- FIG. 4illustrates a respiratory dataset usable in the display of FIG. 2, including details of an arterial blood gas dataset
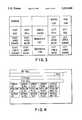
- FIG. 5illustrates hematologic and electrolyte datasets usable in the display of FIG. 2;
- FIG. 6illustrates a cardiovascular dataset usable in the display of FIG. 2
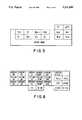
- FIG. 7illustrates an abdominal/gastrointestinal dataset usable in the display of FIG. 2;
- FIG. 8illustrates an image of a heart pace setting device which can be incorporated into the display of FIG. 2;
- FIG. 9illustrates a method of creating of an image from a dataset in accordance with the present invention.
- the teachings of the current inventionare applicable to creation of a display from any information source which produces alphanumeric and/or binary information, including alphanumeric representations of information which are associated as "words.”
- the only requirement for the production of a displayis to define the specific datapoints to be contained in each image, to assign specific locations for each image on the display, and then to decide on the methodology (color, intensity, size, presence or absence, shape/form modulation, or any combination of these) to be used to describe different valuations for members of a given dataset.
- green iconsare used to designate normal conditions
- red iconsto designate abnormally high values
- yellow iconsto designate abnormally low values.
- Value modulationis indicated by changing a portion of a green icon to red or yellow.
- frequency of occurrence of an eventis indicated by modulating the amount of color in a given icon.
- corrective interventionsuch as therapeutic devices, for example vascular lines, catheters, other tubes, etc., which can be attached to or in the patient, are detailed with white icons in specifically defined locations. Blue icons are used to describe infections of certain organs or organ systems, again on the basis of location on the display. In other areas of the display, e.g. in the corrective intervention area, various types of intervention are designated by color and/or form of the icon, as well as by location.
- medical therapeutic interventionsuch as inotropes, which are a class of medications including dopamine, dobutamine, epinephrine, norepinephrine, etc.
- inotropeswhich are a class of medications including dopamine, dobutamine, epinephrine, norepinephrine, etc.
- medication routei.e. oral or intravenous is detailed by icon location.
- information obtained on a given patientincludes such information as the presence or absence of various vascular lines (e.g., peripheral or central IV's), catheters, and tubes (e.g., endotracheal, nasogastric, chest, and intra-aortic balloons), etc., as well as various blood parameters (e.g., electrolytes, hemograms, clotting factors, liver function tests, cardiac enzymes, etc.), physical exam findings (e.g., neurological findings, findings about the chest, the cardiac system, the extremities, etc.), vital signs, input and output systems, (e.g., urine, gastrointestinal, etc.), daily weights, etc., all of which are entered into the display system either in alphanumerical form for subsequent analysis by the system which then assigns and plots the appropriate icons, or directly as icons from the keyboard via specifically programmed keys actuated by physicians or other paramedical personnel.
- various vascular linese.g., peripheral or central IV's
- catheterse.g., endotrac
- new valuesare assigned to the various icons comprising each display.
- various binary iconse.g., presence or absence of a foley catheter
- the representative imageis simply removed from the display when the device is removed from the patient.
- all caregivers viewing the displayobtain immediate knowledge of the patient's overall condition, including the level of instrumentation. In addition to having value from a caregiver's standpoint, this has additional value for those doing acuity assessments.
- FIG. 1Adepicts the basic icon 10, which is displayed in the color green to indicate a normal condition, red to indicate a dangerously high condition, or yellow to indicate a dangerously low condition. Modulations are accomplished with the use of color, with each basic icon form being identical.
- FIG. 1Bdepicts a green icon 12 having a yellow center 14 to indicate a slightly low abnormality
- FIG. 1Cdepicts a yellow icon 16 with a green center 18, indicating a moderately low abnormality.
- a solid yellow iconthus, indicates a very low abnormality.
- FIG. 1Ddepicts a green icon 20 with a red center 22 to indicate a slightly high abnormality
- 1Edepicts a red icon 24 with a green center 26 to indicate a moderately high abnormality, and a solid red icon indicates a very high abnormality. Dangerously low or high levels are indicated by causing the yellow or red icon to blink or flash. Further refinement of the slightly and moderately abnormal level indications can be provided by appropriately modulating the size of the center 14, 18, 22, or 26 within the abnormal icon 12, 16, 20, or 24.
- FIG. 2depicts the basic display consisting of a "stick figure" representing the head, body areas, arms and legs of a patient.
- the head imageis detailed in FIG. 3 and consists of icons representing parameters including average and peak temperatures, gaze, and pupil activity, as well as upper and lower extremity motor and sensory functions. Additionally included in this image are illustrative device icons representing a naso-gastric tube and an endotracheal tube.
- a "mental status" iconindicates the consciousness level of the patient, including whether the patient is alert and awake, somnolent, comatose, or agitated. Head pain or "headache,” which is a symptom or compliant, is also depicted by an icon.
- FIG. 2also depicts general areas within the body display where images indicating datasets from the various systems are plotted. These correspond roughly to the general anatomical locations of the particular systems, thereby assisting in visualization and assimilation of the information in the display.
- the general respiratory images, depicted in FIG. 4include datasets indicating details such as ventilator settings, respiratory rate, arterial blood gases, and lung exam icons. Details of the blood gas display are also shown.
- FIG. 5depicts images regarding datasets indicating blood work, specifically hemogram and electrolytes, which could be considered “central” as compared to specific system blood work, such as liver function tests (vide infra), cardiac isozymes, etc. Additionally, previously acquired information is "dated” by presenting it in an icon adjacent the current icon, providing within the image comparative information and so allowing the caregiver to assimilate progress of the patient.
- FIG. 5includes details of hemogram and electrolyte images.
- the magnesium "Mg++” icon in the electrolyte datasetis displayed even though it is not considered a standard part of a "SMA6" (a standard electrolyte profile) or a “SMA7” (another standard profile which adds creatinine to the SMA6).
- the displayshows the tremendous advantage of creating standard datasets and images.
- a caregiver evaluating the patientmust closely examine the patient chart, or in a computer based system must "pull up” the value of magnesium, to determine whether required tests have been performed.
- the presence or absence of the "Mg++" iconimmediately gives the caregiver this information.
- the presence of icons, but also their absence in a given imagetransmits information.
- the cardiovascular dataset imageincludes, for example, heart rate, blood pressure, cardiac index, pulmonary capillary wedge pressure, vascular resistance, and the associated rhythm image consisting of occurrence icons or images for premature atrial and ventricular contractions, supraventricular tachycardia and atrial fibrillation, ventricular tachycardia, and ventricular fibrillation. Additionally contained within the cardiovascular section of the display are the cardiac isoenzyme, and physical exam images. As can be seen, current, high/low, and average indications can be presented for varying parameters.
- FIG. 7depicts the image of the abdominal/gastrointestinal area dataset.
- the liver datasetis displayed in the displayed stick figure's right upper quadrant, which is the general anatomical location of the liver.
- datapoint iconsare located so as to readily show the various "sub-conditions" that can occur with respect to the liver, e.g., acute hepatocellular disease would appear much differently than a biliary obstructive type process.
- the gastrointestinal system imageis also designed to have an appearance generally similar to the actual gastrointestinal system. FIG.
- FIG. 7additionally shows how images can be created that transmit related but variable source multiparametric datapoints from, e.g., laboratory sources, (amylase), physical examination ("Pal”--palpation, "BS”--bowel sounds), patient complaints ("Nau”--nausea), observed phenomena ("Vom”--vomiting, "Dia”--diarrhea), etc.
- Thisreveals the true power behind this information display methodology. Physicians can recognize complex patient conditions as simple images. Several blank or unused icon locations are included in FIG. 7 to accommodate additional phenomena.
- FIG. 8depicts an image representing a heart pacesetting device or "Pacemaker.”
- Device iconsare preferably displayed in white. For the most part they are binary, i.e., present or absent. However, they can also be modulated, as are other datapoint icons, to describe a specific datapoint, e.g., present but with an abnormal function. Specifically, an abnormally functioning device, such as an abnormally functioning heart pace setting device, may be modulated with black. Further refinements of the preferred embodiment might include methodologies for further modulation. In the current example, modulation might be required to describe an abnormal "sense", or abnormal "pace" function of a pace setting device.
- FIG. 9illustrates the method of creating images. Simply stated, a given datapoint falls in a certain range which is translated into the datapoint icon. This icon is then combined in a standard fashion with other icons in the dataset to produce an image.
- FIG. 2can represent a single bodily part, for example a foot which has been fractured, and a separate, enlarged display can be called up with images that present indications of the conditions of the several bones, the cartilage, etc. within the foot.
Landscapes
- Engineering & Computer Science (AREA)
- Theoretical Computer Science (AREA)
- General Engineering & Computer Science (AREA)
- Health & Medical Sciences (AREA)
- General Physics & Mathematics (AREA)
- Physics & Mathematics (AREA)
- Human Computer Interaction (AREA)
- Epidemiology (AREA)
- General Health & Medical Sciences (AREA)
- Medical Informatics (AREA)
- Primary Health Care (AREA)
- Public Health (AREA)
- Measuring And Recording Apparatus For Diagnosis (AREA)
Abstract
Description
Claims (13)
Priority Applications (1)
| Application Number | Priority Date | Filing Date | Title |
|---|---|---|---|
| US07/989,462US5321800A (en) | 1989-11-24 | 1992-12-10 | Graphical language methodology for information display |
Applications Claiming Priority (2)
| Application Number | Priority Date | Filing Date | Title |
|---|---|---|---|
| US44087789A | 1989-11-24 | 1989-11-24 | |
| US07/989,462US5321800A (en) | 1989-11-24 | 1992-12-10 | Graphical language methodology for information display |
Related Parent Applications (1)
| Application Number | Title | Priority Date | Filing Date |
|---|---|---|---|
| US44087789AContinuation | 1989-11-24 | 1989-11-24 |
Publications (1)
| Publication Number | Publication Date |
|---|---|
| US5321800Atrue US5321800A (en) | 1994-06-14 |
Family
ID=23750545
Family Applications (1)
| Application Number | Title | Priority Date | Filing Date |
|---|---|---|---|
| US07/989,462Expired - LifetimeUS5321800A (en) | 1989-11-24 | 1992-12-10 | Graphical language methodology for information display |
Country Status (1)
| Country | Link |
|---|---|
| US (1) | US5321800A (en) |
Cited By (66)
| Publication number | Priority date | Publication date | Assignee | Title |
|---|---|---|---|---|
| US5488569A (en)* | 1993-12-20 | 1996-01-30 | At&T Corp. | Application-oriented telecommunication system interface |
| US5630081A (en)* | 1995-09-07 | 1997-05-13 | Puma Technology, Inc. | Connection resource manager displaying link-status information using a traffic light iconic representation |
| US5630664A (en)* | 1995-12-20 | 1997-05-20 | Farrelly; Patricia A. | Hand held apparatus for performing medical calculations |
| US5653887A (en)* | 1995-06-07 | 1997-08-05 | Cobe Laboratories, Inc. | Apheresis blood processing method using pictorial displays |
| US5657460A (en)* | 1995-04-11 | 1997-08-12 | Data View, Inc. | System and method for storing and displaying data |
| US5680558A (en)* | 1993-12-09 | 1997-10-21 | Canon Kabushiki Kaisha | Multimedia file management in which specialized icons can be created for different file types |
| US5684969A (en)* | 1991-06-25 | 1997-11-04 | Fuji Xerox Co., Ltd. | Information management system facilitating user access to information content through display of scaled information nodes |
| US5710899A (en)* | 1991-12-06 | 1998-01-20 | Lucent Technologies Inc. | Interactive selectors for selecting subsets of a set of values |
| GB2328168A (en)* | 1997-08-15 | 1999-02-17 | Vickers Inc | Entering and displaying structure information in a machining system |
| US5905493A (en)* | 1996-11-13 | 1999-05-18 | Unalink Communications, Inc. | Color coded instructional scheme for computers and the like system, method and article of manufacture |
| WO1999024913A3 (en)* | 1997-11-07 | 1999-07-29 | Frank Hans Juergen | Problem oriented information and communication method |
| US6034676A (en)* | 1995-04-11 | 2000-03-07 | Data View, Inc. | System and method for measuring and processing tire depth data |
| US6200287B1 (en) | 1997-09-05 | 2001-03-13 | Gambro, Inc. | Extracorporeal blood processing methods and apparatus |
| US6327501B1 (en) | 1999-11-02 | 2001-12-04 | Pacesetter, Inc. | System and method for determining safety alert conditions for implantable medical devices |
| WO2001093241A1 (en)* | 2000-05-31 | 2001-12-06 | Bela, Inc. | Method of graphically indicating patient information |
| US20010052110A1 (en)* | 2000-02-14 | 2001-12-13 | Julian Orbanes | System and method for graphically programming operators |
| US20020004729A1 (en)* | 2000-04-26 | 2002-01-10 | Christopher Zak | Electronic data gathering for emergency medical services |
| US20020075311A1 (en)* | 2000-02-14 | 2002-06-20 | Julian Orbanes | Method for viewing information in virtual space |
| US20020080177A1 (en)* | 2000-02-14 | 2002-06-27 | Julian Orbanes | Method and apparatus for converting data objects to a custom format for viewing information in virtual space |
| US20020177758A1 (en)* | 1996-12-30 | 2002-11-28 | Ido Schoenberg | Patient treatment and progress monitor display |
| US20030065537A1 (en)* | 2001-08-31 | 2003-04-03 | Docusys, Inc. | System and method for displaying drug information |
| US6639614B1 (en) | 2000-07-10 | 2003-10-28 | Stephen Michael Kosslyn | Multi-variate data presentation method using ecologically valid stimuli |
| US20030203205A1 (en)* | 1997-07-21 | 2003-10-30 | Xiangxin Bi | Nanoparticle production and corresponding structures |
| US20030214537A1 (en)* | 2002-05-16 | 2003-11-20 | Heloise Bloxsom Lynn | Method for displaying multi-dimensional data values |
| US6730055B2 (en) | 2000-03-09 | 2004-05-04 | Gambro Inc. | Extracorporeal blood processing methods and apparatus |
| US6741264B1 (en)* | 1999-05-11 | 2004-05-25 | Gific Corporation | Method of generating an audible indication of data stored in a database |
| US20040111296A1 (en)* | 1999-11-18 | 2004-06-10 | Brian Rosenfeld | System and method for physician note creation and management |
| US6751620B2 (en) | 2000-02-14 | 2004-06-15 | Geophoenix, Inc. | Apparatus for viewing information in virtual space using multiple templates |
| US20040152060A1 (en)* | 2003-01-31 | 2004-08-05 | Haru Ando | Learning condition judging program and user condition judging system |
| US20040153343A1 (en)* | 2003-01-31 | 2004-08-05 | Phyllis Gotlib | Medical information query system |
| US20040152952A1 (en)* | 2003-01-31 | 2004-08-05 | Phyllis Gotlib | Medical information event manager |
| US20050159987A1 (en)* | 1999-06-23 | 2005-07-21 | Visicu, Inc. | System and method for standardizing care in a hospital environment |
| US20050177400A1 (en)* | 1999-06-23 | 2005-08-11 | Visicu, Inc. | Remote command center for patient monitoring relationship to other applications |
| US20050187796A1 (en)* | 1999-06-23 | 2005-08-25 | Visicu, Inc. | System and method for displaying a health status of hospitalized patients |
| US20050203777A1 (en)* | 1999-06-23 | 2005-09-15 | Rosenfeld Brian A. | System and method for accounting and billing patients in a hospital environment |
| US20060004610A1 (en)* | 2004-01-09 | 2006-01-05 | Eran David | Clinical data database system and method for a critical care and/or hospital environment |
| US20060017563A1 (en)* | 1999-06-23 | 2006-01-26 | Rosenfeld Brian A | System and method for observing patients in geographically dispersed health care locations |
| US20060022834A1 (en)* | 1999-06-23 | 2006-02-02 | Rosenfeld Brian A | System and method for video observation of a patient in a health care location |
| US7000193B1 (en) | 2002-02-07 | 2006-02-14 | Impink Jr Albert J | Display to facilitate the monitoring of a complex process |
| US20060052949A1 (en)* | 2000-03-01 | 2006-03-09 | Gambro Inc | Extracorporeal blood processing information management system |
| US20060064324A1 (en)* | 1999-06-23 | 2006-03-23 | Visicu, Inc. | Video visitation system and method for a health care location |
| US7017515B1 (en)* | 1999-09-03 | 2006-03-28 | Delaval Holding Ab | Graphical user interface and method related thereto |
| US20060085227A1 (en)* | 1999-06-23 | 2006-04-20 | Visicu, Inc. | System and method for patient-worn monitoring of patients in geographically dispersed health care locations |
| US20060147369A1 (en)* | 1997-07-21 | 2006-07-06 | Neophotonics Corporation | Nanoparticle production and corresponding structures |
| US20060271409A1 (en)* | 1999-06-23 | 2006-11-30 | Rosenfeld Brian A | System for providing expert care to a basic care medical facility from a remote location |
| US20060271410A1 (en)* | 1999-06-23 | 2006-11-30 | Rosenfeld Brian A | Order evaluation system for use in a healthcare location |
| US20060271408A1 (en)* | 1999-06-23 | 2006-11-30 | Rosenfeld Brian A | Rules-base patient care system for use in healthcare locations |
| US20070027368A1 (en)* | 2005-07-14 | 2007-02-01 | Collins John P | 3D anatomical visualization of physiological signals for online monitoring |
| US20070208725A1 (en)* | 2006-03-03 | 2007-09-06 | Mike Gilger | Displaying common operational pictures |
| US7395216B2 (en) | 1999-06-23 | 2008-07-01 | Visicu, Inc. | Using predictive models to continuously update a treatment plan for a patient in a health care location |
| US20090075083A1 (en)* | 1997-07-21 | 2009-03-19 | Nanogram Corporation | Nanoparticle production and corresponding structures |
| US20100056875A1 (en)* | 2008-08-28 | 2010-03-04 | Imdsoft, Inc. | Monitoring Patient Conditions |
| US7765112B2 (en) | 1996-10-16 | 2010-07-27 | Health Hero Network, Inc. | Multiple patient monitoring system for proactive health management |
| US20100217623A1 (en)* | 2009-02-26 | 2010-08-26 | Ido Schoenberg | Decision Support |
| US20110106558A1 (en)* | 2009-11-02 | 2011-05-05 | Cerner Innovation, Inc. | Infection control solution |
| CN103052956A (en)* | 2010-08-03 | 2013-04-17 | 皇家飞利浦电子股份有限公司 | Method for display and navigation to clinical events |
| US20130339890A1 (en)* | 2011-12-31 | 2013-12-19 | Peter Wilkinson | Visual presentation of multi-dimentional data sets |
| US9248446B2 (en) | 2013-02-18 | 2016-02-02 | Terumo Bct, Inc. | System for blood separation with a separation chamber having an internal gravity valve |
| US9336620B2 (en) | 2007-09-07 | 2016-05-10 | Visualcue Technologies, LLC | Advanced data visualization solutions in high-volume data analytics |
| US20170126772A1 (en)* | 2015-11-02 | 2017-05-04 | Microsoft Technology Licensing, Llc | Streaming data on charts |
| US9733805B2 (en) | 2012-06-26 | 2017-08-15 | Terumo Bct, Inc. | Generating procedures for entering data prior to separating a liquid into components |
| CN108664181A (en)* | 2018-04-03 | 2018-10-16 | 北京天使软件技术有限公司 | The system extracted with extraocular muscle anatomical location and show extraocular muscle MRI image data |
| US10216359B2 (en) | 2007-09-07 | 2019-02-26 | Visualcue Technologies, LLC | System for displaying a status of an object of interest |
| US10409450B2 (en) | 2007-09-07 | 2019-09-10 | Visualcue Technologies, LLC | System for displaying a system status for a plurality of objects of interest |
| US11093704B2 (en) | 2015-11-02 | 2021-08-17 | Microsoft Technology Licensing, Llc | Rich data types |
| US11207015B2 (en)* | 2013-01-04 | 2021-12-28 | Infobionic, Inc. | Systems and methods for processing and displaying patient electrocardiograph data |
Citations (25)
| Publication number | Priority date | Publication date | Assignee | Title |
|---|---|---|---|---|
| US3993861A (en)* | 1975-03-24 | 1976-11-23 | Sanders Associates, Inc. | Digital video modulation and demodulation system |
| US4045815A (en)* | 1976-02-04 | 1977-08-30 | The United States Of America As Represented By The Secretary Of The Department Of Health, Education And Welfare | System for combining analog and image signals into a standard video format |
| US4051522A (en)* | 1975-05-05 | 1977-09-27 | Jonathan Systems | Patient monitoring system |
| US4154230A (en)* | 1977-01-17 | 1979-05-15 | The United States Of America As Represented By The Administrator Of The National Aeronautics And Space Administration | EKG and ultrasonoscope display |
| US4344145A (en)* | 1979-10-12 | 1982-08-10 | Chasek Norman E | Display method and apparatus for efficiently communicating the status of an ongoing process or system by the simultaneous display of many normalized parameter deviations |
| US4436684A (en)* | 1982-06-03 | 1984-03-13 | Contour Med Partners, Ltd. | Method of forming implantable prostheses for reconstructive surgery |
| US4489387A (en)* | 1981-08-20 | 1984-12-18 | Lamb David E | Method and apparatus for coordinating medical procedures |
| US4513753A (en)* | 1981-11-17 | 1985-04-30 | Kabushiki Kaisha Daini Seikosha | Heartbeat rate indicator |
| US4527240A (en)* | 1982-12-29 | 1985-07-02 | Kvitash Vadim I | Balascopy method for detecting and rapidly evaluating multiple imbalances within multi-parametric systems |
| US4570225A (en)* | 1983-07-22 | 1986-02-11 | Lundy Research Laboratories, Inc. | Method and apparatus for characterizing the unknown state of a physical system |
| US4598368A (en)* | 1982-12-27 | 1986-07-01 | Tokyo Shibaura Denki Kabushiki Kaisha | Superposed image display device |
| US4608635A (en)* | 1982-08-03 | 1986-08-26 | Thomas Jefferson University | Method and apparatus for tomographic diagnosis |
| US4631676A (en)* | 1983-05-25 | 1986-12-23 | Hospital For Joint Diseases Or | Computerized video gait and motion analysis system and method |
| US4639223A (en)* | 1985-01-02 | 1987-01-27 | Keller Jr J Walter | Simulated heart display system |
| US4648028A (en)* | 1984-08-31 | 1987-03-03 | General Electric Co. | Color enhanced display for a numerical control system |
| US4664125A (en)* | 1984-05-10 | 1987-05-12 | Pinto John G | Flow-occluding method for the diagnosis of heart conditions |
| US4675147A (en)* | 1983-04-06 | 1987-06-23 | Westinghouse Electic Corp. | Generating an integrated graphic display of the safety status of a complex process plant |
| US4729381A (en)* | 1986-02-04 | 1988-03-08 | Nippon Colin Co., Ltd. | Living body information recorder |
| US4794532A (en)* | 1986-11-10 | 1988-12-27 | Hewlett-Packard Company | Virtual arrhythmia system |
| US4805631A (en)* | 1985-04-09 | 1989-02-21 | Roi Du Maroc Ii Sa Majeste H | Device for the detection, the study and the supervision of diseases, and in particular heart diseases, resulting in electrically recordable manifestations |
| US4809705A (en)* | 1984-10-11 | 1989-03-07 | Gilles Ascher | Portable electrocardiogram monitor |
| US4847785A (en)* | 1985-01-22 | 1989-07-11 | International Business Machines Corp. | Interactive display for trend or bar graph |
| US4996654A (en)* | 1988-12-22 | 1991-02-26 | Tektronix, Inc. | Method of displaying acquired data |
| US5043920A (en)* | 1989-09-20 | 1991-08-27 | International Business Machines Corporation | Multi-dimension visual analysis |
| US5140519A (en)* | 1988-05-19 | 1992-08-18 | Dragerwerk Aktiengesellschaft | Method for monitoring patient data and circuit arrangement therefor |
- 1992
- 1992-12-10USUS07/989,462patent/US5321800A/ennot_activeExpired - Lifetime
Patent Citations (26)
| Publication number | Priority date | Publication date | Assignee | Title |
|---|---|---|---|---|
| US3993861A (en)* | 1975-03-24 | 1976-11-23 | Sanders Associates, Inc. | Digital video modulation and demodulation system |
| US4051522A (en)* | 1975-05-05 | 1977-09-27 | Jonathan Systems | Patient monitoring system |
| US4045815A (en)* | 1976-02-04 | 1977-08-30 | The United States Of America As Represented By The Secretary Of The Department Of Health, Education And Welfare | System for combining analog and image signals into a standard video format |
| US4154230A (en)* | 1977-01-17 | 1979-05-15 | The United States Of America As Represented By The Administrator Of The National Aeronautics And Space Administration | EKG and ultrasonoscope display |
| US4344145A (en)* | 1979-10-12 | 1982-08-10 | Chasek Norman E | Display method and apparatus for efficiently communicating the status of an ongoing process or system by the simultaneous display of many normalized parameter deviations |
| US4489387A (en)* | 1981-08-20 | 1984-12-18 | Lamb David E | Method and apparatus for coordinating medical procedures |
| US4513753A (en)* | 1981-11-17 | 1985-04-30 | Kabushiki Kaisha Daini Seikosha | Heartbeat rate indicator |
| US4436684B1 (en)* | 1982-06-03 | 1988-05-31 | ||
| US4436684A (en)* | 1982-06-03 | 1984-03-13 | Contour Med Partners, Ltd. | Method of forming implantable prostheses for reconstructive surgery |
| US4608635A (en)* | 1982-08-03 | 1986-08-26 | Thomas Jefferson University | Method and apparatus for tomographic diagnosis |
| US4598368A (en)* | 1982-12-27 | 1986-07-01 | Tokyo Shibaura Denki Kabushiki Kaisha | Superposed image display device |
| US4527240A (en)* | 1982-12-29 | 1985-07-02 | Kvitash Vadim I | Balascopy method for detecting and rapidly evaluating multiple imbalances within multi-parametric systems |
| US4675147A (en)* | 1983-04-06 | 1987-06-23 | Westinghouse Electic Corp. | Generating an integrated graphic display of the safety status of a complex process plant |
| US4631676A (en)* | 1983-05-25 | 1986-12-23 | Hospital For Joint Diseases Or | Computerized video gait and motion analysis system and method |
| US4570225A (en)* | 1983-07-22 | 1986-02-11 | Lundy Research Laboratories, Inc. | Method and apparatus for characterizing the unknown state of a physical system |
| US4664125A (en)* | 1984-05-10 | 1987-05-12 | Pinto John G | Flow-occluding method for the diagnosis of heart conditions |
| US4648028A (en)* | 1984-08-31 | 1987-03-03 | General Electric Co. | Color enhanced display for a numerical control system |
| US4809705A (en)* | 1984-10-11 | 1989-03-07 | Gilles Ascher | Portable electrocardiogram monitor |
| US4639223A (en)* | 1985-01-02 | 1987-01-27 | Keller Jr J Walter | Simulated heart display system |
| US4847785A (en)* | 1985-01-22 | 1989-07-11 | International Business Machines Corp. | Interactive display for trend or bar graph |
| US4805631A (en)* | 1985-04-09 | 1989-02-21 | Roi Du Maroc Ii Sa Majeste H | Device for the detection, the study and the supervision of diseases, and in particular heart diseases, resulting in electrically recordable manifestations |
| US4729381A (en)* | 1986-02-04 | 1988-03-08 | Nippon Colin Co., Ltd. | Living body information recorder |
| US4794532A (en)* | 1986-11-10 | 1988-12-27 | Hewlett-Packard Company | Virtual arrhythmia system |
| US5140519A (en)* | 1988-05-19 | 1992-08-18 | Dragerwerk Aktiengesellschaft | Method for monitoring patient data and circuit arrangement therefor |
| US4996654A (en)* | 1988-12-22 | 1991-02-26 | Tektronix, Inc. | Method of displaying acquired data |
| US5043920A (en)* | 1989-09-20 | 1991-08-27 | International Business Machines Corporation | Multi-dimension visual analysis |
Cited By (122)
| Publication number | Priority date | Publication date | Assignee | Title |
|---|---|---|---|---|
| US5684969A (en)* | 1991-06-25 | 1997-11-04 | Fuji Xerox Co., Ltd. | Information management system facilitating user access to information content through display of scaled information nodes |
| US5710899A (en)* | 1991-12-06 | 1998-01-20 | Lucent Technologies Inc. | Interactive selectors for selecting subsets of a set of values |
| US5680558A (en)* | 1993-12-09 | 1997-10-21 | Canon Kabushiki Kaisha | Multimedia file management in which specialized icons can be created for different file types |
| US5488569A (en)* | 1993-12-20 | 1996-01-30 | At&T Corp. | Application-oriented telecommunication system interface |
| US6034676A (en)* | 1995-04-11 | 2000-03-07 | Data View, Inc. | System and method for measuring and processing tire depth data |
| US5657460A (en)* | 1995-04-11 | 1997-08-12 | Data View, Inc. | System and method for storing and displaying data |
| US5653887A (en)* | 1995-06-07 | 1997-08-05 | Cobe Laboratories, Inc. | Apheresis blood processing method using pictorial displays |
| US5630081A (en)* | 1995-09-07 | 1997-05-13 | Puma Technology, Inc. | Connection resource manager displaying link-status information using a traffic light iconic representation |
| US5630664A (en)* | 1995-12-20 | 1997-05-20 | Farrelly; Patricia A. | Hand held apparatus for performing medical calculations |
| US7840420B2 (en)* | 1996-10-16 | 2010-11-23 | Health Hero Network, Inc. | Multiple patient monitoring system for proactive health management |
| US7778845B2 (en)* | 1996-10-16 | 2010-08-17 | Health Hero Network, Inc. | Multiple patient monitoring system for proactive health management |
| US7765112B2 (en) | 1996-10-16 | 2010-07-27 | Health Hero Network, Inc. | Multiple patient monitoring system for proactive health management |
| US5905493A (en)* | 1996-11-13 | 1999-05-18 | Unalink Communications, Inc. | Color coded instructional scheme for computers and the like system, method and article of manufacture |
| US20020177758A1 (en)* | 1996-12-30 | 2002-11-28 | Ido Schoenberg | Patient treatment and progress monitor display |
| US7831450B2 (en) | 1996-12-30 | 2010-11-09 | I.M.D. Soft Ltd. | Medical order information display system |
| US20110004489A1 (en)* | 1996-12-30 | 2011-01-06 | I.M.D. Soft Ltd. | Medical Information System |
| US20030036687A1 (en)* | 1996-12-30 | 2003-02-20 | Ido Schoenberg | Medical order information display system |
| US8027846B2 (en) | 1996-12-30 | 2011-09-27 | I.M.D. Soft Ltd. | Patient treatment and progress monitor display |
| US7778851B2 (en) | 1996-12-30 | 2010-08-17 | I.M.D. Soft Ltd. | Medical information system |
| US7899683B2 (en) | 1996-12-30 | 2011-03-01 | I.M.D. Soft Ltd. | Medical information system |
| US20090075083A1 (en)* | 1997-07-21 | 2009-03-19 | Nanogram Corporation | Nanoparticle production and corresponding structures |
| US20080026220A9 (en)* | 1997-07-21 | 2008-01-31 | Xiangxin Bi | Nanoparticle-based power coatings and corresponding structures |
| US20030203205A1 (en)* | 1997-07-21 | 2003-10-30 | Xiangxin Bi | Nanoparticle production and corresponding structures |
| US20060147369A1 (en)* | 1997-07-21 | 2006-07-06 | Neophotonics Corporation | Nanoparticle production and corresponding structures |
| GB2328168B (en)* | 1997-08-15 | 2002-11-20 | Vickers Inc | Method and apparatus for entering and displaying structure information in a machining system |
| US5984503A (en)* | 1997-08-15 | 1999-11-16 | Vickers, Incorporated | Method and apparatus for entering and displaying structure information in a machining system |
| GB2328168A (en)* | 1997-08-15 | 1999-02-17 | Vickers Inc | Entering and displaying structure information in a machining system |
| US6773413B2 (en) | 1997-09-05 | 2004-08-10 | Gamero Inc | Extracorporeal blood processing methods and apparatus |
| US6200287B1 (en) | 1997-09-05 | 2001-03-13 | Gambro, Inc. | Extracorporeal blood processing methods and apparatus |
| WO1999024913A3 (en)* | 1997-11-07 | 1999-07-29 | Frank Hans Juergen | Problem oriented information and communication method |
| US6741264B1 (en)* | 1999-05-11 | 2004-05-25 | Gific Corporation | Method of generating an audible indication of data stored in a database |
| US8175895B2 (en) | 1999-06-23 | 2012-05-08 | Koninklijke Philips Electronics N.V. | Remote command center for patient monitoring |
| US7395216B2 (en) | 1999-06-23 | 2008-07-01 | Visicu, Inc. | Using predictive models to continuously update a treatment plan for a patient in a health care location |
| US7650291B2 (en) | 1999-06-23 | 2010-01-19 | Koninklijke Philips Electronics N.V. | Video visitation system and method for a health care location |
| US7991625B2 (en) | 1999-06-23 | 2011-08-02 | Koninklijke Philips Electronics N.V. | System for providing expert care to a basic care medical facility from a remote location |
| US8170887B2 (en) | 1999-06-23 | 2012-05-01 | Koninklijke Philips Electronics N.V. | System and method for providing continuous, expert network care services from a remote location(s) to geographically dispersed healthcare locations |
| US7467094B2 (en) | 1999-06-23 | 2008-12-16 | Visicu, Inc. | System and method for accounting and billing patients in a hospital environment |
| US7454360B2 (en) | 1999-06-23 | 2008-11-18 | Visicu, Inc. | Order evaluation system for use in a healthcare location |
| US7454359B2 (en) | 1999-06-23 | 2008-11-18 | Visicu, Inc. | System and method for displaying a health status of hospitalized patients |
| US20050159987A1 (en)* | 1999-06-23 | 2005-07-21 | Visicu, Inc. | System and method for standardizing care in a hospital environment |
| US20050177400A1 (en)* | 1999-06-23 | 2005-08-11 | Visicu, Inc. | Remote command center for patient monitoring relationship to other applications |
| US20050187796A1 (en)* | 1999-06-23 | 2005-08-25 | Visicu, Inc. | System and method for displaying a health status of hospitalized patients |
| US20050203777A1 (en)* | 1999-06-23 | 2005-09-15 | Rosenfeld Brian A. | System and method for accounting and billing patients in a hospital environment |
| US7433827B2 (en) | 1999-06-23 | 2008-10-07 | Visicu, Inc. | System and method for displaying a health status of hospitalized patients |
| US7411509B2 (en) | 1999-06-23 | 2008-08-12 | Visicu, Inc. | System and method for observing patients in geographically dispersed health care locations |
| US20060017563A1 (en)* | 1999-06-23 | 2006-01-26 | Rosenfeld Brian A | System and method for observing patients in geographically dispersed health care locations |
| US20060022834A1 (en)* | 1999-06-23 | 2006-02-02 | Rosenfeld Brian A | System and method for video observation of a patient in a health care location |
| US20060025657A1 (en)* | 1999-06-23 | 2006-02-02 | Rosenfeld Brian A | System and method for providing continuous, expert network care services from a remote location(s) to geographically dispersed healthcare locations |
| US7256708B2 (en) | 1999-06-23 | 2007-08-14 | Visicu, Inc. | Telecommunications network for remote patient monitoring |
| US7307543B2 (en) | 1999-06-23 | 2007-12-11 | Visicu, Inc. | System and method for video observation of a patient in a health care location |
| US20060064324A1 (en)* | 1999-06-23 | 2006-03-23 | Visicu, Inc. | Video visitation system and method for a health care location |
| US7315825B2 (en) | 1999-06-23 | 2008-01-01 | Visicu, Inc. | Rules-based patient care system for use in healthcare locations |
| US20060071797A1 (en)* | 1999-06-23 | 2006-04-06 | Brian Rosenfeld | Telecommunications network for remote patient monitoring |
| US20060085229A9 (en)* | 1999-06-23 | 2006-04-20 | Visicu, Inc. | Remote command center for patient monitoring relationship to other applications |
| US20060085227A1 (en)* | 1999-06-23 | 2006-04-20 | Visicu, Inc. | System and method for patient-worn monitoring of patients in geographically dispersed health care locations |
| US20060122869A9 (en)* | 1999-06-23 | 2006-06-08 | Visicu, Inc. | System and method for standardizing care in a hospital environment |
| US20060271408A1 (en)* | 1999-06-23 | 2006-11-30 | Rosenfeld Brian A | Rules-base patient care system for use in healthcare locations |
| US20060161459A9 (en)* | 1999-06-23 | 2006-07-20 | Visicu, Inc. | System and method for displaying a health status of hospitalized patients |
| US7321862B2 (en) | 1999-06-23 | 2008-01-22 | Visicu, Inc. | System and method for patient-worn monitoring of patients in geographically dispersed health care locations |
| US20060271409A1 (en)* | 1999-06-23 | 2006-11-30 | Rosenfeld Brian A | System for providing expert care to a basic care medical facility from a remote location |
| US20060271410A1 (en)* | 1999-06-23 | 2006-11-30 | Rosenfeld Brian A | Order evaluation system for use in a healthcare location |
| US7017515B1 (en)* | 1999-09-03 | 2006-03-28 | Delaval Holding Ab | Graphical user interface and method related thereto |
| US6327501B1 (en) | 1999-11-02 | 2001-12-04 | Pacesetter, Inc. | System and method for determining safety alert conditions for implantable medical devices |
| US6687544B1 (en) | 1999-11-02 | 2004-02-03 | Pacesetter, Inc. | System and method for determining safety alert conditions for implantable medical devices |
| US20040111296A1 (en)* | 1999-11-18 | 2004-06-10 | Brian Rosenfeld | System and method for physician note creation and management |
| US7475019B2 (en) | 1999-11-18 | 2009-01-06 | Visicu, Inc. | System and method for physician note creation and management |
| US6785667B2 (en) | 2000-02-14 | 2004-08-31 | Geophoenix, Inc. | Method and apparatus for extracting data objects and locating them in virtual space |
| US6751620B2 (en) | 2000-02-14 | 2004-06-15 | Geophoenix, Inc. | Apparatus for viewing information in virtual space using multiple templates |
| US20020080177A1 (en)* | 2000-02-14 | 2002-06-27 | Julian Orbanes | Method and apparatus for converting data objects to a custom format for viewing information in virtual space |
| US20020075311A1 (en)* | 2000-02-14 | 2002-06-20 | Julian Orbanes | Method for viewing information in virtual space |
| US20010052110A1 (en)* | 2000-02-14 | 2001-12-13 | Julian Orbanes | System and method for graphically programming operators |
| US20060052949A1 (en)* | 2000-03-01 | 2006-03-09 | Gambro Inc | Extracorporeal blood processing information management system |
| US20040249332A1 (en)* | 2000-03-09 | 2004-12-09 | Gambro, Inc. | Extra-corporeal Dual Stage Blood Processing Method and Apparatus |
| US20040230152A1 (en)* | 2000-03-09 | 2004-11-18 | Gambro, Inc. | Extra-corporeal Blood Processing Method and Apparatus Based on Donor Characteristics |
| US6945948B2 (en) | 2000-03-09 | 2005-09-20 | Gambro, Inc. | Extra-corporeal dual stage blood processing method and apparatus |
| US7354415B2 (en) | 2000-03-09 | 2008-04-08 | Gambro Bct, Inc. | Extra-corporeal blood processing method and apparatus based on donor characteristics |
| US6730055B2 (en) | 2000-03-09 | 2004-05-04 | Gambro Inc. | Extracorporeal blood processing methods and apparatus |
| US20020004729A1 (en)* | 2000-04-26 | 2002-01-10 | Christopher Zak | Electronic data gathering for emergency medical services |
| US7107547B2 (en) | 2000-05-31 | 2006-09-12 | Grady Smith | Method of graphically indicating patient information |
| WO2001093241A1 (en)* | 2000-05-31 | 2001-12-06 | Bela, Inc. | Method of graphically indicating patient information |
| US6639614B1 (en) | 2000-07-10 | 2003-10-28 | Stephen Michael Kosslyn | Multi-variate data presentation method using ecologically valid stimuli |
| US20030065537A1 (en)* | 2001-08-31 | 2003-04-03 | Docusys, Inc. | System and method for displaying drug information |
| US7000193B1 (en) | 2002-02-07 | 2006-02-14 | Impink Jr Albert J | Display to facilitate the monitoring of a complex process |
| US20030214537A1 (en)* | 2002-05-16 | 2003-11-20 | Heloise Bloxsom Lynn | Method for displaying multi-dimensional data values |
| US20040152060A1 (en)* | 2003-01-31 | 2004-08-05 | Haru Ando | Learning condition judging program and user condition judging system |
| US8930213B2 (en) | 2003-01-31 | 2015-01-06 | I.M.D. Soft Ltd. | Medical information event manager |
| US7848935B2 (en) | 2003-01-31 | 2010-12-07 | I.M.D. Soft Ltd. | Medical information event manager |
| US8620678B2 (en) | 2003-01-31 | 2013-12-31 | Imd Soft Ltd. | Medical information query system |
| US20110166887A1 (en)* | 2003-01-31 | 2011-07-07 | I.M.D. Soft Ltd. | Medical Information Event Manager |
| US20040153343A1 (en)* | 2003-01-31 | 2004-08-05 | Phyllis Gotlib | Medical information query system |
| US20040152952A1 (en)* | 2003-01-31 | 2004-08-05 | Phyllis Gotlib | Medical information event manager |
| US20060004610A1 (en)* | 2004-01-09 | 2006-01-05 | Eran David | Clinical data database system and method for a critical care and/or hospital environment |
| US20070027368A1 (en)* | 2005-07-14 | 2007-02-01 | Collins John P | 3D anatomical visualization of physiological signals for online monitoring |
| US20070208725A1 (en)* | 2006-03-03 | 2007-09-06 | Mike Gilger | Displaying common operational pictures |
| US9336620B2 (en) | 2007-09-07 | 2016-05-10 | Visualcue Technologies, LLC | Advanced data visualization solutions in high-volume data analytics |
| US10216359B2 (en) | 2007-09-07 | 2019-02-26 | Visualcue Technologies, LLC | System for displaying a status of an object of interest |
| US10409450B2 (en) | 2007-09-07 | 2019-09-10 | Visualcue Technologies, LLC | System for displaying a system status for a plurality of objects of interest |
| US8600777B2 (en) | 2008-08-28 | 2013-12-03 | I.M.D. Soft Ltd. | Monitoring patient conditions |
| US20100056875A1 (en)* | 2008-08-28 | 2010-03-04 | Imdsoft, Inc. | Monitoring Patient Conditions |
| US20100217623A1 (en)* | 2009-02-26 | 2010-08-26 | Ido Schoenberg | Decision Support |
| US20100217621A1 (en)* | 2009-02-26 | 2010-08-26 | Ido Schoenberg | Clinical Information |
| US20110106558A1 (en)* | 2009-11-02 | 2011-05-05 | Cerner Innovation, Inc. | Infection control solution |
| CN103052956A (en)* | 2010-08-03 | 2013-04-17 | 皇家飞利浦电子股份有限公司 | Method for display and navigation to clinical events |
| US20130246089A1 (en)* | 2010-08-03 | 2013-09-19 | Koninklijke Philips Electronics N.V. | Method for display and navigation to clinical events |
| US20130339890A1 (en)* | 2011-12-31 | 2013-12-19 | Peter Wilkinson | Visual presentation of multi-dimentional data sets |
| US9678635B2 (en)* | 2011-12-31 | 2017-06-13 | Quest Diagnostics Investments Incorporated | Visual presentation of multi-dimensional data sets |
| US11875025B2 (en) | 2011-12-31 | 2024-01-16 | Quest Diagnostics Investments Incorporated | Visual presentation of multi-dimensional data sets |
| US12327008B2 (en) | 2011-12-31 | 2025-06-10 | Quest Diagnostics Investments Incorporated | Visual presentation of multi-dimensional data sets |
| US10528231B2 (en) | 2011-12-31 | 2020-01-07 | Quest Diagnostics Investments Inc. | Visual presentation of multi-dimensional data sets |
| US11669228B2 (en) | 2011-12-31 | 2023-06-06 | Quest Diagnostics Investments Incorporated | Visual presentation of multi-dimensional data sets |
| US11036369B2 (en) | 2011-12-31 | 2021-06-15 | Quest Diagnostics Investments Incorporated | Visual presentation of multi-dimensional data sets |
| US9733805B2 (en) | 2012-06-26 | 2017-08-15 | Terumo Bct, Inc. | Generating procedures for entering data prior to separating a liquid into components |
| US11207015B2 (en)* | 2013-01-04 | 2021-12-28 | Infobionic, Inc. | Systems and methods for processing and displaying patient electrocardiograph data |
| US9248446B2 (en) | 2013-02-18 | 2016-02-02 | Terumo Bct, Inc. | System for blood separation with a separation chamber having an internal gravity valve |
| US11093704B2 (en) | 2015-11-02 | 2021-08-17 | Microsoft Technology Licensing, Llc | Rich data types |
| US11157689B2 (en) | 2015-11-02 | 2021-10-26 | Microsoft Technology Licensing, Llc | Operations on dynamic data associated with cells in spreadsheets |
| US11106865B2 (en) | 2015-11-02 | 2021-08-31 | Microsoft Technology Licensing, Llc | Sound on charts |
| US11321520B2 (en) | 2015-11-02 | 2022-05-03 | Microsoft Technology Licensing, Llc | Images on charts |
| US11630947B2 (en) | 2015-11-02 | 2023-04-18 | Microsoft Technology Licensing, Llc | Compound data objects |
| US20170126772A1 (en)* | 2015-11-02 | 2017-05-04 | Microsoft Technology Licensing, Llc | Streaming data on charts |
| CN108664181B (en)* | 2018-04-03 | 2021-05-07 | 北京天使软件技术有限公司 | A system for extracting and displaying extraocular muscle MRI image data based on the anatomical position of the extraocular muscle |
| CN108664181A (en)* | 2018-04-03 | 2018-10-16 | 北京天使软件技术有限公司 | The system extracted with extraocular muscle anatomical location and show extraocular muscle MRI image data |
Similar Documents
| Publication | Publication Date | Title |
|---|---|---|
| US5321800A (en) | Graphical language methodology for information display | |
| JP5584413B2 (en) | Patient monitoring system and monitoring method | |
| Law et al. | A comparison of graphical and textual presentations of time series data to support medical decision making in the neonatal intensive care unit | |
| JP5996840B2 (en) | System and method for graphical display of medical information | |
| CN101460086B (en) | Display of trends and anticipated trends from mitigation | |
| JP2007021213A (en) | Anatomical visualization method for physiological signal, and anatomical visualization method and visualization apparatus for a plurality of physiological signals | |
| EP4079224A1 (en) | Electrocardiographic analysis device, electrocardiographic analysis method, and program | |
| EP1509867A2 (en) | Data analysis system | |
| EP2422695A2 (en) | Monitoring patients receiving care | |
| US20210401379A1 (en) | Early warning score design and other scores | |
| Watt et al. | Alarms and anesthesia: challenges in design of intelligent systems for patient monitoring | |
| US8994733B2 (en) | Clock-wise representation of information | |
| TW202020890A (en) | Display system for medical information and method for producing display content | |
| CN113226154A (en) | Display method, monitoring equipment and system for early warning score | |
| CN105517488A (en) | Devices and methods for assessing, diagnosing and/or monitoring cardiac health | |
| Meijler | Automation in anesthesia—a relief?: A systematic approach to computers in patient monitoring | |
| CN112911992B (en) | Monitoring method, monitor and computer storage medium | |
| JP7199368B2 (en) | Patient status monitor with visually powerful patient status display | |
| WO2023126012A1 (en) | Patient monitoring device and patient monitoring alarm method | |
| CN116669618A (en) | Monitoring device and display method for monitoring device | |
| Ruth-Sahd | Fostering intuition: A role of the trauma nurse mentor | |
| Deneault | Comparing Geometric Object and Conventional Displays in Patient Monitoring | |
| JP2025119196A (en) | Hypotension risk prediction device, hypotension risk prediction system, hypotension risk prediction method, and hypotension risk prediction program | |
| Fahy et al. | Clinician Monitoring | |
| CN114947775A (en) | Early warning scoring system capable of displaying in real time and method thereof |
Legal Events
| Date | Code | Title | Description |
|---|---|---|---|
| STCF | Information on status: patent grant | Free format text:PATENTED CASE | |
| AS | Assignment | Owner name:LMI OF BREVARD COUNTY, INC. Free format text:ASSIGNMENT OF ASSIGNORS INTEREST;ASSIGNOR:LESSER, MICHAEL F.;REEL/FRAME:007403/0065 Effective date:19950411 | |
| FEPP | Fee payment procedure | Free format text:PAYOR NUMBER ASSIGNED (ORIGINAL EVENT CODE: ASPN); ENTITY STATUS OF PATENT OWNER: SMALL ENTITY | |
| FPAY | Fee payment | Year of fee payment:4 | |
| AS | Assignment | Owner name:GIFIC CORPORATION, THE, FLORIDA Free format text:ASSIGNMENT OF ASSIGNORS INTEREST;ASSIGNOR:LMI OF BREVARD COUNTY;REEL/FRAME:008855/0898 Effective date:19971117 | |
| AS | Assignment | Owner name:GIFIC CORPORATION, THE, FLORIDA Free format text:CONFIRMATION OF ASSIGNMENT;ASSIGNOR:LMI OF BREVARD COUNTY, INC.;REEL/FRAME:009235/0981 Effective date:19980601 | |
| FPAY | Fee payment | Year of fee payment:8 | |
| FEPP | Fee payment procedure | Free format text:PAYER NUMBER DE-ASSIGNED (ORIGINAL EVENT CODE: RMPN); ENTITY STATUS OF PATENT OWNER: SMALL ENTITY Free format text:PAYOR NUMBER ASSIGNED (ORIGINAL EVENT CODE: ASPN); ENTITY STATUS OF PATENT OWNER: SMALL ENTITY | |
| AS | Assignment | Owner name:FYI CORPORATION, FLORIDA Free format text:ASSIGNMENT OF ASSIGNORS INTEREST;ASSIGNOR:GIFIC CORPORATION;REEL/FRAME:016079/0301 Effective date:20050405 | |
| FPAY | Fee payment | Year of fee payment:12 |