US5252487A - Method and apparatus for determining the amount of oncogene protein product in a cell sample - Google Patents
Method and apparatus for determining the amount of oncogene protein product in a cell sampleDownload PDFInfo
- Publication number
- US5252487A US5252487AUS08/009,378US937893AUS5252487AUS 5252487 AUS5252487 AUS 5252487AUS 937893 AUS937893 AUS 937893AUS 5252487 AUS5252487 AUS 5252487A
- Authority
- US
- United States
- Prior art keywords
- dna
- amount
- protein product
- cell
- oncogene protein
- Prior art date
- Legal status (The legal status is an assumption and is not a legal conclusion. Google has not performed a legal analysis and makes no representation as to the accuracy of the status listed.)
- Expired - Lifetime
Links
- 108700020796OncogeneProteins0.000titleclaimsabstractdescription101
- 102000043276OncogeneHuman genes0.000titleclaimsabstractdescription100
- 238000000034methodMethods0.000titleclaimsabstractdescription26
- 230000003287optical effectEffects0.000claimsabstractdescription60
- 210000004027cellAnatomy0.000claimsdescription235
- 210000001519tissueAnatomy0.000claimsdescription59
- 238000002360preparation methodMethods0.000claimsdescription37
- 230000004044responseEffects0.000claimsdescription23
- 210000000805cytoplasmAnatomy0.000claimsdescription16
- 239000000463materialSubstances0.000claimsdescription7
- 230000002708enhancing effectEffects0.000claims6
- 108090000623proteins and genesProteins0.000abstractdescription13
- 238000006243chemical reactionMethods0.000abstractdescription10
- 102000004169proteins and genesHuman genes0.000abstractdescription8
- 238000005259measurementMethods0.000abstractdescription7
- 239000000523sampleSubstances0.000description33
- 210000003855cell nucleusAnatomy0.000description17
- 206010028980NeoplasmDiseases0.000description15
- 102100030086Receptor tyrosine-protein kinase erbB-2Human genes0.000description15
- 102000002260Alkaline PhosphataseHuman genes0.000description14
- 108020004774Alkaline PhosphataseProteins0.000description14
- 241000282414Homo sapiensSpecies0.000description11
- 101001012157Homo sapiens Receptor tyrosine-protein kinase erbB-2Proteins0.000description11
- KUUVQVSHGLHAKZ-UHFFFAOYSA-NthionineChemical compoundC=1C=CC=CSC=CC=1KUUVQVSHGLHAKZ-UHFFFAOYSA-N0.000description8
- 201000011510cancerDiseases0.000description7
- 101710100968Receptor tyrosine-protein kinase erbB-2Proteins0.000description6
- 238000012545processingMethods0.000description6
- 238000010186stainingMethods0.000description6
- 206010006187Breast cancerDiseases0.000description5
- 208000026310Breast neoplasmDiseases0.000description5
- 241000283973Oryctolagus cuniculusSpecies0.000description5
- WLDHEUZGFKACJH-UHFFFAOYSA-KamaranthChemical compound[Na+].[Na+].[Na+].C12=CC=C(S([O-])(=O)=O)C=C2C=C(S([O-])(=O)=O)C(O)=C1N=NC1=CC=C(S([O-])(=O)=O)C2=CC=CC=C12WLDHEUZGFKACJH-UHFFFAOYSA-K0.000description5
- 230000005540biological transmissionEffects0.000description5
- 239000000872bufferSubstances0.000description5
- 239000011824nuclear materialSubstances0.000description5
- 238000003556assayMethods0.000description4
- 210000000481breastAnatomy0.000description4
- 230000035755proliferationEffects0.000description4
- 206010061535Ovarian neoplasmDiseases0.000description3
- 238000003491arrayMethods0.000description3
- 238000004891communicationMethods0.000description3
- 230000003211malignant effectEffects0.000description3
- 229910019142PO4Inorganic materials0.000description2
- 230000001413cellular effectEffects0.000description2
- 230000001086cytosolic effectEffects0.000description2
- 238000010562histological examinationMethods0.000description2
- 230000036210malignancyEffects0.000description2
- 238000012986modificationMethods0.000description2
- 230000004048modificationEffects0.000description2
- 235000021317phosphateNutrition0.000description2
- 230000003595spectral effectEffects0.000description2
- 230000004083survival effectEffects0.000description2
- 238000002560therapeutic procedureMethods0.000description2
- 238000011269treatment regimenMethods0.000description2
- 102000004190EnzymesHuman genes0.000description1
- 108090000790EnzymesProteins0.000description1
- 206010033128Ovarian cancerDiseases0.000description1
- 102000004160Phosphoric Monoester HydrolasesHuman genes0.000description1
- 108090000608Phosphoric Monoester HydrolasesProteins0.000description1
- 208000006994Precancerous ConditionsDiseases0.000description1
- 102000052575Proto-OncogeneHuman genes0.000description1
- 108700020978Proto-OncogeneProteins0.000description1
- 208000035199TetraploidyDiseases0.000description1
- 238000010521absorption reactionMethods0.000description1
- 230000009471actionEffects0.000description1
- 238000013459approachMethods0.000description1
- 239000000987azo dyeSubstances0.000description1
- 238000001574biopsyMethods0.000description1
- 230000005907cancer growthEffects0.000description1
- 238000005094computer simulationMethods0.000description1
- 230000002596correlated effectEffects0.000description1
- 238000011161developmentMethods0.000description1
- 238000003745diagnosisMethods0.000description1
- 238000002405diagnostic procedureMethods0.000description1
- 238000010586diagramMethods0.000description1
- 210000001840diploid cellAnatomy0.000description1
- 238000009826distributionMethods0.000description1
- 230000009977dual effectEffects0.000description1
- 230000000694effectsEffects0.000description1
- 238000001914filtrationMethods0.000description1
- 239000012634fragmentSubstances0.000description1
- 238000010191image analysisMethods0.000description1
- 230000001788irregularEffects0.000description1
- 230000007774longtermEffects0.000description1
- 239000000203mixtureSubstances0.000description1
- 230000000877morphologic effectEffects0.000description1
- 238000010606normalizationMethods0.000description1
- 230000002611ovarianEffects0.000description1
- NBIIXXVUZAFLBC-UHFFFAOYSA-KphosphateChemical compound[O-]P([O-])([O-])=ONBIIXXVUZAFLBC-UHFFFAOYSA-K0.000description1
- 239000010452phosphateSubstances0.000description1
- 150000003013phosphoric acid derivativesChemical class0.000description1
- 230000008569processEffects0.000description1
- 238000004445quantitative analysisMethods0.000description1
- 238000011160researchMethods0.000description1
- 239000000126substanceSubstances0.000description1
- 238000012546transferMethods0.000description1
- 238000011282treatmentMethods0.000description1
- 230000001018virulenceEffects0.000description1
Images


Classifications
- C—CHEMISTRY; METALLURGY
- C12—BIOCHEMISTRY; BEER; SPIRITS; WINE; VINEGAR; MICROBIOLOGY; ENZYMOLOGY; MUTATION OR GENETIC ENGINEERING
- C12Q—MEASURING OR TESTING PROCESSES INVOLVING ENZYMES, NUCLEIC ACIDS OR MICROORGANISMS; COMPOSITIONS OR TEST PAPERS THEREFOR; PROCESSES OF PREPARING SUCH COMPOSITIONS; CONDITION-RESPONSIVE CONTROL IN MICROBIOLOGICAL OR ENZYMOLOGICAL PROCESSES
- C12Q1/00—Measuring or testing processes involving enzymes, nucleic acids or microorganisms; Compositions therefor; Processes of preparing such compositions
- C12Q1/68—Measuring or testing processes involving enzymes, nucleic acids or microorganisms; Compositions therefor; Processes of preparing such compositions involving nucleic acids
- C12Q1/6876—Nucleic acid products used in the analysis of nucleic acids, e.g. primers or probes
- C12Q1/6883—Nucleic acid products used in the analysis of nucleic acids, e.g. primers or probes for diseases caused by alterations of genetic material
- C12Q1/6886—Nucleic acid products used in the analysis of nucleic acids, e.g. primers or probes for diseases caused by alterations of genetic material for cancer
- G—PHYSICS
- G01—MEASURING; TESTING
- G01N—INVESTIGATING OR ANALYSING MATERIALS BY DETERMINING THEIR CHEMICAL OR PHYSICAL PROPERTIES
- G01N1/00—Sampling; Preparing specimens for investigation
- G01N1/28—Preparing specimens for investigation including physical details of (bio-)chemical methods covered elsewhere, e.g. G01N33/50, C12Q
- G01N1/30—Staining; Impregnating ; Fixation; Dehydration; Multistep processes for preparing samples of tissue, cell or nucleic acid material and the like for analysis
- G01N1/31—Apparatus therefor
- Y—GENERAL TAGGING OF NEW TECHNOLOGICAL DEVELOPMENTS; GENERAL TAGGING OF CROSS-SECTIONAL TECHNOLOGIES SPANNING OVER SEVERAL SECTIONS OF THE IPC; TECHNICAL SUBJECTS COVERED BY FORMER USPC CROSS-REFERENCE ART COLLECTIONS [XRACs] AND DIGESTS
- Y10—TECHNICAL SUBJECTS COVERED BY FORMER USPC
- Y10S—TECHNICAL SUBJECTS COVERED BY FORMER USPC CROSS-REFERENCE ART COLLECTIONS [XRACs] AND DIGESTS
- Y10S436/00—Chemistry: analytical and immunological testing
- Y10S436/811—Test for named disease, body condition or organ function
- Y10S436/813—Cancer
- Y—GENERAL TAGGING OF NEW TECHNOLOGICAL DEVELOPMENTS; GENERAL TAGGING OF CROSS-SECTIONAL TECHNOLOGIES SPANNING OVER SEVERAL SECTIONS OF THE IPC; TECHNICAL SUBJECTS COVERED BY FORMER USPC CROSS-REFERENCE ART COLLECTIONS [XRACs] AND DIGESTS
- Y10—TECHNICAL SUBJECTS COVERED BY FORMER USPC
- Y10T—TECHNICAL SUBJECTS COVERED BY FORMER US CLASSIFICATION
- Y10T436/00—Chemistry: analytical and immunological testing
- Y10T436/25—Chemistry: analytical and immunological testing including sample preparation
Definitions
- the inventionrelates to a system for performing an assay of a cell sample to provide an accurate quantitative analysis of a characteristic of the cells which have been sampled. More particularly, the invention is directed to a system which receives images of stained cells and enhances the cell images prior to further processing to determine an amount of oncogene protein product in the cells of a cell sample.
- a pathologistafter having examined the stained cell sample, makes a qualitative determination of the state of the tissue or the patient from whom the sample was removed and reaches a conclusion as to whether the patient is normal, or has a premalignant condition which might place him at risk of a malignancy in the future or has cancer. While this diagnostic method has provided some degree of predictability in the past, it is somewhat lacking in scientific rigor since it is heavily reliant on the subjective judgement of the pathologist. In addition, it is sometimes difficult for the practitioner to determine the stage which the tumor has reached. Such a determination often allows the clinician to select a particular treatment by balancing the tumor's resistance to therapy with the potential harm resulting from the selected therapy.
- U.S. application Ser. No. 315,289, filed Feb. 24, 1989, now U.S. Pat. No. 5,086,476 for Method and Apparatus for Determining a Proliferation Index of a Cell Sample to Bacusdiscloses a system for determining the proliferation index of cells by microscopic examination of cell samples which have been stained with a proliferation substance stain and a nuclear stain.
- the systemincludes a computer coupled to a pair of monochrome television cameras, which receive optically filtered images of the magnified cell images, and an image processor. The system computes the proliferation index from the optical characteristics of the stained cell sample.
- oncogenes and proto-oncogenesalso may contribute to the growth and development of human beings in the early stages of their lives.
- oncogenesseem to be related to specific cancers.
- the neu HER-2 proto-oncogeneappears to be related to human breast and ovarian cancers.
- neu HER-2 proto-oncogenes and the oncogene protein product that is expressed from neu HER-2appear, when in elevated amounts, to be correlated with the virulence of the cancer, Slamon D.J.
- the monoclonal antibody based stains for visualizing the oncogene protein productwork best on frozen sections, as opposed to other types of prepared cell samples.
- the sectioned tissuesuffers from the problem that while a number of whole cells are present in the section, a number of fractional portions of cells are also present, preventing assaying simply by counting of the cells in an image field of a microscope. It is important to know the sum total of cells being examined because the assay of oncogene protein product is on the basis of the amount of oncogene protein product per cell.
- What is neededis a method and apparatus for automatically and quickly assaying the amount of oncogene protein product in the cells of frozen sectioned tissues taken from a human patient.
- the present inventionprovides a rapid and convenient method and an apparatus for practicing the method for determining the amount of oncogene protein product in the cells of a cell sample.
- the inventionis practiced upon samples of tissue taken from sites of suspected malignancies, in particular human breast and ovarian cancers.
- the tissue sectionsare cell samples comprising frozen sections of connected cells.
- Cell samplesmay also be made from touch preparations, which are made by touching a freshly microtomed or sectioned surface of a piece of frozen tissue to a microscope slide to which the cells cling.
- the apparatus and methodemploy a mouse alkaline phosphatase based staining system with an anti-rabbit mouse bridging antibody, wherein rabbit antibodies for a protein product of the genes being assayed are connected to the bridging antibody.
- the genemay be neu HER-2, the number of copies of which have been found to be an indicator of the long-term survival of a patient suffering from human breast cancer.
- the alkaline phosphatase antibodiesare complexed with an enzyme, in this embodiment alkaline phosphatase.
- the cellsare contacted with the rabbit primary antibody, which binds only to portions of the cytoplasm of the cells having epitopes identifying them as having the protein product of the neu HER-2 oncogene.
- a stainin this embodiment Napthol ASTR phosphate and Fast Red KL chromogen, v is placed in contact with the cells having the antibody-alkaline phosphatase conjugate bound to their neu HER-2 protein product sites.
- the alkaline phosphatasecatalyzes a chromogen forming reaction only at the areas where it is bound.
- the catalyzed chromogen forming reactionproduces a red chromogen comprised of a red azo dye at the oncogene protein product sites.
- the cellsalso are stained with a conventional stain for DNA, in this instance a thionine stain using the Feulgen technique which yields a blue stain at cellular sites where there is DNA.
- the image of the cellsis magnified in a light microscope and split into a pair of separated images.
- the separated imagesare enhanced by a pair of narrow bandpass optical filters.
- One of the narrow bandpass optical filterspreferentially transmits light having a wavelength at the transmission region of the blue DNA stain thereby producing an optically enhanced oncogene protein product image which only has background and the red chromogen.
- the background of the oncogene protein product imageis composed of the cell nuclei, cytoplasm and the like which have substantially zero optical density.
- the oncogene protein product siteshave a relatively high optical density. Thus the only features which are easily perceivable are the oncogene protein product sites.
- the other narrow bandpass optical filterpreferentially transmits in the regions of spectral absorption for the blue stain.
- This filterproduces an optically enhanced DNA image of all portions of the cells, with and without neu HER-2 protein product.
- the apparatussenses the enhanced oncogene protein product image with a first monochrome television camera.
- the enhanced DNA imageis sensed by a second monochrome television camera.
- Analog signals representative of the imagesare fed to respective image processors.
- the image processorsconvert the analog signals to digitized arrays of pixels which are stored in internal frame buffers.
- the apparatuscomputes a summed optical density of the oncogene protein product image which has high optical density, yielding an area measure weighted by the average pixel optical density for the oncogene protein product in that image field.
- the inventionincludes the steps of quantitating a standardized cell sample for DNA in order to determine the linear relationship between the summed optical density of pixels of each cell image in the cell image field having a value indicative of an optical density greater than a selected threshold value.
- a touch preparationis made of cells from the frozen section of the tissue to be examined. This is done by touching the frozen tissue to the warmed slide also having the standardized cells for DNA calibration thereon. The touch preparation comprises a whole cell preparation. In order to obtain the amount of DNA per cell, it is necessary to segregate the pixels associated with each separated cell into separate categories. This is done by the system in conjunction with the human operator.
- the summed optical density of each of the cell image pixels for each of the sampled cellsis also determined in order to determine the average amount of DNA in picograms per cell in the cell sample taken from the patient. This is done in order to remove error introduced by sectioning the tissue sample when the frozen section is made. Thus an average is obtained for the amount of DNA per cell in the cells of the tissue sample.
- the clinicianthen can proceed to the next step in the quantitation of the cytoplasm material, specifically the oncogene protein product.
- the whole cell preparationallows an accurate assay of the amount of nuclear material, it cannot be used to assay the cytoplasm. This is because the cytoplasm is relatively fragile and is not completely transferred to the warmed slide in the touch preparation procedure.
- a second slideis prepared with a standard cell line thereon having a known amount of DNA per cell and having a known amount of oncogene protein product in the cytoplasm of its cells and the frozen section from the tissue sample taken from the patient.
- Both samples on the second slideare stained with the thionine stain and the alkaline phosphatase staining system.
- the first sampleis quantitated for both DNA and the oncogene protein product so that the system can create a pair of linear equations relating the optical densities of the pixels sensed by the two optical trains to the known amounts of DNA and oncogene protein product in the calibration sample on the second slide.
- the frozen section cell sample containing what may be cancer cellsis then examined using the apparatus. Since the cancer cells of the frozen section do not have well defined borders, it is impractical to allow the apparatus and or the human operator to assign areas of the image field uniquely associated with single cells.
- the optical densities of the pixels associated with the red chromogen as detected by the 500 nanometer optical train, and exceeding a second preselected thresholdare summed for the entire image field to provide a summed or total value for the amount of oncogene protein product in the cells in the image field.
- the total amount of DNA in the image fieldis also determined by summing the pixels of the image from the 620 nanometer optical train exceeding the first threshold to yield a total for the amount of DNA in the cells in the image field.
- the amount of DNA in the image fieldis divided by the average value for the DNA in the whole cell sample previously determined by examination of the touch preparation thereby yielding the sum total of whole and fractional cells in the image field.
- the image field cell total for the image fieldis then stored.
- the total amount of oncogene protein productis then divided by the image field cell total to yield the amount of oncogene protein product per cell in the image field.
- FIG. 1is an isometric view of an apparatus for determining an amount of an oncogene protein product embodying the present invention
- FIG. 2is a block diagram of the apparatus of FIG. 1;
- FIG. 3is an elevational view of an optical conversion module of the apparatus of FIG. 1;
- FIG. 4is a magnified view of a stained cell sample as seen through the microscope of FIG. 1 without optical filtering;
- FIG. 5is a magnified view of the stained cell sample of FIG. 4 as seen through a 620 nanometer narrow band optical filter which yields a DNA or nuclear material image;
- FIG. 6is a magnified view of the stained cell sample of FIG. 4 as seen through a 500 nanometer narrow band optical filter which yields an oncogene protein product image;
- FIG. 7is a graph of the spectral response of a red chromogen, a thionine stain and the narrow band optical filters
- FIG. 8is an elevational view of a microscope slide including a calibration zone
- FIG. 9is an elevational view of a second microscope slide including a calibration zone
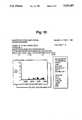
- FIG. 10is a depiction of a display screen shown by the system displaying a histogram of the per cell cytoplasmic mass in optical density units, of a set of control cells;
- FIG. 11is a depiction of a display screen shown by the system displaying a histogram of the per cell DNA or nuclear mass of a set of control cells;
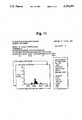
- FIG. 12is a depiction of a display screen shown by the system displaying a scattergram of the cytoplasmic mass versus the DNA or nuclear mass of the same cells.
- FIG. 13is a depiction of a screen display shown by the system displaying the average number of picograms of oncogene protein product per cell from a frozen section from a patient.
- the apparatus 10comprises an optical microscope 12, which may be of any conventional type but in this embodiment is a Reichart Diastar or Microstar.
- An optical conversion module 14is mounted on the microscope 12 to enhance optically a magnified image of a cell sample viewed with the microscope 12.
- the optical conversion module 14, as may best be seen in FIG. 3,has a cell nuclei or DNA sensing means comprising a cell nuclei image optical enhancement unit 16.
- the cell nuclei image optical enhancement unit 16has a 620 ⁇ 20 nanometer red narrow bandpass optical transmission filter 18 and a television camera 20 for receiving a filtered image from the filter 18.
- An oncogene protein product sensing meanscomprising an oncogene protein product optical enhancement module 22 has a green 500 ⁇ 20 nanometer narrow bandpass optical transmission filter 24 and a television camera 26 and is also part of the optical conversion module 14.
- Each of the television cameras 20 and 26generates a standard NTSC compatible signal representative, respectively, of an enhanced DNA or cell nuclear material image and an enhanced oncogene protein product image.
- An image processing system 28is connected to the television cameras 20 and 26 to receive the enhanced DNA image signal and the enhanced oncogene protein product image signal and to store a DNA pixel array and an oncogene protein product pixel array therein.
- the image processor 28is connected to a computer 32, in the present embodiment, an IBM personal computer model AT for processing of the DNA and oncogene protein product pixel arrays.
- the computer 32includes system bus 34, connected to the image processor unit 28.
- An 80286 microprocessor 36is connected to the system bus 34.
- a random access memory 38 and a read only memory 40are also connected to the system bus 34 for storage of information.
- a disk controller 42is connected by a local bus 44 to a Winchester disk drive 46 and to a floppy disk drive 48 for secondary information storage.
- a video conversion board 50in this embodiment an, EGA board having 256K bytes of memory, is connected to the system bus 34 to control an instruction monitor 52 connected to the EGA board 50.
- a keyboard processor 54is connected to the system bus 34 to interpret signals from a keyboard 56 which is connected to the keyboard processor 54.
- a printer 58is connected to the system bus 54 for communication therewith.
- An X Y or image field board 60is connected to the system bus 34.
- the X Y board 60also is connected to a slide holder of the microscope 12 to sense the relative position of a slide 62 with respect to a microscope objective 64 and thus identify a field being viewed. Included are a Y position sensor 66 and an X position sensor 68.
- the Y position sensor 66is connected via a communication path 70 to the X Y board 60.
- the X position sensor 68is connected via a communication path 72 to the X Y board 60.
- the microscope 12also includes an eyepiece 76 in optical alignment with the objective 64 for magnification of light forming an image of a cell sample on the slide 62.
- the method of the instant inventionis practiced by collecting a cell sample, which may be in the form of a tissue section made from a frozen section or a paraffinized section and having both cell nuclei, cell fragments and whole cells therein.
- the cells of the cell sampleare placed on the slide 62 and fixed thereon.
- a rabbit monoclonal antibody for a protein product of the neu HER-2 proto-oncogene to be detected in the cellsis then placed in contact with them.
- the monoclonal antibodyselectively binds to all points on and within the cells where the neu HER-2 protein product is present.
- the monoclonal antibodyalso has bound thereto a bridging anti-rabbit mouse antibody and an alkaline phosphatase complex.
- the alkaline phosphates complexcomprises an anti-mouse antibody which also specifically binds to the alkaline phosphatase enzyme.
- the alkaline phosphatase enzymeis bound to the antibody and held through the chain of antibodies to the neu HER-2 protein product in the cells.
- a quantity of a mixture containing Napthol ASTR and Fast Red KL chromogenis applied to the cell sample on the slide.
- the Napthol ASTR and the Fast Red KLreact to form a red azo chromogen.
- the usual rate of reactionhowever is relatively low.
- the alkaline phosphatasecatalyzes the chromogen-forming reaction only at the points where the alkaline phosphatase is localized.
- red chromogenis found only at the points in the cells where protein product of the neu HER-2 oncogene is present and the cells are preferentially stained only at the points where they have the oncogene protein product.
- any remaining unreacted Napthol ASTR and Fast Red KL chromogenare removed from the cell sample.
- the cellsare then stained with a thionine stain using the Feulgen technique which leaves a blue stain preferentially bound with the DNA in the cell nuclei.
- the DNAis stained blue and the points within the cells having oncogene protein product are stained red.
- the microscope slide 62is then placed on a carrying stage of the microscope 12 and the objective 64 is focused thereon.
- Light from the objective 64travels through the eyepiece 12 where it may be viewed by an observer.
- the optical converter module 14includes a beam-splitting mirror 80 which carries off approximately 90% of the light to other portions of the converter.
- the lightis fed to a dual prism dichroic mirror 82 which reflects a portion of the light to the red filter 18.
- the remaining portion of the lightis filtered by the dichroic mirror 82 and fed to the green filter 24.
- the dichroic mirror 82selectively passes light having wavelengths greater than 500 nanometers to the filter 18 and having a wavelength of less than 500 nanometers to the filter 24.
- the dichroic mirror 82acts as a first color filter before the light reaches the color filters 18 and 24.
- the filter 18When the light passes through the filter 18, the filter 18 preferentially blocks light from the blue stained DNA and provides a high contrast cell nuclei image to the camera 20.
- the optical characteristics of the blue stain and the red chromogen, as well as the optical filters 18 and 24are shown in the graph of FIG. 7.
- the camera 20then generates an NTSC DNA image signal which is fed to the image processor module 28.
- the image processor module 28has an image processor 90 and an image processor 92. Each of the image processors 90 and 92 is a model AT428 from the Datacube Corporation.
- the green filter 24provides a high contrast oncogene protein product image to the camera 26.
- the camera 26then feeds the oncogene protein product image signal to the image processor 92.
- Both of the image processors 90 and 92contain analog to digital converters for converting the analog NTSC signals to digitized arrays of pixels which are then stored within internal frame buffers.
- the internal frame buffersmay be accessed via the system bus 34 under the control of the microprocessor 36.
- the image of the cell sample viewed through the eyepiece 12is of the type shown in FIG. 4 having red cytoplasm 99 and a blue cell nucleus 100, red cytoplasm 101 and a blue cell nucleus 102, and red cytoplasm 103 and a blue cell nucleus 104.
- the cellsare shown therein as they would appear through the red filter 18, which causes all of the blue stained DNA to darken and appear prominently.
- the oncogene protein product image of the cell nuclei of FIG. 4is shown therein with the DNA of the cell nuclei 100, 102 and 104 being rendered substantially transparent or invisible by the effect of the 500 nanometer filter 24.
- the 500 nanometer filter 24transmits at an optical absorbing region of the red stain and at an optical transmission region of the blue stain.
- the 620 nanometer filtertransmits at an optical absorbing region of the blue stain and at an optical transmission region of the red stain.
- the image of FIG. 5is stored in the internal frame buffer of the image processor 90.
- the image of FIG. 6is formed and stored in the internal frame buffer of the image processor 92.
- the pixel values for the imagesmay be sliced using standard image processing techniques to increase the contrast between the stained areas and the backgrounds. That is, the areas of high optical density in FIG. 6 the cytoplasm 99, 101 and 103 are shown as being very dense and stored as high optical density pixels, while the background areas 110 may be stored as substantially zero optical density pixels in order to provide a clear threshold or difference between the two areas.
- a first slide 148includes a DNA or nuclear material calibration zone 150 and a whole cell preparation measurement zone 152.
- the calibration zone 150is a cell population having a known quantity of DNA, usually 7.18 picograms per cell nucleus in each of the cells.
- a whole cell preparationis positioned in the whole cell measurement zone 152 and is prepared by making a touch preparation from a frozen section taken from a human breast cancer tumor. The touch preparation is made simply by touching a warm slide to the frozen tumor tissue and allowing the cells from the frozen tumor tissue to cling to the warm slide.
- the DNA or nuclear materialincluding the entire cell nucleus, from the transferred cells clings to the whole cell preparation zone 152 and is thus pulled intact from the frozen tissue sample, although the associated cytoplasm may be damaged in the transfer.
- the standard cells in the calibration zone 150 and the cells of the whole cell preparation zone 152are then stained with a the thionine stain using the Feulgen technique in order to optically enhance the DNA.
- the systemthen reads the slide 148 by having it placed on the microscope stage where the image is fed through both of the optical trains 16 and 22.
- the image received by the camera 20consists of a darkened area where the DNA has been stained blue by the thionine stain and a substantially clear area outside it.
- the imageis digitized and the resulting pixels are stored.
- the stored pixelsare segregated into separate cell images.
- the pixel values exceeding the thresholdare summed to give summed values of optical density for each of the cells in the calibration zone 150.
- a similar summing techniqueis employed for the cells of the whole preparation zone 152.
- the valuesare stored and may be displayed in histograms by the system, as shown in FIG. 11.
- the valuesalso are averaged respectively, for the calibration cells and the whole cell preparation cells. Those averages are used to compute the average value of DNA mass per cell for the cells taken from the biopsied tissue and stained in the whole cell preparation zone 152.
- the average value of DNA mass per cellis used for later normalization of cytoplasm measurements from frozen sections.
- the summed optical density from the field from the calibration sideis equivalent to a concentration of 7.18 picograms a linear equation can be developed relating the optical density of the image to the amount of DNA present in the imaged cells.
- the optical density of the summed pixelsis measured on the right hand side of the slide 150 summed and sum value is inserted into the equation to compute the average quantity of DNA per cell in the frozen tissue section. If the cells are diploid cells, typically the average quantity will be 7.18 picograms. If the cells are tetraploid, which is often common with cancers, the cells will each typically have 14.36 picograms of DNA per cell nucleus.
- a second calibration slide 160 for calibrating the amount of oncogene protein productis then prepared.
- the second calibration slide 160includes a calibration portion 162 having a plurality of cells taken from a standard cell line having a known amount of DNA per cell and a known amount of oncogene protein product per cell.
- An examination zone 164 on the slide 160has frozen section of the tissue taken from a human patient who is to be evaluated.
- the standard cells in zone 162 and the sectioned cells in zone 164are then contacted with an oncogene protein product rabbit antibody which attaches to the protein products of the neu HER-2 oncogenes present in the cells.
- a bridging mouse anti-rabbit antibodyis conjugated with the rabbit antibody.
- An alkaline phosphatase antibody and alkaline phosphataseare conjugated to the mouse anti-rabbit antibody.
- Napthol ASTR and Fast Red KLare then placed on the slide and a red azo chromogen is formed at each of the locations where alkaline phosphatase is present.
- the cells in both zonesare stained red in the areas in which oncogene protein product is present.
- the cellsalso are stained with the thionine stain using the Feulgen technique. This allows the areas having DNA to be identified and measured. The amounts of DNA and oncogene protein product are determined in the same manner as the DNA was quantitated.
- the systemthus has stored therein the average amount of DNA and oncogene protein product per cell for the cells in the calibration zone 162. This allows staining variations to be calibrated out.
- the distributions of the per cell DNA and oncogene protein product amountsmay be output to the user in the form of display information as may best be seen in FIGS. 10, 11 and 12.
- the stained frozen tissue sectionis examined under the optical microscope.
- the cell imagesare fed through the 500 nanometer and 620 nanometer optical trains where respectively, summed optical densities, for the entire image field, of the DNA identified by the thionine stain and the neu HER-2 protein product identified by the red stain are computed.
- the total number of cells present in the image field under examinationis computed by dividing the summed DNA mass by the average amount of DNA per cell, as derived from the measurements made on the whole cell preparation.
- the summed amount of oncogene protein productis then divided by the number of cells under examination to yield the amount of oncogene protein product per cell, which is output on the display, as may best be seen in FIG. 13. It is this value which will allow the clinician to formulate an appropriate course of action for the patient.
- the invention disclosed hereinemploys particular materials, it may be appreciated that various other materials may be used. in its practice.
Landscapes
- Chemical & Material Sciences (AREA)
- Life Sciences & Earth Sciences (AREA)
- Health & Medical Sciences (AREA)
- Organic Chemistry (AREA)
- Engineering & Computer Science (AREA)
- Proteomics, Peptides & Aminoacids (AREA)
- Zoology (AREA)
- Wood Science & Technology (AREA)
- Analytical Chemistry (AREA)
- Immunology (AREA)
- Biochemistry (AREA)
- Molecular Biology (AREA)
- Physics & Mathematics (AREA)
- Pathology (AREA)
- Genetics & Genomics (AREA)
- General Health & Medical Sciences (AREA)
- General Engineering & Computer Science (AREA)
- Bioinformatics & Cheminformatics (AREA)
- Biotechnology (AREA)
- Biophysics (AREA)
- Microbiology (AREA)
- Biomedical Technology (AREA)
- General Physics & Mathematics (AREA)
- Hospice & Palliative Care (AREA)
- Oncology (AREA)
- Investigating Or Analysing Biological Materials (AREA)
Abstract
Description
Claims (6)
Applications Claiming Priority (1)
| Application Number | Priority Date | Filing Date | Title |
|---|---|---|---|
| US35466089A | 1989-05-19 | 1989-05-19 |
Related Parent Applications (1)
| Application Number | Title | Priority Date | Filing Date |
|---|---|---|---|
| US35466089AContinuation | 1989-05-19 | 1989-05-19 |
Publications (1)
| Publication Number | Publication Date |
|---|---|
| US5252487Atrue US5252487A (en) | 1993-10-12 |
Family
ID=23394383
Family Applications (1)
| Application Number | Title | Priority Date | Filing Date |
|---|---|---|---|
| US08/009,378Expired - LifetimeUS5252487A (en) | 1989-05-19 | 1993-01-27 | Method and apparatus for determining the amount of oncogene protein product in a cell sample |
Country Status (1)
| Country | Link |
|---|---|
| US (1) | US5252487A (en) |
Cited By (38)
| Publication number | Priority date | Publication date | Assignee | Title |
|---|---|---|---|---|
| US5352613A (en)* | 1993-10-07 | 1994-10-04 | Tafas Triantafillos P | Cytological screening method |
| WO1995023960A1 (en)* | 1994-03-01 | 1995-09-08 | Government Of The United States, Represented By The Secretary Of The Department Of Health And Human Services | Isolation of cellular material under microscopic visualization |
| WO1998039728A1 (en)* | 1997-03-03 | 1998-09-11 | Bacus Research Laboratories, Inc. | Method and apparatus for creating a virtual microscope slide |
| US5843657A (en)* | 1994-03-01 | 1998-12-01 | The United States Of America As Represented By The Department Of Health And Human Services | Isolation of cellular material under microscopic visualization |
| DE19726226A1 (en)* | 1997-06-22 | 1998-12-24 | Zentrum Fuer Neuroinformatik G | Automatic image recognition technique for comparison of tissue structures and cells, especially in medical diagnosis |
| US6007996A (en)* | 1995-12-12 | 1999-12-28 | Applied Spectral Imaging Ltd. | In situ method of analyzing cells |
| WO2000026650A1 (en)* | 1997-12-31 | 2000-05-11 | Mako, Frederick, M. | A system for describing the physical distribution of an agent in a patient |
| US6101265A (en)* | 1996-08-23 | 2000-08-08 | Bacus Research Laboratories, Inc. | Method and apparatus for acquiring and reconstructing magnified specimen images from a computer-controlled microscope |
| US6136540A (en)* | 1994-10-03 | 2000-10-24 | Ikonisys Inc. | Automated fluorescence in situ hybridization detection of genetic abnormalities |
| US6348325B1 (en) | 1999-10-29 | 2002-02-19 | Cytyc Corporation | Cytological stain composition |
| US6396941B1 (en) | 1996-08-23 | 2002-05-28 | Bacus Research Laboratories, Inc. | Method and apparatus for internet, intranet, and local viewing of virtual microscope slides |
| US6404906B2 (en) | 1997-03-03 | 2002-06-11 | Bacus Research Laboratories,Inc. | Method and apparatus for acquiring and reconstructing magnified specimen images from a computer-controlled microscope |
| US20020090120A1 (en)* | 2001-01-11 | 2002-07-11 | Wetzel Arthur W. | System and method for finding regions of interest for microscopic digital montage imaging |
| US20020090127A1 (en)* | 2001-01-11 | 2002-07-11 | Interscope Technologies, Inc. | System for creating microscopic digital montage images |
| US20020141050A1 (en)* | 2001-03-19 | 2002-10-03 | Triantafyllos Tafas | System and method for increasing the contrast of an image produced by an epifluorescence microscope |
| DE10124340A1 (en)* | 2001-05-18 | 2002-12-05 | Fraunhofer Ges Forschung | Method of analyzing a biological sample |
| US20030039384A1 (en)* | 2000-12-19 | 2003-02-27 | Bacus Research Laboratories, Inc. | Method and apparatus for processing an image of a tissue sample microarray |
| US6593102B2 (en) | 1999-10-29 | 2003-07-15 | Cytyc Corporation | Cytological stain composition |
| US20030166261A1 (en)* | 1999-04-14 | 2003-09-04 | Cytologix Corporation | Quality control for cytochemical assays |
| US6661501B1 (en) | 1999-10-29 | 2003-12-09 | Cytyc Corporation | Cytological stain composition including verification characteristic |
| US6665060B1 (en) | 1999-10-29 | 2003-12-16 | Cytyc Corporation | Cytological imaging system and method |
| US20040004614A1 (en)* | 2002-02-22 | 2004-01-08 | Bacus Laboratories, Inc. | Focusable virtual microscopy apparatus and method |
| US20040008894A1 (en)* | 1998-06-01 | 2004-01-15 | Zeineh Jack A. | Compression packaged image transmission for telemicroscopy |
| US6746848B2 (en) | 1998-10-21 | 2004-06-08 | Steven Jay Smith | Protein quantitation with cell imaging densitometry |
| US6798571B2 (en) | 2001-01-11 | 2004-09-28 | Interscope Technologies, Inc. | System for microscopic digital montage imaging using a pulse light illumination system |
| US6816606B2 (en) | 2001-02-21 | 2004-11-09 | Interscope Technologies, Inc. | Method for maintaining high-quality focus during high-throughput, microscopic digital montage imaging |
| US6867038B2 (en) | 1994-03-01 | 2005-03-15 | The United States Of America As Represented By The Department Of Health And Human Services | Isolation of cellular material under microscopic visualization |
| US20060034543A1 (en)* | 2004-08-16 | 2006-02-16 | Bacus James V | Method and apparatus of mechanical stage positioning in virtual microscopy image capture |
| US20060257908A1 (en)* | 2003-10-23 | 2006-11-16 | Georgetown University | Method for two- and three-dimensional microassembly of patterns and structures |
| US20060276974A1 (en)* | 2003-07-14 | 2006-12-07 | Trestle Acquisition Corp. | System for remote viewing and display of a slide |
| US20070141723A1 (en)* | 2005-12-16 | 2007-06-21 | Sompuram Seshi A | Immunohistochemistry staining controls |
| US20100047825A1 (en)* | 2004-02-24 | 2010-02-25 | Biocare Medical, Inc. | Immunoassay reagents and methods of use thereof |
| US9417243B2 (en) | 2011-05-10 | 2016-08-16 | Biocare Medical, Llc | Systems and methods for anti-PAX8 antibodies |
| US9429577B2 (en) | 2012-09-27 | 2016-08-30 | Biocare Medical, Llc | Anti-uroplakin II antibodies systems and methods |
| US9428576B2 (en) | 2013-02-28 | 2016-08-30 | Biocare Medical, Llc | Anti-p40 antibodies systems and methods |
| US9816997B2 (en) | 2013-10-03 | 2017-11-14 | Biocare Medical, Llc | Anti-SOX10 antibody systems and methods |
| US10316103B1 (en) | 2012-03-30 | 2019-06-11 | Biocare Medical, Llc | Systems and methods for anti-Uroplakin III antibodies |
| US10429390B2 (en) | 2012-12-18 | 2019-10-01 | Biocare Medical, Llc | Antibody cocktail systems and methods for classification of histologic subtypes in lung cancer |
Citations (8)
| Publication number | Priority date | Publication date | Assignee | Title |
|---|---|---|---|---|
| US4097845A (en)* | 1976-11-01 | 1978-06-27 | Rush-Presbyterian-St. Luke's Medical Center | Method of and an apparatus for automatic classification of red blood cells |
| US4725538A (en)* | 1985-10-25 | 1988-02-16 | The Beth Israel Hospital Association | Method of assaying the presence of cancer cells |
| US4741043A (en)* | 1985-11-04 | 1988-04-26 | Cell Analysis Systems, Inc. | Method of and an apparatus for image analyses of biological specimens |
| US4751188A (en)* | 1982-10-15 | 1988-06-14 | Max-Planck-Gesellschaft Zur Foerderung Der Wissenschaften E.V. | Method for the simultaneous quantitative determination of cells and reagent therefor |
| US4782015A (en)* | 1984-03-30 | 1988-11-01 | Syntex (U.S.A.) Inc. | Method for determining the presence of malignant cells |
| US4812909A (en)* | 1986-08-12 | 1989-03-14 | Hitachi, Ltd. | Cell classification apparatus capable of displaying a scene obtained by superimposing a character scene and graphic scene on a CRT |
| US4847910A (en)* | 1986-06-30 | 1989-07-11 | Hitachi, Ltd. | Automatic cell sample classifying apparatus |
| US4998284A (en)* | 1987-11-17 | 1991-03-05 | Cell Analysis Systems, Inc. | Dual color camera microscope and methodology for cell staining and analysis |
- 1993
- 1993-01-27USUS08/009,378patent/US5252487A/ennot_activeExpired - Lifetime
Patent Citations (10)
| Publication number | Priority date | Publication date | Assignee | Title |
|---|---|---|---|---|
| US4097845A (en)* | 1976-11-01 | 1978-06-27 | Rush-Presbyterian-St. Luke's Medical Center | Method of and an apparatus for automatic classification of red blood cells |
| US4751188A (en)* | 1982-10-15 | 1988-06-14 | Max-Planck-Gesellschaft Zur Foerderung Der Wissenschaften E.V. | Method for the simultaneous quantitative determination of cells and reagent therefor |
| US4782015A (en)* | 1984-03-30 | 1988-11-01 | Syntex (U.S.A.) Inc. | Method for determining the presence of malignant cells |
| US4725538A (en)* | 1985-10-25 | 1988-02-16 | The Beth Israel Hospital Association | Method of assaying the presence of cancer cells |
| US4741043A (en)* | 1985-11-04 | 1988-04-26 | Cell Analysis Systems, Inc. | Method of and an apparatus for image analyses of biological specimens |
| US4887892A (en)* | 1985-11-04 | 1989-12-19 | Cell Analysis Systems, Inc. | Method and method and apparatus for control of light intensity for image analysis |
| US4741043B1 (en)* | 1985-11-04 | 1994-08-09 | Cell Analysis Systems Inc | Method of and apparatus for image analyses of biological specimens |
| US4847910A (en)* | 1986-06-30 | 1989-07-11 | Hitachi, Ltd. | Automatic cell sample classifying apparatus |
| US4812909A (en)* | 1986-08-12 | 1989-03-14 | Hitachi, Ltd. | Cell classification apparatus capable of displaying a scene obtained by superimposing a character scene and graphic scene on a CRT |
| US4998284A (en)* | 1987-11-17 | 1991-03-05 | Cell Analysis Systems, Inc. | Dual color camera microscope and methodology for cell staining and analysis |
Cited By (103)
| Publication number | Priority date | Publication date | Assignee | Title |
|---|---|---|---|---|
| US6221607B1 (en) | 1993-10-07 | 2001-04-24 | Ikonisys Inc. | Automated fluorescence in situ hybridization detection of genetic abnormalities |
| US5352613A (en)* | 1993-10-07 | 1994-10-04 | Tafas Triantafillos P | Cytological screening method |
| US5843657A (en)* | 1994-03-01 | 1998-12-01 | The United States Of America As Represented By The Department Of Health And Human Services | Isolation of cellular material under microscopic visualization |
| US6867038B2 (en) | 1994-03-01 | 2005-03-15 | The United States Of America As Represented By The Department Of Health And Human Services | Isolation of cellular material under microscopic visualization |
| US5843644A (en)* | 1994-03-01 | 1998-12-01 | The United States Of America As Represented By The Secretary Of The Department Of Health And Human Services | Isolation of cellular material under microscopic visualization using an adhesive/extraction reagent tipped probe |
| US6569639B2 (en) | 1994-03-01 | 2003-05-27 | The United States Of America As Represented By The Department Of Health And Human Services | Isolation of cellular material under microscopic visualization |
| WO1995023960A1 (en)* | 1994-03-01 | 1995-09-08 | Government Of The United States, Represented By The Secretary Of The Department Of Health And Human Services | Isolation of cellular material under microscopic visualization |
| US6204030B1 (en) | 1994-03-01 | 2001-03-20 | The United States Of America As Represented By The Secretary Of The Department Of Health And Human Services | Isolation of cellular material under microscopic visualization |
| US6136540A (en)* | 1994-10-03 | 2000-10-24 | Ikonisys Inc. | Automated fluorescence in situ hybridization detection of genetic abnormalities |
| US6007996A (en)* | 1995-12-12 | 1999-12-28 | Applied Spectral Imaging Ltd. | In situ method of analyzing cells |
| US6101265A (en)* | 1996-08-23 | 2000-08-08 | Bacus Research Laboratories, Inc. | Method and apparatus for acquiring and reconstructing magnified specimen images from a computer-controlled microscope |
| US6674881B2 (en) | 1996-08-23 | 2004-01-06 | Bacus Laboratories, Inc. | Method and apparatus for internet, intranet, and local viewing of virtual microscope slides |
| US20040141637A1 (en)* | 1996-08-23 | 2004-07-22 | Bacus Laboratories, Inc. | Method and apparatus for internet, intranet, and local viewing of virtual microscope slides |
| US6226392B1 (en) | 1996-08-23 | 2001-05-01 | Bacus Research Laboratories, Inc. | Method and apparatus for acquiring and reconstructing magnified specimen images from a computer-controlled microscope |
| US20040136582A1 (en)* | 1996-08-23 | 2004-07-15 | Bacus Laboratories, Inc. | Apparatus for remote control of a microscope |
| US7149332B2 (en) | 1996-08-23 | 2006-12-12 | Bacus Laboratories, Inc. | Method and apparatus for internet, intranet, and local viewing of virtual microscope slides |
| US6396941B1 (en) | 1996-08-23 | 2002-05-28 | Bacus Research Laboratories, Inc. | Method and apparatus for internet, intranet, and local viewing of virtual microscope slides |
| US6674884B2 (en) | 1996-08-23 | 2004-01-06 | Bacus Laboratories, Inc. | Apparatus for remote control of a microscope |
| US7110586B2 (en) | 1996-08-23 | 2006-09-19 | Bacus Laboratories, Inc. | Apparatus for remote control of a microscope |
| US6522774B1 (en) | 1997-03-03 | 2003-02-18 | Bacus Research Laboratories, Inc. | Method and apparatus for creating a virtual microscope slide |
| US6775402B2 (en) | 1997-03-03 | 2004-08-10 | Bacus Laboratories, Inc. | Method and apparatus for creating a virtual microscope slide |
| US20040236773A1 (en)* | 1997-03-03 | 2004-11-25 | Bacus Laboratories, Inc. | Method and apparatus for creating a virtual microscope slide |
| WO1998039728A1 (en)* | 1997-03-03 | 1998-09-11 | Bacus Research Laboratories, Inc. | Method and apparatus for creating a virtual microscope slide |
| US8625920B2 (en) | 1997-03-03 | 2014-01-07 | Olympus America Inc. | Method and apparatus for creating a virtual microscope slide |
| WO1998044446A1 (en)* | 1997-03-03 | 1998-10-08 | Bacus Research Laboratories, Inc. | Method and apparatus for acquiring and reconstructing magnified specimen images from a computer-controlled microscope |
| US6404906B2 (en) | 1997-03-03 | 2002-06-11 | Bacus Research Laboratories,Inc. | Method and apparatus for acquiring and reconstructing magnified specimen images from a computer-controlled microscope |
| US7146372B2 (en) | 1997-03-03 | 2006-12-05 | Olympus America Inc. | Method and apparatus for creating a virtual microscope slide |
| DE19726226A1 (en)* | 1997-06-22 | 1998-12-24 | Zentrum Fuer Neuroinformatik G | Automatic image recognition technique for comparison of tissue structures and cells, especially in medical diagnosis |
| DE19726226C2 (en)* | 1997-06-22 | 2001-07-26 | Zentrum Fuer Neuroinformatik G | Process for the automated recognition of structures in sections through biological cells or biological tissue |
| US6555380B2 (en) | 1997-12-31 | 2003-04-29 | Pem Technologies, Inc. | Method for describing the physical distribution of an agent in a patient |
| WO2000026650A1 (en)* | 1997-12-31 | 2000-05-11 | Mako, Frederick, M. | A system for describing the physical distribution of an agent in a patient |
| US7391894B2 (en) | 1998-06-01 | 2008-06-24 | Carl Zeiss Microimaging Ais, Inc. | System and method for remote navigation of a specimen |
| US20100073472A1 (en)* | 1998-06-01 | 2010-03-25 | Carl Zeiss Microlmaging Ais, Inc. | Intergrated virtual slide and live microscope system |
| US20040008894A1 (en)* | 1998-06-01 | 2004-01-15 | Zeineh Jack A. | Compression packaged image transmission for telemicroscopy |
| US20060251309A1 (en)* | 1998-06-01 | 2006-11-09 | Trestle Acquisition Corp. | System and method for remote navigation of a specimen |
| US7224839B2 (en) | 1998-06-01 | 2007-05-29 | Clarient, Inc. | Compression packaged image transmission for telemicroscopy |
| US8036868B2 (en) | 1998-06-01 | 2011-10-11 | Carl Zeiss Microimaging Gmbh | Intergrated systems and methods of virtual or live microscope slide presentation |
| US7916916B2 (en) | 1998-06-01 | 2011-03-29 | Carl Zeiss Microimaging Gmbh | System and method for remote navigation of a specimen |
| US20100067759A1 (en)* | 1998-06-01 | 2010-03-18 | Zeineh Jack A | System and Method for Remote Navigation of a Specimen |
| US20100034437A1 (en)* | 1998-06-01 | 2010-02-11 | Zeineh Jack A | System and method for reconstructing a diagnostic trajectory |
| US7916913B2 (en) | 1998-06-01 | 2011-03-29 | Carl Zeiss Microimaging Gmbh | System and method for reconstructing a diagnostic trajectory |
| US7505616B2 (en) | 1998-06-01 | 2009-03-17 | Carl Zeiss Microimaging Ais, Inc. | System and method for reconstructing a diagnostic trajectory |
| US20060251331A1 (en)* | 1998-06-01 | 2006-11-09 | Trestle Acquisition Corp. | System and method for reconstructing a diagnostic trajectory |
| US6746848B2 (en) | 1998-10-21 | 2004-06-08 | Steven Jay Smith | Protein quantitation with cell imaging densitometry |
| US6855490B2 (en) | 1999-04-14 | 2005-02-15 | Medical Discovery Partners Llc | Method for attaching biological molecules to a glass surface |
| US7011940B1 (en) | 1999-04-14 | 2006-03-14 | Medical Discovery Partners Llc | Quality control for cytochemical assays |
| US20030166261A1 (en)* | 1999-04-14 | 2003-09-04 | Cytologix Corporation | Quality control for cytochemical assays |
| US20060127956A1 (en)* | 1999-04-14 | 2006-06-15 | Sompuram Seshi R | Quality control for cytochemical assays |
| US7538861B2 (en) | 1999-10-29 | 2009-05-26 | Cytyc Corporation | Cytological imaging system and method |
| US7411664B2 (en) | 1999-10-29 | 2008-08-12 | Cytyc Corporation | Cytological imaging system and method |
| US20040132197A1 (en)* | 1999-10-29 | 2004-07-08 | Cytyc Corporation | Cytological imaging system and method |
| US6665060B1 (en) | 1999-10-29 | 2003-12-16 | Cytyc Corporation | Cytological imaging system and method |
| US6661501B1 (en) | 1999-10-29 | 2003-12-09 | Cytyc Corporation | Cytological stain composition including verification characteristic |
| US6593102B2 (en) | 1999-10-29 | 2003-07-15 | Cytyc Corporation | Cytological stain composition |
| US6348325B1 (en) | 1999-10-29 | 2002-02-19 | Cytyc Corporation | Cytological stain composition |
| US7031507B2 (en) | 2000-12-19 | 2006-04-18 | Bacus Laboratories, Inc. | Method and apparatus for processing an image of a tissue sample microarray |
| US20030039384A1 (en)* | 2000-12-19 | 2003-02-27 | Bacus Research Laboratories, Inc. | Method and apparatus for processing an image of a tissue sample microarray |
| US20060045320A1 (en)* | 2001-01-11 | 2006-03-02 | Trestle Corporation | System and method for finding regions of interest for microscopic digital montage imaging |
| US20060029266A1 (en)* | 2001-01-11 | 2006-02-09 | Trestle Corporation | System and method for finding regions of interest for microscopic digital montage imaging |
| US20060204072A1 (en)* | 2001-01-11 | 2006-09-14 | Wetzel Arthur W | System for creating microscopic digital montage images |
| US20020090120A1 (en)* | 2001-01-11 | 2002-07-11 | Wetzel Arthur W. | System and method for finding regions of interest for microscopic digital montage imaging |
| US6798571B2 (en) | 2001-01-11 | 2004-09-28 | Interscope Technologies, Inc. | System for microscopic digital montage imaging using a pulse light illumination system |
| US7155049B2 (en) | 2001-01-11 | 2006-12-26 | Trestle Acquisition Corp. | System for creating microscopic digital montage images |
| US7212660B2 (en) | 2001-01-11 | 2007-05-01 | Clarient, Inc. | System and method for finding regions of interest for microscopic digital montage imaging |
| US20020090127A1 (en)* | 2001-01-11 | 2002-07-11 | Interscope Technologies, Inc. | System for creating microscopic digital montage images |
| US20100060729A1 (en)* | 2001-01-11 | 2010-03-11 | Wetzel Arthur W | System for creating microscopic digital montage images |
| US7876948B2 (en) | 2001-01-11 | 2011-01-25 | Carl Zeiss Microimaging Gmbh | System for creating microscopic digital montage images |
| US20100002918A1 (en)* | 2001-01-11 | 2010-01-07 | Wetzel Arthur W | System and method for finding regions of interest for microscopic digital montage imaging |
| US7869641B2 (en) | 2001-01-11 | 2011-01-11 | Carl Zeiss Microimaging Gmbh | System and method for finding regions of interest for microscopic digital montage imaging |
| US6993169B2 (en) | 2001-01-11 | 2006-01-31 | Trestle Corporation | System and method for finding regions of interest for microscopic digital montage imaging |
| US7421102B2 (en) | 2001-01-11 | 2008-09-02 | Carl Zeiss Microimaging Ais, Inc. | System and method for finding regions of interest for microscopic digital montage imaging |
| US6816606B2 (en) | 2001-02-21 | 2004-11-09 | Interscope Technologies, Inc. | Method for maintaining high-quality focus during high-throughput, microscopic digital montage imaging |
| US6956695B2 (en) | 2001-03-19 | 2005-10-18 | Ikonisys, Inc. | System and method for increasing the contrast of an image produced by an epifluorescence microscope |
| US7330309B2 (en) | 2001-03-19 | 2008-02-12 | Ikonisys, Inc. | System and method for increasing the contrast of an image produced by an epifluorescence microscope |
| US20020141050A1 (en)* | 2001-03-19 | 2002-10-03 | Triantafyllos Tafas | System and method for increasing the contrast of an image produced by an epifluorescence microscope |
| US20060056016A1 (en)* | 2001-03-19 | 2006-03-16 | Ikonisys, Inc. | System and method for increasing the contrast of an image produced by an epifluorescence microscope |
| US20040235180A1 (en)* | 2001-05-18 | 2004-11-25 | Robert Schmidt | Method for analyzing a biological sample |
| DE10124340A1 (en)* | 2001-05-18 | 2002-12-05 | Fraunhofer Ges Forschung | Method of analyzing a biological sample |
| US7257243B2 (en)* | 2001-05-18 | 2007-08-14 | Fraunhofer-Gesellschaft Zur Foerderung Der Angewandten Forschung E.V. | Method for analyzing a biological sample |
| US20040004614A1 (en)* | 2002-02-22 | 2004-01-08 | Bacus Laboratories, Inc. | Focusable virtual microscopy apparatus and method |
| US8306300B2 (en) | 2002-02-22 | 2012-11-06 | Olympus America Inc. | Focusable virtual microscopy apparatus and method |
| US20100074489A1 (en)* | 2002-02-22 | 2010-03-25 | Olympus America Inc. | Focusable virtual microscopy apparatus and method |
| US7596249B2 (en) | 2002-02-22 | 2009-09-29 | Olympus America Inc. | Focusable virtual microscopy apparatus and method |
| US7925067B2 (en) | 2002-02-22 | 2011-04-12 | Olympus America Inc. | Focusable virtual microscopy apparatus and method |
| US20110181622A1 (en)* | 2002-02-22 | 2011-07-28 | Olympus America Inc. | Focusable virtual microscopy apparatus and method |
| US20060276974A1 (en)* | 2003-07-14 | 2006-12-07 | Trestle Acquisition Corp. | System for remote viewing and display of a slide |
| US20110187846A1 (en)* | 2003-07-14 | 2011-08-04 | Carl Zeiss Microimaging Gmbh | System for remote viewing and display of a slide |
| US8349584B2 (en) | 2003-10-23 | 2013-01-08 | Georgetown University | Microarrays and their manufacture |
| US20060257908A1 (en)* | 2003-10-23 | 2006-11-16 | Georgetown University | Method for two- and three-dimensional microassembly of patterns and structures |
| US20100047825A1 (en)* | 2004-02-24 | 2010-02-25 | Biocare Medical, Inc. | Immunoassay reagents and methods of use thereof |
| US8603765B2 (en) | 2004-02-24 | 2013-12-10 | Biocare Medical, Llc. | Immunoassay reagents and methods of use thereof |
| US20060034543A1 (en)* | 2004-08-16 | 2006-02-16 | Bacus James V | Method and apparatus of mechanical stage positioning in virtual microscopy image capture |
| US7792338B2 (en) | 2004-08-16 | 2010-09-07 | Olympus America Inc. | Method and apparatus of mechanical stage positioning in virtual microscopy image capture |
| US20070141723A1 (en)* | 2005-12-16 | 2007-06-21 | Sompuram Seshi A | Immunohistochemistry staining controls |
| US9417243B2 (en) | 2011-05-10 | 2016-08-16 | Biocare Medical, Llc | Systems and methods for anti-PAX8 antibodies |
| US10316103B1 (en) | 2012-03-30 | 2019-06-11 | Biocare Medical, Llc | Systems and methods for anti-Uroplakin III antibodies |
| US9429577B2 (en) | 2012-09-27 | 2016-08-30 | Biocare Medical, Llc | Anti-uroplakin II antibodies systems and methods |
| US9823251B2 (en) | 2012-09-27 | 2017-11-21 | Biocare Medical, Llc | Anti-Uroplakin II antibodies systems and methods |
| US10429390B2 (en) | 2012-12-18 | 2019-10-01 | Biocare Medical, Llc | Antibody cocktail systems and methods for classification of histologic subtypes in lung cancer |
| US9428576B2 (en) | 2013-02-28 | 2016-08-30 | Biocare Medical, Llc | Anti-p40 antibodies systems and methods |
| US9708395B2 (en) | 2013-02-28 | 2017-07-18 | Biocare Medical, Llc | Anti-p40 antibodies systems and methods |
| US9816997B2 (en) | 2013-10-03 | 2017-11-14 | Biocare Medical, Llc | Anti-SOX10 antibody systems and methods |
| US10295542B2 (en) | 2013-10-03 | 2019-05-21 | Biocare Medical, Llc | Systems and methods for anti-SOX10 antibodies |
Similar Documents
| Publication | Publication Date | Title |
|---|---|---|
| US5252487A (en) | Method and apparatus for determining the amount of oncogene protein product in a cell sample | |
| CA2045614C (en) | Method and apparatus for determining a proliferation index of a cell sample | |
| US5086476A (en) | Method and apparatus for determining a proliferation index of a cell sample | |
| US5008185A (en) | Methods and apparatus for the quantitation of nuclear proteins | |
| US5202931A (en) | Methods and apparatus for the quantitation of nuclear protein | |
| US4741043A (en) | Method of and an apparatus for image analyses of biological specimens | |
| Bacus et al. | The evaluation of estrogen receptor in primary breast carcinoma by computer-assisted image analysis | |
| US5134662A (en) | Dual color camera microscope and methodology for cell staining and analysis | |
| US4998284A (en) | Dual color camera microscope and methodology for cell staining and analysis | |
| EP0317139B1 (en) | Methods and apparatus for cell analysis | |
| US5473706A (en) | Method and apparatus for automated assay of biological specimens | |
| AU2010241288B2 (en) | Method and quantification assay for determining c-kit/SCF/pAKT status | |
| US5485527A (en) | Apparatus and method for analyses of biological specimens | |
| Parry et al. | Cancer detection by quantitative fluorescence image analysis | |
| JP2002530676A (en) | Cell in situ analysis method | |
| JP2002296274A (en) | Method of detecting tumor cell and precursor thereof in uterocervical smear | |
| JP2002521682A5 (en) | ||
| JP2002521682A (en) | Cell in situ analysis method | |
| Zhou et al. | A multiple wavelength algorithm in color image analysis and its applications in stain decomposition in microscopy images | |
| Woltmann et al. | Objective quantitative analysis of eosinophils and bronchial epithelial cells in induced sputum by laser scanning cytometry | |
| Pujol et al. | Hypodiploidy, Ki-67 growth fraction and prognosis of surgically resected lung cancers | |
| JPH06229723A (en) | Method and equipment for measuring tissue intercept thickness | |
| King et al. | Analytic studies of foam cells from breast cancer precursors | |
| Sklarew et al. | Quantitation of the immunocytochemical assay for estrogen receptor protein (ER-ICA) in human breast cancer by television imaging. | |
| CN102369473B (en) | Method for preparing a processed virtual analysis plate |
Legal Events
| Date | Code | Title | Description |
|---|---|---|---|
| STCF | Information on status: patent grant | Free format text:PATENTED CASE | |
| CC | Certificate of correction | ||
| FPAY | Fee payment | Year of fee payment:4 | |
| FEPP | Fee payment procedure | Free format text:PAYOR NUMBER ASSIGNED (ORIGINAL EVENT CODE: ASPN); ENTITY STATUS OF PATENT OWNER: SMALL ENTITY | |
| AS | Assignment | Owner name:MMC/GATX PARTNERSHIP NO. 1, CALIFORNIA Free format text:SECURITY AGREEMENT;ASSIGNOR:CELL ANALYSIS SYSTEMS, INC.;REEL/FRAME:010526/0412 Effective date:20000131 | |
| AS | Assignment | Owner name:SILICON VALLEY BANK, CALIFORNIA Free format text:SECURITY AGREEMENT;ASSIGNOR:CELL ANALYSIS SYSTEMS, INC.;REEL/FRAME:010719/0903 Effective date:20000131 | |
| AS | Assignment | Owner name:SILICON VALLEY BANK, GEORGIA Free format text:SECURITY INTEREST;ASSIGNOR:CELL ANALYSIS SYSTEMS, INC.;REEL/FRAME:011089/0561 Effective date:20000131 | |
| FPAY | Fee payment | Year of fee payment:8 | |
| AS | Assignment | Owner name:CELL ANALYSIS SYSTEMS, INC., NORTH CAROLINA Free format text:TERMINATION OF SECURITY INTEREST;ASSIGNORS:MMC/GATX PARTNERSHIP NO. I;TRANSAMERICA BUSINESS CREDIT CORPORATION;REEL/FRAME:014601/0512 Effective date:20030404 | |
| REMI | Maintenance fee reminder mailed | ||
| FPAY | Fee payment | Year of fee payment:12 | |
| SULP | Surcharge for late payment | Year of fee payment:11 | |
| AS | Assignment | Owner name:CELL ANALYSIS SYSTEMS, INC., NORTH CAROLINA Free format text:RELEASE OF SECURITY AGREEMENT;ASSIGNOR:SILICON VALLEY BANK;REEL/FRAME:018224/0284 Effective date:20060829 Owner name:CELL ANALYSIS SYSTEMS, INC., NORTH CAROLINA Free format text:RELEASE OF SECURITY AGREEMENT;ASSIGNOR:SILICON VALLEY BANK;REEL/FRAME:018224/0289 Effective date:20060830 |