US5221834A - Method for providing feedback correction for an imaging device - Google Patents
Method for providing feedback correction for an imaging deviceDownload PDFInfo
- Publication number
- US5221834A US5221834AUS07/723,141US72314191AUS5221834AUS 5221834 AUS5221834 AUS 5221834AUS 72314191 AUS72314191 AUS 72314191AUS 5221834 AUS5221834 AUS 5221834A
- Authority
- US
- United States
- Prior art keywords
- local
- imaging device
- performance
- transfer function
- optical
- Prior art date
- Legal status (The legal status is an assumption and is not a legal conclusion. Google has not performed a legal analysis and makes no representation as to the accuracy of the status listed.)
- Expired - Lifetime
Links
- 238000003384imaging methodMethods0.000titleclaimsabstractdescription73
- 238000000034methodMethods0.000titleclaimsabstractdescription62
- 238000012937correctionMethods0.000titleclaimsabstractdescription32
- 230000003287optical effectEffects0.000claimsabstractdescription55
- 210000001747pupilAnatomy0.000claimsabstractdescription50
- 238000005070samplingMethods0.000claimsabstractdescription31
- 238000012546transferMethods0.000claimsabstractdescription31
- 230000005855radiationEffects0.000claimsabstractdescription17
- 230000009471actionEffects0.000claimsabstractdescription11
- 238000004519manufacturing processMethods0.000claimsdescription18
- 238000005498polishingMethods0.000claimsdescription3
- 230000008901benefitEffects0.000abstractdescription6
- 230000007547defectEffects0.000abstractdescription6
- 238000012986modificationMethods0.000abstractdescription3
- 230000004048modificationEffects0.000abstractdescription3
- 230000006870functionEffects0.000description40
- 230000004075alterationEffects0.000description17
- 230000006872improvementEffects0.000description16
- 230000008569processEffects0.000description13
- 238000012360testing methodMethods0.000description13
- 230000000875corresponding effectEffects0.000description11
- 238000013459approachMethods0.000description6
- 238000000926separation methodMethods0.000description6
- 239000002131composite materialSubstances0.000description5
- 230000003044adaptive effectEffects0.000description4
- 238000011156evaluationMethods0.000description4
- 238000004886process controlMethods0.000description4
- 241000894007speciesSpecies0.000description4
- 238000004458analytical methodMethods0.000description3
- 230000000694effectsEffects0.000description3
- 238000012913prioritisationMethods0.000description3
- 238000002834transmittanceMethods0.000description3
- 230000015572biosynthetic processEffects0.000description2
- 238000004364calculation methodMethods0.000description2
- 230000001427coherent effectEffects0.000description2
- 238000009795derivationMethods0.000description2
- 238000006073displacement reactionMethods0.000description2
- 239000000284extractSubstances0.000description2
- 230000010354integrationEffects0.000description2
- 238000005457optimizationMethods0.000description2
- 239000002994raw materialSubstances0.000description2
- 230000009467reductionEffects0.000description2
- 238000003786synthesis reactionMethods0.000description2
- 206010010071ComaDiseases0.000description1
- 235000004035Cryptotaenia japonicaNutrition0.000description1
- 101150108015STR6 geneProteins0.000description1
- 101100386054Saccharomyces cerevisiae (strain ATCC 204508 / S288c) CYS3 geneProteins0.000description1
- 102000007641Trefoil FactorsHuman genes0.000description1
- 235000015724Trifolium pratenseNutrition0.000description1
- 238000004422calculation algorithmMethods0.000description1
- 230000015556catabolic processEffects0.000description1
- 230000003750conditioning effectEffects0.000description1
- 238000007796conventional methodMethods0.000description1
- 230000002596correlated effectEffects0.000description1
- 230000001186cumulative effectEffects0.000description1
- 238000006731degradation reactionMethods0.000description1
- 239000001064degraderSubstances0.000description1
- 230000001419dependent effectEffects0.000description1
- 238000011161developmentMethods0.000description1
- 238000010586diagramMethods0.000description1
- 238000009826distributionMethods0.000description1
- 238000005315distribution functionMethods0.000description1
- 230000008030eliminationEffects0.000description1
- 238000003379elimination reactionMethods0.000description1
- 238000007519figuringMethods0.000description1
- 238000001914filtrationMethods0.000description1
- 238000009499grossingMethods0.000description1
- 238000001746injection mouldingMethods0.000description1
- 238000005305interferometryMethods0.000description1
- 238000013507mappingMethods0.000description1
- 238000012634optical imagingMethods0.000description1
- 230000003864performance functionEffects0.000description1
- 230000010363phase shiftEffects0.000description1
- 238000007517polishing processMethods0.000description1
- 238000012545processingMethods0.000description1
- 238000001303quality assessment methodMethods0.000description1
- 230000004044responseEffects0.000description1
- 230000035945sensitivityEffects0.000description1
- 239000007787solidSubstances0.000description1
- 238000001228spectrumMethods0.000description1
- 101150035983str1 geneProteins0.000description1
- 238000006467substitution reactionMethods0.000description1
- 238000012956testing procedureMethods0.000description1
- 230000009466transformationEffects0.000description1
- 238000013519translationMethods0.000description1
- 238000012795verificationMethods0.000description1
Images


Classifications
- G—PHYSICS
- G01—MEASURING; TESTING
- G01M—TESTING STATIC OR DYNAMIC BALANCE OF MACHINES OR STRUCTURES; TESTING OF STRUCTURES OR APPARATUS, NOT OTHERWISE PROVIDED FOR
- G01M11/00—Testing of optical apparatus; Testing structures by optical methods not otherwise provided for
- G01M11/02—Testing optical properties
- G01M11/0242—Testing optical properties by measuring geometrical properties or aberrations
- G01M11/0257—Testing optical properties by measuring geometrical properties or aberrations by analyzing the image formed by the object to be tested
- G01M11/0264—Testing optical properties by measuring geometrical properties or aberrations by analyzing the image formed by the object to be tested by using targets or reference patterns
- G—PHYSICS
- G01—MEASURING; TESTING
- G01M—TESTING STATIC OR DYNAMIC BALANCE OF MACHINES OR STRUCTURES; TESTING OF STRUCTURES OR APPARATUS, NOT OTHERWISE PROVIDED FOR
- G01M11/00—Testing of optical apparatus; Testing structures by optical methods not otherwise provided for
- G01M11/02—Testing optical properties
- G01M11/0285—Testing optical properties by measuring material or chromatic transmission properties
- G—PHYSICS
- G02—OPTICS
- G02B—OPTICAL ELEMENTS, SYSTEMS OR APPARATUS
- G02B26/00—Optical devices or arrangements for the control of light using movable or deformable optical elements
- G02B26/06—Optical devices or arrangements for the control of light using movable or deformable optical elements for controlling the phase of light
Definitions
- This inventionrelates to a method for assessing the optical quality of an imaging device, and in particular, for providing feedback correction to the imaging device based on this assessment.
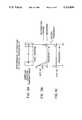
- FIGS. 1A-Dshow an optical system 10 and waveforms that may be used to explain the concept of assessing the optical quality of an imaging device.
- the FIG. 1A optical system 10includes a source of radiation comprising a point source 12 that can output a radiation beam 14; and, an imaging device comprising a conventional lens 16.
- the lens 16can image the radiation beam to generate an exit pupil imaged beam 18.
- the FIG. 1A imaging devicecomprising the lens 16 is ideal.
- the point source 12can output a radiation beam comprising divergent spherical waves, which divergent spherical waves, in turn, may be imaged by the ideal lens 16 to generate convergent spherical waves.
- FIG. 1A lens 16Since the FIG. 1A lens 16 is assumed to be ideal, it does not introduce wavefront errors, which would otherwise deform the sphericity of the convergent waves. Therefore, a FIG. 1B graph of optical path difference (OPD) error, from assumed perfect sphericity, as a function of exit pupil position (p), is a straight line congruent with the abscissa, i.e., a constant error of zero.
- OPDoptical path difference
- a lens 20may have inherent defects, such as a trefoil or coma, so that in the presence of the point-source, the lens 20 generates at its exit pupil a wavefront 22 that departs from ideal sphericity.
- OPDoptical path difference
- D graphs of PD errormay be sensed, i.e., generated, by conventional techniques, including Michelson, e.g., Twyman-Green interferometry, or Foucault knife-edge testing.
- the FIG. 1B, D graphs of OPD errorare one measure of the optical quality of the imaging device.
- the graphsmay be generated for the following purpose. Namely, it has been historically understood that:
- RMSroot mean square
- the problemstems from an inherent assumption, common to all of the cited theoretical mathematical interrogation techniques, which assess the optical quality of the imaging device on the basis of a global parameter, namely, the global OPD error function.
- the cited mathematical techniquesfor example, the RMS approach, derive a wavefront error statistic from a function that has been initially developed over an entire (hence, global) imaging device exit pupil.
- an indefinite number of different OPD error functionscan have an identical RMS value, yet, at the same time, have a different impact on imaging performance, so that there may be no direct correlation between minimizing a particular computed RMS value, on the one hand, and providing, on the other hand, a corresponding maximization of global imaging performance through a reduction of local OPD error.
- the imperfect correlationcan reduce the imaging performance when the local OPD errors are corrected on the basis of RMS minimization.
- the optical transfer functionis a global spatial frequency-dependent complex quantity, whose modulus is a modulation transfer function (MTF), and whose phase is a phase transfer function (PTF).
- MTFmodulation transfer function
- PTFphase transfer function
- the MTFis a measure of a reduction in contrast from object to image, for each spatial frequency passed by an imaging device.
- the PTFrepresents commensurate relative phase shift, for each spatial frequency passed by an imaging device.
- the optical transfer functionmay be expressed by an equation (1):
- optical quality function(OQF)
- Equation (2)The related global optical quality function (OQF) may be expressed by an equation (2): ##EQU1##
- the global OTF and the OQFhave the following advantage, as compared to the above elaborated optical path difference (OPD) error technique. Namely, the global OTF and OQF are directly correlated to global imaging performance of an imaging device with arbitrary aberration distributions. Accordingly, the OTF and OQF have an advantage in that they can provide the immediate parameters of concern to customers of imaging devices and systems, since the customers typically state a desired imaging device global imaging performance specification, expressed directly as a function of the OTF and OQF.
- OPDoptical path difference
- OTF and OQFmay be offset, however, when we point out that these global performance functions do not supply information for a corrective process in terms of required local area modifications.
- OTF and OQF techniquemuch like the optical path difference (OPD) error criterion, may be limited in usefulness, because there is no way to map these inherently global parameters to performance loss due to discrete parts of an exit pupil.
- OPDoptical path difference
- novel methodfor assessing the imaging quality or performance of an optical imaging device.
- the novel methodhas an important advantage of retaining all the virtues of the mathematical approach subsumed by the global optical transfer and quality functions, while entirely overcoming their heretofore offsetting limitations, in terms of exclusivity vis-a-vis local mapping capabilities.
- the novel methodhas additional advantages, to be specified below, in terms of prioritization capabilities, and performance tailored modulation transfer function (MTF) specifications.
- the novel methodis suitable for use in an optical system comprising a source of radiation that can output a radiation beam; and, an imaging device to be tested, which imaging device can image the radiation beam to produce an imaged beam.
- the steps of the novel methodcomprise:
- OTFoptical transfer function
- a source of radiationthat can output a radiation beam
- an imaging deviceto be corrected and which can image the radiation beam to produce an imaged beam
- LOTFLocal Optical Transfer Function
- LMTFLocal Modulation Transfer Function
- LPTFLocal Phase Transfer Function
- LOQFlocal optical quality factor
- LPTFlocal phase transfer function
- FIGS. 1A-1Dshow an optical system and waveforms that may be used to explain the concept of assessing the optical quality of an imaging device
- FIGS. 2A and 2Bshow schematics of a sampling step of the method of the present invention comprising object to image information transfer;
- FIGS. 3A-3Cshow a basic LWPA sampling aperture transmittance function in 1-D form, generated in accordance with the steps of the present invention
- FIG. 4demonstrates a full aperture performance synthesis process for a unique spatial frequency
- FIGS. 5A and 5Bshow a (shaded) wavefront error contour map and corresponding profile, respectively, generated in accordance with experimental data
- FIG. 6shows a schematic of an illustrative LWPA sampling geometry
- FIG. 7shows a schematic to explain a nexus between local to global performance estimation
- FIG. 8is a generic illustration of an optical assembly comprising correction feedback developed in accordance with a method of the present invention.
- FIG. 9shows a first species of the FIG. 8 generic correction feedback assembly comprising an active control system
- FIG. 10shows a second species of the FIG. 9 correction feedback assembly comprising an active control system in operative configuration
- FIG. 11comprises a low volume manufacturing control flowchart utilizing a method of the present invention
- FIG. 12shows a performance map vs. wavefront error map, derived from an example of the FIG. 11 flowchart process
- FIG. 13shows a hardware realization of the FIG. 11 flowchart
- FIG. 14comprises a high volume manufacturing control flowchart utilizing a method of the present invention
- FIG. 15shows a hardware realization of the FIG. 14 flowchart
- FIG. 16shows performance maps derived in accordance with the FIG. 15 hardware system.
- the first aspect of the novel method of the present inventioncan provide an assessment of the optical quality or performance of an imaging device. This assessment can be done in real time or, alternatively, through software designed to evaluate wavefront error maps from simulated models, or from the output of wavefront sensors.
- the imaging device to be testedcan comprise a conventional lens, or a mirror, or a diffraction grating, or a combination of these elements.
- the imaging devicecan comprise an unconventional element, for example, a synthetic aperture comprising two or more monolithic apertures.
- the radiation source that inputs to the imaging devicecan comprise an extended source or a point source, and can be coherent, incoherent, or partially coherent.
- the novel methodcomprises analysis of local wavefront performance, as developed over an exit pupil of an imaging device, as evaluated by the local optical transfer function (OTF). For this reason, the novel method may also be referenced as a Localized Wavefront Performance Analysis (LWPA) system.
- LWPALocalized Wavefront Performance Analysis
- the local wavefront errors that are included in LWPA spatial frequency selective sampling aperturesare used in assessing performance of an imaging device.
- a performance map of a full system aperturemy be generated when the apertures are used to sample the wavefront at an adequate number of local areas (i.e., in satisfaction of the classical and well known Nyquist sampling rate function).
- the wavefront error at each sample positioncan therefore now be prioritized, and corrected on a basis of its impact on overall imaging performance. Further, any remaining error residuals are now optimized, for minimal impact on imaging device performance.
- a LWPA system prioritization sequenceevaluates an imaging device quality on a basis of a local optical quality function (LOQF) that is specific to discrete regions of an exit pupil defined by an imaging device.
- LOQFlocal optical quality function
- This informationmay be used to generate a corresponding LOQF map over the entire exit pupil.
- An optician or polisher, or adaptive optical control systemcan therefore now use this LOQF map, to maximize imaging performance, by correcting those localized wavefront error regions with the lowest local OQF values.
- the net result of this action of the novel methodis to generate a substantially monotonic-type convergence to an acceptable performance, at a given spatial frequency, thus securing a performance tailored local modulation transfer function (LMTF).
- LMTFperformance tailored local modulation transfer function
- the method of the present inventionis based on a first principle that an arbitrary object can be constructed from a knowledge of its Fourier spatial components, and on a second principle that a spatial filter, utilizing two dilute apertures, can be used to extract selected spatial frequency information from the object.
- the two principlesprovide an understanding for the first step of the first aspect of the present invention, namely, sampling an imaged beam (generated by an imaging device under test), by way of an opaque screen defining at least two apertures.
- the at least two aperturesmay each comprise a geometric shape defining a rectangle or a star, but preferably comprise a circle or a square.
- the aperturescan comprise areas of appreciable extent, for example, an appreciable percentage of the global exit pupil, or, in a limiting case, may comprise a pinhole dimensionality. (See Reference 3).
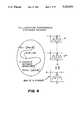
- FIGS. 2 through 7are provided as heuristics to demonstrate preferred aspects of the steps of the method of the present invention in its first aspect.
- FIG. 2Asymbolically shows an imaging process of the present invention, in terms of the Fourier transform theory, and with a one-dimensional object for an input signal.
- the two headed arrowindicates a Fourier transformation from the space domain (X) to the frequency domain (f).
- the spectrum of this FIG. 2A objectis schematically shown as the well-known sinc function.
- a specification frequency (f*)may be selected for performance evaluation in FIG. 2B, where a Young's two-slit aperture is shown sampling the image quality at a pupil position Xl.
- FIG. 2 exampleindicates how the LWPA apertures extract information on lens quality at critical (specification) spatial frequencies.
- the transform shown by the double headed arrowis, in general, complex, which indicates that input signal fringe contrast (fringe modulation depth) and phase contribute to the image quality.
- Local area Xl's contributionis shown as the small black rectangle at the LOQF function at frequency f*.
- Multiple fringe patternsare obtained from the several pupil regions that are sampled. When they are superimposed, the composite fringe obtained from their superposition, is indicative of global performance at frequency f*.
- the two-aperture sampling methodcan be considered as comprising a narrow-band filter that extracts from an input wavefront those components that are of maximal importance for object information, transmitted at a specific spatial frequency.
- the LWPA systemcombines this operation of frequency selection with the operation of performance assessment. This may be accomplished by obtaining the OTF of the system defined by the two-aperture pupil and the local wavefront errors that are circumscribed therein.
- FIGS. 3A-Cschematically present this critical concept. (Reference 3).
- FIG. 3Apresents the basic LWPA sampling aperture transmittance function in a one-dimensional form.
- the distance between the two sample apertures (D)determines the filtered spatial frequency band of interest, in this case denoted f*.
- the local OTF resultmay be obtained by the autocorrelation of this complex pupil function, and gives the LMTF (FIG. 3B) and LPTF (FIG. 3C) components.
- the dashed LMTF curverepresents the diffraction limited case of no aberrations, the solid curve the aberration perturbed case.
- the diffraction limited LMTFis always 0.5 at frequency f*.
- the ratio of (LMTF (f*)-perturbed)/(LMTF(f*)-diffraction limited)is roughly 0.50 in the above example.
- This valuerepresents the LOQF(f*) at the sampled pupil position. A correction at this position can increase the elemental performance at spatial frequency f* by nearly a factor of two.
- the local OTF obtained from each sample locationgives that region's differential contribution to full aperture imaging performance for an object spatial frequency that is directly related to the separation distance between the two apertures. This concept is schematically shown in FIG. 4.
- the two aperturesAs shown in FIG. 4, the two apertures, separated by a distance D, give Young's fringes at the diffraction plane, for each sample position (1 through N).
- Local image quality lossis indicated by fringe contrast degradation (LMTF) due to local aberrations, or from phasing (LPTF) errors as indicated by translation of a main lobe from a reference position (zero (0) in figures).
- LMTFfringe contrast degradation
- LPTFphasing
- Such local aberrationscan tend to reduce the composite fringe generated from the superposition of the N sample patterns of unit normalized amplitude.
- the resulting composite fringeis indicative of global quality.
- FIG. 4represents a schematic version of the situation for a perfect full aperture optic.
- the fringes from the N sample areaswill have maximal amplitudes and be perfectly phased (exact alignment of all central lobes). This will result in a composite unattenuated fringe of maximal contrast of N.
- each patterncan be evaluated separately for its affect on full aperture performance.
- the Young's fringesform a linear system which allows superposition--the total effect due to the N local fringes is given by their superposition. This yields the desired connection between the local and full aperture performance.
- LWPAuses a somewhat modified form of Young's interferometer, in that the sample apertures may be of appreciable extent. This expands the sensitivity of the system to any higher-order (2nd degree or higher) aberrations that are contained in the sample region, because they are nonlinear in nature, and thus have a strong impact on the local fringe pattern quality and resulting local OQF.
- a Fourier transform of the sample pupilgives the above fringe pattern in the far-field plane.
- a second transformgives the local OQF, the primary output.
- the local OQF valuesare computed directly from the autocorrelation of the wavefront errors circumscribed in the two sampling apertures.
- the LWPA conceptcan be connected with the Young's aperture sampling of a wavefront and its transfer to the diffraction (image) plane.
- the performance at different pupil regionscan be obtained with a generalized "Young's interferometer" sampling process, in that finite area sampling apertures are used.
- An additional generalizationmay entail the use of more than two apertures, in order to obtain results pertinent to several spatial frequencies simultaneously (multi-band spatial frequency filtering). (See Reference 5).
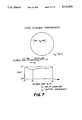
- FIGS. 5A, BA contour (shaded) wavefront error map is presented in FIGS. 5A, B.
- the wavefront error contour mapis shown in FIG. 5A, and the corresponding profile in FIG. 5B.
- the local performance contribution for the example aberration(pure Zernike spherical) is well known and thus allows assessment of LWPA accuracy.
- a strip formatwas selected for ease of presentation, but the results are directly extendable to the complete pupil.
- the corresponding LWPA sampling geometryis schematically shown in FIG. 6.
- Sample aperture separation distance Dis about 14% of input aperture width--commensurate with 10 c/mm information.
- Table I valuesare ordered in the form of a 10 c/mm imaging performance map (OQF). The results are shown at 13 equally spaced points over this aperture. Table I parameters include:
- POSthe position of the local error in the aperture-position is along the X-direction; left-to-right with position 1 leftmost (see FIG. 6);
- LMTF(10)local MTF at 10 c/mm;
- LPTF(10)local phase error at 10 c/mm in 10 degrees
- LOQF(10)local optical quality factor at 10 c/mm-ratio of LMTF(10) to the corresponding diffraction limited LMTF.
- D1MTFThe difference between the diffraction limited MTF and the perturbed input MTF.
- D2MTFThe difference between the corrected and input MTF.
- %-IMPThe percent improvement calculated as the ratio D2MTF/D1MTF.
- the tableindicates the performance improvement for a band of spatial frequencies given LWPA dictated correction at positions 1 and 13, regions contributing maximal performance loss for 10 c/mm information transfer.
- the 56.3% improvement in the 10 c/mm global OQFis as expected.
- the interesting aspect of the dataconcerns a non-uniform enhancement associated with the data at frequencies of 20 and 30 c/mm.
- the fact that 20 and 30 c/mm performance is also enhancedis not unexpected, given the high spatial correlation associated with the input aberration function.
- the relative differential in the size of the improvementssuggests that performance improvement at collateral frequencies will not be uniform.
- the non-randomness of arbitrary aberrations, particularly the highly deterministic form for the example test casesupports the differential shown in the Table III data.
- the global OQFis the average vector sum (AVS) of the local OQF values; arrow denotes vector in diagram.
- AVSaverage vector sum
- This formulaties the full aperture performance, denoted the global OQF, to the local OQF values represented by the m OQF(f*)'s under the summation symbol.
- the OQFis a complex number (treated in vector form) which is comprised of modulus and phase parts that are indicative of performance.
- the global OQF at a given spatial frequencyis the phasor or vector average of the m local OQF values.
- Table IVpresents the AVS calculation data for the Table II performance map.
- Table IV entriespresent the vector summation components for each position in the aperture with the following nomenclature:
- OQF(10)local optical quality factor at 10 c/mm-ratio for MTF(10) to its corresponding diffraction limited MTF;
- C(PTF)Cosine of PTF, local cosine vector component
- OQF X C(PTF)the product of the local OQF and the cosine of the PTF.
- the C(PTF) and the S(PTF)are the vector cosine and sine components (real and imaginary axis projections) associated with the local OQF's.
- the AVS of the OQf'sis a good estimator of the corresponding global result.
- the global OQFis then computed at the Root-Sum-Square (RSS) of the two sums.
- the S(PTF) factorssum to zero and it is not necessary to compute OQF X S(PTF).
- OQF X C(PTF) summation totalis 12.5786 and the estimated global OQF is calculated directly as 12.5786/13 or 0.9676. This compares with a conventional global result of 0.9635 as computed from the autocorrelation of the full aperture complex pupil function--well within our computational accuracy.
- the performance map of Table Iis a satisfactory indicator of the performance contribution from local pupil regions in that results are in agreement with the local wavefront error contributions expected from the test case deterministic aberration.
- the maximum error slope differential for the input spherical aberrationis located in the regions associated with positions 1 and 13 for 10 c/mm information transfer--maximal loss would be expected in these regions.
- the maximal slope errorcorrelates with the maximum transverse ray error at the image plane.
- the first aspect of the present inventionnamely, its capability for providing a localized imaging quality assessment of an imaging device, has now been disclosed, and we accordingly turn our attention to particulars of the second aspect of the present invention.
- a "controlled action" to the imaging devicemay be realized in accordance with a generic FIG. 8 construct, wherein:
- Numeral 24input optic (input wavefront conditioning such as autocollimation, null compensation, etc.;
- LWPA filtershown as a spatial light modulator (SLM);
- D maxis the maximum extent of the pupil
- f maxis a test optic cut-off frequency
- FIG. 8 constructis generic, since it comprises a feedback correction capability for an operational adaptive optical system, or a low volume manufacturing control system, or a high volume manufacturing control system. Particulars on all three systems are disclosed, below.
- the LWPA systemcan generate a performance map, directly, with hardware (such as the noted SLM), or by computation from the recorded wavefront errors.
- Those regions with the lowest LOQFare the worst imaging degraders, shown at pupil position X* of this figure inset.
- Verificationmay be seen in the conventional global OQF, at FIG. 8 inset 40.
- the greatest global improvementcan indeed be effected for frequency f*, via correction of the pupil error at position X*.
- Correction informationmay be obtained from the LPTF part of the LOQF, which indicates the differential error between the region of the wavefront error circumscribed by the sampling apertures.
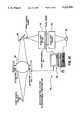
- FIG. 9shows a first species of the FIG. 8 generic correction feedback construct, comprising an active control system 42.
- the active control system 42includes conventional components connected as shown:
- test optic 46
- the image quality of the test optic 42can be directly improved on the basis of local performance assessment.
- the number of force and/or displacement actuators 44can, via the method of the present invention, be optimally determined, and optimally positioned, within the active pupil element. This leads to greater efficiency in a correction process, since it derives from local, rather than global, performance parameters.
- the force actuators 44can apply a required or determined force to the test optic 46, as computed by the computer 58.
- the computer 58may be conventionally programmed to develop, in accordance with input parameters from the performance map, an influence function, of the type disclosed, for example, in U.S. Pat. Nos. 4,875,765 and 4,993,823, and incorporated by reference herein.
- FIG. 10shows a second species of the FIG. 9 active control system 42.
- the componentsare the same as those listed for the FIG. 9 system 42, but they are now slightly re-structured so that the method of the present invention can be used in a wavefront sensor configuration.
- the point source (object) 50is now located on the other side of the spatial light monitor 54.
- the pupilis imaged by the auxiliary optics 52 onto the spatial light modulator 54.
- the spatial light modulator 54may be programmed to step through a series of pupil position locations by scanning the sample apertures over the imaged pupil, as schematically shown in FIG. 4.
- the lightis re-imaged onto the CCD detector 56, which is conjugate to the original image surface.
- the signal from the detectoris Fourier transformed to give the LMTF, from which the LOQF is calculated. This results in a performance map of LOQF versus pupil position, which the computer 58 uses to determine the local corrections necessary to maintain acceptable imaging quality. This is done using a conventional optimization algorithm.
- the systemcan then evaluate the effects of the changes in real-time to insure that the image quality is maintained.
- LWPALow-power photoelectron spectroscopy
- the LWPA methodcan also be used to tailor the response of an adaptive system to user needs. For example, if it is required that the system performance be optimized at specific frequencies (typical of most performance specifications), LWPA can be used to determine those local features which will give the most efficient convergence to acceptable imaging quality. (In contrast, conventional methodology involves minimizing the RMS of the wavefront error--a function of the total frequency bandpass of the lens.)
- High volume process controlinvolves an entire manufacturing process (see FIG. 14), which entails a rapid sequential production of optical components and systems. In this process, individual components and systems are not reworked until they meet specification. This is in contrast to low volume production (see FIG. 11) where components and systems are processed until they meet specification.
- LWPAcan be used to determine localized optical performance and prioritize a correction sequence for an active system, it can be used in the manufacturing of optical components.
- the correctionsmay be provided by polishing or figuring tools that can reduce "high spots" on an optical surface. (Currently, in contrast, an optical component is polished until it reaches a specified RMS wavefront error.)
- LWPAprovides the basis for an intelligent manufacturing system dedicated to the production of optical components.
- the resultis a method 60 (see FIG. 11) where raw materials are input and finished products are output. In essence, this removes the art from the fabrication of optical components, and leads to an improved competitiveness in today's markets.
- An automated proceduretypically starts with a set of LWPA compatible requirements on the components to be manufactured.
- the raw materialsmay be input into the process where they may be first rough ground to an appropriate figure. Once the figure is ground, the component may be tested, and performance maps may be generated, using LWPA at specific frequencies. Each of the frequency based performance maps may be properly weighted and summed, to give a composite map that may be used to correct those local regions which yield the greatest improvement in imaging quality.
- FIG. 12shows the potentially large differences between performance and wavefront error.
- the performance mapshows that the errors in the pupil center are not significant with respect to the imaging performance at the spatial frequency, f*.
- the wavefront error mapdictates a need for correction in this region. If the optic were processed according to this criteria, resources would be wasted.
- FIG. 13provides an example of a polishing process 62 using LWPA.
- An optical componentmay be polished based on inputs from the process control computer. It may be then tested and the results evaluated using LWPA.
- the process control computeruses the lowest LOQF values to determine the local areas where correction will give the largest improvement in performance.
- the componentmay be returned to testing, where another wavefront error map may be generated, and a LWPA analysis performed.
- the LWPA systemcan also monitor and control the high volume manufacture of precision optical components and systems, and is shown schematically in a FIG. 14 high volume process control flowchart 64.
- FIG. 15shows an example of the FIG. 14 flowchart process, using a standard high volume manufacturing process 66 such as injection molding. As the components and/or systems are manufactured, they may be tested and evaluated at specific frequencies using LWPA. The results may be combined to form performance maps as shown in FIG. 16.
Landscapes
- Physics & Mathematics (AREA)
- General Physics & Mathematics (AREA)
- Chemical & Material Sciences (AREA)
- Analytical Chemistry (AREA)
- Geometry (AREA)
- Optics & Photonics (AREA)
- Testing Of Optical Devices Or Fibers (AREA)
Abstract
Description
OTF(freq.)=MTF(freq.). e.sup.j PTF (freq.). ( 1)
LOTF(freq.)=LMTF(freq.)×e.sup.(j)LPTF (freq.)
TABLE I ______________________________________ Performance Map (10 c/mm) POS LMTF(10) LPTF(10) LOQF(10) ______________________________________ 1 0.4883 +15.5 0.9766 2 0.4959 -4.8 0.9918 3 0.4992 -15.4 0.9984 4 0.5000 -18.3 1.000 5 0.4995 -15.4 0.9990 6 0.4988 -8.7 0.9976 7 0.4985 0.0 0.9970 8 0.4988 +8.7 0.9976 9 0.4995 +15.5 0.9990 10 0.5000 +18.3 1.000 11 0.4992 +15.4 0.9984 12 0.4959 +4.8 0.9918 13 0.4883 -15.5 0.9766 ______________________________________
TABLE II ______________________________________ Results at Three Position Sets (10 c/mm) (Input MTF 0.8405) Positions Corrected: 1 & 13 2 & 12 4 & 10 ______________________________________ MTF-after corr: 0.8584 0.8429 0.8394 Improve. Ratio: 1.022 1.015 1.000 ______________________________________
TABLE III ______________________________________ Filter Results vs. Fequency (10 c/mm) Frequency c/mm D1MTF D2MTF %-IMP ______________________________________ 10 0.0318 0.0179 56.3 20 0.0563 0.0088 15.6 30 0.0548 0.0263 47.9 ______________________________________
TABLE IV ______________________________________ LWPA VECTOR SUM ESTIMATE OF GLOBAL OQF OQF × POS. PTF(10) OQF(10) C(PTF) S(PTF) C(PTF) ______________________________________ 1 +15.5 0.9766 0.9636 0.2672 0.9413 2 -4.8 0.9918 0.9965 -0.0837 0.9883 3 -15.4 0.9984 0.9641 -0.2656 0.9626 4 -18.3 1.000 0.9494 -0.314 0.9494 5 -15.4 0.9990 0.9641 -0.2656 0.9631 6 -8.7 0.9976 0.9885 -0.1513 0.9861 7 0.0 0.9970 1.0000 0.0000 0.9970 8 +8.7 0.9976 0.9885 0.1513 0.9861 9 +15.5 0.9990 0.9641 0.2656 0.9631 10 +18.3 1.000 0.9494 0.3140 0.9494 11 +15.4 0.9984 0.9641 0.2656 0.9626 12 +4.8 0.9918 0.9965 0.0837 0.9883 13 -15.5 0.9766 0.9636 -0.2672 0.9413 Vector Sum: 12.5786 ______________________________________
__________________________________________________________________________APPENDIX A AVERAGE VECTOR SUM DERIVATION __________________________________________________________________________In this section we derive a mathematical relationship between the local and global or full aperture performance. The derived model will show that the global OQF can be expressed as the average of the vector (phasor) sum of the local OQF's. In the following demonstration, it is assumed that the sampling density of the pupil plane satisfies the Nyquist criterion relative to the aberration spatial frequency bandwidth. The OTF can be computed as the autocorrelation of the lens complex pupil function; P(x) as- ##STR1## (1) Where- A = total area of full aperture s = common region of integration for the product P(x) P(x + D) P*(x + D) = complex conjugate of pupil function for shift distance D = λzf λ = lightwavelength z = distance of pupil to diffraction plane D = pupil shift distance f = spatial frequency P(x) = p(x)e.sup.jkW(x) and P*(x + D) = p(x + D)e.sup.-jkW(x+D) where- p(x) = complex transmittance of pupil W(x) = aberration function of pupil and k = 2x/λ. Thus, eq, (1) is expressed as- ##STR2## For simplicity let ΔW(x,D) = [W(x) - W(x + D)], then- ##STR3## (2) Euler's formula applied to eq. 2 gives- ##STR4## OTF(f) = 1/A (a + jb), where- ##STR5## ##STR6## The polar form of the OTF is given in terms of the MTF and the PTF as- OTF(f) = MTF(f)e.sup.jPTF(f) where- MTF(f) = (a.sup.2 + b.sup.2).sup.1/2 and PTF(f) = arctan{b/a} Given that ΔW(x,D) is approximately linear over the LWPA sample aperture, then- ##STR7## (3) where- c{ } = the Fourier cosine transform s{ } = the Fourier sine transform The modulus of the OTF is the MTF and is then expressible as- ##STR8## and the corresponding OTF phase as- ##STR9## where PTF(f) = (λ/2x) ΔW(x,D) Thus, the OTF can be expressed in polar form as- OTF(f) = MTF(f)e.sup.jPTF(f) (4) In the diffraction limited case, the PTF part is zero and 4 reduces to- OTF.sub.D (f) = MTF.sub.D (f) (5) Equations 4 and 5 represent the global or full aperture OTF for the general and diffraction limited case respectively. A complex OQF can now be defined as- ##STR10## (6) To this point, only global transfer functions and OQF have been discussed. Similar results are dirived for local pupil regions in the following sections. FIG. 1 presents an example full aperature in the form of a 1-dimensional rectangular slit for exemplary purposes-results are extendable to 2-D PARTITIONED FULL APERTURE ##STR11## As shown, the full or global aperture of FIG. 1A is partitioned into m subapertures where X.sub.p represents the central coordinate of the p-th subaperture. The shifted aperture is also shown in FIG. 1B for the demonstration of the autocorrelation process. The OTF is obtained, by the integration over the common region, as shown in the figure, of the shifted and unshifted pupils. Since the example aperture is partitioned, a local OTF can be defined for each of the m-D common subaperture pairs. The OTF for the p-th subaperture is composed of sample regions at coordinates X.sub.p and X.sub.p+D. The local OTF for that part of the pupil circumcribed by this pair of sample apertures is then- ##STR12## (7) Equation 7 gives the p-th local OQF for common regions defined over Sp -the intersection of regions located at coordinates X.sub.p and X.sub.p+D. The paired local subapertures in the common region of FIG. 1 define a system of Young's sampling apertures. For example, subapertures X.sub.1 and X.sub.1+D, X.sub. 2 and X.sub.2+D, etc. form a set of Young's interferometers, wherein each pair within the set have a fixed separation distance D = λzf*. In essence, each pair evaluates the quality of the full aperture on the basis of m-D discrete subaperture pairs of the common region. From equation's 2 and 7, the global OTF is expressed in terms of local pupil contributions as- ##STR13## (8) The corresponding diffraction limited case is- ##STR14## (9) The global OQF is computed as OQF(f) = OTF(f)/OTF.sub.D (f); thus, from equation's 8 and 9 we get the global OQF in terms of subapertures as- ##STR15## Substitution of equation 4 and 5 gives a simplified expression for the global OQF as- ##STR16## where MTF.sub.D,p (f) is the diffraction-limited MTF for the p-th Young's subaperture pair. Arithmetic operations lead to the following simplified formulas- ##STR17## This equation demonstrates that the global OQF can be represented as the vector or phasor sum of the local complex OQF results. Finally, Euler's formula can be used to give the following computationally convenient form for the global OQF- ##STR18## This equation was used in obtaining the TABLE IV results. The summation components for the first term is denoted as OQF X C(PTF). __________________________________________________________________________Claims (8)
LOTF(freq.)=LMTF(freq.)×e.sup.(j)LPTF (freq.)
Priority Applications (1)
| Application Number | Priority Date | Filing Date | Title |
|---|---|---|---|
| US07/723,141US5221834A (en) | 1991-06-28 | 1991-06-28 | Method for providing feedback correction for an imaging device |
Applications Claiming Priority (1)
| Application Number | Priority Date | Filing Date | Title |
|---|---|---|---|
| US07/723,141US5221834A (en) | 1991-06-28 | 1991-06-28 | Method for providing feedback correction for an imaging device |
Publications (1)
| Publication Number | Publication Date |
|---|---|
| US5221834Atrue US5221834A (en) | 1993-06-22 |
Family
ID=24905037
Family Applications (1)
| Application Number | Title | Priority Date | Filing Date |
|---|---|---|---|
| US07/723,141Expired - LifetimeUS5221834A (en) | 1991-06-28 | 1991-06-28 | Method for providing feedback correction for an imaging device |
Country Status (1)
| Country | Link |
|---|---|
| US (1) | US5221834A (en) |
Cited By (28)
| Publication number | Priority date | Publication date | Assignee | Title |
|---|---|---|---|---|
| US5361307A (en)* | 1993-03-25 | 1994-11-01 | General Electric Company | Correlation methods of identifying defects in imaging devices |
| US5450352A (en)* | 1993-02-05 | 1995-09-12 | Santa Barbara Research Center | Method for reducing sidelobe impact of low order aberration in a coronagraph |
| US5760829A (en)* | 1995-06-06 | 1998-06-02 | United Parcel Service Of America, Inc. | Method and apparatus for evaluating an imaging device |
| US5818572A (en)* | 1996-04-24 | 1998-10-06 | Northrop Grumman Corporation | Two-dimensional modulation transfer function measurement technique |
| US5867211A (en)* | 1995-10-27 | 1999-02-02 | Northrop Grumman Corporation | Apparatus and method for removing offset and shading from a video signal |
| DE19823844C1 (en)* | 1998-03-27 | 1999-10-14 | Leica Camera Ag | Lens tester |
| US6271914B1 (en) | 1996-11-25 | 2001-08-07 | Autonomous Technologies Corporation | Objective measurement and correction of optical systems using wavefront analysis |
| US6270221B1 (en) | 1998-08-19 | 2001-08-07 | Alcon Universal Ltd. | Apparatus and method for measuring vision defects of a human eye |
| US6341183B1 (en)* | 1998-10-27 | 2002-01-22 | The Regents Of The University Of California | Graphical user interface for image acquisition and processing |
| US6346981B1 (en) | 1998-03-27 | 2002-02-12 | Leica Camera A.G. | Lens testing device |
| US6497483B2 (en) | 2000-05-08 | 2002-12-24 | Alcon, Inc. | Apparatus and method for objective measurement of optical systems using wavefront analysis |
| US20030078753A1 (en)* | 2000-03-22 | 2003-04-24 | Campin John Alfred | Optimization of ablation correction of an optical system and associated methods |
| US6565209B2 (en) | 2000-04-25 | 2003-05-20 | Alcon Universal Ltd. | Range-extending system and spatial filter for enhancing Hartmann-Shack images and associated methods |
| US6569154B2 (en) | 2000-03-22 | 2003-05-27 | Alcon, Inc. | Optimization of ablation correction of an optical system and associated methods |
| US6578963B2 (en) | 2000-04-19 | 2003-06-17 | Alcon Universal Ltd. | Wavefront sensor for objective measurement of an optical system and associated methods |
| US6598973B2 (en) | 2000-04-25 | 2003-07-29 | Alcon, Inc. | Spatial filter for enhancing Hartmann-Shack images and associated methods |
| US6626895B2 (en) | 1994-04-25 | 2003-09-30 | Alcon, Inc. | Laser beam delivery system |
| US20040130677A1 (en)* | 1998-08-19 | 2004-07-08 | Alcon, Inc. | Apparatus and method for measuring vision defects of a human eye |
| US20040183457A1 (en)* | 2002-12-12 | 2004-09-23 | Hirohito Kondo | Image forming apparatus |
| US20040190762A1 (en)* | 2003-03-31 | 2004-09-30 | Dowski Edward Raymond | Systems and methods for minimizing aberrating effects in imaging systems |
| US20050018278A1 (en)* | 2000-10-10 | 2005-01-27 | Nikon Corporation | Method for evaluating image formation performance |
| US20050124983A1 (en)* | 1996-11-25 | 2005-06-09 | Frey Rudolph W. | Method for determining and correcting vision |
| US20050197809A1 (en)* | 2003-12-01 | 2005-09-08 | Dowski Edward R.Jr. | System and method for optimizing optical and digital system designs |
| US7226443B1 (en) | 2003-11-07 | 2007-06-05 | Alcon Refractivehorizons, Inc. | Optimization of ablation correction of an optical system and associated methods |
| US20090040510A1 (en)* | 2007-08-07 | 2009-02-12 | Ryoko Tomioka | Method and apparatus as well as corrective optical system for evaluating restoration-premised lens |
| US20100272327A1 (en)* | 2003-12-01 | 2010-10-28 | Silveira Paulo E X | Task-Based Imaging Systems |
| US20100278390A1 (en)* | 2003-12-01 | 2010-11-04 | Silveira Paulo E X | Task-based imaging systems |
| US20110311132A1 (en)* | 2009-03-04 | 2011-12-22 | Elie Meimoun | Wavefront analysis inspection apparatus and method |
Citations (6)
| Publication number | Priority date | Publication date | Assignee | Title |
|---|---|---|---|---|
| US3930732A (en)* | 1974-11-22 | 1976-01-06 | Atlantic Research Corporation | Device and process for testing a lens system |
| US4772120A (en)* | 1985-07-10 | 1988-09-20 | Matra | Determination of the transfer function of an optical instrument |
| US4875765A (en)* | 1988-07-29 | 1989-10-24 | Eastman Kodak Company | Method for correction of distortions of a mirror |
| US4950878A (en)* | 1989-04-12 | 1990-08-21 | Kaman Aerospace Corporation | Wavefront control system using optical coarse/fine gradient sensor |
| US4993823A (en)* | 1989-06-29 | 1991-02-19 | Eastman Kodak Company | Method for correction of distortions of an imaging device |
| US5126550A (en)* | 1991-03-27 | 1992-06-30 | Eastman Kodak Company | Method for assessing the optical quality of an imaging device |
- 1991
- 1991-06-28USUS07/723,141patent/US5221834A/ennot_activeExpired - Lifetime
Patent Citations (6)
| Publication number | Priority date | Publication date | Assignee | Title |
|---|---|---|---|---|
| US3930732A (en)* | 1974-11-22 | 1976-01-06 | Atlantic Research Corporation | Device and process for testing a lens system |
| US4772120A (en)* | 1985-07-10 | 1988-09-20 | Matra | Determination of the transfer function of an optical instrument |
| US4875765A (en)* | 1988-07-29 | 1989-10-24 | Eastman Kodak Company | Method for correction of distortions of a mirror |
| US4950878A (en)* | 1989-04-12 | 1990-08-21 | Kaman Aerospace Corporation | Wavefront control system using optical coarse/fine gradient sensor |
| US4993823A (en)* | 1989-06-29 | 1991-02-19 | Eastman Kodak Company | Method for correction of distortions of an imaging device |
| US5126550A (en)* | 1991-03-27 | 1992-06-30 | Eastman Kodak Company | Method for assessing the optical quality of an imaging device |
Cited By (50)
| Publication number | Priority date | Publication date | Assignee | Title |
|---|---|---|---|---|
| US5450352A (en)* | 1993-02-05 | 1995-09-12 | Santa Barbara Research Center | Method for reducing sidelobe impact of low order aberration in a coronagraph |
| US5361307A (en)* | 1993-03-25 | 1994-11-01 | General Electric Company | Correlation methods of identifying defects in imaging devices |
| US6626895B2 (en) | 1994-04-25 | 2003-09-30 | Alcon, Inc. | Laser beam delivery system |
| US6626898B2 (en) | 1994-04-25 | 2003-09-30 | Alcon, Inc. | Flying spot laser ablation method |
| US6626894B2 (en) | 1994-04-25 | 2003-09-30 | Alcon, Inc. | Method of ablating a moving eye |
| US6626897B2 (en) | 1994-04-25 | 2003-09-30 | Alcon, Inc. | Method of redirecting an ablating laser beam |
| US6626896B2 (en) | 1994-04-25 | 2003-09-30 | Alcon, Inc. | Method of correcting vision |
| US5760829A (en)* | 1995-06-06 | 1998-06-02 | United Parcel Service Of America, Inc. | Method and apparatus for evaluating an imaging device |
| US5867211A (en)* | 1995-10-27 | 1999-02-02 | Northrop Grumman Corporation | Apparatus and method for removing offset and shading from a video signal |
| US5818572A (en)* | 1996-04-24 | 1998-10-06 | Northrop Grumman Corporation | Two-dimensional modulation transfer function measurement technique |
| US6271915B1 (en) | 1996-11-25 | 2001-08-07 | Autonomous Technologies Corporation | Objective measurement and correction of optical systems using wavefront analysis |
| US20050124983A1 (en)* | 1996-11-25 | 2005-06-09 | Frey Rudolph W. | Method for determining and correcting vision |
| US6271914B1 (en) | 1996-11-25 | 2001-08-07 | Autonomous Technologies Corporation | Objective measurement and correction of optical systems using wavefront analysis |
| US6346981B1 (en) | 1998-03-27 | 2002-02-12 | Leica Camera A.G. | Lens testing device |
| DE19823844C1 (en)* | 1998-03-27 | 1999-10-14 | Leica Camera Ag | Lens tester |
| US6270221B1 (en) | 1998-08-19 | 2001-08-07 | Alcon Universal Ltd. | Apparatus and method for measuring vision defects of a human eye |
| US20040130677A1 (en)* | 1998-08-19 | 2004-07-08 | Alcon, Inc. | Apparatus and method for measuring vision defects of a human eye |
| US6341183B1 (en)* | 1998-10-27 | 2002-01-22 | The Regents Of The University Of California | Graphical user interface for image acquisition and processing |
| US20050018277A1 (en)* | 2000-02-08 | 2005-01-27 | Nikon Corporation | Method for evaluating image formation performance |
| US6569154B2 (en) | 2000-03-22 | 2003-05-27 | Alcon, Inc. | Optimization of ablation correction of an optical system and associated methods |
| US20030078753A1 (en)* | 2000-03-22 | 2003-04-24 | Campin John Alfred | Optimization of ablation correction of an optical system and associated methods |
| US7044944B2 (en) | 2000-03-22 | 2006-05-16 | Alcon Refractivehorizons, Inc. | Optimization of ablation correction of an optical system and associated methods |
| US6578963B2 (en) | 2000-04-19 | 2003-06-17 | Alcon Universal Ltd. | Wavefront sensor for objective measurement of an optical system and associated methods |
| US6598973B2 (en) | 2000-04-25 | 2003-07-29 | Alcon, Inc. | Spatial filter for enhancing Hartmann-Shack images and associated methods |
| US6565209B2 (en) | 2000-04-25 | 2003-05-20 | Alcon Universal Ltd. | Range-extending system and spatial filter for enhancing Hartmann-Shack images and associated methods |
| US6497483B2 (en) | 2000-05-08 | 2002-12-24 | Alcon, Inc. | Apparatus and method for objective measurement of optical systems using wavefront analysis |
| US7061671B2 (en)* | 2000-10-10 | 2006-06-13 | Nikon Corporation | Method for evaluating image formation performance |
| US20050018278A1 (en)* | 2000-10-10 | 2005-01-27 | Nikon Corporation | Method for evaluating image formation performance |
| US20040183457A1 (en)* | 2002-12-12 | 2004-09-23 | Hirohito Kondo | Image forming apparatus |
| US7889903B2 (en) | 2003-03-31 | 2011-02-15 | Omnivision Technologies, Inc. | Systems and methods for minimizing aberrating effects in imaging systems |
| WO2004090581A3 (en)* | 2003-03-31 | 2005-02-24 | Cdm Optics Inc | Systems and methods for minimizing aberrating effects in imaging systems |
| US20040190762A1 (en)* | 2003-03-31 | 2004-09-30 | Dowski Edward Raymond | Systems and methods for minimizing aberrating effects in imaging systems |
| US7260251B2 (en)* | 2003-03-31 | 2007-08-21 | Cdm Optics, Inc. | Systems and methods for minimizing aberrating effects in imaging systems |
| US8107705B2 (en)* | 2003-03-31 | 2012-01-31 | Omnivision Technologies, Inc. | Systems and methods for minimizing aberrating effects in imaging systems |
| US20110142310A1 (en)* | 2003-03-31 | 2011-06-16 | Omnivision Technologies, Inc. | Systems and Methods for Minimizing Aberrating Effects in Imaging Systems |
| US20090067680A1 (en)* | 2003-03-31 | 2009-03-12 | Omnivision Cdm Optics, Inc. | Systems And Methods For Minimizing Aberrating Effects In Imaging Systems |
| US7226443B1 (en) | 2003-11-07 | 2007-06-05 | Alcon Refractivehorizons, Inc. | Optimization of ablation correction of an optical system and associated methods |
| US7860699B2 (en) | 2003-12-01 | 2010-12-28 | Omnivision Technologies, Inc. | System and method for optimizing optical and digital system designs |
| US20100278390A1 (en)* | 2003-12-01 | 2010-11-04 | Silveira Paulo E X | Task-based imaging systems |
| US20050197809A1 (en)* | 2003-12-01 | 2005-09-08 | Dowski Edward R.Jr. | System and method for optimizing optical and digital system designs |
| US20100272327A1 (en)* | 2003-12-01 | 2010-10-28 | Silveira Paulo E X | Task-Based Imaging Systems |
| US7944467B2 (en) | 2003-12-01 | 2011-05-17 | Omnivision Technologies, Inc. | Task-based imaging systems |
| US20110176708A1 (en)* | 2003-12-01 | 2011-07-21 | Omnivision Technologies, Inc. | Task-Based Imaging Systems |
| US7469202B2 (en) | 2003-12-01 | 2008-12-23 | Omnivision Cdm Optics, Inc. | System and method for optimizing optical and digital system designs |
| US8144208B2 (en) | 2003-12-01 | 2012-03-27 | Omnivision Technologies, Inc. | Task-based imaging systems |
| US8760516B2 (en) | 2003-12-01 | 2014-06-24 | Omnivision Technologies, Inc. | Task-based imaging systems |
| US7876429B2 (en)* | 2007-08-07 | 2011-01-25 | Fujinon Corporation | Method and apparatus as well as corrective optical system for evaluating restoration-premised lens |
| US20090040510A1 (en)* | 2007-08-07 | 2009-02-12 | Ryoko Tomioka | Method and apparatus as well as corrective optical system for evaluating restoration-premised lens |
| US20110311132A1 (en)* | 2009-03-04 | 2011-12-22 | Elie Meimoun | Wavefront analysis inspection apparatus and method |
| US8928892B2 (en)* | 2009-03-04 | 2015-01-06 | Elie Meimoun | Wavefront analysis inspection apparatus and method |
Similar Documents
| Publication | Publication Date | Title |
|---|---|---|
| US5221834A (en) | Method for providing feedback correction for an imaging device | |
| US8104905B2 (en) | Method and apparatus for determining a deviation of an actual shape from a desired shape of an optical surface | |
| US6781681B2 (en) | System and method for wavefront measurement | |
| US7612893B2 (en) | Scanning interferometric methods and apparatus for measuring aspheric surfaces and wavefronts | |
| CN112740092B (en) | Method and system for non-invasive optical characterization of non-homogeneous media | |
| EP1651100A1 (en) | Optical wavefront analyzer | |
| US20190188834A1 (en) | Rapid image correction method for a simplified adaptive optical system | |
| Birch et al. | The application of computer-generated holograms to testing optical elements | |
| US5341312A (en) | Method for assessing and correcting individual components of a non-monolithic imaging assembly | |
| US5126550A (en) | Method for assessing the optical quality of an imaging device | |
| Dzyuba et al. | Wavefront Aberrations Recognition Study Based on Multi-Channel Spatial Filter Matched with Basis Zernike Functions and Convolutional Neural Network with Xception Architecture | |
| Selberg | Absolute testing of spherical surfaces | |
| Garbusi et al. | Advanced studies on the measurement of aspheres and freeform surfaces with the tilted-wave interferometer | |
| Mancilla-Escobar et al. | Two dimensional wavefront retrieval using lateral shearing interferometry | |
| Barbosa et al. | Progressive power lens measurement by low coherence speckle interferometry | |
| Schwider et al. | Grazing-incidence test for cylindrical microlenses with high numericalaperture | |
| Lago et al. | Wavefront sensing by diffracted beam interferometry | |
| Brady et al. | Improved optical metrology using phase retrieval | |
| Sokolova et al. | Computer modelling of a wavefront diffracted at a concave grating | |
| Hénault et al. | Hartmann vs reverse Hartmann test: a Fourier optics point of view | |
| Lisson et al. | Estimation of imaging performance using local optical quality factor metrics | |
| Comastri et al. | Joint transform correlator: aberrations in the joint spectrum and their influence on the correlation peak | |
| Gross et al. | Non‐Interferometric Wavefront Sensing | |
| CN111307302B (en) | A Complementation Method for Wavefront Loss Information During Transverse Shear Interferometric Wavefront Reconstruction | |
| Minnick et al. | Transfer function calculation techniques for real optical systems |
Legal Events
| Date | Code | Title | Description |
|---|---|---|---|
| AS | Assignment | Owner name:EASTMAN KODAK COMPANY, NEW YORK Free format text:ASSIGNMENT OF ASSIGNORS INTEREST.;ASSIGNORS:LISSON, JEROLD B.;MOUNTS, DARRYL I.;MACK, DALE K.;REEL/FRAME:005757/0386 Effective date:19910626 | |
| FEPP | Fee payment procedure | Free format text:PAYOR NUMBER ASSIGNED (ORIGINAL EVENT CODE: ASPN); ENTITY STATUS OF PATENT OWNER: LARGE ENTITY | |
| STCF | Information on status: patent grant | Free format text:PATENTED CASE | |
| FEPP | Fee payment procedure | Free format text:PAYOR NUMBER ASSIGNED (ORIGINAL EVENT CODE: ASPN); ENTITY STATUS OF PATENT OWNER: LARGE ENTITY Free format text:PAYER NUMBER DE-ASSIGNED (ORIGINAL EVENT CODE: RMPN); ENTITY STATUS OF PATENT OWNER: LARGE ENTITY | |
| FPAY | Fee payment | Year of fee payment:4 | |
| FPAY | Fee payment | Year of fee payment:8 | |
| AS | Assignment | Owner name:ITT MANUFACTURING ENTERPRISES, INC., DELAWARE Free format text:ASSIGNMENT OF ASSIGNORS INTEREST;ASSIGNOR:EASTMAN KODAK COMPANY;REEL/FRAME:015980/0844 Effective date:20040916 | |
| REMI | Maintenance fee reminder mailed | ||
| FPAY | Fee payment | Year of fee payment:12 | |
| SULP | Surcharge for late payment | Year of fee payment:11 |