US4949710A - Method of artifact rejection for noninvasive blood-pressure measurement by prediction and adjustment of blood-pressure data - Google Patents
Method of artifact rejection for noninvasive blood-pressure measurement by prediction and adjustment of blood-pressure dataDownload PDFInfo
- Publication number
- US4949710A US4949710AUS07/254,204US25420488AUS4949710AUS 4949710 AUS4949710 AUS 4949710AUS 25420488 AUS25420488 AUS 25420488AUS 4949710 AUS4949710 AUS 4949710A
- Authority
- US
- United States
- Prior art keywords
- waveform
- counterpressure
- pressure
- cuff
- blood
- Prior art date
- Legal status (The legal status is an assumption and is not a legal conclusion. Google has not performed a legal analysis and makes no representation as to the accuracy of the status listed.)
- Expired - Lifetime
Links
Images


Classifications
- A—HUMAN NECESSITIES
- A61—MEDICAL OR VETERINARY SCIENCE; HYGIENE
- A61B—DIAGNOSIS; SURGERY; IDENTIFICATION
- A61B5/00—Measuring for diagnostic purposes; Identification of persons
- A61B5/02—Detecting, measuring or recording for evaluating the cardiovascular system, e.g. pulse, heart rate, blood pressure or blood flow
- A61B5/021—Measuring pressure in heart or blood vessels
- A61B5/022—Measuring pressure in heart or blood vessels by applying pressure to close blood vessels, e.g. against the skin; Ophthalmodynamometers
- A61B5/02225—Measuring pressure in heart or blood vessels by applying pressure to close blood vessels, e.g. against the skin; Ophthalmodynamometers using the oscillometric method
- A—HUMAN NECESSITIES
- A61—MEDICAL OR VETERINARY SCIENCE; HYGIENE
- A61B—DIAGNOSIS; SURGERY; IDENTIFICATION
- A61B5/00—Measuring for diagnostic purposes; Identification of persons
- A61B5/02—Detecting, measuring or recording for evaluating the cardiovascular system, e.g. pulse, heart rate, blood pressure or blood flow
- A61B5/021—Measuring pressure in heart or blood vessels
- A61B5/02108—Measuring pressure in heart or blood vessels from analysis of pulse wave characteristics
- A61B5/02116—Measuring pressure in heart or blood vessels from analysis of pulse wave characteristics of pulse wave amplitude
- A—HUMAN NECESSITIES
- A61—MEDICAL OR VETERINARY SCIENCE; HYGIENE
- A61B—DIAGNOSIS; SURGERY; IDENTIFICATION
- A61B5/00—Measuring for diagnostic purposes; Identification of persons
- A61B5/02—Detecting, measuring or recording for evaluating the cardiovascular system, e.g. pulse, heart rate, blood pressure or blood flow
- A61B5/021—Measuring pressure in heart or blood vessels
- A61B5/022—Measuring pressure in heart or blood vessels by applying pressure to close blood vessels, e.g. against the skin; Ophthalmodynamometers
- A61B5/0225—Measuring pressure in heart or blood vessels by applying pressure to close blood vessels, e.g. against the skin; Ophthalmodynamometers the pressure being controlled by electric signals, e.g. derived from Korotkoff sounds
- A—HUMAN NECESSITIES
- A61—MEDICAL OR VETERINARY SCIENCE; HYGIENE
- A61B—DIAGNOSIS; SURGERY; IDENTIFICATION
- A61B5/00—Measuring for diagnostic purposes; Identification of persons
- A61B5/72—Signal processing specially adapted for physiological signals or for diagnostic purposes
- A61B5/7203—Signal processing specially adapted for physiological signals or for diagnostic purposes for noise prevention, reduction or removal
- A61B5/7207—Signal processing specially adapted for physiological signals or for diagnostic purposes for noise prevention, reduction or removal of noise induced by motion artifacts
Definitions
- This inventionpertains to an improvement in artifact rejection methods for noninvasive blood-pressure measurement, and more particularly, to a unique method of predicting, from acquired data, subsequent, expected data values.
- a counterpressure-producing cuffis wrapped around the person's upper arm, with the cuff then inflated to a counterpressure above systolic pressure to occlude an artery (blood vessel) in the arm. Thereafter cuff counterpressure is progressively reduced in a stepped fashion from this suprasystolic pressure to an ending counterpressure where the cuff is substantially deflated.
- the arteryopens progressively from an occluded state to an unoccluded state.
- the arterybegins to product detectable pulsations against the cuff, and the waveforms of these pulsations are monitorable to produce graphic illustrations of blood-pressure parameters.
- the method of the present inventionsignificantly addresses this key issue.
- An important object of the inventionis to provide for artifact rejection in a unique way which ensures that accepted pressure waveforms truly are blood-pressure induced.
- Another objectis to decrease the number of pressure waveforms that are monitored at each cuff counterpressure level, thereby to decrease the overall time period of a measuring cycle, thus to maximize efficiency.
- NIBPnon-invasive blood-pressure measurement
- the present inventionis employed after development of waveform data values for a predetermined number of cuff counterpressure levels at the beginning of a measuring cycle.
- the techniqueis used to predict a next, expected-to-be-encountered data value for a next, lower cuff counterpressure level.
- Employing prediction for successive, next, lower cuff counterpressure levelsprovides a simple and accurate method of artifact rejection which also substantially decreases the number of pressure waveforms required to be monitored at a given cuff counterpressure level. Therefore, if a next, developed waveform data value for a measured waveform is within experimentally set upper and lower bounds of its corresponding predicted value, the measured value is accepted as being blood-pressure induced.
- the proposed rejection techniqueis employed further to perform a "pulse-data adjustment".
- the techniqueadjusts previously encountered (and stored) waveform data values based on the difference between a measured waveform data value and a corresponding predicted waveform data value for a given cuff counterpressure level. This is referred to herein as a “smoothing" technique.
- smoothingprovides further ensurance of the accuracy of ultimately derived, desired blood-pressure parameters.
- FIG. 1is a schematic/block depiction of apparatus and software suitable for carrying out the present invention.
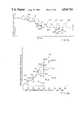
- FIG. 2Ais a fragmented graph of cuff counterpressure decreasing over time, showing a series of cuff counterpressure levels wherein the waveforms depicted are monitored by the method of the present invention.
- FIG. 2Bis a fragmented graph of waveform-specific data vs. cuff counterpressure levels that depicts how the method technique of the invention predicts a subsequent, expected-to-be-stored waveform data value for a subsequent cuff counterpressure level.
- FIG. 2Cis a fragmented graph of waveform data vs. cuff counterpressure levels illustrating the "smoothing" technique referred to earlier.
- FIG. 2Dis a graph of waveform-specific data vs. cuff counterpressure levels for an entire measuring cycle of a living test subject.
- FIG. 3is a computer-program flow chart further illustrating computer-based implementation of the invention.
- FIG. 1a schematic/block depiction of blood-pressure measuring apparatus and software characterizing applicant's NIBP system is shown.
- cuff 14is a means for producing a baseline counterpressure, and is disposed adjacent a blood vessel 16 (wrapped around the arm) of a living subject 18.
- a pump 20inflates cuff 14 to a point where it exerts a counterpressure against the arm that is above systolic pressure, thereby occluding vessel 16.
- a valve 22Under the control of a microprocessor (still to be discussed), a valve 22 progressively reduces the cuff counterpressure from the beginning counterpressure level above systolic pressure to an ending counterpressure to be described later.
- counterpressureis reduced in a stepwise fashion in order to monitor pressure changes occurring in cuff 14 at each step, or cuff counterpressure level.
- cuff counterpressurereduces in steps of 5- to 6-mm Hg.
- vessel 16gradually begins to produce detectable pulsations from heart contractions. More specifically, and as previously noted, these vessel pulsations are caused by blood that has been accelerated, or given momentum, during the time period of each successive heart contraction.
- a pressure transducer 24receives, at a predetermined rate, an analog pressure signal composed of a cuff counterpressure component and a pressure pulsation component which "may be" blood-pressure-induced.
- Transducer 24converts each pressure signal into an electrical signal which is amplified by an amplifier 26.
- the amplified electrical signalis then sent to two different locations--a band-pass filter 28, and an analog-to-digital converter 30.
- Each signalis sent to filter 28 in order to have the cuff counterpressure component filtered out.
- the signal output of filter 28corresponds to pressure pulsations.
- the filtered signal componentis fed to converter 30 from which there emerges a first stream of digitized data which corresponds to pressure pulsations.
- the presently preferred monitoring interval for transducer 24is about 5.5-msec.
- Each signal from amplifier 26is also sent to converter 30 in order to provide a second stream of data corresponding to cuff counterpressure levels at which corresponding pressure pulsations occur.
- the signal from amplifier 26contains both the cuff counterpressure component and the pressure pulsation component.
- the pressure pulsation component's valueis so small relative to the cuff counterpressure component's value, we have found that the signal from amplifier 26 substantially corresponds to cuff counterpressure.
- baseline counterpressure datathe second stream of data corresponding to cuff counterpressure levels.
- converter 30digitizes two streams of data, one corresponding to baseline counterpressure data, and one corresponding to pressure pulsation data.
- Data emanating from converter 30,is processed by a microprocessor 31 having suitable memory capacity--this microprocessor being operated by programs which will be described in the discussion of FIG. 3.
- pressure signal data from converter 30are processed by microprocessor 31 in accordance with the important steps of the present invention. Most of the remaining blocks in FIG. 1 depict generally the software or program which directs the operation of the microprocessor.
- the microprocessorexamines the data streams arriving from converter 30 and, throughout the performance of a complete monitoring cycle of blood pressure, exercises various functions on this data to verify proper data, and to arrive at maximally accurate useful information. From an overview point of view, once a cycle of operation has begun, and particularly with the data streams emanating from the converter including pulsation data, and as cuff counterpressure is stepped downwardly as will be explained, every single pulsation which is sensed by the microprocessor has applied to it what is referred to herein as a first artifact rejection technique which is designed to determine that that particular pulsation, or signal, is one which has been induced by blood-pressure activity. For a comprehensive description of applicants' first artifact rejection technique, reference is made to the above-mentioned pending patent application, the text and drawings of which are hereby incorporated herein by reference.
- every pulse which is so "validated"has, in the particular system now being described, an area integration performed with respect to it to develop waveform integrals upon which the microprocessor then performs other functions to arrive at the finally accepted and usable waveform-specific area data.
- three waveformsare accepted in each of the first two successively reduced counterpressure levels wherein pulses are detected and, as will be explained, a selection and averaging function is performed to select an acceptable, ultimately-generated-and-stored piece of waveform-specific area data.
- These two datain such first two steps, establish, via operation of the microprocessor, a pattern for employing prediction, in accordance with what has been referred to herein as the second artifact rejection technique, as a way of determining whether subsequently acquired waveform-specific area data is or is not acceptable.
- block 32has been identified as the first artifact rejection technique as a way of putting an identifying name on that part of the program which looks at every single data stream reflecting a pressure pulsation to determine whether it is in fact a blood-pressure-induced pulsation.
- Block 34identified as the waveform integrator, indicates that part of the program which, with regard to pulses accepted by block 32, performs a waveform area integration.
- Block 36identified as the first waveform area data evaluator, represents that part of the program which examines the first two pulsation-data-containing counterpressure stepped levels for the purpose of "setting up" the operation of block 42--the second artifact rejection technique program which is the subject matter of the present invention.
- block 42applies the second technique, including the generation of a prediction curve, the evaluation of waveform area data vis-a-vis its acceptability relative to that curve, and the smoothing of the curve referred to earlier.
- microprocessor 31is directed by the second artifact rejection technique program to process the third and subsequent pulsation-data-containing counterpressure-stepped levels. At the end of the measuring cycle, the microprocessor generates a final curve connecting final, adjusted (by the aforementioned smoothing of the curve) waveform-specific area data for each counterpressure level of the measurement cycle.
- the second artifact rejection technique program directing the microprocessor during the third and subsequent counterpressure levelswill be more fully described in the discussion of FIGS. 2A-2D and FIG. 3.
- block 48has been identified as the blood pressure parameter determiner as a way of putting an identifying name on that part of a program which directs the microprocessor to determine MAP, systolic, and diastolic pressure from the final curve of waveform-specific area data.
- the way in which the microprocessor determines the desired blood-pressure parameters from the final curvewill be described in the discussion of FIG. 2D.
- the parametersare sent in a digitized, arabic numeral form to a display 50 where the parameters are represented as arabic numerals by a conventional LCD read-out.
- FIG. 2Astepped, decreasing cuff counterpressure levels and associated pressure waveforms acquired relative to one measurement are shown in order to depict graphically what has previously been described as first waveform area data evaluator 36 and second artifact rejection technique 42.
- each waveform depicted in FIG. 2Arepresents pulsation data that has been processed by the microprocessor, seriatim, in order to verify that the data is blood pressure-induced, and to integrate verified data as the data exhibits one of the three aforementioned phases of divergence from baseline counterpressure data.
- the microprocessorAfter the microprocessor receives pulsation data relative to a point to the right of each waveform's peak, thus at a point where pulsation data is converging to baseline data, the microprocessor stores the integral of each waveform, which is calculated from the previously described waveform base to the waveform processing ending point. Then, waveform integrals for each waveform that the microprocessor verifies and integrates by the aforementioned technique 32 and integrator 34 are further processed to determine one waveform-specific area data value for each counterpressure level.
- the second artifact rejection technique programdirects the microprocessor to generate a prediction curve from the two area data values.
- This prediction curvedirects the microprocessor to use a different technique for determining an area data value for the third and subsequent counterpressure levels than the technique of evaluator 36 that was applied to the first two counterpressure levels.
- FIG. 2Adepicts no detectable pressure waveforms at a counterpressure level 72 because counterpressure level 72 is above systolic pressure.
- verified-to-be-blood-pressure induced waveforms 74a, 74b, 74care processed by microprocessor 31 (i.e. waveform integrals are developed under the direction of programs 100, 124, 144).
- the microprocessordirects valve 22 to decrease counterpressure to a next counterpressure level 76, where the microprocessor processes verified-to-be-blood-pressure induced waveforms 76a, 76b, 76c and develops corresponding waveform integrals.
- a computer programdirects microprocessor 31 to evaluate the three waveform integrals in order to calculate one waveform-specific area data value for each counterpressure level 74, 76.
- the microprocessorchooses the two waveform integrals that are closest to each other, averages the two integrals, and stores a final averaged waveform-specific area data value.
- the program which directs microprocessor 31is depicted in FIG. 3.
- the microprocessoris directed by a portion of Second Artifact Refection Technique 300. This portion has been previously depicted and described as first waveform area data evaluator 36.
- Program 300begins with decision block 302 (D1) which asks whether the apparatus is at the first cuff counterpressure level at which pulsation values were processed by microprocessor 31. If the answer to decision block 302 (D1) is no, decision block 304 (D2) asks whether the apparatus is at the second cuff counterpressure level at which pulsation values were monitored by microprocessor 31.
- decision blocks 302 (D1) and 304 (D2)direct the microprocessor to determine whether the apparatus is at counterpressure levels such as level 74, 76 depicted in FIG. 2A. If the answer is yes to either decision block 302 (D1) or 304 (D2), then Program 300 directs the microprocessor to evaluate waveform-specific integrals that have been developed at the corresponding first or second cuff counterpressure levels according to what has been previously depicted and described in FIG. 1 as first waveform area data evaluator 36.
- decision block 306 (D3)asks whether two waveform integrals have been developed by the microprocessor for the present counterpressure level (e.g. levels 74, 76 of FIG. 2A). If the answer to decision block 306 (D3) is yes, then the present waveform integral is a third integral and Program 300 directs the microprocessor to chose the closest two of the three waveform integrals, average the closest two waveform-specific area data values, and calculate one, averaged waveform-specific area data value for the counterpressure level. The steps of this process begin with task block 318 (T4) and will be described soon. However, the steps that Program 300 follows if the answer to decision block 306 (D3) is no will be described first.
- T4task block 318
- decision block 310(D4) asks whether the present waveform integral is the first waveform integral developed by the microprocessor for the present counterpressure level. If the answer to decision block 310 (D4) is yes, then task block 312 (T1) initializes the current waveform-specific area data value as WF1. If the answer to decision block 310 (D4) is no, then the present waveform integral is the second integral and task block 314 (T2) initializes the present waveform integral as WF2.
- task block 316labels the program for Waveform Beginning Program 200 and the program exits to Kernel 108 so that microprocessor 31 can go to Waveform Beginning Program 200 and develop a next integral for a next processed waveform.
- task block 318initializes the present waveform integral as WF3.
- the remainder of FIG. 3shows the steps that Program 300 follows in order to chose the closest two of the three integrals of the present counterpressure level (i.e., levels 74, 76 of FIG. 2A).
- decision block 320(D5) asks whether WF1 is greater than WF2. If the answer to decision block 320 (D5) is yes, then decision block 322a (D6) asks whether WF2 is greater than WF3. If the answer to decision block 320 (D5) is no, then decision block 322b (D7) asks whether WF2 is greater than WF3.
- decision block 324a(D8) asks whether (WF1-WF2) is greater than (WF2-WF3).
- a yes or a no answer to decision block 324aallows Program 300 to decide which two of WF1, WF2, WF3 are the closest to each other. If the answer to decision block 324a is yes, then WF2 and WF3 are the two closest area data values, and task block 326a (T5) averages WF2 and WF3 in order to calculate one waveform-specific area data value for the current cuff counterpressure level. If the answer to decision block 324a (D8) is no, then WF1 and WF2 are the two closest area data values and task block 328a (T6) calculates an average waveform-specific area data value for the current cuff counterpressure level.
- decision block 330a(D9) asks whether WF1 is greater than WF3. If the answer to decision block 330a (D9) is yes, then decision block 332a (D10) asks whether (WF1-WF3) is greater than (WF3-WF2).
- decision block 332a (D10)If the answer to decision block 332a (D10) is yes, then WF2 and WF3 are the two closest area data values and task block 326a (T5) would calculate an average waveform-specific area data value for the current cuff counterpressure level. If the answer to decision block 332a (D10) is no, then WF1 and WF3 are the two closest area data values and task block 334a (T7) would calculate an average waveform-specific area data value from WF1 and WF3.
- decision block 336a (D11)asks whether (WF3-WF1) is greater than (WF1-WF2). If the answer to decision block 336a (D11) is yes, then WF1 and WF2 are the two closest area data values and task block 338a (T8) calculates an average waveform-specific area data value from WF1 and WF2. If the answer to decision block 336a (D11) is no, then WF1 and WF3 are the two closest area data values and task block 334a (T7) would calculate an average waveform-specific area data value from WF1 and WF3.
- decision block 322b (D7)asks whether WF2 is greater than WF3. If the answer to decision block 322b (D7) is no, then decision block 324b (D12) asks whether (WF3-WF2) is greater than (WF2-WF1). If the answer to decision block 324b (D12) is yes, then WF1 and WF2 are two closest area data values and task block 326b (T9) calculates and stores an average waveform-specific area data value based on WF1 and WF2. If the answer to decision block 324b (D12) is no, then WF2 and WF3 are the two closest area data values and task block 328b (T10) calculates and stores an average waveform-specific area data value from WF2 and WF3.
- decision block 330b (D13)asks whether WF1 is greater than WF3. If the answer to decision block 330b (D13) is yes, then decision block 332b (D14) asks whether (WF2-WF1) is greater than (WF1-WF3). Again, the description will continue with the steps after decision block 332 before describing the possibility of a negative answer to decision block 330b (D13). If the answer to decision block 332b (D14) is no, then WF1 and WF2 are the two closest area data values and decision block 326b (T9) calculates and stores an average waveform-specific area data value based on WF1 and WF2. If the answer to decision block 332b (D14) is yes, then WF1 and WF3 are the two closest area data values and task block 334b (T11) calculates and stores an average waveform-specific area data value from WF1 and WF3.
- decision block 336b (D15)asks whether (WF2-WF3) is greater than (WF3-WF1). If the answer to decision block 336b (D15) is yes, then task block 334b (T11) calculates and stores an average, waveform-specific area data value from WF1 and WF3. If the answer to decision block 336b (D15) is no, then WF3 and WF2 are the two closest area data values and task block 338b. (T12) calculates an average, waveform-specific area data value from WF3 and WF2.
- Program 300exits to Kernel 108 so that the microprocessor can go to the programs described in U.S. patent application Ser. No. 07/198,468 to develop a next waveform integral from pulsation data divergence at a next counterpressure level.
- the microprocessoris directed by a program employing second artifact rejection technique 42 to predict an expected-to-be-stored waveform-specific area data value for a pressure waveform that as yet, has not been processed at a next counterpressure level 78.
- the microprocessormakes this prediction from a prediction curve that the microprocessor generated from the area data values of levels 74, 76.
- blood pressure induced waveform 78arepresents a waveform that is actually processed by Microprocessor 31 at counterpressure level 78
- a waveform integral developed from measured waveform 78a by the method disclosed in the above-referenced patent applicationis now evaluated by whether it meets the criterion of the predicted waveform-specific area data value generated by the microprocessor under the direction of second artifact rejection technique 42.
- the evaluationincludes checking whether the waveform integral of waveform 78a is within the upper and lower bounds of the corresponding predicted waveform-specific area data value generated by the microprocessor under the direction of second artifact rejection technique 42.
- program 300does not direct the microprocessor to decision block 358 (D16) unless the answer to decision blocks 302 (D1), 304 (D2) is no. Thus, program 300 only directs the microprocessor to the portion of program 300 beginning with decision block 358 (D16) when the microprocessor is processing data at the third and following counterpressure levels.
- Program 300which directs the microprocessor's evaluation of waveform integrals developed from pulsation waveforms occurring at the third and subsequent counterpressure levels will be discussed after the description of FIG. 2B because FIG. 2B explains how the microprocessor is directed by second artifact rejection technique 42 to predict an expected-to-be-stored waveform-specific area data value for the third and subsequent counterpressure levels. Because it is first necessary to understand the prediction of area data values using second artifact rejection technique 42, the explanation of how program 300 uses the predicted area data value of technique 42 will be postponed until after the description of technique 42 in FIG. 2B.
- program 300uses a different method of determining one waveform-specific area data value for counterpressure levels 78-86 than the previously described method of determining one area data value for counterpressure levels 74, 76. Therefore, with the exclusion of counterpressure level 82, the remainder of FIG. 2A depicts how the present invention would continue the measurement cycle if the waveform integral developed by the microprocessor for pressure waveforms at each counterpressure level met the criterion set by the predicted area data value for each corresponding counterpressure level.
- program 300determines one area data value for counterpressure level 78 by a portion of the program yet to be described, the microprocessor directs valve 22 to reduce counterpressure to a next counterpressure level 80.
- prediction and determination processwould be repeated at counterpressure level 80.
- the processwould repeat for subsequent counterpressure levels provided each waveform integral of each pulsation waveform at each subsequent cuff counterpressure level fell within the bounds of a predicted waveform-specific area data value (predicted by the microprocessor under the direction of second artifact rejection technique 42).
- FIG. 2Ashows how the present invention responds when a waveform integral of a pulsation waveform occurring at a counterpressure level does not fall within the bounds of a previously predicted area data value.
- a counterpressure level 82is shown with five blood pressure induced waveforms 82a-82e depicted thereon. Waveforms 82a, 82b are shown by solid lines in order to show a first scenario. Then, blood pressure induced waveform 82c is depicted by dot-dashed lines to represent a second scenario wherein waveform 82c occurs instead of waveform 82b, and further, wherein waveforms 82d, 82e would also occur at cuff counterpressure level 82.
- FIG. 2Adepicts waveform 82a as larger than previously accepted waveforms 78a, 80a in order to graphically represent that the developed waveform integral of waveform 82a is outside the bounds of the corresponding predicted waveform-specific area data value of waveform 82a.
- Program 300rejects the waveform integral of waveform 82a because the value is outside the bounds of the previously predicted waveform-specific area data value for waveform 82a.
- waveform 82ais substantially larger than previously accepted waveforms 78a, 80a
- the developed waveform integral of waveform 82awould be rejected by the microprocessor under the direction of Program 300 because it is greater than the upper bounds of the previously predicted waveform-specific area data value for waveform 82a.
- Program 300 of FIG. 3determines whether to accept the waveform integral at the third and subsequent counterpressure levels will be described following the description of FIG. 2B.
- waveform 82acould be substantially smaller than previously accepted waveform 78a, 80a. Then, the developed waveform integral for this hypothetical, undepicted waveform 82a would be rejected by the microprocessor because the measured area data value would be outside the lower bounds of the previously predicted waveform-specific area data value for this hypothetical, undepicted waveform 82a.
- microprocessor 31determines whether the integral of waveform 82b is within the bounds of its corresponding predicted area data value (remember that microprocessor 31 predicts the area data value according to technique 42 and determines whether to accept the integral of waveform 82b under the direction of yet-to-be-described portion of Program 300).
- waveform 82bis substantially the same size as previously accepted waveforms 78a, 80a. This graphically depicts that the integral of waveform 82b is accepted by the microprocessor because the measured area data value falls within the bounds of the predicted waveform-specific area data value.
- microprocessor 31directs valve 22 to reduce counterpressure by a next increment.
- the same processwould repeat, including predicting a subsequent, expected-to-be-stored waveform-specific area data value, developing a waveform integral for a next-occurring pressure waveform, and determining whether the waveform integral of the waveform falls within the bounds of the predicted waveform-specific area data value.
- FIG. 2Adepicts waveforms 82c, 82d, 82e as also substantially larger than previously accepted waveforms 78a, 80ain order to graphically depict that the corresponding, developed waveform integrals of waveforms 82c, 82d, 82e are outside the bounds of the corresponding predicted area data value for counterpressure level 82.
- microprocessor 31would reject the waveform integrals of waveforms 82c, 82d, 82e because the measured area data values would be outside the bounds of the predicted area data value.
- microprocessordirects valve 22 to stay at counterpressure level 82 and continues to develop waveform integrals for subsequently occurring pulsation waveforms.
- FIG. 2Adepicts a fragmented portion of counterpressure level 82 by dot-dashed lines in order to show that the aforementioned, developing, predicting, and determining steps carried out by microprocessor 31 under the direction of the corresponding programs would repeat, until either a developed waveform integral of a waveform was accepted by the microprocessor because it was within the bounds of the predicted area data value, or until time period "T" occurred as shown in FIG. 2A.
- time period "T”occurs without the microprocessor having accepted a waveform integral of a subsequently occurring waveform at counterpressure level 82, then the apparatus would abort the entire measuring cycle, and the microprocessor would direct valve 22 to deflate cuff 14.
- the preferred practice of the present inventionis to use a 30 second time period as time "T”.
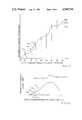
- FIGS. 2B-2Dthree graphs of waveform-specific area data values vs. cuff counterpressure levels are shown.
- FIGS. 2B and 2Care fragmented graphs wherein the vertical spread of points are exaggerated in order to graphically depict the operation of second artifact rejection technique 42 and data smoother 46.
- FIG. 2Bcuff counterpressure levels 72-82 are shown wherein solid points 74I-82I correspond to developed waveform integrals for each counterpressure level. Further, referring to FIG. 2B, solid points 74I and 76I also correspond to stored waveform-specific area data values determined by microprocessor 31 for counterpressure levels 74, 76 according to the previously described portion of Program 300 of FIG. 3. There is no corresponding waveform-specific area data value for cuff counterpressure level 72 because, as discussed in FIG. 2A, no blood pressure induced waveform occurred at counterpressure level 72 because it was above systolic pressure.
- second artifact rejection technique 42directs the microprocessor to predict a subsequent, expected-to-be-stored waveform-specific area data value 78P.
- the specific algorithms used to predict subsequent, expected-to-be-stored waveform-specific area dataare called Kalman equations because they are based on the previously noted “Kalman Filter theory " For a discussion of the Kalman equations necessary to second artifact rejection technique 42, see Geld, Arthur, Applied Optimal Estimation, MIT Press, 1974.
- a i , A i-1are waveform-specific data values at the current and previous cuff counterpressure levels, i.e. occurring at times T i , and T i-1 ; and A s1 , A s2 , and A s3 are the first, second, and third estimates of A i-1 based on what has been described as data "smoothing".
- the identity matricesaugment the state transition matrix to provide for what is known in the art as "fixed lag smoothing".
- fixed lag smoothingFor a discussion of the algorithms that are used in the invention to direct the microprocessor's data adjustments, see the discussion of fixed lag smoothing in Ch. 7.3 of Anderson and Moore, Estimation Theory, Prentice Hall, 1979.
- Applicantsmodified the state transition matrix to a 5 ⁇ 5 matrix defined as: ##EQU2## where "a” and “b” are constants based on a second order critically damped model of the system, and two identity matrices are provided, one in the first and second columns of the second and third row, and one in the third and fourth columns of the fourth and fifth rows.
- a second artifact rejection technique programdirects the microprocessor to predict value 78P based on a prediction curve that microprocessor 31 generates from area data values 74, 76.
- the second artifact rejection technique programdirects the microprocessor to set upper and lower bounds for predicted waveform-specific area data value 78P. These bounds are shown by upper bound bar 78UB and lower bound bar 78LB.
- the microprocessordevelops a waveform integral 78I of pulsation waveform 78a (depicted in FIG. 2A).
- microprocessor 31checks, under the direction of soon-to-be-described portion of program 300, whether developed waveform integral 78I is within upper bounds 78UB and lower bounds 78LB
- second waveform area data evaluator 38accepts waveform-specific area data value 78I because it falls within upper bounds 78UB and lower bounds 78LB.
- second artifact rejection technique programdirects the microprocessor to calculate updated area data value 78U based on the difference between waveform integral 78I and predicted area data value 78P. Further, the microprocessor adjusts area data values 74I, 76I so that a first (undepicted) smoothed curve is generated through adjusted waveform-specific area data values 74A 1 , 76A 1 , and updated waveform-specific area data value 78U.
- the microprocessorrepeats the process for cuff counterpressure level 80.
- the microprocessorunder the direction of the second artifact rejection technique program accepts a developed waveform integral 80I because it falls within upper bounds 80UB and lower bounds 80LB of predicted, expected-to-be-stored waveform-specific area data value 80P.
- the microprocessorcalculates an updated area data value 80U, and adjusts once-adjusted area data values 74A, 76A, of counterpressure levels 74, 76 to twice-adjusted area data values 74A 2 , 76A 2 .
- the microprocessoradjusts value 78I to value 78A 1 .
- the microprocessorgenerates a second (undepicted) adjusted curve through points 74A 2 , 76A 2 , and 78A 1 .
- the microprocessorpredicts a subsequent, expected-to-be-stored waveform-specific area data value 82P for cuff counterpressure level 82.
- the microprocessordoes not accept developed waveform integral 82I because it is outside upper bound 82UB of predicted waveform-specific area data value 82P.
- the microprocessorthen develops an integral of second waveform 82b at counterpressure level 82. Further, the microprocessor checks whether the developed integral of waveform 82b was within bounds 82UB, 82LB. If, as shown in the first scenario of FIG. 2A at counterpressure level 82, waveform 82B was processed, and its developed integral was within bounds 82UB, 82LB, then microprocessor directs valve 22 to decrease counterpressure to next level 84.
- the microprocessorrejects developed integrals of pulsation waveforms 82C-82E because they are outside bounds 82UB, 82LB.
- decision block 358 (D16)asks whether a waveform integral developed by the microprocessor for a pulsation waveform is less than or equal to the upper bounds of the present counterpressure level's predicted waveform-specific area data value.
- decision block 358 (D16)In order to graphically depict what decision block 358 (D16) concerns, reference is made to the discussion of predicted waveform-specific area data value 78P of cuff counterpressure level 78 depicted in FIG. 2B.
- the reference to a predicted area data value and the upper bounds of a predicted area data value in decision block 358 (D16)refers to values 78P and 78UB of FIG. 2B.
- task block 360labels the program for Waveform Beginning Program 200 and the program exits to Kernel so that microprocessor 31 will monitor a next blood pressure induced waveform at the same, present counterpressure level.
- FIG. 2B and FIG. 2Athe microprocessor processes waveform 82A of FIG. 2A and develops a waveform integral represented by point 82I of FIG. 2B. Further, integral 82I is outside upper bounds 82UB of predicted area data value 82P. This, event graphically depicts what happens when the answer to decision block 358 (D16) is no.
- task block 360 (T13)labels the program for Waveform Beginning Program 200 so that a next waveform will be processed at counterpressure level 82. This next waveform is shown as waveform 82B of FIG. 2A.
- decision block 362(D17) asks whether the present, developed waveform integral is greater than or equal to the lower bounds of the present counterpressure level's predicted area data value. If the answer to decision block 362 (D17) is no, then task block 360 (T13) again labels the program for Waveform Beginning Program 200 and the program exits to Kernel so that microprocessor 31 will process a next pulsation waveform at the present counterpressure level.
- FIG. 2Band specifically to lower bounds 78LB of predicted waveform-specific area data value 78P of cuff counterpressure level 78 for an example of the lower bounds criterion represented in decision block 362 (D17).
- task block 364(T14) stores the integral as the waveform-specific area data value for the counterpressure level
- task block 366(T15) stores the corresponding counterpressure level value at which the pulsation waveform represented by the integral occurred.
- task block 368(T16) labels the program ready for a next counterpressure level and the program exits to Kernel 308 so that microprocessor 31 will signal pressure control 44 to decrease counterpressure by a next increment of 51/3-mm Hg.
- FIG. 2Ca second fragmented graph of waveform-specific area data vs. cuff counterpressure levels is shown wherein corresponding predicted, developed, updated, and adjusted waveform-specific area data values are calculated and developed by the process outlined in the discussion of FIG. 2B.
- the microprocessoradjusts waveform-specific area data values for counterpressure levels relative to a present counterpressure level.
- adjusted waveform-specific area data value 78A5is the final waveform-specific area data value for counterpressure level 78.
- adjusted waveform-specific area data values 74A 4 and 76A 5are the final waveform-specific area data values for counterpressure levels 74, 76, respectively.
- the microprocessorgenerates a fifth adjusted curve 94 connecting all final waveform-specific area data values.
- the fifth adjusted curveis partially shown by dot-dashed lines connecting final waveform-specific area data values 74A 4 , 76A 5 , and 78A 5 .
- FIG. 2Da graph of waveform-specific area data vs. cuff counterpressure levels for the entire measurement cycle of living test subject 18 is shown.
- the microprocessorAfter monitoring the ending counterpressure level, the microprocessor generates fifth adjusted curve 94 for the final waveform-specific area data values of each counterpressure level monitored.
- fifth adjusted curve 94passes through final waveform-specific area data values 74A 4 , 76A 5 , and 78A 5 of counterpressure levels 74, 76, 78, respectively.
- the microprocessoris directed by a program to determine desired blood pressure parameters by what has previously been described as determiner 48.
- the microprocessordetermines MAP as the lowest counterpressure level with the greatest final area data value. Further, the microprocessor determines the systolic and diastolic pressure of subject 18 as the counterpressure levels corresponding to waveform-specific area data values of fifth adjusted curve 94 that have an experimentally determined fractional relationship with the greatest area data value corresponding to MAP.
- Systolic pressureis determined herein as the counterpressure level above MAP corresponding to the waveform-specific area data value on fifth adjusted curve 94 that is sixty percent of the MAP waveform-specific area data value.
- Diastolic pressureis determined as the waveform-specific area data value corresponding to a counterpressure level below MAP wherein the area data value on fifth adjusted curve 94 is eighty percent of the value of the MAP waveform-specific area data value.
- the method of the present inventionemploys a unique technique of "pulse-prediction” and “pulse-adjustment” after development of waveform data values for a predetermined number of cuff counterpressure levels at the beginning of a blood pressure measuring cycle.
- a next, expected-to-be-encountered data value for a next, lower cuff counterpressure levelis predicted.
- a waveform data valueis developed for an actually measured waveform at the next cuff counterpressure level, and this waveform data value is checked for acceptability as bloodpressure induced data by determining whether the waveform data value is within experimentally set upper and lower bounds of its corresponding predicted value.
- the preferred practice of the present inventionis to decrease counterpressure to a next level and repeat the above-described steps.
- the preferred practice of the present inventionemploys "pulse-adjustment" by adjusting previously developed and stored waveform data values based on the difference between a measured waveform data value and a corresponding predicted waveform data value for a given cuff counterpressure level.
- Such "pulse-adjustment”can be used to "smooth" the above-described curve that has been fitted from previously developed waveform data values.
Landscapes
- Health & Medical Sciences (AREA)
- Life Sciences & Earth Sciences (AREA)
- Cardiology (AREA)
- Engineering & Computer Science (AREA)
- Vascular Medicine (AREA)
- Molecular Biology (AREA)
- Animal Behavior & Ethology (AREA)
- Pathology (AREA)
- Physics & Mathematics (AREA)
- Biomedical Technology (AREA)
- Heart & Thoracic Surgery (AREA)
- Medical Informatics (AREA)
- Physiology (AREA)
- Surgery (AREA)
- Biophysics (AREA)
- General Health & Medical Sciences (AREA)
- Public Health (AREA)
- Veterinary Medicine (AREA)
- Ophthalmology & Optometry (AREA)
- Signal Processing (AREA)
- Artificial Intelligence (AREA)
- Computer Vision & Pattern Recognition (AREA)
- Psychiatry (AREA)
- Measuring Pulse, Heart Rate, Blood Pressure Or Blood Flow (AREA)
Abstract
Description
TABLE V-FIG. 3 ______________________________________ D1 Is the Microprocessor Monitoring First Cuff Counterpressure Level? D2 Is the Microprocessor Monitoring Second Cuff Counterpressure Level? D3 Has the Microprocessor Developed 2 Waveform Integrals? D4 Is Sample (N) = 1st Waveform Integral D5 Is WF1 > WF2? D6 Is WF2 > WF3? D7 Is WF2 > WF3? D8 Is (WF1-WF2) > (WF2 - (WF3?) D9 Is WF1 > WF3? D10 Is (WF1 - WF3) > (WF3 - WF2)? D11 Is (WF3 - WF1) > (WF1 - WF2)? D12 Is (WF3 - WF2) > (WF2 -WF1)? D13 Is WF1 > WF3? D14 Is (WF2 - WF1) > (WF1 - WF3)? D15 Is (WF2 - WF3) > (WF3 - WF1)? D16 Is Sample (N) ≦ Upper Bound of Predicted Value D17 Is Sample (N) ≧ Lower Bound of Predicted Value T1 Initialize Waveform Integral (N) as WF1 T2 Initialize Waveform Integral (N) as WF2 T3 Go to Waveform Beginning Program; Set Program Count = 0 T4 Initialize Waveform Integral (N) as WF3 T5 Average WF2 and WF3 = (WF2 + WF3)/2 T6 Average WF1 and WF2 = (WF1 + WF2)/2 T7 Average WF1 and WF3 = (WF1 + WF3)/2 T8 Average WF1 and WF2 = (WF1 + WF2)/2 T9 Average WF1 and WF2 = (WF1 + WF2)/2 T10 Average WF2 and WF3 = (WF2 + WF3)/2 T11 Average WF1 and WF3 = (WF1 + WF3)/2 T12 Average WF3 and WF2 = (WF3 + WF2)/2 T13 Go to Waveform Beginning Program; Set Program Count =0 T14 Store Waveform Integral (N) T15 Store Baseline Counterpressure (N) T16 Decrease to next Baseline Counterpressure ______________________________________
X=[A.sub.i, A.sub.i-1, A.sub.s1, A.sub.s2, A.sub.s3 ]T
Claims (19)
Priority Applications (1)
| Application Number | Priority Date | Filing Date | Title |
|---|---|---|---|
| US07/254,204US4949710A (en) | 1988-10-06 | 1988-10-06 | Method of artifact rejection for noninvasive blood-pressure measurement by prediction and adjustment of blood-pressure data |
Applications Claiming Priority (1)
| Application Number | Priority Date | Filing Date | Title |
|---|---|---|---|
| US07/254,204US4949710A (en) | 1988-10-06 | 1988-10-06 | Method of artifact rejection for noninvasive blood-pressure measurement by prediction and adjustment of blood-pressure data |
Publications (1)
| Publication Number | Publication Date |
|---|---|
| US4949710Atrue US4949710A (en) | 1990-08-21 |
Family
ID=22963332
Family Applications (1)
| Application Number | Title | Priority Date | Filing Date |
|---|---|---|---|
| US07/254,204Expired - LifetimeUS4949710A (en) | 1988-10-06 | 1988-10-06 | Method of artifact rejection for noninvasive blood-pressure measurement by prediction and adjustment of blood-pressure data |
Country Status (1)
| Country | Link |
|---|---|
| US (1) | US4949710A (en) |
Cited By (64)
| Publication number | Priority date | Publication date | Assignee | Title |
|---|---|---|---|---|
| US5054494A (en)* | 1989-12-26 | 1991-10-08 | U.S. Medical Corporation | Oscillometric blood pressure device |
| EP0535449A1 (en)* | 1991-09-30 | 1993-04-07 | Siemens Medical Systems, Inc. | Air flow control apparatus and method for an automatic blood pressure gauge |
| US5224484A (en)* | 1992-01-17 | 1993-07-06 | Siemens Medical Electronics, Inc. | Pressure signal processing apparatus and method for an automatic blood pressure gauge |
| US5240008A (en)* | 1991-09-30 | 1993-08-31 | Siemens Medical Electronics, Inc. | Inflation control apparatus for an automatic blood pressure gauge |
| EP0581313A1 (en)* | 1992-07-30 | 1994-02-02 | Spacelabs Medical, Inc. | Automatic blood pressure monitor employing artifact rejection method and apparatus |
| US5316005A (en)* | 1990-05-17 | 1994-05-31 | Mitsuei Tomita | Apparatus for detecting and displaying blood ciculatory information |
| US5355890A (en)* | 1992-01-17 | 1994-10-18 | Siemens Medical Electronics, Inc. | Pulse signal extraction apparatus for an automatic blood pressure gauge |
| US5406954A (en)* | 1992-01-13 | 1995-04-18 | Tomita; Mitsuei | Apparatus for detecting and displaying blood circulatory information |
| WO1996011628A1 (en)* | 1994-10-12 | 1996-04-25 | Tovarischestvo S Ogranichennoi Otvetstvennostju 'russky Tsentr Perspektivnykh Tekhnology' (Russintsentr' | Oscillometric method of determining basic haemodynamic parameters in a patient's arterial circulation and a measuring system for carrying out said method |
| US5518000A (en)* | 1994-09-30 | 1996-05-21 | Johnson & Johnson Medical, Inc. | Oscillometric blood pressure monitor employing deflation periods of alternating durations |
| US5560366A (en)* | 1993-11-29 | 1996-10-01 | Colin Corporation | Oscillometric blood pressure measuring apparatus |
| US5577508A (en)* | 1995-01-13 | 1996-11-26 | Johnson & Johnson Medical, Inc. | Determination of oscillometric blood pressure by linear approximation |
| US5579776A (en)* | 1995-01-13 | 1996-12-03 | Johnson & Johnson Medical, Inc. | Oscillometric blood pressure monitor with enhanced cuff pressure control |
| US5590662A (en)* | 1995-02-15 | 1997-01-07 | Johnson & Johnson Medical, Inc. | Detection of oscillometric blood pressure complexes using correlation |
| US5606977A (en)* | 1995-01-04 | 1997-03-04 | Critikon, Inc. | Oscillometric blood pressure monitor which automatically determines when to take blood pressure measurements |
| US5649536A (en)* | 1994-02-25 | 1997-07-22 | Colin Corporation | Blood pressure measuring apparatus |
| US5651369A (en)* | 1992-01-13 | 1997-07-29 | Tomita; Mitsuei | Apparatus for detecting and displaying blood circulatory information |
| US5680870A (en)* | 1995-01-04 | 1997-10-28 | Johnson & Johnson Medical, Inc. | Oscillometric blood pressure monitor which acquires blood pressure signals from composite arterial pulse signal |
| US5704362A (en)* | 1993-08-13 | 1998-01-06 | Johnson & Johnson Medical, Inc. | Method for oscillometric blood pressure determination employing curve fitting |
| US5752919A (en)* | 1996-12-17 | 1998-05-19 | Johnson & Johnson Medical, Inc. | Mitigation of respiratory artifact in blood pressure signal using line segment smoothing |
| US5800359A (en)* | 1995-05-19 | 1998-09-01 | Johnson & Johnson Medical, Inc. | NIBP playback system |
| US5853364A (en)* | 1995-08-07 | 1998-12-29 | Nellcor Puritan Bennett, Inc. | Method and apparatus for estimating physiological parameters using model-based adaptive filtering |
| WO1999004140A1 (en) | 1997-07-17 | 1999-01-28 | Protocol Systems, Inc. | Volumetric-displacement device having molded pistons and cylinders |
| US5993396A (en)* | 1998-02-11 | 1999-11-30 | Critikon Company, L.L.C. | Method and apparatus for determining a minimum wait time between blood pressure determinations |
| US6017313A (en)* | 1998-03-20 | 2000-01-25 | Hypertension Diagnostics, Inc. | Apparatus and method for blood pressure pulse waveform contour analysis |
| US6045510A (en)* | 1994-02-25 | 2000-04-04 | Colin Corporation | Blood pressure measuring apparatus |
| US6132383A (en)* | 1998-03-20 | 2000-10-17 | Hypertension Diagnostics, Inc. | Apparatus for holding and positioning an arterial pulse pressure sensor |
| US6159166A (en)* | 1998-03-20 | 2000-12-12 | Hypertension Diagnostics, Inc. | Sensor and method for sensing arterial pulse pressure |
| US6331161B1 (en) | 1999-09-10 | 2001-12-18 | Hypertension Diagnostics, Inc | Method and apparatus for fabricating a pressure-wave sensor with a leveling support element |
| WO2001085014A3 (en)* | 2000-05-10 | 2002-04-11 | Motorola Inc | Method for obtaining blood pressure data from optical sensor |
| US6440080B1 (en) | 2001-09-25 | 2002-08-27 | Ge Medical Systems Information Technologies, Inc. | Automatic oscillometric apparatus and method for measuring blood pressure |
| US20020128544A1 (en)* | 1991-03-07 | 2002-09-12 | Diab Mohamed K. | Signal processing apparatus |
| US6517495B1 (en) | 2001-09-10 | 2003-02-11 | Ge Medical Systems Information Technologies, Inc. | Automatic indirect non-invasive apparatus and method for determining diastolic blood pressure by calibrating an oscillation waveform |
| WO2001097059A3 (en)* | 2000-06-16 | 2003-03-13 | Isis Innovation | Combining measurements from different sensors |
| US6648828B2 (en) | 2002-03-01 | 2003-11-18 | Ge Medical Systems Information Technologies, Inc. | Continuous, non-invasive technique for measuring blood pressure using impedance plethysmography |
| US6733461B2 (en) | 2002-08-01 | 2004-05-11 | Hypertension Diagnostics, Inc. | Methods and apparatus for measuring arterial compliance, improving pressure calibration, and computing flow from pressure data |
| US6746403B2 (en) | 2000-10-04 | 2004-06-08 | Ge Medical Systems Information Technologies, Inc. | Physiological-signal-analysis device for measuring a blood pressure and method |
| US6767328B2 (en) | 2002-07-31 | 2004-07-27 | Ge Medical Systems Information Technologies, Inc. | Method and apparatus for determining blood pressure using pressure pulse duty cycle |
| US20040167411A1 (en)* | 2003-02-25 | 2004-08-26 | Ge Medical Systems Information Technologies, Inc. | Oscillometric determination of blood pressure |
| US20040171943A1 (en)* | 2003-02-27 | 2004-09-02 | Ge Medical Systems Information Technologies, Inc. | Method and system for cuff pressure reversions |
| US20040181157A1 (en)* | 2003-03-13 | 2004-09-16 | Ge Medical Systems Information Technologies, Inc. | Artifact rejection using pulse quality values |
| US20040186386A1 (en)* | 2003-03-18 | 2004-09-23 | Ge Medical Systems Information Technologies, Inc. | Method and system for determination of pulse rate |
| US20040204637A1 (en)* | 1997-04-14 | 2004-10-14 | Diab Mohamed K. | Signal processing apparatus and method |
| US20040204638A1 (en)* | 1991-03-07 | 2004-10-14 | Diab Mohamed Kheir | Signal processing apparatus and method |
| US20040236196A1 (en)* | 1991-03-07 | 2004-11-25 | Diab Mohamed K. | Signal processing apparatus |
| US20050004477A1 (en)* | 2003-07-03 | 2005-01-06 | Friedman Bruce Arnold | Method and apparatus for measuring blood pressure using relaxed matching criteria |
| US20050027205A1 (en)* | 2001-12-14 | 2005-02-03 | Lionel Tarassenko | Combining measurements from breathing rate sensors |
| DE4300343B4 (en)* | 1992-01-21 | 2005-06-09 | Draeger Medical Systems, Inc. | sphygmomanometer |
| US20050261597A1 (en)* | 2004-05-18 | 2005-11-24 | Sai Kolluri | Method and apparatus for determining extreme blood pressure values |
| US7194293B2 (en) | 2004-03-08 | 2007-03-20 | Nellcor Puritan Bennett Incorporated | Selection of ensemble averaging weights for a pulse oximeter based on signal quality metrics |
| US20070118036A1 (en)* | 2005-11-21 | 2007-05-24 | Hersh Lawrence T | Computation of blood pressure using different signal processing channels |
| US20070123784A1 (en)* | 2005-11-30 | 2007-05-31 | Hersh Lawrence T | Method of controlling blood pressure cuff deflation |
| US7300404B1 (en) | 2006-09-07 | 2007-11-27 | The General Electric Company | Method and system utilizing SpO2 plethysmograph signal to qualify NIBP pulses |
| US20080045846A1 (en)* | 2006-08-16 | 2008-02-21 | Friedman Bruce A | Method and system of determining nibp target inflation pressure using an sp02 plethysmograph signal |
| US20080082006A1 (en)* | 2006-09-07 | 2008-04-03 | Sai Kolluri | METHOD AND SYSTEM UTILIZING SpO2 PLETHYSMOGRAPH SIGNAL TO REDUCE NIBP DETERMINATION TIME |
| US7376453B1 (en) | 1993-10-06 | 2008-05-20 | Masimo Corporation | Signal processing apparatus |
| US20100249616A1 (en)* | 2009-03-26 | 2010-09-30 | The General Electric Company | Nibp target inflation pressure automation using derived spo2 signals |
| US8019400B2 (en) | 1994-10-07 | 2011-09-13 | Masimo Corporation | Signal processing apparatus |
| US8560034B1 (en) | 1993-10-06 | 2013-10-15 | Masimo Corporation | Signal processing apparatus |
| US9301700B2 (en) | 2012-09-27 | 2016-04-05 | Welch Allyn, Inc. | Configurable vital signs system |
| CN109464136A (en)* | 2018-11-29 | 2019-03-15 | 东莞市康助医疗科技有限公司 | A kind of arterial stiffness display methods, system and device |
| CN110623651A (en)* | 2019-09-25 | 2019-12-31 | 江苏盖睿健康科技有限公司 | Method and device for processing measurement data of cuff pressure oscillation wave |
| US11071467B2 (en) | 2013-08-08 | 2021-07-27 | Welch Allyn, Inc. | Hybrid patient monitoring system |
| US11406272B2 (en)* | 2014-02-18 | 2022-08-09 | Welch Allyn, Inc. | Systems and methods for blood pressure measurement |
Citations (12)
| Publication number | Priority date | Publication date | Assignee | Title |
|---|---|---|---|---|
| US3791378A (en)* | 1971-04-01 | 1974-02-12 | Hoffmann La Roche | Blood pressure monitor with rate sensing artifact rejection processing circuitry |
| US4174707A (en)* | 1976-12-27 | 1979-11-20 | American Optical Corporation | Apparatus and process for antifact rejection through cross correlation in sphygmometry |
| US4263918A (en)* | 1977-03-21 | 1981-04-28 | Biomega Corporation | Methods of and apparatus for the measurement of blood pressure |
| US4349034A (en)* | 1978-04-10 | 1982-09-14 | Johnson & Johnson | Automatic mean blood pressure reading device |
| US4360029A (en)* | 1978-04-10 | 1982-11-23 | Johnson & Johnson | Automatic mean blood pressure reading device |
| US4367751A (en)* | 1976-12-27 | 1983-01-11 | Warner-Lambert Company | Apparatus and process for producing artifact effect on sphygmometric information |
| US4543962A (en)* | 1984-07-09 | 1985-10-01 | Critikon, Inc. | Method of automated blood pressure detection |
| US4546775A (en)* | 1984-06-18 | 1985-10-15 | Critikon, Inc. | Detection of blood pressure complexes in automated vital signs monitors |
| US4638810A (en)* | 1985-07-05 | 1987-01-27 | Critikon, Inc. | Automated diastolic blood pressure monitor with data enhancement |
| US4703760A (en)* | 1985-03-15 | 1987-11-03 | Omron Tateisi Electronics Co. | Electronic blood pressure measuring device |
| US4754761A (en)* | 1985-07-05 | 1988-07-05 | Critikon, Inc. | Automated mean arterial blood pressure monitor with data enhancement |
| US4796184A (en)* | 1986-08-01 | 1989-01-03 | Cas Medical Systems, Inc. | Automatic blood pressure measuring device and method |
- 1988
- 1988-10-06USUS07/254,204patent/US4949710A/ennot_activeExpired - Lifetime
Patent Citations (12)
| Publication number | Priority date | Publication date | Assignee | Title |
|---|---|---|---|---|
| US3791378A (en)* | 1971-04-01 | 1974-02-12 | Hoffmann La Roche | Blood pressure monitor with rate sensing artifact rejection processing circuitry |
| US4174707A (en)* | 1976-12-27 | 1979-11-20 | American Optical Corporation | Apparatus and process for antifact rejection through cross correlation in sphygmometry |
| US4367751A (en)* | 1976-12-27 | 1983-01-11 | Warner-Lambert Company | Apparatus and process for producing artifact effect on sphygmometric information |
| US4263918A (en)* | 1977-03-21 | 1981-04-28 | Biomega Corporation | Methods of and apparatus for the measurement of blood pressure |
| US4349034A (en)* | 1978-04-10 | 1982-09-14 | Johnson & Johnson | Automatic mean blood pressure reading device |
| US4360029A (en)* | 1978-04-10 | 1982-11-23 | Johnson & Johnson | Automatic mean blood pressure reading device |
| US4546775A (en)* | 1984-06-18 | 1985-10-15 | Critikon, Inc. | Detection of blood pressure complexes in automated vital signs monitors |
| US4543962A (en)* | 1984-07-09 | 1985-10-01 | Critikon, Inc. | Method of automated blood pressure detection |
| US4703760A (en)* | 1985-03-15 | 1987-11-03 | Omron Tateisi Electronics Co. | Electronic blood pressure measuring device |
| US4638810A (en)* | 1985-07-05 | 1987-01-27 | Critikon, Inc. | Automated diastolic blood pressure monitor with data enhancement |
| US4754761A (en)* | 1985-07-05 | 1988-07-05 | Critikon, Inc. | Automated mean arterial blood pressure monitor with data enhancement |
| US4796184A (en)* | 1986-08-01 | 1989-01-03 | Cas Medical Systems, Inc. | Automatic blood pressure measuring device and method |
Cited By (149)
| Publication number | Priority date | Publication date | Assignee | Title |
|---|---|---|---|---|
| US5054494A (en)* | 1989-12-26 | 1991-10-08 | U.S. Medical Corporation | Oscillometric blood pressure device |
| US5316005A (en)* | 1990-05-17 | 1994-05-31 | Mitsuei Tomita | Apparatus for detecting and displaying blood ciculatory information |
| US7383070B2 (en) | 1991-03-07 | 2008-06-03 | Masimo Corporation | Signal processing apparatus |
| US8046042B2 (en) | 1991-03-07 | 2011-10-25 | Masimo Corporation | Signal processing apparatus |
| US20040236196A1 (en)* | 1991-03-07 | 2004-11-25 | Diab Mohamed K. | Signal processing apparatus |
| US7215984B2 (en) | 1991-03-07 | 2007-05-08 | Masimo Corporation | Signal processing apparatus |
| US7254433B2 (en) | 1991-03-07 | 2007-08-07 | Masimo Corporation | Signal processing apparatus |
| US7937130B2 (en) | 1991-03-07 | 2011-05-03 | Masimo Corporation | Signal processing apparatus |
| US20040204638A1 (en)* | 1991-03-07 | 2004-10-14 | Diab Mohamed Kheir | Signal processing apparatus and method |
| US7454240B2 (en) | 1991-03-07 | 2008-11-18 | Masimo Corporation | Signal processing apparatus |
| US8948834B2 (en) | 1991-03-07 | 2015-02-03 | Masimo Corporation | Signal processing apparatus |
| US8942777B2 (en) | 1991-03-07 | 2015-01-27 | Masimo Corporation | Signal processing apparatus |
| US20020128544A1 (en)* | 1991-03-07 | 2002-09-12 | Diab Mohamed K. | Signal processing apparatus |
| US20040204636A1 (en)* | 1991-03-07 | 2004-10-14 | Diab Mohamed K. | Signal processing apparatus |
| US8364226B2 (en) | 1991-03-07 | 2013-01-29 | Masimo Corporation | Signal processing apparatus |
| US8128572B2 (en) | 1991-03-07 | 2012-03-06 | Masimo Corporation | Signal processing apparatus |
| US8046041B2 (en) | 1991-03-07 | 2011-10-25 | Masimo Corporation | Signal processing apparatus |
| US20040210146A1 (en)* | 1991-03-07 | 2004-10-21 | Diab Mohamed K. | Signal processing apparatus |
| US8036728B2 (en) | 1991-03-07 | 2011-10-11 | Masimo Corporation | Signal processing apparatus |
| US7469157B2 (en) | 1991-03-07 | 2008-12-23 | Masimo Corporation | Signal processing apparatus |
| US7509154B2 (en) | 1991-03-07 | 2009-03-24 | Masimo Corporation | Signal processing apparatus |
| US7962190B1 (en) | 1991-03-07 | 2011-06-14 | Masimo Corporation | Signal processing apparatus |
| US7530955B2 (en) | 1991-03-07 | 2009-05-12 | Masimo Corporation | Signal processing apparatus |
| US5337751A (en)* | 1991-09-30 | 1994-08-16 | Siemens Medical Electronics, Inc. | Air flow control apparatus and method for an automatic blood pressure gauge |
| US5240008A (en)* | 1991-09-30 | 1993-08-31 | Siemens Medical Electronics, Inc. | Inflation control apparatus for an automatic blood pressure gauge |
| DE4230693B4 (en)* | 1991-09-30 | 2004-06-09 | Siemens Ag | sphygmomanometer |
| EP0535449A1 (en)* | 1991-09-30 | 1993-04-07 | Siemens Medical Systems, Inc. | Air flow control apparatus and method for an automatic blood pressure gauge |
| US5651369A (en)* | 1992-01-13 | 1997-07-29 | Tomita; Mitsuei | Apparatus for detecting and displaying blood circulatory information |
| US5406954A (en)* | 1992-01-13 | 1995-04-18 | Tomita; Mitsuei | Apparatus for detecting and displaying blood circulatory information |
| US5355890A (en)* | 1992-01-17 | 1994-10-18 | Siemens Medical Electronics, Inc. | Pulse signal extraction apparatus for an automatic blood pressure gauge |
| US5224484A (en)* | 1992-01-17 | 1993-07-06 | Siemens Medical Electronics, Inc. | Pressure signal processing apparatus and method for an automatic blood pressure gauge |
| DE4300343B4 (en)* | 1992-01-21 | 2005-06-09 | Draeger Medical Systems, Inc. | sphygmomanometer |
| US5337750A (en)* | 1992-07-30 | 1994-08-16 | Spacelabs Medical, Inc. | Automatic blood pressure monitor employing artifact rejection method and apparatus |
| EP0581313A1 (en)* | 1992-07-30 | 1994-02-02 | Spacelabs Medical, Inc. | Automatic blood pressure monitor employing artifact rejection method and apparatus |
| US5704362A (en)* | 1993-08-13 | 1998-01-06 | Johnson & Johnson Medical, Inc. | Method for oscillometric blood pressure determination employing curve fitting |
| US7328053B1 (en) | 1993-10-06 | 2008-02-05 | Masimo Corporation | Signal processing apparatus |
| US7376453B1 (en) | 1993-10-06 | 2008-05-20 | Masimo Corporation | Signal processing apparatus |
| US8560034B1 (en) | 1993-10-06 | 2013-10-15 | Masimo Corporation | Signal processing apparatus |
| US5560366A (en)* | 1993-11-29 | 1996-10-01 | Colin Corporation | Oscillometric blood pressure measuring apparatus |
| US6413224B1 (en) | 1994-02-25 | 2002-07-02 | Colin Corporation | Blood pressure measuring apparatus |
| US6045510A (en)* | 1994-02-25 | 2000-04-04 | Colin Corporation | Blood pressure measuring apparatus |
| US5836888A (en)* | 1994-02-25 | 1998-11-17 | Colin Corporation | Blood pressure measuring apparatus |
| US5649536A (en)* | 1994-02-25 | 1997-07-22 | Colin Corporation | Blood pressure measuring apparatus |
| US5518000A (en)* | 1994-09-30 | 1996-05-21 | Johnson & Johnson Medical, Inc. | Oscillometric blood pressure monitor employing deflation periods of alternating durations |
| US8126528B2 (en) | 1994-10-07 | 2012-02-28 | Masimo Corporation | Signal processing apparatus |
| US8359080B2 (en) | 1994-10-07 | 2013-01-22 | Masimo Corporation | Signal processing apparatus |
| US8755856B2 (en) | 1994-10-07 | 2014-06-17 | Masimo Corporation | Signal processing apparatus |
| US8019400B2 (en) | 1994-10-07 | 2011-09-13 | Masimo Corporation | Signal processing apparatus |
| US8463349B2 (en) | 1994-10-07 | 2013-06-11 | Masimo Corporation | Signal processing apparatus |
| WO1996011628A1 (en)* | 1994-10-12 | 1996-04-25 | Tovarischestvo S Ogranichennoi Otvetstvennostju 'russky Tsentr Perspektivnykh Tekhnology' (Russintsentr' | Oscillometric method of determining basic haemodynamic parameters in a patient's arterial circulation and a measuring system for carrying out said method |
| US5606977A (en)* | 1995-01-04 | 1997-03-04 | Critikon, Inc. | Oscillometric blood pressure monitor which automatically determines when to take blood pressure measurements |
| US5680870A (en)* | 1995-01-04 | 1997-10-28 | Johnson & Johnson Medical, Inc. | Oscillometric blood pressure monitor which acquires blood pressure signals from composite arterial pulse signal |
| US5579776A (en)* | 1995-01-13 | 1996-12-03 | Johnson & Johnson Medical, Inc. | Oscillometric blood pressure monitor with enhanced cuff pressure control |
| US5577508A (en)* | 1995-01-13 | 1996-11-26 | Johnson & Johnson Medical, Inc. | Determination of oscillometric blood pressure by linear approximation |
| US5651370A (en)* | 1995-02-15 | 1997-07-29 | Johnson & Johnson Medical, Inc. | Detection of oscillometeric blood pressure complexes using correlation |
| US5590662A (en)* | 1995-02-15 | 1997-01-07 | Johnson & Johnson Medical, Inc. | Detection of oscillometric blood pressure complexes using correlation |
| US5800359A (en)* | 1995-05-19 | 1998-09-01 | Johnson & Johnson Medical, Inc. | NIBP playback system |
| US7865224B2 (en) | 1995-08-07 | 2011-01-04 | Nellcor Puritan Bennett Llc | Method and apparatus for estimating a physiological parameter |
| US20040181134A1 (en)* | 1995-08-07 | 2004-09-16 | Nellcor Puritan Bennett Incorporated | Pulse oximeter with parallel saturation calculation modules |
| US20110071375A1 (en)* | 1995-08-07 | 2011-03-24 | Nellcor Incorporated, A Delaware Corporation | Method and apparatus for estimating physiological parameters using model-based adaptive filtering |
| US7931599B2 (en) | 1995-08-07 | 2011-04-26 | Nellcor Puritan Bennett Llc | Method and apparatus for estimating a physiological parameter |
| US20040158135A1 (en)* | 1995-08-07 | 2004-08-12 | Nellcor Incorporated, A Delaware Corporation | Pulse oximeter sensor off detector |
| US20020137994A1 (en)* | 1995-08-07 | 2002-09-26 | Nellcor Incorporated, A Delaware Corporation | Method and apparatus for estimating physiological parameters using model-based adaptive filtering |
| US6083172A (en)* | 1995-08-07 | 2000-07-04 | Nellcor Puritan Bennett Incorporated | Method and apparatus for estimating physiological parameters using model-based adaptive filtering |
| US7130671B2 (en) | 1995-08-07 | 2006-10-31 | Nellcor Puritan Bennett Incorporated | Pulse oximeter sensor off detector |
| US6836679B2 (en) | 1995-08-07 | 2004-12-28 | Nellcor Puritan Bennett Incorporated | Method and apparatus for estimating physiological parameters using model-based adaptive filtering |
| US7302284B2 (en) | 1995-08-07 | 2007-11-27 | Nellcor Puritan Bennett Llc | Pulse oximeter with parallel saturation calculation modules |
| US20060183988A1 (en)* | 1995-08-07 | 2006-08-17 | Baker Clark R Jr | Pulse oximeter with parallel saturation calculation modules |
| US20050085735A1 (en)* | 1995-08-07 | 2005-04-21 | Nellcor Incorporated, A Delaware Corporation | Method and apparatus for estimating a physiological parameter |
| US7315753B2 (en) | 1995-08-07 | 2008-01-01 | Nellcor Puritan Bennett Llc | Pulse oximeter with parallel saturation calculation modules |
| US7336983B2 (en) | 1995-08-07 | 2008-02-26 | Nellcor Puritan Bennett Llc | Pulse oximeter with parallel saturation calculation modules |
| US20050124871A1 (en)* | 1995-08-07 | 2005-06-09 | Nellcor Puritan Bennett Incorporated | Pulse oximeter with parallel saturation calculation modules |
| US20050143634A1 (en)* | 1995-08-07 | 2005-06-30 | Nellcor Incorporated, A Delaware Corporation | Method and apparatus for estimating a physiological parameter |
| US5853364A (en)* | 1995-08-07 | 1998-12-29 | Nellcor Puritan Bennett, Inc. | Method and apparatus for estimating physiological parameters using model-based adaptive filtering |
| US5752919A (en)* | 1996-12-17 | 1998-05-19 | Johnson & Johnson Medical, Inc. | Mitigation of respiratory artifact in blood pressure signal using line segment smoothing |
| US20040204637A1 (en)* | 1997-04-14 | 2004-10-14 | Diab Mohamed K. | Signal processing apparatus and method |
| US8190227B2 (en) | 1997-04-14 | 2012-05-29 | Masimo Corporation | Signal processing apparatus and method |
| US7471971B2 (en) | 1997-04-14 | 2008-12-30 | Masimo Corporation | Signal processing apparatus and method |
| US20060200016A1 (en)* | 1997-04-14 | 2006-09-07 | Diab Mohamed K | Signal processing apparatus and method |
| US7489958B2 (en) | 1997-04-14 | 2009-02-10 | Masimo Corporation | Signal processing apparatus and method |
| US7499741B2 (en) | 1997-04-14 | 2009-03-03 | Masimo Corporation | Signal processing apparatus and method |
| US9289167B2 (en) | 1997-04-14 | 2016-03-22 | Masimo Corporation | Signal processing apparatus and method |
| US8180420B2 (en) | 1997-04-14 | 2012-05-15 | Masimo Corporation | Signal processing apparatus and method |
| US8888708B2 (en) | 1997-04-14 | 2014-11-18 | Masimo Corporation | Signal processing apparatus and method |
| WO1999004140A1 (en) | 1997-07-17 | 1999-01-28 | Protocol Systems, Inc. | Volumetric-displacement device having molded pistons and cylinders |
| US5993396A (en)* | 1998-02-11 | 1999-11-30 | Critikon Company, L.L.C. | Method and apparatus for determining a minimum wait time between blood pressure determinations |
| US6689069B2 (en) | 1998-03-20 | 2004-02-10 | Hypertension Diagnostics, Inc. | Apparatus and method for blood pressure pulse waveform contour analysis |
| US6132383A (en)* | 1998-03-20 | 2000-10-17 | Hypertension Diagnostics, Inc. | Apparatus for holding and positioning an arterial pulse pressure sensor |
| US6159166A (en)* | 1998-03-20 | 2000-12-12 | Hypertension Diagnostics, Inc. | Sensor and method for sensing arterial pulse pressure |
| US6017313A (en)* | 1998-03-20 | 2000-01-25 | Hypertension Diagnostics, Inc. | Apparatus and method for blood pressure pulse waveform contour analysis |
| US6394958B1 (en)* | 1998-03-20 | 2002-05-28 | Hypertension Diagnostics, Inc. | Apparatus and method for blood pressure pulse waveform contour analysis |
| US6544188B1 (en) | 1998-03-20 | 2003-04-08 | Hypertension Diagnostics, Inc. | Apparatus and method for holding and positioning an arterial pulse pressure sensor |
| US6331161B1 (en) | 1999-09-10 | 2001-12-18 | Hypertension Diagnostics, Inc | Method and apparatus for fabricating a pressure-wave sensor with a leveling support element |
| US6629343B1 (en) | 1999-09-10 | 2003-10-07 | Hypertension Diagnostics, Inc. | Method for fabricating a pressure-wave sensor with a leveling support element |
| US6585659B1 (en) | 1999-09-10 | 2003-07-01 | Hypertension Diagnostics, Inc. | Pressure-wave sensor with a leveling support element |
| WO2001085014A3 (en)* | 2000-05-10 | 2002-04-11 | Motorola Inc | Method for obtaining blood pressure data from optical sensor |
| US6475153B1 (en)* | 2000-05-10 | 2002-11-05 | Motorola Inc. | Method for obtaining blood pressure data from optical sensor |
| US20030187337A1 (en)* | 2000-06-16 | 2003-10-02 | Lionel Tarassenko | Combining measurements from different sensors |
| US7647185B2 (en) | 2000-06-16 | 2010-01-12 | Oxford Biosignals Limited | Combining measurements from different sensors |
| WO2001097059A3 (en)* | 2000-06-16 | 2003-03-13 | Isis Innovation | Combining measurements from different sensors |
| US6746403B2 (en) | 2000-10-04 | 2004-06-08 | Ge Medical Systems Information Technologies, Inc. | Physiological-signal-analysis device for measuring a blood pressure and method |
| US6517495B1 (en) | 2001-09-10 | 2003-02-11 | Ge Medical Systems Information Technologies, Inc. | Automatic indirect non-invasive apparatus and method for determining diastolic blood pressure by calibrating an oscillation waveform |
| US6440080B1 (en) | 2001-09-25 | 2002-08-27 | Ge Medical Systems Information Technologies, Inc. | Automatic oscillometric apparatus and method for measuring blood pressure |
| US20050027205A1 (en)* | 2001-12-14 | 2005-02-03 | Lionel Tarassenko | Combining measurements from breathing rate sensors |
| US7318808B2 (en) | 2001-12-14 | 2008-01-15 | Isis Innovation Limited | Combining measurements from breathing rate sensors |
| US6648828B2 (en) | 2002-03-01 | 2003-11-18 | Ge Medical Systems Information Technologies, Inc. | Continuous, non-invasive technique for measuring blood pressure using impedance plethysmography |
| US6767328B2 (en) | 2002-07-31 | 2004-07-27 | Ge Medical Systems Information Technologies, Inc. | Method and apparatus for determining blood pressure using pressure pulse duty cycle |
| US6733461B2 (en) | 2002-08-01 | 2004-05-11 | Hypertension Diagnostics, Inc. | Methods and apparatus for measuring arterial compliance, improving pressure calibration, and computing flow from pressure data |
| US20040167413A1 (en)* | 2002-08-01 | 2004-08-26 | Hypertension Diagnostics, Inc. | Method and apparatus for calibrating and measuring arterial compliance and stroke volume |
| US20040167411A1 (en)* | 2003-02-25 | 2004-08-26 | Ge Medical Systems Information Technologies, Inc. | Oscillometric determination of blood pressure |
| US7311669B2 (en) | 2003-02-25 | 2007-12-25 | Ge Medical Systems Information Technologies, Inc. | Oscillometric determination of blood pressure |
| US6893403B2 (en) | 2003-02-25 | 2005-05-17 | Ge Medical Systems Information Technologies, Inc. | Oscillometric determination of blood pressure |
| US20050187483A1 (en)* | 2003-02-25 | 2005-08-25 | Ge Medical Systems Information Technologies Inc. | Oscillometric determination of blood pressure |
| US7186218B2 (en) | 2003-02-27 | 2007-03-06 | Ge Medical Systems Information Technologies Inc. | Method and system for cuff pressure reversions |
| US7544167B2 (en) | 2003-02-27 | 2009-06-09 | Ge Medical Systems Information Technologies, Inc. | Method and system for cuff pressure reversions |
| US20040171943A1 (en)* | 2003-02-27 | 2004-09-02 | Ge Medical Systems Information Technologies, Inc. | Method and system for cuff pressure reversions |
| US7070566B2 (en) | 2003-03-13 | 2006-07-04 | Ge Medical Systems Information Technologies, Inc. | Artifact rejection using pulse quality values |
| US20040181157A1 (en)* | 2003-03-13 | 2004-09-16 | Ge Medical Systems Information Technologies, Inc. | Artifact rejection using pulse quality values |
| US20060184055A1 (en)* | 2003-03-18 | 2006-08-17 | Sai Kolluri | Method and system for determination of pulse rate |
| US20040186386A1 (en)* | 2003-03-18 | 2004-09-23 | Ge Medical Systems Information Technologies, Inc. | Method and system for determination of pulse rate |
| US8282567B2 (en) | 2003-03-18 | 2012-10-09 | General Electric Company | Method and system for determination of pulse rate |
| US7198604B2 (en) | 2003-03-18 | 2007-04-03 | Ge Medical Systems Information Technologies | Method and system for determination of pulse rate |
| US7074192B2 (en) | 2003-07-03 | 2006-07-11 | Ge Medical Systems Information Technologies, Inc. | Method and apparatus for measuring blood pressure using relaxed matching criteria |
| US20050004477A1 (en)* | 2003-07-03 | 2005-01-06 | Friedman Bruce Arnold | Method and apparatus for measuring blood pressure using relaxed matching criteria |
| US7194293B2 (en) | 2004-03-08 | 2007-03-20 | Nellcor Puritan Bennett Incorporated | Selection of ensemble averaging weights for a pulse oximeter based on signal quality metrics |
| US7890154B2 (en) | 2004-03-08 | 2011-02-15 | Nellcor Puritan Bennett Llc | Selection of ensemble averaging weights for a pulse oximeter based on signal quality metrics |
| US7474907B2 (en) | 2004-03-08 | 2009-01-06 | Nellcor Puritan Bennett Inc. | Selection of ensemble averaging weights for a pulse oximeter based on signal quality metrics |
| US20070208242A1 (en)* | 2004-03-08 | 2007-09-06 | Nellcor Puritan Bennett Inc. | Selection of ensemble averaging weights for a pulse oximeter based on signal quality metrics |
| US8560036B2 (en) | 2004-03-08 | 2013-10-15 | Covidien Lp | Selection of ensemble averaging weights for a pulse oximeter based on signal quality metrics |
| US20050261597A1 (en)* | 2004-05-18 | 2005-11-24 | Sai Kolluri | Method and apparatus for determining extreme blood pressure values |
| US7288070B2 (en) | 2004-05-18 | 2007-10-30 | The General Electric Company | Method and apparatus for determining extreme blood pressure values |
| US7775987B2 (en) | 2005-11-21 | 2010-08-17 | General Electric Company | Computation of blood pressure using different signal processing channels |
| US20070118036A1 (en)* | 2005-11-21 | 2007-05-24 | Hersh Lawrence T | Computation of blood pressure using different signal processing channels |
| US20070123784A1 (en)* | 2005-11-30 | 2007-05-31 | Hersh Lawrence T | Method of controlling blood pressure cuff deflation |
| US7226421B1 (en) | 2005-11-30 | 2007-06-05 | The General Electric Company | Method of controlling blood pressure cuff deflation |
| US7390302B2 (en) | 2006-08-16 | 2008-06-24 | The General Electric Company | Method and system of determining NIBP target inflation pressure using an SpO2 plethysmograph signal |
| US20080045846A1 (en)* | 2006-08-16 | 2008-02-21 | Friedman Bruce A | Method and system of determining nibp target inflation pressure using an sp02 plethysmograph signal |
| US20080082006A1 (en)* | 2006-09-07 | 2008-04-03 | Sai Kolluri | METHOD AND SYSTEM UTILIZING SpO2 PLETHYSMOGRAPH SIGNAL TO REDUCE NIBP DETERMINATION TIME |
| US7300404B1 (en) | 2006-09-07 | 2007-11-27 | The General Electric Company | Method and system utilizing SpO2 plethysmograph signal to qualify NIBP pulses |
| US7462152B2 (en) | 2006-09-07 | 2008-12-09 | The General Electric Company | Method and system utilizing SpO2 plethysmograph signal to reduce NIBP determination time |
| US20100249616A1 (en)* | 2009-03-26 | 2010-09-30 | The General Electric Company | Nibp target inflation pressure automation using derived spo2 signals |
| US8211030B2 (en) | 2009-03-26 | 2012-07-03 | The General Electric Company | NIBP target inflation pressure automation using derived SPO2 signals |
| US9301700B2 (en) | 2012-09-27 | 2016-04-05 | Welch Allyn, Inc. | Configurable vital signs system |
| US11071467B2 (en) | 2013-08-08 | 2021-07-27 | Welch Allyn, Inc. | Hybrid patient monitoring system |
| US11406272B2 (en)* | 2014-02-18 | 2022-08-09 | Welch Allyn, Inc. | Systems and methods for blood pressure measurement |
| CN109464136A (en)* | 2018-11-29 | 2019-03-15 | 东莞市康助医疗科技有限公司 | A kind of arterial stiffness display methods, system and device |
| CN109464136B (en)* | 2018-11-29 | 2020-11-13 | 东莞市康助医疗科技有限公司 | Method, system and device for displaying hardness of artery |
| CN110623651A (en)* | 2019-09-25 | 2019-12-31 | 江苏盖睿健康科技有限公司 | Method and device for processing measurement data of cuff pressure oscillation wave |
| CN110623651B (en)* | 2019-09-25 | 2020-11-27 | 江苏盖睿健康科技有限公司 | Method and device for processing measurement data of cuff pressure oscillation wave |
Similar Documents
| Publication | Publication Date | Title |
|---|---|---|
| US4949710A (en) | Method of artifact rejection for noninvasive blood-pressure measurement by prediction and adjustment of blood-pressure data | |
| US4889133A (en) | Method for noninvasive blood-pressure measurement by evaluation of waveform-specific area data | |
| JP3470121B2 (en) | Electronic blood pressure measurement device | |
| US7300404B1 (en) | Method and system utilizing SpO2 plethysmograph signal to qualify NIBP pulses | |
| DE69906008T2 (en) | Blood Pressure Monitor | |
| US5170795A (en) | Oscillometric blood pressure monitor and method employing non-uniform pressure decrementing steps | |
| US4926873A (en) | Method for measuring blood pressure and apparatus for automated blood pressure measuring | |
| US7462152B2 (en) | Method and system utilizing SpO2 plethysmograph signal to reduce NIBP determination time | |
| EP0655219B1 (en) | Oscillometric blood pressure measuring apparatus | |
| EP2110074B1 (en) | Apparatus and method of evaluating vascular endothelial function | |
| US4543962A (en) | Method of automated blood pressure detection | |
| US7074192B2 (en) | Method and apparatus for measuring blood pressure using relaxed matching criteria | |
| JP3710823B2 (en) | Improved method and apparatus for measuring cardiac output | |
| US7544167B2 (en) | Method and system for cuff pressure reversions | |
| US8282567B2 (en) | Method and system for determination of pulse rate | |
| JPH03218728A (en) | Method and device for distinguishing between correct and incorrect measured values of blood pressure in the presence of false signal | |
| US5653241A (en) | Blood-pressure monitor apparatus | |
| EP0333332A1 (en) | Method and apparatus for monitoring blood pressure | |
| US6893403B2 (en) | Oscillometric determination of blood pressure | |
| US4870973A (en) | Electronic blood pressure meter having means for detecting artifacts | |
| US5339822A (en) | Method of validating physiologic events resulting from a heartbeat | |
| US20020133083A1 (en) | Automatic blood-pressure measuring apparatus | |
| CN1345571A (en) | Blood pressure measuring method and device thereof | |
| US6475154B1 (en) | Method and apparatus for non-invasive blood-pressure measurement | |
| US6458085B1 (en) | Method and apparatus for oscillometric blood-pressure measurement |
Legal Events
| Date | Code | Title | Description |
|---|---|---|---|
| AS | Assignment | Owner name:PROTOCOL SYSTEMS, INC., BEAVERTON, OR, A CORP. OF Free format text:ASSIGNMENT OF ASSIGNORS INTEREST.;ASSIGNORS:DORSETT, THOMAS J.;DAVIS, CHARLES L.;REEL/FRAME:004958/0619 Effective date:19880912 Owner name:PROTOCOL SYSTEMS, INC., A CORP. OF OR,OREGON Free format text:ASSIGNMENT OF ASSIGNORS INTEREST;ASSIGNORS:DORSETT, THOMAS J.;DAVIS, CHARLES L.;REEL/FRAME:004958/0619 Effective date:19880912 | |
| STCF | Information on status: patent grant | Free format text:PATENTED CASE | |
| FPAY | Fee payment | Year of fee payment:4 | |
| FPAY | Fee payment | Year of fee payment:8 | |
| FEPP | Fee payment procedure | Free format text:PAYOR NUMBER ASSIGNED (ORIGINAL EVENT CODE: ASPN); ENTITY STATUS OF PATENT OWNER: LARGE ENTITY Free format text:PAT HOLDER NO LONGER CLAIMS SMALL ENTITY STATUS, ENTITY STATUS SET TO UNDISCOUNTED (ORIGINAL EVENT CODE: STOL); ENTITY STATUS OF PATENT OWNER: LARGE ENTITY | |
| REFU | Refund | Free format text:REFUND - PAYMENT OF MAINTENANCE FEE, 12TH YR, SMALL ENTITY (ORIGINAL EVENT CODE: R285); ENTITY STATUS OF PATENT OWNER: LARGE ENTITY | |
| FPAY | Fee payment | Year of fee payment:12 |