US4930519A - Method of graphing cardiopulmonary data - Google Patents
Method of graphing cardiopulmonary dataDownload PDFInfo
- Publication number
- US4930519A US4930519AUS06/774,222US77422285AUS4930519AUS 4930519 AUS4930519 AUS 4930519AUS 77422285 AUS77422285 AUS 77422285AUS 4930519 AUS4930519 AUS 4930519A
- Authority
- US
- United States
- Prior art keywords
- axes
- plotted
- cardiopulmonary
- true
- respiratory
- Prior art date
- Legal status (The legal status is an assumption and is not a legal conclusion. Google has not performed a legal analysis and makes no representation as to the accuracy of the status listed.)
- Expired - Lifetime
Links
- 230000002612cardiopulmonary effectEffects0.000titleclaimsabstractdescription30
- 238000000034methodMethods0.000titleclaimsabstractdescription19
- 238000005259measurementMethods0.000claimsdescription11
- QVGXLLKOCUKJST-UHFFFAOYSA-Natomic oxygenChemical compound[O]QVGXLLKOCUKJST-UHFFFAOYSA-N0.000claimsdescription10
- 229910052760oxygenInorganic materials0.000claimsdescription10
- 239000001301oxygenSubstances0.000claimsdescription10
- 230000003519ventilatory effectEffects0.000claimsdescription6
- 230000000241respiratory effectEffects0.000claimsdescription3
- 230000002802cardiorespiratory effectEffects0.000claims5
- 238000009662stress testingMethods0.000claims2
- 230000001788irregularEffects0.000abstractdescription9
- CURLTUGMZLYLDI-UHFFFAOYSA-NCarbon dioxideChemical compoundO=C=OCURLTUGMZLYLDI-UHFFFAOYSA-N0.000description18
- 229910002092carbon dioxideInorganic materials0.000description13
- 238000012360testing methodMethods0.000description11
- 230000006870functionEffects0.000description10
- 230000002503metabolic effectEffects0.000description9
- 238000009423ventilationMethods0.000description8
- 230000000875corresponding effectEffects0.000description7
- 239000001569carbon dioxideSubstances0.000description5
- 238000004519manufacturing processMethods0.000description5
- 230000036284oxygen consumptionEffects0.000description4
- 230000002159abnormal effectEffects0.000description3
- 238000004458analytical methodMethods0.000description3
- 230000006735deficitEffects0.000description3
- 208000000059DyspneaDiseases0.000description2
- 206010013975DyspnoeasDiseases0.000description2
- 230000005856abnormalityEffects0.000description2
- 230000008901benefitEffects0.000description2
- 230000000747cardiac effectEffects0.000description2
- 210000000748cardiovascular systemAnatomy0.000description2
- 230000001419dependent effectEffects0.000description2
- 238000010586diagramMethods0.000description2
- 201000010099diseaseDiseases0.000description2
- 208000037265diseases, disorders, signs and symptomsDiseases0.000description2
- 238000011156evaluationMethods0.000description2
- 239000007789gasSubstances0.000description2
- 238000005303weighingMethods0.000description2
- 208000010444AcidosisDiseases0.000description1
- 208000000884Airway ObstructionDiseases0.000description1
- 208000019901Anxiety diseaseDiseases0.000description1
- 206010065929Cardiovascular insufficiencyDiseases0.000description1
- 201000006306Cor pulmonaleDiseases0.000description1
- 206010027417Metabolic acidosisDiseases0.000description1
- 241001465754MetazoaSpecies0.000description1
- 230000036506anxietyEffects0.000description1
- 238000002564cardiac stress testMethods0.000description1
- 238000010276constructionMethods0.000description1
- 230000002596correlated effectEffects0.000description1
- 238000009792diffusion processMethods0.000description1
- 230000002526effect on cardiovascular systemEffects0.000description1
- 230000001747exhibiting effectEffects0.000description1
- 230000036541healthEffects0.000description1
- 208000000122hyperventilationDiseases0.000description1
- 230000000870hyperventilationEffects0.000description1
- 208000006443lactic acidosisDiseases0.000description1
- 210000004072lungAnatomy0.000description1
- 230000007246mechanismEffects0.000description1
- 208000030159metabolic diseaseDiseases0.000description1
- 230000004060metabolic processEffects0.000description1
- 230000002232neuromuscularEffects0.000description1
- 208000018360neuromuscular diseaseDiseases0.000description1
- 238000011017operating methodMethods0.000description1
- 238000000053physical methodMethods0.000description1
- 238000012545processingMethods0.000description1
- 230000002685pulmonary effectEffects0.000description1
- 230000024977response to activityEffects0.000description1
- 238000003860storageMethods0.000description1
- 230000002459sustained effectEffects0.000description1
Images

Classifications
- A—HUMAN NECESSITIES
- A61—MEDICAL OR VETERINARY SCIENCE; HYGIENE
- A61B—DIAGNOSIS; SURGERY; IDENTIFICATION
- A61B5/00—Measuring for diagnostic purposes; Identification of persons
- A61B5/02—Detecting, measuring or recording for evaluating the cardiovascular system, e.g. pulse, heart rate, blood pressure or blood flow
- A61B5/0205—Simultaneously evaluating both cardiovascular conditions and different types of body conditions, e.g. heart and respiratory condition
Definitions
- This inventionrelates generally to a method for displaying numerical data obtained from physical measurements, and more specifically to a new method of presenting graphic data pertaining to cardiopulmonary function data obtained during the course of exercise testing on living subjects whereby the measurements indicative of abnormal values will be readily apparent.
- systemmeasures and/or computes data that are ultimately stored in a memory but which may be printed out in tabular form or, alternatively, may be displayed on conventional Cartesian coordinates where one parameter is chosen to be the independent variable and another parameter is chosen to be the dependent variable.
- cardiopulmonary function datacan be acquired during the course of an exercise regimen using the system described in the aforereferenced Anderson, et al paternt application or any other suitable gas exchange system.
- that datawould be stored in the memory of the host computer.
- itis instead plotted on a planar sheet or on the face of a CRT, but in a way which facilitates recognition of deviations of the measured data from expected normal values thereof.
- a plotis made of a plurality of axes, each axis comprising a straight line radiating from a point of common origin, the axes being regularly spaced from one another.
- cardiopulmonary parameterssuch as the ventilatory equivalent (V E ), True CO 2 , CO 2 takeup (VCO 2 ), O 2 Pulse, Heart Rate, Work Rate, oxygen output (VO 2 ), and True O 2 .
- V Eventilatory equivalent
- VCO 2CO 2 takeup
- O 2 PulseO 2 Pulse
- Heart RateWork Rate
- oxygen outputVO 2
- True O 2True O 2 .
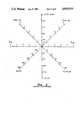
- Each of these parametersis displayed in its normal units but the scales on each of the axes are arranged such that normal or expected values of each of the parameters would be displaced radially outward from the origin by an equal distance such that when the normal or expected values on adjacent axes are connected by straight line segments, a generally regular polygon results.
- the actual readings obtained during the course of the exercise testing as stored in the memoryare plotted on the appropriate axes and a straight line segment is made to join the actual readings on adjacent axes. If the measured parameters are abnormal, the resulting figure so generated will be an irregular polygon. By noting the shape of the irregular polygon with respect to the regular polygon, the type of disfunction existing in the subject on whom the measurements have been taken become readily apparent. The closer the actual data comes to creating a regular polygon, the closer is the subject's metabolic data to the norm.
- the "work" parametercan be the independent variable and individual plots presented on the axes as a function of work rate.
- Another object of the inventionis to provide a method for displaying cardiopulmonary function data obtained during the course of an exercise test such that any deviations of the parameters being measured from normal become noticeable.
- Yet another object of the inventionis to provide a method for presenting numerical data obtained during the course of a cardiopulmonary stress test so that actual measured values can be readily compared to expected values for the purpose of noting any radical deviations of the parameters from the norm.
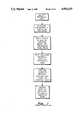
- FIG. 1illustrates a typical layout of the axes on which cardiopulmonary test data is to be plotted
- FIG. 2illustrates a typical plot for an individual having normal cardiopulmonary metabolism
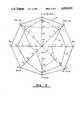
- FIGS. 3 and 4are plots of cardiopulmonary function data from two individuals suffering from one or more cardiopulmonary abnormalities.
- V Eoxygen uptake and carbon dioxide production
- dyspneaBy taking various measurements and/or by computing various parameters based upon such measurements, it is possible for a trained person to evaluate dyspnea, cardiopulmonary impairment and the like. Such testing is also useful in differentiating the cause of the dyspnea, e.g., when due to diffusion limitations, airway obstruction, cardiovascular insufficiency, neuromuscular and metabolic disorders and anxiety or hyperventilation states.
- a cardiopulmonary exercise systemhaving means for obtaining and/or calculating predetermined respiratory variables, on a breath-by-breath basis, and for storing the resulting information in the memory of a computer. More particularly, that application indicates that the system described and claimed therein is capable of accessing, computing, and storing 22 different cardiopulmonary parameters which values can be read from the computer memory and use in conjunction with a cathode ray tube type display or a hard copy printer to produce graphic presentation.
- V CO 2carbon dioxide production
- V Ethe CO 2 production divided by minute ventilation
- V Ethe minute ventilation itself
- V Ethe oxygen consumption divided by minute ventilation
- FIG. 1there is illustrated by means of a block diagram a flow chart illustrating the method of the present invention. It involves first the collecting of the metabolic data to be displayed.
- the data in questioncan be secured from the system described in the aforereferenced Anderson et al application, and following the data processing functions explained in detail therein, the parameters mentioned are stored in the memory of the host computer at addressable storage locations for later retrieval and display, either on a CRT screen or by means of a printer/plotter mechanism of known construction.
- FIG. 2illustrates a typical plot of such axes where it is desired to plot eight cardiopulmonary parameters.
- the axeshave a common origin, O, and extending radially outwardly therefrom at equal angular spacings are a plurality of axes, each of which is provided with a label indicating the metabolic parameter to be plotted therealong.
- the collected metabolic data stored in the computer memory or elsewhereare plotted on the appropriate axes. That is to say, the actual measured value or values of heart rate for differing levels of work are plotted on the axes labeled "HR" with the corresponding work levels being plotted on the axis labeled "WATTS”. Similarly, O 2 Pulse, VCO 2 , and the other values mentioned above are plotted on the axes so labeled.
- line segmentsare joined between plotted data points on adjacent axes. The polygon indicated in FIG.
- the solid line polygon identified by the letter Creflects the metabolic data obtained on the same patient, but at a later time after his level of work on a cycle ergometer or treadmill had been increased to the point where the subject was producing approximately 210 Watts.
- the corresponding values of the plotted metabolic parametersare as follows:
- VCO 23.8 L/min.
- V E128 L/min.
- a regular polygon identified by letter Amay be drawn on the same set of axes with the respective vertexes of the regular polygon being located at the normal or expected values of that parameter, assuming a healthy cardipulmonary system. Then, the degree to which the actual measurements, e.g., polygon "C", corresponds to that regular polygon at a maximum work effort provides a readily apparent indication of the degree to which the actual measurements correspond to the norm.
- the data used in plotting the polygon C in FIG. 3were obtained from an athleic male, age 27, weighing 188 pounds, and being 70.5 inches (179 centimeters) tall and exhibiting good cardiopulmonary function.
- the graphical representation of the subject inventionalso provides a ready indication of a subject's anaerobic threshold.
- the anaerobic thresholdmay be defined as the oxygen consumption (VO 2 ) above which a sustained lactic acidosis occurs is a measure of the ability of the subject to perform endurance work. True O 2 and True CO 2 measurements may be used to determine the anaerobic threshold.
- the oxygen ventilatory equivalentis the parameter referred to. This is the ratio of minute ventilation and O 2 consumption (V E /VO 2 ). The lowest ventilatory equivalent is defined as the anaerobic threshold.
- the inverse of ventilatory equivalentis True O 2
- itis the highest true O 2 value that corresponds to the anaerobic threshold and one may locate that threshold by extending a line from the maximum point on the True O 2 axis back to its corresponding reading on the VO 2 axis.
- the maximum True CO 2 pointcan be extrapolated down to the VO 2 axis to determine respiratory compensation.
- FIG. 4represents the metabolic data obtained from a patient at three separate levels of work.
- the particular patientwas a 21 year old female weighing 101 pounds and being 60.5 inches in height. This subject had earlier suffered a seizure while running which induced her to seek medical treatment and evaluation.
- the innermost irregular polygon identified by letter "D" and represented by a dashed lineindicates the values of the various parameters for a very modest level of work.
- the method of the present inventionfurther contemplates the use of a clear plastic overlay having a regular polygon scribed or printed thereon, there being an overlay for males, another for females, and still others for persons of differing ages and, in this fashion, the actual measured data obtained by the cardiopulmonary exercise system can be compared to expected norms or maimums as reflected on those overlays.
Landscapes
- Health & Medical Sciences (AREA)
- Life Sciences & Earth Sciences (AREA)
- Cardiology (AREA)
- Physiology (AREA)
- Heart & Thoracic Surgery (AREA)
- Medical Informatics (AREA)
- Biophysics (AREA)
- Pathology (AREA)
- Engineering & Computer Science (AREA)
- Biomedical Technology (AREA)
- Pulmonology (AREA)
- Physics & Mathematics (AREA)
- Molecular Biology (AREA)
- Surgery (AREA)
- Animal Behavior & Ethology (AREA)
- General Health & Medical Sciences (AREA)
- Public Health (AREA)
- Veterinary Medicine (AREA)
- Measurement Of The Respiration, Hearing Ability, Form, And Blood Characteristics Of Living Organisms (AREA)
- Measuring Pulse, Heart Rate, Blood Pressure Or Blood Flow (AREA)
Abstract
Description
Claims (5)
Priority Applications (1)
| Application Number | Priority Date | Filing Date | Title |
|---|---|---|---|
| US06/774,222US4930519A (en) | 1984-04-02 | 1985-09-09 | Method of graphing cardiopulmonary data |
Applications Claiming Priority (2)
| Application Number | Priority Date | Filing Date | Title |
|---|---|---|---|
| US59604684A | 1984-04-02 | 1984-04-02 | |
| US06/774,222US4930519A (en) | 1984-04-02 | 1985-09-09 | Method of graphing cardiopulmonary data |
Related Parent Applications (1)
| Application Number | Title | Priority Date | Filing Date |
|---|---|---|---|
| US59604684AContinuation | 1984-04-02 | 1984-04-02 |
Publications (1)
| Publication Number | Publication Date |
|---|---|
| US4930519Atrue US4930519A (en) | 1990-06-05 |
Family
ID=27082447
Family Applications (1)
| Application Number | Title | Priority Date | Filing Date |
|---|---|---|---|
| US06/774,222Expired - LifetimeUS4930519A (en) | 1984-04-02 | 1985-09-09 | Method of graphing cardiopulmonary data |
Country Status (1)
| Country | Link |
|---|---|
| US (1) | US4930519A (en) |
Cited By (20)
| Publication number | Priority date | Publication date | Assignee | Title |
|---|---|---|---|---|
| EP0590200A1 (en)* | 1992-10-02 | 1994-04-06 | E.R. SQUIBB & SONS, INC. | Device and method for the visualisation of cardiovascular risk factors |
| US5448071A (en)* | 1993-04-16 | 1995-09-05 | Bruce W. McCaul | Gas spectroscopy |
| EP0753283A1 (en)* | 1995-07-14 | 1997-01-15 | Hewlett-Packard Company | Method and apparatus for comparing a sample with a reference using a spider diagram |
| US5625189A (en)* | 1993-04-16 | 1997-04-29 | Bruce W. McCaul | Gas spectroscopy |
| US5782772A (en)* | 1994-02-26 | 1998-07-21 | Stegmann; Heiner | Device and method for determination of the individual anaerobic threshold of a living organism |
| US6176241B1 (en)* | 1998-12-04 | 2001-01-23 | Saul Blau | System and method for cardiorespiratory conditioning |
| US20020015034A1 (en)* | 2000-08-01 | 2002-02-07 | Siemens Elema Ab | User interface for a medical display device |
| US7053796B1 (en)* | 2003-02-27 | 2006-05-30 | Rockwell Collins, Inc. | Multi-dimensional instruments for monitoring engine and system parameters |
| US20090076347A1 (en)* | 2007-09-17 | 2009-03-19 | Shape Medical Systems, Inc. | Pattern Recognition System for Classifying the Functional Status of Patients with Chronic Disease |
| US20100016750A1 (en)* | 2007-09-17 | 2010-01-21 | Shape Medical Systems, Inc. | Pattern Recognition System for Classifying the Functional Status of Patients with Pulmonary Hypertension, Including Pulmonary Arterial and Pulmonary Vascular Hypertension |
| USRE41332E1 (en)* | 1999-05-28 | 2010-05-11 | Mergenet Medical, Inc. | Cardiopulmonary exercise testing apparatus and method |
| US20100317932A1 (en)* | 2008-12-22 | 2010-12-16 | Nihon Kohden Corporation | Respiratory function measuring apparatus |
| US20110130675A1 (en)* | 2009-12-01 | 2011-06-02 | Neurowave Systems Inc. | Multi-channel brain or cortical activity monitoring and method |
| US8630811B2 (en) | 2007-09-17 | 2014-01-14 | Shape Medical Systems, Inc. | Method for combining individual risk variables derived from cardiopulmonary exercise testing into a single variable |
| US9526437B2 (en) | 2012-11-21 | 2016-12-27 | i4c Innovations Inc. | Animal health and wellness monitoring using UWB radar |
| US9536318B2 (en) | 2012-12-03 | 2017-01-03 | Koninklijke Philips N.V. | Image processing device and method for detecting line structures in an image data set |
| JP2017012402A (en)* | 2015-06-30 | 2017-01-19 | フクダ電子株式会社 | Biological information output device and control method thereof |
| US9993304B2 (en) | 2011-01-13 | 2018-06-12 | Koninklijke Philips N.V. | Visualization of catheter of three-dimensional ultrasound |
| US10149617B2 (en) | 2013-03-15 | 2018-12-11 | i4c Innovations Inc. | Multiple sensors for monitoring health and wellness of an animal |
| US11497439B2 (en) | 2019-03-05 | 2022-11-15 | Shape Medical Systems, Inc. | Pattern recognition system for classifying the functional status of patients with chronic heart, lung, and pulmonary vascular diseases |
Citations (11)
| Publication number | Priority date | Publication date | Assignee | Title |
|---|---|---|---|---|
| US2714380A (en)* | 1953-04-03 | 1955-08-02 | Alexander W Freshman | Spatial vectometer for vectorcardiography |
| FR1123404A (en)* | 1955-03-11 | 1956-09-21 | Nouvelles Tech Radioelectrique | Medical diagnostic device |
| US3364476A (en)* | 1964-06-04 | 1968-01-16 | Navy Usa | Interaction analyzer |
| US3675640A (en)* | 1970-04-09 | 1972-07-11 | Gatts J D | Method and apparatus for dynamic health testing evaluation and treatment |
| US3811040A (en)* | 1972-09-27 | 1974-05-14 | Gen Electric | Vector contour plot of physiological parameters |
| US3818901A (en)* | 1972-04-12 | 1974-06-25 | Del Mar Eng Lab | Apparatus for automatically periodically measuring and displaying the total air expired by a subject during each of a succession of given time intervals |
| US4112928A (en)* | 1975-09-11 | 1978-09-12 | Keiper Trainingsysteme Gmbh & Co. | Ergometer |
| US4282655A (en)* | 1980-01-11 | 1981-08-11 | Daniel Tinman | Cardiac axis calculator |
| US4463764A (en)* | 1981-09-29 | 1984-08-07 | Medical Graphics Corporation | Cardiopulmonary exercise system |
| US4550502A (en)* | 1983-04-15 | 1985-11-05 | Joseph Grayzel | Device for analysis of recorded electrocardiogram |
| US4566461A (en)* | 1983-02-15 | 1986-01-28 | Michael Lubell | Health fitness monitor |
- 1985
- 1985-09-09USUS06/774,222patent/US4930519A/ennot_activeExpired - Lifetime
Patent Citations (11)
| Publication number | Priority date | Publication date | Assignee | Title |
|---|---|---|---|---|
| US2714380A (en)* | 1953-04-03 | 1955-08-02 | Alexander W Freshman | Spatial vectometer for vectorcardiography |
| FR1123404A (en)* | 1955-03-11 | 1956-09-21 | Nouvelles Tech Radioelectrique | Medical diagnostic device |
| US3364476A (en)* | 1964-06-04 | 1968-01-16 | Navy Usa | Interaction analyzer |
| US3675640A (en)* | 1970-04-09 | 1972-07-11 | Gatts J D | Method and apparatus for dynamic health testing evaluation and treatment |
| US3818901A (en)* | 1972-04-12 | 1974-06-25 | Del Mar Eng Lab | Apparatus for automatically periodically measuring and displaying the total air expired by a subject during each of a succession of given time intervals |
| US3811040A (en)* | 1972-09-27 | 1974-05-14 | Gen Electric | Vector contour plot of physiological parameters |
| US4112928A (en)* | 1975-09-11 | 1978-09-12 | Keiper Trainingsysteme Gmbh & Co. | Ergometer |
| US4282655A (en)* | 1980-01-11 | 1981-08-11 | Daniel Tinman | Cardiac axis calculator |
| US4463764A (en)* | 1981-09-29 | 1984-08-07 | Medical Graphics Corporation | Cardiopulmonary exercise system |
| US4566461A (en)* | 1983-02-15 | 1986-01-28 | Michael Lubell | Health fitness monitor |
| US4550502A (en)* | 1983-04-15 | 1985-11-05 | Joseph Grayzel | Device for analysis of recorded electrocardiogram |
Cited By (29)
| Publication number | Priority date | Publication date | Assignee | Title |
|---|---|---|---|---|
| EP0590200A1 (en)* | 1992-10-02 | 1994-04-06 | E.R. SQUIBB & SONS, INC. | Device and method for the visualisation of cardiovascular risk factors |
| US5396886A (en)* | 1992-10-02 | 1995-03-14 | Bristol-Myers Squibb Company | Method for predicting coronary heart disease |
| US5448071A (en)* | 1993-04-16 | 1995-09-05 | Bruce W. McCaul | Gas spectroscopy |
| US5491341A (en)* | 1993-04-16 | 1996-02-13 | Bruce W. McCaul | Gas spectroscopy |
| US5625189A (en)* | 1993-04-16 | 1997-04-29 | Bruce W. McCaul | Gas spectroscopy |
| US6150661A (en)* | 1993-04-16 | 2000-11-21 | Bruce W. McCaul | Gas spectroscopy |
| US5782772A (en)* | 1994-02-26 | 1998-07-21 | Stegmann; Heiner | Device and method for determination of the individual anaerobic threshold of a living organism |
| EP0753283A1 (en)* | 1995-07-14 | 1997-01-15 | Hewlett-Packard Company | Method and apparatus for comparing a sample with a reference using a spider diagram |
| US5731998A (en)* | 1995-07-14 | 1998-03-24 | Hewlett-Packard Company | Method and apparatus for comparing a sample with a reference using a spider diagram |
| US6176241B1 (en)* | 1998-12-04 | 2001-01-23 | Saul Blau | System and method for cardiorespiratory conditioning |
| USRE41332E1 (en)* | 1999-05-28 | 2010-05-11 | Mergenet Medical, Inc. | Cardiopulmonary exercise testing apparatus and method |
| US20020015034A1 (en)* | 2000-08-01 | 2002-02-07 | Siemens Elema Ab | User interface for a medical display device |
| US7053796B1 (en)* | 2003-02-27 | 2006-05-30 | Rockwell Collins, Inc. | Multi-dimensional instruments for monitoring engine and system parameters |
| US8630811B2 (en) | 2007-09-17 | 2014-01-14 | Shape Medical Systems, Inc. | Method for combining individual risk variables derived from cardiopulmonary exercise testing into a single variable |
| US20090076347A1 (en)* | 2007-09-17 | 2009-03-19 | Shape Medical Systems, Inc. | Pattern Recognition System for Classifying the Functional Status of Patients with Chronic Disease |
| US20100016750A1 (en)* | 2007-09-17 | 2010-01-21 | Shape Medical Systems, Inc. | Pattern Recognition System for Classifying the Functional Status of Patients with Pulmonary Hypertension, Including Pulmonary Arterial and Pulmonary Vascular Hypertension |
| US8775093B2 (en) | 2007-09-17 | 2014-07-08 | Shape Medical Systems, Inc. | Pattern recognition system for classifying the functional status of patients with pulmonary hypertension, including pulmonary arterial and pulmonary vascular hypertension |
| US20100317932A1 (en)* | 2008-12-22 | 2010-12-16 | Nihon Kohden Corporation | Respiratory function measuring apparatus |
| WO2011046729A1 (en)* | 2009-09-25 | 2011-04-21 | Shape Medical Systems, Inc. | Pattern recognition system for classifying the functional status of patients with pulmonary hypertension, including pulmonary arterial and pulmonary vascular hypertension |
| US20110130675A1 (en)* | 2009-12-01 | 2011-06-02 | Neurowave Systems Inc. | Multi-channel brain or cortical activity monitoring and method |
| US8838226B2 (en)* | 2009-12-01 | 2014-09-16 | Neuro Wave Systems Inc | Multi-channel brain or cortical activity monitoring and method |
| US9993304B2 (en) | 2011-01-13 | 2018-06-12 | Koninklijke Philips N.V. | Visualization of catheter of three-dimensional ultrasound |
| US9526437B2 (en) | 2012-11-21 | 2016-12-27 | i4c Innovations Inc. | Animal health and wellness monitoring using UWB radar |
| US10070627B2 (en) | 2012-11-21 | 2018-09-11 | i4c Innovations Inc. | Animal health and wellness monitoring using UWB radar |
| US11317608B2 (en) | 2012-11-21 | 2022-05-03 | i4c Innovations Inc. | Animal health and wellness monitoring using UWB radar |
| US9536318B2 (en) | 2012-12-03 | 2017-01-03 | Koninklijke Philips N.V. | Image processing device and method for detecting line structures in an image data set |
| US10149617B2 (en) | 2013-03-15 | 2018-12-11 | i4c Innovations Inc. | Multiple sensors for monitoring health and wellness of an animal |
| JP2017012402A (en)* | 2015-06-30 | 2017-01-19 | フクダ電子株式会社 | Biological information output device and control method thereof |
| US11497439B2 (en) | 2019-03-05 | 2022-11-15 | Shape Medical Systems, Inc. | Pattern recognition system for classifying the functional status of patients with chronic heart, lung, and pulmonary vascular diseases |
Similar Documents
| Publication | Publication Date | Title |
|---|---|---|
| US4930519A (en) | Method of graphing cardiopulmonary data | |
| US3675640A (en) | Method and apparatus for dynamic health testing evaluation and treatment | |
| Starr et al. | Ballistocardiogram. II. Normal standards, abnormalities commonly found in diseases of the heart and circulation, and their significance | |
| Froelicher et al. | A randomized trial of exercise training in patients with coronary heart disease | |
| US6572558B2 (en) | Apparatus and method for non-invasive measurement of current functional state and adaptive response in humans | |
| US6185451B1 (en) | Muscle function assessment apparatus and method | |
| US11147507B2 (en) | Decision support system for cardiopulmonary resuscitation (CPR) | |
| US7092849B2 (en) | Extracting causal information from a chaotic time series | |
| Copie et al. | Correlation between time‐domain measures of heart rate variability and scatterplots in postinfarction patients | |
| Tobin | Breathing pattern analysis | |
| US6416473B1 (en) | Methods and apparatus for providing an indicator of autonomic nervous system function | |
| US20040260185A1 (en) | Method of cardiac risk assessment | |
| US5810011A (en) | Method and apparatus for measuring myocardial impairment and dysfunctions from efficiency and performance diagrams | |
| JP4668505B2 (en) | Method and system for measuring heart rate variability | |
| Vainamo et al. | Artificial neural networks for aerobic fitness approximation | |
| Kardash et al. | The slope of ST segment/heart rate relationship during exercise in the prediction of severity of coronary artery disease | |
| Lewalter et al. | Oxygen uptake kinetics during low intensity exercise: relevance for rate adaptive pacemaker programming. | |
| Andresen et al. | An improved automated ECG algorithm for detecting acute and prior myocardial infarction | |
| US20210298608A1 (en) | Pattern recognition system for identifying patients with ischemic heart disease | |
| Blackie et al. | Exercise testing in the assessment of pulmonary disease | |
| Geiger | Application of Computer Systems in Critical Care | |
| AU706493B3 (en) | Muscle functiion assessment apparatus and method | |
| CA2033433C (en) | Autonomic neuropathy detection and method of analysis | |
| Lundin et al. | Reproducibility of on‐line vectorcardiography measurements in patients with and without acute ischaemic heart disease | |
| Tobin | Predicting ventilator independence |
Legal Events
| Date | Code | Title | Description |
|---|---|---|---|
| STCF | Information on status: patent grant | Free format text:PATENTED CASE | |
| CC | Certificate of correction | ||
| FEPP | Fee payment procedure | Free format text:PAYOR NUMBER ASSIGNED (ORIGINAL EVENT CODE: ASPN); ENTITY STATUS OF PATENT OWNER: SMALL ENTITY | |
| FPAY | Fee payment | Year of fee payment:4 | |
| AS | Assignment | Owner name:MARQUETTE CAPITAL BANK, MINNESOTA Free format text:SECURITY AGREEMENT;ASSIGNOR:MEDICAL GRAPHICS CORPORATION;REEL/FRAME:008321/0820 Effective date:19970116 | |
| AS | Assignment | Owner name:NORWEST BANK MINNESOTA, NATIONAL ASSOCIATION, MINN Free format text:ASSIGNMENT OF ASSIGNORS INTEREST;ASSIGNOR:MEDICAL GRAPHICS CORPORATION;REEL/FRAME:008447/0751 Effective date:19970331 | |
| AS | Assignment | Owner name:NORWEST BUSINESS CREDIT, INC., MINNESOTA Free format text:SECURITY AGREEMENT;ASSIGNOR:MEDICAL GRAPHICS CORPORATION;REEL/FRAME:008470/0116 Effective date:19970331 | |
| REMI | Maintenance fee reminder mailed | ||
| FPAY | Fee payment | Year of fee payment:8 | |
| SULP | Surcharge for late payment | ||
| REMI | Maintenance fee reminder mailed | ||
| FPAY | Fee payment | Year of fee payment:12 | |
| SULP | Surcharge for late payment | Year of fee payment:11 |