US4679426A - Wave shape chemical analysis apparatus and method - Google Patents
Wave shape chemical analysis apparatus and methodDownload PDFInfo
- Publication number
- US4679426A US4679426AUS06/774,150US77415085AUS4679426AUS 4679426 AUS4679426 AUS 4679426AUS 77415085 AUS77415085 AUS 77415085AUS 4679426 AUS4679426 AUS 4679426A
- Authority
- US
- United States
- Prior art keywords
- electromagnetic signal
- test sample
- shape
- signal
- chemical
- Prior art date
- Legal status (The legal status is an assumption and is not a legal conclusion. Google has not performed a legal analysis and makes no representation as to the accuracy of the status listed.)
- Expired - Lifetime
Links
- 239000000126substanceSubstances0.000titleclaimsabstractdescription77
- 238000000034methodMethods0.000titleclaimsabstractdescription36
- 238000004458analytical methodMethods0.000titleabstractdescription23
- 238000012360testing methodMethods0.000claimsabstractdescription80
- 230000000737periodic effectEffects0.000claimsabstractdescription18
- 230000009466transformationEffects0.000claimsabstractdescription13
- FAPWRFPIFSIZLT-UHFFFAOYSA-MSodium chlorideChemical compound[Na+].[Cl-]FAPWRFPIFSIZLT-UHFFFAOYSA-M0.000claimsdescription44
- 239000011780sodium chlorideSubstances0.000claimsdescription23
- 239000003990capacitorSubstances0.000claimsdescription18
- 238000001514detection methodMethods0.000claimsdescription18
- 230000008859changeEffects0.000claimsdescription14
- 230000005540biological transmissionEffects0.000claimsdescription4
- 230000007274generation of a signal involved in cell-cell signalingEffects0.000claimsdescription3
- 230000000644propagated effectEffects0.000claimsdescription2
- 238000012544monitoring processMethods0.000claims2
- 239000007787solidSubstances0.000claims2
- 239000004020conductorSubstances0.000claims1
- 238000003780insertionMethods0.000claims1
- 230000037431insertionEffects0.000claims1
- 238000012545processingMethods0.000claims1
- 230000001902propagating effectEffects0.000claims1
- 230000008054signal transmissionEffects0.000claims1
- 239000000523sampleSubstances0.000abstractdescription47
- 235000002639sodium chlorideNutrition0.000description15
- 239000011734sodiumSubstances0.000description12
- DGAQECJNVWCQMB-PUAWFVPOSA-MIlexoside XXIXChemical compoundC[C@@H]1CC[C@@]2(CC[C@@]3(C(=CC[C@H]4[C@]3(CC[C@@H]5[C@@]4(CC[C@@H](C5(C)C)OS(=O)(=O)[O-])C)C)[C@@H]2[C@]1(C)O)C)C(=O)O[C@H]6[C@@H]([C@H]([C@@H]([C@H](O6)CO)O)O)O.[Na+]DGAQECJNVWCQMB-PUAWFVPOSA-M0.000description11
- 229910052708sodiumInorganic materials0.000description11
- VEXZGXHMUGYJMC-UHFFFAOYSA-MChloride anionChemical compound[Cl-]VEXZGXHMUGYJMC-UHFFFAOYSA-M0.000description8
- WCUXLLCKKVVCTQ-UHFFFAOYSA-MPotassium chlorideChemical compound[Cl-].[K+]WCUXLLCKKVVCTQ-UHFFFAOYSA-M0.000description8
- 239000000243solutionSubstances0.000description7
- 230000008569processEffects0.000description5
- 235000021419vinegarNutrition0.000description5
- 239000000052vinegarSubstances0.000description5
- 239000007864aqueous solutionSubstances0.000description4
- 235000011164potassium chlorideNutrition0.000description4
- 239000001103potassium chlorideSubstances0.000description4
- 230000035945sensitivityEffects0.000description4
- 235000000346sugarNutrition0.000description4
- 230000008901benefitEffects0.000description3
- 150000001875compoundsChemical class0.000description3
- 150000003839saltsChemical class0.000description3
- XLYOFNOQVPJJNP-UHFFFAOYSA-NwaterSubstancesOXLYOFNOQVPJJNP-UHFFFAOYSA-N0.000description3
- LFQSCWFLJHTTHZ-UHFFFAOYSA-NEthanolChemical compoundCCOLFQSCWFLJHTTHZ-UHFFFAOYSA-N0.000description2
- 229920002472StarchPolymers0.000description2
- 238000013459approachMethods0.000description2
- 210000003743erythrocyteAnatomy0.000description2
- 238000005259measurementMethods0.000description2
- 235000019698starchNutrition0.000description2
- 239000008107starchSubstances0.000description2
- 238000004435EPR spectroscopyMethods0.000description1
- 238000005481NMR spectroscopyMethods0.000description1
- 238000009614chemical analysis methodMethods0.000description1
- 238000010835comparative analysisMethods0.000description1
- 230000001143conditioned effectEffects0.000description1
- 230000001419dependent effectEffects0.000description1
- 238000010586diagramMethods0.000description1
- 230000000694effectsEffects0.000description1
- 238000005048flame photometryMethods0.000description1
- 235000013305foodNutrition0.000description1
- 230000006870functionEffects0.000description1
- 239000000383hazardous chemicalSubstances0.000description1
- 231100000206health hazardToxicity0.000description1
- 150000002500ionsChemical class0.000description1
- 238000002372labellingMethods0.000description1
- 239000000203mixtureSubstances0.000description1
- 238000012986modificationMethods0.000description1
- 230000004048modificationEffects0.000description1
- 238000004445quantitative analysisMethods0.000description1
- 150000003388sodium compoundsChemical class0.000description1
- 238000002798spectrophotometry methodMethods0.000description1
- 235000013522vodkaNutrition0.000description1
Images


Classifications
- G—PHYSICS
- G01—MEASURING; TESTING
- G01N—INVESTIGATING OR ANALYSING MATERIALS BY DETERMINING THEIR CHEMICAL OR PHYSICAL PROPERTIES
- G01N22/00—Investigating or analysing materials by the use of microwaves or radio waves, i.e. electromagnetic waves with a wavelength of one millimetre or more
Definitions
- This inventionrelates generally to chemical analysis apparatus, and relates more particularly to an apparatus and method for determining chemical concentration based on waveform distortion analysis.
- Bolieentitled “Method of Counting Erythrocytes Utilizing High Frequency Current,” which measures the impedance variation of a solution flowing through an orifice to count red blood cells
- 3,489,522, issued Jan. 13, 1970 to H. M. McConnellentitled “Electron Spin Resonance Labeling of Biomolecules,” which utilizes a radio frequency alternating magnetic field and a unidirectional magnetic field to identify biomolecules
- 3,765,841issued Oct. 16, 1973 to Paulson, et al., entitled “Method and Apparatus for Chemical Analysis,” which measures the rate of change of the conductivity of a test sample to measure the concentrations of reactive substances.
- Chemical analysis apparatussuch as these are either very expensive, or very limited in their use.
- the present inventionprovides an apparatus and method for measuring the concentration of a chemical substance in a test sample based on a technique of waveform distortion analysis.
- the apparatusincludes a waveform generator that generates a periodic signal, an antenna probe that transmits the signal into the test sample and receives from the test sample a corresponding periodic signal, the waveform of which has been distorted or otherwise transformed by the chemical, and a detector circuit that quantifies the transformation of the signal to determine the concentration of the chemical in the test sample.
- the methodincludes the steps of generating a signal having a periodic waveform and transmitting that signal through the test sample, receiving the signal after it has propagated through the test sample and has been distorted or otherwise transformed by the chemical in the test sample, and detecting the magnitude of the transformation of the signal, which is directly related to the concentration of the chemical in the test sample.
- Another methodinvolves the tuning of the apparatus for sensitivity to a particular chemical by selecting a frequency and waveform shape for the transmitted signal in order to maximize the distortion or transformation of the signal due to the presence of the chemical in the test sample.
- the apparatus and method of the present inventionare not based upon the technique of conductivity testing, or any of the other previously employed chemical analysis techniques. Instead, the chemical analysis apparatus of the present invention is based upon comparative analysis of a periodic signal transmitted through a test sample.
- the signalis distorted or otherwise transformed by one or more chemical substances in the test sample.
- the waveform shape and frequencyare selected so that the transformation is particularly responsive to the presence of a selected chemical substance, so that the magnitude of the distortion or transformation of the signal is directly related to the concentration of the selected chemical substance.
- the waveform generatorIn the preferred embodiment of the invention, which measures the concentration of salt in an aqueous solution, the waveform generator generates a square wave at a frequency of either sixteen or eighteen megahertz, and supplies that signal to the antenna probe.
- the antenna probeincludes two conductive prongs protruding in parallel from a housing. The prongs act as antennas for transmitting the square wave signal into the test sample and for receiving the distorted or transformed signal from the test sample.
- the prongs of the antenna probeare inserted into the test sample, and the square wave signal is transmitted into the test sample via one of the prongs.
- the waveform shape of the signalis distorted by the sodium or chloride ions as the signal propagates through the test sample. The distorted signal is received by the other prong of the antenna probe and is sent to the detector circuit for analysis.
- the detector circuitresponds to the transmitted and received signals to generate an output signal that is related to the magnitude of the distortion of the signal.
- a capacitor and resistor networksupplies an "average" of the transmitted and received signals as a reference signal to a common input terminal of an analog multiplier.
- the analog multipliermultiplies the difference between the transmitted and reference signals by the difference between the received and reference signals to generate the output signal.
- An output deviceresponds to the output signal of the detector circuit to visually indicate the presence and concentration of salt in the test sample.
- FIG. 1is a block diagram of a chemical analysis apparatus according to the present invention.
- FIG. 2is a sectional view of an antenna probe utilized in the chemical analysis apparatus of FIG. 1.
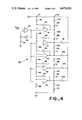
- FIG. 3is a schematic view of an electronic circuit utilized in the chemical analysis apparatus of FIG. 1 for signal generation and distortion detection.
- FIG. 4is a schematic view of an output circuit utilized in the chemical analysis apparatus of FIG. 1.
- FIG. 5is a voltage curve for output from the analog multiplier of the apparatus of the present invention.
- FIGS. 1 through 4 of the drawingsdepict the preferred embodiment of the present invention for purposes of illustration only.
- One skilled in the artwill readily recognize from the following discussion that alternative embodiments of the structures and methods illustrated herein may be employed without departing from the principles of the invention described herein.
- the preferred embodiment of the present inventionis an apparatus and method for determining the concentration of sodium chloride in an aqueous solution based on waveform distortion analysis.
- the chemical analysis apparatus 10 of the present inventionincludes a waveform generator 12, a transmitting antenna 14, a receiving antenna 16, a detection circuit 18, and an output device 20.
- the transmitting and receiving antenna 14 and 16are placed in contact with a test sample 22, which contains a solution to be tested for the presence of one or more selected chemical substances.
- the waveform generator 12supplies an electromagnetic signal having a periodic waveform to the transmitting antenna 14 and to the detection circuit 18.
- the electromagnetic signal 23is transmitted into the test sample 22, propagates through the test sample, and is received by the receiving antenna 16.
- the waveform shape and frequency of the signal 23is selected to be susceptible to distortion by the presence of the selected chemical in the test sample.
- the signal 23propagates from the transmitting antenna 14 to the receiving antenna 16, the signal is distorted or otherwise transformed by the selected chemical substance.
- the amount of the distortion or transformationis a function of the concentration of the selected chemical in the test sample 22.
- Both the undistorted transmitted signal and the distorted received signalare supplied to the detection circuit 18, which analyses the two signals to determine the magnitude of the distortion or transformation, and generates an output signal based on that analysis.
- the output signalis supplied to the output device 20, which visually displays the measured concentration of the selected chemical.
- FIGS. 2, 3, and 4illustrate the preferred embodiment of the chemical analysis apparatus 10, which is intended for measuring the concentration of sodium or chloride ions in an aqueous solution.
- FIG. 2shows an antenna probe 24 that contains the transmitting and receiving antennas 14 and 16.
- Each antenna 14 and 16is a conductive, cylindrical rod 26 extending outwardly from an insulative housing 28.
- At the inward end of each rod 26is an axial cavity 30, into which is soldered a wire 32 that electrically connects the rod 26 to either the waveform generator 12 or the detection circuit 18.
- the axial cavityserves as a filter to help eliminate harmonics of the transmitted and received signals.
- the outward tips of the rods 26are fully radiused.
- the circuitry of the detection circuit 18is illustrated.
- the heart of the detection circuit 18is an analog multiplier 34, which receives the transmitted and received signals as input signals and generates an output signal that is related to the amount of distortion in the signal caused by sodium or chloride ions in the test sample.
- the waveform generator 12is a square wave generator 36, which is coupled to a Y input terminal of the analog multiplier 34 through a capacitor 38, and is coupled to the transmitting antenna 14 of the antenna probe 24 through a capacitor 40.
- the receiving antenna 16 of the antenna probe 24is coupled to an X input terminal of the analog multiplier 34 through a capacitor 42.
- Capacitors 40 and 42isolate the antenna probe from any direct current components of the signal 23.
- a capacitor and resistor networkacts as a summing circuit to supply an "average" of the transmitted and received signals to a common input terminal of the analog multiplier 34 for use as a reference signal.
- the capacitor and resistor networkincludes a resistor 44 connected between the Y input terminal and a grounded node 46, a resistor 48 connected between the X input terminal and the grounded node 46, and a resistor 50 and a capacitor 52 connected in parallel between the common input terminal and the grounded node 46.
- the analog multiplier 34in effect measures the amount of distortion between the transmitted and received signals, which is directly related to the concentration of sodium or chloride ions in the test sample 22.
- the analog multiplier 34multiplies the differential voltage applied across the X input and common terminals by the differential voltage applied across the Y input and common terminals. Since the reference signal supplied by the capacitor and resistor network is intermediate in voltage between the transmitted and received signals, one differential input to the analog multiplier 34 is positive and the other is negative.
- the X times Y product output signalis inversely related to the difference between the transmitted and received signals, and is, thus, inversely related to the concentration of sodium or chloride ions in the test sample 22.
- the output signal of the analog multiplier 34is conditioned and then supplied to the output device 20.
- a capacitor 54smooths the pulses and irregularities in the output signal of the analog multiplier 34 to supply a stable, direct current signal to a buffer 56.
- the output terminal of the buffer 56is coupled to ground through a resistor 58 and to the inverting input terminal of an operational amplifier 60 through another resistor 62.
- the operational amplifier 60is configured as an inverting amplifier with a reference voltage, Vref, supplied to its non-inverting input terminal, and a resistor 64 coupled to feedback the output, Vout, to the inverting input terminal. Since the operational amplifier 60 is configured as an inverting amplifier, the output signal of the operational amplifier 60, Vout, is directly related to the concentration of sodium or chloride ions in the test sample 22.
- the output device 20receives the output signal of the operational amplifier 60, Vout, and, if the measured concentration of sodium or chloride ions is high enough, activates one of five light emitting diodes 66.
- the output device 20includes a non-inverting operational amplifier 68, and five operational amplifiers 70 configured as comparators.
- An adjustable resistor 72is connected to feedback the output of the operational amplifier 68 to its inverting input terminal, which also is coupled to ground through a resistor 74.
- the output signal of the detection circuit 18, Voutis supplied to the non-inverting input terminal of the operational amplifier 68.
- the output terminal of the operational amplifier 68is connected to the inverting input terminals of the five comparator operational amplifiers 70.
- a resistor ladder 76consisting of six resistors 78, 80, 82, 84, 86, and 88 is coupled between a supply voltage, Vs, and ground. Each of the five internal nodes of the resistor ladder 76 is connected to the non-inverting input terminal of one of the comparator operational amplifiers 70. Resistors 90, 92, 94, 96, and 98 are connected as feedback resistors between the output terminal of each comparator operational amplifier 70 and its non-inverting input terminal.
- a resistor and diode ladder 100consisting of six resistors 102, 104, 106, 108, 110, and 112 and six diodes 66 and 114 is coupled between the supply voltage and ground.
- Each of the five internal nodes of the resistor and diode ladder 100is connected to the output terminal of one of the comparator operational amplifiers 70.
- the output terminals of four of the comparator operational amplifiers 70are coupled to the supply voltage via pull-up resistors 116, 118, 120, and 122, respectively.
- the output signal of operational amplifier 68acts in cooperation with the resistor ladder 76 and the comparator operational amplifiers 70 to turn on the appropriate light emitting diode (LED) 66.
- LEDlight emitting diode
- the output voltage of the operational amplifier 68is less than the voltage at the node between resistors 80 and 82, but greater than the voltage at the node between resistors 82 and 84. This will cause the upper two comparator operational amplifiers 70 to supply positive output voltages, while causing the lower three comparator operational amplifiers 70 to supply negative output voltages. Current will flow through resistor 106, causing the middle LED 66 to light. The other LED's 66 will not light because no current will flow through resistors 102, 104, 108, and 110.
- the waveform shape and frequency of the transmitted signalare selected so that the distortion or transformation of the signal is particularly responsive to the presence of the selected chemical. Since it is difficult to predict how various chemical substances will respond, the selection process is largely empirical.
- the first step in the selection processis to determine at which frequencies a chemical substance causes a maximum amount of distortion in a square wave signal.
- the antenna probeis inserted into a test sample containing a representative amount of the selected chemical substance.
- the distortion of the square wave signalis monitored while varying the frequency of the square wave signal through a range of frequencies somewhere between ten and one hundred megahertz.
- the distortioncan be monitored by examining the output signal of the analog multiplier, or by displaying the Lissajous patterns of the analog multiplier differential input signals on an oscilloscope and looking for complex or distorted patterns.
- the waveform shape of the transmitted signalcan be varied to investigate whether other waveforms are more susceptible to distortion by the chemical substance. Combinations of multiple signals with different frequencies and waveforms can also be investigated. The goal is to select a signal that is distorted by the presence of the selected chemical substance, but is not distorted by the presence of companion chemical substances that may be in the test sample in actual operation.
- the component values of the capacitor and resistor networkare also selected to tune the sensitivity of the apparatus to the selected chemical. This selection process is also empirical, and should be coordinated with the selection of the transmittal signal. Again, the distortion can be monitored by examining the output signal of the analog multiplier, or by displaying the Lissajous patterns of the analog multiplier differential input signals on an oscilloscope and looking for complex or distorted patterns.
- the distance between antennas 14 and 16was set at 0.80 inches. The areas of antennas were too small to reliably calculate the spacing which would produce the best efficiency, but signal peaks were observed at several spacings as the antennas were separated. The selected spacing was believed to be a fractional multiple of the transmission frequency which would enhance efficiency, although other spacings are acceptable in connection with the apparatus and method of the present invention.
- FIG. 5illustrates the output voltage, measured between the X times Y product output signal and the reference voltage, V REF , as the concentration of sodium is increased in 100 milliliters of water.
- V REFreference voltage
- the curve of FIG. 5was generated by employing a transmitted signal of 16 megahertz.
- the greatest sensitivity to distortion for chloride ionswas found by testing sodium chloride and potassium chloride to occur at 17.75 megahertz. This was determined by the empirical techniques set forth above. Sodium chloride also will distort by the transmitted square wave signal at about 18 megahertz, and 42.50 megahertz. The 17.75 megahertz frequency is somewhat better than 16 megahertz. Use of 17.75 megahertz has the advantage of being somewhat sensitive to the common table salt substitute, potassium chloride. Since transmitting a signal of 17.75 megahertz requires a custom transmitter, a signal of 18.00 megahertz can be used in commercial, economically priced "salt meter.”
- the sodium chloride detectoralso was used with vinegar, sugar, alcohol and various starch solutions and produced outputs indicating that there was no sodium chloride present. It did not, therefore, give false positive readings in such solutions, including heavily ionized solutions.
- the apparatus of the present inventioncould sense the presence and accurately measure the concentration of sodium chloride in such solutions.
- the apparatus of the present inventionalso appears to be well suited for computer implementation to perform complex chemical analysis.
- a rapid series of signals at selected frequenciescan be transmitted with corresponding circuit variations, if required, to enable a high degree of selectivity and a large range of chemical compounds to be sensed, measured, stored and then output using the apparatus of the present invention and a microprocessor controller.
Landscapes
- Physics & Mathematics (AREA)
- Biochemistry (AREA)
- General Physics & Mathematics (AREA)
- Life Sciences & Earth Sciences (AREA)
- Chemical & Material Sciences (AREA)
- Analytical Chemistry (AREA)
- Electromagnetism (AREA)
- General Health & Medical Sciences (AREA)
- Health & Medical Sciences (AREA)
- Immunology (AREA)
- Pathology (AREA)
- Investigating Or Analyzing Materials By The Use Of Electric Means (AREA)
- Analysing Materials By The Use Of Radiation (AREA)
- Investigating Or Analysing Materials By The Use Of Chemical Reactions (AREA)
- Investigating Or Analyzing Materials By The Use Of Ultrasonic Waves (AREA)
Abstract
Description
38, 40, 42 0.01 ______________________________________ capacitors microforad resistor 44 2000ohm resistor 50 1000ohm capacitor 52 0.68microfarad capacitor 54 2.2microfarad resistor 58 510062, 64 100,000 ohm resistor ohm resistor 72 5000 ohm,variable resistor 74 1000ohm resistor 78 22,000ohm resistor 80 4700ohm resistor 82 8200ohm resistor 84 12,000ohm resistor 86 8200ohm resistor 88 24,00090, 92, 94, 96, 98 470,000 ohm resistor ohm resistor 102 470ohm resistor 104 820106, 108, 110, 112 470 ohm resistor 116, 118, 120, 122 10,000 ohm ______________________________________ ohm resistor
______________________________________ Compound Megahertz ______________________________________ Potassium chloride 17.75, 35.70 Sugar 44.3, 44.6, 50.0 Vodka 16.62, 35.5, 35.95 Water 19.80, 32.05, 36.31, 35.6, 44.3, 50.0 Vinegar 20.4 ______________________________________
Claims (21)
Priority Applications (8)
| Application Number | Priority Date | Filing Date | Title |
|---|---|---|---|
| US06/774,150US4679426A (en) | 1985-09-09 | 1985-09-09 | Wave shape chemical analysis apparatus and method |
| DE3650428TDE3650428T2 (en) | 1985-09-09 | 1986-09-02 | WAVE-SHAPED CHEMICAL ANALYSIS AND METHOD. |
| AU63364/86AAU604651B2 (en) | 1985-09-09 | 1986-09-02 | Wave shape chemical analysis apparatus and method |
| PCT/US1986/001776WO1987001455A1 (en) | 1985-09-09 | 1986-09-02 | Wave shape chemical analysis apparatus and method |
| JP61504813AJP2751139B2 (en) | 1985-09-09 | 1986-09-02 | Waveform chemical analyzer and method |
| EP86905585AEP0236434B1 (en) | 1985-09-09 | 1986-09-02 | Wave shape chemical analysis apparatus and method |
| AT86905585TATE129572T1 (en) | 1985-09-09 | 1986-09-02 | WAVE-SHAPED CHEMICAL ANALYSIS APPARATUS AND METHOD. |
| US07/022,973US4765179A (en) | 1985-09-09 | 1987-03-06 | Radio frequency spectroscopy apparatus and method using multiple frequency waveforms |
Applications Claiming Priority (1)
| Application Number | Priority Date | Filing Date | Title |
|---|---|---|---|
| US06/774,150US4679426A (en) | 1985-09-09 | 1985-09-09 | Wave shape chemical analysis apparatus and method |
Related Child Applications (1)
| Application Number | Title | Priority Date | Filing Date |
|---|---|---|---|
| US07/022,973Continuation-In-PartUS4765179A (en) | 1985-09-09 | 1987-03-06 | Radio frequency spectroscopy apparatus and method using multiple frequency waveforms |
Publications (1)
| Publication Number | Publication Date |
|---|---|
| US4679426Atrue US4679426A (en) | 1987-07-14 |
Family
ID=25100389
Family Applications (1)
| Application Number | Title | Priority Date | Filing Date |
|---|---|---|---|
| US06/774,150Expired - LifetimeUS4679426A (en) | 1985-09-09 | 1985-09-09 | Wave shape chemical analysis apparatus and method |
Country Status (7)
| Country | Link |
|---|---|
| US (1) | US4679426A (en) |
| EP (1) | EP0236434B1 (en) |
| JP (1) | JP2751139B2 (en) |
| AT (1) | ATE129572T1 (en) |
| AU (1) | AU604651B2 (en) |
| DE (1) | DE3650428T2 (en) |
| WO (1) | WO1987001455A1 (en) |
Cited By (28)
| Publication number | Priority date | Publication date | Assignee | Title |
|---|---|---|---|---|
| WO1990002330A1 (en)* | 1988-08-16 | 1990-03-08 | Elman Associates | Measuring the degree of mixing in a turbulent liquid |
| US5157961A (en)* | 1990-07-04 | 1992-10-27 | Madid Industrial Controls Ltd. | Apparatus for measuring the relative amount of a liquid in a mixture |
| US5508203A (en)* | 1993-08-06 | 1996-04-16 | Fuller; Milton E. | Apparatus and method for radio frequency spectroscopy using spectral analysis |
| US5553616A (en)* | 1993-11-30 | 1996-09-10 | Florida Institute Of Technology | Determination of concentrations of biological substances using raman spectroscopy and artificial neural network discriminator |
| US5642734A (en)* | 1990-10-04 | 1997-07-01 | Microcor, Inc. | Method and apparatus for noninvasively determining hematocrit |
| WO1997039341A1 (en)* | 1996-04-15 | 1997-10-23 | Solid State Farms, Inc. | Improving radio frequency spectral analysis for in vitro or in vivo environments |
| US5729787A (en)* | 1996-07-23 | 1998-03-17 | Eastman Kodak Company | Toner concentration monitor and method |
| US6338968B1 (en) | 1998-02-02 | 2002-01-15 | Signature Bioscience, Inc. | Method and apparatus for detecting molecular binding events |
| US6368795B1 (en) | 1998-02-02 | 2002-04-09 | Signature Bioscience, Inc. | Bio-assay device and test system for detecting molecular binding events |
| US6395480B1 (en) | 1999-02-01 | 2002-05-28 | Signature Bioscience, Inc. | Computer program and database structure for detecting molecular binding events |
| US20030011476A1 (en)* | 2000-02-26 | 2003-01-16 | Godfrey James William | Medicament dispenser |
| US20030081574A1 (en)* | 2001-10-25 | 2003-05-01 | Ntt Docomo, Inc. | Radio base station and method of controlling radio communications |
| US20030146836A1 (en)* | 2000-05-24 | 2003-08-07 | Wood Christopher Ivor | Monitoring method |
| US20030183226A1 (en)* | 2000-07-15 | 2003-10-02 | Brand Peter John | Medicament dispenser |
| US20040065158A1 (en)* | 2001-03-06 | 2004-04-08 | Schrepfer Thomas W. | Method and device for determining the concentration of a substance in body liquid |
| US20040100415A1 (en)* | 2000-06-06 | 2004-05-27 | Veitch Jeffrey Douglas | Sample container with radiofrequency identifier tag |
| US20040147819A1 (en)* | 2001-03-06 | 2004-07-29 | Andreas Caduff | Impedance spectroscopy based systems and methods |
| US20050203361A1 (en)* | 2002-09-04 | 2005-09-15 | Pendragon Medical Ltd. | Method and a device for measuring glucose |
| US20050203363A1 (en)* | 2002-09-24 | 2005-09-15 | Pendragon Medical Ltd. | Device for the measurement of glucose concentrations |
| US20070282180A1 (en)* | 2003-11-27 | 2007-12-06 | Andreas Caduff | Techniques for Determining Glucose Levels |
| US20080319293A1 (en)* | 2007-06-21 | 2008-12-25 | Pindi Products, Inc. | Sample scanning and analysis system and methods for using the same |
| US20090107216A1 (en)* | 2007-10-30 | 2009-04-30 | National Taiwan University | Dual-band micro-planar inverted f antenna used for biomolecular finger print and its identification method |
| US20090312615A1 (en)* | 2005-11-10 | 2009-12-17 | Andreas Caduff | Device for Determining the Glucose Level in Body Tissue |
| US20100069731A1 (en)* | 2007-06-21 | 2010-03-18 | Pindi Products, Inc. | Non-Invasive Weight and Performance Management |
| US20100065751A1 (en)* | 2007-06-21 | 2010-03-18 | Pindi Products, Inc. | Non-invasive scanning apparatuses |
| US20100072386A1 (en)* | 2007-06-21 | 2010-03-25 | Pindi Products, Inc. | Non-Invasive Determination of Characteristics of a Sample |
| US20100099960A1 (en)* | 2003-12-02 | 2010-04-22 | Andreas Caduff | Device and method for measuring a property of living tissue |
| US8259299B2 (en) | 2007-06-21 | 2012-09-04 | Rf Science & Technology Inc. | Gas scanning and analysis |
Families Citing this family (2)
| Publication number | Priority date | Publication date | Assignee | Title |
|---|---|---|---|---|
| GB2288022A (en)* | 1994-03-23 | 1995-10-04 | Central Research Lab Ltd | Method of sensing the condition of a piece of food |
| DE102018129356A1 (en)* | 2018-11-21 | 2020-05-28 | Endress+Hauser SE+Co. KG | Measuring device |
Citations (7)
| Publication number | Priority date | Publication date | Assignee | Title |
|---|---|---|---|---|
| US3048772A (en)* | 1955-05-31 | 1962-08-07 | Exxon Research Engineering Co | Process for conducting quantitative analyses |
| US3287638A (en)* | 1962-10-02 | 1966-11-22 | Univ Iowa State Res Found Inc | Method of counting erythrocytes utilizing high frequency current |
| US3489522A (en)* | 1965-10-15 | 1970-01-13 | Synvar Ass | Electron spin resonance labeling of biomolecules |
| US3648513A (en)* | 1970-01-05 | 1972-03-14 | Dow Chemical Co | Sonic method and means for determination of solution concentrations |
| US3654072A (en)* | 1970-05-27 | 1972-04-04 | Dynamics Corp America | Monitoring a chemical processing system by measuring the instantaneous sound transmission characteristics therein |
| US3765841A (en)* | 1971-08-06 | 1973-10-16 | Beckman Instruments Inc | Method and apparatus for chemical analysis |
| US4327587A (en)* | 1978-08-01 | 1982-05-04 | Vyzkumny ustav chemickych zrizeni | Method of and apparatus for the continuous measurement of changes in rheological properties of monomers during polymerization |
Family Cites Families (3)
| Publication number | Priority date | Publication date | Assignee | Title |
|---|---|---|---|---|
| US3626284A (en)* | 1969-08-07 | 1971-12-07 | Bendix Corp | An apparatus for measuring changes in microwave frequencies corresponding to the density of a fluid |
| US3789655A (en)* | 1972-03-20 | 1974-02-05 | Bendix Corp | Fluid analyzer |
| GB2094033B (en)* | 1981-02-25 | 1985-01-03 | Cons Design Inc | Method and apparatus for measuring selected characteristics of fluids |
- 1985
- 1985-09-09USUS06/774,150patent/US4679426A/ennot_activeExpired - Lifetime
- 1986
- 1986-09-02WOPCT/US1986/001776patent/WO1987001455A1/enactiveIP Right Grant
- 1986-09-02EPEP86905585Apatent/EP0236434B1/ennot_activeExpired - Lifetime
- 1986-09-02JPJP61504813Apatent/JP2751139B2/ennot_activeExpired - Lifetime
- 1986-09-02ATAT86905585Tpatent/ATE129572T1/ennot_activeIP Right Cessation
- 1986-09-02AUAU63364/86Apatent/AU604651B2/ennot_activeCeased
- 1986-09-02DEDE3650428Tpatent/DE3650428T2/ennot_activeExpired - Fee Related
Patent Citations (7)
| Publication number | Priority date | Publication date | Assignee | Title |
|---|---|---|---|---|
| US3048772A (en)* | 1955-05-31 | 1962-08-07 | Exxon Research Engineering Co | Process for conducting quantitative analyses |
| US3287638A (en)* | 1962-10-02 | 1966-11-22 | Univ Iowa State Res Found Inc | Method of counting erythrocytes utilizing high frequency current |
| US3489522A (en)* | 1965-10-15 | 1970-01-13 | Synvar Ass | Electron spin resonance labeling of biomolecules |
| US3648513A (en)* | 1970-01-05 | 1972-03-14 | Dow Chemical Co | Sonic method and means for determination of solution concentrations |
| US3654072A (en)* | 1970-05-27 | 1972-04-04 | Dynamics Corp America | Monitoring a chemical processing system by measuring the instantaneous sound transmission characteristics therein |
| US3765841A (en)* | 1971-08-06 | 1973-10-16 | Beckman Instruments Inc | Method and apparatus for chemical analysis |
| US4327587A (en)* | 1978-08-01 | 1982-05-04 | Vyzkumny ustav chemickych zrizeni | Method of and apparatus for the continuous measurement of changes in rheological properties of monomers during polymerization |
Cited By (50)
| Publication number | Priority date | Publication date | Assignee | Title |
|---|---|---|---|---|
| US5033321A (en)* | 1988-08-16 | 1991-07-23 | Gerson Donald F | Method and apparatus for measuring the degree of mixing in a turbulent liquid system |
| WO1990002330A1 (en)* | 1988-08-16 | 1990-03-08 | Elman Associates | Measuring the degree of mixing in a turbulent liquid |
| US5157961A (en)* | 1990-07-04 | 1992-10-27 | Madid Industrial Controls Ltd. | Apparatus for measuring the relative amount of a liquid in a mixture |
| US5642734A (en)* | 1990-10-04 | 1997-07-01 | Microcor, Inc. | Method and apparatus for noninvasively determining hematocrit |
| US5792668A (en)* | 1993-08-06 | 1998-08-11 | Solid State Farms, Inc. | Radio frequency spectral analysis for in-vitro or in-vivo environments |
| US5508203A (en)* | 1993-08-06 | 1996-04-16 | Fuller; Milton E. | Apparatus and method for radio frequency spectroscopy using spectral analysis |
| US5553616A (en)* | 1993-11-30 | 1996-09-10 | Florida Institute Of Technology | Determination of concentrations of biological substances using raman spectroscopy and artificial neural network discriminator |
| WO1997039341A1 (en)* | 1996-04-15 | 1997-10-23 | Solid State Farms, Inc. | Improving radio frequency spectral analysis for in vitro or in vivo environments |
| US5729787A (en)* | 1996-07-23 | 1998-03-17 | Eastman Kodak Company | Toner concentration monitor and method |
| US6338968B1 (en) | 1998-02-02 | 2002-01-15 | Signature Bioscience, Inc. | Method and apparatus for detecting molecular binding events |
| US6368795B1 (en) | 1998-02-02 | 2002-04-09 | Signature Bioscience, Inc. | Bio-assay device and test system for detecting molecular binding events |
| US6376258B2 (en) | 1998-02-02 | 2002-04-23 | Signature Bioscience, Inc. | Resonant bio-assay device and test system for detecting molecular binding events |
| US6395480B1 (en) | 1999-02-01 | 2002-05-28 | Signature Bioscience, Inc. | Computer program and database structure for detecting molecular binding events |
| US20030011476A1 (en)* | 2000-02-26 | 2003-01-16 | Godfrey James William | Medicament dispenser |
| US7151456B2 (en) | 2000-02-26 | 2006-12-19 | Glaxo Group Limited | Medicament dispenser |
| US7009517B2 (en) | 2000-05-24 | 2006-03-07 | Glaxo Group Limited | Method for monitoring objects with transponders |
| US20030146836A1 (en)* | 2000-05-24 | 2003-08-07 | Wood Christopher Ivor | Monitoring method |
| US20070075141A1 (en)* | 2000-06-06 | 2007-04-05 | Glaxo Group Limited | Sample container with radiofrequency identifier tag |
| US7091864B2 (en) | 2000-06-06 | 2006-08-15 | Glaxo Group Limited | Sample container with radiofrequency identifier tag |
| US20040100415A1 (en)* | 2000-06-06 | 2004-05-27 | Veitch Jeffrey Douglas | Sample container with radiofrequency identifier tag |
| US20030183226A1 (en)* | 2000-07-15 | 2003-10-02 | Brand Peter John | Medicament dispenser |
| US7819116B2 (en) | 2000-07-15 | 2010-10-26 | Glaxo Group Limited | Medicament dispenser |
| US20070163583A1 (en)* | 2000-07-15 | 2007-07-19 | Brand Peter J | Medicament dispenser |
| US7191777B2 (en) | 2000-07-15 | 2007-03-20 | Glaxo Group Limited | Medicament dispenser |
| US20060004269A9 (en)* | 2001-03-06 | 2006-01-05 | Andreas Caduff | Impedance spectroscopy based systems and methods |
| US20040065158A1 (en)* | 2001-03-06 | 2004-04-08 | Schrepfer Thomas W. | Method and device for determining the concentration of a substance in body liquid |
| US7693561B2 (en) | 2001-03-06 | 2010-04-06 | Solianis Holding Ag | Method and device for determining the concentration of a substance in body liquid |
| US7315767B2 (en) | 2001-03-06 | 2008-01-01 | Solianis Holding Ag | Impedance spectroscopy based systems and methods |
| US20040147819A1 (en)* | 2001-03-06 | 2004-07-29 | Andreas Caduff | Impedance spectroscopy based systems and methods |
| US20030081574A1 (en)* | 2001-10-25 | 2003-05-01 | Ntt Docomo, Inc. | Radio base station and method of controlling radio communications |
| US7184810B2 (en) | 2002-09-04 | 2007-02-27 | Solianis Holding Ag | Method and a device for measuring glucose |
| US20050203361A1 (en)* | 2002-09-04 | 2005-09-15 | Pendragon Medical Ltd. | Method and a device for measuring glucose |
| US20050203363A1 (en)* | 2002-09-24 | 2005-09-15 | Pendragon Medical Ltd. | Device for the measurement of glucose concentrations |
| US7534208B2 (en) | 2002-09-24 | 2009-05-19 | Max Link | Device for the measurement of glucose concentrations |
| US20070282180A1 (en)* | 2003-11-27 | 2007-12-06 | Andreas Caduff | Techniques for Determining Glucose Levels |
| US20100099960A1 (en)* | 2003-12-02 | 2010-04-22 | Andreas Caduff | Device and method for measuring a property of living tissue |
| US8197406B2 (en) | 2003-12-02 | 2012-06-12 | Biovotion Ag | Device and method for measuring a property of living tissue |
| US20090312615A1 (en)* | 2005-11-10 | 2009-12-17 | Andreas Caduff | Device for Determining the Glucose Level in Body Tissue |
| US9713447B2 (en) | 2005-11-10 | 2017-07-25 | Biovotion Ag | Device for determining the glucose level in body tissue |
| US20080319293A1 (en)* | 2007-06-21 | 2008-12-25 | Pindi Products, Inc. | Sample scanning and analysis system and methods for using the same |
| US20100069731A1 (en)* | 2007-06-21 | 2010-03-18 | Pindi Products, Inc. | Non-Invasive Weight and Performance Management |
| US20100072386A1 (en)* | 2007-06-21 | 2010-03-25 | Pindi Products, Inc. | Non-Invasive Determination of Characteristics of a Sample |
| US8259299B2 (en) | 2007-06-21 | 2012-09-04 | Rf Science & Technology Inc. | Gas scanning and analysis |
| US8382668B2 (en) | 2007-06-21 | 2013-02-26 | Rf Science & Technology Inc. | Non-invasive determination of characteristics of a sample |
| US8647272B2 (en) | 2007-06-21 | 2014-02-11 | Rf Science & Technology Inc | Non-invasive scanning apparatuses |
| US8647273B2 (en) | 2007-06-21 | 2014-02-11 | RF Science & Technology, Inc. | Non-invasive weight and performance management |
| US20100065751A1 (en)* | 2007-06-21 | 2010-03-18 | Pindi Products, Inc. | Non-invasive scanning apparatuses |
| US10264993B2 (en) | 2007-06-21 | 2019-04-23 | Rf Science & Technology Inc. | Sample scanning and analysis system and methods for using the same |
| US20090107216A1 (en)* | 2007-10-30 | 2009-04-30 | National Taiwan University | Dual-band micro-planar inverted f antenna used for biomolecular finger print and its identification method |
| US7820372B2 (en)* | 2007-10-30 | 2010-10-26 | National Taiwan University | Dual-band micro-planar inverted F antenna used for biomolecular finger print and its identification method |
Also Published As
| Publication number | Publication date |
|---|---|
| JPS63500741A (en) | 1988-03-17 |
| EP0236434A1 (en) | 1987-09-16 |
| EP0236434A4 (en) | 1989-03-29 |
| ATE129572T1 (en) | 1995-11-15 |
| JP2751139B2 (en) | 1998-05-18 |
| AU604651B2 (en) | 1991-01-03 |
| DE3650428T2 (en) | 1996-04-04 |
| AU6336486A (en) | 1987-03-24 |
| DE3650428D1 (en) | 1995-11-30 |
| WO1987001455A1 (en) | 1987-03-12 |
| EP0236434B1 (en) | 1995-10-25 |
Similar Documents
| Publication | Publication Date | Title |
|---|---|---|
| US4679426A (en) | Wave shape chemical analysis apparatus and method | |
| US4765179A (en) | Radio frequency spectroscopy apparatus and method using multiple frequency waveforms | |
| EP0721103B1 (en) | Apparatus for identifying container components using electrical conductivity | |
| US7205769B2 (en) | Method and apparatus for processing a signal received by an electromagnetic prober | |
| EP2405263B1 (en) | Analysis of a dielectric medium | |
| US3965416A (en) | Dielectric-constant measuring apparatus | |
| CA1226898A (en) | Method and apparatus for measuring soil salinity | |
| US3982177A (en) | Soil sample conductivity measurement utilizing a bridge circuit and plural electrode cell | |
| GB2269901A (en) | Determining concentration of gas, particularly breath alcohol | |
| Vacík et al. | Improvement of the performance of a high-frequency contactless conductivity detector for isotachophoresis | |
| CN108445051A (en) | A kind of online device for testing moisture content of wood | |
| NO159220B (en) | DETECTOR TO DETECT IONE CONCENTRATION IN A CASE. | |
| US4525666A (en) | Cell breakdown | |
| CN104067113A (en) | Low-conductivity contacting-type conductivity measurement system | |
| JPH11304764A (en) | Moisture sensor | |
| US4864282A (en) | Method and apparatus for detecting or measuring the presence of humans or biological organism | |
| US20220178866A1 (en) | Method for measuring semiconductor gas sensor based on virtual alternating current impedance | |
| CN110954584B (en) | A kind of taste test method and verification method based on electronic tongue | |
| Mandaris et al. | Time efficient reverberation chamber performance analysis using simultaneous multiprobe measurement technique | |
| McKee et al. | Real-time chemical sensing of aqueous ethanol glucose mixtures | |
| CN109459486B (en) | Method for measuring water content of meat product by utilizing electromagnetic induction | |
| JP2795099B2 (en) | Device for measuring DUT using electromagnetic waves | |
| Sulthoni et al. | Development of economical microcontroller-based soil moisture sensor using time domain reflectometry | |
| Opekar et al. | A contactless impedance probe for simple and rapid determination of the ratio of liquids with different permittivities in binary mixtures | |
| RU2362990C2 (en) | Method and device to verify substance availability and chemical composition |
Legal Events
| Date | Code | Title | Description |
|---|---|---|---|
| STCF | Information on status: patent grant | Free format text:PATENTED CASE | |
| AS | Assignment | Owner name:SOLID STATE FARMS, INC., A CORP. OF NV Free format text:ASSIGNMENT OF ASSIGNORS INTEREST.;ASSIGNORS:FULLER MILTON, E.;FLETCHER GARY S. JR.;REEL/FRAME:004755/0549 Effective date:19870822 | |
| FEPP | Fee payment procedure | Free format text:PAYOR NUMBER ASSIGNED (ORIGINAL EVENT CODE: ASPN); ENTITY STATUS OF PATENT OWNER: SMALL ENTITY | |
| FPAY | Fee payment | Year of fee payment:4 | |
| AS | Assignment | Owner name:SOLID STATE FARMS, INC. A DE CORP., NEVADA Free format text:ASSIGNMENT OF ASSIGNORS INTEREST.;ASSIGNOR:SOLID STATE FARMS, INC. A CORP. OF NV;REEL/FRAME:006248/0362 Effective date:19920626 | |
| AS | Assignment | Owner name:GORDON ROCK, WASHINGTON Free format text:SECURITY INTEREST;ASSIGNOR:SOLID STATE FARMS, INC. A CORP. OF THE STATE OF DE;REEL/FRAME:006309/0554 Effective date:19920426 | |
| AS | Assignment | Owner name:SUMITOMO CORPORATION, NEW JERSEY Free format text:SECURITY INTEREST;ASSIGNOR:SOLID STATE FARMS, INC.;REEL/FRAME:006920/0305 Effective date:19940315 Owner name:SUMITOMO CORPORATION OF AMERICA, PENNSYLVANIA Free format text:SECURITY INTEREST;ASSIGNOR:SOLID STATE FARMS, INC.;REEL/FRAME:006920/0305 Effective date:19940315 Owner name:HOECHST-ROUSSEL PHARMACEUTICALS INC., NEW JERSEY Free format text:SECURITY INTEREST;ASSIGNOR:SOLID STATE FARMS, INC.;REEL/FRAME:006920/0305 Effective date:19940315 Owner name:SUMITOMO CORPORATION, JAPAN Free format text:SECURITY INTEREST;ASSIGNOR:SOLID STATE FARMS, INC.;REEL/FRAME:006920/0305 Effective date:19940315 | |
| FPAY | Fee payment | Year of fee payment:8 | |
| AS | Assignment | Owner name:SOLID STATE FARMS, INC. ( A CORP. OF DE), NEVADA Free format text:RELEASE OF SECURITY OF INTEREST;ASSIGNORS:HOECHST-ROUSSEL PHARMACEUTICALS, INC.;SUMITOMO CORPORATION OF AMERICA;SUMITOMO CORPORATION;REEL/FRAME:007577/0558 Effective date:19941216 | |
| AS | Assignment | Owner name:ROCK, GORDON, WASHINGTON Free format text:SECURITY AGREEMENT;ASSIGNOR:SOLID STATE FARMS, INC.;REEL/FRAME:009089/0443 Effective date:19980306 | |
| FPAY | Fee payment | Year of fee payment:12 |