US12224169B2 - Interactive analysis of mass spectrometry data - Google Patents
Interactive analysis of mass spectrometry dataDownload PDFInfo
- Publication number
- US12224169B2 US12224169B2US17/706,539US202217706539AUS12224169B2US 12224169 B2US12224169 B2US 12224169B2US 202217706539 AUS202217706539 AUS 202217706539AUS 12224169 B2US12224169 B2US 12224169B2
- Authority
- US
- United States
- Prior art keywords
- molecule
- interest
- data
- pivot
- user
- Prior art date
- Legal status (The legal status is an assumption and is not a legal conclusion. Google has not performed a legal analysis and makes no representation as to the accuracy of the status listed.)
- Active, expires
Links
Images


Classifications
- H—ELECTRICITY
- H01—ELECTRIC ELEMENTS
- H01J—ELECTRIC DISCHARGE TUBES OR DISCHARGE LAMPS
- H01J49/00—Particle spectrometers or separator tubes
- H01J49/0027—Methods for using particle spectrometers
- H01J49/0036—Step by step routines describing the handling of the data generated during a measurement
- H—ELECTRICITY
- H01—ELECTRIC ELEMENTS
- H01J—ELECTRIC DISCHARGE TUBES OR DISCHARGE LAMPS
- H01J49/00—Particle spectrometers or separator tubes
- H01J49/02—Details
Definitions
- This inventionrelates to graphical user-interactive reports for use in mass spectrometery (MS) based analysis of proteins, as well as methods and software for generating and using such.
- MSmass spectrometery
- biologicalsDue to the complexity of proteins and their biological production, characterization of protein pharmaceuticals (“biologics”) poses much more demanding analytical challenges than do small molecule drugs. Biologics are prone to production problems such as sequence variation, misfolding, variant glycosylation, and post-production degradation including aggregation and modifications such as oxidation and deamidation. These problems can lead to loss of safety and efficacy, so the biopharmaceutical industry would like to identify and quantify variant and degraded forms of the product down to low concentrations, plus obtain tertiary structure information. Because of the rapidly increasing power of mass spectrometry (MS), an MS-based platform for comprehensive measurement of almost all the relevant drug's physical characteristics is now conceivable. A crucial piece of such a platform is data analysis software focused to address the needs of the biopharmaceutical industry.
- MSmass spectrometry
- Quality assurance for monoclonal antibodiesmust consider primary structure, higher order structure, glycosylation and heterogeneity.
- Primary structure analysescan include total mass (as measured by MS), amino acid sequence (as measured by orthogonal peptide mapping with high resolution MS and MS/MS sequencing), disulfide bridging (as measured by non-reducing peptide mapping), free cysteines (as measured by Ellman's or peptide mapping), and thioether bridging (as measured by peptide mapping, SDS-PAGE, or CGE).
- Higher order structurecan be analyzed using CD spectroscopy, DSC, H-D-exchange, and FT-IR.
- Glycosylationrequires identification of glycan isoforms (by NP-HPLC-ESI-MS, exoglycosidase digestion, and/or MALDI TOF/TOF), sialic acid (by NP-HPLC, WAX, HPAEC, RP-HPLC) and aglycolsylation (by CGE and peptide mapping).
- Heterogeneity analysesmust take into consideration C- and N-terminal modifications, glycation of lysine, oxidation, deamidation, aggregation, disulfide bond shuffling, and amino acid substitutions, insertions and deletions. The large variety of assays and techniques gives some idea of the daunting analytical challenge.
- MSMass spectrometry
- MS-based assaysare lack of high-quality data analysis software, and in particular, the ability to dynamically interpret and display reports on the often complex results.
- MSUnlike slow gel-based peptide mapping, which allows human visual comparison, MS generally relies on automatic data analysis, due to the huge numbers of spectra (often >10,000/hour), the high accuracy of the measurements (often in the 1-10 ppm range), and the complexity of spectra (100 s of peaks spanning a dynamic range >1000).
- Described hereinare user-interactive apparatuses for the interpretation of MS-based analysis of proteins, as well as methods and software for generating and using reports, including pivot tables on such information.
- described hereinare interactive apparatuses and methods for generating useful, simplified reports from highly complex MS data, and in particular, data from multiple MS datasets. It is common to run multiple trials of the same protein, but it has proven difficult to analyze, and in particular, to concurrently analyze, such multiple trials.
- the methods and apparatuses described hereinallow the use of multiple initial data sets (MS based data sets) into a single data flow (e.g., a data flow module, which may be implement in hardware, software or some combination thereof), from which one or more reports may be generated.
- Each flat tablemay correspond to a set of MS based data and may include information specific to the MS of the protein.
- the datamay be combined into a single flat table (e.g., as opposed to pivot table) and pre-processed prior to being rendered as a pivot table.
- the pre-pivot processingmay include extraction of metadata from the flat table. This pre-pivot processing may be performed using a scripting language or toolset that allows virtually any, including non-linear, analysis, to be performed on the MS data in the flat table.
- This new metadatamay be added to the flat table and the flat table with the new metadata may be processed through the pivot table engine to generate a pivot table.
- post-pivot metadata extractionmay be performed to determine data from the pivot table (e.g., averages, etc.) and this new set of data may be added to the pivot table output from the pivot table engine.
- the post-pivot table datamay be added to the flat table and re-run.
- the dashed boxmay refer to a configuration file, including the pre- and post-pivot metadata extraction.
- the metadata extractionmay refer to the data extracted or determined from the flat table, without requiring additional data. This new data (manipulated/extracted from the flat table) may be added to the flat table (e.g., the summed flat table).
- An apparatus including a user interface for controlling the pivot table engine, including the selection and display of components (including the pre- and/or post-pivot metadata)may be manipulated, in real time, by the user, who may adjust the resulting pivot table and other reports (e.g., graphical output). This is illustrated in the figures ( FIGS. 2 A- 38 U ) herein.
- a computer-implemented method for dynamically preparing reports from a mass spectrometry data set associated with a molecule of interestcan include displaying an inspection view component of a user interface, the inspection view component comprising a table window and a spectrum window, the table window comprising a table of values comprising a plurality of mass-to-charge ratio values associated with the molecule of interest, the spectrum window comprising a graph indicating one or more peaks corresponding to mass-to-charge ratios of at least one molecular species associated with the molecule of interest.
- the methodcan also include receiving, from a user, one or more selections modifying one or more of the table of values and the graph indicating the one or more peaks.
- the methodcan further include displaying, in response to a user's export command, a report view component of the user interface comprising pivot tabs selectable by the user, each of the pivot tabs configured to display all or a subset of the information from the modified one or more of the table of values and the graph indicating the one or more peaks of the inspection view component of the user interface.
- the methodcan additionally include selecting, in response to a user's tab selection, one of the pivot tabs to display within the report view component of the user interface, wherein the selected pivot tab comprises an active element window configured to display a first subset of pivot functions, a display window configured to display one or more of a report table and a report graph based on the first subset of pivot functions, and a storage window configured to display a second subset of pivot functions that is not displayed in the display window.
- the methodcan also include moving, in response to a user-input move command, one or more pivot functions between the active element window and the storage window to adjust the one or more of the report table and the report graph displayed in the display window.
- the methodcan further include saving the pivot functions contained in the active element window as the first subset of pivot functions associated with the selected pivot tab.
- a computer-implemented method for dynamically preparing reports from a mass spectrometry data set associated with a molecule of interestcan include displaying an inspection view component of a user interface, the inspection view component comprising a table window and a spectrum window, the table window comprising a table of values comprising a plurality of mass-to-charge ratio values associated with the molecule of interest, the spectrum window comprising a graph indicating one or more peaks corresponding to mass-to-charge ratios of at least one molecular species associated with the molecule of interest.
- the methodcan also include receiving, from a user, one or more selections modifying one or more of the table of values and the graph indicating the one or more peaks.
- the methodcan further include displaying, in response to a user's export command, a report view component of the user interface comprising pivot tabs selectable by the user, each of the pivot tabs configured to display all or a subset of the information from the modified one or more of the table of values and the graph indicating the one or more peaks from the inspection view component of the user interface.
- the methodcan additionally include selecting, in response to a user's tab selection, one of the pivot tabs to display within the report view component of the user interface, wherein the selected pivot tab comprises an active element window configured to display a first subset of pivot functions, a display window configured to display one or more of a report table and a report graph based on the first subset of pivot functions, and a storage window configured to display a second subset of pivot functions that is not displayed in the display window.
- the methodcan also include toggling between the inspection view component and the report view component based on user input, and dynamically modifying the pivot tabs in response to a user further modifying one or more of the table of values and the graph in the inspection view component.
- the methodcan further include generating a report from one or more of the pivot tabs.
- a computer-implemented method for dynamically preparing reports associated with a molecule of interestmay include: displaying an inspection view component of a user interface including mass spectrometry (MS) data, the inspection view component further comprising: a window including values associated with the molecule of interest, wherein the values associated with the molecule of interest are one or more of: mass values, mass-over-charge ratio (m/z) values, or values derived from mass-to-charge ratios, and data from one or more analytical techniques specific to the molecule of interest; and a spectrum window including a graph indicating peaks corresponding to the values associated with the molecule of interest; displaying a report view on a user interface dashboard, the report view comprising one or more selectable pivot tabs, each of the one or more selectable pivot tabs including all or a subset of information from one or both of the values associated with the molecule of interest and the graph having peaks corresponding to the values associated with the molecule of interest; and dynamically modifying a selected pivot tab in response to a user
- the one or more analytical techniques specific to the molecule of interestmay be chromatography data (e.g., liquid chromatography (LC), gas chromatography, ion mobility, gel electrophoresis and/or capillary electrophoresis).
- chromatography datae.g., liquid chromatography (LC), gas chromatography, ion mobility, gel electrophoresis and/or capillary electrophoresis.
- the one or more analytical techniques specific to the molecule of interestmay comprise pH and/or O 2 levels, bioreactor sample data, clinical data, or charge variant data.
- the apparatuses and method described hereinmay include the ability to compare an analyze data over time (e.g., new datasets, pivot tables, etc.).
- these reportse.g., report views
- the outputmay be a dashboard (e.g., a user interface report) that shows data but may be updated as data is added. This is a dynamic and in some examples interactive process.
- a dashboarde.g., a user interface report
- any of the computer-implemented methods and apparatuses described hereinmay be performed on a local and/or a remote processor.
- a remote processormay be used to perform many or all of the steps of these methods.
- the displays, including the dashboardmay be displayed locally from a remote (e.g., web-driven) system.
- these methods and apparatusesmay be used with any appropriate types of data, in addition to the MS data, on a molecule (or molecules) of interest.
- the displaysare not limited to MS data.
- any type of process datamay be included, including, but not limited to analytical techniques (e.g., chromatography, charge variants, etc.) related to and/or connect to mass-spec species, etc.
- the process datamay include data on one or more samples from a bioreactor including the molecule(s) of interest.
- the datamay include sensor data related to the molecule(s) of interest, such as pH/O2 levels, feed information (e.g., in examples include a bioreactor), data specific to particular clones or subsets of the target molecule(s) of interest.
- the datamay include one or more additional types of biological data, including (but not limited to clinical data).
- the datamay include data related to the molecule of interest, or data related to one or more instruments used to collect other data about the molecule of interest, and/or to patient-specific data. Virtually any data may be included.
- a non-transitory computer-readable medium with instructions stored thereonthat when executed by a processor, perform steps comprising: storing a mass spectrometry data set associated with a molecule of interest in a memory location; displaying an inspection view component of a user interface, the inspection view component comprising a table window and a spectrum window, the table window comprising a table of values comprising a plurality of mass-to-charge ratio values associated with the molecule of interest, the spectrum window comprising a graph indicating one or more peaks corresponding to mass-to-charge ratios of at least one molecular species associated with the molecule of interest; receiving, from a user, one or more selections modifying one or more of the table of values and the graph indicating the one or more peaks; displaying, in response to a user's export command, a report view component of the user interface comprising pivot tabs selectable by the user, each of the pivot tabs configured to display all or a subset of the information from the modified one or more of
- the report view component of the user interfacecan include default tabs including one or more of: a summary tab that, when selected, is configured to display a description of the molecule of interest and mass spectrometry parameters; a coverage tab that, when selected, is configured to display information related to the molecule of interest; a percent modification tab that, when selected, is configured to display information associated with modifications to the molecule of interest; and an average percent modification tab that, when selected, is configured to display the information associated with modifications averaged among multiple mass spectrometry data sets.
- the usermay be able to toggle between the inspection view component and the report view component based on user input.
- the inspection view componentcomprises a chromatogram of the mass spectrometry data set.
- the apparatusmay be configured to dynamically modify one or more of the pivot tabs in response to the user further modifying one or more of the table of values and the graph indicating the one or more peaks of the inspection view component of the user interface.
- the table of values of the table window of the inspection view componentcan include information associated with the intact molecule of interest and/or one or more fragments of the molecule of interest.
- the informationcan include one or more of an occurrence, modifications, isotopes, and date of mass spectrometry associated with the intact molecule of interest and/or the one or more fragments of the molecule of interest.
- Displaying the inspection viewcan comprise dynamically adjusting the table window and the spectrum window as the user modifies one or more of the table of values and the graph indicating the one or more peaks.
- the apparatusmay be configured to modify an order or arrangement of information displayed in the report table and/or the report graph of the display window in response to user input. Modifying one or more of the pivot tabs can comprise dynamically adjusting the display window in the report view component of the user interface. In the inspection view component, the user may be able to select one or more peaks and/or be able to select a range of mass-to-charge ratios around one or more peaks.
- the apparatusmay be configured to generate a report from the display window of one or more of the pivot tabs.
- the apparatusmay be configured to apply one or more filters to the first subset of pivot functions in the active element window in response to user input.
- the usermay be able to select one or more additional mass spectrometry data sets, wherein displaying the report view component comprises concatenating the mass spectrometry data set with one or more additional mass spectrometry data sets so that the table window and/or the spectrum window is populated with information from the concatenated mass spectrometry data set.
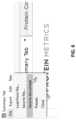
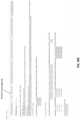
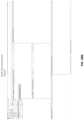
- FIG. 1provides a schematic overview of a method of dynamically determining a pivot table from mass spectrometry data.
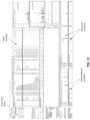
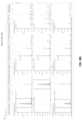
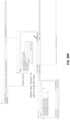
- FIG. 2 Aprovides a schematic diagram of a data flow for reporting mass spectrometry data.
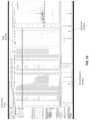
- FIG. 2 Bshows additional detail on the report modules from the overview of FIG. 2 A .
- FIG. 2 Cillustrates additional detail on the user interface (UI) rendering for FIGS. 2 A- 2 B .
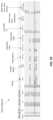
- FIG. 2 Dis a flow for rending reports in detail from FIGS. 2 A- 2 C .
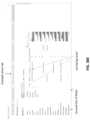
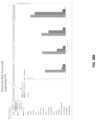
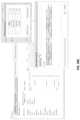
- FIG. 3illustrates a pivot report with charts having heat map shading.
- FIGS. 4 and 5illustrate how a user can modify tab settings from the report view component of the user interface.
- FIG. 6illustrates how a user can save a current configuration from the report view component of the user interface.
- FIG. 7illustrates how a user can choose to normalize results from the report view component of the user interface.
- FIG. 8illustrates how a user can manipulate the format of the report from the report view component of the user interface.
- FIG. 9illustrates how a user can modify filter options from the report view component of the user interface.
- FIG. 10illustrates how a user can filter values for reporting using numeric operands from the report view component of the user interface.
- FIGS. 11 and 12illustrate an inspection view component of a user interface, indicating how to hide wildtype protein data.
- FIG. 13illustrates a search filter window for filtering data presented in the inspection view module.
- FIGS. 14 and 15illustrate how to stack peaks in an inspection view component of a user interface.
- FIG. 16illustrates a protein coverage window accessed by a user from a report view component of the user interface.
- FIG. 17illustrates how a report can be presented in a traffic light format from the report view component of the user interface.
- FIGS. 18 and 19illustrate how a user can choose automatic assignment of reference masses from the report view component of the user interface.
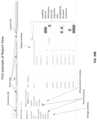
- FIG. 20illustrates how a user can calculate an average protein mass from the report view component of the user interface.
- FIG. 21illustrates how a user can control mass area computation during and after a project is created.
- FIGS. 22 A- 22 Billustrate how a user can create customized names.
- FIG. 23illustrates how a user can retroactively edit the masses of the protein and delta masses.
- FIG. 24illustrates how a user can choose export formats from the report view component.
- FIG. 25illustrates how a user can choose column attributes of a report from the report view component.
- FIG. 26illustrates how a user can choose relative intensities from the report view component.
- FIG. 27illustrates how a user can import files from the report view component.
- FIGS. 28 and 29illustrate how a user can choose relative intensities from the report view component.
- FIG. 30illustrates how a user can select to allow multiple subtotals and other aggregates from the report view component.
- FIG. 31illustrates how a user can customize a summary tab of the report view component.
- FIG. 32illustrates how a user can attach a pivot report to the document from the report view component.
- FIG. 33illustrates how a user can directly read certain file types from the report view component.
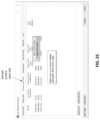
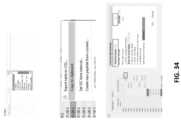
- FIG. 34illustrates how a user can filter out selected rows such that they are excluded from the pivot report from the report view component.
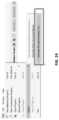
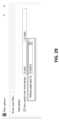
- FIG. 35illustrates how plot styles can be modified from the report view component.
- FIG. 36illustrates how command line project creation and reporting can be modified from the report view component.
- FIG. 37illustrates how multiple documents can be used to create a pivot report.
- FIGS. 38 A- 38 Uillustrate example operations of an apparatus for dynamically analyzing and preparing a report, e.g., a pivot table, summarizing mass spectrometry data.
- FIGS. 39 A- 39 Dillustrate example operations of an apparatus for dynamically analyzing and preparing a report, e.g., a pivot table, summarizing mass spectrometry data.
- FIG. 40illustrates an apparatus for dynamically analyzing and reporting mass spectrometry data.
- Drug substance analysescan be part of a critical path of drug development, and projects are often gated by the analysis of a production run. Any time saving that leads to earlier commercialization of a drug brings significant monetary benefits to the company, not to mention the therapeutic benefits of bringing novel treatments to the patients as early as possible.
- Described hereinare methods and apparatuses (including systems, devices, user interfaces and/or software).
- the methods and systemsmay allow a user to interactively generate configurable, graphical tables to aid in interpreting MS data.
- the methods and systems described hereinmay be used to free up the time of technical staff for additional projects while reducing staff frustration with the analysis process.
- sequence variant analysisused a cumbersome combination of several existing software tools, supplemented with the use of spreadsheet macros.
- the methods and system described hereincan include an integrated approach providing a single user-friendly dashboard where one can identify false positives and quantify true positives efficiently. This can give greater confidence to the user and drastically reduce the time required to distinguish true from false positive identifications.
- sequence variantrefers to any chemical change in a protein, peptide or peptide fragment relative to its wildtype counterpart. Sequence variants can include single or double amino acid substitutions, single amino acid insertions, single amino acid deletions, truncations, as well as oxidation, deamidation, glycosylation, and the like.
- MSMass Spectrometry
- m/zmass/charge ratios
- sampleis used in its broadest sense, and may include a specimen or culture, of natural or synthetic origin.
- proteinrefers to a polymer of amino acids (whether or not naturally occurring) linked via peptide bonds.
- a proteinis the complete product, prior to any enzymatic digestion or fragmentation that is to be subjected to analysis by mass spectrometry.
- a “peptide,” as used herein,refers to one or more members of the mixture produced by controlled digestion of a protein.
- the peptide mixtureis a product of digestion of the protein with a proteolytic enzyme, however other methods of controlled digestion are contemplated.
- the digestion mechanismcleaves the protein at positions in response to the presence of specific amino acids. Due to incomplete digestion by the enzyme or other mechanism, the mixture of digestion products (i.e. peptides) can include the undigested protein, which in this situation would also be a peptide.
- fragmentor “peptide fragment” refers to the products of fragmentation within a mass spectrometer.
- Described hereinare methods and systems for analyzing mass spectrometry data, especially to provide user-generated and customized reports identifying features from one, or preferably more, MS-based data sets. For example, these reports may aid in the detection and identification of molecular variants, wherein the initial sample contains a mixture of the molecule of interest (the reference molecule) and variant molecules, where the variants differ from the reference molecule by some chemical modification.
- the molecule of interestcan be any molecule susceptible to analysis by mass spectroscopy, including but not limited to, polypeptides, oligonucleotides, lipids, organic polymers, pharmaceutical excipients and growth media components.
- a non-exclusive list of pharmaceutical excipientsincludes, but is not limited to, polyvinylpyrrolidone, polyvinyl acetate, polysorbate, polyethylene glycol, polyvinyl alcohol, polyvinyl alcohol-polyethylene glycol, Poloxamer (polyethylene glycol-block-polypropylene glycol-block-polyethylene glycol), hydrogenate castor oils, and Mygliols.
- Cell growth media componentsinclude nutrients, such as protein, peptides, amino acids, and carbohydrates, as well as gelling components, such as agar, gelatin, carrageenans, alginates, and polyacrylamides.
- Exemplary modificationsinclude oxidation, deoxidation, deamidation, conjugate, glycation, sulfation, glycosylation, alkylation, dealkylation, polymerization and the like.
- the methods and systemsare useful for analyzing protein modifications, such as sequence substitutions, insertions or deletions, oxidation, deamination, glycosylation and the like.
- the mass spectrometry datacan be acquired according to conventional methods, which typically consist of i) subjecting the sample to a separation technique, ii) acquiring an MS1 spectrum (prior to fragmentation on a first mass spectrometer), iii) successively selecting each precursor ion observed with an intense signal on the MS1 spectrum, iv) successively fragmenting each precursor ion and acquiring its MS2 spectrum (after fragmentation on a second mass spectrometer), v) interrogating databases through software (i.e. perform a computational search of observed spectra with respect to a database or a library of recorded spectra) to identify one or more molecules having a strong probability of matching the MS2 spectrum observed.
- softwarei.e. perform a computational search of observed spectra with respect to a database or a library of recorded spectra
- the sampleis a protein that is first digested using a suitable enzyme to obtain a peptide mixture.
- suitable enzymesinclude, but are not limited to trypsin, endoproteinase Asp-N, endoproteinase Glu-C, and thermolysin. If a protein sample contains wildtype protein and variant protein, the resulting peptide mixture will comprise wildtype peptide and variant peptide.
- Separation methods suitable for use in conjunction with the methods disclosed hereininclude, but are not limited to liquid chromatography (LC), gas chromatography, ion mobility, gel electrophoresis and capillary electrophoresis.
- More than one type of digestion enzymemay be examined at once, and each may include multiple LC-MS/MS data acquisitions and multiple MS2 searches from any data acquisition.
- the MS2 data setmay be generated using any fragmentation method, including any combination of low-energy CID, beam-type CID, and/or ETD.
- the quantification of a variant relative to wildtype (WT)is performed by label-free quantification with extracted ion chromatograms (XICs), which, in some implementations, have editable limits of integration.
- the MS datais collected by a tandem mass spectrometer.
- the MS datais collected as MS1 data prior to fragmentation on a first mass spectrometer and MS2 data after fragmentation on a second mass spectrometer.
- the data file(s) containing the MS1 and/or MS2 spectracan be loaded from a storage medium or received (e.g., directly) from another device (e.g. over a wired or wireless connection).
- the spectral datamay be in any suitable format.
- the datais in a format proprietary to the manufacturer of the acquiring mass spectrometer, e.g. a .RAW file for a Thermo Fisher Scientific OrbitrapTM spectrometer.
- the datacan be stored or transferred in an open format, such as mzML.
- the wild type and variant datacan be obtained from a single data file or from separate wildtype and variant data files.
- the list of molecular identificationscan be populated from results of a computational search of observed spectra with respect to a database or library of recorded spectra.
- the system described hereincan accept a file containing results of an MS2 search based upon the input MS data.
- the MS2 searchcan be performed by software such as Byonic, Mascot, SEQUEST, PEAKS DB, X!Tandem, and the like.
- the search softwareis capable of identifying variants.
- a common search performed by the Mascot software, and that would be appropriate as input for the methods described herein,is the “Error-Tolerant Search”. While the utility of the current versions of Sequest nor X!Tandem can be limited because these software packages allow any number of instances of each variant per peptide, these programs are appropriate when searches are limited to fewer than approximately 10 types of variants.
- the method and systems described hereinmay require a description of the reference molecule.
- the descriptionmay include an amino acid sequence for the protein of interest in the sample.
- One or more chemical formulae, amino acid sequences, and/or oligonucleotide sequencescan be entered manually, loaded from a storage medium or received directly from another device (e.g. over wired or wireless connection).
- the structure and/or sequence(s)can be automatically loaded from a website, upon entry of a URL.
- GUIgraphical user interface
- dashboardcomprising several interactive views may be used to initially analyze the data for each run, generating MS based data that may be stored/saved as a flat table for each data set. These datasets may then be combined, as shown in FIG. 1 , and analyzed in one or more of the examples shown in FIGS. 2 A- 2 D and 3 - 37 .
- the reportsmay be customized and these customizations stored for later re-use, as shown in the figures.
- FIGS. 3 - 39 Dgraphically and textually illustrate exemplary portions of the user interface of the apparatus and methods described herein.
- the user interfacecan be used to generating a configurable pivot table report summarizing all or a portion of the mass spectrometry data.
- the user interfaceincludes an inspection view component and a report view component, which may be viewed in separate windows.
- FIG. 39 Ashows an exemplary inspection view component of the user interface
- FIGS. 39 B- 39 Dshow exemplary report view components of the user interface.
- the usermay be able to dynamically select all or a subset of data in the inspection view component for displaying in a more concise, consolidated or readable form in the report view component.
- the usermay be able to toggle between the report view component and the inspection view component, e.g., to quickly determine how selected data in the inspection view component effects the data presented in the report view component.
- the usermay be able to import multiple mass spectrometry data sets (e.g., from different samples) and use the report view component to provide a report summarizing all or some of the multiple data sets.
- the inspection view componentcan include a table window comprising a table of values associated with the molecule of interest, such as mass-to-charge ratio and peak intensity values for various peaks.
- the inspection view componentcan include a spectrum window comprising a graph indicating one or more peaks corresponding to mass-to-charge ratios of at least one molecular species (e.g., intact molecule and/or fragments) associated with the molecule of interest.
- the inspection view componentcan include a chromatogram window comprising a chromatogram of the mass spectrometry data.
- the inspection view componentmay provide the user the ability to hide certain portions of data.
- FIGS. 11 and 12show how a user can hide a data associated with wildtype protein.
- a dropdown menucan be accessed for the user to choose wildtype proteins to be hidden, which data can be highlighted in one or more rows of data within the table window. Hiding certain data this way can filter what is presented within the spectrum window and/or chromatogram window of the inspection view component.
- the dropdown menucan then be access to display the wildtype proteins again.
- the usercan filter the data presented in the inspection view component based on a search.
- FIG. 13shows an example of a search filter window that may be accessed by the user in the inspection view component (e.g., via a drop down menu).
- the search filter windowcan present a list of searchable parameters, such as types of molecules (e.g., modifications of the molecule of interest) within the sample.
- the selected parameterscan then be used to filter the data presented in inspection view component as selected by the user.
- the search filter windowhas multiple tabs for filtering based on different parameters (e.g., protein or protein type).
- the inspection view componentmay provide the user the ability to stack peaks within the spectrum window and/or the chromatogram window, such as illustrated in FIGS. 14 and 15 .
- FIG. 14shows a user accessing a drop down menu from the inspection view component that provides an option for enabling stacked plots.
- FIG. 15shows how various chosen peaks can be stacked in the spectrum window and/or chromatogram window. In some cases, the various peaks are indicated with different shadings and/or colors.
- This stacking featuremay be useful, for example, if a user is interested in clustering associated peaks, such peaks associated with the intact molecule and/or different isotope. In some applications, peaks associated with parent peptides are stacked with peaks associated with multiple child peptides. This stacking feature may be used to associate other molecule types, such as wildtype, variants, and/or deamidation modifications.
- the usermay be able to select data that is to be used in the report view component by clicking (e.g., double clicking) one or more values (e.g., one or more row of values) in the table window and/or one or more peaks in the spectrum window and/or chromatogram window.
- the useris able to choose a range of data displayed in the inspection view component. For example, the user may be able to select a range of mass-to-charge ratios around a peak using range lines, such as shown in FIG. 38 A .
- the usercan generate (e.g., export) one or more pivot reports such as shown in FIG. 38 A .
- the report view component of the user interfacecan include one or more selectable tabs, which include one or more pivot tabs.
- the tabsinclude default tabs, which can be generated automatically.
- a summary tabwhen selected, can be configured to display a description of the molecule of interest and mass spectrometry parameters, such as shown in FIG. 38 B .
- the summary tab(and/or other tabs) are customizable so as to display certain information, as shown in FIG. 31 .
- Other default tabscan include: a coverage tab that, when selected, can be configured to display information related to the molecule of interest, such as shown in FIGS.
- a percent modification tabthat, when selected, is configured to display information associated with modifications to the molecule of interest, such as shown in FIGS. 38 E- 381 ; and an average percent modification tab that, when selected, is configured to display the information associated with modifications averaged among multiple mass spectrometry data sets, such as shown in FIGS. 38 J and 38 K .
- the usermay be able to create new pivot tabs that the user can us to generate a customized report, such as shown in FIGS. 38 L and 38 M .
- the names of any of the tabsmay also be changed by the user.
- FIGS. 38 N- 38 Rillustrate an exemplary user interface process for generating one or more pivot reports from multiple projects.
- the multiple mass spectrometry data setscan be received as a single file or multiple files.
- the multiple mass spectrometry data setsare concatenated into a single flat file.
- the table window and/or the spectrum window of the inspection view componentmay be populated with information from the concatenated data.
- the concatenated datacan then be used to generate one or more pivot tables with one or more new fields indicating which project the data is associated with, such as shown in FIG. 38 Q (e.g., new fields “flavor” and “lot”).
- the pivot tabscan be used to generate a unified report including data associated with all of the different projects, or a report including a subset of data associated with a subset of the different projects.
- FIG. 4shows how tab settings can be modified by accessing a current tab setting window as a drop down option in the report view configuration.
- Selectable tab settingsmay include choosing to show column totals, as well as other options. These setting will be reflected in the display window, as show in FIG. 5 .
- FIG. 6shows how a user can save a current configuration from the report view component.
- a drop down menumay be accessible while in a selected tab, which give the user the option to save the current configuration into a document while the report view component is open.
- FIG. 7shows how a user can choose to normalize results based on one or more of the existing values.
- a drop down menu in the selected tabmay provide options to “Normalize Column” over the default setting of “Sum of Fraction of Columns Level N”.
- the pivot tabs in FIGS. 39 B- 39 Dinclude particular features so that the user can pick and choose which parameters are used to generate a report.
- the selected pivot tabs in FIGS. 39 B- 39 Dinclude an active element window that can be configured to display a first subset of pivot functions, a display window that can be configured to display one or more of a report table (e.g., chart) and a report graph (e.g., bar graph or plot) based on the first subset of pivot functions, and a storage window that can be configured to display a second subset of pivot functions that is not displayed in the display window.
- the usermay be able to control the data presented in the display window by moving (e.g., dragging and dropping) pivot functions between the active element window and the storage window.
- the usermay also be able to choose how the values in the display window are displayed, such as show in FIG. 38 H (e.g., by average, count, integer sum, maximum, minimum, sums, sums as a fraction of columns, sums as a fraction of rows, sums as a fraction of that total).
- the usermay further be able to filter the first and/or second subset of pivot function by accessing a filter options window, as shown in FIG. 39 C .
- the filter options windowis accessed by clicking (e.g., right clicking) one of the pivot functions.
- the filter options windowcan include a drop-down menu that lists data associated with the selected pivot function, and which the user can choose from.
- the filter options windowis another way the user can further customize the table and/or graph displayed in the display window.
- FIGS. 38 S- 38 Ushow how various features in the pivot tabs can be dynamically used to create pivot reports.
- FIG. 38 Sshows how a drop down menu can provide pre-pivot modifications by accessing an Edit dynamic columns window, which enables the user to enter code (e.g., JavaScript) with customized calculations. These can provide pre-pivot dynamic columns in, for example, a flat table.
- FIG. 38 Tshows a drop down menu can provide post-pivot modifications by accessing an Edit post pivot dynamic columns window, which enables the user to enter code (e.g., JavaScript) with customized calculations. This post-pivot modification can create new columns in the display window of the pivot tab (e.g., new columns for average and relative standard deviation).
- FIG. 38 Ushows how the dynamic field editing can also be used with multi-document reports. For example, the Edit dynamic columns window can also be accessed from the Edit menu, similar to single document reports.
- FIGS. 9 , 10 and 381show other examples of filter options windows.
- FIG. 9shows an example of how a filter options window can be modified by accessing a filter options settings window, which can include a setting for adjusting the maximum number of values in the filter options window.
- the filter options windowis able to provide selections of more than 200 unique values.
- the pivot functions that are filteredare distinguishable from pivot functions that are not filtered.
- the filtered pivot functionsmay be indicated with a different font (e.g., italicized) compared to the unfiltered pivot functions (e.g., non-italicized).
- the pivot functions selected in the active element windoware saved (e.g., as an updated first subset of pivot functions associated with the selected pivot tab).
- the usermay be able to choose the format in which the pivot functions selected in the active element window are displayed in the display window and in a report.
- the usermay choose to display one or more bar graphs (e.g., single or stacked bar graphs), one or more peak plots, one or more line graphs and/or one or more tables (e.g., charts) as described herein.
- the tablescan include heat map shading indicating, for example, the relative magnitudes of values in the table.
- FIG. 3shows an exemplary report in a pivot tab with charts indicating data before and after an assay test.
- the before and after chartshave a column of cells with values having lesser magnitude with lighter shaded cells and values having greater magnitude with darker shaded cells, and cells having values of intermediate magnitude shaded with varying shades therebetween.
- This type of heat map shadingcan help the user quickly identify patterns within the data.
- the cells of a chartare provided in continuous (e.g., gradual) gradation of shades.
- the various shadingsare in one or more colors.
- FIG. 8shows an exemplary report in a pivot tab indicating how X and Y of a chart can be modified.
- an axes windowcan be accessed by the user to change settings associated with X and Y axes of a bar chart.
- the axes windowcan be used, for example, to create a first chart including a first value along the X axes and a second chart indicating a first, second and third value along the X axes.
- the axes windowcan be also used to switch X and Y axes, as well as modify the size (e.g., width and height) of the charts.
- FIG. 35shows an exemplary report in a pivot tab indicating how a plot style can be modified via a plot style adjustment window.
- the example of FIG. 35shows how the line width of a peak can be increased or decreased.
- Other changeable plot style settingscan include a circle indicator size, grid width, x-axis width and y-axis width.
- the peaksmay also be labeled. These features may be used to highlight peaks associated with a molecule of interest.
- a protein aliase.g., labeled “HC” or “LC”
- the protein aliascan then be used to, for example, render labels in a chromatogram plot.
- the pivot tab(s)can be configured to dynamically display the selected information in the inspection view component.
- one or more of the pivot tabscan dynamically reflect modifications that user made to the table of values and/or the graph with the mass-to-charge ratio peaks in the inspection view component (e.g., without having to close the inspection view component and/or the report view component). This may allow the user to quickly determine how selected data in the inspection view component effects the report view component. In this way, the user can quickly generate customized reports (e.g., pivot tables and/or graphs).
- the useris able to switch (e.g., toggle) between the inspection view component and the report view based on user input with each modification.
- the usermay be able to access the report view component from the inspection view component (e.g., via report command button) and vice versa.
- the inspection view component and the report view componentare displayed in different windows such that the user can view them simultaneously.
- the apparatusis configured to accept multiple mass spectrometry data sets from multiple mass spectrometry samples (also referred to as projects).
- the multiple projectsmay include data associated with the same molecule of interest or different molecules of interest.
- the ability to accept multiple projectsmay be useful, for example, for evaluating quality assurance of a product.
- the multiple projectsmay be associated with different temperatures, days and/or lots, which may or may not result in different chemical characteristics of the samples.
- the apparatus and methods described hereinmay be used to help determine whether these sorts of factors are significant.
- the report view componenthas feature that allow a user the ability to calculate protein coverage per sample.
- FIG. 16shows a protein coverage window accessed by a user, which includes a table indicating protein coverage per sample. This feature can be used to calculate the protein coverage per sample and create new parameters to display these values in tabular format. The user may also be able to export the protein coverage per sample on a per file basis or in a chain.
- FIG. 17shows an example of how data can be presented in a traffic light format.
- the traffic light formatshow cells in a chart with various colors: red, green and yellow, where red indicates an undesired value, green indicates a desired value and yellow indicates an unexpected value.
- cells (e.g., columns) with all desired massescan be indicated with green (pass), and cells (e.g., columns) where one or more desired masses are not found can be indicated with red (fail).
- cells (e.g., columns) with no undesired massescan be indicated with green (pass), and all other cells (e.g., columns) can be indicated with red (fail).
- cellse.g., columns with no undesired masses can be indicated with green (pass), and cells (e.g., columns) having one or more unexpected masses can be indicated with “review”.
- a first column of cellscan be indicated with green (pass) status if all masses in that column (e.g., three) are green (pass)
- a second column of cellscan be indicated with a “review” status if any of the masses in that column marked as “review”
- a third column of cellscan be indicated with red (fail) status if any of the masses in that column are red (fail).
- a “validate” columncan be used to override any automatic “status” column.
- FIGS. 18 and 19show an example of how a user can choose automatic assignment of reference masses.
- a new reference projectis opened by the user from the report view component of the user interface, where the user choses the configuration of the masses of interest.
- FIG. 19shows an example table of masses after the configuration for the masses of interest is chosen.
- the Name columncan list the names of matching reference mass names and delta mass names. In cases where no match is found, the mass value will default to the rounded mass value configurable, for example, via a MassNameTemplate variable in an Advanced Configuration tab.
- the Protein Name columncan list matching reference mass names.
- the Delta Name columncan list matching delta mass names.
- the Expected Mass columncan list the combined mass value.
- the Expected Type columncan list the matching reference type (desired or undesired). If the local relative intensity is below the “minimum % of local base peak”, it can be marked as “ignored”. Otherwise, it can be marked as “unexpected”. The Delta mass from calculation and Delta mass from most intense can be derived from the data.
- FIG. 20shows an example of how a user can calculate an average protein mass from a sequence.
- the Protein input tabcan list the proteins within a project, with a column indicating “Average Mass.” If the value within this column is blank or 0, but the protein sequence column is filled, the average mass will be automatically calculated.
- the following rulesmay apply by default (but can be changed): (1) if the N-terminal residue is Q, it becomes proGlu, (2) if the C-terminal residue is K, it is clipped off, (3) all possible cysteine pairs are formed (as disulfide bonds). If there is an odd number of cysteines, the odd one out is left alone (not modified), and (4) atomic weights can be configured.
- Items (1), (2), and (4) default valuescan be changed by entering new values into the Advanced Configuration box (Advanced tab in project creation dialog).
- Item (3)is configured on a per-protein basis and is described below.
- Combining chains for oligomers, and customizing number of disulfide bondsare possible with the following syntax: LCSEQUENCE,HCSEQUENCE,LCSEQUENCE,HCSEQUENCE
- the entire protein complexhas a total of 2 disulfides.
- FIG. 21shows an example of how mass area computation can be controlled during and after a project is created.
- the mass matching tab in a new reference projectcan provide the user the ability to control mass area computation and relative intensity reporting during and after project creation.
- FIGS. 22 A- 22 Bshow an example of how a user can create customized names. For example, an editable Name column can be accessed in the Advanced tab of a new reference project, as shown in FIG. 22 A .
- FIG. 22 Bshows how, if there is a match, the names will be populated
- FIG. 23shows an example of how a user can retroactively edit the masses of the protein and delta masses from the report view component.
- a drop down menucan provide a number of ways to edit these masses in a sample table after a project has been created and updated in the windows of the report view component.
- FIG. 24shows an example of how a user can choose an export format.
- a drop down menucan provide an Export option, with a selectable format, such as multi-document reports or MS data CSV.
- FIG. 25shows an example of how a user can choose column attributes of a report.
- a sample protein input tabcan provide a way to modify column attributes during a project and/or after project creation.
- the columncan be right clicked to provide a drop down menu with an option to edit the column attributes.
- FIG. 26shows an example of how a user can choose relative intensities.
- An Intensity Options windowcan be accessed from the report view component, which provides the user the ability to choose the mass and intensity while the document is open (e.g., after project creation).
- FIG. 27shows an example of how a user can choose relative intensities during a project and/or after project creation.
- an import MS files buttoncan provide a way to import files during a project and/or after project creation.
- FIGS. 28 and 29show an example of how a user can change the minimum peak area percentage intensities during a project and/or after project creation.
- the usermay be able to restrict the start and end range windows via the “Advanced” configuration tab, as shown in FIG. 28
- FIG. 29shows how a filter options window can be used to select the minimum peak area percentage.
- FIG. 30shows how a user can select to allow multiple subtotals and other aggregates with hierarchy.
- FIG. 31shows how a user can customize a summary tab of the report view component.
- FIG. 32shows how a user can attach a pivot report to the document during and/or after project creation.
- FIG. 33shows how a user can directly read certain file types during and/or after project creation.
- FIG. 34shows how a user can filter out selected rows such that they are excluded from the pivot report during and/or after project creation.
- FIG. 35shows how plot styles can be modified from the report view component.
- FIG. 36shows how command line project creation and reporting can be modified during and/or after project creation.
- FIG. 37shows how multiple documents can be used to create a pivot report during and/or after project creation.
- Other features of the user interfacecan include enhancements to complete assignments by default, such as to “Enable auto compute and auto-assign masses,” such that masses will then be assigned automatically during project creation.
- Other featurescan include adding new user-defined columns for samples and adding the ability to access project table content as part of the pivot reports.
- FIG. 40shows an apparatus for dynamically preparing reports from mass spectrometry data in accordance with some embodiments.
- Mass spectrometry (MS) data from one or more mass spectrometry data setscan be stored on one or more MS databases 4002 (memory locations).
- the MS data set(s)may include mass-to-charge ratios (m/z) peaks and peak intensities associated with a molecule of interest.
- the MS data set(s)may be include data associated with an intact molecule of interest, fragments of the molecule of interest, modifications of the molecule of interest, and/or mass deltas associated with the molecule of interest.
- One or more processors 4006 of the apparatus 4000can include an inspection view component engine 4008 and a report view component engine 4010 to provide an inspection view component window and a report view component window, respectively, of the user interface.
- the inspection view component engine 4008 and/or the report view component engine 4010can be configured accept user input from the user interface stored in a user input database 4004 .
- the inspection view component engine 4008can be operationally coupled to and dynamically interact with the report view component engine 4010 in response to the user input.
- the processor(s)can be configured to store data associated with reports in a report database 4012 , which can be used to generate a pivot report 4012 summarizing all or a subset of MS data as defined by the user input.
- any of the methods (including user interfaces) described hereinmay be implemented as software, hardware or firmware, and may be described as a non-transitory computer-readable storage medium storing a set of instructions capable of being executed by a processor (e.g., computer, tablet, smartphone, etc.), that when executed by the processor causes the processor to control perform any of the steps, including but not limited to: displaying, communicating with the user, analyzing, modifying parameters (including timing, frequency, intensity, etc.), determining, alerting, or the like.
- a processore.g., computer, tablet, smartphone, etc.
- references to a structure or feature that is disposed “adjacent” another featuremay have portions that overlap or underlie the adjacent feature.
- spatially relative termssuch as “under”, “below”, “lower”, “over”, “upper” and the like, may be used herein for ease of description to describe one element or feature's relationship to another element(s) or feature(s) as illustrated in the figures. It will be understood that the spatially relative terms are intended to encompass different orientations of the device in use or operation in addition to the orientation depicted in the figures. For example, if a device in the figures is inverted, elements described as “under” or “beneath” other elements or features would then be oriented “over” the other elements or features. Thus, the exemplary term “under” can encompass both an orientation of over and under.
- the devicemay be otherwise oriented (rotated 90 degrees or at other orientations) and the spatially relative descriptors used herein interpreted accordingly.
- the terms “upwardly”, “downwardly”, “vertical”, “horizontal” and the likeare used herein for the purpose of explanation only unless specifically indicated otherwise.
- first and secondmay be used herein to describe various features/elements (including steps), these features/elements should not be limited by these terms, unless the context indicates otherwise. These terms may be used to distinguish one feature/element from another feature/element. Thus, a first feature/element discussed below could be termed a second feature/element, and similarly, a second feature/element discussed below could be termed a first feature/element without departing from the teachings of the present invention.
- any of the apparatuses and methods described hereinshould be understood to be inclusive, but all or a sub-set of the components and/or steps may alternatively be exclusive, and may be expressed as “consisting of” or alternatively “consisting essentially of” the various components, steps, sub-components or sub-steps.
- a numeric valuemay have a value that is +/ ⁇ 0.1% of the stated value (or range of values), +/ ⁇ 1% of the stated value (or range of values), +/ ⁇ 2% of the stated value (or range of values), +/ ⁇ 5% of the stated value (or range of values), +/ ⁇ 10% of the stated value (or range of values), etc.
- Any numerical values given hereinshould also be understood to include about or approximately that value, unless the context indicates otherwise. For example, if the value “10” is disclosed, then “about 10” is also disclosed. Any numerical range recited herein is intended to include all sub-ranges subsumed therein.
Landscapes
- Chemical & Material Sciences (AREA)
- Analytical Chemistry (AREA)
- Other Investigation Or Analysis Of Materials By Electrical Means (AREA)
Abstract
Description
Claims (21)
Priority Applications (3)
| Application Number | Priority Date | Filing Date | Title |
|---|---|---|---|
| US17/706,539US12224169B2 (en) | 2017-09-29 | 2022-03-28 | Interactive analysis of mass spectrometry data |
| US19/000,363US20250232970A1 (en) | 2017-09-29 | 2024-12-23 | Interactive analysis of mass spectrometry data |
| US19/049,855US20250183022A1 (en) | 2017-09-29 | 2025-02-10 | Interactive analysis of analytical data |
Applications Claiming Priority (5)
| Application Number | Priority Date | Filing Date | Title |
|---|---|---|---|
| US201762566247P | 2017-09-29 | 2017-09-29 | |
| US16/149,026US10510521B2 (en) | 2017-09-29 | 2018-10-01 | Interactive analysis of mass spectrometry data |
| US16/713,556US10879057B2 (en) | 2017-09-29 | 2019-12-13 | Interactive analysis of mass spectrometry data |
| US17/135,963US11289317B2 (en) | 2017-09-29 | 2020-12-28 | Interactive analysis of mass spectrometry data |
| US17/706,539US12224169B2 (en) | 2017-09-29 | 2022-03-28 | Interactive analysis of mass spectrometry data |
Related Parent Applications (1)
| Application Number | Title | Priority Date | Filing Date |
|---|---|---|---|
| US17/135,963Continuation-In-PartUS11289317B2 (en) | 2017-09-29 | 2020-12-28 | Interactive analysis of mass spectrometry data |
Related Child Applications (2)
| Application Number | Title | Priority Date | Filing Date |
|---|---|---|---|
| US19/000,363ContinuationUS20250232970A1 (en) | 2017-09-29 | 2024-12-23 | Interactive analysis of mass spectrometry data |
| US19/049,855Continuation-In-PartUS20250183022A1 (en) | 2017-09-29 | 2025-02-10 | Interactive analysis of analytical data |
Publications (2)
| Publication Number | Publication Date |
|---|---|
| US20220301840A1 US20220301840A1 (en) | 2022-09-22 |
| US12224169B2true US12224169B2 (en) | 2025-02-11 |
Family
ID=83284171
Family Applications (2)
| Application Number | Title | Priority Date | Filing Date |
|---|---|---|---|
| US17/706,539Active2039-07-22US12224169B2 (en) | 2017-09-29 | 2022-03-28 | Interactive analysis of mass spectrometry data |
| US19/000,363PendingUS20250232970A1 (en) | 2017-09-29 | 2024-12-23 | Interactive analysis of mass spectrometry data |
Family Applications After (1)
| Application Number | Title | Priority Date | Filing Date |
|---|---|---|---|
| US19/000,363PendingUS20250232970A1 (en) | 2017-09-29 | 2024-12-23 | Interactive analysis of mass spectrometry data |
Country Status (1)
| Country | Link |
|---|---|
| US (2) | US12224169B2 (en) |
Families Citing this family (4)
| Publication number | Priority date | Publication date | Assignee | Title |
|---|---|---|---|---|
| US12400846B2 (en) | 2017-08-01 | 2025-08-26 | Protein Metrics, Llc | Interactive analysis of mass spectrometry data including peak selection and dynamic labeling |
| US11640901B2 (en) | 2018-09-05 | 2023-05-02 | Protein Metrics, Llc | Methods and apparatuses for deconvolution of mass spectrometry data |
| US11346844B2 (en) | 2019-04-26 | 2022-05-31 | Protein Metrics Inc. | Intact mass reconstruction from peptide level data and facilitated comparison with experimental intact observation |
| EP4204948A4 (en) | 2020-08-31 | 2024-10-02 | Protein Metrics, LLC | DATA COMPRESSION FOR MULTI-DIMENSIONAL TIME SERIES DATA |
Citations (83)
| Publication number | Priority date | Publication date | Assignee | Title |
|---|---|---|---|---|
| US4464650A (en) | 1981-08-10 | 1984-08-07 | Sperry Corporation | Apparatus and method for compressing data signals and restoring the compressed data signals |
| US4558302A (en) | 1983-06-20 | 1985-12-10 | Sperry Corporation | High speed data compression and decompression apparatus and method |
| US4814764A (en) | 1986-09-30 | 1989-03-21 | The Boeing Company | Apparatus and method for warning of a high yaw condition in an aircraft |
| US5343554A (en) | 1988-05-20 | 1994-08-30 | John R. Koza | Non-linear genetic process for data encoding and for solving problems using automatically defined functions |
| US5910655A (en) | 1996-01-05 | 1999-06-08 | Maxent Solutions Ltd. | Reducing interferences in elemental mass spectrometers |
| US5995989A (en) | 1998-04-24 | 1999-11-30 | Eg&G Instruments, Inc. | Method and apparatus for compression and filtering of data associated with spectrometry |
| US6094627A (en) | 1997-05-30 | 2000-07-25 | Perkinelmer Instruments, Inc. | High-performance digital signal averager |
| US6393393B1 (en) | 1998-06-15 | 2002-05-21 | Matsushita Electric Industrial Co., Ltd. | Audio coding method, audio coding apparatus, and data storage medium |
| US20020068366A1 (en) | 2000-04-13 | 2002-06-06 | Ladine James R. | Proteomic analysis by parallel mass spectrometry |
| US20030031369A1 (en) | 2001-04-13 | 2003-02-13 | Erwan Le Pennec | Method and apparatus for processing or compressing n-dimensional signals by foveal filtering along trajectories |
| US6535555B1 (en) | 1999-04-26 | 2003-03-18 | Thomson Licensing S.A. | Quantizing method and device for video compression |
| US20030200032A1 (en) | 2002-03-01 | 2003-10-23 | Applera Corporation | Determination of compatibility of a set chemical modifications with an amino-acid chain |
| US20030218634A1 (en) | 2002-05-22 | 2003-11-27 | Allan Kuchinsky | System and methods for visualizing diverse biological relationships |
| US20040083063A1 (en)* | 2002-10-25 | 2004-04-29 | Mcclure Thomas D. | Method and apparatus for automated detection of peaks in spectroscopic data |
| US20040102906A1 (en) | 2002-08-23 | 2004-05-27 | Efeckta Technologies Corporation | Image processing of mass spectrometry data for using at multiple resolutions |
| US20040160353A1 (en) | 2002-06-28 | 2004-08-19 | Science Applications International Corporation | Measurement and signature intelligence analysis and reduction technique |
| US6798360B1 (en) | 2003-06-27 | 2004-09-28 | Canadian Space Agency | Method and system for compressing a continuous data flow in real-time using recursive hierarchical self-organizing cluster vector quantization (HSOCVQ) |
| JP2004317509A (en) | 2003-04-10 | 2004-11-11 | Micromass Uk Ltd | Mass spectrometer |
| US20050047670A1 (en) | 2003-08-29 | 2005-03-03 | Shen-En Qian | Data compression engines and real-time wideband compressor for multi-dimensional data |
| US20050063864A1 (en) | 2003-08-13 | 2005-03-24 | Akihiro Sano | Mass spectrometer system |
| US6906320B2 (en) | 2003-04-02 | 2005-06-14 | Merck & Co., Inc. | Mass spectrometry data analysis techniques |
| US20050276326A1 (en) | 2004-06-09 | 2005-12-15 | Broadcom Corporation | Advanced video coding intra prediction scheme |
| US7006567B2 (en) | 2001-11-30 | 2006-02-28 | International Business Machines Corporation | System and method for encoding three-dimensional signals using a matching pursuit algorithm |
| US7283684B1 (en) | 2003-05-20 | 2007-10-16 | Sandia Corporation | Spectral compression algorithms for the analysis of very large multivariate images |
| US7283937B2 (en) | 2005-12-21 | 2007-10-16 | Palo Alto Research Center Incorporated | Method, apparatus, and program product for distinguishing valid data from noise data in a data set |
| US7297940B2 (en) | 2005-05-03 | 2007-11-20 | Palo Alto Research Center Incorporated | Method, apparatus, and program product for classifying ionized molecular fragments |
| US20080010309A1 (en) | 2006-07-05 | 2008-01-10 | Fujifilm Corporation | Data compression apparatus and data compressing program storage medium |
| US20080025394A1 (en) | 2004-03-02 | 2008-01-31 | Thomson Licensing | Method Of Encoding And Decoding An Image Sequence By Means Of Hierarchical Temporal Analysis |
| US7397961B2 (en) | 2001-03-29 | 2008-07-08 | Electronics For Imaging, Inc. | Apparatus and methods for digital image compression |
| US7400772B1 (en) | 2003-05-20 | 2008-07-15 | Sandia Corporation | Spatial compression algorithm for the analysis of very large multivariate images |
| US7402438B2 (en) | 2003-10-30 | 2008-07-22 | Palo Alto Research Center Incorporated | Automated identification of carbohydrates in mass spectra |
| US7429727B2 (en) | 2005-12-13 | 2008-09-30 | Palo Alto Research Center Incorporated | Method, apparatus, and program product for quickly selecting complex molecules from a data base of molecules |
| US20080260269A1 (en) | 2005-11-22 | 2008-10-23 | Matrixview Limited | Repetition and Correlation Coding |
| US20090012931A1 (en) | 2007-06-04 | 2009-01-08 | Bae Systems Plc | Data indexing and compression |
| US7496453B2 (en) | 2006-11-07 | 2009-02-24 | The Hong Kong Polytechnic University | Classification of herbal medicines using wavelet transform |
| US20090052528A1 (en) | 2005-01-21 | 2009-02-26 | Lg Electronics Inc. | Method and Apparatus for Encoding/Decoding Video Signal Using Block Prediction Information |
| US20090179147A1 (en)* | 2008-01-16 | 2009-07-16 | Milgram K Eric | Systems, methods, and computer-readable medium for determining composition of chemical constituents in a complex mixture |
| US7680670B2 (en) | 2004-01-30 | 2010-03-16 | France Telecom | Dimensional vector and variable resolution quantization |
| US20100124785A1 (en) | 2008-11-18 | 2010-05-20 | Palo Alto Research Center Incorporated | Wild-card-modification technique for peptide identification |
| US20100288917A1 (en) | 2009-05-13 | 2010-11-18 | Agilent Technologies, Inc. | System and method for analyzing contents of sample based on quality of mass spectra |
| US20100288918A1 (en) | 2009-05-14 | 2010-11-18 | Agilent Technologies, Inc. | System and method for performing tandem mass spectrometry analysis |
| US20110093205A1 (en) | 2009-10-19 | 2011-04-21 | Palo Alto Research Center Incorporated | Proteomics previewer |
| US7979258B2 (en) | 2004-12-20 | 2011-07-12 | Palo Alto Research Center Incorporated | Self-calibration of mass spectra using robust statistical methods |
| US8004432B2 (en) | 2007-11-30 | 2011-08-23 | Shimadzu Corporation | Time-of-flight measuring device |
| US20110206119A1 (en) | 2010-02-19 | 2011-08-25 | Lazar Bivolarsky | Data Compression for Video |
| US8023750B2 (en) | 2001-07-02 | 2011-09-20 | Qualcomm Incorporated | Apparatus and method for encoding digital image data in a lossless manner |
| WO2011127544A1 (en) | 2010-04-12 | 2011-10-20 | Katholieke Universifeit Leuven | Intensity normalization in imaging mass spectrometry |
| US8077988B2 (en) | 2004-08-09 | 2011-12-13 | David Leigh Donoho | Method and apparatus for compressed sensing |
| US8108153B2 (en) | 2005-12-13 | 2012-01-31 | Palo Alto Research Center Incorporated | Method, apparatus, and program product for creating an index into a database of complex molecules |
| US20120047098A1 (en) | 2010-08-19 | 2012-02-23 | Daniel Reem | Method for computing and storing voronoi diagrams, and uses therefor |
| US20120245857A1 (en) | 2010-06-16 | 2012-09-27 | Abbott Laboratories | Methods and Systems for the Analysis of Protein Samples |
| US20130080073A1 (en) | 2010-06-11 | 2013-03-28 | Waters Technologies Corporation | Techniques for mass spectrometry peak list computation using parallel processing |
| US8428889B2 (en) | 2010-10-07 | 2013-04-23 | Thermo Finnigan Llc | Methods of automated spectral peak detection and quantification having learning mode |
| US20130144540A1 (en) | 2011-12-06 | 2013-06-06 | Palo Alto Research Center Incorporated | Constrained de novo sequencing of peptides |
| US8511140B2 (en) | 2005-10-25 | 2013-08-20 | Waters Technologies Corporation | Baseline modeling in chromatography |
| US20130226594A1 (en) | 2010-07-20 | 2013-08-29 | Fraunhofer-Gesellschaft Zur Foerderung Der Angewandten Forschung E.V. | Audio encoder, audio decoder, method for encoding and audio information, method for decoding an audio information and computer program using an optimized hash table |
| US20130262809A1 (en) | 2012-03-30 | 2013-10-03 | Samplify Systems, Inc. | Processing system and method including data compression api |
| US20130266067A1 (en) | 2010-12-06 | 2013-10-10 | Sk Telecom Co., Ltd. | Method and device for encoding/decoding image by inter prediction using random block |
| US20130275399A1 (en) | 2012-04-16 | 2013-10-17 | International Business Machines Corporation | Table boundary detection in data blocks for compression |
| US20130289892A1 (en) | 2012-04-25 | 2013-10-31 | Jeol Ltd. | Time-of-Flight Mass Spectrometer and Data Compression Method Therefor |
| US8598516B2 (en) | 2010-07-09 | 2013-12-03 | Yerbol Aldanovich Sapargaliyev | Method of mass-spectrometry and a device for its realization |
| US8645145B2 (en) | 2010-01-12 | 2014-02-04 | Fraunhoffer-Gesellschaft Zur Foerderung Der Angewandten Forschung E.V. | Audio encoder, audio decoder, method for encoding and audio information, method for decoding an audio information and computer program using a hash table describing both significant state values and interval boundaries |
| US20140045273A1 (en) | 2012-08-09 | 2014-02-13 | Perkinelmer Health Sciences, Inc. | Methods and apparatus for identification of polymeric species from mass spectrometry output |
| US20140164444A1 (en) | 2012-12-01 | 2014-06-12 | The Regents Of The University Of California | System and method of managing large data files |
| WO2015031820A1 (en) | 2013-08-29 | 2015-03-05 | University Of Notre Dame Du Lac | High sensitivity electrospray interface |
| WO2015148941A1 (en) | 2014-03-28 | 2015-10-01 | Wisconsin Alumni Research Foundation | High mass accuracy filtering for improved spectral matching of high-resolution gas chromatography-mass spectrometry data against unit-resolution reference databases |
| US20150319268A1 (en) | 2014-05-02 | 2015-11-05 | Futurewei Technologies, Inc. | System and Method for Hierarchical Compression |
| WO2015189255A1 (en)* | 2014-06-13 | 2015-12-17 | Thermo Fisher Scientific (Bremen) Gmbh | Data processing device and method for the evaluation of mass spectrometry data |
| US20150369782A1 (en)* | 2014-06-19 | 2015-12-24 | Shimadzu Corporation | Chromatograph/mass spectrometer data processing device |
| US20160077926A1 (en) | 2014-09-16 | 2016-03-17 | Actifio, Inc. | System and method for multi-hop data backup |
| US20160180555A1 (en)* | 2014-12-17 | 2016-06-23 | Shimadzu Corporation | Analytical data display processing device |
| US9385751B2 (en) | 2014-10-07 | 2016-07-05 | Protein Metrics Inc. | Enhanced data compression for sparse multidimensional ordered series data |
| US20160215028A1 (en) | 2013-09-24 | 2016-07-28 | University Of Guelph | Biomarkers for mycobacterium avium paratuberculosis (map) |
| US20160268112A1 (en) | 2015-03-12 | 2016-09-15 | Thermo Finnigan Llc | Methods for Data-Dependent Mass Spectrometry of Mixed Biomolecular Analytes |
| US9640376B1 (en)* | 2014-06-16 | 2017-05-02 | Protein Metrics Inc. | Interactive analysis of mass spectrometry data |
| US20180301326A1 (en) | 2017-01-26 | 2018-10-18 | Marshall Bern | Methods and apparatuses for determining the intact mass of large molecules from mass spectrographic data |
| US10354421B2 (en) | 2015-03-10 | 2019-07-16 | Protein Metrics Inc. | Apparatuses and methods for annotated peptide mapping |
| US10510521B2 (en)* | 2017-09-29 | 2019-12-17 | Protein Metrics Inc. | Interactive analysis of mass spectrometry data |
| US10546736B2 (en) | 2017-08-01 | 2020-01-28 | Protein Metrics Inc. | Interactive analysis of mass spectrometry data including peak selection and dynamic labeling |
| US20200075300A1 (en) | 2018-09-05 | 2020-03-05 | Protein Metrics Inc. | Methods and apparatuses for deconvolution of mass spectrometry data |
| US20210335589A1 (en) | 2017-08-01 | 2021-10-28 | Protein Metrics Inc. | Interactive analysis of mass spectrometry data including peak selection and dynamic labeling |
| US11276204B1 (en) | 2020-08-31 | 2022-03-15 | Protein Metrics Inc. | Data compression for multidimensional time series data |
| US11346844B2 (en) | 2019-04-26 | 2022-05-31 | Protein Metrics Inc. | Intact mass reconstruction from peptide level data and facilitated comparison with experimental intact observation |
- 2022
- 2022-03-28USUS17/706,539patent/US12224169B2/enactiveActive
- 2024
- 2024-12-23USUS19/000,363patent/US20250232970A1/enactivePending
Patent Citations (95)
| Publication number | Priority date | Publication date | Assignee | Title |
|---|---|---|---|---|
| US4464650A (en) | 1981-08-10 | 1984-08-07 | Sperry Corporation | Apparatus and method for compressing data signals and restoring the compressed data signals |
| US4558302A (en) | 1983-06-20 | 1985-12-10 | Sperry Corporation | High speed data compression and decompression apparatus and method |
| US4558302B1 (en) | 1983-06-20 | 1994-01-04 | Unisys Corp | |
| US4814764A (en) | 1986-09-30 | 1989-03-21 | The Boeing Company | Apparatus and method for warning of a high yaw condition in an aircraft |
| US5343554A (en) | 1988-05-20 | 1994-08-30 | John R. Koza | Non-linear genetic process for data encoding and for solving problems using automatically defined functions |
| US5910655A (en) | 1996-01-05 | 1999-06-08 | Maxent Solutions Ltd. | Reducing interferences in elemental mass spectrometers |
| US6094627A (en) | 1997-05-30 | 2000-07-25 | Perkinelmer Instruments, Inc. | High-performance digital signal averager |
| US5995989A (en) | 1998-04-24 | 1999-11-30 | Eg&G Instruments, Inc. | Method and apparatus for compression and filtering of data associated with spectrometry |
| US6393393B1 (en) | 1998-06-15 | 2002-05-21 | Matsushita Electric Industrial Co., Ltd. | Audio coding method, audio coding apparatus, and data storage medium |
| US6535555B1 (en) | 1999-04-26 | 2003-03-18 | Thomson Licensing S.A. | Quantizing method and device for video compression |
| US20020068366A1 (en) | 2000-04-13 | 2002-06-06 | Ladine James R. | Proteomic analysis by parallel mass spectrometry |
| US7397961B2 (en) | 2001-03-29 | 2008-07-08 | Electronics For Imaging, Inc. | Apparatus and methods for digital image compression |
| US20030031369A1 (en) | 2001-04-13 | 2003-02-13 | Erwan Le Pennec | Method and apparatus for processing or compressing n-dimensional signals by foveal filtering along trajectories |
| US8023750B2 (en) | 2001-07-02 | 2011-09-20 | Qualcomm Incorporated | Apparatus and method for encoding digital image data in a lossless manner |
| US7006567B2 (en) | 2001-11-30 | 2006-02-28 | International Business Machines Corporation | System and method for encoding three-dimensional signals using a matching pursuit algorithm |
| US20030200032A1 (en) | 2002-03-01 | 2003-10-23 | Applera Corporation | Determination of compatibility of a set chemical modifications with an amino-acid chain |
| US20030218634A1 (en) | 2002-05-22 | 2003-11-27 | Allan Kuchinsky | System and methods for visualizing diverse biological relationships |
| US20040160353A1 (en) | 2002-06-28 | 2004-08-19 | Science Applications International Corporation | Measurement and signature intelligence analysis and reduction technique |
| US20040102906A1 (en) | 2002-08-23 | 2004-05-27 | Efeckta Technologies Corporation | Image processing of mass spectrometry data for using at multiple resolutions |
| US20040083063A1 (en)* | 2002-10-25 | 2004-04-29 | Mcclure Thomas D. | Method and apparatus for automated detection of peaks in spectroscopic data |
| US6906320B2 (en) | 2003-04-02 | 2005-06-14 | Merck & Co., Inc. | Mass spectrometry data analysis techniques |
| GB2401721A (en) | 2003-04-10 | 2004-11-17 | Micromass Ltd | Mass spectrometer providing mass to charge ratio measurements with error bands |
| JP2004317509A (en) | 2003-04-10 | 2004-11-11 | Micromass Uk Ltd | Mass spectrometer |
| US7283684B1 (en) | 2003-05-20 | 2007-10-16 | Sandia Corporation | Spectral compression algorithms for the analysis of very large multivariate images |
| US7400772B1 (en) | 2003-05-20 | 2008-07-15 | Sandia Corporation | Spatial compression algorithm for the analysis of very large multivariate images |
| US6798360B1 (en) | 2003-06-27 | 2004-09-28 | Canadian Space Agency | Method and system for compressing a continuous data flow in real-time using recursive hierarchical self-organizing cluster vector quantization (HSOCVQ) |
| US20050063864A1 (en) | 2003-08-13 | 2005-03-24 | Akihiro Sano | Mass spectrometer system |
| US20050047670A1 (en) | 2003-08-29 | 2005-03-03 | Shen-En Qian | Data compression engines and real-time wideband compressor for multi-dimensional data |
| US7402438B2 (en) | 2003-10-30 | 2008-07-22 | Palo Alto Research Center Incorporated | Automated identification of carbohydrates in mass spectra |
| US7680670B2 (en) | 2004-01-30 | 2010-03-16 | France Telecom | Dimensional vector and variable resolution quantization |
| US20080025394A1 (en) | 2004-03-02 | 2008-01-31 | Thomson Licensing | Method Of Encoding And Decoding An Image Sequence By Means Of Hierarchical Temporal Analysis |
| US20050276326A1 (en) | 2004-06-09 | 2005-12-15 | Broadcom Corporation | Advanced video coding intra prediction scheme |
| US8077988B2 (en) | 2004-08-09 | 2011-12-13 | David Leigh Donoho | Method and apparatus for compressed sensing |
| US7979258B2 (en) | 2004-12-20 | 2011-07-12 | Palo Alto Research Center Incorporated | Self-calibration of mass spectra using robust statistical methods |
| US20090052528A1 (en) | 2005-01-21 | 2009-02-26 | Lg Electronics Inc. | Method and Apparatus for Encoding/Decoding Video Signal Using Block Prediction Information |
| US7297940B2 (en) | 2005-05-03 | 2007-11-20 | Palo Alto Research Center Incorporated | Method, apparatus, and program product for classifying ionized molecular fragments |
| US8511140B2 (en) | 2005-10-25 | 2013-08-20 | Waters Technologies Corporation | Baseline modeling in chromatography |
| US20080260269A1 (en) | 2005-11-22 | 2008-10-23 | Matrixview Limited | Repetition and Correlation Coding |
| US8108153B2 (en) | 2005-12-13 | 2012-01-31 | Palo Alto Research Center Incorporated | Method, apparatus, and program product for creating an index into a database of complex molecules |
| US7429727B2 (en) | 2005-12-13 | 2008-09-30 | Palo Alto Research Center Incorporated | Method, apparatus, and program product for quickly selecting complex molecules from a data base of molecules |
| US7283937B2 (en) | 2005-12-21 | 2007-10-16 | Palo Alto Research Center Incorporated | Method, apparatus, and program product for distinguishing valid data from noise data in a data set |
| US20080010309A1 (en) | 2006-07-05 | 2008-01-10 | Fujifilm Corporation | Data compression apparatus and data compressing program storage medium |
| US7496453B2 (en) | 2006-11-07 | 2009-02-24 | The Hong Kong Polytechnic University | Classification of herbal medicines using wavelet transform |
| US20090012931A1 (en) | 2007-06-04 | 2009-01-08 | Bae Systems Plc | Data indexing and compression |
| US8004432B2 (en) | 2007-11-30 | 2011-08-23 | Shimadzu Corporation | Time-of-flight measuring device |
| US20090179147A1 (en)* | 2008-01-16 | 2009-07-16 | Milgram K Eric | Systems, methods, and computer-readable medium for determining composition of chemical constituents in a complex mixture |
| US20100124785A1 (en) | 2008-11-18 | 2010-05-20 | Palo Alto Research Center Incorporated | Wild-card-modification technique for peptide identification |
| US20100288917A1 (en) | 2009-05-13 | 2010-11-18 | Agilent Technologies, Inc. | System and method for analyzing contents of sample based on quality of mass spectra |
| US20100288918A1 (en) | 2009-05-14 | 2010-11-18 | Agilent Technologies, Inc. | System and method for performing tandem mass spectrometry analysis |
| US20110093205A1 (en) | 2009-10-19 | 2011-04-21 | Palo Alto Research Center Incorporated | Proteomics previewer |
| US8645145B2 (en) | 2010-01-12 | 2014-02-04 | Fraunhoffer-Gesellschaft Zur Foerderung Der Angewandten Forschung E.V. | Audio encoder, audio decoder, method for encoding and audio information, method for decoding an audio information and computer program using a hash table describing both significant state values and interval boundaries |
| US20110206119A1 (en) | 2010-02-19 | 2011-08-25 | Lazar Bivolarsky | Data Compression for Video |
| WO2011127544A1 (en) | 2010-04-12 | 2011-10-20 | Katholieke Universifeit Leuven | Intensity normalization in imaging mass spectrometry |
| US20130080073A1 (en) | 2010-06-11 | 2013-03-28 | Waters Technologies Corporation | Techniques for mass spectrometry peak list computation using parallel processing |
| US20120245857A1 (en) | 2010-06-16 | 2012-09-27 | Abbott Laboratories | Methods and Systems for the Analysis of Protein Samples |
| US8598516B2 (en) | 2010-07-09 | 2013-12-03 | Yerbol Aldanovich Sapargaliyev | Method of mass-spectrometry and a device for its realization |
| US20130226594A1 (en) | 2010-07-20 | 2013-08-29 | Fraunhofer-Gesellschaft Zur Foerderung Der Angewandten Forschung E.V. | Audio encoder, audio decoder, method for encoding and audio information, method for decoding an audio information and computer program using an optimized hash table |
| US20120047098A1 (en) | 2010-08-19 | 2012-02-23 | Daniel Reem | Method for computing and storing voronoi diagrams, and uses therefor |
| US8428889B2 (en) | 2010-10-07 | 2013-04-23 | Thermo Finnigan Llc | Methods of automated spectral peak detection and quantification having learning mode |
| US20130266067A1 (en) | 2010-12-06 | 2013-10-10 | Sk Telecom Co., Ltd. | Method and device for encoding/decoding image by inter prediction using random block |
| US20130144540A1 (en) | 2011-12-06 | 2013-06-06 | Palo Alto Research Center Incorporated | Constrained de novo sequencing of peptides |
| US20130262809A1 (en) | 2012-03-30 | 2013-10-03 | Samplify Systems, Inc. | Processing system and method including data compression api |
| US20130275399A1 (en) | 2012-04-16 | 2013-10-17 | International Business Machines Corporation | Table boundary detection in data blocks for compression |
| US20130289892A1 (en) | 2012-04-25 | 2013-10-31 | Jeol Ltd. | Time-of-Flight Mass Spectrometer and Data Compression Method Therefor |
| US20140045273A1 (en) | 2012-08-09 | 2014-02-13 | Perkinelmer Health Sciences, Inc. | Methods and apparatus for identification of polymeric species from mass spectrometry output |
| US20140164444A1 (en) | 2012-12-01 | 2014-06-12 | The Regents Of The University Of California | System and method of managing large data files |
| WO2015031820A1 (en) | 2013-08-29 | 2015-03-05 | University Of Notre Dame Du Lac | High sensitivity electrospray interface |
| US20160215028A1 (en) | 2013-09-24 | 2016-07-28 | University Of Guelph | Biomarkers for mycobacterium avium paratuberculosis (map) |
| WO2015148941A1 (en) | 2014-03-28 | 2015-10-01 | Wisconsin Alumni Research Foundation | High mass accuracy filtering for improved spectral matching of high-resolution gas chromatography-mass spectrometry data against unit-resolution reference databases |
| US20150319268A1 (en) | 2014-05-02 | 2015-11-05 | Futurewei Technologies, Inc. | System and Method for Hierarchical Compression |
| WO2015189255A1 (en)* | 2014-06-13 | 2015-12-17 | Thermo Fisher Scientific (Bremen) Gmbh | Data processing device and method for the evaluation of mass spectrometry data |
| US10199206B2 (en) | 2014-06-16 | 2019-02-05 | Protein Metrics Inc. | Interactive analysis of mass spectrometry data |
| US9640376B1 (en)* | 2014-06-16 | 2017-05-02 | Protein Metrics Inc. | Interactive analysis of mass spectrometry data |
| US20150369782A1 (en)* | 2014-06-19 | 2015-12-24 | Shimadzu Corporation | Chromatograph/mass spectrometer data processing device |
| US20160077926A1 (en) | 2014-09-16 | 2016-03-17 | Actifio, Inc. | System and method for multi-hop data backup |
| US9385751B2 (en) | 2014-10-07 | 2016-07-05 | Protein Metrics Inc. | Enhanced data compression for sparse multidimensional ordered series data |
| US9859917B2 (en) | 2014-10-07 | 2018-01-02 | Protein Metrics Inc. | Enhanced data compression for sparse multidimensional ordered series data |
| US9571122B2 (en) | 2014-10-07 | 2017-02-14 | Protein Metrics Inc. | Enhanced data compression for sparse multidimensional ordered series data |
| US20160180555A1 (en)* | 2014-12-17 | 2016-06-23 | Shimadzu Corporation | Analytical data display processing device |
| US10354421B2 (en) | 2015-03-10 | 2019-07-16 | Protein Metrics Inc. | Apparatuses and methods for annotated peptide mapping |
| US20160268112A1 (en) | 2015-03-12 | 2016-09-15 | Thermo Finnigan Llc | Methods for Data-Dependent Mass Spectrometry of Mixed Biomolecular Analytes |
| US10665439B2 (en) | 2017-01-26 | 2020-05-26 | Protein Metrics Inc. | Methods and apparatuses for determining the intact mass of large molecules from mass spectrographic data |
| US20180301326A1 (en) | 2017-01-26 | 2018-10-18 | Marshall Bern | Methods and apparatuses for determining the intact mass of large molecules from mass spectrographic data |
| US20220076936A1 (en) | 2017-01-26 | 2022-03-10 | Protein Metrics Inc. | Methods and apparatuses for determining the intact mass of large molecules from mass spectrographic data |
| US11127575B2 (en) | 2017-01-26 | 2021-09-21 | Protein Metrics Inc. | Methods and apparatuses for determining the intact mass of large molecules from mass spectrographic data |
| US10546736B2 (en) | 2017-08-01 | 2020-01-28 | Protein Metrics Inc. | Interactive analysis of mass spectrometry data including peak selection and dynamic labeling |
| US10991558B2 (en) | 2017-08-01 | 2021-04-27 | Protein Metrics Inc. | Interactive analysis of mass spectrometry data including peak selection and dynamic labeling |
| US20210335589A1 (en) | 2017-08-01 | 2021-10-28 | Protein Metrics Inc. | Interactive analysis of mass spectrometry data including peak selection and dynamic labeling |
| US10879057B2 (en)* | 2017-09-29 | 2020-12-29 | Protein Metrics Inc. | Interactive analysis of mass spectrometry data |
| US10510521B2 (en)* | 2017-09-29 | 2019-12-17 | Protein Metrics Inc. | Interactive analysis of mass spectrometry data |
| US11289317B2 (en)* | 2017-09-29 | 2022-03-29 | Protein Metrics Inc. | Interactive analysis of mass spectrometry data |
| US20200075300A1 (en) | 2018-09-05 | 2020-03-05 | Protein Metrics Inc. | Methods and apparatuses for deconvolution of mass spectrometry data |
| US11346844B2 (en) | 2019-04-26 | 2022-05-31 | Protein Metrics Inc. | Intact mass reconstruction from peptide level data and facilitated comparison with experimental intact observation |
| US20220291229A1 (en) | 2019-04-26 | 2022-09-15 | Protein Metrics Inc. | Intact mass reconstruction from peptide level data and facilitated comparison with experimental intact observation |
| US11276204B1 (en) | 2020-08-31 | 2022-03-15 | Protein Metrics Inc. | Data compression for multidimensional time series data |
Non-Patent Citations (31)
| Title |
|---|
| Bern et al.; Parsimonious charge deconvolution for native mass spectrometry. Journal of proteome research; 17(3); pp. 1216-1226; Jan. 29, 2018. |
| Bern et al.; U.S. Appl. No. 18/298,327 entitled "Interactive analysis of mass spectrometry data including peak selection and dynamic labeling," filed Apr. 10, 2023. |
| Bern et al.; U.S. Appl. No. 18/309,727 entitled "Methods and apparatuses for deconvolution of mass spectrometry data," filed Apr. 28, 2023. |
| Kim et al.; Comparative analysis of mass spectral similarity measures on peak alignment for comprehensive two? dimensional gas chromatography mass spectrometry; Computational and mathematical methods in medicine; 2013(1); 509761; 12 pages; doi.org/10.1155/2013/509761; Sep. 16, 2013. |
| Klammer et al.; Peptide charge state determination for low-resolution tandem mass spectra; In2005 IEEE Computational Systems Bioinformatics Conference (CSB'05); pp. 175-185; Aug. 8, 2005. |
| Kletter et al.; U.S. Appl. No. 18/460,028 entitled "Data Compression for multidimensional time series data," filed Sep. 1, 2023. |
| Kletter; U.S. Appl. No. 17/694,474 entitled "Data compression for multidimensional time series data," filed Mar. 14, 2022. |
| Krokhin et al.; An improved model for prediction of retention times of tryptics peptides in ion pair reversed-phase HPLC: its application to protein peptide mapping by off-line HPLC-MALDI MS; Molecular and Cellular Proteomics; 3(9); pp. 908-919; Sep. 2004. |
| Lu et al.; Improved peak detection and deconvolution of native electrospray mass spectra from large protein complexes; Journal of the American Society for Mass Spectrometry; 26(12); pp. 2141-2151; Dec. 2015. |
| Marty et al.; Bayesian deconvolution of mass and ion mobility spectra: from binary interactions to polydisperse ensembles; Analytical Chemistry; 87(8); pp. 4370-4376; 7 pages; (Author Manuscript); Apr. 2015. |
| Marty; What can unidec do for you? Mar. 24, 2015I 28 pages; retrieved from the internet (http://unidec.chem.ox.ac.uk/UniDecTutorial.pdf) on Oct. 25, 2022. |
| Nichols et al.; U.S. Appl. No. 18/737,836 entitled "Psuedo-electropherogram construction from peptide level mass spectrometry data," filed Jun. 7, 2024. |
| Schreiber et al.; Using PeakView(TM) software with the XIC manager for screening and identification with high confidence based on high resolution and accurate mass LC-MS/MS: AB Sciex, Food & Environmental; (Pub. # 2170811-03); 5 pgs.; Apr. 2, 2011. |
| Schreibier and Cox, "Using PeakView™ Software with the XIC Manager for Screening and Identification with High Confidence Based on High Resolution and Accurate Mass LC-MS/MS", AB Sciex; Food & Environmental (Pub. # 2170811-03); 5pgs; Apr. 2, 2011 (Year: 2011).* |
| Shi et al.; Feature-based image set compression; 2013 IEEE International Conference on Multimedia and Expo (ICME); IEEE; pp. 1-6; Jul. 15, 2013. |
| Shi et al.; Multi-model prediction for image set compression; 2013 Visual Communications and Image Processing (VCIP); IEEE; pp. 1-6; Nov. 17, 2013. |
| Thermo Fisher Scientific, Inc.; Thermo Xcaliber: Qualitative Analysis (User Guide); Revision B; 290 pgs.; Sep. 2010. |
| Valot et al.; MassChroQ: A versatile tool for mass spectrometry quantification; Proteomics; 11(17); 23 pgs.; Sep. 2011. |
| VanBramer; An Introduction to Mass Spectrometry; Wider University; 38 pgs.; © 1997; (revised) Sep. 2, 1998. |
| Waters Corporation; Biopharmalynx: A new bioinformatics tool for automated LC/MS peptide mapping assignment; 6 pages retrived May 17, 2018 from the internet (http://www.waters.com/webassets/cms/library/docs/720002754en.pdf); Sep. 2008. |
| Waters Corporation; MassLynx 4.1 Getting started guide; 71500113203/RevisionA; 96 pages; retrieved May 17, 2018 from the internet (http://turroserver.chem.columbia.edu/group/instrument/HPLC/HPLC%20Getting%20Started.pdf) ; 2005. |
| Waters Corporation; QuanLynx User's Guide; Version 4.0; 125 pages; retrived May 17, 2018 from the internet ( http://www.waters.com/webassets/cms/support/docs/quanlynx_40.pdf); Feb. 15, 2002. |
| Wehofsky et al.; Isotopic deconvolution of matrix-assisted laser desorption/ionization mass spectra for substance-class specific analysis of complex samples; European Journal of Mass Spectrometry; 7(1); pp. 39-46; Feb. 1, 2001. |
| Wikipedia; Intra-Frame Coding; Sep. 19, 2019; 2 pages; retrieved from the internet (https://en.wikipedia.org/w/index.php?title=Intra-frame_coding&oldid=916815985) on Aug. 20, 2024. |
| Xu et al.; Deconvolution in mass spectrometry based proteomics; Rapid Communications in Mass Spectrometry; 32(10); pp. 763-774; May 30, 2018. |
| Yang et al.; Detecting low level sequence variants in recombinant monoclonal antibodies; mAbs 2 (3); pp. 285-298; May/Jun. 2010. |
| Yang et al.; Hybrid mass spectrometry approaches in glycoprotein analysis and their usage in scoring biosimilarity; Nature Communications; 7(1); pp. 1-10; Nov. 8, 2016. |
| Zhao et al.; An efficient macroblock-based diverse and flexible prediction modes selection for hyperspectral images coding; Signal Processing: Image Communication; 25(9); pp. 697-708; Oct. 1, 2010. |
| Ziv et al.; A universal algorithm for sequential data compression; IEEE Trans. on Information Theory; IT-23(3); pp. 337-343; May 1977. |
| Ziv et al.; Compression of individual sequences via variable-rate coding; IEEE Trans. on Information Theory; IT-24(5); pp. 530-536; Sep. 1978. |
| ZNova Decorivolutiori; retrieved from the internet (https://web.archive.org/web/20141106214830/http://www.enovatia.com:80/downloads/manuals/promass/Help/html/prom2cdq.htm); 1 page; on Oct. 6, 2023. |
Also Published As
| Publication number | Publication date |
|---|---|
| US20250232970A1 (en) | 2025-07-17 |
| US20220301840A1 (en) | 2022-09-22 |
Similar Documents
| Publication | Publication Date | Title |
|---|---|---|
| US11289317B2 (en) | Interactive analysis of mass spectrometry data | |
| US10991558B2 (en) | Interactive analysis of mass spectrometry data including peak selection and dynamic labeling | |
| US12224169B2 (en) | Interactive analysis of mass spectrometry data | |
| US10199206B2 (en) | Interactive analysis of mass spectrometry data | |
| US11626274B2 (en) | Interactive analysis of mass spectrometry data including peak selection and dynamic labeling | |
| US10354421B2 (en) | Apparatuses and methods for annotated peptide mapping | |
| Choi et al. | Analyzing protein‐protein interactions from affinity purification‐mass spectrometry data with SAINT | |
| Pedrioli | Trans-proteomic pipeline: a pipeline for proteomic analysis | |
| Carvalho et al. | Search engine processor: filtering and organizing peptide spectrum matches | |
| Brewis et al. | Proteomics technologies for the global identification and quantification of proteins | |
| Kusebauch et al. | Using PeptideAtlas, SRMAtlas, and PASSEL: comprehensive resources for discovery and targeted proteomics | |
| JP4768189B2 (en) | Methods for non-targeted complex sample analysis | |
| EP3155543B1 (en) | Data processing device and method for the evaluation of mass spectrometry data | |
| US12400846B2 (en) | Interactive analysis of mass spectrometry data including peak selection and dynamic labeling | |
| Dayon et al. | Progress and pitfalls of using isobaric mass tags for proteome profiling | |
| US20180088094A1 (en) | Multiple attribute monitoring methodologies for complex samples | |
| Perez-Lopez et al. | MSident: Straightforward identification of chemical compounds from MS-resolved spectra | |
| Beisken et al. | Metabolic differences in ripening of Solanum lycopersicum ‘Ailsa Craig’and three monogenic mutants | |
| US20250183022A1 (en) | Interactive analysis of analytical data | |
| Lundgren et al. | Protein identification using TurboSEQUEST | |
| Pablo et al. | Listening to your mass spectrometer: An open-source toolkit to visualize mass spectrometer data | |
| KR20230168942A (en) | A method for automatic selection for peak of mass spectrometry | |
| Yang et al. | Profiling Serum Intact N-Glycopeptides Using Data-Independent Acquisition Mass Spectrometry | |
| Farooq et al. | Concepts and Techniques in OMICS and System Biology | |
| El Abiead et al. | Benchmarking feature quality assurance strategies for non-targeted metabolomics |
Legal Events
| Date | Code | Title | Description |
|---|---|---|---|
| FEPP | Fee payment procedure | Free format text:ENTITY STATUS SET TO UNDISCOUNTED (ORIGINAL EVENT CODE: BIG.); ENTITY STATUS OF PATENT OWNER: LARGE ENTITY | |
| FEPP | Fee payment procedure | Free format text:ENTITY STATUS SET TO SMALL (ORIGINAL EVENT CODE: SMAL); ENTITY STATUS OF PATENT OWNER: LARGE ENTITY | |
| AS | Assignment | Owner name:PROTEIN METRICS INC., CALIFORNIA Free format text:ASSIGNMENT OF ASSIGNORS INTEREST;ASSIGNORS:KIL, YONG JOO;CARLSON, ERIC;REEL/FRAME:059564/0240 Effective date:20220407 | |
| STPP | Information on status: patent application and granting procedure in general | Free format text:DOCKETED NEW CASE - READY FOR EXAMINATION | |
| AS | Assignment | Owner name:PROTEIN METRICS, LLC, CALIFORNIA Free format text:CHANGE OF NAME;ASSIGNOR:PROTEIN METRICS INC.;REEL/FRAME:062625/0973 Effective date:20221227 | |
| STPP | Information on status: patent application and granting procedure in general | Free format text:NON FINAL ACTION MAILED | |
| AS | Assignment | Owner name:ARES CAPITAL CORPORATION, AS COLLATERAL AGENT, NEW YORK Free format text:NOTICE OF GRANT OF SECURITY INTEREST IN PATENTS;ASSIGNORS:PROTEIN METRICS, LLC;SOFTGENETICS, LLC;REEL/FRAME:068102/0180 Effective date:20240628 | |
| FEPP | Fee payment procedure | Free format text:ENTITY STATUS SET TO UNDISCOUNTED (ORIGINAL EVENT CODE: BIG.); ENTITY STATUS OF PATENT OWNER: LARGE ENTITY | |
| STPP | Information on status: patent application and granting procedure in general | Free format text:RESPONSE TO NON-FINAL OFFICE ACTION ENTERED AND FORWARDED TO EXAMINER | |
| STPP | Information on status: patent application and granting procedure in general | Free format text:NOTICE OF ALLOWANCE MAILED -- APPLICATION RECEIVED IN OFFICE OF PUBLICATIONS | |
| STPP | Information on status: patent application and granting procedure in general | Free format text:AWAITING TC RESP, ISSUE FEE PAYMENT VERIFIED | |
| STPP | Information on status: patent application and granting procedure in general | Free format text:PUBLICATIONS -- ISSUE FEE PAYMENT VERIFIED | |
| STCF | Information on status: patent grant | Free format text:PATENTED CASE | |
| AS | Assignment | Owner name:SOFTGENETICS, LLC, MASSACHUSETTS Free format text:RELEASE BY SECURED PARTY;ASSIGNOR:ARES CAPITAL CORPORATION, AS COLLATERAL AGENT;REEL/FRAME:071582/0907 Effective date:20250701 Owner name:PROTEIN METRICS, LLC, MASSACHUSETTS Free format text:RELEASE BY SECURED PARTY;ASSIGNOR:ARES CAPITAL CORPORATION, AS COLLATERAL AGENT;REEL/FRAME:071582/0907 Effective date:20250701 |