US12016694B2 - Electrocardiogram processing system for delineation and classification - Google Patents
Electrocardiogram processing system for delineation and classificationDownload PDFInfo
- Publication number
- US12016694B2 US12016694B2US17/390,714US202117390714AUS12016694B2US 12016694 B2US12016694 B2US 12016694B2US 202117390714 AUS202117390714 AUS 202117390714AUS 12016694 B2US12016694 B2US 12016694B2
- Authority
- US
- United States
- Prior art keywords
- ecg
- beats
- data
- beat
- ecg data
- Prior art date
- Legal status (The legal status is an assumption and is not a legal conclusion. Google has not performed a legal analysis and makes no representation as to the accuracy of the status listed.)
- Active
Links
Images


Classifications
- A—HUMAN NECESSITIES
- A61—MEDICAL OR VETERINARY SCIENCE; HYGIENE
- A61B—DIAGNOSIS; SURGERY; IDENTIFICATION
- A61B5/00—Measuring for diagnostic purposes; Identification of persons
- A61B5/24—Detecting, measuring or recording bioelectric or biomagnetic signals of the body or parts thereof
- A61B5/316—Modalities, i.e. specific diagnostic methods
- A61B5/318—Heart-related electrical modalities, e.g. electrocardiography [ECG]
- A61B5/346—Analysis of electrocardiograms
- A61B5/349—Detecting specific parameters of the electrocardiograph cycle
- A61B5/366—Detecting abnormal QRS complex, e.g. widening
- A—HUMAN NECESSITIES
- A61—MEDICAL OR VETERINARY SCIENCE; HYGIENE
- A61B—DIAGNOSIS; SURGERY; IDENTIFICATION
- A61B5/00—Measuring for diagnostic purposes; Identification of persons
- A61B5/72—Signal processing specially adapted for physiological signals or for diagnostic purposes
- A61B5/7271—Specific aspects of physiological measurement analysis
- A61B5/7282—Event detection, e.g. detecting unique waveforms indicative of a medical condition
- A—HUMAN NECESSITIES
- A61—MEDICAL OR VETERINARY SCIENCE; HYGIENE
- A61B—DIAGNOSIS; SURGERY; IDENTIFICATION
- A61B5/00—Measuring for diagnostic purposes; Identification of persons
- A61B5/0002—Remote monitoring of patients using telemetry, e.g. transmission of vital signals via a communication network
- A61B5/0004—Remote monitoring of patients using telemetry, e.g. transmission of vital signals via a communication network characterised by the type of physiological signal transmitted
- A61B5/0006—ECG or EEG signals
- A—HUMAN NECESSITIES
- A61—MEDICAL OR VETERINARY SCIENCE; HYGIENE
- A61B—DIAGNOSIS; SURGERY; IDENTIFICATION
- A61B5/00—Measuring for diagnostic purposes; Identification of persons
- A61B5/0002—Remote monitoring of patients using telemetry, e.g. transmission of vital signals via a communication network
- A61B5/0015—Remote monitoring of patients using telemetry, e.g. transmission of vital signals via a communication network characterised by features of the telemetry system
- A61B5/0022—Monitoring a patient using a global network, e.g. telephone networks, internet
- A—HUMAN NECESSITIES
- A61—MEDICAL OR VETERINARY SCIENCE; HYGIENE
- A61B—DIAGNOSIS; SURGERY; IDENTIFICATION
- A61B5/00—Measuring for diagnostic purposes; Identification of persons
- A61B5/02—Detecting, measuring or recording for evaluating the cardiovascular system, e.g. pulse, heart rate, blood pressure or blood flow
- A61B5/024—Measuring pulse rate or heart rate
- A61B5/02405—Determining heart rate variability
- A—HUMAN NECESSITIES
- A61—MEDICAL OR VETERINARY SCIENCE; HYGIENE
- A61B—DIAGNOSIS; SURGERY; IDENTIFICATION
- A61B5/00—Measuring for diagnostic purposes; Identification of persons
- A61B5/02—Detecting, measuring or recording for evaluating the cardiovascular system, e.g. pulse, heart rate, blood pressure or blood flow
- A61B5/024—Measuring pulse rate or heart rate
- A61B5/02438—Measuring pulse rate or heart rate with portable devices, e.g. worn by the patient
- A—HUMAN NECESSITIES
- A61—MEDICAL OR VETERINARY SCIENCE; HYGIENE
- A61B—DIAGNOSIS; SURGERY; IDENTIFICATION
- A61B5/00—Measuring for diagnostic purposes; Identification of persons
- A61B5/02—Detecting, measuring or recording for evaluating the cardiovascular system, e.g. pulse, heart rate, blood pressure or blood flow
- A61B5/024—Measuring pulse rate or heart rate
- A61B5/0245—Measuring pulse rate or heart rate by using sensing means generating electric signals, i.e. ECG signals
- A—HUMAN NECESSITIES
- A61—MEDICAL OR VETERINARY SCIENCE; HYGIENE
- A61B—DIAGNOSIS; SURGERY; IDENTIFICATION
- A61B5/00—Measuring for diagnostic purposes; Identification of persons
- A61B5/24—Detecting, measuring or recording bioelectric or biomagnetic signals of the body or parts thereof
- A61B5/30—Input circuits therefor
- A61B5/307—Input circuits therefor specially adapted for particular uses
- A61B5/308—Input circuits therefor specially adapted for particular uses for electrocardiography [ECG]
- A—HUMAN NECESSITIES
- A61—MEDICAL OR VETERINARY SCIENCE; HYGIENE
- A61B—DIAGNOSIS; SURGERY; IDENTIFICATION
- A61B5/00—Measuring for diagnostic purposes; Identification of persons
- A61B5/24—Detecting, measuring or recording bioelectric or biomagnetic signals of the body or parts thereof
- A61B5/316—Modalities, i.e. specific diagnostic methods
- A61B5/318—Heart-related electrical modalities, e.g. electrocardiography [ECG]
- A61B5/332—Portable devices specially adapted therefor
- A—HUMAN NECESSITIES
- A61—MEDICAL OR VETERINARY SCIENCE; HYGIENE
- A61B—DIAGNOSIS; SURGERY; IDENTIFICATION
- A61B5/00—Measuring for diagnostic purposes; Identification of persons
- A61B5/24—Detecting, measuring or recording bioelectric or biomagnetic signals of the body or parts thereof
- A61B5/316—Modalities, i.e. specific diagnostic methods
- A61B5/318—Heart-related electrical modalities, e.g. electrocardiography [ECG]
- A61B5/339—Displays specially adapted therefor
- A—HUMAN NECESSITIES
- A61—MEDICAL OR VETERINARY SCIENCE; HYGIENE
- A61B—DIAGNOSIS; SURGERY; IDENTIFICATION
- A61B5/00—Measuring for diagnostic purposes; Identification of persons
- A61B5/24—Detecting, measuring or recording bioelectric or biomagnetic signals of the body or parts thereof
- A61B5/316—Modalities, i.e. specific diagnostic methods
- A61B5/318—Heart-related electrical modalities, e.g. electrocardiography [ECG]
- A61B5/346—Analysis of electrocardiograms
- A61B5/349—Detecting specific parameters of the electrocardiograph cycle
- A61B5/352—Detecting R peaks, e.g. for synchronising diagnostic apparatus; Estimating R-R interval
- A—HUMAN NECESSITIES
- A61—MEDICAL OR VETERINARY SCIENCE; HYGIENE
- A61B—DIAGNOSIS; SURGERY; IDENTIFICATION
- A61B5/00—Measuring for diagnostic purposes; Identification of persons
- A61B5/24—Detecting, measuring or recording bioelectric or biomagnetic signals of the body or parts thereof
- A61B5/316—Modalities, i.e. specific diagnostic methods
- A61B5/318—Heart-related electrical modalities, e.g. electrocardiography [ECG]
- A61B5/346—Analysis of electrocardiograms
- A61B5/349—Detecting specific parameters of the electrocardiograph cycle
- A61B5/36—Detecting PQ interval, PR interval or QT interval
- A—HUMAN NECESSITIES
- A61—MEDICAL OR VETERINARY SCIENCE; HYGIENE
- A61B—DIAGNOSIS; SURGERY; IDENTIFICATION
- A61B5/00—Measuring for diagnostic purposes; Identification of persons
- A61B5/24—Detecting, measuring or recording bioelectric or biomagnetic signals of the body or parts thereof
- A61B5/316—Modalities, i.e. specific diagnostic methods
- A61B5/318—Heart-related electrical modalities, e.g. electrocardiography [ECG]
- A61B5/346—Analysis of electrocardiograms
- A61B5/349—Detecting specific parameters of the electrocardiograph cycle
- A61B5/361—Detecting fibrillation
- A—HUMAN NECESSITIES
- A61—MEDICAL OR VETERINARY SCIENCE; HYGIENE
- A61B—DIAGNOSIS; SURGERY; IDENTIFICATION
- A61B5/00—Measuring for diagnostic purposes; Identification of persons
- A61B5/24—Detecting, measuring or recording bioelectric or biomagnetic signals of the body or parts thereof
- A61B5/316—Modalities, i.e. specific diagnostic methods
- A61B5/318—Heart-related electrical modalities, e.g. electrocardiography [ECG]
- A61B5/346—Analysis of electrocardiograms
- A61B5/349—Detecting specific parameters of the electrocardiograph cycle
- A61B5/364—Detecting abnormal ECG interval, e.g. extrasystoles, ectopic heartbeats
- A—HUMAN NECESSITIES
- A61—MEDICAL OR VETERINARY SCIENCE; HYGIENE
- A61B—DIAGNOSIS; SURGERY; IDENTIFICATION
- A61B5/00—Measuring for diagnostic purposes; Identification of persons
- A61B5/72—Signal processing specially adapted for physiological signals or for diagnostic purposes
- A61B5/7221—Determining signal validity, reliability or quality
- A—HUMAN NECESSITIES
- A61—MEDICAL OR VETERINARY SCIENCE; HYGIENE
- A61B—DIAGNOSIS; SURGERY; IDENTIFICATION
- A61B5/00—Measuring for diagnostic purposes; Identification of persons
- A61B5/72—Signal processing specially adapted for physiological signals or for diagnostic purposes
- A61B5/7235—Details of waveform analysis
- A61B5/725—Details of waveform analysis using specific filters therefor, e.g. Kalman or adaptive filters
- A—HUMAN NECESSITIES
- A61—MEDICAL OR VETERINARY SCIENCE; HYGIENE
- A61B—DIAGNOSIS; SURGERY; IDENTIFICATION
- A61B5/00—Measuring for diagnostic purposes; Identification of persons
- A61B5/72—Signal processing specially adapted for physiological signals or for diagnostic purposes
- A61B5/7235—Details of waveform analysis
- A61B5/7264—Classification of physiological signals or data, e.g. using neural networks, statistical classifiers, expert systems or fuzzy systems
- A61B5/7267—Classification of physiological signals or data, e.g. using neural networks, statistical classifiers, expert systems or fuzzy systems involving training the classification device
- A—HUMAN NECESSITIES
- A61—MEDICAL OR VETERINARY SCIENCE; HYGIENE
- A61B—DIAGNOSIS; SURGERY; IDENTIFICATION
- A61B5/00—Measuring for diagnostic purposes; Identification of persons
- A61B5/74—Details of notification to user or communication with user or patient; User input means
- A61B5/742—Details of notification to user or communication with user or patient; User input means using visual displays
- A61B5/7435—Displaying user selection data, e.g. icons in a graphical user interface
- G—PHYSICS
- G06—COMPUTING OR CALCULATING; COUNTING
- G06N—COMPUTING ARRANGEMENTS BASED ON SPECIFIC COMPUTATIONAL MODELS
- G06N3/00—Computing arrangements based on biological models
- G06N3/02—Neural networks
- G—PHYSICS
- G06—COMPUTING OR CALCULATING; COUNTING
- G06N—COMPUTING ARRANGEMENTS BASED ON SPECIFIC COMPUTATIONAL MODELS
- G06N3/00—Computing arrangements based on biological models
- G06N3/02—Neural networks
- G06N3/04—Architecture, e.g. interconnection topology
- G06N3/044—Recurrent networks, e.g. Hopfield networks
- G06N3/0442—Recurrent networks, e.g. Hopfield networks characterised by memory or gating, e.g. long short-term memory [LSTM] or gated recurrent units [GRU]
- G—PHYSICS
- G06—COMPUTING OR CALCULATING; COUNTING
- G06N—COMPUTING ARRANGEMENTS BASED ON SPECIFIC COMPUTATIONAL MODELS
- G06N3/00—Computing arrangements based on biological models
- G06N3/02—Neural networks
- G06N3/04—Architecture, e.g. interconnection topology
- G06N3/045—Combinations of networks
- G—PHYSICS
- G06—COMPUTING OR CALCULATING; COUNTING
- G06N—COMPUTING ARRANGEMENTS BASED ON SPECIFIC COMPUTATIONAL MODELS
- G06N3/00—Computing arrangements based on biological models
- G06N3/02—Neural networks
- G06N3/04—Architecture, e.g. interconnection topology
- G06N3/0464—Convolutional networks [CNN, ConvNet]
- G—PHYSICS
- G06—COMPUTING OR CALCULATING; COUNTING
- G06N—COMPUTING ARRANGEMENTS BASED ON SPECIFIC COMPUTATIONAL MODELS
- G06N3/00—Computing arrangements based on biological models
- G06N3/02—Neural networks
- G06N3/08—Learning methods
- G—PHYSICS
- G06—COMPUTING OR CALCULATING; COUNTING
- G06N—COMPUTING ARRANGEMENTS BASED ON SPECIFIC COMPUTATIONAL MODELS
- G06N3/00—Computing arrangements based on biological models
- G06N3/02—Neural networks
- G06N3/08—Learning methods
- G06N3/09—Supervised learning
- G—PHYSICS
- G16—INFORMATION AND COMMUNICATION TECHNOLOGY [ICT] SPECIALLY ADAPTED FOR SPECIFIC APPLICATION FIELDS
- G16H—HEALTHCARE INFORMATICS, i.e. INFORMATION AND COMMUNICATION TECHNOLOGY [ICT] SPECIALLY ADAPTED FOR THE HANDLING OR PROCESSING OF MEDICAL OR HEALTHCARE DATA
- G16H50/00—ICT specially adapted for medical diagnosis, medical simulation or medical data mining; ICT specially adapted for detecting, monitoring or modelling epidemics or pandemics
- G16H50/20—ICT specially adapted for medical diagnosis, medical simulation or medical data mining; ICT specially adapted for detecting, monitoring or modelling epidemics or pandemics for computer-aided diagnosis, e.g. based on medical expert systems
- A—HUMAN NECESSITIES
- A61—MEDICAL OR VETERINARY SCIENCE; HYGIENE
- A61B—DIAGNOSIS; SURGERY; IDENTIFICATION
- A61B2560/00—Constructional details of operational features of apparatus; Accessories for medical measuring apparatus
- A61B2560/02—Operational features
Definitions
- the present disclosurerelates, in general, to an electrocardiogram (ECG) processing system, for example, an ECG system with artificial intelligence and having delineation, classification, embedding, and grouping machine learning functionality and facilitating visualization of a large volume of ECG related data.
- ECGelectrocardiogram
- An electrocardiogramreceives electrical cardiac signals from the heart that may be digitized and recorded by a computing device.
- An ECGtypically is generated from cardiac signals sensed by a number of electrodes placed in specific areas on a patient. It is a simple, non-invasive tool, that may be used by most any healthcare professional.
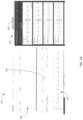
- FIG. 1 Aillustrates a recording of a standard 12-lead resting ECG. As is shown in FIG. 1 A , each lead generates an electrical signal, resulting in 12 electrical signals. Though the ECG illustrated in FIG. 1 A involves 12 leads resulting in 12 recordings, some ECGs may involve fewer leads resulting in fewer recordings. As is shown in FIG. 1 A , a cardiac signal displays repeating patterns usually comprising a P-wave, a QRS complex, and a T-wave. As the name suggests, a QRS complex includes a Q-wave, an R-wave and an S-wave. An exemplary P-wave, QRS complex, and T-wave is illustrated in FIG. 1 B , which focuses on a couple of beats in one lead signal, showing one R-R interval.
- a trained healthcare professionalmay analyze the ECG recording to identify any abnormalities and/or episodes. It is estimated that about 150 measurable abnormalities may be identified on an ECG recordings today. However, specific expertise and/or training is required to identify abnormalities from an ECG. ECG analysis is only available to those patients that can afford healthcare professions having the appropriate expertise and who otherwise have access to these professionals.
- Telecardiology centershave been developed to provide ECG analysis to patients that may not otherwise have access to these trained healthcare professionals.
- an ECG recordingis generated offsite by a non-specialist and is sent to the telecardiology center for analysis by a cardiologist or by a specialized ECG technician. While the results are generally high quality, the process may be slow and expensive.
- the first approachis based on multiscale wavelet analysis. This approach looks for wavelet coefficients reaching predefined thresholds at specified scales.
- the usual processinvolves identifying QRS complexes, then P-waves, and finally T-waves. This approach is made unstable by the use of thresholds and fails to identify multiple P-waves and “hidden” P-waves.
- the second delineation approachis based on Hidden Markov Models (HMM).
- HMMHidden Markov Models
- This machine learning approachtreats the current state of the signal as a hidden variable that one wants to recover (Coast et al., IEEE transactions on biomedical engineering, Vol. 37, No. 9, September 1990, pp 826-836; Hughes et al., Proceedings of Neural Information Processing Systems, 2004, pp 611-618; U.S. Pat. No. 8,332,017 to Trassenko et al.).
- HMMHidden Markov Models
- QRS complexin current systems analysis is only performed on the QRS complex. For example, analysis of a QRS complex may detect ventricular or paced beats.
- the traininginvolves handcrafted sets of features and corresponding beat labels (Chazal et al., IEEE Transactions on Biomedical Engineering, 2004, vol. 51, pp. 1196-1206). As explained above, features that have been handcrafted will always be suboptimal since they were not learnt and the process of handcrafting features may have ignored or eliminated crucial information.
- neural networkslearn from raw or mildly preprocessed data and thus bypass the need of handcrafted features. While the application of neural networks is an improvement on the delineation and classification approaches described above, current systems have certain drawbacks. For example, the current neural networks were only developed for QRS characterization. Further, current neural networks processes information in a beat-by-beat manner which fails to capture contextual information from surrounding beats.
- ECGelectrocardiogram
- the systemsreceive ECG data from a sensing device positioned on a patient such as one or more ECG leads.
- the systemmay include an application that communicates with an ECG platform running on a server that processes and analyzes the ECG data, e.g., using neural networks for delineation of the cardiac signal and classification of various abnormalities, conditions and/or descriptors.
- the ECG platformmay be a cloud-based ECG platform that processes and analyzes the ECG data in the cloud.
- the processed ECG datais communicated from the server for display in a user-friendly and interactive manner with enhanced accuracy.
- the ECG application and ECG platformimplement the ECG processing system to receive ECG data, process and analyze ECG data, display ECG data on a system device, and generate a report having ECG data.
- a computerized-systemfor analyzing ECG data of a patient generated by one or more electrodes across a plurality of time points and comprising a plurality of beats.
- the computerized-systemmay be designed to analyze the ECG data using a delineation algorithm to generate wave information corresponding to a likelihood of a presence of at least one wave at the plurality of time points and further to determine beat onset information and beat offset information for beats of the plurality of beats where at least one wave is determined to be present to generate a plurality of beat onsets and beat offsets.
- the computerized systemmay further be designed to extract a plurality of beat portions of ECG data based on the plurality of beat onsets and beat offsets, each beat portion of the plurality of beat portions of ECG data corresponding to a beat of the plurality of beats, and determine that at least two beats of the plurality of beats should be grouped together based on the plurality of beat portions of ECG data, the at least two beats forming a cluster. Determining that the at least two beats of the plurality of beats should be grouped together may involve determining that the group data satisfies a threshold value.
- the computerized-systemmay further be designed to analyze the plurality of portions of ECG data using an embedding algorithm to generate embedding data representative of the plurality of beats, and analyze the embedding data using a grouping algorithm to generate group data.
- the at least two beats of the plurality of beatsmay be determined to be grouped together based on the group data.
- the group datamay correspond to a distance between two beats.
- the delineation algorithmmay utilize a first neural network and the embedding algorithm may utilize a second neural network.
- the grouping algorithmmay utilize a third neural network.
- the computerized-systemmay further be designed to receive user input data from an input device regarding an inaccuracy corresponding to displayed data related to the ECG data.
- the computerized-systemmay further be designed to adjust one or more of the delineation algorithm, embedding algorithm, or grouping algorithm based on the user input data.
- the computerized-systemmay further be designed to modify the displayed data based on the user input data.
- the user input datamay correspond to adding, deleting, or splitting one or more QRS clusters, PVC clusters, or PAC clusters.
- the embedding datamay involve a vector of data for each beat of the plurality of beats.
- the computerized-systemmay further be designed to transmit information indicative of the cluster to a computer for display on a graphic user interface.
- the computerized-systemmay further be designed to generate information to display at least one overlay comprising at least two beats of the plurality of beats overlaid over one another.
- the computerized-systemmay further be designed to analyze the beats in the cluster using a classification algorithm to determine a likelihood of a presence of the one or more abnormalities, conditions, or descriptors associated with cardiac events for the patient.
- the computerized-systemmay further be designed to analyze the wave information from the delineation algorithm using a classification algorithm to determine a likelihood of a presence of the one or more abnormalities, conditions, or descriptors associated with cardiac events for the patient.
- the wave informationmay be inputted into the classification algorithm and separately used to determine that at least two beats of the plurality of beats should be grouped together.
- the computerized-systemmay further be designed to, prior to analyzing the ECG data using the delineation algorithm, pre-process the ECG data to remove noise from the ECG data.
- the computerized-systemmay assign the ECG data and information based on the ECG data to a user account for review.
- the computerizedmay receive user input data regarding the ECG data and information based on the ECG data from the user account based on the review.
- a method for analyzing electrocardiogram (ECG) data of a patient generated by one or more electrodes across a plurality of time points and comprising a plurality of beatsis described herein.
- the methodmay involve analyzing the ECG data using a delineation algorithm to generate wave information corresponding to a likelihood of a presence of at least one wave at the plurality of time points, and determining beat onset information and beat offset information for beats of the plurality of beats where at least one wave is determined to be present to generate a plurality of beat onsets and beat offsets.
- the methodmay further involve extracting a plurality of beat portions of ECG data based on the plurality of beat onsets and beat offsets, each beat portion of the plurality of beat portions of ECG data corresponding to a beat of the plurality of beats, and determining that at least two beats of the plurality of beats should be grouped together based on the plurality of beat portions of ECG data, the at least two beats forming a cluster.
- the methodmay further involve analyzing the plurality of portions of ECG data using an embedding algorithm to generate embedding data representative of the plurality of beats, and analyzing the embedding data using a grouping algorithm to generate group data.
- the at least two beats of the plurality of beatsmay be determined to be grouped together based on the group data.
- the methodmay further involve assigning the ECG data and information based on the ECG data to a user account for review of the ECG data.
- the methodmay further involve submitting the ECG data and information based on the ECG data for quality review by one or more reviewers.
- the methodmay further involve receiving quality control input generated by the one or more reviewers.
- the methodmay further involve causing display of the quality control input for additional quality control review.
- the methodmay further involving receiving user input data from an input device regarding an inaccuracy corresponding to information based on the ECG data.
- the methodmay further involve adjusting one or more of the delineation algorithm, embedding algorithm, or grouping algorithm based on the user input data.
- the methodmay further involve assigning the displayed data to a user account for quality review.
- a system for analyzing ECG data of a patientmay, in one example, involve a first plurality of instructions designed to, when executed, obtain ECG data of the patient over a plurality of time points and may further cause transmission of the ECG data to at least one server.
- the ECG datamay be sampled at a predetermined sampling rate such as a rate of at least 20 samples per second.
- the system for analyzing ECG datamay further involve a second plurality of instructions designed to, when executed, cause the at least one server to receive the ECG data of the patient, analyze the ECG data of the patient using at least one algorithm trained from a plurality of ECG data sets from different patients, quantify a likelihood of a presence of one or more abnormalities, conditions, or descriptors, or any combination thereof, and transmit information corresponding to the presence of the one or more abnormalities, conditions, or descriptors, or any combination thereof, to a computer remote from the at least one server for display.
- the system for analyzing ECG datamay further involve a third plurality of instructions designed to, when executed by the computer, cause the computer to display information corresponding the presence of the one or more abnormalities, conditions, or descriptors, or any combination thereof, based on the transmitted information from the at least one server. It is understood that each set of the plurality of ECG data sets from the different patients may be generated at a sampling rate equal to the rate used to obtain the ECG data. It is further understood that the computer that executes the third plurality of instructions may also execute the first plurality of instructions.
- the second plurality of instructionsmay, when executed, further cause the at least one server to pre-process the ECG data which may involve removing noise from the ECG data or expressing the ECG data at a predetermined baseline frequency. Further, the second plurality of instructions, when executed, may analyze the ECG data of the patient using at least one algorithm that applies the ECG data to a first neural network for delineation and may further quantify a likelihood of a presence of at least one of a P-wave, QRS complex, or T-wave at each of the plurality of time points.
- the second plurality of instructionsmay further calculate at least one onset and at least one offset for at least one of the P-wave, QRS-complex, or T-wave, and/or calculate at least one measurement from one or more of the onset, the offset, or the output of the first neural network.
- the second plurality of instructionsmay, when executed, analyze the ECG data of the patient using at least one algorithm that applies the ECG data to a second neural network for classification.
- the second plurality of instructionsmay quantify a likelihood of a presence of the one or more abnormalities, conditions, or descriptors, and may apply a threshold to at least one value in the output of the second neural network and assign at least one label corresponding to the one or more abnormalities, conditions, or descriptors if the value exceeds a threshold.
- the second plurality of instructionsmay also post-process the ECG data by removing redundant labels.
- the systemmay further include a fourth and/or fifth plurality of instructions.
- the fourth plurality of instructionsmay, when executed, cause the at least one server to generate a report including at least the transmitted information corresponding to the presence of the one or more abnormalities, conditions, or descriptors.
- the fifth plurality of instructionsmay, when executed, receive user input related to the ECG data and cause the computer to transmit the user input to the at least one server such that the at least one server uses the user input to generate the report.
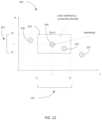
- the reportmay include at least one heart rate density plot representing density of heart rates of the patient as a function of time. It is understood that a third plurality of instructions is further configured to, when executed by the computer, cause the computer to display a heart rate density plot representing density of heart rates of the patient as a function of time.
- a system for analyzing ECG data of a patientmay, in another example, involve instructions stored on at least one server that are designed to, when executed, cause the at least one server to receive a set of ECG data of the patient over a plurality of time points.
- the set of ECG datamay be sampled at a predetermined sampling rate such as a rate of at least 20 samples per second.
- the instructionsmay further be designed to cause the at least one server to analyze the set of ECG data of the patient using at least one algorithm, quantify, at each time point of the plurality of time points, a likelihood of a presence of one or more abnormalities, conditions, or descriptors, or any combination thereof and transmit information corresponding to the likelihood of the presence of the one or more abnormalities, conditions, or descriptors to a computer for display.
- the at least one algorithmmay be trained using a plurality of sets of ECG data generated at a sampling rate of at least 20 samples per second from different patients.
- a computerized-method for analyzing ECG data of a patientmay similarly involve receiving a set of ECG data of the patient over a plurality of time points sampled at a sample rate and analyzing the set of ECG data of the patient using at least one algorithm trained using a plurality of sets of ECG data. Each set in the plurality of sets of ECG data may be generated at the same sample rate from different patients.
- the computerized method for analyzing ECG datamay further involve identifying, at each time point, one or more abnormalities, conditions or descriptors, or any combination thereof and further may involve transmitting information including the one or more abnormalities, conditions, or descriptors, or any combination thereof to a computer for display. It is understood that the computerized-method may involve analyzing an entire set of sampled ECG data without discarding data from the set of ECG data.
- the computerized-methodmay, in one example, involve a sample rate of at least 20 samples per second.
- the computerized-methodmay further involve assigning the set of ECG data and information based on the set of ECG data to a user account for review of the ECG data.
- the computerized-methodmay further involve submitting the set of ECG data and information based on the set of ECG data for quality review by one or more reviewers.
- the computerized-methodmay further involve receiving quality control input generated by the one or more reviewers.
- the methodmay further involve causing display of the quality control input for additional quality control review.
- FIG. 1 Ais a recording of a standard 12-lead resting ECG and FIG. 1 B is a recording of an exemplary P-wave, QRS complex and T-wave.
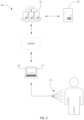
- FIG. 2is a diagram illustrating exemplary components for executing systems and methods in accordance with aspect of the present disclosure.
- FIGS. 3 A- 3 Bare schematic views of the exemplary hardware and software components of an exemplary system device and an exemplary server, respectively.
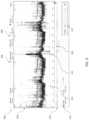
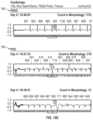
- FIGS. 5 A- 5 Bare line graphs representing an exemplary ECG signal and an exemplary output of a first neural network for each wave type analyzed, respectively.
- FIGS. 6 A- 6 Bare exemplary representations of classification neural networks in the form of a convolutional neural network and a recurrent neural network, respectively.
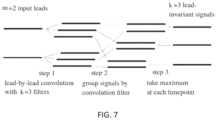
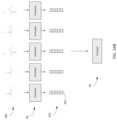
- FIG. 7is an exemplary representation of a variable number of lead entries and a constant number of outputs.
- FIG. 8is an exemplary user interface having an R-R plot generated in accordance with aspects of the recent disclosure.
- FIG. 9is a zoomed-in view of the R-R plot shown in FIG. 8 .
- FIG. 10is an exemplary user interface having a heart rate density plot generated in accordance with aspects of the present disclosure.
- FIG. 11is a flow chart illustrating an exemplary approach for generating a heart rate density plot.
- FIG. 12is an exemplary heart rate density plot generated in accordance with aspects of the present disclosure.
- FIG. 13is an exemplary user interface having a zoomed-in heart rate density plot.
- FIGS. 14 A- 14 Eare side-by-side comparisons of various R-R plots and heart rate density plots generated from the same cardiac signal.
- FIGS. 15 A- 15 Dis an exemplary report generated by the ECG processing system having information corresponding to the patient and processed ECG data and displaying a heart rate density plot and ECG strips.
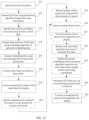
- FIG. 16 Ais a flow chart of an exemplary method of processing ECG data, displaying ECG data, and generating a report including ECG data and
- FIG. 16 Bis an exemplary data flow illustrating embedding.
- FIG. 17is an exemplary process for analyzing ECG data and grouping similar beats using a grouping algorithm.
- FIG. 18is an exemplary graphic user interface illustrating a plurality of morphologies.
- FIG. 19illustrates a third graphic window of the graphic user interface.
- FIGS. 20 A and 20 Billustrate an exemplary morphology and beat overlay.
- FIG. 21is an exemplary graphic user interface illustrating an ectopic run.
- FIGS. 22 A- 22 Pis an exemplary report generated by the ECG processing system.
- FIGS. 23 A- 23 Dillustrate user interfaces for assigning ECG data and information based on ECG data to healthcare professionals.
- FIGS. 24 A- 24 Fillustrate user interfaces for quality control and quality review of ECG data and information based on ECG data.
- the present inventionis directed to an electrocardiogram (ECG) processing system having medical grade artificial intelligence involving an ECG application run on a system device and an ECG platform run on a server(s).
- the ECG application and ECG platformimplement the ECG processing system by processing and analyzing the ECG data using machine learning algorithms to achieve delineation of the cardiac signal and classification of various abnormalities, conditions, and descriptors.
- the server(s)may be located in a different location than the system device(s) and the servers need not be in the same physical location as one another (e.g., the server(s) may be a remote server(s)). Alternatively, the server(s) and the system device(s) may be located in the same general area (e.g., on a local area network (LAN)).
- the ECG platformmay be a cloud-based ECG platform that may implement the ECG processing system by processing and analyzing the ECG data in the cloud.
- ECG application running on the system devicemay receive ECG data (i.e., cardiac signal) from a sensing device and may transmit the ECG data to a ECG platform running on the server.
- the ECG platformmay execute a first and second neural network and may apply the ECG data to the first and second neural network.
- the first neural networkmay be a delineation neural network having machine learning functionality.
- the second neural networkmay be a classification neural network having machine learning functionality.
- the output of the first and/or second neural networksmay be processed by the ECG platform to achieve delineation and classification of the ECG data.
- the ECG data and/or data generated by the ECG platformmay be communicated from the ECG platform to the ECG application.
- the ECG applicationmay cause the ECG data and/or data generated by the ECG platform to be displayed in an interactive manner.
- the ECG platformmay generate reports including ECG data and/or data generated by the ECG platform, and may communicate the reports to the ECG application.
- FIG. 2exemplary components for executing electrocardiogram (ECG) processing system 10 are illustrated.
- FIG. 2shows ECG sensing device 13 , system device 14 , and server 15 , as well as drive 16 .
- ECG sensing device 13is designed to sense the electrical activity of the heart for generating ECG data.
- sensing device 13may be one or more electrodes that may be disposed on one or more leads.
- ECG sensing device 13may be an ECG-dedicated sensing device such as a conventional 12-lead arrangement or may be a multi-purposes device with sensing hardware for sensing electrical activity of the heart for ECG generation such as the Apple Watch available from Apple, Inc., of Cupertino, California Sensing device 13 may be placed on the surface of the chest of a patient and/or limbs of a patient.
- Sensing device 13may be in electrical communication with system device 14 running the ECG application 29 such that the electrical signal sensed by sensing device 13 may be received by the ECG application 29 .
- ECG application 29may include instructions that cause sensing device 13 to sense or otherwise obtain ECG data.
- System device 14is preferably one or more computing devices (e.g., laptop, desktop, tablet, smartphone, smartwatch, etc.) having the components described below with reference to FIG. 3 A and the functionality described herein.
- System device 14 running ECG application 29may connect with server 15 running ECG platform 37 via any well-known wired or wireless connection.
- system device 14may connect to the Internet using well known technology (e.g., WiFi, cellular, cable/coaxial, and/or DSL) and may communicate with server 15 over the Internet.
- well known technologye.g., WiFi, cellular, cable/coaxial, and/or DSL
- Server 15is preferably one or more servers having the components described below with reference to FIG. 3 B and the functionality described herein.
- Server 15preferably has processing power superior to system device 14 such that server 15 can process and analyze cardiac signals having a sampling rate above a predetermined threshold, such as at least 20 samples per second, at least 250 samples per second, or at least 1000 samples per second.
- server 15may include a plurality of servers located in a common physical location or in different physical locations. In a preferred embodiment, server 15 is located in a different, remote location (e.g., on the cloud) than system device 14 , although server 15 and system device 14 may be located in a common location (e.g., on a local area network (LAN)).
- LANlocal area network
- Server 15may optionally communicate with drive 16 which may be one or more drives having memory dedicated to storing digital information unique to a certain patient, professional, facility and/or device.
- drive 16may include, but is not limited to, volatile (e.g. random-access memory (RAM)), non-volatile (e.g. read-only memory (ROM)), flash memory, or any combination thereof.
- RAMrandom-access memory
- ROMread-only memory
- Drive 16may be incorporated into server 15 or may be separate and distinct from server 15 and may communicate with server 15 over any well-known wireless or wired connection.
- hardware and software components of system device 14may include one or more processing unit 21 , memory 22 , storage 27 , communication unit 23 , and power source 24 , input devices 25 and output devices 26 .
- Processing unit 31may be one or more processors configured to run collaboration operating system 28 and ECG application 29 and perform the tasks and operations of system device 14 set forth herein.
- Memory 22may include, but is not limited to, volatile (e.g. random-access memory (RAM)), non-volatile (e.g. read-only memory (ROM)), flash memory, or any combination thereof.
- Communication unit 23may receive and/or transmit information to and from other components in ECG processing system 10 including, but not limited to, sensing device 13 and server 15 .
- Communication unit 23may be any well-known communication infrastructure facilitating communication over any well-known wired or wireless connection, including over any well-known standard such as any IEEE 802 standard.
- Power source 24may be a battery or may connect system device 14 to a wall outlet or any other external source of power.
- Storage 27may include, but is not limited to, removable and/or non-removable storage such as, for example, magnetic disks, optical disks, or tape.
- Input device 25may be one or more devices coupled to or incorporated into system device 14 for inputting data to system device 14 .
- Input device 25may further include a keyboard, a mouse, a pen, a sound input device (e.g., microphone), a touch input device (e.g., touch pad or touch screen), a location sensor, and/or a camera, for example.
- Output device 26may be any device coupled to or incorporated into system device 14 for outputting or otherwise displaying data and includes at least a display 17 .
- Output device 26may further include speakers and/or a printer, for example.
- ECG application 29may be stored in storage 27 and executed on processing unit 21 .
- ECG application 29may be a software application and/or software modules having one or more sets of instructions suitable for performing the operations of system device 14 set forth herein, including facilitating the exchange of information with sensing device 13 and server 15 .
- ECG application 29may cause system device 14 to receive ECG data from sensing device 13 , to record ECG data from sensing device 13 , to communicate ECG data to server 15 , to instruct server 15 to process and analyze ECG data, to receive processed and/or analyzed ECG data from server 15 , to communicate user input regarding report generation to server, and to generate a graphic user interface suitable for displaying raw, analyzed and/or processed ECG data and data related thereto.
- Operating system 28may be stored in storage 27 and executed on processing unit 21 . Operating system 28 may be suitable for controlling the general operation of system device 14 and may work in concert with ECG application 29 to achieve the functionality of system device 14 described herein. System device 14 may also optionally run a graphics library, other operating systems, and/or any other application programs. It of course is understood that system device 14 may include additional or fewer components than those illustrated in FIG. 3 A and may include more than one of each type of component.
- hardware and software components of server 15may include one or more processing unit 31 , memory 32 , storage 35 , power source 33 , and communication unit 34 .
- Processing unit 31may be one or more processors configured to run operating system 36 and ECG platform 37 and perform the tasks and operations of server 15 set forth herein. Given the volume of data and processing tasks assigned to processing unit 31 , it is understood that processing unit 31 has superior processing power compared to processing unit 21 .
- Memory 32may include, but is not limited to, volatile (e.g. random-access memory (RAM)), non-volatile (e.g. read-only memory (ROM)), flash memory, or any combination thereof.
- Storage 35may include, but is not limited to, removable and/or non-removable storage such as, for example, magnetic disks, optical disks, or tape.
- Communication unit 34may receive and/or transmit information to and from other components of ECG processing system 10 including, but not limited to, system device 14 and/or drive 16 .
- Communication unit 34may be any well-known communication infrastructure facilitating communication over any well-known wired or wireless connection.
- Power source 33may be a battery or may connect server 15 to a wall outlet or other external source of power.
- Operating system 36 and ECG platform 37may be stored in storage 35 and executed on processing unit 31 .
- Operating system 36may be suitable for controlling general operation of server 15 .
- ECG platform 37may be a software application and/or software modules having one or more sets of instructions.
- ECG platform 37may facilitate and oversee the processing and analysis of ECG data received from system device 14 , report generation, and otherwise may be suitable for performing the operations of server 15 set forth herein.
- ECG platform 37may include several sub-modules and/or applications including, but not limited to, pre-processor 38 , delineator 39 , classifier 41 , clusterer 42 which may include embedder 48 and grouper 49 , post-processor 43 , report generator 44 and recomputer 40 .
- Each sub-module and/or applicationmay be a separate software application and/or module having one or more sets of instructions.
- Pre-processor 38may pre-process raw ECG data
- delineator 39may execute a first neural network to achieve delineation
- classifier 41may execute a second neural network to achieve classification
- clusterer 42may identify clusters in data processed by the first neural network
- post-processor 43may post-process data processed by the second neural network
- embedder 48may execute one or more algorithms and/or a third neural network to achieve embedding
- grouper 49may execute one or more algorithms and/or a fourth neural network to generate cluster groups
- report generator 44may generate reports based on raw ECG data and ECG data processed by ECG platform 37
- recomputer 40may recompute and/or adjust embedder 48 and/or grouper 49 based on user input data.
- recomputer 40may recalculate episodes based on corrected wave information.
- ECG platform 37may also perform various other functions including, but not limited to, receiving requests from system device 14 to process and/or analyze ECG data, communicating processed and/or analyzed ECG data to system device 14 , receiving a request to generate a report, requesting and/or receiving user interaction and/or instructions from system device 14 , receiving user input data and/or instruction information from system device 14 regarding report generation, and/or communicating a report to system device 14 .
- Server 15may also optionally run a graphics library, other operating systems, and/or any other application programs. It of course is understood that server 15 may include additional or fewer components than those illustrated in FIG. 3 B and may include more than one of each type of component.
- FIG. 4illustrates an exemplary process for implementing ECG processing system 10 to receive and record ECG data, process and analyze ECG data, and generate reports involving ECG data, and further shows the flow of information between front end 45 and back end 46 of ECG processing system 10 .
- Front end 45includes at least ECG application 29 running on system device 14 .
- Back end 46includes at least ECG platform 37 running on server 15 .
- ECG application 29may cause system device 14 to receive and/or otherwise obtain raw ECG data 52 from sensing device 13 .
- ECG application 29may cause sensing device 13 to sense the cardiac signal and communicate the cardiac signal sensed by sensing device 13 to system device 14 .
- Raw ECG datais the cardiac signal sensed by sensing device 13 .
- Raw ECG data 52has not been processed or analyzed by ECG processing system 10 .
- Raw ECG data 52preferably involves data sampled multiple times per heartbeat over a plurality of heartbeats. It is understood that sensing device 13 may convert an analog cardiac signal into a digital signal, a different component not shown in FIG. 2 may convert the analog cardiac signal to a digital signal, or ECG application 29 may cause system device 14 to convert the analog cardiac signal to a digital signal.
- Raw ECG data in both analog and digital formare referred to herein as raw ECG data 52 .
- ECG application 29may cause system device 14 to record raw ECG data 52 and may optionally save some or all of raw ECG data 52 to system device 14 .
- the signalsmay correspond to one or more leads. When multiple leads are used, all leads may be processed simultaneously. It is understood that the cardiac signal generated by each lead may have varying lengths. It is further understood that the cardiac signal may be short term (e.g., 10 seconds in standard ECGs) or long term (several days in holters).
- System device 14may optionally display raw ECG data 52 or a portion thereof on display 17 .
- raw ECG data 52may be transmitted from front end 45 to back end 46 .
- ECG application 29may cause system device 14 to communicate raw ECG data 52 to ECG platform 37 running on server 15 .
- ECG platform 37may cause server 15 to save some or all of raw ECG data 52 to server 15 .
- ECG platform 37cause raw ECG data 52 to be preprocessed at step 54 by pre-processor 38 . It is understood that pre-processor 38 may be a stand-alone component of ECG platform 37 or subcomponent of delineator 39 .
- Pre-processor 38may process raw ECG data 52 or a portion thereof by removing the disturbing elements of the cardiac signal, such as noise from the raw ECG data.
- a multivariate functional data analysis approachmay be used (Pigoli and Sangalli. Computational Statistics and Data Analysis, Vol. 56, 2012, pp 1482-1498).
- the baseline frequency of raw ECG data 52may be removed by pre-processor 38 and the cardiac signal may be expressed at a chosen frequency.
- the frequencies of the signal corresponding to the patient's movementsmay be removed using median filtering (Kaur et al., Proceedings published by International Journal of Computer Applications, 2011, pp 30-36).
- ECG platform 37may cause pre-processed ECG data 55 to optionally be communicated to ECG application 29 running on system device 14 for display on display 17 .
- ECG platform 37may alternatively, or additionally, cause pre-processed ECG data 55 to be used as an input at classification step 58 , discussed in more detail.
- ECG platform 37causes pre-processed ECG data 55 to be applied to delineator 39 for delineation.
- Delineator 39applies a first neural network that is a delineation neural network to pre-processed ECG data 55 .
- a neural networkrefers to a mathematical structure or algorithm that may take an object (e.g., matrix or vector) as input and produce another object as an output though a set of linear and non-linear operations called layers.
- the input of the first neural networkmay be one or more multi-lead cardiac signals that are pre-processed to remove noise and/or baseline wandering.
- delineator 39may cause some or all of raw ECG data 52 to be expressed as matrix X, which may be a matrix of real numbers.
- matrix Xmay be a matrix of size m ⁇ n at the frequency used for training the networks, described in more detail below.
- the constant “m”may be a number of leads in sensing device 13 , which is typically 12, though any number of leads may be used.
- the number of samples “n”provides the duration of the cardiac signal “n/f” with f being the sampling frequency of the cardiac signal.
- the sample rateis above a predetermined rate and is preferably relatively high, such as, for example, at least 20, at least 250, at least 500 or at least 1000 samples per second, etc.
- all of the sampled ECG datais transferred to the server for input into the processing algorithms without filtering out ECG data.
- the ECG data applied to the first neural networkis preferably pre-processed ECG data 55 , it is understood that a non-preprocessed cardiac signal (i.e., raw ECG data 52 , or a portion thereof) may be applied to the first neural network.
- the first neural networkmay provide as an output, values corresponding to the likelihood of the presence of or one or more waves at a plurality of time points in the cardiac signal.
- the time pointsmay be dictated by the raw ECG data, may be selected by the user of system device 14 , or may be preprogrammed.
- the first neural networkmay be a convolutional neural network, and is preferably a fully convolutional neural network.
- Convolutional neural networksare a particular type of neural network where one or more matrices, which are learned, do not encode a full linear combination of the input elements, but the same local linear combination at all the elements of a structured signal, such as a cardiac signal, through a convolution (Fukushima, Biol. Cybernetics, Vol. 36, 1980, pp 193-202, LeCun et al., Neural Computation, Vol. 1, 1989, pp 541-551).
- a network which only contains convolutional networksis called a fully convolutional neural network.
- delineator 39causes the first neural network to read each time point of the cardiac signal, spatio-temporally analyze each time point of the cardiac signal, and assign a score at each time point corresponding to one or more types of waves. In this manner, all types of waves in the cardiac signals may analyzed and the likelihood of their presence at each time point, quantified, in a single step. Accordingly, each score generated by delineator 39 is indicative of the likelihood of the presence of a particular wave type at a given time point of the cardiac signal.
- delineator 39may process data sampled multiple times per heart beat across a plurality of heart beats.
- the output of the first neural networkmay be a matrix Y, which may be a matrix of real numbers.
- matrix Ymay be a matrix of the size p ⁇ n.
- Matrix Ymay include scores for each type of wave at each time point of the cardiac signal.
- “n”is the number of samples, as discussed above with respect to Matrix X
- “p”is the number of wave types plus the number of wave characterizations.
- wave characterizationmay correspond to conductivity, prematurity, ectopy, and/or origin of the waves in the cardiac signal, for example.
- the wave typesinclude (1) P-waves, (2) QRS complexes, and (3) T-waves
- Each wave typemay be expressed according to certain characteristics of that wave, such as start and end points (i.e., onset and offset)).
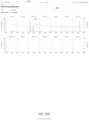
- FIGS. 5 A and 5 Bexemplary outputs of the first neural network are graphed for each wave type to illustrate the value of generating scores at each time point corresponding to a plurality of types of waves.
- FIG. 5 Aillustrates an exemplary output where the delineation neural network processed a normal cardiac signal (with no abnormalities)
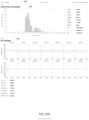
- FIG. 5 Billustrates an exemplary output where the delineation neural network processed a cardiac signal having “hidden” P-waves, for example due to an atrioventricular block.
- Line graph 71represents the cardiac signal over multiple beats.
- the plotted signalreflects the well-known ECG waveform having a P-Wave (point 75 ), QRS complex (point 76 ), and T-wave (point 77 ).
- Line graph 72is a graph the P-wave score over the same time points in the cardiac signal.
- line graph 73 and line graph 74are graphs of the QRS score and T-wave scores, respectively, over the same time points.
- the y-axis for each line graphs 72 - 74is the score assigned at each time point, ranging from 0 to 1, with 0 indicating a low likelihood of the presence of a particular wave and 1 indicating a high likelihood of the presence of a particular wave.
- line graph 72indicates a very high likelihood of the presence of P-waves at score 78 which corresponds to the time points near point 75
- line graph 73indicates a very high likelihood of the presence of a QRS complex at score 79 which corresponds to the time points near point 76
- line graph 74indicates a very high likelihood of the presence of a T-wave at score 80 which corresponds to the time points near point 77 .
- FIG. 5 Blike FIG. 5 A , illustrates four line graphs, line graphs 81 - 82 , which are similar to line graphs 71 - 74 .
- line graph 81represents the cardiac signal over several beats
- line graph 82represents the P-wave score over the cardiac signal
- line graph 83represents the QRS score over the cardiac signal
- line graph 84illustrates the T-wave score over the cardiac signal.
- the ECG signal in line graph 81includes hidden P-waves such as the hidden P-wave shown at point 85 .
- Hidden P-wavesare P-waves that occur during another wave or complex such as a T-wave.
- the delineation networkAs the cardiac signal processed by the delineation network involves a high sample rate and the delineation network generates data for each wave type at each time point, the output recovered is robust enough (i.e., includes enough sample points) to identify two waves occurring at the same time, such as the case with hidden P-waves.
- line graph 82indicates a very high likelihood of the presence of P-waves at score 86 which corresponds to the time points near point 85 . Accordingly, it is understood that the delineation neural network is not limited to recovering only one wave at each time point and therefore can identify several waves at any time point. It is further understood that signals from one or more leads may be processed simultaneously by the first neural network.
- delineator 39may post-process the cardiac signal. Post-processing involves, assigning to each time point, none, one, or several waves, calculating the onset and offset of each of the identified waves, and optionally determining the characterization of the waves. Waves may be assigned to each time point by determining that a wave exists at that time point if a certain value is achieved.
- wave typee.g., P-wave, QRS complex, T-wave, etc.
- Computing the “onset” and “offset” of each waveinvolves computing the time points of the beginning and the end of each wave in the cardiac signal, the beginning referred to as the “onset” and the end referred to as the “offset.” This may involve analyzing the time points corresponding begging and end of the highest values for each wave type.
- Delineator 39may characterize the waves by identifying prematurity, conductivity and ectopy. Wave characterization leverages the contextual information between each wave and/or each beat. For example, the premature label may be applied to the wave if a certain threshold value is achieved at a certain time point or an average value over several time points.
- delineator 39may calculate global measurements.
- Global measurementsare derived from the onset and offset of each wave type and may relate to features and characteristics of the cardiac signal such as intervals between waves and wave durations.
- global measurementsmay include, but are not limited to, PR interval, P-wave duration, QRS complex duration, QRS axis, QT interval, corrected QT interval (Qtc), T-wave duration, JT interval, corrected JT interval, heart rate, ST elevation, Sokolov index, number of premature ventricular complexes, number of premature atrial complexes (PAC), ratio of non-conducted P waves, and/or ratio of paced waves.
- Delineator 39may further deduce labels solely from the information generated by delineator 39 .
- the following labelsmay be deduced by delineator 39 : short PR interval (i.e., PR interval ⁇ 120 ms), first degree AV block (e.g., PR interval >200 ms), axis deviations, long QTc, short QTc, wide complex tachycardia, and/or intraventricular conduction blocks.
- Labels determined solely from information generated by delineator 39are referred to as delineation based labels.
- ECG platform 37may cause the output of step 56 (e.g., wave information 62 ) as well as pre-processed ECG data 55 to be communicated or otherwise applied to clusterer 42 for clustering at step 63 .
- Wave information 62may include scores regarding PVC waves and PAC waves including onsets and offsets generated and relevant durations.
- Clusterer 42may process wave information 62 and identify clusters of PAC or PAV waves during the duration of the cardiac signal. Once identified, clusterer 42 may assign cluster label 64 to one or more time windows, identifying either a PVC or a PAC cluster for each time window. A time window is defined by two time points in the cardiac signal.
- ECG platform 37may also cause the output of step 56 (e.g., wave information 57 ) as well as pre-processed ECG data 55 to be communicated or otherwise applied to classifier 41 for classification at step 58 .
- Classification at step 58involves applying a second neural network (i.e., classification neural network) to pre-processed ECG data 55 .
- the input of the second neural networkmay be one or more multi-lead cardiac signals with variable length that is pre-processed.
- Classifier 41may also process wave information 57 and/or other information such as patient-specific information including the patient's age or any relevant clinical information.
- ECG platform 37may cause optionally cause pre-processed ECG data 55 to be communicated directly to classifier 41 and processed by classifier 41 if delineation at step 56 is not necessary.
- classifier 41may process data sampled multiple times per heart beat across a plurality of heart beats.
- the second neural networkgenerates an output having values that correspond to the likelihood of the presence of one or more abnormality, condition and/or descriptor at each time point of the cardiac signal. If a time point or time window is determined to correspond to a certain abnormality, condition, and/or descriptor, a label corresponding to that abnormality, condition, and/or descriptor will be assigned to that time point or window. In one example, one or more labels 59 may be assigned to a time point or time window if a score achieves a predetermined threshold. Accordingly, multi-label localization may be achieved for abnormalities, conditions, and/or descriptors by generating a plurality of values at each time point and assigning one or more labels at each time point.
- Classifier 41may recover the output of the classification neural network as a vector of size q.
- the values in the vectorcorrespond to the presence of each label at each time point or each time window.
- the output of the classification neural networkmay be the vector [0.98: 0.89; 0.00] with the corresponding labels for each element of the vector: Right Bundle Branch Bloc; Atrial Fibrillation; Normal ECG.
- the scoresmay be between 0 and 1.
- a threshold of 0.5would result in the labels “Right Bundle Branch Block” and “Atrial Fibrillation” being assigned by classifier 41 to the time point or time window corresponding to the score.
- the thresholdmay be preprogrammed and/or selected by the user and may be modified to provide varying degrees of sensitivity and specificity. By assigning one or more labels for each time point, onsets and offsets corresponding to each label may be computed to identify durations of episodes (e.g., abnormalities episodes).
- Abnormalities and conditionsmay include any physiological abnormality or condition which may be identifiable on the cardiac signal. Today about 150 measurable abnormalities may be identified on cardiac signal recordings. Abnormalities and conditions may include but are not limited to, sinoatrial block, paralysis or arrest, atrial fibrillation, atrial flutter, atrial tachycardia, junctional tachycardia, supraventricular tachycardia, sinus tachycardia, ventricular tachycardia, pacemaker, premature ventricular complex, premature atrial complex, first degree atrioventricular block (AVB), 2nd degree AVB Mobitz I, 2nd degree AVB Mobitz II, 3rd degree AVB, Wolff-Parkinson-White syndrome, left bundle branch block, right bundle branch block, intraventricular conduction delay, left ventricular hypertrophy, right ventricular hypertrophy, acute myocardial infarction, old myocardial infarction, ischemia, hyperkalemia, hypokalemia, brugada, and/or long QTc. Descript
- classifier 41may read each time point of the cardiac signal as well as each global measurement, analyze each time point of the cardiac signal and each global measurement, compute time windows by aggregating at least two time points, and compute scores for each time window, the scores corresponding to a plurality of non-exclusive labels.
- the classification neural networkmay be a convolutional neural network or a recurrent neural network.
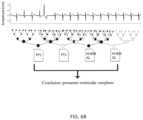
- FIG. 6 Aa classification neural network in the form of a convolutional neural network is illustrated applied to an ECG signal.
- Most convolutional neural networksimplement a few convolutional layers and then standard layers so as to provide a classification.
- the ECG signalis given as input to the network, which aggregates the information locally and then combines it layer by layer to produce a high-level multi-label classification of the ECG. For each label a score is provided.
- the labels of the convolutional neutral network shown in FIG. 6include atrial fibrillation (AFIB), right bundle branch block (RBBB) and, and premature ventricular complex (PVC).
- AFIBatrial fibrillation
- RBBBright bundle branch block
- PVCpremature ventricular complex
- a classification neural network in the form of a recurrent convolutional neural networkis illustrated. Similar to FIG. 6 A , the ECG signal is given as input to the network.
- a recurrent convolutional neural networkrefers to a particular convolutional neural network structure able to keep memory of the previous objects it has been applied to.
- a recurrent convolutional neural networkis composed of two sub-networks: a convolutional neural network which extracts features and is computed at all time points of the cardiac signal, and a neural network on top of it which accumulates through time the outputs of the convolutional neural network in order to provide a refined output. In this manner, the convolutional neural network acts as a pattern detector whose output will be accumulated in time by the recurrent neural network.
- the output of the convolutional neural networkidentified four labels at various time points including premature ventricular complex (PVC) and Normal. Those labels were then applied to the second neural network which produced the refined output “premature ventricular complex.”
- PVCpremature ventricular complex
- the networkcorrectly recognized a premature ventricular complex (PVC, the fifth and largest beat) in the first part of the signal while the second part of the signal is considered normal. As the cardiac signal includes abnormality, it cannot therefore be considered as normal, and the accumulated output is therefore PVC.
- the first neural networki.e., delineation neural network
- the second neural networki.e., classification neural network
- the networksmay be expressed using open software such as, for example, Tensorflow, Theano, Caffe or Torch. These tools provide functions for computing the output(s) of the networks and for updating their parameters through gradient descent.
- Training the neural networksinvolves applying numerous datasets containing cardiac signals and known outputs to the neural networks.
- a database of the datasets containing cardiac signals collected across a plurality of patients using the systems and methods described hereinmay be stored on server 15 and/or drive 16 (e.g., in the cloud).
- the datasets in the databasemay be used by server 15 to analyze new cardiac signals inputted into the system for processing.
- any cardiac signal applied to the trained neural networkwill have the same sampling rate and/or frequency as the cardiac signals in the datasets used to train the neural network.
- training of the classification neural networkbegins with a dataset containing cardiac signals and their known delineation. As explained above, the cardiac signal is expressed as a matrix of size m ⁇ n at a predefined frequency.
- the networkmay be trained at 250 Hz, 500 Hz or 1000 Hz, though any frequency could be used.
- the delineationis then expressed in the form of a Matrix Y of size p ⁇ n where p is the number of types of waves. Each wave is expressed with their start and end points such as, for example: (P, 1.2s, 1.3s), (QRS 1.4s 1.7s), (T, 1.7s, 2.1s), (P, 2.2s, 2.3s).
- the first row of Matrix Ycorresponds to P-waves, and will have a value of 1 at times 1.2s and 1.3s, and as well as 2.2s and 2.4s, and 0 otherwise.
- the second row of Matrix Ycorresponds to QRS complexes and will have a value of 1 at times 1.4s and 1.7s, and otherwise 0.
- the third row of Matrix Ycorresponds to T-waves and will have a value of 1 at times 2.2s and 2.3s, and otherwise 0.
- the parameters of the networkmay then be modified so as to decrease a cost function comparing the known delineation and the output of the network.
- a cross-entropy error functionis used so as to allow for multi-labeling (i.e., allowing for multiple waves at a given instant). This minimization can be done though a gradient step, repeating the foregoing steps at least once for each cardiac signal of the dataset. It is understood that a similar approach may be used to train the delineation neural network (i.e., second neural network).
- ECG platform 37may cause neural networks described herein to process cardiac signals having a differing number of leads in entry.
- the neural networkmay comprise a sequence of layers at the beginning of the network so as to obtain a network which is independent of the number of input leads and can therefore process cardiac signals with any number of leads m.
- the same structurecan process any number of input leads m and will still provide the same number of output signals, which can be fed to the rest of the network for which a fixed number of input signals is required. For this reason, the number of input leads may vary and need not be fixed.
- the leadsmay be convoluted using a lead-by-lead convolution with k filters.
- the signalmay then be grouped by a convolution filter in order to obtain k groups of m leads and a mathematical function is finally applied to each group to obtain k leads.
- the mathematical functionmay be the maximum at each time point or may be any other function known to one skilled in the art.
- ECG platform 37may cause labels for each time window (i.e., labels) to be aggregated by post-processor 43 to generate processed labels 60 .
- the labelsmay be derived from global measurements based on delineation.
- the label corresponding to first degree atrioventricular blockmay be derived from a PR interval longer than 200 ms .
- the PR intervalis a global measurement based on the delineation.
- Post-processor 43may also aggregate the delineation-based labels with the classification labels corresponding to the same time points.
- Post-processor 43may also filter the labels to remove redundant labels, assemble labels according to a known hierarchy of labels, or ignore labels that are known to be of lesser importance according to a hierarchy or weighted values. Post-processor 43 may also aggregate the labels through time so as to compute the start (onset) and end (offset) times of each abnormality. It is understood that post-processor 43 may be a standalone component or may be a subcomponent of classifier 41 .
- the information generated on back end 46 by ECG platform 37 in steps 54 , 56 , 58 and 61 , and optionally, 63may be communicated by ECG platform 37 to ECG application 29 on front end 45 .
- ECG application 29may cause the foregoing information to be displayed, at step 65 , on display 17 of system device 14 .
- the information generated on back end 46may be automatically transmitted by ECG platform 37 or ECG platform 37 may cause the information to be stored on server 15 until requested by ECG application 29 .
- ECG platform 37may transmit a message to ECG application 29 , informing ECG application 29 that the data is available from ECG platform 37 .
- ECG application 29may receive data (e.g., raw ECG data, pre-processed ECG data, wave information, labels and any other data generated during steps 54 , 56 , 58 , 61 , and/or 63 ) and cause system device 14 to display as described in PCT/EP2018/072912, the entire contents of which are incorporated herein by reference.
- datae.g., raw ECG data, pre-processed ECG data, wave information, labels and any other data generated during steps 54 , 56 , 58 , 61 , and/or 63
- system device 14may display as described in PCT/EP2018/072912, the entire contents of which are incorporated herein by reference.
- the '912 applicationexplains that the ECG signal, features of the ECG signal, and/or descriptors of the ECG signal may be displayed in a multiple field display in an interactive manner.
- Interactive display 101includes first side 102 and second side 103 .
- First side 102further includes second graphic window 105 and first graphic window 104 , having plot 110 which includes data corresponding to the ECG signal.
- First graphic window 104includes plot 110 providing a global view of an ECG signal.
- plot 110is an R-R interval plot which is a plot of R-R intervals (interval between two QRS waves) through time.
- the upper region of first graphic window 104comprises multiple label buttons 109 .
- Each label button 109has, displayed in its proximity, text describing the label to which it is associated.
- Each label button 109is associated with a color so that, when label button 109 is selected by the user, graphic portion 111 is displayed on the plot 110 to visually indicate the presence the episodes and/or events corresponding to the label associate with label button 109 .
- First graphic window 104further comprises, parallel to the time axis of the plot 110 , temporal bar 115 .
- Temporal bar 115provides a linear representation of the total ECG acquisition time wherein the time periods associated to episodes or events are represented as colored segments. As is shown in FIG. 9 , the darker grey zones on temporal bar 115 correspond to time periods of noisy signal (e.g., when the signal is too artifacted and the analysis algorithm cannot propose a delineation and proper detection).
- First graphic window 104further comprises interactive cursor 116 .
- a user using ECG application 29may move interactive cursor 116 along temporal bar 115 to allow a navigation of the plot 110 along the total ECG acquisition time.
- first graphic window 104comprises second interactive means 117 configured to cause plot 110 to zoom in and out.
- second side 103includes multiple episode plots 106 .
- Each episode plot 106displays at least one segment of the ECG strip corresponding to a detected episode and may include text regarding the duration (e.g., “Duration: 1 h38 m”) and/or the starting time of the episode (e.g., “Day 3/09:39:30”).
- Each episode plot 106includes third interactive icon 108 to select the corresponding episode plot for inclusion in a report.
- Each episode plot 106further includes fourth interactive icon 107 which permits the user to remove the respective ECG plot from interactive display 101 .
- Second side 103may further include text describing one or more of episode plots 106 .
- Interactive display 101further includes graphic window 105 including ECG strip 118 in a second time window starting at the time point selected by the cursor 116 .
- Second graphic window 105further includes ECG strip 119 in a third time window which is larger than the second time window which is inclusive of the second time window.
- the third time windowincludes a shaded portion which corresponds to the second time window.
- Interactive display 121includes first side 122 and second side 123 .
- First side 122further includes first graphic window 124 and second graphic window 125 .
- Second side 113has the same functionality as second side 103 described above, and includes episode plots 126 similar to episode plots 106 .
- second graphic window 125has the same functionality as second graphic window 105 , and includes ECG strip 138 and ECG strip 139 similar to ECG strip 118 and ECG strip 119 .
- First graphic window 124is similar to first graphic window 104 except for plot 130 .
- first graphic window 124includes multiple label buttons 129 having the same functionality as multiple label buttons 109 , secondary labels 132 having the same functionality as secondary labels 112 , temporal bar 135 and curser 136 having the same functionality as temporal bar 115 and cursor 116 , and second interactive means 137 having the same functionality as second interactive means 117 .
- plot 130is a heart rate density plot which is the projection onto a bivariate intensity plot of the histogram of the density of heart rates as a function of time.
- timeis projected along the x-axis and the heart rate (e.g., beats per minute) is projected along the y-axis.
- heart ratee.g., beats per minute
- both time and heart rateare scaled linearly.
- time and/or heart ratemay be scaled logarithmically or using other well-known scales. For simplicity, only four heart beats are shown in FIG. 12 .
- ECG platform 37may cause the y-axis and the x-axis may be divided into elementary elements, referred to as HR bins and time bins respectively.
- HR bin 151 and time bin 152are illustrated.
- HR bin 151is defined by a first and second heart rate value (e.g., h b 1 and h b 2 ).
- time bin 152is defined by a first and second time value (e.g., t b 1 and t b 2 ).
- the intersection of a HR bin and a time-binwill be referred to as a bin.
- a binwill be defined by a first and second heart rate value and a first and second time value.
- bin 153is illustrated and defined by HR bin 151 and time bin 152 .
- ECG platform 37will cause each heartbeat to be assigned to a bin.
- a heartbeate.g., QRS complex
- a heart rate corresponding to that heartbeatdetermines which HR bin it belongs to in the column defined by the time bin.
- heartbeat 154 and heartbeat 155each have a corresponding time and heart rate value that fall within time bin 152 and HR bin 151 , respectively.
- heartbeat 156 and heartbeat 157each have a time value that falls outside time bin 151 and thus neither are included in bin 153 .
- ECG platform 47will calculate the heart rate density for each time bin.
- the area defined by the respective time bin and heart rate binwill be represented according to the density of the heart beats comprised in the bin (i.e., number of heartbeats within the bin).
- Each binmay then be color coded according to the density.
- each binmay have certain shades of colors or patterns, such as grey levels, for example.
- binsmay be represented as levels of grey that get darker as the density of heart rates increases.
- bin 153which includes 2 heartbeats, may be represented by a darker shade of grey than a bin with only 1 heartbeat, but a lighter shade of grey than a bin having 3 or more heartbeats.
- the densityis calculated as a function of the number of R-waves in the bin divided by the heart rate of the HR bin (e.g. the mean of the minimum and maximum bounds of the time window).
- This preferred computation of densityconsiders the time spent in a specific bin. For example, in a time bin of 3 minutes, if there occurs 100 beats at a heart rate of 50 bpm (beats per minute) in a first HR bin and 100 beats at 100 bpm in a second HR bin, there will be as many beats in each bin, but 2 minutes will be spent at 50 bpm and only one minute at 100 bpm. Therefore, this bin would have the same density representation if only the number of beats are considered.
- the first bin corresponding to the heart rate bin of 50 bpmwill be darker than the bin corresponding to the heart rate bin of 100 bpm, as dividing by the heart rate gives higher weight to lower heart rate values.
- the preferred embodimenttherefore captures this temporal information better than only considering the count of beats.
- ECG platform 37will plot the heart rate density for each bin. It is understood that capturing temporal information in the column (time bin), in addition to the temporal information naturally given as function of the x-axis, facilitates expression of the density in a manner superior to other forms of aggregated representations of the ECG signal, such as the R-R plot in plot 110 .
- the bounds of the x-axis of the HR density plotmay be the beginning and end of the signal.
- the bounds of the x-axismay interactively vary with the action of zooming in and out performed by the user.
- the bounds of the y-axisremain fixed when performing this action.
- plot 130includes interactive means 137 which may be used to zoom-in on the heart rate density plot.
- the zoom actionmay only change the size of the plot display.
- zooming in and outchanges the size of the time window corresponding to a time-bin. With the zooming-in action, a bin represented with the same number of pixels covers a shorter time window.
- FIG. 14 Ca signal generated by a holter with vary conduction flutter is illustrated as R-R plot 165 and density plot 166 . As is shown in FIG. 14 C , the conduction flutter is more emphasized by the four clear black lines in density plot 166 than the four diffuse clouds that appear in the R-R plot 165 .
- FIG. 14 Da signal generated by a holter with permanent atrial fibrillation is illustrated as R-R plot 167 and density plot 168 . As is shown in this figure, density plot 168 gives more precise information on the variations of the heart rate within the fibrillation.
- R-R plot 174a signal generated by a holter having paroxysmal atrial fibrillation and otherwise regular rhythm is illustrated as R-R plot 174 and density plot 175 .
- the pattern of a regular rhythmis more visible in density plot 175 where a clear black line emerges.
- the pattern of atrial fibrillationcontrasts more in density plot 175 than R-R plot 174 as the color changes as well (density diminishes which makes the plot lighter).
- a user using ECG application 29may interact with an interactive active display described above using input devices 25 to request a report and/or customize the report.
- a reporttypically includes portions of the cardiac signal and may involve information pertaining to abnormalities and/or episodes (e.g., episode plots) and/or other information generated during pre-processing (step 54 ), delineation (step 56 ), classification (step 58 ), clustering (step 63 ) and/or post-processing (step 61 ).
- a reportmay further include patient specific medical data such as the patient's name, age, health history, and/or other medical information. It is understood that any individually identifiable health information, and/or protected health information may be encrypted when communicated between ECG application 29 and ECG platform 37 .
- interactive icons in interactive displaysmay be engaged to incorporate data and images displayed in a report.
- third interactive icon 108may be selected by a user using ECG application 29 to include the corresponding episode plot in a report.
- the usermay request a report and may select customized features such as certain data to be included in the report (e.g., abnormality data, episode data, episode plots, etc.).
- ECG application 29may transmit the request for a report and selected customizable features (e.g., ECG data to be included in the report) to ECG platform 37 and ECG platform 37 may receive the request and information.
- ECG platform 37may log the request and save the information received from ECG application 29 .
- ECG platform 37may cause report generator 44 to generate a report according to the information received from system ECG application 29 .
- first page 181may include patient specific information such as, for example, the patient's name, primary indication, whether the patient has a pace maker, the patients date of birth, gender and/or a patient ID.
- Second section 182may include clinician information such as, for example, the overseeing physician, the name of the institute, the date of the analysis and/or a signature.
- Third section 183may include a plot of the ECG data.
- section 183includes a heart rate density plot similar to the one shown in FIG. 12 .
- the window of time shownmay be a default time or may be a user defined time window.
- a certain labelmay be selected to indicate the occurrence of an abnormality on the density plot.
- the time windowis usually selected according to the relevant episodes and/or events. It is understood, however, that other plots may be included in the report such as an R-R plot.
- Fourth section 184may include metrics from the cardiac signal recording.
- fourth section 184may include the duration of the recording, the maximum, minimum and average heart rate, premature supraventricular complexes and any patient-triggered events, and/or any other metrics concerning the cardiac signal.
- Fifth section 185may include information corresponding to any episodes detected.
- fifth section 185may include pause information (count and/or longest R-R interval), atrioventricular block information, atrial fibrillation/flutter information, ventricular tachycardia information, other supraventricular tachycardia information, and/or any other information concerning any episodes or abnormalities.
- Sixth section 186may include results information such as, for example, a summary of the episodes and/or abnormalities, a diagnosis, and/or any other information analyzed, aggregated, computed, determined, identified, or otherwise detected from the cardiac signal. For example, sixth section 186 may identify a sinus rhythm with paroxysmal atrial fibrillation.
- FIG. 15 B-Dillustrates the second, third and fourth pages of an exemplary report.
- the reportmay further include ECG strips previously selected by the user, or selected under default settings.
- a usermay select Max HR strip 191 , Min HR strip 192 , Afib/Flutter strips 193 , other SVT strips 194 , PSVC strip 195 , and PVC strip 196 .
- Max HR strip 191may be an ECG strip indicating the maximum heart rate during a given cardiac signal recording.
- Min HR strip 191may be an ECG strip indicating the minimum heart rate during a given cardiac signal recording.
- Afib/Flutter strips 193may be ECG strips indicating each episode of atrial fibrillation/flutter.
- SVT strip 194may be ECG strips indicating each episode of supraventricular tachycardia.
- PSVC strip 195may be an ECG strip indicating an episode of premature supraventricular complex.
- PVC strip 197may be ECG strips indicating episodes of premature ventricular complex. ECG strips may be displayed with the related relevant associated metrics and comments as added by the user. It is understood that the report shown in FIGS. 15 A-B is merely exemplary and that the report generated at step 68 may have a different structure or configuration and/or may include different ECG and patient related information contemplated herein.
- ECG processing system 10 ′is illustrated which is substantially similar to ECG processing system 10 but includes steps 202 - 205 .
- ECG processing system 10 ′may receive raw ECG data 52 at back end 46 to be preprocessed at step 54 by pre-processor 38 to generate pre-processed ECG data 55 which may be applied to delineator 39 for delineation at step 56 to generate wave information 201 .
- Wave information 201may include wave information 57 (e.g., scores corresponding to the likelihood of the presence of a t-wave, p-wave, QRS complex, etc.) and/or wave information 62 (e.g., scores regarding PVC waves and PAC waves, etc.).
- the output of delineator 39may be one or more vectors and/or a matrix.
- Wave information 201may further include information about onsets and offsets of one or more wave and/or beat in the ECG data. For example, based on the likelihood of the presence of certain types of waves at time points throughout the ECG data, delineator 39 may determine the onset and offset of one or more waves and/or beats.
- clusterer 42may use the onsets and offsets of beats in wave information 201 to extract the beats from the ECG data (e.g., pre-processed ECG data). This may involve determining portions of the ECG data starting at an onset of a beat and ending at an offset. These portions may be extracted from the ECG data and designated as a beat. The portions of ECG data corresponding to a beat may be used an input at step 202 .
- clusterer 42may include, oversee, and/or implement embedder 48 and grouper 49 .
- step 200may include sub-step 202 and sub-step 204 clusterer 42 may execute one or more algorithms, which may be one or more trained neural networks, to generate embedding data 203 and ultimately group data 205 .
- embedder 48may execute one or more algorithms, which may be a trained neural network, to generate embedding data 203 .
- the portions of ECG data extracted at step 200may be input to embedder 48 .
- Embedding data 203may be one or more vectors that represent the beat portions of ECG data used as an input for embedder 48 .
- beats identified in the ECG datamay be extracted from the ECG data and embedded using embedder 48 .
- embedding data 203may be one or more vectors and/or a matrix corresponding to, and representative of, one or more beats.
- grouper 49may execute one or more grouping algorithms, which may be a trained neural network, on the embedded data 203 to generate group data 205 .
- portions of ECG data 206may be used an input for embedder 48 for embedding.
- the portions of ECG data 206may be a portion of ECG data (e.g. pre-processed ECG data) over a time period starting at an onset of a beat and ending at an offset of a beat.
- embedder 48may process portions of ECG data 206 using one or more algorithms, resulting in embedding data 203 .
- the one or more algorithmsmay be one or more neural networks (e.g., embedding neural networks).
- Embedding data 203may be one or more beat vectors 207 .
- Beat vectors 207may be a vector including data and/or values representative of portions of ECG data 206 . As shown in FIG. 16 B , beat vectors 207 may be input into grouper 49 for grouping.
- Grouper 49may process the embedding data 203 corresponding to beats using one or more algorithms, resulting in group data 205 corresponding to a similarity between two or more beats.
- the one or more algorithmsmay be one or more neural networks (e.g., grouping neural networks).
- Group data 205may include one or more scores or values corresponding to a similarity and/or distance between vectors of embedding data 203 .
- a similaritymay involve similar characteristics and/or features such as similar t-waves, p-waves, QRS complexes, or other waves, or a similar distance between any of the forgoing, for example. In this manner, grouper 49 may quantify a similarity between two or more beats of ECG data.
- clusterer 49may determine if group data 205 (e.g., scores or values) is within a threshold differential or satisfies a threshold value and thus if the corresponding beats are similar enough to one another (e.g., have similar characteristics and/or features) such they should be grouped or matched together. Groups of similar beats may be referred to herein as a morphology and/or cluster. As is shown in FIG. 16 A , group data 205 may optionally be applied to classifier 41 for classification at step 58 .
- group data 205e.g., scores or values
- group data 205 and/or a graphic user interface based on or otherwise incorporating group data 205may be communicated by ECG platform 37 on back end 46 to ECG application 29 on front end 45 .
- ECG application 29may cause information about beat groupings and/or group data 205 to be displayed at step 65 on display 17 of system device 14 .
- information regarding beats associated with a type of episodee.g., QRS clusters, PVC clusters, and/or PAC clusters
- the information generated on back end 46may be automatically transmitted by ECG platform 37 or ECG platform 37 may cause the information to be stored on server 15 until requested by ECG application 29 .
- ECG platform 37may transmit a message to ECG application 29 , informing ECG application 29 that the data is available from ECG platform 37 .
- ECG application 29may receive data (e.g., raw ECG data, pre-processed ECG data, wave information, labels, clusters, and/or morphologies and any other data generated during steps 54 , 56 , 58 , 61 , 63 , and 200 , including sub-steps 202 and/or 204 ) and cause system device 14 to display the information and/or data as described herein as well as in WO 2019/038435, the entire contents of which are incorporated herein by reference.
- datae.g., raw ECG data, pre-processed ECG data, wave information, labels, clusters, and/or morphologies and any other data generated during steps 54 , 56 , 58 , 61 , 63 , and 200 , including sub-steps 202 and/or 204
- system device 14may display the information and/or
- a user using ECG application 29may view wave information, labels, episodes, clusters, beat groupings and/or morphologies and any other data generated during steps 54 , 56 , 58 , 61 , and 200 on display 17 .
- a user using ECG application 29may interact with an interactive display described above using input devices 25 to generate user input data 69 , which may be communicated from ECG application 29 on front end 45 to ECG platform 37 on back end 46 .
- a usermay view QRS clusters, PVC clusters and/or PAC clusters on display 17 .
- a usermay interact with display 17 to generate user input data 69 relevant to wave information, labels, episodes, clusters, beat groupings and/or morphologies and any other data presented on display 17 .
- a usermay determine or identify additional clusters and/or beat groups, may identify, associate, and/or merge similar clusters and/or beat groups, may delete clusters and/or beat groups that are inaccurate, irrelevant, or mislabeled, and/or may split clusters and/or beat groups into different subsets.
- user input data 69may correspond to deleted and/or modified morphologies as described below.
- ECG platform 37 on back end 46may, at step 70 , cause recomputer 40 to use user input data 69 to retrain, modify and/or adjust delineator 39 , embedder 48 and/or grouper 49 .
- user input data 69may indicate that grouping data 205 was inaccurate.
- Recomputer 40may use this information to retrain and/or adjust delineator 39 , embedder 48 and/or grouper 49 to generate more accurate grouping data 205 .
- step 200Upon retraining delineator 39 , embedder 48 and/or grouper 49 , one or more of step 200 , sub-step 202 and/or sub-step 204 may be repeated and the information generated (e.g., group data 205 , episodes, and/or clusters or morphologies) may be sent to ECG application 29 on front end 45 , as explained above, to be displayed on display 17 and viewed by the user.
- the information generatede.g., group data 205 , episodes, and/or clusters or morphologies
- the group data, episodes, and/or clusters or morphologiesBy recomputing the group data, episodes, and/or clusters or morphologies and presenting the same to a user via display 17 , a user may adjust and otherwise fine tune processing system 10 ′. For example, more accurate episodes may be identified and the quality of wave information 201 , embedding data 203 and/or group data 205 may be improved.
- This processgenerally involves receiving ECG data of a patient at step 211 . This may involve receiving raw ECG data 52 at ECG platform 37 .
- the raw ECG datamay, optionally, be preprocessed as described above (e.g., to remove noise).
- the ECG datamay be analyzed and/or processed using at least one delineation algorithm to generate wave information.
- the embedding algorithmmay be one or more algorithms and/or a neural network.
- the wave information generatedmay be wave information 201 .
- beat onsets and offsetsmay be determined from the wave information.
- a portion of ECG data starting at a time point corresponding to an offset and ending at a time point corresponding to an onsetmay be extracted from the ECG data and associated with that particular beat.
- a plurality of beat portions of ECG datamay be extracted at step 213 .
- the portions of ECG data corresponding to the beatsmay be analyzed and/or processed using an embedding algorithm to generate embedding data.
- Embedding datamay be embedding data 203 .
- the embedding algorithmmay be one or more algorithms and/or a neural network.
- the embedding data generated by the embedding algorithmmay be representative of a portion of ECG data corresponding to a beat.
- the embedding datamay be analyzed and/or processed using a grouping algorithm to generate group data.
- the group datamay be group data 205 .
- the grouping algorithmmay be one or more algorithms (e.g., kmeans, dbscan) and/or a trained neural network.
- the grouping algorithmis preferably trained from a plurality of ECG data sets and/or portions of ECG data corresponding to various beats.
- group datamay be analyzed to determine whether two or more beats are similar (e.g., share certain features and/or characteristics). For example, a group data value may be compared to a threshold of range to determine similarity between beats. If a group data value indicates a similarity between beats (e.g., if the group data value satisfied the threshold), the similar beats may be grouped together.
- information regarding ECG data, wave information, labels, embedding data, group data, groups of beats, similar beats, clusters, episodes, morphologies, and/or other information based on or indicative of any of the foregoingmay be transmitted from ECG platform 37 to ECG application 29 for display.
- Some or all of the analyzed ECG datamay be displayed on a graphic user interface.
- a graphic user interface similar to interactive display 220 illustrated in FIG. 18may display morphology 240 and other analyzed ECG data.
- the graphic user interfacemay include a beat overlay image of sample beats within that morphology, as is illustrated in FIG. 20 B .
- a request to assign the analyzed ECG data to one or more user accounts associated with one or more healthcare professionalsmay be received by ECG platform 37 and ECG platform 37 may assign the analyzed ECG data to that user account.
- ECG platform 37may assign the analyzed ECG data to that user account.
- the systemmay inform that healthcare professional that ECG data has been assigned to them for review. For example, a message and/or alert may be sent to that healthcare professional.
- the analyzed ECG datamay be unassigned and/or reassigned as well. It is understood that optional step 218 may alternatively occur after or between steps 219 , 220 , and/or 221 , or at any other point.
- the analyzed ECG datamay be submitted for quality control, the request for quality control may be received by ECG platform 37 and/or the analyzed ECG data may be placed in a quality control queue for review by one or more quality reviewers (e.g., technicians).
- quality reviewerse.g., technicians
- ECG platform 37may receive quality control input from one or more quality reviewers (e.g., technicians).
- the quality control inputmay include deleted and/or modified portions of analyzed ECG data.
- ECG platform 37may transmit quality control input to the ECG application 29 for display.
- ECG applicationmay show analyzed ECG data that has been selected for deletion and/or modification. Steps 220 and/or 221 may be repeated multiple times if multiple quality control reviewers review the analyzed ECG data. For example, a first quality control reviewer may indicate that the analyzed ECG data requires further review and a second quality control reviewer may analyze the analyzed ECG data and/or the quality control input generated during the first quality control review.
- ECG platform 37may receive user input data from ECG application 29 .
- a healthcare professionale.g., the assigned healthcare professional
- the user input datamay be a deletion and/or modification of some or all of the analyzed ECG data.
- the user input datamay be generated by input device 25 of system device 14 and transmitted to ECG platform 37 from ECG application 29 .
- the user input datamay correspond to the accuracy of the graphic user interface which may correspond to the accuracy of the embedding data and/or group data. As explained below with respect to FIG.
- user input datamay correspond to a morphology being deleted.
- a clinicianmay delete a morphology using input device 25 if, after reviewing the displayed morphology, the healthcare provider or technician determines that the sample beats within that morphology are normal rather than abnormal.
- the received user input data and/or quality control inputmay be used to train and/or modify the delineation algorithm, classification algorithm, grouping algorithm and/or the embedding algorithm (e.g., using recomputer 40 ).
- the user input datamay inform ECG platform 37 that certain episodes and/or beat groups should be deleted and/or otherwise are inaccurate. This information may be used to retrain or otherwise modify the delineation algorithm, classification algorithm, grouping algorithm and/or the embedding algorithm to improve the quality of the wave information, labels, embedding data and/or group data generated by these algorithms.
- ECG data(e.g., preprocessed ECG data) may be reanalyzed and/or recalculated based on the modified delineation algorithm, classification algorithm, grouping algorithm and/or the embedding algorithm to generate reanalyzed ECG data (e.g., wave information, labels, embedding data, group data, groups of beats, similar beats, clusters, episodes, morphologies, and/or other information based on or indicative of any of the foregoing).
- reanalyzed ECG data and/or other information indicative of or based on reanalyzed ECG datamay be transmitted from ECG platform 37 to ECG application 29 for display.
- the data and/or informationmay be displayed on a graphic user interface.
- a graphic user interfacemay be updated to delete a morphology as instructed in the user input data. Additionally, or alternatively, recomputed episodes or clusters may be displayed.
- Interactive display 220includes first graphic window 221 , which is similar to first graphic window 124 , and second graphic 222 , which is similar to second graphic window 125 .
- Interactive display 220may also include report creation button 225 for generating a report.
- First graphic window 221may illustrate a plurality of beats over a certain time period and may include curser 224 similar to curser 136 .
- Second graphic window 222may include a zoomed in view of a region of the plurality of beats selected by curser 224 .
- Interactive display 220may further include third graphic window 223 which may include analysis or additional information about the plurality of beats in first graphic window 221 .
- third graphic window 233may illustrate one or more morphologies, each including a plurality of beat strips that have matched or otherwise grouped together based on certain similarities, as described above.
- a beat stripis a plurality of consecutive beats in time.
- the plurality of beat strips matched or otherwise grouped togethergenerally are from different time intervals and are not consecutive strips in time.
- third graphic window 223may include category tab 231 for selecting information to be displayed in third graphic window 223 , such as morphology analysis, ventricular activity or any other category listed in navigation window 259 (shown in FIG. 21 ).
- Third graphic window 223may further also include subtabs 232 to further narrow category tab 231 .
- subtabs 232include types of abnormalities, such as PVC and PSVC, or generic tabs such as “other beats.”
- morphologies 233may be viewed using interactive display 220 .
- each morphology of morphologies 233may include a group of beat strips that have been grouped together based on group data.
- each morphologymay include beats having one or more similar characteristics or qualities.
- Morphology 240is illustrated which is exemplary of one morphology of morphologies 233 .
- Morphology 240may involve morphology name 241 , morphology navigator 242 , beat overlay 243 , add to report button 244 , miscellaneous information 245 , time identifier 246 , report button 247 , delete button 248 , and beat window 249 .
- Morphology name 241may identify the morphology.
- Morphology navigator 242may be used to select a beat strip within morphology 240 to view in beat window 249 .
- the beat strips that may be displayed in morphology navigator 242may be a subset of beat strips of the total beat strips in that morphology.
- the subset of beat stripsmay be randomly selected from the total beat strips or, in a preferred embodiment, selected based on the beat strips within that morphology that have the greatest differences from one another. For example, the subset may be generated by comparing group data and/or embedded data to determine the beat strips within that morphology that have vector and/or matrix values with the largest differences from one another. In this manner, morphology navigator 242 displays relevant beat strips for the morphology based on a score.
- Add to report button 244may be used to add morphology 240 to a report to be generated by ECG platform 37 using report generation button 225 .
- Miscellaneous information 245may include certain information about the patient or morphology. For example, miscellaneous information 245 may identify that the patient has a pacemaker.
- Time identifier 246may identify a time at a certain point within beat window 249 . For example, a user may place a curser over a point in beat window 249 and time identifier 246 may identify the corresponding time.
- Report button 247may be used to open a report or report template.
- Delete button 248may be to delete morphology 240 .
- a healthcare provider or technicianmay decide that the beats in the morphology are not similar, are normal, and/or otherwise should not be grouped together, and thus may decide to delete the morphology.
- deleting the morphologymay alter the graphic user interface (e.g., interactive display 220 ) and/or may cause the grouping algorithm to be modified or otherwise altered to retrain the neural network.
- beat overlay 243may display some or all similar beats within morphology 240 on a single plot.
- beat overlay 243may display a single beat from each of the beat strips of morphology navigator 242 overlaid over one another.
- the displayed beat in beat overlay 243 from each of the beat stripsis a beat identified by the system as abnormal in the respective beat strip.
- ECG platform 37may align the beats according to a wave or plot feature (p-wave, t-wave, QRS complex).
- a healthcare provider or technicianmay use beat overlay 243 to determine if the morphology is abnormal, similar, and/or if it is accurately categorized in the appropriate subtab. If the healthcare provider or technician determined that the beats in the morphology are not similar, are normal, and/or otherwise should not be grouped together, the healthcare provider or technician may delete the morphology using delete button 248 , as described above.
- Interactive display 250includes first graphic window 251 , which is similar to first graphic window 221 , and second graphic 252 , which is similar to second graphic window 222 .
- First graphic window 251may illustrate a plurality of beats over a certain time period and may include curser 254 similar to curser 224 .
- Second graphic window 252may include a zoomed in view of a region of the plurality of beats selected by curser 254 .
- Interactive display 250may further include third graphic window 253 illustrating one or more categories.
- Interactive display 250may also include navigation window 254 and report creation button 255 for generating a report.
- Navigation window 259may be used for selecting various categories to be viewed within third graphic window 253 .
- navigation window 259may be used to select categories including, but not limited to Max HR, Min HR, AV block, Morphology Analysis such as Other Beats and PSVC, Supraventricular Activity such as Other SVT, Ventricular Activity such as VT, and/or sinus.
- categoriesincluding, but not limited to Max HR, Min HR, AV block, Morphology Analysis such as Other Beats and PSVC, Supraventricular Activity such as Other SVT, Ventricular Activity such as VT, and/or sinus.
- Interactive display 250may also display ectopic runs in the plurality of beats contained within first graphic window 251 .
- An ectopic runis three or more abnormal beats that are consecutive in time.
- the systems described hereinmay detect an ectopic run when three or more abnormal beats in a row are identified, e.g., using the identifier described above.
- First graphic window 251may identify an ectopic run with identifying bar 256 at the point of the ectopic run.
- Second graphic window 252may identify a region of the ectopic run with ectopic section 257 which may be a different color than second graphic window 252 .
- Each ectopic beat within ectopic section 257may be identified with ectopic marker 258 , showing the precise location of each ectopic beat.
- FIGS. 22 A- 22 Pillustrate report 260 , which is an exemplary report that may be generated using ECG platform 37 and ECG application 29 .
- report 260may include cover page 261 including information about the patient, information about a healthcare provider or technician, a summary of the report, information about the patient's heart rate (e.g., max, min, avg.), ectopic information (e.g., premature supraventricular complexes, premature ventricular complexes), information about patient events, information about paced beats, and a findings section identifying including the most notable findings, results and/or analyses.
- Cover page 261may further include notable beat strips corresponding to ECG data of the patient.
- notable beat stripsmay include, but are not limited to, AFib/Flutter, Other SVT, Pause, AV Block, VT.
- report 260may include heart rate trend display 262 which may illustrate the patient's heart beat over a certain time period (e.g., several hours).
- Heart rate trend display 261may also include one or more abnormality identifiers 263 for identifying abnormalities in the displayed beats over time.
- Heart rate trend displaymay also identify PTE and/or Afib/flutter.
- report 260may include Afib/flutter display 264 which may display the patient's heart rate over a certain time period (e.g., several hours).
- Afib/flutter display 264may be used to display times at which the patient is experiencing atrial fibrillation and/or flutter.
- Afib/flutter display 264may further display a burden percentage, length of time of the longest episode, and max heart.
- report 260may include PSVC display 265 which may display the patient's heart rate over a certain time period (e.g., several hours) and may be used to display times at which the patient is experiencing PSVC.
- PSVC display 265may further display a PSVC value and a couplet number and/or percentage.
- report 260may include PVC display 266 which may display the patient's heart rate over a certain time period (e.g., several hours) and may be used to display times at which the patient is experiencing PVC.
- PVC display 266may further display a PVC value and/or percentage, a number of morphologies relevant to PVC, a number and/or percentage of couplets, a bigeminy number and/or percentage and a trigeminy number and/or percentage.
- report 260may include patient symptom display 267 which may identify patient systems that are detected and may include the total number of patient events and the number of symptomatic patient events. Patient symptom display 267 may be broken up into palpitations, chest pain, dizziness, syncope, and other symptoms.
- report 260may include heart rate variability display 268 and QT analysis display 269 .
- Heart rate variability display 268may identify heart rate distribution and variability and display heart rate parameters such as mean, SDNN, SDANN, ASDNN, NN50, pNN50, RMSSD, VLF, LF, and HF.
- QT analysis display 269may analyze and display QT analysis over time and identify parameters such as QT min, QT avg, QT max, QTcB min, QTcB avg, QTcB max, and QTcB>450 ms.
- report 260may include strip index 271 .
- Strip index 271may include parameters like ID, date and time, category, heart rate, patient event, comments, and page.
- Categorymay include items such as Max HR, Min HR, Sinus, AFib/Flutter, VT, Patient Event, PVC, Ventricular Couplet, Ventricular Bigeminy, PSVC, Supraventricular Couplet.
- Index strip 271may be used to find the report page number at which a beat strip displaying a certain category may be found.
- report 260may include beat strip displays such as max HR display 272 , min HR display 273 , and sinus display 274 .
- Max HR display 272may display beat strips with a maximum heart rate.
- Minimum HR display 273may display beat strips with a minimum heart rate.
- Sinus display 274may display beat strips with a sinus abnormality.
- report 260may include beat strip displays such as sinus display 274 and afib/flutter display 275 .
- Afib/flutter display 275may display beat strips showing atrial fibrillation and/or flutter.
- report 260may include beat strips such as afib/flutter display 275 and VT display 276 .
- VT display 276may display beat strips showing VT.
- report 260may include beat strips such as VT display 276 , patient event display 277 , and PVC display 278 .
- Patient event display 277may display beat strips showing a patient event.
- PVC display 278may display beat strips showing PVC.
- FIG. 22 Millustrates additional PVC displays 278 .
- report 260may include beat strips such as ventricular couplet 279 and ventricular bigeminy 281 .
- Ventricular couplet 279may display beat strips showing one or more ventricular couplets.
- Ventricular bigeminy 281may display beat strips showing ventricular bigeminy. Referring now to FIG.
- report 260may include beat strips such as PSVC display 282 and supraventricular couplet display 283 .
- PSVC display 272may display beat strips showing PSVC.
- Supraventricular couplet display 283may display beat strips showing one or more supraventricular couplets.
- FIG. 22 Palso illustrates supraventricular couplet display 283 .
- FIGS. 23 A- 23 Dexemplary processes and user interfaces are illustrated for assigning analyzed ECG data for review.
- FIGS. 23 A- 23 Dillustrate exemplary interfaces and processes for assigning, un-assigning, and/or reassigning review responsibilities of ECG data sets and/or analyzed ECG data to one or more healthcare professionals.
- the graphic user interface displayed via ECG application 29may display pending review window 312 which may be used to assign ECG data (e.g., files) to one or more healthcare professionals.
- Pending review window 312may include data status identifiers 304 which may correspond to ECG data and/or wave information, labels, group data, embedding data, classification data, delineation data, clusters, analyzed data, and/or any other data based on or corresponding ECG data.
- Data status identifiers 304may indicate whether the corresponding data has been reviewed and by who.
- Data status identifiers 304may also indicate which healthcare professional the data has been assigned to, if any.
- data status identifiers 304may include a user or data identifier, a duration value (e.g., 1 day) corresponding to a duration of ECG data, an upload date (e.g., corresponding to the date the data was uploaded to ECG platform 37 ), a review status corresponding to the status of the review (e.g., returned for analysis, completed, pending quality control), and/or information about who submitted the corresponding data for quality control or review and/or when the data was last modified. If there is no status, the data and/or analysis may be uploaded and ready to be analyzed. If the status is “pending quality control,” the data and/or analysis may be submitted for quality control and may be ready to be reviewed. If the status is “returned for analysis,” the data and/or analysis may have been reviewed but still needs further review. If the status is “completed,” the data and/or analysis may have been reviewed and deemed to be acceptable.
- a duration valuee.g., 1 day
- an upload datee.g., corresponding to the
- Data status identifiers 304may include assignment menu 341 to assign and un-assign data status identifiers 304 to one or more user accounts associated with healthcare professionals. As shown in FIGS. 23 A-B , assignment menu 341 may permit a user to enter a healthcare professional's name for assigning that data status identifier 304 , and thus the corresponding data, to the healthcare professional identified. Alternatively, or in addition, assignment menu 341 may list one or more names of healthcare professionals that may be selected to assign that healthcare professional to the ECG data corresponding to the data status identifier 304 . Assignment menu 341 may also be used to un-assign an assigned data status identifier 304 . Assignment menu 341 may also list healthcare professionals for which the data status identifier may be reassigned.
- pending review window 312may include organization bar 351 and data selectors 352 .
- Data selectors 352may be engaged to select one or more data status identifiers 304 .
- Organization bar 351may be used to organize and/or assign data status identifiers 304 .
- change button 353 on organization bar 351may be engaged to assign, un-assign and/or reassign all selected data status identifiers to a certain healthcare professional. In this manner, multiple data status identifiers 304 may be assigned, unassigned, and/or reassigned at the same time.
- pending review window 312may include filter button 361 .
- Filter button 361may be used to filter one or more data status identifiers 304 .
- filter button 361may be engaged to filter data status identifiers 304 in pending review window 312 by the healthcare professional. For example, if the healthcare professional “Stan Dupp” is selected, only data status identifiers 304 assigned to Stan Dupp will be shown in pending review window 312 . It is understood that other filters may be selected (date, patient, quality review status, etc.).
- tool bar 401may be incorporated into a user interface generated by ECG application 29 and/or ECG platform 37 and may be used to submit ECG data and/or analysis of ECG data for quality control (QC) (e.g., using quality control button 402 ).
- ECG platform 37may generate group data, embedding data, classification data, delineation data, and/or analyzed ECG data and quality control button 402 may be engaged to submit the foregoing data for quality control.
- Interface 403displays a navigation column 406 which may include a worklist interface tab, quality control tab 405 , an archive and a favorites tab, for example. Interface 403 may be used by a quality control reviewer, for example.
- quality control tab 405When quality control tab 405 is engaged, one or more data status identifiers 404 may be displayed. Data status identifiers 404 may be the same as data status identifiers 304 and/or may include information about quality control (e.g., who submitted for quality control, date of submission, date of last modification, quality control status, etc.).
- ECG application 29may cause system device 14 to display interface 411 for quality control review.
- Interface 411may display pending window 412 and review window 413 .
- Each of pending window 412 and review window 413may include one or more data status identifiers 404 .
- Pending window 412may include one or more data status identifiers corresponding to uploaded data that is pending quality control review.
- Reviewed window 413may include one or more data status identifiers 404 corresponding to uploaded data that has been reviewed.
- Quality control reviewerse.g., an initial reviewer, a secondary reviewer, etc.
- Data status identifier 404may be selected for further quality control analysis of the data associated with the selected data status identifier 404 .
- ECG application 29may cause system device 14 to display FIGS. 24 D-E .
- FIGS. 24 D-Eillustrate analysis interface 421 and analysis interface 422 which each illustrate ECG data strips 424 corresponding to data status identifier 404 .
- ECG data strips 424may be organized according to tabs 423 which may identify groups of ECG data strips (e.g., SVT, couplets, etc.).
- Analysis interface 421 and analysis interface 422may be used to view ECG data strips that have been removed during quality control review as well as the ECG data strips that remain (i.e., have not been removed).
- Remove status 425indicates whether the ECG data strips have been removed or if the ECG data strips are those that remain. For example, user interface 421 illustrates ECG data strips that remain and user interface 422 illustrates ECG data strips that have been removed. In this manner, the changes made during quality review may be archived and reviewed. Restore button 426 may be engaged to undo a removal of an ECG data strip such that it is re-categorized as a remaining ECG data strip.
- interface 431is illustrated and may be used to generate a report including quality control information (e.g., pending, passed, return for analysis).
- Interface 431may include report options window 432 , patient information window 433 , clinical information window 434 , results window 435 , quality control window 436 , patient metrics window 437 , and/or generate report window 438 .
- Report options window 432may include several options for generating the report and may further permit selection of one or more leads for selecting ECG data to be included in the report.
- Patient information 433may include identification and other information corresponding to the patient from which ECG data was generated (e.g., Name, patient identifier, primary indication, date of birth, presence of pacemaker, gender, etc.).
- Clinical information window 434may include certain clinical information such as the name of the healthcare professional that conducted the analysis, the date, and/or the name of the institution.
- Results window 435may be used to select results templates and/or or metrics.
- Quality control window 436may be used to select the status of the quality control (e.g., pending, passed, return for analysis).
- Patient metrics window 437may display certain patient metrics such as duration of monitoring and/or time analyzed, heart rate information, information about complexes (e.g., premature supraventricular complexes, premature ventricular complexes), patient events, patient episodes, and/or pause occurrences.
- any of the operations described herein abovemay be implemented at least in part as computer-readable instructions stored on a computer-readable memory. Upon execution of the computer-readable instructions by a processor, the computer-readable instructions may cause a node to perform the operations. It will of course be understood that the embodiments described herein are illustrative, and components may be arranged, substituted, combined, and designed in a wide variety of different configurations, all of which are contemplated and fall within the scope of this disclosure.
Landscapes
- Health & Medical Sciences (AREA)
- Life Sciences & Earth Sciences (AREA)
- Engineering & Computer Science (AREA)
- Physics & Mathematics (AREA)
- Biomedical Technology (AREA)
- General Health & Medical Sciences (AREA)
- Biophysics (AREA)
- Molecular Biology (AREA)
- Cardiology (AREA)
- Public Health (AREA)
- Medical Informatics (AREA)
- Pathology (AREA)
- Veterinary Medicine (AREA)
- Animal Behavior & Ethology (AREA)
- Surgery (AREA)
- Heart & Thoracic Surgery (AREA)
- Artificial Intelligence (AREA)
- Theoretical Computer Science (AREA)
- Physiology (AREA)
- Evolutionary Computation (AREA)
- Mathematical Physics (AREA)
- Data Mining & Analysis (AREA)
- Computational Linguistics (AREA)
- Computing Systems (AREA)
- General Physics & Mathematics (AREA)
- General Engineering & Computer Science (AREA)
- Software Systems (AREA)
- Signal Processing (AREA)
- Computer Vision & Pattern Recognition (AREA)
- Psychiatry (AREA)
- Computer Networks & Wireless Communication (AREA)
- Fuzzy Systems (AREA)
- Human Computer Interaction (AREA)
- Databases & Information Systems (AREA)
- Epidemiology (AREA)
- Primary Health Care (AREA)
- Measurement And Recording Of Electrical Phenomena And Electrical Characteristics Of The Living Body (AREA)
Abstract
Description
Claims (21)
Priority Applications (1)
| Application Number | Priority Date | Filing Date | Title |
|---|---|---|---|
| US17/390,714US12016694B2 (en) | 2019-02-04 | 2021-07-30 | Electrocardiogram processing system for delineation and classification |
Applications Claiming Priority (3)
| Application Number | Priority Date | Filing Date | Title |
|---|---|---|---|
| US16/267,380US10959660B2 (en) | 2015-10-27 | 2019-02-04 | Electrocardiogram processing system for delineation and classification |
| PCT/IB2020/050850WO2020161605A1 (en) | 2015-10-27 | 2020-02-03 | Electrocardiogram processing system for delineation and classification |
| US17/390,714US12016694B2 (en) | 2019-02-04 | 2021-07-30 | Electrocardiogram processing system for delineation and classification |
Related Parent Applications (1)
| Application Number | Title | Priority Date | Filing Date |
|---|---|---|---|
| PCT/IB2020/050850ContinuationWO2020161605A1 (en) | 2015-10-27 | 2020-02-03 | Electrocardiogram processing system for delineation and classification |
Publications (2)
| Publication Number | Publication Date |
|---|---|
| US20220031223A1 US20220031223A1 (en) | 2022-02-03 |
| US12016694B2true US12016694B2 (en) | 2024-06-25 |
Family
ID=80003872
Family Applications (1)
| Application Number | Title | Priority Date | Filing Date |
|---|---|---|---|
| US17/390,714ActiveUS12016694B2 (en) | 2019-02-04 | 2021-07-30 | Electrocardiogram processing system for delineation and classification |
Country Status (1)
| Country | Link |
|---|---|
| US (1) | US12016694B2 (en) |
Families Citing this family (11)
| Publication number | Priority date | Publication date | Assignee | Title |
|---|---|---|---|---|
| DK2568878T3 (en) | 2010-05-12 | 2018-10-29 | Irhythm Tech Inc | Interior features and design elements for long-term adhesion |
| KR102145450B1 (en) | 2013-01-24 | 2020-08-18 | 아이리듬 테크놀로지스, 아이엔씨 | Physiological monitoring device |
| WO2016070128A1 (en) | 2014-10-31 | 2016-05-06 | Irhythm Technologies, Inc. | Wireless physiological monitoring device and systems |
| EP4103051A1 (en) | 2020-02-12 | 2022-12-21 | Irhythm Technologies, Inc. | Non-invasive cardiac monitor and methods of using recorded cardiac data to infer a physiological characteristic of a patient |
| US11350865B2 (en) | 2020-08-06 | 2022-06-07 | Irhythm Technologies, Inc. | Wearable device with bridge portion |
| WO2022032118A1 (en) | 2020-08-06 | 2022-02-10 | Irhythm Technologies, Inc. | Electrical components for physiological monitoring device |
| JP6931880B1 (en)* | 2021-03-24 | 2021-09-08 | アステラス製薬株式会社 | Electrocardiogram analysis support device, program, electrocardiogram analysis support method, and electrocardiogram analysis support system |
| USD1063079S1 (en) | 2021-08-06 | 2025-02-18 | Irhythm Technologies, Inc. | Physiological monitoring device |
| KR102392759B1 (en)* | 2021-10-08 | 2022-05-02 | 주식회사 에이티센스 | Electrocardiogram data processing server, method for handling analysis tasks for signal intervals that meet analysis condition, and computer program |
| US20240120112A1 (en)* | 2022-10-05 | 2024-04-11 | Boston Scientific Cardiac Diagnostics, Inc | Beat clustering |
| US20240350069A1 (en)* | 2023-04-21 | 2024-10-24 | GE Precision Healthcare LLC | Systems for comparative analysis of cardiac information |
Citations (198)
| Publication number | Priority date | Publication date | Assignee | Title |
|---|---|---|---|---|
| US5024225A (en) | 1989-09-26 | 1991-06-18 | William Fang | Personal health monitor enclosure |
| EP0465241A2 (en) | 1990-07-03 | 1992-01-08 | Telectronics N.V. | Apparatus and method for the detection and treatment of arrhythmias using a neural network |
| US5239494A (en) | 1991-10-30 | 1993-08-24 | Motorola, Inc. | Random bit stream generator and method |
| US5533511A (en) | 1994-01-05 | 1996-07-09 | Vital Insite, Incorporated | Apparatus and method for noninvasive blood pressure measurement |
| US5619991A (en) | 1995-04-26 | 1997-04-15 | Lucent Technologies Inc. | Delivery of medical services using electronic data communications |
| US5623935A (en) | 1994-07-07 | 1997-04-29 | Ela Medical, S.A. | Data compression methods and apparatus for use with physiological data |
| WO1997038626A1 (en) | 1996-04-17 | 1997-10-23 | Seiko Epson Corporation | Arrhythmia detector |
| US5819007A (en) | 1996-03-15 | 1998-10-06 | Siemens Medical Systems, Inc. | Feature-based expert system classifier |
| US5907291A (en) | 1997-06-05 | 1999-05-25 | Vsm Technology Inc. | Multi-patient monitoring apparatus and method |
| US5966692A (en) | 1992-05-12 | 1999-10-12 | Telemed Technologies International Corporation | Method and system for monitoring the heart of a patient |
| US6024699A (en) | 1998-03-13 | 2000-02-15 | Healthware Corporation | Systems, methods and computer program products for monitoring, diagnosing and treating medical conditions of remotely located patients |
| US6157850A (en) | 1991-03-07 | 2000-12-05 | Masimo Corporation | Signal processing apparatus |
| US20010029338A1 (en) | 2000-02-18 | 2001-10-11 | Srivathsan Krishnamachari | Automated interpretation of T-wave alternans results |
| EP1179319A1 (en) | 2000-08-09 | 2002-02-13 | GE Medical Systems Information Technologies, Inc. | Method and apparatus to detect acute cardiac syndromes in specified groups of patients using ECG |
| US20020169487A1 (en) | 2001-03-29 | 2002-11-14 | Laurence Graindorge | Presentation of data stored in an active implantable medical device to assist a practitioner's diagnosis |
| CA2466848A1 (en) | 2001-11-28 | 2003-06-05 | Monebo Technologies, Inc. | System and process for analyzing a medical condition of a user |
| US6612985B2 (en) | 2001-02-26 | 2003-09-02 | University Of Rochester | Method and system for monitoring and treating a patient |
| US20030176795A1 (en) | 2000-06-02 | 2003-09-18 | Harris Thomas John | Blood pressure measurement apparatus and method |
| US6694177B2 (en) | 2001-04-23 | 2004-02-17 | Cardionet, Inc. | Control of data transmission between a remote monitoring unit and a central unit |
| US20040147840A1 (en) | 2002-11-08 | 2004-07-29 | Bhavani Duggirala | Computer aided diagnostic assistance for medical imaging |
| US20040230105A1 (en) | 2003-05-15 | 2004-11-18 | Widemed Ltd. | Adaptive prediction of changes of physiological/pathological states using processing of biomedical signals |
| US20040260192A1 (en) | 2003-06-12 | 2004-12-23 | Norihito Yamamoto | Electrocardiograph and method of displaying electrocardiographic wave |
| US20050113706A1 (en) | 2003-11-26 | 2005-05-26 | Prystowsky Eric N. | System and method for processing and presenting arrhythmia information to facilitate heart arrhythmia identification and treatment |
| US20050171448A1 (en) | 2004-02-02 | 2005-08-04 | Lev Korzinov | Biological signal management |
| US20050182334A1 (en) | 2004-02-17 | 2005-08-18 | Lev Korzinov | Distributed cardiac activity monitoring with selective filtering |
| US20050222508A1 (en) | 2004-04-05 | 2005-10-06 | Moreno Pedro J | Cardiac diagnostic system and method |
| US20050256413A1 (en) | 2003-04-24 | 2005-11-17 | Magnus Astrom | Apparatus for analyzing cardiac events |
| US20060020219A1 (en) | 2004-06-30 | 2006-01-26 | Zinser Richard L Jr | Method and system for detecting pace pulses |
| WO2006048881A2 (en) | 2004-11-08 | 2006-05-11 | Eyal Cohen | A method and system for diagnosis of cardiac diseases utilizing neural networks |
| US20060173369A1 (en) | 2005-02-02 | 2006-08-03 | Mikko Kaski | Monitoring of atrial activation |
| US7142907B2 (en) | 2003-07-01 | 2006-11-28 | Ge Medical Systems Information Technologies, Inc. | Method and apparatus for algorithm fusion of high-resolution electrocardiograms |
| US20070129642A1 (en) | 2004-01-21 | 2007-06-07 | Cardionet, Inc. | Cardiac Monitoring |
| US20070244402A1 (en) | 2006-02-17 | 2007-10-18 | Brockway Brian P | System and method of monitoring physiological signals |
| US20080004904A1 (en)* | 2006-06-30 | 2008-01-03 | Tran Bao Q | Systems and methods for providing interoperability among healthcare devices |
| US20080082016A1 (en) | 2006-10-03 | 2008-04-03 | Mark Kohls | System and method of serial comparison for detection of long qt syndrome (lqts) |
| US20080132799A1 (en) | 2006-11-30 | 2008-06-05 | Joel Quizhen Xue | Method of physiological data analysis and measurement quality check using principal component analysis |
| US20080167567A1 (en) | 2006-09-19 | 2008-07-10 | The Cleveland Clinic Foundation | Prediction and prevention of postoperative atrial fibrillation in cardiac surgery patients |
| CN101268938A (en) | 2008-04-30 | 2008-09-24 | 董军 | Method and apparatus for electrocardiogram recognition and specification |
| EP2030565A1 (en) | 2007-09-02 | 2009-03-04 | Medicalgorithmics Sp. Z.O.O. | Systems for safe and remote outpatient ECG monitoring |
| US20090112110A1 (en) | 2007-10-24 | 2009-04-30 | Siemens Medical Solutions Usa, Inc. | System for Cardiac Medical Condition Detection and Characterization |
| US20090192394A1 (en) | 2008-01-16 | 2009-07-30 | Guttag John V | Method and apparatus for predicting patient outcomes from a physiological segmentable patient signal |
| US20100030302A1 (en) | 2008-07-30 | 2010-02-04 | Medtronic, Inc. | Method for displaying trended data retrieved from a medical device |
| US20100056940A1 (en) | 2007-04-12 | 2010-03-04 | University Of Virginia Patent Foundation | Method, System and Computer Program Product for Non-Invasive Classification of Cardiac Rhythm |
| US20100076331A1 (en) | 2008-09-24 | 2010-03-25 | Hsiao-Lung Chan | Device and Method for Measuring Three-Lead ECG in a Wristwatch |
| CN101766484A (en) | 2010-01-18 | 2010-07-07 | 董军 | Method and equipment for identification and classification of electrocardiogram |
| US20100217144A1 (en)* | 2007-06-28 | 2010-08-26 | Arenare Brian | Diagnostic and predictive system and methodology using multiple parameter electrocardiography superscores |
| US20100268103A1 (en) | 2009-04-16 | 2010-10-21 | Cardionet, Inc. | Cardiac Arrhythmia Report |
| US20110184297A1 (en) | 2010-01-26 | 2011-07-28 | Stmicroelectronics S.R.L. | Method and device for estimating morphological features of heart beats |
| US20110224565A1 (en) | 2010-03-15 | 2011-09-15 | Singapore Health Services Pte Ltd. | Method of predicting acute cardiopulmonary events and survivability of a patient |
| CN102188240A (en) | 2010-03-05 | 2011-09-21 | 华东师范大学 | Electrocardiographic data sampling method and device |
| US20110257548A1 (en) | 2008-12-30 | 2011-10-20 | Koninklijke Philips Electronics N.V. | Method and system for processing heart sound signals |
| US20110282225A1 (en) | 2010-05-12 | 2011-11-17 | Medtronic, Inc. | Techniques for reviewing and analyzing implantable medical device system data |
| US20110301435A1 (en) | 2010-06-08 | 2011-12-08 | AliveUSA LLC | Heart Monitoring System Usable With A Smartphone or Computer |
| CN102379694A (en) | 2011-10-12 | 2012-03-21 | 中国科学院苏州纳米技术与纳米仿生研究所 | Electrocardiogram R wave detection method |
| US20120110226A1 (en) | 2010-11-02 | 2012-05-03 | Cardionet, Inc. | Medical data collection apparatus |
| US20120203491A1 (en) | 2011-02-03 | 2012-08-09 | Nokia Corporation | Method and apparatus for providing context-aware control of sensors and sensor data |
| WO2012140559A1 (en) | 2011-04-11 | 2012-10-18 | Medic4All Ag | Pulse oximetry measurement triggering ecg measurement |
| US20120278099A1 (en) | 2011-04-26 | 2012-11-01 | Cerner Innovation, Inc. | Monitoring, capturing, measuring and annotating physiological waveform data |
| CN102779234A (en) | 2012-06-28 | 2012-11-14 | 中国科学院苏州纳米技术与纳米仿生研究所 | Electrocardiogram classified processing method and device |
| US8332017B2 (en) | 2006-12-01 | 2012-12-11 | Obs Medical Limited | Method of biomedical signal analysis including improved automatic segmentation |
| US20130116585A1 (en) | 2011-11-07 | 2013-05-09 | Cardionet, Inc. | Ventricular Fibrillation Detection |
| CN103110417A (en) | 2013-02-28 | 2013-05-22 | 华东师范大学 | Automatic electrocardiogram recognition system |
| US20130184599A1 (en) | 2010-07-14 | 2013-07-18 | Mayo Foundation For Medical Education And Research | Non-invasive monitoring of physiological conditions |
| CN103284702A (en) | 2013-06-17 | 2013-09-11 | 中国科学院苏州纳米技术与纳米仿生研究所 | Electrocardiogram and pulse wave relation analysis method and method and device of fusion analysis |
| CN103417209A (en) | 2013-08-29 | 2013-12-04 | 中国科学院苏州纳米技术与纳米仿生研究所 | Electrocardiogram characteristic selecting method |
| US20140005988A1 (en) | 2009-11-03 | 2014-01-02 | Marina Brockway | Physiological signal denoising |
| US20140073486A1 (en) | 2012-09-04 | 2014-03-13 | Bobo Analytics, Inc. | Systems, devices and methods for continuous heart rate monitoring and interpretation |
| US8684900B2 (en) | 2006-05-16 | 2014-04-01 | Bao Tran | Health monitoring appliance |
| US20140107493A1 (en) | 2012-06-22 | 2014-04-17 | Fitbit, Inc. | Portable Biometric Monitoring Devices and Methods of Operating Same |
| US20140128758A1 (en) | 2012-11-08 | 2014-05-08 | Conner Daniel Cross Galloway | Electrocardiogram signal detection |
| US20140148714A1 (en) | 2010-12-20 | 2014-05-29 | Ecole Polytechnique Federale De Lausanne (Epfl) | Automatic online delineation of a multi-lead electrocardiogram bio signal |
| US20140188770A1 (en) | 2011-05-10 | 2014-07-03 | Foteini Agrafioti | System and method for enabling continuous or instantaneous identity recognition based on physiological biometric signals |
| US20140228665A1 (en) | 2010-06-08 | 2014-08-14 | Alivecor, Inc. | Two Electrode Apparatus and Methods for Twelve Lead ECG |
| US20140275840A1 (en) | 2013-03-15 | 2014-09-18 | Flint Hills Scientific, L.L.C. | Pathological state detection using dynamically determined body data variability range values |
| US20140330147A1 (en) | 2013-05-03 | 2014-11-06 | Medtronic, Inc. | Electrogram summary |
| USD717955S1 (en) | 2013-11-07 | 2014-11-18 | Bardy Diagnostics, Inc. | Electrocardiography monitor |
| US8903479B2 (en) | 2012-06-19 | 2014-12-02 | Texas Instruments Incorporated | Real time QRS duration measurement in electrocardiogram |
| US20150008802A1 (en) | 2012-01-31 | 2015-01-08 | Kodenshi Corporation | Encoder sensor mounting body, drum disk encoder, and motor with encoder using same |
| US20150018702A1 (en) | 2013-07-10 | 2015-01-15 | Alivecor, Inc. | Devices and Methods for Real-Time Denoising of Electrocardiograms |
| US20150051505A1 (en) | 2011-02-23 | 2015-02-19 | Stmicroelectronics S.R.L. | Device for measuring impedance of biologic tissues including an alternating current (ac) coupled voltage-to-current converter |
| KR20150020955A (en) | 2013-08-19 | 2015-02-27 | 광운대학교 산학협력단 | Method of classifing heart condition using neural network, and apparatus thereof |
| CN104463326A (en) | 2014-12-09 | 2015-03-25 | 浙江大学 | Standard 12-lead ecg signal reconstruction method |
| US20150088024A1 (en) | 2012-03-19 | 2015-03-26 | University Of Florida Research Foundation, Inc. | Methods and systems for brain function analysis |
| US20150088020A1 (en) | 2013-09-25 | 2015-03-26 | Bardy Diagnostics, Inc. | System and Method For Interactive Processing Of ECG Data |
| US20150119725A1 (en) | 2013-10-25 | 2015-04-30 | Qualcomm Incorporated | System and method for obtaining bodily function measurements using a mobile device |
| US20150164349A1 (en) | 2013-12-12 | 2015-06-18 | Alivecor, Inc. | Methods and systems for arrhythmia tracking and scoring |
| US20150238151A1 (en) | 2014-02-25 | 2015-08-27 | General Electric Company | System and method for perfusion-based arrhythmia alarm evaluation |
| US20150248534A1 (en) | 2012-09-18 | 2015-09-03 | Draeger Medical Systems, Inc. | System And Method Of Generating A User Interface Display Of Patient Parameter Data |
| US20150257668A1 (en) | 2014-03-11 | 2015-09-17 | Ecole Polytechnique Federale De Lausanne (Epfl) | Method for detecting abnormalities in an electrocardiogram |
| US20150282726A1 (en) | 2012-10-26 | 2015-10-08 | Koninklijke Philips N.V. | Diagnostic representation and interpretation of ecg leads on a digital display |
| US20150289112A1 (en) | 2014-04-04 | 2015-10-08 | Mayo Foundation For Medical Education And Research | Identification of a subject in a facility |
| CN104970789A (en) | 2014-04-04 | 2015-10-14 | 中国科学院苏州纳米技术与纳米仿生研究所 | Electrocardiogram classification method and system |
| USD744659S1 (en) | 2013-11-07 | 2015-12-01 | Bardy Diagnostics, Inc. | Extended wear electrode patch |
| US9241650B2 (en) | 2013-12-15 | 2016-01-26 | Lifewatch Technologies Ltd. | Patient specific QRS complex classification for arrhythmia detection |
| US20160051157A1 (en) | 2014-08-22 | 2016-02-25 | Apple Inc. | Frequency domain projection algorithm |
| US20160058318A1 (en) | 2014-09-02 | 2016-03-03 | The Regents Of The University Of Michigan | Electrocardiogram Data Analysis Method for Rapid Diagnosis |
| US20160086297A1 (en) | 2014-09-18 | 2016-03-24 | Preventice, Inc. | Creating individually tailored care plans |
| US20160085927A1 (en) | 2014-09-18 | 2016-03-24 | Preventice, Inc. | Dynamically adaptive care plans |
| US20160085937A1 (en) | 2014-09-18 | 2016-03-24 | Preventice, Inc. | Care plan administration using thresholds |
| US20160098538A1 (en) | 2014-10-07 | 2016-04-07 | Preventice, Inc. | Care plan administration |
| US20160098536A1 (en) | 2014-10-07 | 2016-04-07 | Preventice, Inc. | Care plan administration: patient feedback |
| US20160098537A1 (en) | 2014-10-07 | 2016-04-07 | Preventice, Inc. | Derived observations in care plan administration |
| US9339202B2 (en) | 2009-11-03 | 2016-05-17 | Vivaquant Llc | System for processing physiological data |
| US20160135706A1 (en) | 2014-11-14 | 2016-05-19 | Zoll Medical Corporation | Medical Premonitory Event Estimation |
| US9345414B1 (en) | 2013-09-25 | 2016-05-24 | Bardy Diagnostics, Inc. | Method for providing dynamic gain over electrocardiographic data with the aid of a digital computer |
| US20160150989A1 (en) | 2013-09-25 | 2016-06-02 | Bardy Diagnostics, Inc. | Method For Efficiently Encoding And Compressing ECG Data Optimized For Use In An Ambulatory ECG Monitor |
| US9364155B2 (en) | 2013-09-25 | 2016-06-14 | Bardy Diagnostics, Inc. | Self-contained personal air flow sensing monitor |
| US20160183827A1 (en) | 2014-12-31 | 2016-06-30 | General Electric Company | Method and apparatus for comparing and visualizing serial ecg data |
| US20160192853A1 (en) | 2013-11-14 | 2016-07-07 | Bardy Diagnostics, Inc. | System and Method for Facilitating Diagnosis of Cardiac Rhythm Disorders with the Aid of a Digital Computer |
| US20160192850A1 (en) | 2013-08-13 | 2016-07-07 | Koninklijke Philips N.V. | Method and display for long term physiological signal quality indication |
| WO2016110804A1 (en) | 2015-01-06 | 2016-07-14 | David Burton | Mobile wearable monitoring systems |
| US9433367B2 (en) | 2013-09-25 | 2016-09-06 | Bardy Diagnostics, Inc. | Remote interfacing of extended wear electrocardiography and physiological sensor monitor |
| US9433380B1 (en) | 2013-09-25 | 2016-09-06 | Bardy Diagnostics, Inc. | Extended wear electrocardiography patch |
| USD766447S1 (en) | 2015-09-10 | 2016-09-13 | Bardy Diagnostics, Inc. | Extended wear electrode patch |
| WO2016145392A1 (en) | 2015-03-12 | 2016-09-15 | Bardy Diagnostics, Inc. | Display arrangement for diagnosis of cardiac rhythm disorders |
| US20160321430A1 (en) | 2015-04-28 | 2016-11-03 | Preventice Technologies, Inc. | User interface displaying a temporal relationship between a health event indicator and monitored health conditions |
| US9504423B1 (en) | 2015-10-05 | 2016-11-29 | Bardy Diagnostics, Inc. | Method for addressing medical conditions through a wearable health monitor with the aid of a digital computer |
| US9545204B2 (en) | 2013-09-25 | 2017-01-17 | Bardy Diagnostics, Inc. | Extended wear electrocardiography patch |
| US20170014037A1 (en) | 2014-04-02 | 2017-01-19 | Koninklijke Philips N.V. | System and method for detecting variation of heart rate of a user |
| EP3144851A1 (en) | 2015-09-18 | 2017-03-22 | Panasonic Intellectual Property Corporation of America | Image recognition method |
| US20170098047A1 (en) | 2015-10-06 | 2017-04-06 | General Electric Company | System and method for clinical decision support |
| US9615763B2 (en) | 2013-09-25 | 2017-04-11 | Bardy Diagnostics, Inc. | Ambulatory electrocardiography monitor recorder optimized for capturing low amplitude cardiac action potential propagation |
| US9619660B1 (en) | 2013-09-25 | 2017-04-11 | Bardy Diagnostics, Inc. | Computer-implemented system for secure physiological data collection and processing |
| US20170105683A1 (en) | 2015-10-16 | 2017-04-20 | General Electric Company | System and method of adaptive interpretation of ecg waveforms |
| US20170112401A1 (en)* | 2015-10-27 | 2017-04-27 | CardioLogs Technologies | Automatic method to delineate or categorize an electrocardiogram |
| WO2017072250A1 (en) | 2015-10-27 | 2017-05-04 | CardioLogs Technologies | An automatic method to delineate or categorize an electrocardiogram |
| US9655538B2 (en) | 2013-09-25 | 2017-05-23 | Bardy Diagnostics, Inc. | Self-authenticating electrocardiography monitoring circuit |
| US9655537B2 (en) | 2013-09-25 | 2017-05-23 | Bardy Diagnostics, Inc. | Wearable electrocardiography and physiology monitoring ensemble |
| CN106778685A (en) | 2017-01-12 | 2017-05-31 | 司马大大(北京)智能系统有限公司 | Electrocardiogram image-recognizing method, device and service terminal |
| US20170177811A1 (en) | 2015-12-17 | 2017-06-22 | Preventice Technologies, Inc. | Patient care systems employing control devices to identify and configure sensor devices for patients |
| US20170188872A1 (en) | 2014-10-31 | 2017-07-06 | Irhythm Technologies, Inc. | Wearable monitor |
| US9700227B2 (en) | 2013-09-25 | 2017-07-11 | Bardy Diagnostics, Inc. | Ambulatory electrocardiography monitoring patch optimized for capturing low amplitude cardiac action potential propagation |
| USD793566S1 (en) | 2015-09-10 | 2017-08-01 | Bardy Diagnostics, Inc. | Extended wear electrode patch |
| US9717432B2 (en) | 2013-09-25 | 2017-08-01 | Bardy Diagnostics, Inc. | Extended wear electrocardiography patch using interlaced wire electrodes |
| US9717433B2 (en) | 2013-09-25 | 2017-08-01 | Bardy Diagnostics, Inc. | Ambulatory electrocardiography monitoring patch optimized for capturing low amplitude cardiac action potential propagation |
| US9737224B2 (en) | 2013-09-25 | 2017-08-22 | Bardy Diagnostics, Inc. | Event alerting through actigraphy embedded within electrocardiographic data |
| US20170238833A1 (en) | 2013-09-25 | 2017-08-24 | Bardy Diagnostics, Inc. | Electrocardiography And Syncope Monitor Recorder |
| US20170258358A1 (en) | 2013-09-25 | 2017-09-14 | Bardy Diagnostics, Inc | Extended wear electrocardiography and physiological sensor monitor |
| US9775536B2 (en) | 2013-09-25 | 2017-10-03 | Bardy Diagnostics, Inc. | Method for constructing a stress-pliant physiological electrode assembly |
| USD801528S1 (en) | 2013-11-07 | 2017-10-31 | Bardy Diagnostics, Inc. | Electrocardiography monitor |
| US9808206B1 (en) | 2013-09-09 | 2017-11-07 | Scanadu, Inc. | Data acquisition quality and data fusion for personal portable wireless vital signs scanner |
| US20170357764A1 (en) | 2016-06-13 | 2017-12-14 | Medical Informatics Corporation | User interface for displaying patient historical data |
| US20180028144A1 (en) | 2014-06-05 | 2018-02-01 | Guangren CHEN | Electronic Acoustic Stethoscope with ECG |
| US20180060522A1 (en) | 2016-08-31 | 2018-03-01 | Alivecor, Inc. | Devices, systems, and methods for physiology monitoring |
| US20180206752A1 (en) | 2013-09-25 | 2018-07-26 | Bardy Diagnostics, Inc. | System And Method For ECG Data Classification For Use In Facilitating Diagnosis Of Cardiac Rhythm Disorders With The Aid Of A Digital Computer |
| US20180279956A1 (en) | 2017-03-28 | 2018-10-04 | Apple Inc. | Detecting conditions using heart rate sensors |
| US20180289274A1 (en) | 2013-01-24 | 2018-10-11 | Irhythm Technologies, Inc. | Physiological monitoring device |
| USD831833S1 (en) | 2013-11-07 | 2018-10-23 | Bardy Diagnostics, Inc. | Extended wear electrode patch |
| US20180310892A1 (en) | 2017-05-01 | 2018-11-01 | Cardiac Pacemakers, Inc. | Systems and methods for medical alert management |
| US20180344189A1 (en) | 2013-08-26 | 2018-12-06 | Apple Inc. | Method of detecting the wearing limb of a wearable electronic device |
| US20180368715A1 (en) | 2017-06-23 | 2018-12-27 | General Electric Company | System and Method for Detecting Atrial Fibrillation |
| US10165946B2 (en) | 2013-09-25 | 2019-01-01 | Bardy Diagnostics, Inc. | Computer-implemented system and method for providing a personal mobile device-triggered medical intervention |
| US20190034050A1 (en) | 2017-05-15 | 2019-01-31 | Apple Inc. | Displaying a scrollable list of affordances associated with physical activities |
| WO2019038435A1 (en) | 2017-08-25 | 2019-02-28 | Cardiologs Technologies Sas | User interface for analysis of electrocardiograms |
| US20190059763A1 (en) | 2017-08-25 | 2019-02-28 | Cambridge Heartwear Limited | Method of detecting abnormalities in ecg signals |
| US20190069800A1 (en) | 2013-09-25 | 2019-03-07 | Bardy Diagnostics, Inc. | Subcutaneous insertable cardiac monitor optimized for long term, low amplitude electrocardiographic data collection |
| US20190069798A1 (en) | 2013-09-25 | 2019-03-07 | Bardy Diagnostics, Inc. | Subcutaneous insertable electrocardiography monitor |
| US20190069794A1 (en) | 2013-09-25 | 2019-03-07 | Bardy Diagnostics, Inc. | System and method for facilitating a cardiac rhythm disorder diagnosis based on subcutaneous cardiac monitoring data |
| US20190090769A1 (en) | 2013-09-25 | 2019-03-28 | Bardy Diagnostics, Inc. | System and method for machine-learning-based atrial fibrillation detection |
| US20190099105A1 (en) | 2013-09-25 | 2019-04-04 | Bardy Diagnostics, Inc. | Self-Expiring Electrocardiography And Physiological Sensor Monitor |
| US20190104961A1 (en) | 2013-09-25 | 2019-04-11 | Bardy Diagnostics, Inc. | Extended Wear Ambulatory Electrocardiography And Physiological Sensor Monitor |
| US20190104951A1 (en) | 2013-12-12 | 2019-04-11 | Alivecor, Inc. | Continuous monitoring of a user's health with a mobile device |
| US20190117068A1 (en) | 2013-07-11 | 2019-04-25 | Alivecor, Inc. | Apparatus for coupling to computing devices and measuring physiological data |
| US20190117099A1 (en) | 2013-09-25 | 2019-04-25 | Bardy Diagnostics, Inc. | System And Method For Secure Cloud-Based Physiological Data Processing And Delivery |
| US20190133483A1 (en) | 2017-11-07 | 2019-05-09 | General Electric Company | System and Method for Processing ECG Recordings from Multiple Patients |
| WO2019089830A1 (en) | 2017-10-31 | 2019-05-09 | Apple, Inc. | Monitoring system for assessing control of a disease state |
| US20190133486A1 (en) | 2013-09-25 | 2019-05-09 | Bardy Diagnostics, Inc. | Remote Interfacing Electrocardiography Patch |
| US20190167143A1 (en) | 2015-10-27 | 2019-06-06 | Cardiologs Technologies Sas | Electrocardiogram processing system for delineation and classification |
| US20190167141A1 (en) | 2017-12-06 | 2019-06-06 | General Electric Company | System and methods for qualification of ecg data for remote analysis |
| WO2019147180A1 (en) | 2018-01-25 | 2019-08-01 | Coala-Life Ab | Analysing electrocardiogram data from a remote portable sensor device |
| US20190259496A1 (en) | 2018-02-19 | 2019-08-22 | General Electric Company | System and method for processing ecg recordings from multiple patients for clinician overreading |
| US20190267139A1 (en) | 2015-04-06 | 2019-08-29 | Preventice Solutions, Inc. | Adverse event prioritization and handling |
| US20190272920A1 (en) | 2018-03-02 | 2019-09-05 | Preventice Solutions, Inc. | Automated ventricular ectopic beat classification |
| US20190274563A1 (en) | 2018-03-12 | 2019-09-12 | Apple Inc. | User interfaces for health monitoring |
| US20190282118A1 (en) | 2018-03-19 | 2019-09-19 | General Electric Company | System and method for monitoring cardiac arrhythmias |
| US20190298204A1 (en) | 2018-03-30 | 2019-10-03 | Cardiologs Technologies Sas | Systems and methods for digitizing electrocardiograms |
| US20190357794A1 (en) | 2013-09-25 | 2019-11-28 | Bardy Diagnostics, Inc. | System and method for facilitating a cardiac rhythm disorder diagnosis with the aid of a digital computer |
| US10492730B1 (en) | 2019-03-11 | 2019-12-03 | Preventice Solutions, Inc. | Determining reliability for ECG data using signal-to-noise ratio |
| US20200013507A1 (en) | 2018-07-09 | 2020-01-09 | Preventice Technologies, Inc | Best fit content delivery in care plan environment |
| US20200022591A1 (en) | 2018-05-09 | 2020-01-23 | Biosig Technologies, Inc. | Systems and Methods for Performing Electrophysiology (EP) Signal Processing |
| US20200029911A1 (en)* | 2018-07-24 | 2020-01-30 | Medtronic Monitoring, Inc. | System and method of patient monitoring and signal quality analysis |
| US10568570B1 (en) | 2019-02-14 | 2020-02-25 | Trungram Gyaltrul Sherpa | Methods and systems for providing a preferred fitness state of a user |
| WO2020086865A1 (en) | 2018-10-26 | 2020-04-30 | Mayo Foundation For Medical Education And Research | Neural networks for atrial fibrillation screening |
| US20200155025A1 (en) | 2018-11-19 | 2020-05-21 | Preventice Technologies, Inc. | True onset identification |
| US20200178825A1 (en) | 2018-12-05 | 2020-06-11 | General Electric Company | System and method for identifying cardiac arrhythmias with deep neural networks |
| US20200205745A1 (en) | 2018-12-26 | 2020-07-02 | Analytics For Life Inc. | Methods and systems to configure and use neural networks in characterizing physiological systems |
| US20200237317A1 (en) | 2015-07-19 | 2020-07-30 | Sanmina Corporation | System and method of a biosensor for detection of health parameters |
| US20200242763A1 (en) | 2017-10-13 | 2020-07-30 | iHealthScreen Inc. | Image based screening system for prediction of individual at risk of late age-related macular degeneration (amd) |
| US20200289033A1 (en) | 2017-11-21 | 2020-09-17 | Omniscient Medical As | System, sensor and method for monitoring health related aspects of a patient |
| US20200297286A1 (en) | 2017-10-13 | 2020-09-24 | Autem Medical, Llc | System for characterization, diagnosis, and treatment of a health condition of a patient and microtubule conductivity, and methods of using same |
| US20200401684A1 (en) | 2019-06-19 | 2020-12-24 | Preventice Solutions, Inc. | Login token management |
| US20200397313A1 (en) | 2017-10-06 | 2020-12-24 | Mayo Foundation For Medical Education And Research | Ecg-based cardiac ejection-fraction screening |
| US20210000344A1 (en) | 2019-07-03 | 2021-01-07 | Bardy Diagnostics, Inc. | System and method for remote ecg data streaming in real-time |
| US20210076960A1 (en) | 2019-09-18 | 2021-03-18 | Tempus Labs | Ecg based future atrial fibrillation predictor systems and methods |
| US20210150693A1 (en) | 2019-11-15 | 2021-05-20 | Geisinger Clinic | Systems and methods for a deep neural network to enhance prediction of patient endpoints using videos of the heart |
| US20210204859A1 (en) | 2018-05-31 | 2021-07-08 | Københavns Universitet | Cardiovascular implantable electronic device (cied) with cardiac event prediction |
| US20210271847A1 (en) | 2019-06-25 | 2021-09-02 | Owkin Inc. | Systems and methods for image preprocessing |
| US11331034B2 (en) | 2015-10-27 | 2022-05-17 | Cardiologs Technologies Sas | Automatic method to delineate or categorize an electrocardiogram |
- 2021
- 2021-07-30USUS17/390,714patent/US12016694B2/enactiveActive
Patent Citations (306)
| Publication number | Priority date | Publication date | Assignee | Title |
|---|---|---|---|---|
| US5024225A (en) | 1989-09-26 | 1991-06-18 | William Fang | Personal health monitor enclosure |
| EP0465241B1 (en) | 1990-07-03 | 1998-11-04 | Telectronics N.V. | Apparatus for the detection and treatment of arrhythmias using neural networks |
| EP0465241A2 (en) | 1990-07-03 | 1992-01-08 | Telectronics N.V. | Apparatus and method for the detection and treatment of arrhythmias using a neural network |
| US6157850A (en) | 1991-03-07 | 2000-12-05 | Masimo Corporation | Signal processing apparatus |
| US5239494A (en) | 1991-10-30 | 1993-08-24 | Motorola, Inc. | Random bit stream generator and method |
| US5966692A (en) | 1992-05-12 | 1999-10-12 | Telemed Technologies International Corporation | Method and system for monitoring the heart of a patient |
| US5533511A (en) | 1994-01-05 | 1996-07-09 | Vital Insite, Incorporated | Apparatus and method for noninvasive blood pressure measurement |
| US5623935A (en) | 1994-07-07 | 1997-04-29 | Ela Medical, S.A. | Data compression methods and apparatus for use with physiological data |
| US5619991A (en) | 1995-04-26 | 1997-04-15 | Lucent Technologies Inc. | Delivery of medical services using electronic data communications |
| US5819007A (en) | 1996-03-15 | 1998-10-06 | Siemens Medical Systems, Inc. | Feature-based expert system classifier |
| WO1997038626A1 (en) | 1996-04-17 | 1997-10-23 | Seiko Epson Corporation | Arrhythmia detector |
| US5907291A (en) | 1997-06-05 | 1999-05-25 | Vsm Technology Inc. | Multi-patient monitoring apparatus and method |
| US6024699A (en) | 1998-03-13 | 2000-02-15 | Healthware Corporation | Systems, methods and computer program products for monitoring, diagnosing and treating medical conditions of remotely located patients |
| US20010029338A1 (en) | 2000-02-18 | 2001-10-11 | Srivathsan Krishnamachari | Automated interpretation of T-wave alternans results |
| US20030176795A1 (en) | 2000-06-02 | 2003-09-18 | Harris Thomas John | Blood pressure measurement apparatus and method |
| EP1179319A1 (en) | 2000-08-09 | 2002-02-13 | GE Medical Systems Information Technologies, Inc. | Method and apparatus to detect acute cardiac syndromes in specified groups of patients using ECG |
| JP2002172096A (en) | 2000-08-09 | 2002-06-18 | Ge Marquette Medical Systems Inc | Method and apparatus for detecting acute heart disease syndrome in a group of patients identified using an electrocardiogram |
| DE60127354T2 (en) | 2000-08-09 | 2007-12-27 | GE Medical Systems Information Technologies, Inc., Milwaukee | Device for acquiring acute cardiac syndromes in specific groups of patients by means of ECG |
| US6507753B1 (en) | 2000-08-09 | 2003-01-14 | Ge Marquette Medical Systems, Inc. | Method and apparatus to detect acute cardiac syndromes in specified groups of patients using ECG |
| US6612985B2 (en) | 2001-02-26 | 2003-09-02 | University Of Rochester | Method and system for monitoring and treating a patient |
| US20020169487A1 (en) | 2001-03-29 | 2002-11-14 | Laurence Graindorge | Presentation of data stored in an active implantable medical device to assist a practitioner's diagnosis |
| US6694177B2 (en) | 2001-04-23 | 2004-02-17 | Cardionet, Inc. | Control of data transmission between a remote monitoring unit and a central unit |
| USRE43767E1 (en) | 2001-04-23 | 2012-10-23 | Cardionet, Inc. | Control of data transmission between a remote monitoring unit and a central unit |
| US20050101873A1 (en) | 2001-06-01 | 2005-05-12 | Monebo Technologies, Inc. | System process for analyzing the medical condition of a user |
| US6656125B2 (en) | 2001-06-01 | 2003-12-02 | Dale Julian Misczynski | System and process for analyzing a medical condition of a user |
| US7289844B2 (en) | 2001-06-01 | 2007-10-30 | Monebo Technologies, Inc. | System process for analyzing the medical condition of a user |
| CA2466848A1 (en) | 2001-11-28 | 2003-06-05 | Monebo Technologies, Inc. | System and process for analyzing a medical condition of a user |
| EP1503664A2 (en) | 2001-11-28 | 2005-02-09 | Monebo Technologies, Inc. | System and process for analyzing a medical condition of a user |
| WO2003045224A2 (en) | 2001-11-28 | 2003-06-05 | Monebo Technologies, Inc. | System and process for analyzing a medical condition of a user |
| WO2003045224A3 (en) | 2001-11-28 | 2004-11-11 | Monebo Technologies Inc | System and process for analyzing a medical condition of a user |
| US20040147840A1 (en) | 2002-11-08 | 2004-07-29 | Bhavani Duggirala | Computer aided diagnostic assistance for medical imaging |
| US20050256413A1 (en) | 2003-04-24 | 2005-11-17 | Magnus Astrom | Apparatus for analyzing cardiac events |
| US20040230105A1 (en) | 2003-05-15 | 2004-11-18 | Widemed Ltd. | Adaptive prediction of changes of physiological/pathological states using processing of biomedical signals |
| US20040260192A1 (en) | 2003-06-12 | 2004-12-23 | Norihito Yamamoto | Electrocardiograph and method of displaying electrocardiographic wave |
| US7142907B2 (en) | 2003-07-01 | 2006-11-28 | Ge Medical Systems Information Technologies, Inc. | Method and apparatus for algorithm fusion of high-resolution electrocardiograms |
| US20050113706A1 (en) | 2003-11-26 | 2005-05-26 | Prystowsky Eric N. | System and method for processing and presenting arrhythmia information to facilitate heart arrhythmia identification and treatment |
| US20150190067A1 (en) | 2003-11-26 | 2015-07-09 | Braemar Manufacturing, Llc | System and method for processing and presenting arrhythmia information to facilitate heart arrhythmia identification and treatment |
| US20070191723A1 (en) | 2003-11-26 | 2007-08-16 | Cardionet, Inc. | System and method for processing and presenting arrhythmia information to facilitate heart arrhythmia identification and treatment |
| US7941207B2 (en) | 2004-01-21 | 2011-05-10 | Cardionet, Inc. | Cardiac monitoring |
| US20070129642A1 (en) | 2004-01-21 | 2007-06-07 | Cardionet, Inc. | Cardiac Monitoring |
| US20050171448A1 (en) | 2004-02-02 | 2005-08-04 | Lev Korzinov | Biological signal management |
| US20050182334A1 (en) | 2004-02-17 | 2005-08-18 | Lev Korzinov | Distributed cardiac activity monitoring with selective filtering |
| US20050222508A1 (en) | 2004-04-05 | 2005-10-06 | Moreno Pedro J | Cardiac diagnostic system and method |
| US20060020219A1 (en) | 2004-06-30 | 2006-01-26 | Zinser Richard L Jr | Method and system for detecting pace pulses |
| WO2006048881A2 (en) | 2004-11-08 | 2006-05-11 | Eyal Cohen | A method and system for diagnosis of cardiac diseases utilizing neural networks |
| US20080103403A1 (en) | 2004-11-08 | 2008-05-01 | Eyal Cohen | Method and System for Diagnosis of Cardiac Diseases Utilizing Neural Networks |
| US20060173369A1 (en) | 2005-02-02 | 2006-08-03 | Mikko Kaski | Monitoring of atrial activation |
| US8818496B2 (en) | 2005-10-14 | 2014-08-26 | Medicalgorithmics Ltd. | Systems for safe and remote outpatient ECG monitoring |
| US9351652B2 (en) | 2005-10-14 | 2016-05-31 | Medicalgorithmics S.A. | Systems for safe and remote outpatient ECG monitoring |
| US20070244402A1 (en) | 2006-02-17 | 2007-10-18 | Brockway Brian P | System and method of monitoring physiological signals |
| US8684900B2 (en) | 2006-05-16 | 2014-04-01 | Bao Tran | Health monitoring appliance |
| US20080004904A1 (en)* | 2006-06-30 | 2008-01-03 | Tran Bao Q | Systems and methods for providing interoperability among healthcare devices |
| US20080167567A1 (en) | 2006-09-19 | 2008-07-10 | The Cleveland Clinic Foundation | Prediction and prevention of postoperative atrial fibrillation in cardiac surgery patients |
| US20080082016A1 (en) | 2006-10-03 | 2008-04-03 | Mark Kohls | System and method of serial comparison for detection of long qt syndrome (lqts) |
| US20080132799A1 (en) | 2006-11-30 | 2008-06-05 | Joel Quizhen Xue | Method of physiological data analysis and measurement quality check using principal component analysis |
| US8332017B2 (en) | 2006-12-01 | 2012-12-11 | Obs Medical Limited | Method of biomedical signal analysis including improved automatic segmentation |
| US20100056940A1 (en) | 2007-04-12 | 2010-03-04 | University Of Virginia Patent Foundation | Method, System and Computer Program Product for Non-Invasive Classification of Cardiac Rhythm |
| US20100217144A1 (en)* | 2007-06-28 | 2010-08-26 | Arenare Brian | Diagnostic and predictive system and methodology using multiple parameter electrocardiography superscores |
| EP2030565A1 (en) | 2007-09-02 | 2009-03-04 | Medicalgorithmics Sp. Z.O.O. | Systems for safe and remote outpatient ECG monitoring |
| US20090112110A1 (en) | 2007-10-24 | 2009-04-30 | Siemens Medical Solutions Usa, Inc. | System for Cardiac Medical Condition Detection and Characterization |
| US20090192394A1 (en) | 2008-01-16 | 2009-07-30 | Guttag John V | Method and apparatus for predicting patient outcomes from a physiological segmentable patient signal |
| CN101268938A (en) | 2008-04-30 | 2008-09-24 | 董军 | Method and apparatus for electrocardiogram recognition and specification |
| US20100030302A1 (en) | 2008-07-30 | 2010-02-04 | Medtronic, Inc. | Method for displaying trended data retrieved from a medical device |
| US20100076331A1 (en) | 2008-09-24 | 2010-03-25 | Hsiao-Lung Chan | Device and Method for Measuring Three-Lead ECG in a Wristwatch |
| US20110257548A1 (en) | 2008-12-30 | 2011-10-20 | Koninklijke Philips Electronics N.V. | Method and system for processing heart sound signals |
| US20100268103A1 (en) | 2009-04-16 | 2010-10-21 | Cardionet, Inc. | Cardiac Arrhythmia Report |
| US9339202B2 (en) | 2009-11-03 | 2016-05-17 | Vivaquant Llc | System for processing physiological data |
| US20140005988A1 (en) | 2009-11-03 | 2014-01-02 | Marina Brockway | Physiological signal denoising |
| CN101766484A (en) | 2010-01-18 | 2010-07-07 | 董军 | Method and equipment for identification and classification of electrocardiogram |
| US20110184297A1 (en) | 2010-01-26 | 2011-07-28 | Stmicroelectronics S.R.L. | Method and device for estimating morphological features of heart beats |
| CN102188240A (en) | 2010-03-05 | 2011-09-21 | 华东师范大学 | Electrocardiographic data sampling method and device |
| WO2011115576A2 (en) | 2010-03-15 | 2011-09-22 | Singapore Health Services Pte Ltd | Method of predicting the survivability of a patient |
| US20140187988A1 (en) | 2010-03-15 | 2014-07-03 | Nanyang Technological University | Method of predicting acute cardiopulmonary events and survivability of a patient |
| US9295429B2 (en) | 2010-03-15 | 2016-03-29 | Singapore Health Services Pte Ltd. | Predicting acute cardiopulmonary events and survivability of a patient |
| US20110224565A1 (en) | 2010-03-15 | 2011-09-15 | Singapore Health Services Pte Ltd. | Method of predicting acute cardiopulmonary events and survivability of a patient |
| EP2534597A2 (en) | 2010-03-15 | 2012-12-19 | Singapore Health Services Pte Ltd | Method of predicting the survivability of a patient |
| CN103038772A (en) | 2010-03-15 | 2013-04-10 | 新加坡保健服务集团有限公司 | Methods of Predicting Patient Survivability |
| US8951193B2 (en) | 2010-03-15 | 2015-02-10 | Singapore Health Services Pte Ltd. | Method of predicting acute cardiopulmonary events and survivability of a patient |
| US8668644B2 (en) | 2010-03-15 | 2014-03-11 | Singapore Health Services Pte Ltd. | Method of predicting acute cardiopulmonary events and survivability of a patient |
| JP2013524865A (en) | 2010-03-15 | 2013-06-20 | シンガポール ヘルス サービシーズ ピーティーイー リミテッド | How to predict patient survival |
| EP2534597B1 (en) | 2010-03-15 | 2018-10-17 | Singapore Health Services Pte Ltd | Method of predicting the survivability of a patient |
| US9420957B2 (en) | 2010-03-15 | 2016-08-23 | Singapore Health Services Pte Ltd. | System and method for predicting acute cardiopulmonary events and survivability of a patient |
| US20130237776A1 (en) | 2010-03-15 | 2013-09-12 | Nanyang Technological University | Method of predicting acute cardiopulmonary events and survivability of a patient |
| US8932220B2 (en) | 2010-03-15 | 2015-01-13 | Singapore Health Services Pte Ltd. | Method of predicting acute cardiopulmonary events and survivability of a patient |
| US20150223759A1 (en)* | 2010-03-15 | 2015-08-13 | Singapore Health Services Pte Ltd. | Predicting acute cardiopulmonary events and survivability of a patient |
| US20110282225A1 (en) | 2010-05-12 | 2011-11-17 | Medtronic, Inc. | Techniques for reviewing and analyzing implantable medical device system data |
| US20180020939A1 (en) | 2010-06-08 | 2018-01-25 | Alivecor, Inc. | Two electrode apparatus and methods for twelve lead ecg |
| US20110301435A1 (en) | 2010-06-08 | 2011-12-08 | AliveUSA LLC | Heart Monitoring System Usable With A Smartphone or Computer |
| US20160235319A1 (en) | 2010-06-08 | 2016-08-18 | Alivecor, Inc. | Two electrode apparatus and methods for twelve lead ecg |
| US20140228665A1 (en) | 2010-06-08 | 2014-08-14 | Alivecor, Inc. | Two Electrode Apparatus and Methods for Twelve Lead ECG |
| US20180146875A1 (en) | 2010-07-14 | 2018-05-31 | Mayo Foundation For Medical Education And Research | Non-Invasive Monitoring of Physiological Conditions |
| US20130184599A1 (en) | 2010-07-14 | 2013-07-18 | Mayo Foundation For Medical Education And Research | Non-invasive monitoring of physiological conditions |
| US20150105640A1 (en) | 2010-07-14 | 2015-04-16 | Mayo Foundation For Medical Education And Research | Non-invasive monitoring of physiological conditions |
| US20160183829A1 (en) | 2010-07-14 | 2016-06-30 | Mayo Foundation For Medical Education And Research | Non-invasive monitoring of physiological conditions |
| US20120110226A1 (en) | 2010-11-02 | 2012-05-03 | Cardionet, Inc. | Medical data collection apparatus |
| US20140148714A1 (en) | 2010-12-20 | 2014-05-29 | Ecole Polytechnique Federale De Lausanne (Epfl) | Automatic online delineation of a multi-lead electrocardiogram bio signal |
| US20120203491A1 (en) | 2011-02-03 | 2012-08-09 | Nokia Corporation | Method and apparatus for providing context-aware control of sensors and sensor data |
| US20150051505A1 (en) | 2011-02-23 | 2015-02-19 | Stmicroelectronics S.R.L. | Device for measuring impedance of biologic tissues including an alternating current (ac) coupled voltage-to-current converter |
| WO2012140559A1 (en) | 2011-04-11 | 2012-10-18 | Medic4All Ag | Pulse oximetry measurement triggering ecg measurement |
| US20120278099A1 (en) | 2011-04-26 | 2012-11-01 | Cerner Innovation, Inc. | Monitoring, capturing, measuring and annotating physiological waveform data |
| US20140188770A1 (en) | 2011-05-10 | 2014-07-03 | Foteini Agrafioti | System and method for enabling continuous or instantaneous identity recognition based on physiological biometric signals |
| CN102379694A (en) | 2011-10-12 | 2012-03-21 | 中国科学院苏州纳米技术与纳米仿生研究所 | Electrocardiogram R wave detection method |
| US20130116585A1 (en) | 2011-11-07 | 2013-05-09 | Cardionet, Inc. | Ventricular Fibrillation Detection |
| US20150008802A1 (en) | 2012-01-31 | 2015-01-08 | Kodenshi Corporation | Encoder sensor mounting body, drum disk encoder, and motor with encoder using same |
| US20150088024A1 (en) | 2012-03-19 | 2015-03-26 | University Of Florida Research Foundation, Inc. | Methods and systems for brain function analysis |
| US8903479B2 (en) | 2012-06-19 | 2014-12-02 | Texas Instruments Incorporated | Real time QRS duration measurement in electrocardiogram |
| US20140107493A1 (en) | 2012-06-22 | 2014-04-17 | Fitbit, Inc. | Portable Biometric Monitoring Devices and Methods of Operating Same |
| CN102779234A (en) | 2012-06-28 | 2012-11-14 | 中国科学院苏州纳米技术与纳米仿生研究所 | Electrocardiogram classified processing method and device |
| US20140073486A1 (en) | 2012-09-04 | 2014-03-13 | Bobo Analytics, Inc. | Systems, devices and methods for continuous heart rate monitoring and interpretation |
| US20160367187A1 (en) | 2012-09-04 | 2016-12-22 | Whoop, Inc. | Interface for removable wrist device |
| US20150248534A1 (en) | 2012-09-18 | 2015-09-03 | Draeger Medical Systems, Inc. | System And Method Of Generating A User Interface Display Of Patient Parameter Data |
| US20150282726A1 (en) | 2012-10-26 | 2015-10-08 | Koninklijke Philips N.V. | Diagnostic representation and interpretation of ecg leads on a digital display |
| US9254095B2 (en) | 2012-11-08 | 2016-02-09 | Alivecor | Electrocardiogram signal detection |
| US20140128758A1 (en) | 2012-11-08 | 2014-05-08 | Conner Daniel Cross Galloway | Electrocardiogram signal detection |
| US20160249823A1 (en) | 2012-11-08 | 2016-09-01 | Alivecor, Inc. | Electrocardiogram signal detection |
| US20180289274A1 (en) | 2013-01-24 | 2018-10-11 | Irhythm Technologies, Inc. | Physiological monitoring device |
| CN103110417A (en) | 2013-02-28 | 2013-05-22 | 华东师范大学 | Automatic electrocardiogram recognition system |
| US20140275840A1 (en) | 2013-03-15 | 2014-09-18 | Flint Hills Scientific, L.L.C. | Pathological state detection using dynamically determined body data variability range values |
| US20140330147A1 (en) | 2013-05-03 | 2014-11-06 | Medtronic, Inc. | Electrogram summary |
| CN103284702A (en) | 2013-06-17 | 2013-09-11 | 中国科学院苏州纳米技术与纳米仿生研究所 | Electrocardiogram and pulse wave relation analysis method and method and device of fusion analysis |
| US20160242665A1 (en) | 2013-07-10 | 2016-08-25 | Alivecor, Inc. | Devices and methods for real-time denoising of electrocardiograms |
| US20150018702A1 (en) | 2013-07-10 | 2015-01-15 | Alivecor, Inc. | Devices and Methods for Real-Time Denoising of Electrocardiograms |
| US20190117068A1 (en) | 2013-07-11 | 2019-04-25 | Alivecor, Inc. | Apparatus for coupling to computing devices and measuring physiological data |
| US20160192850A1 (en) | 2013-08-13 | 2016-07-07 | Koninklijke Philips N.V. | Method and display for long term physiological signal quality indication |
| KR20150020955A (en) | 2013-08-19 | 2015-02-27 | 광운대학교 산학협력단 | Method of classifing heart condition using neural network, and apparatus thereof |
| US20180344189A1 (en) | 2013-08-26 | 2018-12-06 | Apple Inc. | Method of detecting the wearing limb of a wearable electronic device |
| CN103417209A (en) | 2013-08-29 | 2013-12-04 | 中国科学院苏州纳米技术与纳米仿生研究所 | Electrocardiogram characteristic selecting method |
| US9808206B1 (en) | 2013-09-09 | 2017-11-07 | Scanadu, Inc. | Data acquisition quality and data fusion for personal portable wireless vital signs scanner |
| US10172534B2 (en) | 2013-09-25 | 2019-01-08 | Bardy Diagnostics, Inc. | Remote interfacing electrocardiography patch |
| US10111601B2 (en) | 2013-09-25 | 2018-10-30 | Bardy Diagnostics, Inc. | Extended wear electrocardiography monitor optimized for capturing low amplitude cardiac action potential propagation |
| US20200060563A1 (en) | 2013-09-25 | 2020-02-27 | Bardy Diagnostics, Inc. | System and method for classifier-based atrial fibrillation detection with the aid of a digital computer |
| US20190357794A1 (en) | 2013-09-25 | 2019-11-28 | Bardy Diagnostics, Inc. | System and method for facilitating a cardiac rhythm disorder diagnosis with the aid of a digital computer |
| US20190133486A1 (en) | 2013-09-25 | 2019-05-09 | Bardy Diagnostics, Inc. | Remote Interfacing Electrocardiography Patch |
| US9345414B1 (en) | 2013-09-25 | 2016-05-24 | Bardy Diagnostics, Inc. | Method for providing dynamic gain over electrocardiographic data with the aid of a digital computer |
| US20190133444A1 (en) | 2013-09-25 | 2019-05-09 | Bardy Diagnostics, Inc. | Computer-Implemented System And Method For Providing A Personal Mobile Device-Triggered Medical Intervention |
| US20160150989A1 (en) | 2013-09-25 | 2016-06-02 | Bardy Diagnostics, Inc. | Method For Efficiently Encoding And Compressing ECG Data Optimized For Use In An Ambulatory ECG Monitor |
| US9364155B2 (en) | 2013-09-25 | 2016-06-14 | Bardy Diagnostics, Inc. | Self-contained personal air flow sensing monitor |
| US10278606B2 (en) | 2013-09-25 | 2019-05-07 | Bardy Diagnostics, Inc. | Ambulatory electrocardiography monitor optimized for capturing low amplitude cardiac action potential propagation |
| US10278603B2 (en) | 2013-09-25 | 2019-05-07 | Bardy Diagnostics, Inc. | System and method for secure physiological data acquisition and storage |
| US10271756B2 (en) | 2013-09-25 | 2019-04-30 | Bardy Diagnostics, Inc. | Monitor recorder optimized for electrocardiographic signal processing |
| US10271755B2 (en) | 2013-09-25 | 2019-04-30 | Bardy Diagnostics, Inc. | Method for constructing physiological electrode assembly with sewn wire interconnects |
| US20190117107A1 (en) | 2013-09-25 | 2019-04-25 | Bardy Diagnostics, Inc. | Extended Wear Electrocardiography Patch With Wire Interconnects |
| US9408545B2 (en) | 2013-09-25 | 2016-08-09 | Bardy Diagnostics, Inc. | Method for efficiently encoding and compressing ECG data optimized for use in an ambulatory ECG monitor |
| US20190117099A1 (en) | 2013-09-25 | 2019-04-25 | Bardy Diagnostics, Inc. | System And Method For Secure Cloud-Based Physiological Data Processing And Delivery |
| US10264992B2 (en) | 2013-09-25 | 2019-04-23 | Bardy Diagnostics, Inc. | Extended wear sewn electrode electrocardiography monitor |
| US10265015B2 (en) | 2013-09-25 | 2019-04-23 | Bardy Diagnostics, Inc. | Monitor recorder optimized for electrocardiography and respiratory data acquisition and processing |
| US20190104961A1 (en) | 2013-09-25 | 2019-04-11 | Bardy Diagnostics, Inc. | Extended Wear Ambulatory Electrocardiography And Physiological Sensor Monitor |
| US10251575B2 (en) | 2013-09-25 | 2019-04-09 | Bardy Diagnostics, Inc. | Wearable electrocardiography and physiology monitoring ensemble |
| US9433367B2 (en) | 2013-09-25 | 2016-09-06 | Bardy Diagnostics, Inc. | Remote interfacing of extended wear electrocardiography and physiological sensor monitor |
| US9433380B1 (en) | 2013-09-25 | 2016-09-06 | Bardy Diagnostics, Inc. | Extended wear electrocardiography patch |
| US10251576B2 (en) | 2013-09-25 | 2019-04-09 | Bardy Diagnostics, Inc. | System and method for ECG data classification for use in facilitating diagnosis of cardiac rhythm disorders with the aid of a digital computer |
| US20190099105A1 (en) | 2013-09-25 | 2019-04-04 | Bardy Diagnostics, Inc. | Self-Expiring Electrocardiography And Physiological Sensor Monitor |
| US20160262646A1 (en) | 2013-09-25 | 2016-09-15 | Bardy Diagnostics, Inc. | System and Method for Electrocardiographic Data Signal Gain Determination With the Aid of A Digital Computer |
| US20190090769A1 (en) | 2013-09-25 | 2019-03-28 | Bardy Diagnostics, Inc. | System and method for machine-learning-based atrial fibrillation detection |
| US20190069794A1 (en) | 2013-09-25 | 2019-03-07 | Bardy Diagnostics, Inc. | System and method for facilitating a cardiac rhythm disorder diagnosis based on subcutaneous cardiac monitoring data |
| US20190069798A1 (en) | 2013-09-25 | 2019-03-07 | Bardy Diagnostics, Inc. | Subcutaneous insertable electrocardiography monitor |
| US20160345909A1 (en) | 2013-09-25 | 2016-12-01 | Bardy Diagnostics, Inc. | Monitor Recorder-Implemented Method for Electrocardiography Value Encoding and Compression |
| US20160345854A1 (en) | 2013-09-25 | 2016-12-01 | Bardy Diagnostics, Inc. | System And Method For Facilitating A Cardiac Rhythm Disorder Diagnosis With The Aid Of A Digital Computer |
| US20190069800A1 (en) | 2013-09-25 | 2019-03-07 | Bardy Diagnostics, Inc. | Subcutaneous insertable cardiac monitor optimized for long term, low amplitude electrocardiographic data collection |
| US9545204B2 (en) | 2013-09-25 | 2017-01-17 | Bardy Diagnostics, Inc. | Extended wear electrocardiography patch |
| US9545228B2 (en) | 2013-09-25 | 2017-01-17 | Bardy Diagnostics, Inc. | Extended wear electrocardiography and respiration-monitoring patch |
| US10165946B2 (en) | 2013-09-25 | 2019-01-01 | Bardy Diagnostics, Inc. | Computer-implemented system and method for providing a personal mobile device-triggered medical intervention |
| US9554715B2 (en) | 2013-09-25 | 2017-01-31 | Bardy Diagnostics, Inc. | System and method for electrocardiographic data signal gain determination with the aid of a digital computer |
| US10154793B2 (en) | 2013-09-25 | 2018-12-18 | Bardy Diagnostics, Inc. | Extended wear electrocardiography patch with wire contact surfaces |
| US20180353071A1 (en) | 2013-09-25 | 2018-12-13 | Bardy Diagnostics, Inc. | System And Method For Applying A Uniform Dynamic Gain Over Cardiac Data With The Aid Of A Digital Computer |
| US20180344191A1 (en) | 2013-09-25 | 2018-12-06 | Bardy Diagnostics, Inc. | System And Method For Facilitating A Cardiac Rhythm Disorder Diagnosis With The Aid Of A Digital Computer |
| US9615763B2 (en) | 2013-09-25 | 2017-04-11 | Bardy Diagnostics, Inc. | Ambulatory electrocardiography monitor recorder optimized for capturing low amplitude cardiac action potential propagation |
| US9619660B1 (en) | 2013-09-25 | 2017-04-11 | Bardy Diagnostics, Inc. | Computer-implemented system for secure physiological data collection and processing |
| US20150088020A1 (en) | 2013-09-25 | 2015-03-26 | Bardy Diagnostics, Inc. | System and Method For Interactive Processing Of ECG Data |
| US20180296118A1 (en) | 2013-09-25 | 2018-10-18 | Bardy Diagnostics, Inc. | Extended wear electrocardiography patch |
| US10052022B2 (en) | 2013-09-25 | 2018-08-21 | Bardy Diagnostics, Inc. | System and method for providing dynamic gain over non-noise electrocardiographic data with the aid of a digital computer |
| US9642537B2 (en) | 2013-09-25 | 2017-05-09 | Bardy Diagnostics, Inc. | Ambulatory extended-wear electrocardiography and syncope sensor monitor |
| US20170135579A1 (en) | 2013-09-25 | 2017-05-18 | Bardy Diagnostics, Inc | Ambulatory Rescalable Encoding Monitor Recorder |
| US9655538B2 (en) | 2013-09-25 | 2017-05-23 | Bardy Diagnostics, Inc. | Self-authenticating electrocardiography monitoring circuit |
| US9655537B2 (en) | 2013-09-25 | 2017-05-23 | Bardy Diagnostics, Inc. | Wearable electrocardiography and physiology monitoring ensemble |
| US10045709B2 (en) | 2013-09-25 | 2018-08-14 | Bardy Diagnostics, Inc. | System and method for facilitating a cardiac rhythm disorder diagnosis with the aid of a digital computer |
| US20180206752A1 (en) | 2013-09-25 | 2018-07-26 | Bardy Diagnostics, Inc. | System And Method For ECG Data Classification For Use In Facilitating Diagnosis Of Cardiac Rhythm Disorders With The Aid Of A Digital Computer |
| US20180177423A1 (en) | 2013-09-25 | 2018-06-28 | Bardy Diagnostics, Inc. | Electrocardiography patch |
| US9700227B2 (en) | 2013-09-25 | 2017-07-11 | Bardy Diagnostics, Inc. | Ambulatory electrocardiography monitoring patch optimized for capturing low amplitude cardiac action potential propagation |
| US10004415B2 (en) | 2013-09-25 | 2018-06-26 | Bardy Diagnostics, Inc. | Extended wear electrocardiography patch |
| US9717432B2 (en) | 2013-09-25 | 2017-08-01 | Bardy Diagnostics, Inc. | Extended wear electrocardiography patch using interlaced wire electrodes |
| US9717433B2 (en) | 2013-09-25 | 2017-08-01 | Bardy Diagnostics, Inc. | Ambulatory electrocardiography monitoring patch optimized for capturing low amplitude cardiac action potential propagation |
| US9730641B2 (en) | 2013-09-25 | 2017-08-15 | Bardy Diagnostics, Inc. | Monitor recorder-implemented method for electrocardiography value encoding and compression |
| US9730593B2 (en) | 2013-09-25 | 2017-08-15 | Bardy Diagnostics, Inc. | Extended wear ambulatory electrocardiography and physiological sensor monitor |
| US9737224B2 (en) | 2013-09-25 | 2017-08-22 | Bardy Diagnostics, Inc. | Event alerting through actigraphy embedded within electrocardiographic data |
| US9737211B2 (en) | 2013-09-25 | 2017-08-22 | Bardy Diagnostics, Inc. | Ambulatory rescalable encoding monitor recorder |
| US20170238833A1 (en) | 2013-09-25 | 2017-08-24 | Bardy Diagnostics, Inc. | Electrocardiography And Syncope Monitor Recorder |
| US20170251948A1 (en) | 2013-09-25 | 2017-09-07 | Bardy Diagnostics, Inc. | Self-authenticating electrocardiography monitoring circuit |
| US20170258358A1 (en) | 2013-09-25 | 2017-09-14 | Bardy Diagnostics, Inc | Extended wear electrocardiography and physiological sensor monitor |
| US9775536B2 (en) | 2013-09-25 | 2017-10-03 | Bardy Diagnostics, Inc. | Method for constructing a stress-pliant physiological electrode assembly |
| US9955885B2 (en) | 2013-09-25 | 2018-05-01 | Bardy Diagnostics, Inc. | System and method for physiological data processing and delivery |
| US9955888B2 (en) | 2013-09-25 | 2018-05-01 | Bardy Diagnostics, Inc. | Ambulatory electrocardiography monitor recorder optimized for internal signal processing |
| US9955911B2 (en) | 2013-09-25 | 2018-05-01 | Bardy Diagnostics, Inc. | Electrocardiography and respiratory monitor recorder |
| US9820665B2 (en) | 2013-09-25 | 2017-11-21 | Bardy Diagnostics, Inc. | Remote interfacing of extended wear electrocardiography and physiological sensor monitor |
| US20170340290A1 (en) | 2013-09-25 | 2017-11-30 | Bardy Diagnostics, Inc. | Monitor recorder-implemented method for electrocardiography data compression |
| US20170340206A1 (en) | 2013-09-25 | 2017-11-30 | Bardy Diagnostics, Inc | System And Method For Providing Dynamic Gain Over Non-noise Electrocardiographic Data With The Aid Of A Digital Computer |
| US9901274B2 (en) | 2013-09-25 | 2018-02-27 | Bardy Diagnostics, Inc. | Electrocardiography patch |
| US20170367609A1 (en) | 2013-09-25 | 2017-12-28 | Bardy Diagnostics, Inc. | Electrocardiography And Actigraphy Monitoring System |
| US20150119725A1 (en) | 2013-10-25 | 2015-04-30 | Qualcomm Incorporated | System and method for obtaining bodily function measurements using a mobile device |
| USD744659S1 (en) | 2013-11-07 | 2015-12-01 | Bardy Diagnostics, Inc. | Extended wear electrode patch |
| USD831833S1 (en) | 2013-11-07 | 2018-10-23 | Bardy Diagnostics, Inc. | Extended wear electrode patch |
| USD717955S1 (en) | 2013-11-07 | 2014-11-18 | Bardy Diagnostics, Inc. | Electrocardiography monitor |
| USD801528S1 (en) | 2013-11-07 | 2017-10-31 | Bardy Diagnostics, Inc. | Electrocardiography monitor |
| USD838370S1 (en) | 2013-11-07 | 2019-01-15 | Bardy Diagnostics, Inc. | Electrocardiography monitor |
| US20160192853A1 (en) | 2013-11-14 | 2016-07-07 | Bardy Diagnostics, Inc. | System and Method for Facilitating Diagnosis of Cardiac Rhythm Disorders with the Aid of a Digital Computer |
| US9408551B2 (en) | 2013-11-14 | 2016-08-09 | Bardy Diagnostics, Inc. | System and method for facilitating diagnosis of cardiac rhythm disorders with the aid of a digital computer |
| US20190038149A1 (en) | 2013-12-12 | 2019-02-07 | Alivecor, Inc. | Methods and systems for arrhythmia tracking and scoring |
| US20190104951A1 (en) | 2013-12-12 | 2019-04-11 | Alivecor, Inc. | Continuous monitoring of a user's health with a mobile device |
| US20150164349A1 (en) | 2013-12-12 | 2015-06-18 | Alivecor, Inc. | Methods and systems for arrhythmia tracking and scoring |
| US9241650B2 (en) | 2013-12-15 | 2016-01-26 | Lifewatch Technologies Ltd. | Patient specific QRS complex classification for arrhythmia detection |
| US20150238151A1 (en) | 2014-02-25 | 2015-08-27 | General Electric Company | System and method for perfusion-based arrhythmia alarm evaluation |
| US20150257668A1 (en) | 2014-03-11 | 2015-09-17 | Ecole Polytechnique Federale De Lausanne (Epfl) | Method for detecting abnormalities in an electrocardiogram |
| US9468386B2 (en) | 2014-03-11 | 2016-10-18 | Ecole polytechnique fédérale de Lausanne (EPFL) | Method for detecting abnormalities in an electrocardiogram |
| US20170014037A1 (en) | 2014-04-02 | 2017-01-19 | Koninklijke Philips N.V. | System and method for detecting variation of heart rate of a user |
| CN104970789A (en) | 2014-04-04 | 2015-10-14 | 中国科学院苏州纳米技术与纳米仿生研究所 | Electrocardiogram classification method and system |
| US20150289112A1 (en) | 2014-04-04 | 2015-10-08 | Mayo Foundation For Medical Education And Research | Identification of a subject in a facility |
| US20180028144A1 (en) | 2014-06-05 | 2018-02-01 | Guangren CHEN | Electronic Acoustic Stethoscope with ECG |
| US20160051157A1 (en) | 2014-08-22 | 2016-02-25 | Apple Inc. | Frequency domain projection algorithm |
| US20160058318A1 (en) | 2014-09-02 | 2016-03-03 | The Regents Of The University Of Michigan | Electrocardiogram Data Analysis Method for Rapid Diagnosis |
| US20160085927A1 (en) | 2014-09-18 | 2016-03-24 | Preventice, Inc. | Dynamically adaptive care plans |
| US20160085937A1 (en) | 2014-09-18 | 2016-03-24 | Preventice, Inc. | Care plan administration using thresholds |
| US20160086297A1 (en) | 2014-09-18 | 2016-03-24 | Preventice, Inc. | Creating individually tailored care plans |
| US20160098536A1 (en) | 2014-10-07 | 2016-04-07 | Preventice, Inc. | Care plan administration: patient feedback |
| US20160098538A1 (en) | 2014-10-07 | 2016-04-07 | Preventice, Inc. | Care plan administration |
| US20160098537A1 (en) | 2014-10-07 | 2016-04-07 | Preventice, Inc. | Derived observations in care plan administration |
| US20200118673A1 (en) | 2014-10-07 | 2020-04-16 | Preventice Solutions, Inc. | Care plan administration |
| US20180374576A1 (en) | 2014-10-07 | 2018-12-27 | Preventice Technologies, Inc | Care plan administration |
| US20170188872A1 (en) | 2014-10-31 | 2017-07-06 | Irhythm Technologies, Inc. | Wearable monitor |
| US20180242876A1 (en) | 2014-10-31 | 2018-08-30 | Irhythm Technologies, Inc. | Wearable monitor with arrhythmia burden evaluation |
| US20200289014A1 (en) | 2014-10-31 | 2020-09-17 | Irhythm Technologies, Inc. | Wearable monitor |
| US20190274574A1 (en) | 2014-10-31 | 2019-09-12 | Irhythm Technologies, Inc. | Wearable monitor |
| US20160135706A1 (en) | 2014-11-14 | 2016-05-19 | Zoll Medical Corporation | Medical Premonitory Event Estimation |
| CN104463326A (en) | 2014-12-09 | 2015-03-25 | 浙江大学 | Standard 12-lead ecg signal reconstruction method |
| US20160183827A1 (en) | 2014-12-31 | 2016-06-30 | General Electric Company | Method and apparatus for comparing and visualizing serial ecg data |
| WO2016110804A1 (en) | 2015-01-06 | 2016-07-14 | David Burton | Mobile wearable monitoring systems |
| WO2016145392A1 (en) | 2015-03-12 | 2016-09-15 | Bardy Diagnostics, Inc. | Display arrangement for diagnosis of cardiac rhythm disorders |
| US20190267139A1 (en) | 2015-04-06 | 2019-08-29 | Preventice Solutions, Inc. | Adverse event prioritization and handling |
| US20160321430A1 (en) | 2015-04-28 | 2016-11-03 | Preventice Technologies, Inc. | User interface displaying a temporal relationship between a health event indicator and monitored health conditions |
| US20200237317A1 (en) | 2015-07-19 | 2020-07-30 | Sanmina Corporation | System and method of a biosensor for detection of health parameters |
| USD793566S1 (en) | 2015-09-10 | 2017-08-01 | Bardy Diagnostics, Inc. | Extended wear electrode patch |
| USD766447S1 (en) | 2015-09-10 | 2016-09-13 | Bardy Diagnostics, Inc. | Extended wear electrode patch |
| EP3144851A1 (en) | 2015-09-18 | 2017-03-22 | Panasonic Intellectual Property Corporation of America | Image recognition method |
| US9504423B1 (en) | 2015-10-05 | 2016-11-29 | Bardy Diagnostics, Inc. | Method for addressing medical conditions through a wearable health monitor with the aid of a digital computer |
| US9788722B2 (en) | 2015-10-05 | 2017-10-17 | Bardy Diagnostics, Inc. | Method for addressing medical conditions through a wearable health monitor with the aid of a digital computer |
| US9936875B2 (en) | 2015-10-05 | 2018-04-10 | Bardy Diagnostics, Inc. | Health monitoring apparatus for initiating a treatment of a patient with the aid of a digital computer |
| US20190076023A1 (en) | 2015-10-05 | 2019-03-14 | Bardy Diagnostics, Inc. | Health monitoring apparatus for initiating a treatment of a patient based on physiological data with the aid of a digital computer |
| US10123703B2 (en) | 2015-10-05 | 2018-11-13 | Bardy Diagnostics, Inc. | Health monitoring apparatus with wireless capabilities for initiating a patient treatment with the aid of a digital computer |
| US20170095153A1 (en) | 2015-10-05 | 2017-04-06 | Bardy Diagnostics, Inc. | Method For Addressing Medical Conditions Through A Wearable Health Monitor With The Aid Of A Digital Computer |
| US20170098047A1 (en) | 2015-10-06 | 2017-04-06 | General Electric Company | System and method for clinical decision support |
| US20170105683A1 (en) | 2015-10-16 | 2017-04-20 | General Electric Company | System and method of adaptive interpretation of ecg waveforms |
| US20210000365A1 (en) | 2015-10-27 | 2021-01-07 | Cardiologs Technologies Sas | Automatic method to delineate or categorize an electrocardiogram |
| US20190167143A1 (en) | 2015-10-27 | 2019-06-06 | Cardiologs Technologies Sas | Electrocardiogram processing system for delineation and classification |
| US10426364B2 (en) | 2015-10-27 | 2019-10-01 | Cardiologs Technologies Sas | Automatic method to delineate or categorize an electrocardiogram |
| US10779744B2 (en) | 2015-10-27 | 2020-09-22 | Cardiologs Technologies Sas | Automatic method to delineate or categorize an electrocardiogram |
| US20170112401A1 (en)* | 2015-10-27 | 2017-04-27 | CardioLogs Technologies | Automatic method to delineate or categorize an electrocardiogram |
| US11134880B2 (en) | 2015-10-27 | 2021-10-05 | Cardiologs Technologies Sas | Automatic method to delineate or categorize an electrocardiogram |
| US10758139B2 (en) | 2015-10-27 | 2020-09-01 | Cardiologs Technologies Sas | Automatic method to delineate or categorize an electrocardiogram |
| US10959660B2 (en) | 2015-10-27 | 2021-03-30 | Cardiologs Technologies Sas | Electrocardiogram processing system for delineation and classification |
| WO2020161605A1 (en) | 2015-10-27 | 2020-08-13 | Cardiologs Technologies Sas | Electrocardiogram processing system for delineation and classification |
| US20190223739A1 (en) | 2015-10-27 | 2019-07-25 | Cardiologs Technologies Sas | An automatic method to delineate or categorize an electrocardiogram |
| US11147500B2 (en) | 2015-10-27 | 2021-10-19 | Cardiologs Technologies Sas | Electrocardiogram processing system for delineation and classification |
| US11331034B2 (en) | 2015-10-27 | 2022-05-17 | Cardiologs Technologies Sas | Automatic method to delineate or categorize an electrocardiogram |
| WO2017072250A1 (en) | 2015-10-27 | 2017-05-04 | CardioLogs Technologies | An automatic method to delineate or categorize an electrocardiogram |
| US20200015694A1 (en) | 2015-10-27 | 2020-01-16 | Cardiologs Technologies Sas | Automatic method to delineate or categorize an electrocardiogram |
| US20170177811A1 (en) | 2015-12-17 | 2017-06-22 | Preventice Technologies, Inc. | Patient care systems employing control devices to identify and configure sensor devices for patients |
| US20170357764A1 (en) | 2016-06-13 | 2017-12-14 | Medical Informatics Corporation | User interface for displaying patient historical data |
| US20180060522A1 (en) | 2016-08-31 | 2018-03-01 | Alivecor, Inc. | Devices, systems, and methods for physiology monitoring |
| US20200273567A1 (en) | 2016-08-31 | 2020-08-27 | Alivecor, Inc. | Devices, systems, and methods for physiology monitoring |
| CN106778685A (en) | 2017-01-12 | 2017-05-31 | 司马大大(北京)智能系统有限公司 | Electrocardiogram image-recognizing method, device and service terminal |
| US20180279956A1 (en) | 2017-03-28 | 2018-10-04 | Apple Inc. | Detecting conditions using heart rate sensors |
| US20180310892A1 (en) | 2017-05-01 | 2018-11-01 | Cardiac Pacemakers, Inc. | Systems and methods for medical alert management |
| US20190034050A1 (en) | 2017-05-15 | 2019-01-31 | Apple Inc. | Displaying a scrollable list of affordances associated with physical activities |
| US20180368715A1 (en) | 2017-06-23 | 2018-12-27 | General Electric Company | System and Method for Detecting Atrial Fibrillation |
| US20200022604A1 (en) | 2017-08-25 | 2020-01-23 | Cardiologs Technologies Sas | User interface for analysis of electrocardiograms |
| WO2019038435A1 (en) | 2017-08-25 | 2019-02-28 | Cardiologs Technologies Sas | User interface for analysis of electrocardiograms |
| US20190059763A1 (en) | 2017-08-25 | 2019-02-28 | Cambridge Heartwear Limited | Method of detecting abnormalities in ecg signals |
| US20200397313A1 (en) | 2017-10-06 | 2020-12-24 | Mayo Foundation For Medical Education And Research | Ecg-based cardiac ejection-fraction screening |
| US20200297286A1 (en) | 2017-10-13 | 2020-09-24 | Autem Medical, Llc | System for characterization, diagnosis, and treatment of a health condition of a patient and microtubule conductivity, and methods of using same |
| US20200242763A1 (en) | 2017-10-13 | 2020-07-30 | iHealthScreen Inc. | Image based screening system for prediction of individual at risk of late age-related macular degeneration (amd) |
| WO2019089830A1 (en) | 2017-10-31 | 2019-05-09 | Apple, Inc. | Monitoring system for assessing control of a disease state |
| US20190133483A1 (en) | 2017-11-07 | 2019-05-09 | General Electric Company | System and Method for Processing ECG Recordings from Multiple Patients |
| US20200289033A1 (en) | 2017-11-21 | 2020-09-17 | Omniscient Medical As | System, sensor and method for monitoring health related aspects of a patient |
| US20190167141A1 (en) | 2017-12-06 | 2019-06-06 | General Electric Company | System and methods for qualification of ecg data for remote analysis |
| WO2019147180A1 (en) | 2018-01-25 | 2019-08-01 | Coala-Life Ab | Analysing electrocardiogram data from a remote portable sensor device |
| US20190259496A1 (en) | 2018-02-19 | 2019-08-22 | General Electric Company | System and method for processing ecg recordings from multiple patients for clinician overreading |
| US20190272920A1 (en) | 2018-03-02 | 2019-09-05 | Preventice Solutions, Inc. | Automated ventricular ectopic beat classification |
| US20190274563A1 (en) | 2018-03-12 | 2019-09-12 | Apple Inc. | User interfaces for health monitoring |
| US20190282118A1 (en) | 2018-03-19 | 2019-09-19 | General Electric Company | System and method for monitoring cardiac arrhythmias |
| US10827938B2 (en) | 2018-03-30 | 2020-11-10 | Cardiologs Technologies Sas | Systems and methods for digitizing electrocardiograms |
| US20190298204A1 (en) | 2018-03-30 | 2019-10-03 | Cardiologs Technologies Sas | Systems and methods for digitizing electrocardiograms |
| US20200022591A1 (en) | 2018-05-09 | 2020-01-23 | Biosig Technologies, Inc. | Systems and Methods for Performing Electrophysiology (EP) Signal Processing |
| US20210204859A1 (en) | 2018-05-31 | 2021-07-08 | Københavns Universitet | Cardiovascular implantable electronic device (cied) with cardiac event prediction |
| US20200013507A1 (en) | 2018-07-09 | 2020-01-09 | Preventice Technologies, Inc | Best fit content delivery in care plan environment |
| US20200029911A1 (en)* | 2018-07-24 | 2020-01-30 | Medtronic Monitoring, Inc. | System and method of patient monitoring and signal quality analysis |
| WO2020086865A1 (en) | 2018-10-26 | 2020-04-30 | Mayo Foundation For Medical Education And Research | Neural networks for atrial fibrillation screening |
| US20200155025A1 (en) | 2018-11-19 | 2020-05-21 | Preventice Technologies, Inc. | True onset identification |
| US20200178825A1 (en) | 2018-12-05 | 2020-06-11 | General Electric Company | System and method for identifying cardiac arrhythmias with deep neural networks |
| US20200205745A1 (en) | 2018-12-26 | 2020-07-02 | Analytics For Life Inc. | Methods and systems to configure and use neural networks in characterizing physiological systems |
| US10568570B1 (en) | 2019-02-14 | 2020-02-25 | Trungram Gyaltrul Sherpa | Methods and systems for providing a preferred fitness state of a user |
| US20200289063A1 (en) | 2019-03-11 | 2020-09-17 | Preventice Solutions, Inc. | Determining reliability for ecg data using signal-to-noise ratio |
| US10492730B1 (en) | 2019-03-11 | 2019-12-03 | Preventice Solutions, Inc. | Determining reliability for ECG data using signal-to-noise ratio |
| US20200401684A1 (en) | 2019-06-19 | 2020-12-24 | Preventice Solutions, Inc. | Login token management |
| US20210271847A1 (en) | 2019-06-25 | 2021-09-02 | Owkin Inc. | Systems and methods for image preprocessing |
| US20210000344A1 (en) | 2019-07-03 | 2021-01-07 | Bardy Diagnostics, Inc. | System and method for remote ecg data streaming in real-time |
| US20210076960A1 (en) | 2019-09-18 | 2021-03-18 | Tempus Labs | Ecg based future atrial fibrillation predictor systems and methods |
| US20210150693A1 (en) | 2019-11-15 | 2021-05-20 | Geisinger Clinic | Systems and methods for a deep neural network to enhance prediction of patient endpoints using videos of the heart |
Non-Patent Citations (79)
| Title |
|---|
| "Neural Nets and Noise Filtering", Dr. Dobb's Journal, pp. 32 (Jan. 1989). |
| Alfonso, et al., ECG Beat Detection Using Filter Banks, IEEE Transactions on Biomedical Engineering, 46(2):192-202 (Feb. 1999). |
| Almeida, et al., Multilead ECG Delineation Using Spatially Projected Leads From Wavelet Transform Loops, IEEE Transactions On Biomedical Engineering, 56(8):1996-2005 (Aug. 2009). |
| Artis, et al., Detection of Atrial Fibrillation Using Artificial Neural Networks, Proceedings Computers in Cardiology, pp. 173-176 (1991). |
| Attia, et al., An artificial intelligence-enabled ECG algorithm for the identification of patients with atrial fibrillation during sinus rhythm: a retrospective analysis of outcome prediction, The Lancet, 394(10201):861-867 (Sep. 2019). |
| Badilini, et al., ECGScan: A Method for Conversion of Paper Electrocardiogramtouts to Digital Electrocardiogramas, Journal of Electrocardiology, 38:310-318 (Oct. 2005). |
| Bishop, Pattern Recognition and Machine Learning, Springer, Information Science and Statistics, 2006, ISBN-10: 0-387-31073-8, New York, NY, USA. |
| Boichat, et al., Wavelet-Based ECG Delineation on a Wearable Embedded Sensor Platform, Proceedings of Wearable and Implantable Body Sensor Networks, 2009 Sixth International Workshop on Wearable and Implantable Body Sensor Networks, IEEE (pp. 256-261) (Jun. 2009) . |
| Chazal, et al., A Patient-Adapting Heartbeat Classifier Using ECG Morphology and Heartbeat Interval Features, IEEE Transactions on Biomedical Engineering, 53(12):2535-2543 (Dec. 2006). |
| Chazal, et al., Automatic Classification of Heartbeats Using ECG Morphology and Heartbeat Interval Features, IEEE Transactions on Biomedical Engineering, 51(7):1196-1206 (Jul. 2004). |
| Chebil, et al., A Novel Method for Digitizing Standard ECG Papers, Proceedings of the International Conference on Computer and Communication Engineering 2008, May 13-15, 2008, Kuala Lumpur, Malaysia (pp. 1308-1312). |
| Choi, et al., Development of ECG Beat Segmentation Method by Combining Lowpass Filter and Irregular R-R Interval Checkup Strategy, Expert Systems with Applications, 37:5208-5218 (Jul. 2010). |
| Christopoulos, et al., Artificial Intelligence-Electrocardiogramadict Incident Atrial Fibrillation—A Population-Based Study, Circulation: Arrhythmia and Electrophysiology, 13(12):e009355 (Dec. 2020). |
| Coast, et al., An Approach to Cardiac Arrhythmia Analysis Using Hidden Markov Models, IEEE transactions on biomedical engineering, 37(9):826-836 (Sep. 1990). |
| Cybenko, Approximation by Superpositions of a Sigmoidal Function, Mathematics of Control, Signals and Systems, 2(4):303-314 (Dec. 1989). |
| Donahue et al., Long-term Recurrent Convolutional Networks for Visual Recognition and Description, arXiv:1411.4389v3, (pp. 1-13) (Feb. 2015). |
| Dubois, et al., Automatic ECG Wave Extraction in Long-Term Recordings using Gaussian Mesa Function Models and Nonlinear Probability Estimators, Computer Methods and Programs in Biomedicine, 88:217-233 (Mar. 2007). |
| European Search Report dated Apr. 13, 2016 in EP Patent Appl. Serial No. 15191769.7 (0230). |
| Extended EP Search Report dated Apr. 12, 2021 in EP Patent Application Serial No. 20211449.2 (0431). |
| Extended European Search Report dated Jul. 20, 2021 in EP Patent Appl. Serial No. 21167613.5 (0331). |
| Extended European Search Report dated Oct. 15, 2018 in EP Patent Appl. Serial No. 18305376.8 (0530). |
| Fiorina, AI-Based Strategy Enables Faster Holter ECG Analysis With Equivalent Clinical Accuracy Compared to a Classical Strategy, EP Europace, vol. 22, Issue Supplement 1, Abstract 222 (Jun. 2020). |
| Fiorina, et al., Artificial Intelligence Based Platform Enables Faster Ambulatory Electrocardiogram Analysis With Equivalent Clinical Accuracy Compared to Traditional Solution, Circulation, vol. 140, Issue Suppl. 1, Abstract 9825 (Nov. 2019). |
| Fukushima., Neocognitron: A Self-organizing Neural Network Model for a Mechanism of Pattern Recognition Unaffected by Shift in Position, Biological Cybernetics, 36:193-202 (1980). |
| Hughes, et al., Markov Models for Automated ECG Interval Analysis, Proceedings of Neural Information Processing Systems, 2004, Oxford, UK, (pp. 611-618). |
| Ieva, et al., Multivariate Functional Clustering for the Morphological Analysis of Electrocardiogramal of the Royal Statistical Society: Series C (Applied Statistics), 62(3):401-418 (May 2013). |
| International Search Report & Written Opinion dated Aug. 1, 2019 in Int'l PCT Patent Appl. No. PCT/IB2019/052517 (0510). |
| International Search Report & Written Opinion dated Jan. 14, 2022 in Int'l PCT Patent Appl. Serial No. PCT/IB2021/0058958 (0910). |
| International Search Report & Written Opinion dated Jan. 24, 2017 in Int'l PCT Patent Appl. Serial No. PCT/EP2016/075972 (0310). |
| International Search Report & Written Opinion dated Jan. 31, 2022 in Int'l PCT Patent Appl. Serial No. PCT/IB2021/057341 (0810). |
| International Search Report & Written Opinion dated Jun. 4, 2020 in PCT Patent Appl. Serial No. PCT/IB2020/050850 (0710 PCT). |
| International Search Report & Written Opinion dated Nov. 21, 2018 in Int'l PCT Patent Appl. Serial No. PCT/EP2018/072912 (0410). |
| Jin, et al., Deep Learning Research on Clinical Electrocardiogram Analysis, Science China Press, 45(3):398-416 (2015), English abstract provided. |
| Johnson, et al., R-Peak Estimation using Multimodal Lead Switching, Computing in Cardiology 2014, IEEE, pp. 281-284 (Sep. 2014). |
| Kaur et al., Comparison of Different Approaches for Removal of Baseline Wander From ECG Signal, Proceedings of the International Conference & Workshop on Emerging Trends in Technology, (pp. 30-36) (Feb. 2011). |
| Kiranyaz, et al., Convolutional Neural Networks for Patient-Specific ECG Classification, 2015 37th Annual International Conference of the IEEE Engineering in Medicine and Biology Society (EMBC), IEEE (pp. 2608-2611) (Aug. 2015). |
| Kiranyaz, et al., Real-Time Patient-Specific ECG Classification by 1-D Convolutional Neural Networks, IEEE transactions on Biomedical Engineering, 63(3):664-675 (Aug. 2015). |
| Krizhevsky, et al., ImageNet Classification with Deep Convolutional Neural Networks, Advances in neural information processing systems, 25:1097-1105 (2012). |
| Laguna, et al., A Database for Evaluation of Algorithms for Measurement of QT and Other Waveform Intervals in the ECG, Computers in Cardiology 1997, 24:673-676. |
| Lecun, et al., Backpropagation Applied to Handwritten Zip Code Recognition, Neural Computation, 1(4):541-551 (Dec. 1989). |
| Li, et al., Deep neural networks Improve Atrial Fibrillation Detection in Holter: first results, European Journal of Preventive Cardiology, Abstract, 23 (2S) (Oct. 2016). |
| Li, et al., Detection of ECG Characteristic Points Using Wavelet Transforms, IEEE Transactions on Biomedical Engineering, 42(1):21-28 (Jan. 1995). |
| Lin et al., Beat-to-beat p. and T Wave Delineation in ECG Signals using a Marginalized Particle Filter, 2012 Proceedings of the 20th European Signal Processing Conference (EUSIPCO), (pp. 479-483) (Aug. 2012). |
| Lin et al., P- and T-Wave Delineation in ECG Signals Using a Bayesian Approach and a Partially Collapsed Gibbs Sampler, IEEE Transactions on Biomedical Engineering, 57(12):2840-2849 (Sep. 2010). |
| Lin, et al., P. and Twave Delineation And Waveform Estimation in ECG Signals Using a Block Gibbs Sampler, 2011 IEEE International Conference on Acoustics, Speech and Signal Processing (ICASSP), (pp. 479-483) (May 2011). |
| Long, et al., Fully Convolutional Networks for Semantic Segmentation, Proceedings of The IEEE Conference On Computer Vision and Pattern Recognition, (pp. 3431-3440) (2015). |
| Maille, et al., Smartwatch Electrocardiogram and Artificial Intelligence for Assessing Cardiac-Rhythm Safety of Drug Therapy in the COVID-19 Pandemic. The QT-logs study, International Journal of Cardiology, 331:333-339 (May 2021). |
| Martinez et al., A Wavelet-Based ECG Delineator: Evaluation on Standard Databases, IEEE Transactions on Biomedical Engineering, 51(4): 570-581 (Mar. 2004). |
| Matan, et al., Multi-Digit Recognition Using a Space Displacement Neural Network, Neural Information Processing Systems, 2:488-495) (Jan. 1991). |
| Meghriche, et al., On the Analysis of a Compound Neural Network for Detecting Atrio Ventricular Heart Block (AVB) in an ECG Signal, International Journal of Biological and Medical Sciences, 1(1):1-11 (Mar. 2008). |
| Megriche, et al., On the Analysis of a Compound Neural Network for Detecting Atrio Ventricular Heart Block (AVB) in a ECG Signal, International Journal of Medical, Health, Biomedical, Bioengineering and Pharmaceutical Engineering, 2(3):68-78 (2008). |
| Mittal, et al., AI Filter Improves Positive Predictive Value of Atrial Fibrillation Detection by an Implantable Loop Recorder, JACC: Clinical Electrophysiology, available online Feb. 10, 2021, https://doi.org/10.1016/j.jacep.2020.12.006. |
| Mittal, et al., An Artificial Intelligence-based Solution To Reduce False Positive Detections of Atrial Fibrillation By An Implantable Loop Recorder, available at https://cslide-us.ctimeetingtech.com/hrs20/attendee/eposter/file/195#1 (retrieved Jul. 23, 2021). |
| Mnih, et al., Recurrent Models of Visual Attention, arXiv:1406.6247v1:1406.6247(Jun. 2014). |
| Noda, et al., Audio-Visual Speech Recognition using Deep Learning, Applied Intelligence, 42(4):722-737, (Jun. 2015). |
| Nowlan, et al., A Convolutional Neural Network Hand Tracker, Advances in Neural Information Processing Systems7, (pp. 901-908) (Jan. 1995). |
| Pan, et al., A Real-Time QRS Detection Algorithm, IEEE Transactions on Biomedical Engineering, 3:230-236 (Mar. 1985). |
| Pigoli, et al., Wavelets in Functional Data Analysis: Estimation of Multidimensional Curves and their Derivatives, Computational Statistics & Data Analysis, 56(6):1482-1498 (Jun. 2012). |
| Portet, F., P Wave Detector with PP Rhythm Tracking: Evaluation in Different Arrhythmia Contexts, Physiological Measurement, 29(1):141-155 (Jan. 2008). |
| Prineas et al., The Minnesota Code Manual of Electrocardiographic Findings, Springer, Second Edition, ISBN 978-1-84882-777-6, 2009, Minneapolis, Minnesota, US. |
| Raghunath, et al., Deep Neural Networks Can Predict New-Onset Atrial Fibrillation From the 12-Lead ECG and Help Identify Those At Risk of Atrial Fibrillation-Related Stroke, Circulation, 143(13):1287-98 (Mar. 2021). |
| Ravichandran, et al., Novel Tool for Complete Digitization of Paper Electrocardiogra Data, IEEE Journal of Translational Engineering in Health and Medicine, Medical Imaging and Diagnostic Radiology, 1:1800107 (Jun. 2013). |
| Rodrigues, et al., A Neural Network Approach to ECG Denoising, arXIV preprint arXiv:1212-5217 (Dec. 2012). |
| Rosenblatt, The Perceptron: A Probabilistic Model for Information Storage and Organization in the Brain, Psychological Review, 65(6):386-408 (Nov. 1958). |
| Russakovsky, et al., "ImageNet Large Scale Visual Recognition Challenge", International Journal of Computer Vision, 115(3):211-252 (Dec. 2015). |
| Saini, et al., Automated ECG Delineation using Machine Learning Algorithms, International Congress on Electrocardiology, Jalandhar, India, 2014, (pp. 1-4). |
| Schluter, et al., Improved Musical Onset Detection With Convolutional Neural Networks, IEEE International Conference on Acoustics, Speech, and Signal Processing (ICASSP ), (pp. 6979-6983) (May 2014). |
| Shen, et al., Multi-Lead ECG Classification Based on Independent Component Analysis and Support Vector Machine, 3rd International Conference on Biomedical Engineering and Informatics (BMEI), 3:960-964 (Oct. 2010). |
| Simonyan, et al., Very Deep Convolutional Networks for Large-Scale Image Recognition, arXiv preprint arXiv:1409.1556(Sep. 2014). |
| Smith, et al., A deep neural network for 12-lead electrocardiogram interpretation outperforms a conventional algorithm, and its physician overread, in the diagnosis of atrial fibrillation, IJC Heart & Vasculature, 25:100423 (Dec. 2019). |
| Smith, et al., A deep neural network learning algorithm outperforms a conventional algorithm for emergency department electrocardiogram interpretation, Journal of Electrocardiology, 52:88-95 (Jan. 2019). |
| Smith, et al., Improved Interpretation of Atrial Dysrhythmias by a New Neural Network Electrocardiogram Interpretation Algorithm, Academic Emergency Medicine, vol. 24, S1, Abstract 670 (May 2017). |
| Smith, et al., Improved Interpretation of Atrial Dysrhythmias by a New Neural Network Electrocardiogram Interpretation Algorithm, Society for Academic Emergency Medicine Abstracts, 24 (S1), S235 (2017). |
| Statement of Validation and Accuracy for the Glasgow 12-Lead ECG Analysis Program, Physio Control, Mar. 2009, Redmond, WA USA. |
| Tun, et al., Analysis on conversion process from paper record ECG to computer based ECG, MOJ Applied Bionics and Biomechanics, 1(2):69-81 (2017). |
| Vaessen., An approach to ECG Delineation using Wavelet Analysis and Hidden Markov Models, Universiteit Maastricht Institute of Instrument Development Engineering & Evaluation Master Thesis, (Sep. 2006). |
| Zeiler, Matthew D., ADADELTA: An Adaptive Learning Rate Method, arXiv preprint arXiv:1212.5701(Dec. 2012). |
| Zhang et al., Improving Object Detection with Deep Convolutional Networks via Bayesian Optimization and Structured Prediction, Proceedings of the IEEE Conference on Computer Vision and Pattern Recognition, (pp. 249-258) (2015). |
| Zheng, et al., Time Series Classification Using Multi-Channels Deep Convolutional Neural Networks, International Conference on Web-Age Information Management, (pp. 298-310), (Jun. 2014). |
Also Published As
| Publication number | Publication date |
|---|---|
| US20220031223A1 (en) | 2022-02-03 |
Similar Documents
| Publication | Publication Date | Title |
|---|---|---|
| AU2020218863B2 (en) | Electrocardiogram processing system for delineation and classification | |
| US12016694B2 (en) | Electrocardiogram processing system for delineation and classification | |
| US20220095982A1 (en) | Electrocardiogram processing system for detecting and/or predicting cardiac events | |
| US11678831B2 (en) | Electrocardiogram processing system for detecting and/or predicting cardiac events | |
| US11179087B2 (en) | System for facilitating a cardiac rhythm disorder diagnosis with the aid of a digital computer | |
| US20220218259A1 (en) | Systems and methods for restricting rights to an electrocardiogram processing system | |
| KR102387703B1 (en) | Method And Apparatus for Correcting Electrocardiogram | |
| CN116504398A (en) | Methods and systems for arrhythmia prediction using a transducer-based neural network | |
| US11672464B2 (en) | Electrocardiogram processing system for delineation and classification | |
| US20250204866A1 (en) | Apparatus and a method for a plurality of time series data | |
| EP3920789A1 (en) | Electrocardiogram processing system for delineation and classification | |
| Farell et al. | Classification of Arrhythmia Potential using the K-Nearest Neighbor Algorithm | |
| HK40053090A (en) | Electrocardiogram processing system for delineation and classification | |
| KR102803314B1 (en) | Method for analyzing ecg data using multiple deep neural networks and recording medium storing program to implement the method | |
| WO2023144022A1 (en) | Systems and methods for restricting rights to an electrocardiogram processing system | |
| Mansour et al. | A NOVEL DEEP 2D-CNN MODEL FOR ECG-BASED ARRHYTHMIA DIAGNOSIS WITH SELECTIVE ATTENTION MECHANISM AND CWT INTEGRATION. | |
| WO2021030216A1 (en) | Facilitating a cardiac rhythm disorder diagnosis with the aid of a digital computer |
Legal Events
| Date | Code | Title | Description |
|---|---|---|---|
| AS | Assignment | Owner name:CARDIOLOGS TECHNOLOGIES SAS, FRANCE Free format text:ASSIGNMENT OF ASSIGNORS INTEREST;ASSIGNORS:LI, JIA;POMIER, ROMAIN;SCABELLONE, CHIARA;AND OTHERS;SIGNING DATES FROM 20200206 TO 20200213;REEL/FRAME:057041/0458 | |
| STPP | Information on status: patent application and granting procedure in general | Free format text:SPECIAL NEW | |
| STPP | Information on status: patent application and granting procedure in general | Free format text:NON FINAL ACTION MAILED | |
| STPP | Information on status: patent application and granting procedure in general | Free format text:RESPONSE TO NON-FINAL OFFICE ACTION ENTERED AND FORWARDED TO EXAMINER | |
| STPP | Information on status: patent application and granting procedure in general | Free format text:NON FINAL ACTION MAILED | |
| AS | Assignment | Owner name:KONINKLIJKE PHILIPS N.V., NETHERLANDS Free format text:ASSIGNMENT OF ASSIGNORS INTEREST;ASSIGNOR:CARDIOLOGS TECHNOLOGIES SAS;REEL/FRAME:064430/0814 Effective date:20230601 | |
| STPP | Information on status: patent application and granting procedure in general | Free format text:RESPONSE TO NON-FINAL OFFICE ACTION ENTERED AND FORWARDED TO EXAMINER | |
| STPP | Information on status: patent application and granting procedure in general | Free format text:FINAL REJECTION MAILED | |
| STPP | Information on status: patent application and granting procedure in general | Free format text:RESPONSE AFTER FINAL ACTION FORWARDED TO EXAMINER | |
| STPP | Information on status: patent application and granting procedure in general | Free format text:NOTICE OF ALLOWANCE MAILED -- APPLICATION RECEIVED IN OFFICE OF PUBLICATIONS | |
| STPP | Information on status: patent application and granting procedure in general | Free format text:AWAITING TC RESP, ISSUE FEE PAYMENT VERIFIED | |
| STPP | Information on status: patent application and granting procedure in general | Free format text:PUBLICATIONS -- ISSUE FEE PAYMENT VERIFIED | |
| STCF | Information on status: patent grant | Free format text:PATENTED CASE |