US11796454B2 - Gas leak emission quantification with a gas cloud imager - Google Patents
Gas leak emission quantification with a gas cloud imagerDownload PDFInfo
- Publication number
- US11796454B2 US11796454B2US16/661,407US201916661407AUS11796454B2US 11796454 B2US11796454 B2US 11796454B2US 201916661407 AUS201916661407 AUS 201916661407AUS 11796454 B2US11796454 B2US 11796454B2
- Authority
- US
- United States
- Prior art keywords
- gas
- optical
- data
- imaging system
- processing unit
- Prior art date
- Legal status (The legal status is an assumption and is not a legal conclusion. Google has not performed a legal analysis and makes no representation as to the accuracy of the status listed.)
- Active, expires
Links
- 238000011002quantificationMethods0.000titledescription11
- 230000035945sensitivityEffects0.000claimsabstractdescription23
- 230000003287optical effectEffects0.000claimsdescription277
- 230000003595spectral effectEffects0.000claimsdescription99
- 238000012545processingMethods0.000claimsdescription75
- 238000003384imaging methodMethods0.000claimsdescription71
- 230000005855radiationEffects0.000claimsdescription48
- 238000004891communicationMethods0.000claimsdescription25
- 238000012546transferMethods0.000claimsdescription25
- 230000003190augmentative effectEffects0.000claimsdescription7
- 238000004040coloringMethods0.000claims2
- 239000002245particleSubstances0.000claims1
- 238000000034methodMethods0.000abstractdescription61
- 238000001228spectrumMethods0.000abstractdescription31
- 239000007789gasSubstances0.000description365
- 238000010521absorption reactionMethods0.000description43
- 238000005259measurementMethods0.000description40
- 238000001514detection methodMethods0.000description26
- 238000004422calculation algorithmMethods0.000description25
- 230000008859changeEffects0.000description19
- 238000000862absorption spectrumMethods0.000description18
- 230000005540biological transmissionEffects0.000description9
- 238000012544monitoring processMethods0.000description9
- 230000000694effectsEffects0.000description8
- 238000000701chemical imagingMethods0.000description7
- 230000006870functionEffects0.000description6
- 239000000203mixtureSubstances0.000description6
- 238000013459approachMethods0.000description5
- 238000004611spectroscopical analysisMethods0.000description5
- 239000003570airSubstances0.000description4
- 230000008901benefitEffects0.000description4
- 238000004364calculation methodMethods0.000description4
- 230000005670electromagnetic radiationEffects0.000description4
- 230000007613environmental effectEffects0.000description4
- XLYOFNOQVPJJNP-UHFFFAOYSA-NwaterChemical compoundOXLYOFNOQVPJJNP-UHFFFAOYSA-N0.000description4
- 239000012080ambient airSubstances0.000description3
- 238000001816coolingMethods0.000description3
- 238000010586diagramMethods0.000description3
- 238000009499grossingMethods0.000description3
- 230000015654memoryEffects0.000description3
- 230000008569processEffects0.000description3
- 239000000126substanceSubstances0.000description3
- 230000002123temporal effectEffects0.000description3
- QGZKDVFQNNGYKY-UHFFFAOYSA-NAmmoniaChemical compoundNQGZKDVFQNNGYKY-UHFFFAOYSA-N0.000description2
- 238000002835absorbanceMethods0.000description2
- 238000004847absorption spectroscopyMethods0.000description2
- 230000007423decreaseEffects0.000description2
- 230000003247decreasing effectEffects0.000description2
- 238000013461designMethods0.000description2
- 238000001914filtrationMethods0.000description2
- 230000000670limiting effectEffects0.000description2
- 238000012423maintenanceMethods0.000description2
- VNWKTOKETHGBQD-UHFFFAOYSA-NmethaneChemical compoundCVNWKTOKETHGBQD-UHFFFAOYSA-N0.000description2
- QQONPFPTGQHPMA-UHFFFAOYSA-NpropyleneNatural productsCC=CQQONPFPTGQHPMA-UHFFFAOYSA-N0.000description2
- 125000004805propylene groupChemical group[H]C([H])([H])C([H])([*:1])C([H])([H])[*:2]0.000description2
- 230000002829reductive effectEffects0.000description2
- 230000008439repair processEffects0.000description2
- 238000007619statistical methodMethods0.000description2
- 238000012935AveragingMethods0.000description1
- RWSOTUBLDIXVET-UHFFFAOYSA-NDihydrogen sulfideChemical compoundSRWSOTUBLDIXVET-UHFFFAOYSA-N0.000description1
- 238000004566IR spectroscopyMethods0.000description1
- 229910021529ammoniaInorganic materials0.000description1
- 238000003491arrayMethods0.000description1
- 230000002238attenuated effectEffects0.000description1
- BJQHLKABXJIVAM-UHFFFAOYSA-Nbis(2-ethylhexyl) phthalateChemical compoundCCCCC(CC)COC(=O)C1=CC=CC=C1C(=O)OCC(CC)CCCCBJQHLKABXJIVAM-UHFFFAOYSA-N0.000description1
- 239000000919ceramicSubstances0.000description1
- 230000001010compromised effectEffects0.000description1
- 238000000205computational methodMethods0.000description1
- 239000000470constituentSubstances0.000description1
- 238000007796conventional methodMethods0.000description1
- 230000001419dependent effectEffects0.000description1
- 238000005553drillingMethods0.000description1
- 239000000428dustSubstances0.000description1
- 238000004993emission spectroscopyMethods0.000description1
- 238000000295emission spectrumMethods0.000description1
- 238000002474experimental methodMethods0.000description1
- 230000004907fluxEffects0.000description1
- 229930195733hydrocarbonNatural products0.000description1
- 150000002430hydrocarbonsChemical class0.000description1
- 229910000037hydrogen sulfideInorganic materials0.000description1
- 238000010348incorporationMethods0.000description1
- 238000002329infrared spectrumMethods0.000description1
- 238000004519manufacturing processMethods0.000description1
- 230000000873masking effectEffects0.000description1
- 239000000463materialSubstances0.000description1
- 239000002184metalSubstances0.000description1
- 229910052751metalInorganic materials0.000description1
- -1methane)Chemical class0.000description1
- 238000002156mixingMethods0.000description1
- 239000004033plasticSubstances0.000description1
- 230000001902propagating effectEffects0.000description1
- 210000001747pupilAnatomy0.000description1
- 238000013139quantizationMethods0.000description1
- 230000009467reductionEffects0.000description1
- 238000006467substitution reactionMethods0.000description1
- 239000000758substrateSubstances0.000description1
- 238000012360testing methodMethods0.000description1
- 238000000411transmission spectrumMethods0.000description1
- 239000012855volatile organic compoundSubstances0.000description1
Images


Classifications
- G—PHYSICS
- G01—MEASURING; TESTING
- G01N—INVESTIGATING OR ANALYSING MATERIALS BY DETERMINING THEIR CHEMICAL OR PHYSICAL PROPERTIES
- G01N21/00—Investigating or analysing materials by the use of optical means, i.e. using sub-millimetre waves, infrared, visible or ultraviolet light
- G01N21/17—Systems in which incident light is modified in accordance with the properties of the material investigated
- G01N21/25—Colour; Spectral properties, i.e. comparison of effect of material on the light at two or more different wavelengths or wavelength bands
- G01N21/31—Investigating relative effect of material at wavelengths characteristic of specific elements or molecules, e.g. atomic absorption spectrometry
- G01N21/35—Investigating relative effect of material at wavelengths characteristic of specific elements or molecules, e.g. atomic absorption spectrometry using infrared light
- G01N21/3504—Investigating relative effect of material at wavelengths characteristic of specific elements or molecules, e.g. atomic absorption spectrometry using infrared light for analysing gases, e.g. multi-gas analysis
- G—PHYSICS
- G01—MEASURING; TESTING
- G01J—MEASUREMENT OF INTENSITY, VELOCITY, SPECTRAL CONTENT, POLARISATION, PHASE OR PULSE CHARACTERISTICS OF INFRARED, VISIBLE OR ULTRAVIOLET LIGHT; COLORIMETRY; RADIATION PYROMETRY
- G01J3/00—Spectrometry; Spectrophotometry; Monochromators; Measuring colours
- G01J3/28—Investigating the spectrum
- G01J3/2823—Imaging spectrometer
- G—PHYSICS
- G01—MEASURING; TESTING
- G01J—MEASUREMENT OF INTENSITY, VELOCITY, SPECTRAL CONTENT, POLARISATION, PHASE OR PULSE CHARACTERISTICS OF INFRARED, VISIBLE OR ULTRAVIOLET LIGHT; COLORIMETRY; RADIATION PYROMETRY
- G01J3/00—Spectrometry; Spectrophotometry; Monochromators; Measuring colours
- G01J3/28—Investigating the spectrum
- G01J3/42—Absorption spectrometry; Double beam spectrometry; Flicker spectrometry; Reflection spectrometry
- G—PHYSICS
- G01—MEASURING; TESTING
- G01M—TESTING STATIC OR DYNAMIC BALANCE OF MACHINES OR STRUCTURES; TESTING OF STRUCTURES OR APPARATUS, NOT OTHERWISE PROVIDED FOR
- G01M3/00—Investigating fluid-tightness of structures
- G01M3/02—Investigating fluid-tightness of structures by using fluid or vacuum
- G01M3/26—Investigating fluid-tightness of structures by using fluid or vacuum by measuring rate of loss or gain of fluid, e.g. by pressure-responsive devices, by flow detectors
- G—PHYSICS
- G01—MEASURING; TESTING
- G01M—TESTING STATIC OR DYNAMIC BALANCE OF MACHINES OR STRUCTURES; TESTING OF STRUCTURES OR APPARATUS, NOT OTHERWISE PROVIDED FOR
- G01M3/00—Investigating fluid-tightness of structures
- G01M3/38—Investigating fluid-tightness of structures by using light
- G—PHYSICS
- G01—MEASURING; TESTING
- G01N—INVESTIGATING OR ANALYSING MATERIALS BY DETERMINING THEIR CHEMICAL OR PHYSICAL PROPERTIES
- G01N21/00—Investigating or analysing materials by the use of optical means, i.e. using sub-millimetre waves, infrared, visible or ultraviolet light
- G01N21/17—Systems in which incident light is modified in accordance with the properties of the material investigated
- G01N2021/1793—Remote sensing
- G—PHYSICS
- G01—MEASURING; TESTING
- G01N—INVESTIGATING OR ANALYSING MATERIALS BY DETERMINING THEIR CHEMICAL OR PHYSICAL PROPERTIES
- G01N21/00—Investigating or analysing materials by the use of optical means, i.e. using sub-millimetre waves, infrared, visible or ultraviolet light
- G01N21/17—Systems in which incident light is modified in accordance with the properties of the material investigated
- G01N21/25—Colour; Spectral properties, i.e. comparison of effect of material on the light at two or more different wavelengths or wavelength bands
- G01N21/31—Investigating relative effect of material at wavelengths characteristic of specific elements or molecules, e.g. atomic absorption spectrometry
- G01N21/35—Investigating relative effect of material at wavelengths characteristic of specific elements or molecules, e.g. atomic absorption spectrometry using infrared light
- G01N21/3504—Investigating relative effect of material at wavelengths characteristic of specific elements or molecules, e.g. atomic absorption spectrometry using infrared light for analysing gases, e.g. multi-gas analysis
- G01N2021/3531—Investigating relative effect of material at wavelengths characteristic of specific elements or molecules, e.g. atomic absorption spectrometry using infrared light for analysing gases, e.g. multi-gas analysis without instrumental source, i.e. radiometric
Definitions
- This disclosuregenerally relates to systems and methods for gas cloud detection and gas leak emission quantification.
- gasesthere are a wide variety of systems that create, store, transfer, process, or otherwise involve gases. These include, but are not limited to, industrial systems, such as oil and gas drilling rigs and refineries. In such systems, there may be a risk of gas leaks. Such gases may include hydrocarbons (e.g., methane), ammonia, hydrogen sulfide, volatile organic compounds, and many, many others. Gas leaks can pose safety and/or environmental risks. They can also result in financial loss. It would therefore be advantageous to develop systems and methods for detecting gas leaks and quantifying gas leak emission.
- an infrared (IR) imaging systemfor quantifying one or more parameters of a gas leak having a gaseous emission rate
- the imaging systemcomprising: an optical system including an optical focal plane array (FPA) unit, the optical system having components defining at least two optical channels thereof, said at least two optical channels being spatially and spectrally different from one another, each of the at least two optical channels positioned to transfer IR radiation incident on the optical system towards the optical FPA unit; and a data-processing unit comprising one or more processors, said data-processing unit configured to acquire multispectral optical data from the IR radiation received at the optical FPA unit and output gaseous emission rate data for a gaseous leak.
- FPAoptical focal plane array
- an infrared (IR) imaging systemfor quantifying one or more parameters of a gas cloud
- the imaging systemcomprising: an optical system including an optical focal plane array (FPA) unit, the optical system having components defining at least two optical channels thereof, said at least two optical channels being spatially and spectrally different from one another, each of the at least two optical channels positioned to transfer IR radiation incident on the optical system towards the optical FPA unit; and a data-processing unit comprising one or more processors, said data-processing unit configured to acquire spectral optical data from the IR radiation received at the optical FPA unit, wherein said data-processing unit is configured to determine absorption spectra data at a given pixel of a given frame by comparing spectral data for said pixel of said frame with spectral data from prior frames.
- FPAoptical focal plane array
- a system for quantifying one or more parameters of a gas leakcomprising: a communication subsystem for receiving multi-spectral optical data produced by a camera including an optical focal plane array (FPA) unit, the camera having components defining at least two optical channels thereof, said at least two optical channels being spatially and spectrally different from one another, each of the at least two optical channels positioned to transfer IR radiation incident on the optical system towards the optical FPA, said multi-spectral optical data derived from the IR radiation received at the optical FPA; and a data-processing unit comprising one or more processors, said data-processing unit configured to acquire said multispectral spectral optical data from said communication subsystem, wherein said data-processing unit is configured to process said multispectral optical data and output gaseous emission rate data from a gaseous leak.
- FPAoptical focal plane array
- a system for quantifying one or more parameters of a gas leakcomprising: a communication subsystem for receiving processed data derived from multi-spectral optical data produced by a camera including an optical focal plane array (FPA) unit, the camera having components defining at least two optical channels thereof, said at least two optical channels being spatially and spectrally different from one another, each of the at least two optical channels positioned to transfer IR radiation incident on the optical system towards the optical FPA, said multi-spectral optical data derived from the IR radiation received at the optical FPA; and a data-processing unit comprising one or more processors, said data-processing unit configured to acquire said processed data from said communication subsystem, wherein said data-processing unit is configured to further process said processed data and output gaseous emission rate data for a gaseous leak.
- FPAoptical focal plane array
- a system for quantifying one or more parameters of a gas cloudcomprising: a communication subsystem for receiving multi-spectral optical data produced by a camera including an optical focal plane array (FPA) unit, the camera having components defining at least two optical channels thereof, said at least two optical channels being spatially and spectrally different from one another, each of the at least two optical channels positioned to transfer IR radiation incident on the optical system towards the optical FPA, said multi-spectral optical data derived from the IR radiation received at the optical FPA; and a data-processing unit comprising one or more processors, said data-processing unit configured to acquire said multi-spectral optical data from said communication subsystem, wherein said data-processing unit is configured to determine absorption spectra data at a given pixel of a given frame from a comparison of spectral data for said pixel of said frame with spectral data from prior frames.
- FPAoptical focal plane array
- a system for quantifying one or more parameters of a gas cloudcomprising: a communication subsystem for receiving multi-spectral optical data produced by a camera including an optical focal plane array (FPA) unit, the camera having components defining at least two optical channels thereof, said at least two optical channels being spatially and spectrally different from one another, each of the at least two optical channels positioned to transfer IR radiation incident on the optical system towards the optical FPA, said multi-spectral optical data derived from the IR radiation received at the optical FPA; and a data-processing unit comprising one or more processors, said data-processing unit configured to acquire said multi-spectral optical data from said communication subsystem, wherein said data-processing unit is configured to compare spectral data for said pixel of said frame with spectral data from prior frames for the determination of absorption spectra data at a given pixel of a given frame.
- FPAoptical focal plane array
- a system for quantifying one or more parameters of a gas cloudcomprising: a communication subsystem for receiving optical data produced by a camera including an optical focal plane array (FPA) unit, the camera having components defining at least two optical channels thereof, said at least two optical channels being spatially and spectrally different from one another, each of the at least two optical channels positioned to transfer IR radiation incident on the optical system towards the optical FPA, said multi-spectral optical data derived from the IR radiation received at the optical FPA; and a data-processing unit comprising one or more processors, said data-processing unit configured to acquire said optical data from said communication subsystem, wherein said data-processing unit is configured to consider noise as a criteria for determining whether to include data for the given pixel for a particular prior frame with data from other prior frames for comparing spectral data for a pixel of a later frame with spectral data from prior frames for the determination of absorption spectra data for the given pixel of the later frame.
- FPAoptical focal plane array
- an infrared (IR) imaging systemfor quantifying one or more parameters of a gas cloud
- the imaging systemcomprising: an optical system including an optical focal plane array (FPA) unit, the optical system having components defining at least two optical channels thereof, said at least two optical channels being spatially and spectrally different from one another, each of the at least two optical channels positioned to transfer IR radiation incident on the optical system towards the optical FPA unit; and a data-processing unit comprising one or more processors, said data-processing unit configured to acquire spectral optical data from the IR radiation received at the optical FPA unit, wherein said data-processing unit is configured to determine gas emission by comparing data from a given frame with data from one or more prior frames.
- FPAoptical focal plane array
- an infrared (IR) imaging systemfor quantifying one or more parameters of a gas cloud
- the imaging systemcomprising: an optical system including an optical focal plane array (FPA) unit, the optical system having components defining at least two optical channels thereof, said at least two optical channels being spatially and spectrally different from one another, each of the at least two optical channels positioned to transfer IR radiation incident on the optical system towards the optical FPA unit; and a data-processing unit comprising one or more processors, said data-processing unit configured to acquire spectral optical data from the IR radiation received at the optical FPA unit, wherein said data-processing unit is configured to include an estimate of loss caused by a portion of said cloud being blown out of the field of view of the optical system.
- FPAoptical focal plane array
- an infrared (IR) imaging systemfor quantifying one or more parameters of a gas cloud
- the imaging systemcomprising: an optical system including an optical focal plane array (FPA) unit, the optical system having components defining at least two optical channels thereof, said at least two optical channels being spatially and spectrally different from one another, each of the at least two optical channels positioned to transfer IR radiation incident on the optical system towards the optical FPA unit; and a data-processing unit comprising one or more processors, said data-processing unit configured to acquire spectral optical data from the IR radiation received at the optical FPA unit, wherein said optical system and FPA unit together with said data-processing unit has a detection sensitivity for detecting absorption, and wherein said data-processing unit is configured to include an estimate of loss caused by a portion of said cloud having absorption less than the detection sensitivity.
- FPAoptical focal plane array
- an infrared (IR) imaging systemfor quantifying one or more parameters of a gas cloud
- the imaging systemcomprising: an optical system including an optical focal plane array (FPA) unit, the optical system having components defining at least two optical channels thereof, said at least two optical channels being spatially and spectrally different from one another, each of the at least two optical channels positioned to transfer IR radiation incident on the optical system towards the optical FPA unit; and a data-processing unit comprising one or more processors, said data-processing unit configured to acquire spectral optical data from the IR radiation received at the optical FPA unit, wherein said data-processing unit is configured to use noise as a criteria for determining whether to de-emphasize or exclude data for a particular frame.
- FPAoptical focal plane array
- an infrared (IR) imaging systemfor quantifying one or more parameters of a gas cloud
- the imaging systemcomprising: an optical system including an optical focal plane array (FPA) unit, the optical system having components defining at least two optical channels thereof, said at least two optical channels being spatially and spectrally different from one another, each of the at least two optical channels positioned to transfer IR radiation incident on the optical system towards the optical FPA unit; and a data-processing unit comprising one or more processors, said data-processing unit configured to acquire spectral optical data from the IR radiation received at the optical FPA unit, wherein said data-processing unit is configured to determine a quantity of gas using one or more specifications of the FPA unit, one or more specification of the optical system, distance of camera to the gas cloud, or combinations thereof.
- FPAoptical focal plane array
- a system for quantifying one or more parameters of a gas cloudcomprising: a communication subsystem for receiving optical data produced by a camera including an optical focal plane array (FPA) unit, the camera having components defining at least two optical channels thereof, said at least two optical channels being spatially and spectrally different from one another, each of the at least two optical channels positioned to transfer IR radiation incident on the optical system towards the optical FPA, said multi-spectral optical data derived from the IR radiation received at the optical FPA; and a data-processing unit comprising one or more processors, said data-processing unit configured to acquire said optical data from said communication subsystem, wherein said data-processing unit is configured to determine gas emission by comparing data from a given frame with data from one or more prior frames.
- FPAoptical focal plane array
- a system for quantifying one or more parameters of a gas cloudcomprising: a communication subsystem for receiving optical data produced by a camera including an optical focal plane array (FPA) unit, the camera having components defining at least two optical channels thereof, said at least two optical channels being spatially and spectrally different from one another, each of the at least two optical channels positioned to transfer IR radiation incident on the optical system towards the optical FPA, said multi-spectral optical data derived from the IR radiation received at the optical FPA; and a data-processing unit comprising one or more processors, said data-processing unit configured to acquire said optical data from said communication subsystem, wherein said data-processing unit is configured to include an estimate of loss caused by a portion of said cloud being blown out of the field of view of the optical system.
- FPAoptical focal plane array
- a system for quantifying one or more parameters of a gas cloudcomprising: a communication subsystem for receiving optical data produced by a camera including an optical focal plane array (FPA) unit, the camera having components defining at least two optical channels thereof, said at least two optical channels being spatially and spectrally different from one another, each of the at least two optical channels positioned to transfer IR radiation incident on the optical system towards the optical FPA, said multi-spectral optical data derived from the IR radiation received at the optical FPA; and a data-processing unit comprising one or more processors, said data-processing unit configured to acquire said optical data from said communication subsystem, wherein said optical system and FPA unit together with said data-processing unit has a detection sensitivity for detecting absorption, and wherein said data-processing unit is configured to include an estimate of loss caused by a portion of said cloud having absorption less than the detection sensitivity.
- FPAoptical focal plane array
- a system for quantifying one or more parameters of a gas cloudcomprising: a communication subsystem for receiving optical data produced by a camera including an optical focal plane array (FPA) unit, the camera having components defining at least two optical channels thereof, said at least two optical channels being spatially and spectrally different from one another, each of the at least two optical channels positioned to transfer IR radiation incident on the optical system towards the optical FPA, said multi-spectral optical data derived from the IR radiation received at the optical FPA; and a data-processing unit comprising one or more processors, said data-processing unit configured to acquire said optical data from said communication subsystem, wherein said data-processing unit is configured to use noise as a criteria for determining whether to de-emphasize or exclude data for a particular frame.
- FPAoptical focal plane array
- a system for quantifying one or more parameters of a gas cloudcomprising: a communication subsystem for receiving optical data produced by a camera including an optical focal plane array (FPA) unit, the camera having components defining at least two optical channels thereof, said at least two optical channels being spatially and spectrally different from one another, each of the at least two optical channels positioned to transfer IR radiation incident on the optical system towards the optical FPA, said multi-spectral optical data derived from the IR radiation received at the optical FPA; and a data-processing unit comprising one or more processors, said data-processing unit configured to acquire said optical data from said communication subsystem, wherein said data-processing unit is configured to determine a quantity of gas using one or more specifications of the FPA unit, one or more specification of the optical system, distance of camera to the gas cloud, or combinations thereof.
- FPAoptical focal plane array
- an infrared (IR) imaging systemfor quantifying one or more parameters of a gas cloud
- the imaging systemcomprising: an optical system including an optical focal plane array (FPA) unit, the optical system having components defining at least two optical channels thereof, said at least two optical channels being spatially and spectrally different from one another, each of the at least two optical channels positioned to transfer IR radiation incident on the optical system towards the optical FPA unit; and a data-processing unit comprising one or more processors, said data-processing unit configured to acquire spectral optical data from the IR radiation received at the optical FPA unit, wherein said data-processing unit is configured to include an estimate of atmospheric absorption between the gas cloud and the optical system.
- FPAoptical focal plane array
- a method of analyzing a gas leak using a processorcomprising: receiving a time series of data from a sensor, the data being capable of quantifying an absorption spectrum of a gas cloud located within a field of view of the sensor, the data comprising a frame for each time in the time series, each frame comprising optical signal values corresponding to different locations within the field of view for each of a plurality of spectral wavelengths of electromagnetic radiation; comparing a subsequent frame of data with at least one prior frame of data in the time series; analyzing at least one property of a gas cloud located within the field of view of the sensor based on the comparison between the subsequent frame of data and the at least one prior frame of data; and outputting an indicator of the at least one property of the gas cloud to a user interface.
- a method of analyzing the emission rate of a gas leak using a processorcomprising: receiving a time series of data from a sensor, the data being capable of quantifying an absorption spectrum of a gas cloud located within a field of view of the sensor, the data comprising a frame for each time in the time series, each frame comprising optical signal values corresponding to different locations within the field of view for each of a plurality of spectral wavelengths of electromagnetic radiation; estimating the total amount of gas within the field of view of the sensor; temporally smoothing the estimate of the total amount of gas within the field of view; combining the temporally-smoothed estimate of the total amount of gas within the field of view with an estimate of the amount of gas that has exited the field of view; combining the temporally-smoothed estimate of the total amount of detected gas within the field of view of the sensor with an estimate of the amount of gas that has dropped below the sensitivity limit of the sensor; and outputting an indicator of the emission rate of the
- a system for analyzing a gas leakcomprising: at least one processor; and a non-transitory memory with instructions configured to cause the at least one processor to perform a method comprising: receiving a time series of data from a sensor, the data being capable of quantifying an absorption spectrum of a gas cloud located within a field of view of the sensor, the data comprising a frame for each time in the time series, each frame comprising optical signal values corresponding to different locations within the field of view for each of a plurality of spectral wavelengths of electromagnetic radiation; comparing a subsequent frame of data with at least one prior frame of data in the time series; analyzing at least one property of a gas cloud located within the field of view of the sensor based on the comparison between the subsequent frame of data and the at least one prior frame of data; and outputting an indicator of the at least one property of the gas cloud to a user interface.
- a system for analyzing the emission rate of a gas leakcomprising: at least one processor; and a non-transitory memory with instructions configured to cause the at least one processor to perform a method comprising: receiving a time series of data from a sensor, the data being capable of quantifying an absorption spectrum of a gas cloud located within a field of view of the sensor, the data comprising a frame for each time in the time series, each frame comprising optical signal values corresponding to different locations within the field of view for each of a plurality of spectral wavelengths of electromagnetic radiation; estimating the total amount of gas within the field of view of the sensor; temporally smoothing the estimate of the total amount of gas within the field of view; combining the temporally-smoothed estimate of the total amount of gas within the field of view with an estimate of the amount of gas that has exited the field of view; combining the temporally-smoothed estimate of the total amount of detected gas within the field of view of the sensor with an estimate
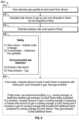
- FIG. 1provides a diagram schematically illustrating spatial and spectral division of incoming light by an embodiment of a divided aperture infrared spectral imager (DAISI) system that can image an object possessing IR spectral signature(s).
- DAISIdivided aperture infrared spectral imager
- FIG. 2illustrates another embodiment of a spectral imager system.
- FIG. 3illustrates an example of the measurement geometry for a gas cloud imager (GCI).
- GCIgas cloud imager
- FIG. 4is a flowchart of an example method for calculating a running average of a scene spectral distribution.
- FIG. 5is a flowchart of an example method for detecting a gas cloud.
- FIG. 6illustrates a gas cloud imager detector pixel projected to the location of the gas cloud.
- FIG. 7is a flowchart of an example method for calculating the absolute quantity of gas present in a gas cloud.
- FIG. 8is a flowchart of an example method for quantizing the emission rate of a gas leak.
- FIG. 9is a flowchart of an example method 700 for compensating an estimate of emission rate based on gas exiting the field of view of the camera and absorption dropping below sensitivity limits of the camera.
- FIG. 10illustrates a top view of an example scene measured by a gas cloud imager camera, with the gas cloud at a distance z (left).
- FIG. 8also illustrates the example scene as viewed from the gas cloud imager camera itself (right).
- FIG. 11shows an example of the gas cloud imager (GCI) live viewer graphical user interface.
- GCIgas cloud imager
- FIG. 12shows an example of the mosaic viewer interface which shows an overview of the entire area being monitored.
- FIG. 13shows an example of the graphical user interface with an alarm condition.
- FIG. 14shows an example of an alarm thresholds settings window.
- FIG. 15shows the measurement geometry for a single pixel in a gas cloud imager.
- FIG. 16shows an example absorption spectrum measurement for propylene gas, showing the measured spectrum M( ⁇ ).
- FIG. 17shows a detector pixel projected to the location of the gas cloud.
- one type of gas cloud imageris a divided-aperture infrared spectral imaging (DAISI) system that is structured and adapted to provide identification of target chemical contents of the imaged scene.
- the systemis based on spectrally-resolved imaging and can provide such identification with a single-shot (also referred to as a snapshot) comprising a plurality of images having different wavelength compositions that are obtained generally simultaneously.
- snapshotrefers to a system in which most of the data elements that are collected are continuously viewing the light emitted from the scene. In contrast in scanning systems, at any given time only a minority of data elements are continuously viewing a scene, followed by a different set of data elements, and so on, until the full dataset is collected. Relatively fast operation can be achieved in a snapshot system because it does not need to use spectral or spatial scanning for the acquisition of infrared (IR) spectral signatures of the target chemical contents. Instead, IR detectors (such as, for example, infrared focal plane arrays or FPAs) associated with a plurality of different optical channels having different wavelength profiles can be used to form a spectral cube of imaging data.
- IR detectorssuch as, for example, infrared focal plane arrays or FPAs
- spectral datacan be obtained from a single snapshot comprising multiple simultaneously-acquired images corresponding to different wavelength ranges
- multiple snap shotsmay be obtained.
- these multiple snapshotscan be averaged.
- multiple snap shotsmay be obtained and a portion of these can be selected and possibly averaged.
- the DAISI systemdoes not require cooling (for example cryogenic cooling). Accordingly, it can advantageously use uncooled infrared detectors.
- the imaging systems disclosed hereindo not include detectors configured to be cooled to a temperature below 300 Kelvin.
- the imaging systems disclosed hereindo not include detectors configured to be cooled to a temperature below 273 Kelvin.
- the imaging systems disclosed hereindo not include detectors configured to be cooled to a temperature below 250 Kelvin.
- the imaging systems disclosed hereindo not include detectors configured to be cooled to a temperature below 200 Kelvin.
- Implementations disclosed hereinprovide several advantages over existing IR spectral imaging systems, most if not all of which may require FPAs that are highly sensitive and cooled in order to compensate, during the optical detection, for the reduction of the photon flux caused by spectrum-scanning operation.
- the highly sensitive and cooled FPA systemsare expensive and require a great deal of maintenance. Since various embodiments disclosed herein are configured to operate in single-shot acquisition mode without spatial and/or spectral scanning, the instrument can receive photons from a plurality of points (e.g., every point) of the object substantially simultaneously, during the single reading.
- the embodiments of imaging system described hereincan collect a substantially greater amount of optical power from the imaged scene (for example, an order of magnitude more photons) at any given moment in time especially in comparison with spatial and/or spectral scanning systems. Consequently, various embodiments of the imaging systems disclosed herein can be operated using uncooled detectors (for example, FPA unit including an array of microbolometers) that are less sensitive to photons in the IR but are well fit for continuous monitoring applications.
- uncooled detectorsfor example, FPA unit including an array of microbolometers
- the imaging systems disclosed hereindo not include detectors configured to be cooled to a temperature below 300 Kelvin. As another example, in various implementations, the imaging systems disclosed herein do not include detectors configured to be cooled to a temperature below 273 Kelvin. As yet another example, in various implementations, the imaging systems disclosed herein do not include detectors configured to be cooled to a temperature below 250 Kelvin. As another example, in various implementations, the imaging systems disclosed herein do not include detectors configured to be cooled to a temperature below 200 Kelvin. Imaging systems including uncooled detectors can be capable of operating in extreme weather conditions, require less power, are capable of operation during day and night, and are less expensive. Some embodiments described herein can also be less susceptible to motion artifacts in comparison with spatially and/or spectrally scanning systems which can cause errors in either the spectral data, spatial data, or both.
- FIG. 1provides a diagram schematically illustrating spatial and spectral division of incoming light by an embodiment 100 of a divided aperture infrared spectral imager (DAISI) system that can image an object 110 possessing IR spectral signature(s).
- the system 100includes a front objective lens 124 , an array of optical filters 130 , an array of reimaging lenses 128 and a detector array 136 .
- the detector array 136can include a single FPA or an array of FPAs. Each detector in the detector array 136 can be disposed at the focus of each of the lenses in the array of reimaging lenses 128 .
- the detector array 136can include a plurality of photo-sensitive devices.
- the plurality of photo-sensitive devicesmay comprise a two-dimensional imaging sensor array that is sensitive to radiation having wavelengths between 1 ⁇ m and 20 ⁇ m (for example, in near infra-red wavelength range, mid infra-red wavelength range, or long infra-red wavelength range).
- the plurality of photo-sensitive devicescan include CCD or CMOS sensors, bolometers, microbolometers or other detectors that are sensitive to infra-red radiation. Without any loss of generality the detector array 136 can also be referred to herein as an imaging system or a camera.
- An aperture of the system 100 associated with the front objective lens system 124is spatially and spectrally divided by the combination of the array of optical filters 130 and the array of reimaging lenses 128 .
- the combination of the array of optical filters 130 and the array of reimaging lenses 128can be considered to form a spectrally divided pupil that is disposed forward of the optical detector array 136 .
- the spatial and spectral division of the aperture into distinct aperture portionsforms a plurality of optical channels 120 along which light propagates.
- Various implementations of the systemcan include at least two spatially and spectrally different optical channels.
- various implementations of the systemcan include at least three, at least four, at least five, at least six, at least seven, at least eight, at least nine, at least ten, at least eleven or at least twelve spatially and spectrally different optical channels.
- the number of spatially and spectrally different optical channelscan be less than 50 in various implementations of the system.
- the array 128 of re-imaging lenses 128 a and the array of spectral filters 130can respectively correspond to the distinct optical channels 120 .
- the plurality of optical channels 120can be spatially and/or spectrally distinct.
- the plurality of optical channels 120can be formed in the object space and/or image space.
- the spatially and spectrally different optical channelscan be separated angularly in space.
- the array of spectral filters 130may additionally include a filter-holding aperture mask (comprising, for example, IR light-blocking materials such as ceramic, metal, or plastic).
- each of the re-imaging lenses 128 acan be spatially aligned with a respectively-corresponding spectral region.
- each filter element from the array of spectral filters 130corresponds to a different spectral region.
- Each re-imaging lens 128 a and the corresponding filter element of the array of spectral filter 130can coincide with (or form) a portion of the divided aperture and therefore with respectively-corresponding spatial channel 120 . Accordingly, in various embodiments an imaging lens 128 a and a corresponding spectral filter can be disposed in the optical path of one of the plurality of optical channels 120 . Radiation from the object 110 propagating through each of the plurality of optical channels 120 travels along the optical path of each re-imaging lens 128 a and the corresponding filter element of the array of spectral filter 130 and is incident on the detector array (e.g., FPA component) 136 to form a single image (e.g., sub-image) of the object 110 .
- the detector arraye.g., FPA component
- the image formed by the detector array 136generally includes a plurality of sub-images formed by each of the optical channels 120 .
- Each of the plurality of sub-imagescan provide different spatial and spectral information of the object 110 .
- the different spatial informationresults from some parallax because of the different spatial locations of the smaller apertures of the divided aperture.
- adjacent sub-imagescan be characterized by close or substantially equal spectral signatures.
- the detector array (e.g., FPA component) 136is further operably connected with a data-processing unit that includes a processor 150 (not shown).
- the processorcan comprise processing electronics.
- the data-processing unitcan be located remotely from the detector array 136 .
- the data-processing unitcan be located at a distance of about 10-3000 feet from the detector array 136 .
- the data-processing unitcan be located at a distance less than about 10 feet from the detector array 136 or greater than about 3000 feet.
- the data-processing unitcan be connected to the detector array by a wired or a wireless communication link.
- the detector array (e.g., FPA component) 136 and/or the data-processing unitcan be operably connected with a display device.
- the processor or processing electronics 150can be programmed to aggregate the data acquired with the system 100 into a spectral data cube.
- the data cuberepresents, in spatial (x, y) and spectral ( ⁇ ) coordinates, an overall spectral image of the object 110 within the spectral region defined by the combination of the filter elements in the array of spectral filters 130 .
- the processor or processing electronics 150may be programmed to determine the unique absorption characteristic of the object 110 .
- the processor 150can, alternatively or in addition, map the overall image data cube into a cube of data representing, for example, spatial distribution of concentrations, c, of targeted chemical components within the field of view associated with the object 110 .
- Various implementations of the embodiment 100can include an optional moveable temperature-controlled reference source 160 including, for example, a shutter system comprising one or more reference shutters maintained at different temperatures.
- the reference source 160can include a heater, a cooler or a temperature-controlled element configured to maintain the reference source 160 at a desired temperature.
- the embodiment 100can include two reference shutters maintained at different temperatures. In various implementations including more than one reference shutter, some of the shutters may not be temperature controlled.
- the reference source 160is removably and, in one implementation, periodically inserted into an optical path of light traversing the system 100 from the object 110 to the detector array (e.g., FPA component) 136 along at least one of the channels 120 .
- the removable reference source 160thus can block such optical path.
- this reference source 160can provide a reference IR spectrum to recalibrate various components including the detector array 136 of the system 100 in real time.
- the front objective lens system 124is shown to include a single front objective lens positioned to establish a common field-of-view (FOV) for the reimaging lenses 128 a and to define an aperture stop for the whole system.
- FOVfield-of-view
- the aperture stopsubstantially spatially coincides with and/or is about the same size or slightly larger, as the plurality of smaller limiting apertures corresponding to different optical channels 120 .
- the positions for spectral filters of the different optical channels 120coincide with the position of the aperture stop of the whole system, which in this example is shown as a surface between the lens system 124 and the array 128 of the reimaging lenses 128 a .
- the lens system 124can be an objective lens 124 .
- the objective lens 124is optional and various embodiments of the system 100 need not include the objective lens 124 .
- the objective lens 124can slightly shift the images obtained by the different detectors in the array 136 spatially along a direction perpendicular to optical axis of the lens 124 , thus the functionality of the system 100 is not necessarily compromised when the objective lens 124 is not included.
- the field apertures corresponding to different optical channelsmay be located in the same or different planes. These field apertures may be defined by the aperture of the reimaging lens 128 a and/or filters in the divided aperture 130 in certain implementations.
- the field apertures corresponding to different optical channelscan be located in different planes and the different planes can be optical conjugates of one another.
- the filter elements in the array of spectral filters 130 of the embodiment 100are shown to lie in one plane, generally different filter elements of the array of spectral filter 130 can be disposed in different planes.
- different filter elements of the array of spectral filters 130can be disposed in different planes that are optically conjugate to one another.
- the different filter elementscan be disposed in non-conjugate planes.
- the front objective lens 124need not be a single optical element, but instead can include a plurality of lenses 224 as shown in an embodiment 200 of the DAISI imaging system in FIG. 2 .
- These lenses 224are configured to divide an incoming optical wavefront from the object 110 .
- the array of front objective lenses 224can be disposed so as to receive an IR wavefront emitted by the object that is directed toward the DAISI system.
- the plurality of front objective lenses 224divide the wavefront spatially into non-overlapping sections.
- FIG. 2shows three objective lenses 224 in a front optical portion of the optical system contributing to the spatial division of the aperture of the system in this example.
- the plurality of objective lenses 224can be configured as a two-dimensional (2D) array of lenses.
- FIG. 2presents a general view of the imaging system 200 and the resultant field of view of the imaging system 200 .
- An exploded view 202 of the imaging system 200is also depicted in greater detail in a figure inset of FIG. 2 .
- the embodiment of the imaging system 200includes a field reference 204 at the front end of the system.
- the field reference 204can be used to truncate the field of view.
- the configuration illustrated in FIG. 2has an operational advantage over embodiment 100 of FIG. 1 in that the overall size and/or weight and/or cost of manufacture of the embodiment 200 can be greatly reduced because the objective lens is smaller.
- Each pair of the lenses in the array 224 and the array 128is associated with a field of view (FOV).
- FOVfield of view
- Each pair of lenses in the array 224 and the array 128receives light from the object from a different angle. While the lenses 224 are shown to be disposed substantially in the same plane, optionally different objective lenses in the array of front objective lenses 224 can be disposed in more than one plane. For example, some of the individual lenses 224 can be displaced with respect to some other individual lenses 224 along the axis 226 (not shown) and/or have different focal lengths as compared to some other lenses 224 . As discussed below, the field reference 204 can be useful in calibrating the multiple detectors 236 .
- the front objective lens systemsuch as the array of lenses 224 is configured as an array of lenses integrated or molded in association with a monolithic substrate. Such an arrangement can reduce the costs and complexity otherwise accompanying the optical adjustment of individual lenses within the system.
- An individual lens 224can optionally include a lens with varying magnification.
- a pair of thin and large diameter Alvarez platescan be used in at least a portion of the front objective lens system. Without any loss of generality, the Alvarez plates can produce a change in focal length when translated orthogonally with respect to the optical beam.
- the detector array 136configured to receive the optical data representing spectral signature(s) of the imaged object 110 can be configured as a single imaging array (e.g., FPA) 136 .
- This single arraymay be adapted to acquire more than one image (formed by more than one optical channel 120 ) simultaneously.
- the detector array 136may include a FPA unit.
- the FPA unitcan include a plurality of optical FPAs. At least one of these plurality of FPAs can be configured to acquire more than one spectrally distinct image of the imaged object. For example, as shown in the embodiment 200 of FIG.
- the number of FPAs included in the FPA unitmay correspond to the number of the front objective lenses 224 .
- the FPA unitcan include an array of microbolometers. The use of multiple microbolometers advantageously allows for an inexpensive way to increase the total number of detection elements (i.e. pixels) for recording of the three-dimensional data cube in a single acquisition event (i.e. one snapshot).
- an array of microbolometersmore efficiently utilizes the detector pixels of the array of FPAs (e.g., each FPA) as the number of unused pixels is reduced, minimized and/or eliminated between the images that may exist when using a single microbolometer.
- the optical filtersused in various implementations of the system, that provide spectrally-distinct IR image (e.g., sub-image) of the object can employ absorption filters, interference filters, and Fabry-Perot etalon based filters, to name just a few.
- interference filtersare used, the image acquisition through an individual imaging channel defined by an individual re-imaging lens (such as a lens 128 a of FIGS. 1 and 2 ) may be carried out in a single spectral bandwidth or multiple spectral bandwidths.
- the optical filtering configuration of various embodiments disclosed hereinmay advantageously use a bandpass filter having a specified spectral band.
- the filtersmay be placed in front of the optical FPA (or generally, between the optical FPA and the object).
- the predominant contribution to noise associated with image acquisitioncan be attributed to detector noise.
- various embodiments disclosed hereinutilize spectrally-multiplexed filters.
- the spectrally-multiplexed filterscan comprise a plurality of long pass (LP) filters, a plurality of band pass filters and any combinations thereof.
- a LP filtergenerally attenuates shorter wavelengths and transmits (passes) longer wavelengths (e.g., over the active range of the target IR portion of the spectrum).
- SP filtersmay also be used.
- a SP filtergenerally attenuates longer wavelengths and transmits (passes) shorter wavelengths (e.g., over the active range of the target IR portion of the spectrum).
- embodiments of the imaging system described hereincan use less sensitive microbolometers without compromising the SNR.
- the use of microbolometers, as detector-noise-limited devicesin turn not only benefits from the use of spectrally multiplexed filters, but also does not require cooling of the imaging system during normal operation.
- various embodimentsmay optionally, and in addition to a temperature-controlled reference unit (for example temperature controlled shutters such as shutter 160 ), employ a field reference component, or an array of field reference components (e.g., filed reference apertures), to enable dynamic calibration.
- a temperature-controlled reference unitfor example temperature controlled shutters such as shutter 160
- a field reference componentor an array of field reference components (e.g., filed reference apertures)
- Such dynamic calibrationcan be used for spectral acquisition of one or more or every data cube.
- Such dynamic calibrationcan also be used for a spectrally-neutral camera-to-camera combination to enable dynamic compensation of parallax artifacts.
- the use of the temperature-controlled reference unit (for example, temperature-controlled shutter system 160 ) and field-reference component(s)facilitates maintenance of proper calibration of each of the FPAs individually and the entire FPA unit as a whole.
- the temperature-controlled unitgenerally employs a system having first and second temperature zones maintained at first and second different temperatures.
- shutter system of each of the embodiments 100 and 200can employ not one but at least two temperature-controlled shutters that are substantially parallel to one another and transverse to the general optical axis 226 of the embodiment(s) 100 and 200 .
- Two shutters at two different temperaturesmay be employed to provide more information for calibration; for example, the absolute value of the difference between FPAs at one temperature as well as the change in that difference with temperature change can be recorded.
- only one of the two shutterscan be temperature controlled in various implementations while the other is not.
- multiple shutterscan be employed to create a known reference temperature difference perceived by the FPA.
- This reference temperature differenceis provided by the IR radiation emitted by the multiple shutters when they are positioned to block the radiation from the object 110 .
- the system having first and second temperature zonesmay include a single or multi-portion piece.
- This single or multi-portion piecemay comprise for example a plate. This piece may be mechanically-movable across the optical axis with the use of appropriate guides and having a first portion at a first temperature and a second portion at a second temperature.
- Various implementations of the DAISI systemcan include a variety of temperature calibration elements to facilitate dynamic calibration of the FPAs.
- the temperature calibration elementscan include mirrors as well as reference sources.
- the use of optically-filtered FPAs in various embodiments of the system described hereincan provide a system with higher number of pixels.
- embodiments including a single large format microbolometer FPA arraycan provide a system with large number of pixels.
- Various embodiments of the systems described hereincan also offer a high optical throughput for a substantially low number of optical channels.
- the systems described hereincan provide a high optical throughput for a number of optical channels between 4 and 50.
- the systems described hereinhave wider spectral bins which allows the signals acquired within each spectral bin to have a greater integrated intensity.
- the typical gas cloud measurement modelis a three-layer radiative transfer system, in which the ray path is divided into three regions: (1) a layer of atmosphere between the sensor and the gas cloud, (2) a layer containing one or more of the target gases, and (3) an atmosphere behind the gas. Layer (3) is followed by a radiation source, which may either be an opaque surface or the sky itself.
- FIG. 3illustrates an example of the measurement geometry for a gas cloud imager (GCI).
- GCIgas cloud imager
- a spectral imagermeasures the at-sensor radiance given by the line integral of the light extending from the source, through each of the three layers of the system (see FIG. 3 ).
- M (0)L f + ⁇ f L b + ⁇ f ⁇ b L s .
- M (1)L f + ⁇ f (1 ⁇ c ) B ( T c )+ ⁇ f ⁇ c L b + ⁇ f ⁇ c ⁇ b L s .
- the approach taken in the existing literatureis generally the following.
- the gas absorption cross-section spectrum ⁇ ( ⁇ )is easily obtained from a spectral library.
- the remaining unknownsare T b , L s , and T c .
- the temperature of the gas cloud T c and the atmosphere behind it T bare often taken as being the same and estimated by the operator using an independent measurement of the air temperature.
- the source radiance L sis generally taken to be either a greybody (if the background is an opaque surface) or is estimated from radiative transfer modelling software, such as MODTRAN.
- total emissionis better measured by first estimating the emission rate over a period of time, and then integrating over that time period to get the total gas emission.
- the conventional methoduses a number of steps in which an operator must manually specify quantities in order for the computation to proceed.
- This type of methodcannot be performed autonomously under conditions of changing weather, temperature, etc. It also makes the assumption that the source (if an opaque surface) is a greybody—an assumption that we see violated in much of our own testing.
- nlM ( 1 ) - M ( 0 ) ⁇ ⁇ [ B ⁇ ( T c ) - M ( 0 ) ] , ( 6 ) 4. Calculating a Running Average of a Scene
- the systemneeds to acquire an initial estimate of the scene reference datacube M (0) (x,y, ⁇ ). For this we simply collect a sequence of datacubes of the scene and average them together. Until a reliable initial estimate is formed, the system cannot attempt gas cloud detection, since the results are no more reliable than the reference datacube is.
- This methodtherefore uses a running estimate of the SNR, which is calculated as follows. Along with the algorithm that continuously updates the reference datacube with each new frame, we also calculate and continuously update an estimated variance with each new frame, as illustrated in blocks 430 and 440 .
- the previous frame's value at that pixelis the one used in the “updated” reference datacube.
- the above algorithmapplies the update (i.e. it uses the new value for x mean rather than the previous frame's x mean for the pixel's value in the reference datacube). 5. Calculating the Absorption, Gas Column Density, and Absolute Quantity of Gas
- FIG. 5is a flowchart of an example method 500 for detecting a gas cloud.
- measuring the absorption by a gasrequires knowing the quantity of light reaching the sensor both with and without the gas.
- the absorption spectrum at a pixelis given by (5), where M (0) represents the reference datacube, M (1) is the datacube obtained in the current frame, B(T c ) is the Planck blackbody spectrum at temperature T c , and T c is the gas cloud temperature.
- the first techniqueis to average the absorption over one or more spectral bands in which the gas absorption cross-section is significant (i.e. not close to zero).
- a second techniqueis to use a statistical method to fit the gas cross-section spectrum to the measured absorption spectrum. Both of these techniques work, with the former requiring less computation, and the latter being more accurate but also more in need of regularization.
- the next stepis to convert the measurement units to an absolute quantity. In order to convert a measurement in ppm ⁇ m units to one in ppm ⁇ m 3 units, we need only calculate the effective area of a pixel projected onto the gas cloud.
- FIG. 6illustrates a gas cloud imager detector pixel projected to the location of the gas cloud.
- FIG. 7is a flowchart of an example method 700 for calculating the absolute quantity of gas present in a gas cloud. While the pixel dimension p x and f are known as a result of the hardware design, the gas cloud distance z varies and must be estimated.
- the gas cloud distance zvaries and must be estimated.
- one of the early setup proceduresis to measure the distances from the camera to the primary items to be monitored. These items are often things such as a collection of tightly interwound pipes, the wall of a gas container tank, the opening of a gas separator tank, etc.
- the important thingis that the general region in which potential leaks may occur is known a priori, and thus the distance to any gas leak can be estimated to reasonable accuracy by using that distance as measured during the system setup.
- This calculationgives the absolute gas quantity at each pixel in the image, and if we sum over all pixels in the image we obtain the total volume of gas at one snapshot in time.
- While the distance to the gas cloudcan be estimated by assuming that the cloud will occur near the equipment being monitored. There are other techniques which are also available. One can use multiple infrared cameras viewing the same scene to triangulate on the gas cloud. Another method is the use a laser tracker (or “laser range finder”) tuned to a wavelength that is absorbed by the gas.
- FIG. 8is a flowchart of an example method 800 for quantizing the emission rate of a gas leak.
- the methodbegins with an estimate of the quantity of gas present at each pixel of the image (which can be determined using the method illustrated in FIG. 5 ).
- the total volume of gas present in the imagecan be calculated by summing over all pixels in the frame.
- this measure of the gas volume, and an estimate of its concentrationare the two most important measures.
- the formerdetermines the scale of the danger, and the latter determines whether the cloud is capable of igniting. If we are using the gas cloud imager not for safety monitoring but for environmental monitoring or for gas leak detection and repair (LDAR), then the primary quantities of interest are emission rate (units of kg/hr, for example) and total emission (units of kg). At block 830 , the emission rate and/or total emission of the gas leak can be calculated. Estimating these quantities requires some additional work.
- FIG. 9is a flowchart of an example method 900 for compensating an estimate of emission rate based on gas exiting the field of view of the camera and absorption dropping below sensitivity limits of the camera.
- a temporally-smoothed moving average of the total gas in the sceneis efficiently implemented using an exponentially-weighted mean average (EWMA).
- EWMAexponentially-weighted mean average
- Estimating the amount of gas that we expect to lose detection to by the time of the next frameis determined using a simple heuristic model that is adjusted to match experimental data.
- a thresholdis set to be some fraction of the range of ppm ⁇ m values above the minimum detected value. Thus, if the maximum ppm ⁇ m value detected within a gas cloud were calculated as 5000 ppm ⁇ m, and the lowest value were 100 ppm ⁇ m, then the range would be 4900 ppm ⁇ m.
- FIG. 8illustrates a top view of an example scene measured by a gas cloud imager camera, with the gas cloud at a distance z (left).
- FIG. 10also illustrates the example scene as viewed from the gas cloud imager camera itself (right). The hatched region at the right hand side of the image indicates the area in which any detected gas is expected to leave the field of view by the next frame (due to being pushed out by wind).
- the wind speed and directionare known (for example with an external wind gauge that communicates with the camera), then we can calculate the projection onto the image and estimate the amount that the gas will move in terms of pixels in the image. For example, say we find a result that the wind motion will cause the gas to move 2 pixels in the horizontal direction and 0 pixels in the vertical.
- the wind speedis such that the number of pixels of motion before the next frame (when imaging at 15 Hz) is less than 2 pixels, so that interpolation of the pixel values is important.
- the method 900 aboveprovides an estimate of the gas emission rate, for each frame within the video sequence, as shown at block 960 . If we sum over all of the images within the sequence then we obtain the total gas emission volume, as shown at block 970 , providing the second of the quantities of interest for environmental and leak detection and repair (LDAR) monitoring.
- LDARleak detection and repair
- FIG. 11shows an example of the gas cloud imager (GCI) live viewer graphical user interface.
- the interfaceincludes a manual record button toward the lower right. Recorded videos can be uploaded to a webserver for easy viewing from a web browser or downloading to a local computer.
- the interfacealso includes a countdown bar that informs the operator when the camera is ready to move. To extend time at a particular field of view, an operator can click on the “Extend Time” button to the right of the countdown bar. The system automatically resumes its scan after the extended time period is finished. If the operator wants to scan before the extend time has finished he/she can click on the resume scan button.
- FIG. 12shows an example of the mosaic viewer interface.
- the GCI's mosaic viewercan be located right next to the live viewer on a separate monitor and displays the entire monitored area, as shown in FIG. 12 . Operators can move the camera to any location in the monitored area by simply clicking on that portion of the mosaic viewer. The camera will stay at that field until the countdown bar has finished (typically 60 secs) and then resumes its automatic motion path. When an alarm has occurred in a particular field a red box will highlight in the mosaic viewer until it has returned to that field and not had an alarm event.
- FIG. 13shows an example of the graphical user interface with an alarm condition.
- the banner at the top of the Live Viewerchanges to RED.
- the detected gasis shown in the Gases Detected List.
- a concentration color bar in ppm-m unitsis displayed to the right of the viewer.
- the gas cloudis false colored in terms of its concentration and shown in real time on the live viewer screen. Behind the scenes, an email is also sent out to all users with a link to view the gas release from the web server.
- FIG. 14shows an example of an alarm thresholds settings window. At any time an operator can view the alarm thresholds for each gas being monitored by clicking on the settings button in the lower left corner of the live viewer, as shown in FIG. 14 . To adjust the thresholds an authorized user can login to the dialog window and adjust the thresholds from the same dialog window.
- the gas cloud imager (GCI) systemuses low-resolution spectroscopy to achieve higher SNR than available with high-resolution spectroscopy. While this has the disadvantage of making the system less capable of discriminating among different spectra, it also has the important advantage that it is less sensitive to saturation. That is, in high-resolution spectroscopy, the sharp absorption/emission features of gases will tend to saturate (i.e. e ⁇ ⁇ for absorption coefficient a) even on smaller gas clouds. With low-resolution spectra, however, saturation of these features tends to have little effect on the overall intensity across a measured spectral channel because the sharp features tend to be too small to dominate the signal. As a result, one can often ignore saturation effects entirely when working with low-resolution spectra.
- spectral infrared gas detection algorithmsmay operate roughly as follows.
- the algorithmmonitors the pixel in the scene and looks for spectral radiance changes. Changes that correspond closely to spectral features of a known gas are classified as a detection, and quantification of the pixel's gas column density follows. Summing and scaling all detected pixels within an image provides an estimate of the total cloud volume, so that tracking the total gas volume over a sequence of frames allows for emissions monitoring.
- the primary taskis simple detection—the most important thing is to determine whether a gas cloud is present, what gas it is made of, and where it is.
- the secondary taskis concentration estimation and quantification—we want to know how much gas is present and what hazards the detected gas poses.
- the tertiary taskis to monitor the gas overtime and form an emission rate estimate.
- FIG. 15shows the measurement geometry for a single pixel in a gas cloud imager.
- the camera line of sightviews (1) the background infrared radiation through (2) a gas cloud layer and (3) a foreground atmospheric layer.
- the gas cloud measurement modelis a two-layer radiative transfer system ( FIG. 15 ), in which (1) spectral radiance is generated within a source region which can be either an opaque object such as the ground, or the atmosphere itself, such as when viewing the cloudless sky, or a combination of the two. (2) The source spectral radiance next traverses the gas cloud layer, and is either attenuated or increased by absorption or emission of gases located there. (3) Finally, the radiation passes through a final atmospheric layer before reaching the camera.
- This measurement modelis simpler than the three-layer version often used in the literature, in which there is an additional background atmospheric layer between the gas and an opaque radiation source.
- the simpler model used herereflects the fact that the autonomous algorithm is agnostic to the spectrum of the background light—whether the atmospheric layer behind the gas is absorbing light from an opaque background source or is itself the source of radiation is information that is not used by the algorithm.
- the absorption values given by taking a measurement spectrum and comparing it with a reference spectrumwe therefore look for spectral radiance changes in the scene that may indicate absorption or emission by a gas cloud by comparing the current frame against a reference frame.
- the reference framemay be a frame obtained at a previous point in time, or a kind of running average.
- the time difference between the current frame and the reference frameis short (e.g.
- M (0)L f + ⁇ f (1 ⁇ s (0) ) B ( T g )+ ⁇ f ⁇ g (0) L b
- M (1)L f + ⁇ f (1 ⁇ g (1) ) B ( T g )+ ⁇ f ⁇ g (1) L b .
- the sign of the radiance contrastindicates whether the cloud is observed in emission ( ⁇ L>0) or absorption ( ⁇ L ⁇ 0).
- a low signal strengthcan result from either a low gas concentration or a poor radiance contrast, and in the latter case it is difficult to obtain an accurate estimate of the concentration, so that one can either assume a concentration of 0 or use spatial and temporal correlations in the data to infer the concentration at a pixel given the value at its neighbors. (Note that spatial-temporal correlations among gas cloud pixels can extend across large regions of the image, and over many frames of data, so that more than just the nearest neighbors can be used to infer the concentration at an unknown pixel.)
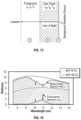
- FIG. 16shows an example absorption spectrum measurement for propylene gas, showing the measured spectrum M( ⁇ ).
- Equation 1relates the transmission of the gas layer to the measured changes in radiance at the sensor. Using the Beer-Lambert-Bouguer law, the transmission is related to the concentration and size of the gas as
- ⁇ gexp ⁇ [ - ⁇ ⁇ ( ⁇ 0 l ⁇ n ⁇ ( z ) ⁇ dz ) ] ⁇ exp ⁇ ( - ⁇ ⁇ ⁇ nl ) , where ⁇ is the absorption cross-section, n the gas concentration (number density), and l the path length through the gas.
- ⁇is the absorption cross-section
- nthe gas concentration (number density)
- lpath length through the gas.
- the transmissioncan be modeled with a linearized version of the Beer-Lambert-Bouguer equation obtained by Taylor expansion:
- the temperature of the gas T gis commonly assumed to be equal to that of the ambient air, under the assumption that the gas quickly entrains into the local air.
- the important quantities that typically impact ⁇ f for path lengths less than 1 kmare those of water vapor and dust. Ignoring the presence of spatially-dependent water vapor variation caused by steam, fog, or rain, the overall average concentration of water vapor in the ambient air can be estimated with a humidity sensor, so that together with an estimate of the distance to a gas cloud, one can then estimate ⁇ f .
- ⁇ fcan be taken as equal to 1.
- the value for ais determined from the type of gas detected, and can be obtained from a spectral library, such as the NIST Infrared Database.
- Equation 4provides the relationships between the change in gas column density ⁇ ,the measured radiance properties, and the known gas absorption spectrum ⁇ ( ⁇ ).
- the first techniqueis to average the measured absorption ⁇ M/[M (0) ⁇ (T g )] over one or more spectral bands in which the gas absorption cross-section is significant (i.e. not close to zero). If the other quantities on the right-hand side of (4) are likewise averaged across the same bands, then one obtains an estimate for ⁇ with minimal computational effort.
- a second techniqueis to use a statistical method to set the gas cross-section spectrum to the measured absorption spectrum, which is more accurate but involves careful regularization in the presence of noisy data and (especially) background clutter.
- the trickis to find a criterion by which to discriminate between objects that have moved in front of the background, thereby obscuring it—in which case an update should not be performed—and a change to the background itself—in which case the update should be performed.
- Another problem that can occur with a running updateis that if a gas cloud is present in a scene, then its spectral signature can quickly get “burned into” the reference spectrum, so that the system loses sensitivity. We also want a criterion to minimize this from occurring.
- the method we useis an SNR threshold based masking of the update procedure. That is, along with the reference spectrum of the pixel, we also calculate a running estimate of the variance of each spectral channel of the pixel. Taking the ratio of the running mean with the square root of the running variance estimate gives an SNR value at each spectral channel.
- the above algorithmtherefore becomes, in pseudocode,
- the initial step of this calculationestimating the projected area of a pixel at the cloud, is easily obtained by multiplying the known dimensions of the detector array pixels (p x , p y ) by the image magnification, which is a function of the focal length f of the camera objective lens and the distance z to the gas cloud.
- FIG. 17shows a detector pixel projected to the location of the gas cloud.
- P xthe plane of the gas cloud
- the gas cloud distance zvaries and can be estimated.
- one of the early set up proceduresis to measure the distances from the camera to the primary items to be monitored. These items are often things such as a collection of tightly interwoven pipes, the wall of a gas container tank, the valves of a gas separator tank, etc.
- the important thingis that the general region in which potential leaks may occur is known a priori, and thus the distance to any gas leak can be estimated to reasonable accuracy by using that distance is measured during the system set up.
- While the distance to the gas cloudcan be estimated by assuming that the gas cloud will occur near the equipment being monitored. There are other techniques which are also available. One can use multiple infrared cameras viewing the same scene to triangulate on the gas cloud. Another method is the use of a laser tracker (or “laser rangefinder”) tuned to a wavelength that is absorbed by the gas.
- the algorithmalso monitors the edges of the field of view, so that if there is wind in the scene, or if the gas is moving rapidly due to buoyancy effects, then it can estimate the volume of gas exiting the camera's field of view and add this amount back into the leak rate. Similarly, if any gas enters the field of view from outside, then that portion of the gas volume is subtracted from the leak rate estimate.
- the final stepis to develop a method for measuring sensitivity loss, and augment the leak rate estimate with the corresponding loss term.
- the algorithmfirst calculates the range of gas column density values detected within the gas cloud.
- the next stepattempts to estimate how much gas will exit the edges of the field of view between the current and the next frame, or how much has entered the field of view from outside it since the previous frame. This either involves knowing the wind speed and direction in terms of the GCI's optical axis, or using video analytics to estimate the speed of motion of the gas. If the wind speed and direction are known (for example with an external wind gauge), then it is a simple calculation to determine the speed in terms of pixels in the image, and estimate gas motion in that way. Wind, however, is generally not as well-behaved as this, so that a unidirectional model of motion will fail to capture the swirls and rapid changes of direction that occur in real life. Thus, estimating flow by modeling the gas motion can be useful for an accurate measure. Because flow estimation is known to be computationally intensive, an important means of reducing the size of the problem is to realize that we need only model flow within the outer boundaries of the image, and not the image as a whole.
- the estimated leak emission rateis the amount by which the augmented gas volume has increased since the last frame. If the augmented gas volume has decreased, then we say that the estimated emission is zero. (That is, the estimate is biased to accept only positive values.) Performing this procedure for every frame over an extended period of observation—such as a 10-second period of a video sequence—the algorithm can obtain the average emission rate over that period.
- the devices, systems, and methods described hereincan advantageously be implemented using, for example, computer software, hardware, firmware, or any combination of software, hardware, and firmware.
- Software modulescan comprise computer executable code for performing the functions described herein.
- computer-executable codeis executed by one or more general purpose computers (including desktop computers, notebook computers, tablet computers, smart phones, etc).
- general purpose computersincluding desktop computers, notebook computers, tablet computers, smart phones, etc.
- any module that can be implemented using software to be executed on a general purpose computercan also be implemented using a different combination of hardware, software, or firmware.
- such a modulecan be implemented completely in hardware using a combination of integrated circuits.
- such a modulecan be implemented completely or partially using specialized computers designed to perform the particular functions described herein rather than by general purpose computers.
- a modulecan be implemented completely or partially using specialized computers designed to perform the particular functions described herein rather than by general purpose computers.
- methodsare described that are, or could be, at least in part carried out by computer software, it should be understood that such methods can be provided on non-transitory computer-readable media (e.g., optical disks such as CDs or DVDs, hard disk drives, flash memories, diskettes, or the like) that, when read by a computer or other processing device, cause it to carry out the method.
- the devices described hereincan exchange information with each other, or with other devices, via one or more communication channels.
- Such communication channelscan be wired or wireless, and can include networks, such as a Local Area Network, a Wide Area Network, the Internet, etc.
Landscapes
- Physics & Mathematics (AREA)
- Spectroscopy & Molecular Physics (AREA)
- General Physics & Mathematics (AREA)
- Health & Medical Sciences (AREA)
- Life Sciences & Earth Sciences (AREA)
- Chemical & Material Sciences (AREA)
- Analytical Chemistry (AREA)
- Biochemistry (AREA)
- General Health & Medical Sciences (AREA)
- Immunology (AREA)
- Pathology (AREA)
- Investigating Or Analysing Materials By Optical Means (AREA)
Abstract
Description
- Lf, Lb, Ls: radiances originating from foreground, background, and source layers
- τf, τb, τc: transmission of foreground, background, and cloud layers
- Tf; Tb, Tc: temperatures of foreground, background, and cloud layers
- M(0), M(1): at-sensor radiance in the absence (0) or presence (1) of the cloud
- σm: absorption cross-section of target gas m
- ηm: concentration of target gas m
- l: path length through the gas cloud
M(0)=Lf+τfLb+τfτbLs.
When a gas cloud is present, this becomes
M(1)=Lf+τf(1−τc)B(Tc)+τfτcLb+τfτcτbLs.
Subtracting M(0)from M(1)gives the radiance difference in the presence of the target gas cloud:
ΔM=M(1)−M(0)=−τf(1−τc)[Lb+τbLs−B(Tc)], (1)
where ΔL, the term [Lb+τbLs−B(Tc)], is the “thermal radiance contrast,” the sign of which indicates whether the cloud is observed in emission (ΔL<0) or absorption (ΔL>0). When the background may be approximated as a homogeneous layer at thermal equilibrium, we can further write that Lb=(1−τb) B(Tb). Note that all of these quantities have an implicit spectral dependence (i.e. M(0)≡M(0)(λ) etc.).
1−τc=−ΔM/(τfΔL) (2)
When the gas concentration is low, the transmission can be modeled with a linearized version of the Beer-Lambert equation obtained by Taylor expansion:
for absorbance αc. For a single gas, the absorbance can be written in terms of the absorption cross-section σ, the number density (or “concentration”) n, and the path length l through the layer as αc=σnl. Using (3) to substitute this into (2) gives
where the left hand side represents the quantity we want to know—the concentration x path length, or “column density.”
M(0)=Lf+τfLs
M(1)=Lf+τf(1−τc)B(Tc)+τfτcLs
ΔM=M(1)−M(0)=τf(1−τc)[B(Tc)−Ls]
Here we can interpret the quantity M(0)(λ) as being either the at-sensor radiance spectrum measured at an initial time, or as a running mean of the at-sensor radiance, so that what we choose to measure will be fluctuations about a mean value. Since gas clouds on this scale are dynamic and fast-moving phenomena, this method still produces excellent gas cloud detection, as we will show below. Finally, for estimation of the gas column density nl from measurements, we use
4. Calculating a Running Average of a Scene


Δx=xi−
x+=Δx/i (b)
where x is the quantity to average (such as the scene datacube), xmeanis its running mean, and i is the frame counter (i.e. if the current frame is the 15th, then i=14, since the counter starts at zero.
Δx=xi−
xmean+=Δx/i (b)
m2+=Δx*(x−xmean) (c)
varx=m2/(i−1) (d)
SNRx=(x−xmean)/√{square root over (varx)} (e)
where varxis the estimated variance for the pixel at the current frame, √{square root over (varx)} is the corresponding estimated standard deviation. Thus, as illustrated in
5. Calculating the Absorption, Gas Column Density, and Absolute Quantity of Gas
Since most detectors have px=py, we can write that the projected area of the pixel is therefore
Aproj=(pxz/f)2 (7)
(ppm·mthreshold)=(minimum ppm·m)+0.2(ppm·mrange)=100+0.2(4900)=1080.
Next we locate the set of all “edge pixels” in the gas cloud—all pixels that lie no more than two pixels away from a pixel without gas detected. We expect that some fraction of edge pixels whose column density lies below the calculated threshold will drop below the detection limit of the camera. Using experimental data, we determined that the best value for our camera was 0.25. (As we will see, the final result is usually not very sensitive to the values chosen for use in this heuristic model.) So, say we find all of the edge pixels that lie below the threshold, sum up all of their ppm·m values, and multiply the result by 0.25. This is the total amount of gas we expect to lose sensitivity to by the next frame. Store that value at
- Lf, Lg, Lb: radiances originating from foreground, gas, and background layers
- M: at-sensor radiance
- τf, τg: transmission of foreground and gas layers
- Tf; Tg: temperatures of foreground and gas layers
Thus, for a pixel in the scene, using the measurement model shown inFIG.1 , we can write the radiative transfer equation of a ray along the line of sight to given at-sensor radiance M of
M=Lf+τfεgB(Tg)+τfτgLb,
where εgis the spectral emissivity of the gas. Note that all of these quantities have an implicit spectral dependence (i.e. M≡M(λ) etc.). Using Kirchoff's law and an assumption of local thermodynamic equilibrium, we can also make the substitution εg=1−τg. Since the pixels in the scene can be treated independently, we need not include the pixel's spatial location within the scene as a variable to model, and thus we can drop the (x, y) dependence from all of the variables and consider only a single pixel at a time.
M(0)=Lf+τf(1−τs(0))B(Tg)+τfτg(0)Lb,
M(1)=Lf+τf(1−τg(1))B(Tg)+τfτg(1)Lb.
ΔM=M(1)−M(0)=−τf(τg(1)−τg(0))[B(Tg)−Lb], (1)
where we use ΔL, which equals Lb, for the “radiance contrast” between the gas cloud layer and the background. The sign of the radiance contrast indicates whether the cloud is observed in emission (ΔL>0) or absorption (ΔL<0). Next, we can correlate the measured spectral radiance change at the sensor ΔM(λ) With the known spectral shape of various library gases, and if the correlation is high enough, and the spectral radiance changes large enough to warrant the change being a result of true signal and not noise, then the pixel is labeled as a “detection” and we can continue on to quantify the detected gas. As we will see below, a low signal strength can result from either a low gas concentration or a poor radiance contrast, and in the latter case it is difficult to obtain an accurate estimate of the concentration, so that one can either assume a concentration of 0 or use spatial and temporal correlations in the data to infer the concentration at a pixel given the value at its neighbors. (Note that spatial-temporal correlations among gas cloud pixels can extend across large regions of the image, and over many frames of data, so that more than just the nearest neighbors can be used to infer the concentration at an unknown pixel.)
where σ is the absorption cross-section, n the gas concentration (number density), and l the path length through the gas. The above approximation becomes valid when the gas layer is approximately homogeneous. Since the measurement involves an integral through the gas layer, it is difficult to separate the contribution of the gas concentration n from the cloud path length l using the radiance value alone, and so we group these two together into a single quantity—the column density ζ=nl.
so that α=−σζ. From (1), the quantity we use during measurement is (τg(1)−τg(0)), which in the thin gas approximation gives
τg(1)−τg(0)≅α(0)−α(1)=σζ(0)−σζ(1)=−αΔζ.
- while new_data:
D=M_i−Mbar
Mbar+=D/i
B+=D*(M−Mbar)
var_M=V/(i−1)
SNR_M=(M_i−Mbar)/sqrt(var_M)
whereM is written as Mbar, and the at-sensor radiance of the current frame as M_i, with i the frame counter. The results var_M and SNR_M are the variance and SNR of the at-sensor radiance. The parameters D and V are the difference value and statistical second moment, used to calculate the variance. For the first second of time in which data is collected, the SNR is calculated over the scene, allowing for all pixels to be updated. Following that, with each new frame we create a binary mask such that for any pixel spectral channel whose SNR value is above a selected threshold, the running update is not applied. This is the simple criterion by which the algorithm determines that a new object has entered the field of view and blocked the background source. For any pixel whose SNR is at or below the threshold, the algorithm applies the running update toM and var(M).
4. Estimating the Total Gas Quantity
- while new_data:
Px≈Pxz/f.
Since most detectors have px=py, we can write that the projected area of the pixel is therefore
Aproj=(pxz/f)2 (6)
(ppm·mthreshold)=(minimum)+0.2(range)=100+0.2(4900)=1080.
Claims (17)
Priority Applications (3)
| Application Number | Priority Date | Filing Date | Title |
|---|---|---|---|
| US16/661,407US11796454B2 (en) | 2014-07-07 | 2019-10-23 | Gas leak emission quantification with a gas cloud imager |
| US17/930,341US20230003640A1 (en) | 2014-07-07 | 2022-09-07 | Gas leak emission quantification with a gas cloud imager |
| US18/471,124US20240094118A1 (en) | 2014-07-07 | 2023-09-20 | Gas leak emission quantification with a gas cloud imager |
Applications Claiming Priority (5)
| Application Number | Priority Date | Filing Date | Title |
|---|---|---|---|
| US201462021636P | 2014-07-07 | 2014-07-07 | |
| US201462021907P | 2014-07-08 | 2014-07-08 | |
| US201462083131P | 2014-11-21 | 2014-11-21 | |
| US14/792,477US10458905B2 (en) | 2014-07-07 | 2015-07-06 | Gas leak emission quantification with a gas cloud imager |
| US16/661,407US11796454B2 (en) | 2014-07-07 | 2019-10-23 | Gas leak emission quantification with a gas cloud imager |
Related Parent Applications (1)
| Application Number | Title | Priority Date | Filing Date |
|---|---|---|---|
| US14/792,477ContinuationUS10458905B2 (en) | 2014-07-07 | 2015-07-06 | Gas leak emission quantification with a gas cloud imager |
Related Child Applications (2)
| Application Number | Title | Priority Date | Filing Date |
|---|---|---|---|
| US17/930,341ContinuationUS20230003640A1 (en) | 2014-07-07 | 2022-09-07 | Gas leak emission quantification with a gas cloud imager |
| US18/471,124ContinuationUS20240094118A1 (en) | 2014-07-07 | 2023-09-20 | Gas leak emission quantification with a gas cloud imager |
Publications (2)
| Publication Number | Publication Date |
|---|---|
| US20200124525A1 US20200124525A1 (en) | 2020-04-23 |
| US11796454B2true US11796454B2 (en) | 2023-10-24 |
Family
ID=55632656
Family Applications (4)
| Application Number | Title | Priority Date | Filing Date |
|---|---|---|---|
| US14/792,477Active2035-08-03US10458905B2 (en) | 2014-07-07 | 2015-07-06 | Gas leak emission quantification with a gas cloud imager |
| US16/661,407Active2035-12-05US11796454B2 (en) | 2014-07-07 | 2019-10-23 | Gas leak emission quantification with a gas cloud imager |
| US17/930,341PendingUS20230003640A1 (en) | 2014-07-07 | 2022-09-07 | Gas leak emission quantification with a gas cloud imager |
| US18/471,124PendingUS20240094118A1 (en) | 2014-07-07 | 2023-09-20 | Gas leak emission quantification with a gas cloud imager |
Family Applications Before (1)
| Application Number | Title | Priority Date | Filing Date |
|---|---|---|---|
| US14/792,477Active2035-08-03US10458905B2 (en) | 2014-07-07 | 2015-07-06 | Gas leak emission quantification with a gas cloud imager |
Family Applications After (2)
| Application Number | Title | Priority Date | Filing Date |
|---|---|---|---|
| US17/930,341PendingUS20230003640A1 (en) | 2014-07-07 | 2022-09-07 | Gas leak emission quantification with a gas cloud imager |
| US18/471,124PendingUS20240094118A1 (en) | 2014-07-07 | 2023-09-20 | Gas leak emission quantification with a gas cloud imager |
Country Status (1)
| Country | Link |
|---|---|
| US (4) | US10458905B2 (en) |
Families Citing this family (44)
| Publication number | Priority date | Publication date | Assignee | Title |
|---|---|---|---|---|
| EP2850403B1 (en) | 2012-05-18 | 2021-10-27 | Rebellion Photonics, Inc. | Divided-aperture infra-red spectral imaging system for chemical detection |
| US9599508B2 (en) | 2012-05-18 | 2017-03-21 | Rebellion Photonics, Inc. | Divided-aperture infra-red spectral imaging system |
| EP3540392B1 (en) | 2013-11-12 | 2025-03-19 | Rebellion Photonics, Inc. | Divided-aperture infra-red spectral imaging system |
| US11290662B2 (en) | 2014-05-01 | 2022-03-29 | Rebellion Photonics, Inc. | Mobile gas and chemical imaging camera |
| US20170026588A1 (en) | 2014-05-01 | 2017-01-26 | Rebellion Photonics, Inc. | Dual-band divided-aperture infra-red spectral imaging system |
| US10458905B2 (en) | 2014-07-07 | 2019-10-29 | Rebellion Photonics, Inc. | Gas leak emission quantification with a gas cloud imager |
| WO2016196224A1 (en) | 2015-05-29 | 2016-12-08 | Rebellion Photonics, Inc. | Hydrogen sulfide imaging system |
| US10837860B2 (en)* | 2015-10-29 | 2020-11-17 | Konica Minolta, Inc. | Leaked gas detection device and leaked gas detection method |
| CA3022540C (en) | 2016-05-18 | 2020-02-18 | Allen M. Waxman | Hydrocarbon leak imaging and quantification sensor |
| WO2018044378A1 (en)* | 2016-08-30 | 2018-03-08 | Konica Minolta Laboratory U.S.A., Inc. | Quantifying gas leak rates using frame images acquired by a camera |
| CN109642846A (en)* | 2016-08-31 | 2019-04-16 | 前视红外系统股份公司 | The method for indicating the gas movement in scene |
| EP4212851A1 (en) | 2016-10-21 | 2023-07-19 | Rebellion Photonics, Inc. | Gas imaging system |
| WO2018075964A1 (en)* | 2016-10-21 | 2018-04-26 | Rebellion Photonics, Inc. | Mobile gas and chemical imaging camera |
| WO2018087768A1 (en) | 2016-11-14 | 2018-05-17 | Opgal Optronic Industries Ltd. | Systems and methods for quantifying a gas leak |
| EP3555593B1 (en) | 2016-12-13 | 2021-03-31 | Koninklijke Philips N.V. | Microbolometer focal plane array with integrated array of mosaic multi-spectral band-pass filters and focusing lenses array for simultaneous real-time anesthetic and respiratory gas concentration detection and measurement signal processing |
| WO2018156795A1 (en) | 2017-02-22 | 2018-08-30 | Rebellion Photonics, Inc. | Systems and methods for monitoring remote installations |
| EP3602009A1 (en)* | 2017-03-31 | 2020-02-05 | Flir Systems AB | Gas imaging systems and methods |
| WO2018231735A1 (en)* | 2017-06-12 | 2018-12-20 | Flir Systems Ab | System and method for quantifying a gas leak |
| CN107290282B (en)* | 2017-07-10 | 2020-07-28 | 中国人民解放军防化学院 | Continous point source chemical cloud cluster-based land-based telemetering positioning method |
| WO2019059632A1 (en)* | 2017-09-25 | 2019-03-28 | 한국과학기술원 | Method and system for reconstructing hyperspectral image by using prism |
| EP4379331A3 (en) | 2017-11-09 | 2024-07-31 | Rebellion Photonics, Inc. | Window obscuration sensors for mobile gas and chemical imaging cameras |
| ES2716486A1 (en)* | 2017-12-12 | 2019-06-12 | Univ Madrid Carlos Iii | SYSTEM AND METHOD OF DETECTION OF GASES WITH SPECTRAL SIGNATURE IN THE INFRARED REGION |
| US10684216B2 (en)* | 2018-03-30 | 2020-06-16 | Konica Minolta Laboratory U.S.A., Inc. | Multi-spectral gas quantification and differentiation method for optical gas imaging camera |
| JP7359149B2 (en)* | 2018-07-25 | 2023-10-11 | コニカミノルタ株式会社 | Gas detection device, gas detection method, and program |
| CN112513676B (en)* | 2018-09-18 | 2024-09-27 | 松下知识产权经营株式会社 | Depth acquisition device, depth acquisition method, and recording medium |
| US11067448B2 (en)* | 2018-10-05 | 2021-07-20 | Parsons Corporation | Spectral object detection |
| US10976245B2 (en) | 2019-01-25 | 2021-04-13 | MultiSensor Scientific, Inc. | Systems and methods for leak monitoring via measurement of optical absorption using tailored reflector installments |
| US11468538B2 (en) | 2019-04-05 | 2022-10-11 | Baker Hughes Oilfield Operations Llc | Segmentation and prediction of low-level temporal plume patterns |
| FR3094792B1 (en)* | 2019-04-08 | 2021-10-15 | Office National Detudes Rech Aerospatiales | GAS DETECTOR |
| CN112307267B (en)* | 2020-06-29 | 2023-07-04 | 数量级(上海)信息技术有限公司 | Concentration quantification system and method for leaked gas |
| US11635338B2 (en)* | 2020-10-23 | 2023-04-25 | Applied Materials, Inc. | Rapid chamber vacuum leak check hardware and maintenance routine |
| US11692932B2 (en) | 2020-12-12 | 2023-07-04 | Blue Sky Measurements, Inc. | Methane monitoring and detection apparatus and methods |
| US11901203B2 (en) | 2021-06-10 | 2024-02-13 | Applied Materials, Inc. | Substrate process endpoint detection using machine learning |
| US20220397515A1 (en)* | 2021-06-10 | 2022-12-15 | Applied Materials, Inc. | Obtaining substrate metrology measurement values using machine learning |
| US11965798B2 (en) | 2021-06-10 | 2024-04-23 | Applied Materials, Inc. | Endpoint detection system for enhanced spectral data collection |
| US12248945B2 (en) | 2021-09-15 | 2025-03-11 | U.S. Government, As Represented By The Administrator Of The U.S. Environmental Protection Agency | System and method for quantifying source and component emission rates from a body in a flow field |
| US11686675B2 (en) | 2021-11-19 | 2023-06-27 | Rebellion Photonics, Inc. | Systems, methods, and computer program products for infrared imaging operations |
| US11815427B2 (en) | 2022-01-14 | 2023-11-14 | Rebellion Photonics, Inc. | Systems, methods, and computer program products for recursive hyperspectral imaging |
| US12297722B2 (en) | 2022-02-03 | 2025-05-13 | Saudi Arabian Oil Company | Total crude oil demand control from multiple oil stabilizer columns |
| US20240077416A1 (en)* | 2022-09-01 | 2024-03-07 | Maxar Technologies Holdings Inc. | Estimating gas quantity in a pixel based on spectral matched filtering |
| US12392678B2 (en)* | 2022-10-21 | 2025-08-19 | Rebellion Photonics, Inc. | Methods, apparatuses, and computer program products for fugitive gas quantification |
| CN115597798B (en)* | 2022-12-01 | 2023-03-14 | 中国科学院合肥物质科学研究院 | Vacuum leak detection system and method based on optical interference method |
| CN119436006B (en)* | 2023-08-07 | 2025-09-30 | 中国石油天然气集团有限公司 | A method and device for spectral remote sensing of gas leakage in hydrogen-blended natural gas stations |
| CN118329298B (en)* | 2024-04-15 | 2024-08-27 | 温州风涌智能科技有限公司 | Product quality detection method based on machine vision |
Citations (165)
| Publication number | Priority date | Publication date | Assignee | Title |
|---|---|---|---|---|
| GB1014769A (en) | 1963-04-11 | 1965-12-31 | Barnes Eng Co | Improvements in thermal image systems for temperature measurement |
| US3841763A (en) | 1973-06-25 | 1974-10-15 | Timelapse Inc | Method and apparatus for monitoring and correlating visible environmental contamination |
| US3849005A (en) | 1972-04-21 | 1974-11-19 | Onera (Off Nat Aerospatiale) | Method and device for estimating a gaseous component |
| US4134683A (en) | 1976-03-05 | 1979-01-16 | The United States Of America As Represented By The Administrator Of The National Aeronautics And Space Administration | Multispectral imaging and analysis system |
| US4390785A (en) | 1980-12-29 | 1983-06-28 | E. I. Du Pont De Nemours & Co. | Method and apparatus for remotely detecting gases in the atmosphere |
| US4464789A (en) | 1980-05-19 | 1984-08-07 | Environmental Research Institute Of Michigan | Image analyzer for processing multiple frames of image data |
| US4933555A (en) | 1987-02-03 | 1990-06-12 | Gec-Marconi Limited | Thermal imager |
| US4963963A (en) | 1985-02-26 | 1990-10-16 | The United States Of America As Represented By The Secretary Of The Air Force | Infrared scanner using dynamic range conserving video processing |
| US4965448A (en) | 1986-04-24 | 1990-10-23 | Honeywell Inc. | Internal calibration source for infrared radiation detector |
| US5127742A (en) | 1991-04-19 | 1992-07-07 | Thermoscan Inc. | Apparatus and method for temperature measurement by radiation |
| US5136421A (en) | 1990-06-29 | 1992-08-04 | Texas Instruments Incorporated | Thermal imaging system and method using scene-average radiation as a thermal reference |
| US5157258A (en) | 1989-08-21 | 1992-10-20 | Rockwell International Corporation | Multicolor infrared focal plane arrays |
| US5354987A (en) | 1992-12-07 | 1994-10-11 | Texas Instruments Incorporated | Calibrating focal plane arrays using multiple variable radiometric sources |
| US5430293A (en) | 1991-10-08 | 1995-07-04 | Osaka Gas Co., Ltd. | Gas visualizing apparatus and method for detecting gas leakage from tanks or piping |
| US5550373A (en) | 1994-12-30 | 1996-08-27 | Honeywell Inc. | Fabry-Perot micro filter-detector |
| US5559336A (en) | 1994-07-05 | 1996-09-24 | Santa Barbara Research Center | Integrated LPE-grown structure for simultaneous detection of infrared radiation in two bands |
| US5604346A (en) | 1992-05-26 | 1997-02-18 | Agema Infrared Systems Ab | Arrangement for recording an IR-image |
| US5656813A (en)* | 1995-04-04 | 1997-08-12 | Gmd Systems, Inc. | Apparatus for imaging gas |
| EP0837600A2 (en) | 1996-10-15 | 1998-04-22 | Nippon Avionics Co., Ltd. | Infrared sensor device with temperature correction function |
| RU2115109C1 (en)* | 1994-02-24 | 1998-07-10 | Александр Васильевич Малов | Panoramic gas analyzer |
| US5822222A (en) | 1995-04-05 | 1998-10-13 | New Jersey Institute Of Technology | Multi-wavelength imaging pyrometer |
| US5877500A (en) | 1997-03-13 | 1999-03-02 | Optiscan Biomedical Corporation | Multichannel infrared detector with optical concentrators for each channel |
| US5890095A (en) | 1997-01-21 | 1999-03-30 | Nichols Research Corporation | System for receiving and enhancing electromagnetic radiation input signals |
| US5920066A (en) | 1996-08-02 | 1999-07-06 | Raytheon Company | Real-time adaptive thermal reference control for night vision systems |
| US5926283A (en) | 1997-07-12 | 1999-07-20 | Optical Insights, Llc | Multi-spectral two dimensional imaging spectrometer |
| US5973844A (en) | 1996-01-26 | 1999-10-26 | Proxemics | Lenslet array systems and methods |
| US6023061A (en) | 1995-12-04 | 2000-02-08 | Microcam Corporation | Miniature infrared camera |
| US6097034A (en) | 1998-02-12 | 2000-08-01 | Instrumentarium Oy | Radiation source assembly and transducer for analyzing gases or other substances |
| CA2365866A1 (en) | 1999-03-17 | 2000-09-21 | University Of Virginia Patent Foundation | Passive remote sensor of chemicals |
| US6184529B1 (en) | 1998-01-28 | 2001-02-06 | Lockheed Martin Corporation | Methods and apparatus for performing scene based uniformity correction in imaging systems |
| US6268883B1 (en) | 1997-05-30 | 2001-07-31 | California Institute Of Technology | High speed infrared imaging system and method |
| US20010040216A1 (en) | 2000-03-17 | 2001-11-15 | Knauth Jonathan P. | Method and apparatus for correction of microbolometer output |
| US20020015151A1 (en) | 2000-07-27 | 2002-02-07 | Gorin Brian A. | Spectral drift and correction technique for hyperspectral imaging systems |
| US20020121370A1 (en) | 2000-12-08 | 2002-09-05 | Schlumberger Technology Corporation | Method and apparatus for hydrogen sulfide monitoring |
| US6456261B1 (en) | 1998-11-23 | 2002-09-24 | Evan Y. W. Zhang | Head/helmet mounted passive and active infrared imaging system with/without parallax |
| US6465785B1 (en) | 2000-05-05 | 2002-10-15 | Infrared Solutions, Inc. | Apparatus and method for compensating for pixel non-uniformity in a bolometer |
| US20020159101A1 (en) | 2001-04-25 | 2002-10-31 | Timothy Alderson | Scene-based non-uniformity correction for detector arrays |
| US6556853B1 (en) | 1995-12-12 | 2003-04-29 | Applied Spectral Imaging Ltd. | Spectral bio-imaging of the eye |
| US20030102435A1 (en) | 2001-11-20 | 2003-06-05 | Mark Myers | Multiband, single element wide field of view infrared imaging system |
| US20030134426A1 (en) | 2000-02-26 | 2003-07-17 | Li Jiang | Hydrogen sulphide detection method and apparatus |
| US20030183756A1 (en) | 2002-03-27 | 2003-10-02 | Huniu Lee J. | Display uniformity calibration system and method for a staring forward looking infrared sensor |
| US6680778B2 (en) | 2001-11-08 | 2004-01-20 | Michele Hinnrichs | Gas leak detector |
| US6695886B1 (en) | 2002-08-22 | 2004-02-24 | Axcelis Technologies, Inc. | Optical path improvement, focus length change compensation, and stray light reduction for temperature measurement system of RTP tool |
| US6700527B1 (en) | 2000-11-15 | 2004-03-02 | Harris Corporation | Coherent two-dimensional image formation by passive synthetic aperture collection and processing of multi-frequency radio signals scattered by cultural features of terrestrial region |
| US20040093167A1 (en) | 2002-11-08 | 2004-05-13 | Braig James R. | Analyte detection system with software download capabilities |
| US20040111232A1 (en) | 2002-05-22 | 2004-06-10 | Matthew Butler | Processing system for remote chemical identification |
| WO2004097389A2 (en) | 2003-04-25 | 2004-11-11 | Land Instruments International Limited | Thermal imaging system and method |
| US20040252300A1 (en) | 2003-06-12 | 2004-12-16 | Slater Richard C. | Chemical identification by flash spectroscopy |
| US20050029453A1 (en) | 2003-08-05 | 2005-02-10 | Bae Systems Information And Electronic Systems Integration, Inc. | Real-time radiation sensor calibration |
| US20050057366A1 (en) | 1999-12-08 | 2005-03-17 | Kadwell Brian J. | Compact particle sensor |
| US20050103989A1 (en) | 2002-03-08 | 2005-05-19 | Bae Systems Plc | Infra red camera calibration |
| US20050156111A1 (en) | 2003-08-29 | 2005-07-21 | Roberto Racca | Imaging of fugitive gas leaks |
| US20060044562A1 (en) | 2004-08-25 | 2006-03-02 | Norsk Elektro Optikk As | Gas monitor |
| US20060091310A1 (en)* | 2003-06-11 | 2006-05-04 | Furry David W | Methods for performing inspections and detecting chemical leaks using an infrared camera system |
| US20060183241A1 (en) | 2001-12-12 | 2006-08-17 | Lehmann Kevin K | Apparatus for enhanced evanescent field exposure in an optical fiber resonator for spectroscopic detection and measurement of trace species |
| US20060203248A1 (en) | 2005-03-11 | 2006-09-14 | Reichardt Thomas A | Natural gas leak mapper |
| US7109488B2 (en) | 2004-02-26 | 2006-09-19 | The United States Of America As Represented By The Secretary Of The Army | Multi-color infrared imaging device |
| US7119337B1 (en) | 1997-08-04 | 2006-10-10 | Ion Optics, Inc. | Infrared radiation sources, sensors and source combinations, and methods of manufacture |
| US20060279632A1 (en) | 2005-05-26 | 2006-12-14 | Anderson Shane M | Method for fixed pattern noise reduction in infrared imaging cameras |
| WO2007008826A2 (en) | 2005-07-11 | 2007-01-18 | Infotonics Technology Center, Inc. | High speed, optically-multiplexed, hyperspectral imagers and methods thereof |
| US20070018105A1 (en) | 2003-10-02 | 2007-01-25 | Ernest Grimberg | Infra-red (ir) sensor with controllable sensitivity |
| US20070075888A1 (en) | 2005-09-30 | 2007-04-05 | Michael Kelly | Digital readout method and apparatus |
| US20070108385A1 (en) | 2003-02-21 | 2007-05-17 | Mantese Joseph V | Pyroelectric sensor |
| US7242478B1 (en) | 2003-12-05 | 2007-07-10 | Surface Optics Corporation | Spatially corrected full-cubed hyperspectral imager |
| US20070170363A1 (en) | 2006-01-26 | 2007-07-26 | Schimert Thomas R | Infrared detector elements and methods of forming same |
| US20070170359A1 (en) | 2006-01-26 | 2007-07-26 | Syllaios Athanasios J | Systems and methods for integrating focal plane arrays |
| US20070170357A1 (en) | 2005-09-29 | 2007-07-26 | Arseneau Roger E | Afterglow DC-offset calibration in a nuclear imaging system |
| US20070268121A1 (en) | 2006-05-18 | 2007-11-22 | Daryush Vasefi | On-line portal system and method for management of devices and services |
| US7315377B2 (en) | 2003-02-10 | 2008-01-01 | University Of Virginia Patent Foundation | System and method for remote sensing and/or analyzing spectral properties of targets and/or chemical species for detection and identification thereof |
| US7321119B2 (en) | 2004-08-12 | 2008-01-22 | E.D. Bullard Company | Method and system for thermal imaging having a selective temperature imaging mode |
| US7364697B2 (en) | 1996-10-09 | 2008-04-29 | Symyx Technologies, Inc. | System for infrared spectroscopic imaging of libraries |
| US20080170140A1 (en) | 2007-01-11 | 2008-07-17 | Silver Alan G | Video Camera System Using Multiple Image Sensors |
| WO2008109183A1 (en) | 2007-03-08 | 2008-09-12 | University Of Virginia Patent Foundation | Approach for passively detecting analytes |
| US20080231719A1 (en) | 2007-03-23 | 2008-09-25 | Flir Systems Inc. | Thermography camera configured for leak detection |
| US7433042B1 (en) | 2003-12-05 | 2008-10-07 | Surface Optics Corporation | Spatially corrected full-cubed hyperspectral imager |
| US20080251724A1 (en) | 2007-04-11 | 2008-10-16 | Baliga Shankar B | Gas and/or flame imaging system |
| US20090015824A1 (en) | 2007-07-09 | 2009-01-15 | Gary Shubinsky | Optical Multiwavelength Window Contamination Monitor for Optical Control Sensors and Systems |
| WO2009094782A1 (en) | 2008-02-01 | 2009-08-06 | Power Diagnostic Technologies Ltd. | Apparatus and method for multi-spectral dual imaging |
| US20090252650A1 (en) | 2006-08-16 | 2009-10-08 | Sridhar Lakshmanan | Portable mems-based spectral identification system |
| US7606484B1 (en) | 2006-03-23 | 2009-10-20 | Flir Systems, Inc. | Infrared and near-infrared camera hyperframing |
| US7634157B1 (en) | 2006-03-23 | 2009-12-15 | Flir Systems, Inc. | Infrared and near-infrared camera hyperframing |
| US20100013979A1 (en) | 2006-07-24 | 2010-01-21 | Hyspec Imaging Ltd | Snapshot spectral imaging systems and methods |
| WO2010053979A2 (en) | 2008-11-04 | 2010-05-14 | William Marsh Rice University | Image mapping spectrometers |
| US20100162206A1 (en) | 2008-12-24 | 2010-06-24 | Flir Systems Ab | Executable code in digital image files |
| US7750802B1 (en) | 2005-02-11 | 2010-07-06 | Parish Warren G | Illumination and detection architecture |
| US20100171866A1 (en) | 2009-01-05 | 2010-07-08 | Applied Quantum Technologies, Inc. | Multiscale Optical System |
| US20100211333A1 (en) | 2009-01-14 | 2010-08-19 | Integrated Process Resources, Inc. | Leak Detection and Identification System |
| US7835002B2 (en) | 2004-10-25 | 2010-11-16 | Rp Ventures Technology Office Ab | System for multi- and hyperspectral imaging |
| US20100309467A1 (en) | 2009-06-05 | 2010-12-09 | Spectral Sciences, Inc. | Single-Shot Spectral Imager |
| US7888624B1 (en) | 2006-11-24 | 2011-02-15 | Solid State Scientific Corporation | Simultaneous spectral imaging system including commonly filtered optical paths defined by focusing elements exhibiting disparate f-numbers |
| US20110176577A1 (en) | 2008-12-08 | 2011-07-21 | California Institute Of Technology | Superpixel multi-waveband photodetector array for remote temperature measurement |
| US20110185048A1 (en) | 2010-01-26 | 2011-07-28 | Apple Inc. | Gating accessory connection |
| CA2787303A1 (en) | 2010-01-19 | 2011-07-28 | Delacom Detection Systems, Llc | A method, device and system for determining the presence of volatile organic compounds (voc) in video |
| US8027041B1 (en) | 2006-06-08 | 2011-09-27 | Wavefront Research, Inc. | Compact snapshot multispectral imaging system |
| US20110261321A1 (en) | 2008-10-06 | 2011-10-27 | The Catholic University Of America | Lenslet array for retinal oximetry |
| US20110271738A1 (en) | 2008-10-21 | 2011-11-10 | Mcgill R Andrew | Analyte detection with infrared light |
| US8153980B1 (en) | 2006-11-30 | 2012-04-10 | L-3 Communications Corp. | Color correction for radiation detectors |
| US8159568B2 (en) | 2009-03-26 | 2012-04-17 | Ahdoot Ned M | Hardware implemented pixel level digital filter and processing of electromagnetic signals |
| WO2012078417A1 (en) | 2010-12-10 | 2012-06-14 | William Marsh Rice University | Image mapped optical coherence tomography |
| WO2012082366A1 (en) | 2010-12-14 | 2012-06-21 | William Marsh Rice University | Image mapped spectropolarimetry |
| US20120154792A1 (en) | 2010-05-13 | 2012-06-21 | Chemimage Corporation | Portable system for detecting hazardous agents using SWIR and method for use thereof |
| US8212213B2 (en) | 2008-04-07 | 2012-07-03 | Halliburton Energy Services, Inc. | Chemically-selective detector and methods relating thereto |
| US20120314080A1 (en) | 2011-06-10 | 2012-12-13 | Lee Yeu Yong | Gas leakage detecting system and method |
| US8373757B1 (en) | 2009-02-23 | 2013-02-12 | Flir Systems, Inc. | Flat field correction for infrared cameras |
| JP2013128185A (en) | 2011-12-16 | 2013-06-27 | Toshiba Corp | Camera system and camera mount |
| US20130181836A1 (en) | 2012-01-18 | 2013-07-18 | Xerox Corporation | Image-based determination of co and co2 concentrations in vehicle exhaust gas emissions |
| US20130206990A1 (en) | 2011-08-22 | 2013-08-15 | ISC8 Inc. | Background Limited Focal Plane Array Assembly |
| US20130228887A1 (en) | 2012-03-01 | 2013-09-05 | Raytheon Company | Photodetector with surface plasmon resonance |
| US20130235256A1 (en) | 2010-11-16 | 2013-09-12 | Kenichi Kodama | Multiband camera, and multiband image capturing method |
| US20130307991A1 (en) | 2009-11-06 | 2013-11-21 | Steven Olsen | Infrared sensor control architecture |
| WO2013173541A1 (en) | 2012-05-18 | 2013-11-21 | Rebellion Photonics, Inc. | Divided-aperture infra-red spectral imaging system for chemical detection |
| US20130341509A1 (en) | 2010-06-11 | 2013-12-26 | Chemimage Corporation | Portable system for detecting explosive materials using near infrared hyperspectral imaging and method for using thereof |
| US20130342680A1 (en) | 2012-06-21 | 2013-12-26 | Providence Photonics, Llc | Multi-spectral infrared imaging system for flare combustion efficiency monitoring |
| US20140002639A1 (en) | 2011-03-25 | 2014-01-02 | Joseph M. Cheben | Autonomous Detection of Chemical Plumes |
| WO2014008137A1 (en) | 2012-07-06 | 2014-01-09 | Industrial Origami, Inc. | Solar panel rack |
| US8629930B2 (en) | 2009-10-14 | 2014-01-14 | Fraunhofer-Gesellschaft Zur Foerderung Der Angewandten Forschung E.V. | Device, image processing device and method for optical imaging |
| US8653461B1 (en) | 2007-03-23 | 2014-02-18 | Flir Systems, Inc. | Thermography camera tuned to detect absorption of infrared radiation in a selected spectral bandwidth |
| US8686364B1 (en) | 2012-09-17 | 2014-04-01 | Jp3 Measurement, Llc | Method and system for determining energy content and detecting contaminants in a fluid stream |
| US20140139643A1 (en) | 2009-06-03 | 2014-05-22 | Flir Systems, Inc. | Imager with array of multiple infrared imaging modules |
| WO2014106122A1 (en)* | 2012-12-31 | 2014-07-03 | Genomatica, Inc. | Compositions and methods for bio-butadiene production screening |
| US20140320843A1 (en) | 2013-04-29 | 2014-10-30 | Raytheon Company | Time-multiplexed broadband and multi-filtered electro-optic sensor |
| GB2518224A (en) | 2013-09-16 | 2015-03-18 | Selex Es Ltd | Thermal imaging calibration system and method |
| CA2870419A1 (en) | 2013-11-12 | 2015-05-12 | Rebellion Photonics, Inc. | Divided-aperture infra-red spectral imaging system |
| US20150136981A1 (en) | 2012-05-18 | 2015-05-21 | Rebellion Photonics, Inc. | Divided-aperture infra-red spectral imaging system |
| US20150138534A1 (en) | 2013-11-18 | 2015-05-21 | Elta Systems Ltd. | Multiband flash detection system |
| US20150144770A1 (en) | 2013-11-26 | 2015-05-28 | nanoLambda Korea | Multispectral imager with hybrid double layer filter array |
| WO2015108236A1 (en) | 2014-01-14 | 2015-07-23 | 삼성테크윈 주식회사 | Summary image browsing system and method |
| US20150226613A1 (en) | 2014-02-07 | 2015-08-13 | Raytheon Company | Imaging device with shutterless non-uniformity correction |
| US20150288894A1 (en) | 2011-11-04 | 2015-10-08 | Imec | Spectral camera with mirrors for projecting multiple adjacent image copies onto sensor array |
| US20150292948A1 (en) | 2013-08-02 | 2015-10-15 | Verifood, Ltd. | Spectrometry system with diffuser |
| US20150316473A1 (en) | 2014-05-01 | 2015-11-05 | Rebellion Photonics, Inc. | Mobile gas and chemical imaging camera |
| EP2942615A1 (en) | 2014-05-01 | 2015-11-11 | Rebellion Photonics, Inc. | Mobile gas and chemical imaging camera |
| EP2955496A2 (en) | 2014-05-01 | 2015-12-16 | Rebellion Photonics, Inc. | Dual band divided aperture infrared spectral imager (daisi) for chemical detection |
| US9225913B2 (en) | 2008-06-19 | 2015-12-29 | Flir Systems Ab | Device for imaging within the IR range |
| US20160037089A1 (en) | 2014-07-30 | 2016-02-04 | Raytheon Company | Multi-band thermal imaging sensor with integrated filter array |
| US20160041095A1 (en) | 2014-08-08 | 2016-02-11 | Quantum-Si Incorporated | Optical system and assay chip for probing, detecting and analyzing molecule |
| US20160097713A1 (en) | 2014-07-07 | 2016-04-07 | Rebellion Photonics, Inc. | Gas leak emission quantification with a gas cloud imager |
| US20160097714A1 (en) | 2014-10-07 | 2016-04-07 | Providence Photonics, Llc | Apparatus for imaging hydrogen sulfide plume and method of the same |
| EP3040706A1 (en) | 2015-01-02 | 2016-07-06 | Sensors Unlimited, Inc. | Detection of hydrocarbon gases using short wave infrared technology |
| US9395516B2 (en) | 2012-05-28 | 2016-07-19 | Nikon Corporation | Imaging device |
| US9404804B1 (en) | 2015-04-02 | 2016-08-02 | Palo Alto Research Center Incorporated | Thermal sensor with infrared absorption membrane including metamaterial structure |
| US20160249228A1 (en) | 2013-10-30 | 2016-08-25 | Huawei Technologies Co., Ltd. | Method and apparatus for managing network sharing |
| US20160245698A1 (en) | 2013-10-16 | 2016-08-25 | The Arizona Board Of Regents On Behalf Of The University Of Arizona | Multispectral imaging based on computational imaging and a narrow-band absorptive filter array |
| US20160313181A1 (en) | 2013-06-18 | 2016-10-27 | Ramot At Tel-Aviv University Ltd. | Apparatus and method for snapshot spectral imaging |
| US20160349228A1 (en) | 2015-05-29 | 2016-12-01 | Rebellion Photonics, Inc. | Hydrogen sulfide imaging system |
| US20160356702A1 (en) | 2013-03-15 | 2016-12-08 | Michele Hinnrichs | Gas imager employing an array imager pixels with order filters |
| US20160379059A1 (en) | 2015-06-23 | 2016-12-29 | Raytheon Company | Methods and apparatus for video wall with feed indicators |
| US20160380014A1 (en) | 2014-01-27 | 2016-12-29 | INVIS Technologies Corporation | Thermal Imaging Device |
| US20170059807A1 (en) | 2015-08-28 | 2017-03-02 | Gopro, Inc. | Thermal compensation to adjust camera lens focus |
| US20170089761A1 (en) | 2014-06-18 | 2017-03-30 | Gary L. McQuilkin | Spectral imaging system for remote and noninvasive detection of target substances using spectral filter arrays and image capture arrays |
| US9612195B1 (en) | 2015-11-11 | 2017-04-04 | Bert Friedman | Gas detector and method for monitoring gas in a confined space |
| US9641772B2 (en) | 2014-11-19 | 2017-05-02 | Northrop Grumman Systems Corporation | Compact PMMW camera calibration target |
| US9644562B2 (en) | 2014-12-03 | 2017-05-09 | Denso Corporation | Injector driving apparatus |
| US20170138846A1 (en) | 2015-11-18 | 2017-05-18 | Servomex Group Limited | Method and system for reduction of influence of baseline distortion in absorption spectroscopy measurements |
| US20170138918A1 (en) | 2014-08-08 | 2017-05-18 | Imx S.R.L. | Gas detection system for toxic and/or flammable gas |
| US20170234761A1 (en) | 2016-02-15 | 2017-08-17 | Universal Enterprises, Inc. | Leak detector |
| US20170248517A1 (en) | 2011-09-09 | 2017-08-31 | Thermo Fisher Scientific (Bremen) Gmbh | High-accuracy mid-ir laseer-based gas sensor |
| US9823231B1 (en) | 2014-06-30 | 2017-11-21 | Picarro, Inc. | Systems and methods for assembling a collection of peaks characterizing a gas leak source and selecting representative peaks for display |
| WO2017201194A1 (en) | 2016-05-18 | 2017-11-23 | MultiSensor Scientific, Inc. | Hydrocarbon leak imaging and quantification sensor |
| US20170347037A1 (en) | 2016-05-25 | 2017-11-30 | United States Of America, As Represented By The Secretary Of The Army | Multiple Field of View Dual Band Optics with Integrated Calibration Source |
| US20180039885A1 (en) | 2016-08-04 | 2018-02-08 | International Business Machines Corporation | Satellite-based location identification of methane-emitting sites |
| WO2018075964A1 (en) | 2016-10-21 | 2018-04-26 | Rebellion Photonics, Inc. | Mobile gas and chemical imaging camera |
| WO2018075957A1 (en) | 2016-10-21 | 2018-04-26 | Rebellion Photonics, Inc. | Gas imaging system |
| WO2018156795A1 (en) | 2017-02-22 | 2018-08-30 | Rebellion Photonics, Inc. | Systems and methods for monitoring remote installations |
| US20190137388A1 (en) | 2017-11-09 | 2019-05-09 | Rebellion Photonics, Inc. | Window obscuration sensors for mobile gas and chemical imaging cameras |
Family Cites Families (2)
| Publication number | Priority date | Publication date | Assignee | Title |
|---|---|---|---|---|
| WO2006122402A1 (en)* | 2005-05-17 | 2006-11-23 | Corporation De L'ecole Polytechnique De Montreal | Plasmon-polariton refractive-index fiber bio-sensor with fiber bragg grating |
| JP2012220313A (en)* | 2011-04-07 | 2012-11-12 | Mitsubishi Electric Corp | Gas detecting device |
- 2015
- 2015-07-06USUS14/792,477patent/US10458905B2/enactiveActive
- 2019
- 2019-10-23USUS16/661,407patent/US11796454B2/enactiveActive
- 2022
- 2022-09-07USUS17/930,341patent/US20230003640A1/enactivePending
- 2023
- 2023-09-20USUS18/471,124patent/US20240094118A1/enactivePending
Patent Citations (210)
| Publication number | Priority date | Publication date | Assignee | Title |
|---|---|---|---|---|
| GB1014769A (en) | 1963-04-11 | 1965-12-31 | Barnes Eng Co | Improvements in thermal image systems for temperature measurement |
| US3849005A (en) | 1972-04-21 | 1974-11-19 | Onera (Off Nat Aerospatiale) | Method and device for estimating a gaseous component |
| US3841763A (en) | 1973-06-25 | 1974-10-15 | Timelapse Inc | Method and apparatus for monitoring and correlating visible environmental contamination |
| US4134683A (en) | 1976-03-05 | 1979-01-16 | The United States Of America As Represented By The Administrator Of The National Aeronautics And Space Administration | Multispectral imaging and analysis system |
| US4464789A (en) | 1980-05-19 | 1984-08-07 | Environmental Research Institute Of Michigan | Image analyzer for processing multiple frames of image data |
| US4390785A (en) | 1980-12-29 | 1983-06-28 | E. I. Du Pont De Nemours & Co. | Method and apparatus for remotely detecting gases in the atmosphere |
| US4963963A (en) | 1985-02-26 | 1990-10-16 | The United States Of America As Represented By The Secretary Of The Air Force | Infrared scanner using dynamic range conserving video processing |
| US4965448A (en) | 1986-04-24 | 1990-10-23 | Honeywell Inc. | Internal calibration source for infrared radiation detector |
| US4933555A (en) | 1987-02-03 | 1990-06-12 | Gec-Marconi Limited | Thermal imager |
| US5157258A (en) | 1989-08-21 | 1992-10-20 | Rockwell International Corporation | Multicolor infrared focal plane arrays |
| US5136421A (en) | 1990-06-29 | 1992-08-04 | Texas Instruments Incorporated | Thermal imaging system and method using scene-average radiation as a thermal reference |
| US5127742A (en) | 1991-04-19 | 1992-07-07 | Thermoscan Inc. | Apparatus and method for temperature measurement by radiation |
| US5430293A (en) | 1991-10-08 | 1995-07-04 | Osaka Gas Co., Ltd. | Gas visualizing apparatus and method for detecting gas leakage from tanks or piping |
| US5604346A (en) | 1992-05-26 | 1997-02-18 | Agema Infrared Systems Ab | Arrangement for recording an IR-image |
| US5354987A (en) | 1992-12-07 | 1994-10-11 | Texas Instruments Incorporated | Calibrating focal plane arrays using multiple variable radiometric sources |
| RU2115109C1 (en)* | 1994-02-24 | 1998-07-10 | Александр Васильевич Малов | Panoramic gas analyzer |
| US5559336A (en) | 1994-07-05 | 1996-09-24 | Santa Barbara Research Center | Integrated LPE-grown structure for simultaneous detection of infrared radiation in two bands |
| US5550373A (en) | 1994-12-30 | 1996-08-27 | Honeywell Inc. | Fabry-Perot micro filter-detector |
| US5656813A (en)* | 1995-04-04 | 1997-08-12 | Gmd Systems, Inc. | Apparatus for imaging gas |
| US5822222A (en) | 1995-04-05 | 1998-10-13 | New Jersey Institute Of Technology | Multi-wavelength imaging pyrometer |
| US6023061A (en) | 1995-12-04 | 2000-02-08 | Microcam Corporation | Miniature infrared camera |
| US6556853B1 (en) | 1995-12-12 | 2003-04-29 | Applied Spectral Imaging Ltd. | Spectral bio-imaging of the eye |
| US5973844A (en) | 1996-01-26 | 1999-10-26 | Proxemics | Lenslet array systems and methods |
| US5920066A (en) | 1996-08-02 | 1999-07-06 | Raytheon Company | Real-time adaptive thermal reference control for night vision systems |
| US7364697B2 (en) | 1996-10-09 | 2008-04-29 | Symyx Technologies, Inc. | System for infrared spectroscopic imaging of libraries |
| US5994701A (en) | 1996-10-15 | 1999-11-30 | Nippon Avonics Co., Ltd. | Infrared sensor device with temperature correction function |
| EP0837600A2 (en) | 1996-10-15 | 1998-04-22 | Nippon Avionics Co., Ltd. | Infrared sensor device with temperature correction function |
| US5890095A (en) | 1997-01-21 | 1999-03-30 | Nichols Research Corporation | System for receiving and enhancing electromagnetic radiation input signals |
| US5877500A (en) | 1997-03-13 | 1999-03-02 | Optiscan Biomedical Corporation | Multichannel infrared detector with optical concentrators for each channel |
| US6268883B1 (en) | 1997-05-30 | 2001-07-31 | California Institute Of Technology | High speed infrared imaging system and method |
| US5926283A (en) | 1997-07-12 | 1999-07-20 | Optical Insights, Llc | Multi-spectral two dimensional imaging spectrometer |
| US7119337B1 (en) | 1997-08-04 | 2006-10-10 | Ion Optics, Inc. | Infrared radiation sources, sensors and source combinations, and methods of manufacture |
| US6184529B1 (en) | 1998-01-28 | 2001-02-06 | Lockheed Martin Corporation | Methods and apparatus for performing scene based uniformity correction in imaging systems |
| US6097034A (en) | 1998-02-12 | 2000-08-01 | Instrumentarium Oy | Radiation source assembly and transducer for analyzing gases or other substances |
| US6456261B1 (en) | 1998-11-23 | 2002-09-24 | Evan Y. W. Zhang | Head/helmet mounted passive and active infrared imaging system with/without parallax |
| CA2365866A1 (en) | 1999-03-17 | 2000-09-21 | University Of Virginia Patent Foundation | Passive remote sensor of chemicals |
| US20050057366A1 (en) | 1999-12-08 | 2005-03-17 | Kadwell Brian J. | Compact particle sensor |
| US20030134426A1 (en) | 2000-02-26 | 2003-07-17 | Li Jiang | Hydrogen sulphide detection method and apparatus |
| US20010040216A1 (en) | 2000-03-17 | 2001-11-15 | Knauth Jonathan P. | Method and apparatus for correction of microbolometer output |
| US6465785B1 (en) | 2000-05-05 | 2002-10-15 | Infrared Solutions, Inc. | Apparatus and method for compensating for pixel non-uniformity in a bolometer |
| US20020015151A1 (en) | 2000-07-27 | 2002-02-07 | Gorin Brian A. | Spectral drift and correction technique for hyperspectral imaging systems |
| US6700527B1 (en) | 2000-11-15 | 2004-03-02 | Harris Corporation | Coherent two-dimensional image formation by passive synthetic aperture collection and processing of multi-frequency radio signals scattered by cultural features of terrestrial region |
| US20020121370A1 (en) | 2000-12-08 | 2002-09-05 | Schlumberger Technology Corporation | Method and apparatus for hydrogen sulfide monitoring |
| US20020159101A1 (en) | 2001-04-25 | 2002-10-31 | Timothy Alderson | Scene-based non-uniformity correction for detector arrays |
| US6680778B2 (en) | 2001-11-08 | 2004-01-20 | Michele Hinnrichs | Gas leak detector |
| US20030102435A1 (en) | 2001-11-20 | 2003-06-05 | Mark Myers | Multiband, single element wide field of view infrared imaging system |
| US20060183241A1 (en) | 2001-12-12 | 2006-08-17 | Lehmann Kevin K | Apparatus for enhanced evanescent field exposure in an optical fiber resonator for spectroscopic detection and measurement of trace species |
| US20050103989A1 (en) | 2002-03-08 | 2005-05-19 | Bae Systems Plc | Infra red camera calibration |
| US20030183756A1 (en) | 2002-03-27 | 2003-10-02 | Huniu Lee J. | Display uniformity calibration system and method for a staring forward looking infrared sensor |
| US20040111232A1 (en) | 2002-05-22 | 2004-06-10 | Matthew Butler | Processing system for remote chemical identification |
| US6695886B1 (en) | 2002-08-22 | 2004-02-24 | Axcelis Technologies, Inc. | Optical path improvement, focus length change compensation, and stray light reduction for temperature measurement system of RTP tool |
| US20040093167A1 (en) | 2002-11-08 | 2004-05-13 | Braig James R. | Analyte detection system with software download capabilities |
| US7315377B2 (en) | 2003-02-10 | 2008-01-01 | University Of Virginia Patent Foundation | System and method for remote sensing and/or analyzing spectral properties of targets and/or chemical species for detection and identification thereof |
| US20070108385A1 (en) | 2003-02-21 | 2007-05-17 | Mantese Joseph V | Pyroelectric sensor |
| WO2004097389A2 (en) | 2003-04-25 | 2004-11-11 | Land Instruments International Limited | Thermal imaging system and method |
| US20060232675A1 (en) | 2003-04-25 | 2006-10-19 | Land Instruments International Limited | Thermal imaging system and method |
| US20120273680A1 (en) | 2003-06-11 | 2012-11-01 | Leak Surveys, Inc. | Chemical Leak Inspection System |
| US20060091310A1 (en)* | 2003-06-11 | 2006-05-04 | Furry David W | Methods for performing inspections and detecting chemical leaks using an infrared camera system |
| US20130250124A1 (en) | 2003-06-11 | 2013-09-26 | Leak Surveys, Inc. | Chemical Leak Inspection System |
| US20040252300A1 (en) | 2003-06-12 | 2004-12-16 | Slater Richard C. | Chemical identification by flash spectroscopy |
| US20050029453A1 (en) | 2003-08-05 | 2005-02-10 | Bae Systems Information And Electronic Systems Integration, Inc. | Real-time radiation sensor calibration |
| US20050156111A1 (en) | 2003-08-29 | 2005-07-21 | Roberto Racca | Imaging of fugitive gas leaks |
| US20070018105A1 (en) | 2003-10-02 | 2007-01-25 | Ernest Grimberg | Infra-red (ir) sensor with controllable sensitivity |
| US7242478B1 (en) | 2003-12-05 | 2007-07-10 | Surface Optics Corporation | Spatially corrected full-cubed hyperspectral imager |
| US7433042B1 (en) | 2003-12-05 | 2008-10-07 | Surface Optics Corporation | Spatially corrected full-cubed hyperspectral imager |
| US7109488B2 (en) | 2004-02-26 | 2006-09-19 | The United States Of America As Represented By The Secretary Of The Army | Multi-color infrared imaging device |
| US7321119B2 (en) | 2004-08-12 | 2008-01-22 | E.D. Bullard Company | Method and system for thermal imaging having a selective temperature imaging mode |
| US20060044562A1 (en) | 2004-08-25 | 2006-03-02 | Norsk Elektro Optikk As | Gas monitor |
| US7835002B2 (en) | 2004-10-25 | 2010-11-16 | Rp Ventures Technology Office Ab | System for multi- and hyperspectral imaging |
| US7750802B1 (en) | 2005-02-11 | 2010-07-06 | Parish Warren G | Illumination and detection architecture |
| US20060203248A1 (en) | 2005-03-11 | 2006-09-14 | Reichardt Thomas A | Natural gas leak mapper |
| US20060279632A1 (en) | 2005-05-26 | 2006-12-14 | Anderson Shane M | Method for fixed pattern noise reduction in infrared imaging cameras |
| WO2007008826A2 (en) | 2005-07-11 | 2007-01-18 | Infotonics Technology Center, Inc. | High speed, optically-multiplexed, hyperspectral imagers and methods thereof |
| US20080204744A1 (en) | 2005-07-11 | 2008-08-28 | Jose Mir | High Speed, Optically-Multiplexed, Hyperspectral Imagers and Methods Thereof |
| US20070170357A1 (en) | 2005-09-29 | 2007-07-26 | Arseneau Roger E | Afterglow DC-offset calibration in a nuclear imaging system |
| US20070075888A1 (en) | 2005-09-30 | 2007-04-05 | Michael Kelly | Digital readout method and apparatus |
| US20070170363A1 (en) | 2006-01-26 | 2007-07-26 | Schimert Thomas R | Infrared detector elements and methods of forming same |
| US20070170359A1 (en) | 2006-01-26 | 2007-07-26 | Syllaios Athanasios J | Systems and methods for integrating focal plane arrays |
| US7634157B1 (en) | 2006-03-23 | 2009-12-15 | Flir Systems, Inc. | Infrared and near-infrared camera hyperframing |
| US7606484B1 (en) | 2006-03-23 | 2009-10-20 | Flir Systems, Inc. | Infrared and near-infrared camera hyperframing |
| US20070268121A1 (en) | 2006-05-18 | 2007-11-22 | Daryush Vasefi | On-line portal system and method for management of devices and services |
| US8027041B1 (en) | 2006-06-08 | 2011-09-27 | Wavefront Research, Inc. | Compact snapshot multispectral imaging system |
| US20100013979A1 (en) | 2006-07-24 | 2010-01-21 | Hyspec Imaging Ltd | Snapshot spectral imaging systems and methods |
| US20090252650A1 (en) | 2006-08-16 | 2009-10-08 | Sridhar Lakshmanan | Portable mems-based spectral identification system |
| US7888624B1 (en) | 2006-11-24 | 2011-02-15 | Solid State Scientific Corporation | Simultaneous spectral imaging system including commonly filtered optical paths defined by focusing elements exhibiting disparate f-numbers |
| US8153980B1 (en) | 2006-11-30 | 2012-04-10 | L-3 Communications Corp. | Color correction for radiation detectors |
| US20080170140A1 (en) | 2007-01-11 | 2008-07-17 | Silver Alan G | Video Camera System Using Multiple Image Sensors |
| WO2008109183A1 (en) | 2007-03-08 | 2008-09-12 | University Of Virginia Patent Foundation | Approach for passively detecting analytes |
| US8653461B1 (en) | 2007-03-23 | 2014-02-18 | Flir Systems, Inc. | Thermography camera tuned to detect absorption of infrared radiation in a selected spectral bandwidth |
| US20080231719A1 (en) | 2007-03-23 | 2008-09-25 | Flir Systems Inc. | Thermography camera configured for leak detection |
| US20080251724A1 (en) | 2007-04-11 | 2008-10-16 | Baliga Shankar B | Gas and/or flame imaging system |
| US20090015824A1 (en) | 2007-07-09 | 2009-01-15 | Gary Shubinsky | Optical Multiwavelength Window Contamination Monitor for Optical Control Sensors and Systems |
| WO2009094782A1 (en) | 2008-02-01 | 2009-08-06 | Power Diagnostic Technologies Ltd. | Apparatus and method for multi-spectral dual imaging |
| US8212213B2 (en) | 2008-04-07 | 2012-07-03 | Halliburton Energy Services, Inc. | Chemically-selective detector and methods relating thereto |
| US9225913B2 (en) | 2008-06-19 | 2015-12-29 | Flir Systems Ab | Device for imaging within the IR range |
| US20110261321A1 (en) | 2008-10-06 | 2011-10-27 | The Catholic University Of America | Lenslet array for retinal oximetry |
| US20110271738A1 (en) | 2008-10-21 | 2011-11-10 | Mcgill R Andrew | Analyte detection with infrared light |
| US20110285995A1 (en) | 2008-11-04 | 2011-11-24 | William Marsh Rice University | Image mapping spectrometers |
| WO2010053979A2 (en) | 2008-11-04 | 2010-05-14 | William Marsh Rice University | Image mapping spectrometers |
| US8654328B2 (en) | 2008-11-04 | 2014-02-18 | William Marsh Rice University | Image mapping spectrometers |
| US20110176577A1 (en) | 2008-12-08 | 2011-07-21 | California Institute Of Technology | Superpixel multi-waveband photodetector array for remote temperature measurement |
| US20100162206A1 (en) | 2008-12-24 | 2010-06-24 | Flir Systems Ab | Executable code in digital image files |
| US20100171866A1 (en) | 2009-01-05 | 2010-07-08 | Applied Quantum Technologies, Inc. | Multiscale Optical System |
| US20100211333A1 (en) | 2009-01-14 | 2010-08-19 | Integrated Process Resources, Inc. | Leak Detection and Identification System |
| US8373757B1 (en) | 2009-02-23 | 2013-02-12 | Flir Systems, Inc. | Flat field correction for infrared cameras |
| US8159568B2 (en) | 2009-03-26 | 2012-04-17 | Ahdoot Ned M | Hardware implemented pixel level digital filter and processing of electromagnetic signals |
| US20140139643A1 (en) | 2009-06-03 | 2014-05-22 | Flir Systems, Inc. | Imager with array of multiple infrared imaging modules |
| US20100309467A1 (en) | 2009-06-05 | 2010-12-09 | Spectral Sciences, Inc. | Single-Shot Spectral Imager |
| US8629930B2 (en) | 2009-10-14 | 2014-01-14 | Fraunhofer-Gesellschaft Zur Foerderung Der Angewandten Forschung E.V. | Device, image processing device and method for optical imaging |
| US20130307991A1 (en) | 2009-11-06 | 2013-11-21 | Steven Olsen | Infrared sensor control architecture |
| CA2787303A1 (en) | 2010-01-19 | 2011-07-28 | Delacom Detection Systems, Llc | A method, device and system for determining the presence of volatile organic compounds (voc) in video |
| US20130286213A1 (en) | 2010-01-19 | 2013-10-31 | Delacom Detection Systems, Llc | Method, device and system for determining the presence of volatile organic compounds (voc) in video |
| US20110185048A1 (en) | 2010-01-26 | 2011-07-28 | Apple Inc. | Gating accessory connection |
| US20120154792A1 (en) | 2010-05-13 | 2012-06-21 | Chemimage Corporation | Portable system for detecting hazardous agents using SWIR and method for use thereof |
| US20130341509A1 (en) | 2010-06-11 | 2013-12-26 | Chemimage Corporation | Portable system for detecting explosive materials using near infrared hyperspectral imaging and method for using thereof |
| US20130235256A1 (en) | 2010-11-16 | 2013-09-12 | Kenichi Kodama | Multiband camera, and multiband image capturing method |
| WO2012078417A1 (en) | 2010-12-10 | 2012-06-14 | William Marsh Rice University | Image mapped optical coherence tomography |
| WO2012082366A1 (en) | 2010-12-14 | 2012-06-21 | William Marsh Rice University | Image mapped spectropolarimetry |
| US20130321806A1 (en) | 2010-12-14 | 2013-12-05 | William Marsh Rice University | Image mapped spectropolarimetry |
| US20140002639A1 (en) | 2011-03-25 | 2014-01-02 | Joseph M. Cheben | Autonomous Detection of Chemical Plumes |
| US20120314080A1 (en) | 2011-06-10 | 2012-12-13 | Lee Yeu Yong | Gas leakage detecting system and method |
| US20130206990A1 (en) | 2011-08-22 | 2013-08-15 | ISC8 Inc. | Background Limited Focal Plane Array Assembly |
| US20170248517A1 (en) | 2011-09-09 | 2017-08-31 | Thermo Fisher Scientific (Bremen) Gmbh | High-accuracy mid-ir laseer-based gas sensor |
| US20150288894A1 (en) | 2011-11-04 | 2015-10-08 | Imec | Spectral camera with mirrors for projecting multiple adjacent image copies onto sensor array |
| JP2013128185A (en) | 2011-12-16 | 2013-06-27 | Toshiba Corp | Camera system and camera mount |
| US20130181836A1 (en) | 2012-01-18 | 2013-07-18 | Xerox Corporation | Image-based determination of co and co2 concentrations in vehicle exhaust gas emissions |
| US20130228887A1 (en) | 2012-03-01 | 2013-09-05 | Raytheon Company | Photodetector with surface plasmon resonance |
| US9599508B2 (en) | 2012-05-18 | 2017-03-21 | Rebellion Photonics, Inc. | Divided-aperture infra-red spectral imaging system |
| US10444070B2 (en) | 2012-05-18 | 2019-10-15 | Rebellion Photonics, Inc. | Divided-aperture infra-red spectral imaging system |
| US9625318B2 (en) | 2012-05-18 | 2017-04-18 | Rebellion Photonics, Inc. | Divided-aperture infra-red spectral imaging system for chemical detection |
| US20150069239A1 (en) | 2012-05-18 | 2015-03-12 | Rebellion Photonics, Inc. | Divided-aperture infra-red spectral imaging system for chemical detection |
| US20200072671A1 (en) | 2012-05-18 | 2020-03-05 | Rebellion Photonics, Inc. | Divided-aperture infra-red spectral imaging system for chemical detection |
| WO2013173541A1 (en) | 2012-05-18 | 2013-11-21 | Rebellion Photonics, Inc. | Divided-aperture infra-red spectral imaging system for chemical detection |
| US20170350758A1 (en) | 2012-05-18 | 2017-12-07 | Rebellion Photonics, Inc. | Divided-aperture infra-red spectral imaging system |
| US20200124470A1 (en) | 2012-05-18 | 2020-04-23 | Rebellion Photonics, Inc. | Divided-aperture infra-red spectral imaging system |
| US20150136981A1 (en) | 2012-05-18 | 2015-05-21 | Rebellion Photonics, Inc. | Divided-aperture infra-red spectral imaging system |
| US20170356802A1 (en) | 2012-05-18 | 2017-12-14 | Rebellion Photonics, Inc. | Divided-aperature infra-red spectral imaging system for chemical detection |
| US10254166B2 (en) | 2012-05-18 | 2019-04-09 | Rebellion Photonics, Inc. | Divided-aperture infra-red spectral imaging system for chemical detection |
| US9395516B2 (en) | 2012-05-28 | 2016-07-19 | Nikon Corporation | Imaging device |
| US20130342680A1 (en) | 2012-06-21 | 2013-12-26 | Providence Photonics, Llc | Multi-spectral infrared imaging system for flare combustion efficiency monitoring |
| EP2870419A1 (en) | 2012-07-06 | 2015-05-13 | Industrial Origami, Inc. | Solar panel rack |
| WO2014008137A1 (en) | 2012-07-06 | 2014-01-09 | Industrial Origami, Inc. | Solar panel rack |
| US8686364B1 (en) | 2012-09-17 | 2014-04-01 | Jp3 Measurement, Llc | Method and system for determining energy content and detecting contaminants in a fluid stream |
| WO2014106122A1 (en)* | 2012-12-31 | 2014-07-03 | Genomatica, Inc. | Compositions and methods for bio-butadiene production screening |
| US20160356702A1 (en) | 2013-03-15 | 2016-12-08 | Michele Hinnrichs | Gas imager employing an array imager pixels with order filters |
| US20140320843A1 (en) | 2013-04-29 | 2014-10-30 | Raytheon Company | Time-multiplexed broadband and multi-filtered electro-optic sensor |
| US20160313181A1 (en) | 2013-06-18 | 2016-10-27 | Ramot At Tel-Aviv University Ltd. | Apparatus and method for snapshot spectral imaging |
| US20160238449A1 (en) | 2013-08-02 | 2016-08-18 | Verifood, Ltd. | Spectrometry system with decreased light path |
| US20150292948A1 (en) | 2013-08-02 | 2015-10-15 | Verifood, Ltd. | Spectrometry system with diffuser |
| US20160238454A1 (en) | 2013-09-16 | 2016-08-18 | Selex Es Ltd | Thermal imaging calibration system and method |
| GB2518224A (en) | 2013-09-16 | 2015-03-18 | Selex Es Ltd | Thermal imaging calibration system and method |
| US20160245698A1 (en) | 2013-10-16 | 2016-08-25 | The Arizona Board Of Regents On Behalf Of The University Of Arizona | Multispectral imaging based on computational imaging and a narrow-band absorptive filter array |
| US20160249228A1 (en) | 2013-10-30 | 2016-08-25 | Huawei Technologies Co., Ltd. | Method and apparatus for managing network sharing |
| US20150136982A1 (en) | 2013-11-12 | 2015-05-21 | Rebellion Photonics, Inc. | Divided-aperture infra-red spectral imaging system |
| US20170205290A1 (en) | 2013-11-12 | 2017-07-20 | Rebellion Photonics, Inc. | Divided-aperture infra-red spectral imaging system |
| CA2870419A1 (en) | 2013-11-12 | 2015-05-12 | Rebellion Photonics, Inc. | Divided-aperture infra-red spectral imaging system |
| EP2871452A1 (en) | 2013-11-12 | 2015-05-13 | Rebellion Photonics, Inc. | Divided-aperture infra-red spectral imaging system |
| US20200088586A1 (en) | 2013-11-12 | 2020-03-19 | Rebellion Photonics, Inc. | Divided-aperture infra-red spectral imaging system |
| US10267686B2 (en) | 2013-11-12 | 2019-04-23 | Rebellion Photonics, Inc. | Divided-aperture infra-red spectral imaging system |
| US9562849B2 (en) | 2013-11-12 | 2017-02-07 | Rebellion Photonics, Inc. | Divided-aperture infra-red spectral imaging system |
| US20150138534A1 (en) | 2013-11-18 | 2015-05-21 | Elta Systems Ltd. | Multiband flash detection system |
| US20150144770A1 (en) | 2013-11-26 | 2015-05-28 | nanoLambda Korea | Multispectral imager with hybrid double layer filter array |
| WO2015108236A1 (en) | 2014-01-14 | 2015-07-23 | 삼성테크윈 주식회사 | Summary image browsing system and method |
| US20160380014A1 (en) | 2014-01-27 | 2016-12-29 | INVIS Technologies Corporation | Thermal Imaging Device |
| US20150226613A1 (en) | 2014-02-07 | 2015-08-13 | Raytheon Company | Imaging device with shutterless non-uniformity correction |
| EP2942615A1 (en) | 2014-05-01 | 2015-11-11 | Rebellion Photonics, Inc. | Mobile gas and chemical imaging camera |
| US20190273875A1 (en) | 2014-05-01 | 2019-09-05 | Rebellion Photonics, Inc. | Mobile gas and chemical imaging camera |
| US20190373185A1 (en) | 2014-05-01 | 2019-12-05 | Rebellion Photonics, Inc. | Dual-band divided-aperture infra-red spectral imaging system |
| US9756263B2 (en) | 2014-05-01 | 2017-09-05 | Rebellion Photonics, Inc. | Mobile gas and chemical imaging camera |
| US20180077363A1 (en) | 2014-05-01 | 2018-03-15 | Rebellion Photonics, Inc. | Mobile gas and chemical imaging camera |
| EP2955496A2 (en) | 2014-05-01 | 2015-12-16 | Rebellion Photonics, Inc. | Dual band divided aperture infrared spectral imager (daisi) for chemical detection |
| US20170026588A1 (en) | 2014-05-01 | 2017-01-26 | Rebellion Photonics, Inc. | Dual-band divided-aperture infra-red spectral imaging system |
| US20150316473A1 (en) | 2014-05-01 | 2015-11-05 | Rebellion Photonics, Inc. | Mobile gas and chemical imaging camera |
| US10084975B2 (en) | 2014-05-01 | 2018-09-25 | Rebellion Photonics, Inc. | Mobile gas and chemical imaging camera |
| US20170089761A1 (en) | 2014-06-18 | 2017-03-30 | Gary L. McQuilkin | Spectral imaging system for remote and noninvasive detection of target substances using spectral filter arrays and image capture arrays |
| US9823231B1 (en) | 2014-06-30 | 2017-11-21 | Picarro, Inc. | Systems and methods for assembling a collection of peaks characterizing a gas leak source and selecting representative peaks for display |
| US20200124525A1 (en) | 2014-07-07 | 2020-04-23 | Rebellion Photonics, Inc. | Gas leak emission quantification with a gas cloud imager |
| US10458905B2 (en) | 2014-07-07 | 2019-10-29 | Rebellion Photonics, Inc. | Gas leak emission quantification with a gas cloud imager |
| US20160097713A1 (en) | 2014-07-07 | 2016-04-07 | Rebellion Photonics, Inc. | Gas leak emission quantification with a gas cloud imager |
| US20160037089A1 (en) | 2014-07-30 | 2016-02-04 | Raytheon Company | Multi-band thermal imaging sensor with integrated filter array |
| US20170138918A1 (en) | 2014-08-08 | 2017-05-18 | Imx S.R.L. | Gas detection system for toxic and/or flammable gas |
| US20160041095A1 (en) | 2014-08-08 | 2016-02-11 | Quantum-Si Incorporated | Optical system and assay chip for probing, detecting and analyzing molecule |
| US20160097714A1 (en) | 2014-10-07 | 2016-04-07 | Providence Photonics, Llc | Apparatus for imaging hydrogen sulfide plume and method of the same |
| US9641772B2 (en) | 2014-11-19 | 2017-05-02 | Northrop Grumman Systems Corporation | Compact PMMW camera calibration target |
| US9644562B2 (en) | 2014-12-03 | 2017-05-09 | Denso Corporation | Injector driving apparatus |
| EP3040706A1 (en) | 2015-01-02 | 2016-07-06 | Sensors Unlimited, Inc. | Detection of hydrocarbon gases using short wave infrared technology |
| US9404804B1 (en) | 2015-04-02 | 2016-08-02 | Palo Alto Research Center Incorporated | Thermal sensor with infrared absorption membrane including metamaterial structure |
| US20160349228A1 (en) | 2015-05-29 | 2016-12-01 | Rebellion Photonics, Inc. | Hydrogen sulfide imaging system |
| US10648960B2 (en) | 2015-05-29 | 2020-05-12 | Rebellion Photonics, Inc. | Hydrogen sulfide imaging system |
| WO2016196224A1 (en) | 2015-05-29 | 2016-12-08 | Rebellion Photonics, Inc. | Hydrogen sulfide imaging system |
| US20160379059A1 (en) | 2015-06-23 | 2016-12-29 | Raytheon Company | Methods and apparatus for video wall with feed indicators |
| US20170059807A1 (en) | 2015-08-28 | 2017-03-02 | Gopro, Inc. | Thermal compensation to adjust camera lens focus |
| US9612195B1 (en) | 2015-11-11 | 2017-04-04 | Bert Friedman | Gas detector and method for monitoring gas in a confined space |
| US20170138846A1 (en) | 2015-11-18 | 2017-05-18 | Servomex Group Limited | Method and system for reduction of influence of baseline distortion in absorption spectroscopy measurements |
| US20170234761A1 (en) | 2016-02-15 | 2017-08-17 | Universal Enterprises, Inc. | Leak detector |
| WO2017201194A1 (en) | 2016-05-18 | 2017-11-23 | MultiSensor Scientific, Inc. | Hydrocarbon leak imaging and quantification sensor |
| US20170347037A1 (en) | 2016-05-25 | 2017-11-30 | United States Of America, As Represented By The Secretary Of The Army | Multiple Field of View Dual Band Optics with Integrated Calibration Source |
| US20180039885A1 (en) | 2016-08-04 | 2018-02-08 | International Business Machines Corporation | Satellite-based location identification of methane-emitting sites |
| WO2018075964A1 (en) | 2016-10-21 | 2018-04-26 | Rebellion Photonics, Inc. | Mobile gas and chemical imaging camera |
| US10375327B2 (en) | 2016-10-21 | 2019-08-06 | Rebellion Photonics, Inc. | Mobile gas and chemical imaging camera |
| US20180188163A1 (en) | 2016-10-21 | 2018-07-05 | Rebellion Photonics, Inc. | Gas imaging system |
| US20180191967A1 (en) | 2016-10-21 | 2018-07-05 | Rebellion Photonics, Inc. | Mobile gas and chemical imaging camera |
| US20200128196A1 (en) | 2016-10-21 | 2020-04-23 | Rebellion Photonics, Inc. | Mobile gas and chemical imaging camera |
| WO2018075957A1 (en) | 2016-10-21 | 2018-04-26 | Rebellion Photonics, Inc. | Gas imaging system |
| US20190003984A1 (en) | 2017-02-22 | 2019-01-03 | Rebellion Photonics, Inc. | Systems and methods for monitoring remote installations |
| WO2018156795A1 (en) | 2017-02-22 | 2018-08-30 | Rebellion Photonics, Inc. | Systems and methods for monitoring remote installations |
| WO2019094639A1 (en) | 2017-11-09 | 2019-05-16 | Rebellion Photonics, Inc. | Window obscuration sensors for mobile gas and chemical imaging cameras |
| US20190137388A1 (en) | 2017-11-09 | 2019-05-09 | Rebellion Photonics, Inc. | Window obscuration sensors for mobile gas and chemical imaging cameras |
| US10605725B2 (en) | 2017-11-09 | 2020-03-31 | Rebellion Photonics, Inc. | Window obscuration sensors for mobile gas and chemical imaging cameras |
| US20200132596A1 (en) | 2017-11-09 | 2020-04-30 | Rebellion Photonics, Inc. | Window obscuration sensors for mobile gas and chemical imaging cameras |
Non-Patent Citations (19)
| Title |
|---|
| Hagen et al., "Snapshot Mueller Matrix Spectropolarimeter" Optics Letters, Aug. 1, 2007, vol. 32, No. 15, pp. 2100-2102. |
| Hagen et al., "Spectrally-Resolved Imaging of Dynamic Turbid Media", Multimodal Biomedical Imaging VI, Proceedings of SPIE vol. 7892, 2011, pp. 1-7. |
| Hagen et al., "Video-Rate Spectral Imaging of Gas Leaks in the Longwave Infrared," Chemical, Biological, Radiological, Nuclear, and Explosives (CBRNE) Sensing XIV, May 29, 2013, SPIE Proceedings vol. 8710, pp. 7. |
| Harley et al., "Remote Quantification of Smokestack Effluent Mass Flow Rates Using Imaging Fourier Transform Spectrometry," Chemical, Biological, Radiological, Nuclear, and Explosives (CBRNE) Sensing XII, Apr. 25-29, 2011, SPIE Proceedings vol. 8018, pp. 1-13. |
| Hayden et al., "Determination of Trace-Gas Amounts in Plumes by the Use of Orthogonal Digital Filtering of Thermal-Emission Spectra", Applied Optics, Jun. 1, 1996, vol. 35, No. 16, pp. 2802-2809. |
| Hirsch et al., "Detection of Gaseous Plumes in IR Hyperspectral Images Using Hierarchical Clustering", Applied Optics, Sep. 1, 2007, vol. 46, No. 25, pp. 6368-6374. |
| International Preliminary Report on Patentability in PCT Application No. PCT/US2013/041278 dated Nov. 27, 2014 in 9 pages. |
| International Preliminary Report on Patentability in PCT Application No. PCT/US2016/034455 dated Dec. 5, 2017 in 8 pages. |
| International Preliminary Report on Patentability in PCT Application No. PCT/US2017/057712 dated May 2, 2019 in 9 pages. |
| International Preliminary Report on Patentability in PCT Application No. PCT/US2017/057725 dated May 2, 2019 in 10 pages. |
| International Preliminary Report on Patentability in PCT Application No. PCT/US2018/019271 dated Sep. 6, 2019 in 11 pages. |
| Johnston et al., "A Real-Time FPGA Impiementation of a Barrel Distortion Correction Algorithm", Projects, 2003, vol. 10, pp. 91-96. |
| Karion et al., "Methane Emissions Estimate from Airborne Measurements Over a Western United States Natural Gas Field", Geophysical Research Letters, 2013, vol. 40, pp. 4393-4397. |
| Keshava et al., "A Survey of Spectral Unmixing Algorithms", Lincoln Laboratory Journal, 2003, vol. 14, No. 1, pp. 55-78. |
| Kester et al., "A Real-Time Gas Cloud Imaging Camera for Fugitive Emission Detection and Monitoring", Imaging and Applied Optics Technical Digest, 2012, pp. 3. |
| Kester et al., "Development of Image Mappers for Hyperspectral Biomedical Imaging Applications", Applied Optics, Apr. 1, 2010, vol. 49, No. 10, pp. 1886-1899. |
| Kester et al., "High Numerical Aperture Microendoscope Objective for a Fiber Confocal Reflectance Microscope", Optics Express, Mar. 5, 2007, vol. 15. No. 5, pp. 2409-2420. |
| U.S. Appl. No. 14/792,477, filed Jul. 6, 2015, U.S. Pat. No. 10,458,905, Patented. |
| US 10,113,914 B2, 10/2018, Kester et al. (withdrawn) |
Also Published As
| Publication number | Publication date |
|---|---|
| US20230003640A1 (en) | 2023-01-05 |
| US20160097713A1 (en) | 2016-04-07 |
| US20240094118A1 (en) | 2024-03-21 |
| US10458905B2 (en) | 2019-10-29 |
| US20200124525A1 (en) | 2020-04-23 |
Similar Documents
| Publication | Publication Date | Title |
|---|---|---|
| US11796454B2 (en) | Gas leak emission quantification with a gas cloud imager | |
| US12316995B2 (en) | Mobile gas and chemical imaging camera | |
| US11290662B2 (en) | Mobile gas and chemical imaging camera | |
| US11846619B2 (en) | Hydrogen sulfide imaging system | |
| US11821792B2 (en) | Divided-aperture infra-red spectral imaging system for chemical detection | |
| US20210250525A1 (en) | Mobile gas and chemical imaging camera | |
| EP3540392B1 (en) | Divided-aperture infra-red spectral imaging system | |
| CA2890498C (en) | Mobile gas and chemical imaging camera | |
| CA2890559C (en) | Dual-band divided aperture infra-red spectral imaging system | |
| Sabbah et al. | Remote sensing of gases by hyperspectral imaging: system performance and measurements | |
| WO2018156795A1 (en) | Systems and methods for monitoring remote installations | |
| Wynn et al. | Flight tests of the computational reconfigurable imaging spectrometer | |
| Zheng et al. | Antarctic Surveying Telescope (AST3-3) NIR camera for the Kunlun Infrared Sky Survey (KISS): thermal optimization and system performance | |
| Adams et al. | Modeling of response, noise, photon transfer curve, MTF, PSF, and atmospheric effects for SWIR, MWIR, and LWIR cameras |
Legal Events
| Date | Code | Title | Description |
|---|---|---|---|
| FEPP | Fee payment procedure | Free format text:ENTITY STATUS SET TO UNDISCOUNTED (ORIGINAL EVENT CODE: BIG.); ENTITY STATUS OF PATENT OWNER: LARGE ENTITY | |
| FEPP | Fee payment procedure | Free format text:ENTITY STATUS SET TO SMALL (ORIGINAL EVENT CODE: SMAL); ENTITY STATUS OF PATENT OWNER: LARGE ENTITY | |
| FEPP | Fee payment procedure | Free format text:ENTITY STATUS SET TO UNDISCOUNTED (ORIGINAL EVENT CODE: BIG.); ENTITY STATUS OF PATENT OWNER: LARGE ENTITY | |
| STPP | Information on status: patent application and granting procedure in general | Free format text:DOCKETED NEW CASE - READY FOR EXAMINATION | |
| AS | Assignment | Owner name:REBELLION PHOTONICS, INC., TEXAS Free format text:ASSIGNMENT OF ASSIGNORS INTEREST;ASSIGNORS:KESTER, ROBERT TIMOTHY;HAGEN, NATHAN ADRIAN;MALLERY, RYAN;SIGNING DATES FROM 20180521 TO 20180523;REEL/FRAME:053585/0066 | |
| STPP | Information on status: patent application and granting procedure in general | Free format text:NON FINAL ACTION MAILED | |
| STPP | Information on status: patent application and granting procedure in general | Free format text:RESPONSE TO NON-FINAL OFFICE ACTION ENTERED AND FORWARDED TO EXAMINER | |
| STPP | Information on status: patent application and granting procedure in general | Free format text:FINAL REJECTION MAILED | |
| STPP | Information on status: patent application and granting procedure in general | Free format text:RESPONSE AFTER FINAL ACTION FORWARDED TO EXAMINER | |
| STPP | Information on status: patent application and granting procedure in general | Free format text:NOTICE OF ALLOWANCE MAILED -- APPLICATION RECEIVED IN OFFICE OF PUBLICATIONS | |
| STPP | Information on status: patent application and granting procedure in general | Free format text:PUBLICATIONS -- ISSUE FEE PAYMENT VERIFIED | |
| STPP | Information on status: patent application and granting procedure in general | Free format text:WITHDRAW FROM ISSUE AWAITING ACTION | |
| STPP | Information on status: patent application and granting procedure in general | Free format text:DOCKETED NEW CASE - READY FOR EXAMINATION | |
| STCT | Information on status: administrative procedure adjustment | Free format text:PROSECUTION SUSPENDED | |
| STPP | Information on status: patent application and granting procedure in general | Free format text:NOTICE OF ALLOWANCE MAILED -- APPLICATION RECEIVED IN OFFICE OF PUBLICATIONS | |
| FEPP | Fee payment procedure | Free format text:PETITION RELATED TO MAINTENANCE FEES GRANTED (ORIGINAL EVENT CODE: PTGR); ENTITY STATUS OF PATENT OWNER: LARGE ENTITY | |
| STPP | Information on status: patent application and granting procedure in general | Free format text:PUBLICATIONS -- ISSUE FEE PAYMENT VERIFIED | |
| STCF | Information on status: patent grant | Free format text:PATENTED CASE |