US11540234B2 - Automated narrow peak interference severity estimation - Google Patents
Automated narrow peak interference severity estimationDownload PDFInfo
- Publication number
- US11540234B2 US11540234B2US17/108,716US202017108716AUS11540234B2US 11540234 B2US11540234 B2US 11540234B2US 202017108716 AUS202017108716 AUS 202017108716AUS 11540234 B2US11540234 B2US 11540234B2
- Authority
- US
- United States
- Prior art keywords
- data
- power
- baseline
- spectrum
- cpri
- Prior art date
- Legal status (The legal status is an assumption and is not a legal conclusion. Google has not performed a legal analysis and makes no representation as to the accuracy of the status listed.)
- Active, expires
Links
Images


Classifications
- H—ELECTRICITY
- H04—ELECTRIC COMMUNICATION TECHNIQUE
- H04W—WIRELESS COMMUNICATION NETWORKS
- H04W52/00—Power management, e.g. Transmission Power Control [TPC] or power classes
- H04W52/04—Transmission power control [TPC]
- H04W52/30—Transmission power control [TPC] using constraints in the total amount of available transmission power
- H04W52/34—TPC management, i.e. sharing limited amount of power among users or channels or data types, e.g. cell loading
- H—ELECTRICITY
- H04—ELECTRIC COMMUNICATION TECHNIQUE
- H04W—WIRELESS COMMUNICATION NETWORKS
- H04W24/00—Supervisory, monitoring or testing arrangements
- H04W24/10—Scheduling measurement reports ; Arrangements for measurement reports
- H—ELECTRICITY
- H04—ELECTRIC COMMUNICATION TECHNIQUE
- H04W—WIRELESS COMMUNICATION NETWORKS
- H04W52/00—Power management, e.g. Transmission Power Control [TPC] or power classes
- H04W52/04—Transmission power control [TPC]
- H04W52/30—Transmission power control [TPC] using constraints in the total amount of available transmission power
- H04W52/36—Transmission power control [TPC] using constraints in the total amount of available transmission power with a discrete range or set of values, e.g. step size, ramping or offsets
- H—ELECTRICITY
- H04—ELECTRIC COMMUNICATION TECHNIQUE
- H04W—WIRELESS COMMUNICATION NETWORKS
- H04W88/00—Devices specially adapted for wireless communication networks, e.g. terminals, base stations or access point devices
- H04W88/08—Access point devices
- H04W88/085—Access point devices with remote components
Definitions
- the present disclosuregenerally relates to network testing. More particularly, the present disclosure relates to systems and methods for automated analysis of Radio Frequency (RF) spectrum, namely for automated narrow peak interference severity estimation.
- RFRadio Frequency
- MNOsMobile network operators
- PIMPassive Intermodulation
- the RF spectrumis a stream of RF samples which is captured over-the-air or, in the case of fiber-based transport, over CPRI (Common Public Radio Interface) or enhanced CPRI (eCPRI).
- CPRIis a standard that defines an interface between Radio Equipment Controllers (REC) and Radio Equipment (RE).
- RECRadio Equipment Controllers
- RERadio Equipment
- CPRIallows the replacement of copper or coaxial cables between a radio transceiver and a base station, such as via fiber.
- CPRIis used herein to represent CPRI as well as eCPRI and other variants.
- EXFO's OpticalRFTM applicationprovides access to the RF signal through the digital CPRI link available at the base station, located at the bottom of the cell tower or kilometers away as in a Centralized Radio Access Network (C-RAN) architecture.
- C-RANCentralized Radio Access Network
- ORFcan be used by mobile operators to measure/troubleshoot cell towers.
- ORFhas various controls available in a spectrum analyzer: RBW, VBW, Center Frequency, Span, etc.
- RBWspectrum analyzer
- VBWCenter Frequency
- SpanCenter Frequency
- EXFO's iORFTM (Intelligent OpticalRF) applicationis an intelligent RF over CPRI application that auto-configures the analysis of the CPRI link as soon as a fiber is inserted and auto-detects the mapping of the antenna connected to the Radio Head.
- iORFprovides RF spectrum analysis over CPRI. Note, while described herein with respect to iORF, those skilled in the art will recognize any RF spectrum analysis device is contemplated.
- the located peaks corresponding to interferers on the networkare identified and are listed with their frequency (e.g., in MHz) and peak power (e.g., in dB). Peaks are often sorted on peak power to emphasize the interferences with the highest absolute power.
- a methodcomprising obtaining, via a test system, data from one or more tests of a mobile network having at least one antenna, wherein the data includes a stream of Radio Frequency (RF) samples captured over-the-air or from a Common Public Radio Interface (CPRI) or an enhanced CPRI (eCPRI) link; processing the data to detect peaks; performing an analysis of any detected peaks to identify any issues on the mobile network, the analysis including determining a relative power of the detected peaks with said relative power used to assign a severity estimation; and causing display of a user interface that includes a reporting of the relative power and the severity estimation with the user interface.
- RFRadio Frequency
- CPRICommon Public Radio Interface
- eCPRIenhanced CPRI
- determining a relative powerincludes obtaining a baseline power of a subset of the data and comparing an absolute power of the peak to the baseline power.
- obtaining the baseline powerincludes modeling the baseline power for the subset of data, the modeling including performing one of a linear regression and an average on the subset of the data to determine a baseline power function.
- the baseline power functionis a constant.
- the subset of the datais all of the data.
- obtaining the baselinefurther comprises averaging multiple samples of the subset of the data to obtain an average subset data set on which to perform the modeling.
- the subset of the datais an occupied bandwidth of the data and obtaining the baseline further comprises filtering the subset of data to extract data pertaining to the occupied bandwidth.
- performing the analysis of detected peaksfurther includes sorting the detected peaks in order of the relative power to assign a relative severity estimation.
- causing the displayfurther includes a ranking of spectrum interferers by antenna based on the severity estimation. For any two spectrum interferers, a higher severity estimation is given to a peak with a higher relative power therebetween.
- the displaycan include at least one spectrum interferer having a higher absolute power than another one spectrum interferer but ranked lower based on the severity estimation due to relative power.
- processing the datafurther includes performing Fast Fourier Transforms on said data and filtering based on an occupied bandwidth/
- a test systemcomprising: a detector configured to capture a stream of RF samples over-the-air or through connection to a Common Public Radio Interface (CPRI) link or enhanced CPRI (eCPRI) link; a processor; and memory storing instructions that, when executed, cause the processor to perform the steps of the method.
- CPRICommon Public Radio Interface
- eCPRIenhanced CPRI
- a non-transitory computer-readable storage mediumhaving computer-readable code stored thereon for programming a test system to perform the steps of the method.
- a non-transitory computer-readable storage mediumhas computer-readable code stored thereon for programming a test system to perform the steps of obtaining data from one or more tests of a mobile network having at least one antenna, wherein the data includes a stream of RF samples captured over-the-air or from a Common Public Radio Interface (CPRI) link; processing the data to detect peaks; performing an analysis of any detected peaks to identify any issues on the mobile network; and causing display of a user interface that includes a reporting of the relative power.
- CPRICommon Public Radio Interface
- a test systemin another embodiment, includes a detector configured to capture a stream of RF samples over-the-air or through connection to a Common Public Radio Interface (CPRI) link; a processor; and memory storing instructions that, when executed, cause the processor to obtain data from one or more tests of a mobile network having at least one antenna, wherein the data includes a stream of RF samples captured over-the-air or from a Common Public Radio Interface (CPRI) link; process the data to detect peaks; perform an analysis of any detected peaks to identify any issues on the mobile network; and cause display of a user interface that includes a reporting of the relative power.
- CPRICommon Public Radio Interface
- a methodincludes obtaining data from one or more tests of a Common Public Radio Interface (CPRI) link, wherein the data includes samples for selected Antenna Carriers (AxC) on the CPRI link; processing the data to detect peaks on any of the selected AxCs on the CPRI link; performing an analysis of any detected peaks to identify any issues on the CPRI link; and causing display of a user interface that includes a reporting of any identified issues with the user interface including a tabular display of the identified issues and a spectrum graph.
- CPRICommon Public Radio Interface
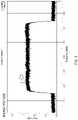
- FIG. 1is a screenshot of a user interface to display a spectrum trace on which an example spectrum is shown, the example spectrum having a peak identified by an arrow with an absolute power of 17 dB;
- FIG. 2is a screenshot of a user interface to display a spectrum trace on which an example spectrum is shown, the example spectrum having a peak identified by an arrow with an absolute power of 20 dB;
- FIG. 3includes FIG. 3 A and FIG. 3 B in which FIG. 3 A is a screenshot of a user interface to display spectrum traces on which a simulated spectrum suffering from exaggerated PIM and narrow interference peaks is shown with its minimum trace, its maximum trace, its average trace and its detected peaks and FIG. 3 B is the screenshot of FIG. 3 a on which are superimposed an approximate baseline power level and the absolute and relative power of its major detected peaks;
- FIG. 4is a flow chart of example main steps of a method for determining the relative power of detected peaks
- FIG. 5shows an example spectrum including its occupied bandwidth, its guard bands, its baseline power level and the absolute and relative power of its major detected peak
- FIG. 6is a screenshot of a user interface to display a tabular representation of the frequency, relative power and absolute power of detected peaks with simulated and exaggerated displayed values;
- FIG. 7includes FIG. 7 A and FIG. 7 B in which FIG. 7 A is a screenshot of a user interface to display a list of issues detected on the network, sorted by order of severity with simulated and exaggerated displayed values and FIG. 7 B is a screenshot of a user interface to display the spectrum relevant to the highlighted issue of FIG. 7 A , on which the displayed spectrum is simulated and suffering from exaggerated PIM and narrow interference peaks;
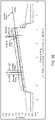
- FIG. 8includes FIG. 8 A and FIG. 8 B in which FIG. 8 A is a schematic representation of a test system with an associated User Interface (UI) in a configuration for use with a CPRI link tap and FIG. 8 B is a schematic representation of an alternative test system with an associated User Interface (UI) in a configuration for use in an over-the-air capture of RF data;
- FIG. 8 Ais a schematic representation of a test system with an associated User Interface (UI) in a configuration for use with a CPRI link tap
- FIG. 8 Bis a schematic representation of an alternative test system with an associated User Interface (UI) in a configuration for use in an over-the-air capture of RF data
- FIG. 9is a functional block diagram of the test system of FIG. 8 A ;
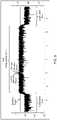
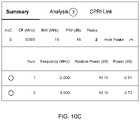
- FIG. 10includes FIG. 10 A , FIG. 10 B and FIG. 10 C in which FIG. 10 A is a screenshot of a user interface to display spectrum traces on which an example practical spectrum is shown with its minimum trace, its maximum trace, its average trace and its detected peaks and a framed section, FIG. 10 B is an enlarged view of the framed section of FIG. 10 A , and FIG. 10 C is a screenshot of a user interface to display a tabular representation of the frequency, relative power and absolute power of detected peaks of FIG. 10 A .
- the present disclosurerelates to systems and methods for automated analysis of Radio Frequency (RF) spectrum, namely for automated narrow peak interference severity estimation.
- the systems and methodsinclude the automatic configuration and detection of issues on a single trace or correlated traces with contextual reporting to a user.
- the objectiveis automated analysis and reporting enabling non-expert user interaction.
- the systems and methodsinclude minimal configuration by the user, i.e., parameters are automatically tuned for the measurement in progress.
- the systems and methodsperform automatic measurement of key parameters, detect the presence of interferers, identify interferers, and present those results is an easily understandable format, such as a tabular and text form.
- the traceis also presented.
- FIGS. 1 and 2give a practical example to better explain the limitations of the current peak power value.
- FIG. 1shows a power spectrum displayed in the iORF application. An arrow points to an interferer of interest. Its peak or absolute power is about 17 dB.
- FIG. 2shows another power spectrum. The only interferer has a peak or absolute power of 20 dB. When comparing both interferers using the peak or absolute power, one could conclude, erroneously, that the interferer of FIG. 2 is more severe than that of FIG. 1 .
- FIG. 3 Ashows a simulated example in which there is an exaggerated PIM issue as well as exaggerated narrow peaks for illustration purposes. Peaks 1 and 3 have a similar absolute power. However, peak 1 is actually stronger because of the slope of the spectrum affected by PIM. Comparing the absolute value of the peaks present in the same signal that is experiencing a PIM that distorts the shape of the spectrum may not serve to represent the real interferer severity.
- the problem to be solved hereis the automatic determination of the signal level function, or baseline power function, to allow a relative power calculation.
- the relative powercorresponds to the absolute power compared to the value of the baseline power function at the frequency of the peak. This can, in turn, automate the process of determining the severity of a peak and rank them from most severe to least severe.
- This automatic determinationshould not be based on the skill of the technician for reading the power spectrum. It should consider that other RF issues can affect the signal shape. It should also allow comparison regardless of the configuration.
- Determining a baseline power function for the spectrumis the problem to solve. Determining proper reference points in the spectrum is the primary challenge. Powerful interferences make finding proper reference points difficult due to their ability to distort spectrum power levels.
- the present systemdetermines that the signal of FIG. 1 has a signal level, or baseline power, of ⁇ 20 dB and calculates that the interferer's relative power is 37 dB by subtracting the baseline power from the absolute power. Using the same logic, the interferer of FIG. 2 has a relative power of about 23 dB since its signal has a baseline power of ⁇ 3 dB. A more precise appreciation of the severity (importance or relevance) of the peak is therefore that the interferer of FIG. 1 is more severe and, if addressed and solved first by skilled technicians, would have a greater impact on the improvement of the quality of the RF signal.
- FIG. 4a flow chart of main steps of an example method 5 for determining a relative power value for the peaks is shown.
- the methodcomprises five steps as follows.
- Step S 1Take raw Fast Fourier Transform (FFT) Data and perform an average over multiple FFTs to have a proper set of data that does not fluctuate rapidly based on carrier activity. For example, an average of 16 FFTs can be used. This value is configurable. It can represent, for example, multiple seconds of data. These multiple snapshots of the full spectrum in time allow to minimize fluctuations caused by carrier activity which should be ignored in order to determine the baseline power level of the spectrum.
- the result of Step S 1is an average signal output which was never actually captured by the system, but which represents a stable basis to perform the baseline power level calculation.
- Step S 1could be omitted if one is willing to have the baseline calculation potentially affected by carrier activity.
- the difference in the resulting baseline calculationmay be negligible depending on the nature of the signal.
- Step S 2Perform filtering on this averaged data. Filtering may include two sub-steps: a) remove values that are not present in the occupied bandwidth of a signal spectrum and b) decimate points per bin to optimize the baseline calculation.
- the occupied bandwidthis calculated using the Long-Term Evolution LTE or Universal Mobile Telecommunications Service (UMTS) specifications.
- the signal bandwidth, occupied subcarrier count, FFT size, and oversample of the signalare used to determine the points that will be filtered out. Equation 1 provides the percentage of the spectrum, which contains the transmitted data. Data not present in this percentage on both sides of the spectrum are omitted.
- FIG. 5shows an example spectrum including its occupied bandwidth, its guard bands, its baseline power level and the absolute and relative power of its major detected peak.
- the example occupied bandwidthis shown with a red bracket. If step S 2 a is omitted, the guard bands on each side of the occupied bandwidth (shown with blue brackets) will be considered in the determination of the baseline power, which will typically yield a baseline power level lower than the actual baseline power.
- the optimization of the baseline calculationcan vary based on resolution bandwidth, namely FFT size and size of the bins. For example, if we decide to use a kHz bin size for a 5 MHz signal, about 4-5 points per bin will be used. If we use a bin size of a MHz, it would be 4300-5000 points per bin when using an FFT size of 32768 points. As will be readily understood, step S 2 b can be omitted.
- Step S 3Perform a mathematical calculation on the filtered data to compute the baseline power level of the data set.
- Example calculationsinclude an average or linear regression of the points.
- Linear regressionhas the added advantage of negating the effect of PIM, if present in the data set.
- Example linear regression algorithmsinclude least-squared linear regression and linear absolute deviation (LAD) regression.
- Step S 3yields a baseline value (simple average) or a relative baseline of the data set which is a linear function (linear regression). Inserting an array index in the x value of the relative baseline function calculates an appropriate y value of the baseline for that index.
- An example baseline level(simple average) is displayed in green in the example spectrum of FIG. 3 A .
- An example baseline power function (linear regression)is displayed in white in the example spectrum of FIG. 3 B .
- Other techniquescould be used. For example, one could first filter out the peaks and some spikes using spike filtering and could then perform an average over the filtered signal. Spike filtering would involve identifying large power and short duration spikes.
- Step S 4Compare the peak absolute power to the relative baseline absolute power.
- the comparisoncan be done in Watts or in dB.
- the relative power in dBis the ratio between the absolute Peak Power divided by the baseline power in Watts converted to dB or the subtraction of peak absolute power in dB by baseline power in dB. This comparison can be a ratio of peak absolute power over baseline power.
- Baseline poweris a value in Watts.
- Example Absolute and Relative powersare displayed in orange in the example spectrums of FIG. 3 B and FIG. 5 .
- Step S 5Return the relative power value.
- the absolute peak power and/or the relative peak powercan be displayed to the user on a user interface of the system.
- a list of all detected peaks in the spectrum of FIG. 3is provided with the center frequency at which the peak appears (MHz), the absolute peak power (dB) and the relative peak power (dB).
- the peaksare numbered sequentially in order of frequency of appearance.
- the peakscan then be sorted from highest relative power to lowest relative power in a table of issues found on the network, therefore assigning a higher severity level to a peak with a higher relative power.
- Other sorting schemesmay also take into account the absolute power and/or the center frequency of the peak in addition to the relative power.
- issues other than narrow peak interferersone may choose to list a PIM issue as having a higher severity than the most severe narrow peak interferer.
- FIG. 7includes screenshots of an example interface for displaying information about issues detected on the network.
- FIG. 7 Ashows a list of detected network issues sorted based on their severity and taking into account all AxCs. The most severe issue, an internal PIM issue, is selected.
- FIG. 7 Bshows the selected spectrum (AxC 13 ) with multiple detected issues, including the internal PIM listed as the most severe issue in FIG. 7 A and a few narrow peak interferers.
- the interferer detected at 1.040 MHz on AxC 13is not as severe as the interferer detected at ⁇ 1.040 MHz on AxC 10 (86.91 dB).
- This solutionprovides an automated way of comparing interferers between different antenna spectrums and within the same antenna spectrum. This automation discards time-sensitive data fluctuation and provides a reliable method for comparing interferers between antenna with different spectrum characteristics.
- This algorithmignores the appearance of interferences and PIM in a power spectrum and can easily determine the baseline power level. It provides a standard baseline that is taken throughout the occupied bandwidth of a spectrum allowing for any point that lies within that occupied bandwidth to be compared correctly with another. The factor of carrier activity is also removed from consideration since this solution performs an average over multiple seconds of FFT Data. If a user were to manually compute this calculation it is possible carrier activity would make it difficult to find a proper baseline.
- FIG. 8 Ashows a test system 10 for a fiber-based network labelled iORF with an associated User Interface (UI).
- the test systemis connected to a CPRI link via a tap or optical splitter.
- the CPRI linkcan be a fiber connection between a Remote Radio Head (RRH) on a cell tower and a Baseband Unit (BBU).
- the tapcan be an optical power tap that provides a portion of the optical power on the CPRI link to the test system for analysis thereof.
- An AxC within the CPRI linkis an Antenna Carrier. It is a portion of the CPRI link where IQ samples of a particular antenna are transported. For the untrained eye, it is difficult to provide an assessment of the quality of the CPRI link by looking at the spectrum trace in the UI. Experience is required to properly set the different parameters and values such as RBW, VBW, min trace, max trace, etc., on the test system. Furthermore, the user has to correlate interferences on multiple AxCs manually by bringing up multiple graphs and comparing them in order to identify interferers.
- FIG. 8 Bshows an alternative test system that captures the streams of RF data over-the-air from the antenna.
- the test systemis connected to a receiver antenna via a connector.
- the receiver antennahas an appropriate frequency range for the application.
- the receiver antennareceives and captures the stream of RF data emitted from the network antenna.
- FIG. 9is a functional block diagram of the test system 10 .
- the test system 10can be a processing device that, in terms of hardware architecture, generally includes a CPRI interface detector 30 , a processor 32 , input/output (I/O) interfaces 34 , a network interface 36 , and memory 38 . It should be appreciated by those of ordinary skill in the art that FIG. 9 depicts the test system 10 in an oversimplified manner, and a practical embodiment may include additional components and suitably configured processing logic to support known or conventional operating features that are not described in detail herein.
- the components ( 30 , 32 , 34 , 36 , and 38 )are communicatively coupled via a local interface such as, for example, one or more buses or other wired or wireless connections, as is known in the art.
- the CPRI interface detector 30is configured to connect to the CPRI link, such as via the tap.
- the CPRI linkcan be a receiver, i.e., a photodetector, that is configured to receive a signal for processing by the test system 10 .
- the CPRI linkcan be an electrical link as well with the tap being a splitter or the like.
- the alternative test system of FIG. 8 Bhas a data detector 30 ′ (not shown), which replaces the CPRI interface detector 30 .
- the data detector 30 ′is adapted to receive the streams of RF data over-the-air instead of via the tap 16 .
- the data detector 30 ′can be a receiver that is configured to receive an RF signal for processing by the test system.
- the processor 32is a hardware device for executing software instructions.
- the processor 32may be any custom made or commercially available processor, a Central Processing Unit (CPU), an auxiliary processor among several processors associated with the test system 10 , a semiconductor-based microprocessor (in the form of a microchip or chip set), or generally any device for executing software instructions.
- the processor 32is configured to execute software stored within the memory 38 , to communicate data to and from the memory 38 , and to generally control operations of the test system 10 pursuant to the software instructions.
- the I/O interfaces 34may be used to receive user input from and/or for providing system output to one or more devices or components.
- the user inputmay be provided via, for example, a keyboard, touchpad, and/or a mouse.
- System outputmay be provided via a display device and a printer (not shown).
- the network interface 36may be used to enable the test system 10 to communicate on a network, such as the Internet.
- the network interface 36may include, for example, an Ethernet card or adapter (e.g., 10BaseT, Fast Ethernet, Gigabit Ethernet, 10 GbE) or a wireless local area network (WLAN) card or adapter (e.g., 802.11a/b/g/n/ac).
- the network interface 36may include address, control, and/or data connections to enable appropriate communications on the network.
- the UI 12 in FIG. 1can be provided via a display device connected to the I/O interfaces 34 and/or via a remote device connected via a network through the network interface 36 .
- the memory 38may include any of volatile memory elements (e.g., Random Access Memory (RAM, such as DRAM, SRAM, SDRAM, etc.)), nonvolatile memory elements (e.g., ROM, hard drive, tape, CDROM, etc.), and combinations thereof. Moreover, the memory 38 may incorporate electronic, magnetic, optical, and/or other types of storage media. Note that the memory 38 may have a distributed architecture, where various components are situated remotely from one another, but can be accessed by the processor 32 .
- the software in memory 38may include one or more software programs, each of which includes an ordered listing of executable instructions for implementing logical functions.
- the software in the memory 38includes a suitable operating system (O/S) and programs.
- O/Soperating system
- the operating systemessentially controls the execution of other computer programs, such as the programs, and provides scheduling, input-output control, file and data management, memory management, and communication control and related services.
- the programsmay be configured to implement the various processes, algorithms, methods, techniques, etc., described herein.
- the test system 10includes functional components such as a test sequencer 40 , a PIM measurement function 46 , a peak detection function 48 , a spectrum traces function 50 , and a post-analysis function 52 .
- a test sequencer 40a PIM measurement function 46
- a peak detection function 48a peak detection function 48
- a spectrum traces function 50a spectrum traces function 50
- a post-analysis function 52a post-analysis function.
- These various functions ( 40 , 46 , 48 , 50 , 52 )can be software instructions executed on the processor 32 for automated RF analysis.
- the test system 10is configured to perform multiple measurements orchestrated by the test sequencer 40 .
- test system 10is configured to connect to the CPRI link
- additional functional componentssuch as a CPRI mapping auto-detect function 42 and an AxC configuration function 44 can be provided to carry out measurements on selected one of the AxCs detected by the CPRI mapping auto-detect function 42 .
- Functions 42 and 44can be software instructions executed on the processor 32 for automated RF analysis.
- the test system 10is a turn-up and troubleshooting tool and may be referred to as a test application or system.
- the test system 10includes the test sequencer 40 which is an automated sequencer configured to fully assess the captured data. This automated sequence includes automated detection of anomalies with key characteristics (e.g., frequency, bandwidth, level) and identification of pre-defined Interference Types (e.g., a UHF Monitor, Wi-Fi hotspot), etc.
- the test system 10requires minimal User Configuration (e.g., Center Frequency, Reference Power). Further, the test system 10 includes progressive reporting as tests are running, correlation of anomalies/interferences, and a reporting view with complete link assessment (e.g., tabular views, annotated RF Spectrum graphs, etc.).
- the assessmentincludes all active AxCs.
- the automated sequenceincludes auto-discovery of CPRI link rate and Key Performance Indicator (KPI) measurements, auto-discovery of AxC mapping and automated AxC KPI measurements (e.g., PIM).
- KPIKey Performance Indicator
- AxC mappinge.g., PIM
- PIMKey Performance Indicator
- the correlation of anomalies/interferencesincludes those observed in more than 1 AxC (e.g., external PIM).
- FIG. 10 Ashows an example practical spectrum.
- This example practical spectrumrepresents data collected in the field in an experiment.
- the effect of PIMis more subtle and the narrow peak interferences have much smaller absolute power values.
- the carrier activity in the occupied bandwidthis noisier.
- the guard bandshave a more typical shape.
- the section of the trace which is of particular interest for the present system and methodis framed in orange. A visual inspection of the trace does not suffice to determine the most severe interference and a calculation of the absolute power does not yield significant results as the two peaks only have a 0.82 dB difference in absolute power, which is substantially the same absolute power.
- FIG. 10 Bis an enlarged view of the framed section of FIG. 10 A .
- the slope of the occupied bandwidth caused by the presence of PIMis apparent and is known to affect the relative power of each peak.
- FIG. 10 Cshows a tabular representation of the frequency, relative power and absolute power of detected peaks of FIG. 10 as calculated by the present method and using the present system.
- the peaksonly have a 0.82 dB difference in absolute power, they have a 2 dB difference in relative power.
- the peak on the left (peak 1)which appears to be more severe when only considering the absolute power is actually less severe than the peak on the right (peak 2) when considering the relative power as calculated by the present method.
- processorssuch as microprocessors; Central Processing Units (CPUs); Digital Signal Processors (DSPs): customized processors such as Network Processors (NPs) or Network Processing Units (NPUs), Graphics Processing Units (GPUs), or the like; Field Programmable Gate Arrays (FPGAs); and the like along with unique stored program instructions (including both software and firmware) for control thereof to implement, in conjunction with certain non-processor circuits, some, most, or all of the functions of the methods and/or systems described herein.
- processorssuch as microprocessors; Central Processing Units (CPUs); Digital Signal Processors (DSPs): customized processors such as Network Processors (NPs) or Network Processing Units (NPUs), Graphics Processing Units (GPUs), or the like; Field Programmable Gate Arrays (FPGAs); and the like along with unique stored program instructions (including both software and firmware) for control thereof to implement, in conjunction with certain non-processor circuits, some, most, or all of the functions of
- circuitryconfigured or adapted to
- logicconfigured or adapted to
- some embodimentsmay include a non-transitory computer-readable storage medium having computer readable code stored thereon for programming a computer, server, appliance, device, processor, circuit, etc. each of which may include a processor to perform functions as described and claimed herein.
- Examples of such computer-readable storage mediumsinclude, but are not limited to, a hard disk, an optical storage device, a magnetic storage device, a ROM (Read Only Memory), a PROM (Programmable Read Only Memory), an EPROM (Erasable Programmable Read Only Memory), an EEPROM (Electrically Erasable Programmable Read Only Memory), Flash memory, and the like.
- softwarecan include instructions executable by a processor or device (e.g., any type of programmable circuitry or logic) that, in response to such execution, cause a processor or the device to perform a set of operations, steps, methods, processes, algorithms, functions, techniques, etc. as described herein for the various embodiments.
- a processor or devicee.g., any type of programmable circuitry or logic
- Embodiments of the present disclosuremay also take the form of a data carrier signal carrying computer program code that reproduces one or more of the claimed computer-implemented methods.
Landscapes
- Engineering & Computer Science (AREA)
- Computer Networks & Wireless Communication (AREA)
- Signal Processing (AREA)
- Monitoring And Testing Of Transmission In General (AREA)
Abstract
Description
Claims (18)
Priority Applications (1)
| Application Number | Priority Date | Filing Date | Title |
|---|---|---|---|
| US17/108,716US11540234B2 (en) | 2019-12-05 | 2020-12-01 | Automated narrow peak interference severity estimation |
Applications Claiming Priority (3)
| Application Number | Priority Date | Filing Date | Title |
|---|---|---|---|
| US201962944142P | 2019-12-05 | 2019-12-05 | |
| US202063011621P | 2020-04-17 | 2020-04-17 | |
| US17/108,716US11540234B2 (en) | 2019-12-05 | 2020-12-01 | Automated narrow peak interference severity estimation |
Publications (2)
| Publication Number | Publication Date |
|---|---|
| US20210176716A1 US20210176716A1 (en) | 2021-06-10 |
| US11540234B2true US11540234B2 (en) | 2022-12-27 |
Family
ID=73726698
Family Applications (1)
| Application Number | Title | Priority Date | Filing Date |
|---|---|---|---|
| US17/108,716Active2041-02-16US11540234B2 (en) | 2019-12-05 | 2020-12-01 | Automated narrow peak interference severity estimation |
Country Status (2)
| Country | Link |
|---|---|
| US (1) | US11540234B2 (en) |
| EP (1) | EP3833089B1 (en) |
Cited By (1)
| Publication number | Priority date | Publication date | Assignee | Title |
|---|---|---|---|---|
| US20220294528A1 (en)* | 2020-10-01 | 2022-09-15 | Viavi Solutions Inc. | Modular cell site installation, testing, measurement, and maintenance tool |
Citations (53)
| Publication number | Priority date | Publication date | Assignee | Title |
|---|---|---|---|---|
| US6373909B2 (en) | 1999-10-22 | 2002-04-16 | Telefonaktiebolaget Lm Ericsson (Publ) | Communications terminal having a receiver and method for removing known interferers from a digitized intermediate frequency signal |
| US6622044B2 (en) | 2001-01-04 | 2003-09-16 | Cardiac Pacemakers Inc. | System and method for removing narrowband noise |
| US7024680B2 (en) | 2000-11-16 | 2006-04-04 | Broadcom Corporation | Method and apparatus for detection and classification of impairments on a RF modulated network |
| US7106781B2 (en) | 1997-02-24 | 2006-09-12 | Cingular Wireless Ii, Llc | Highly bandwidth-efficient communications |
| US7133686B2 (en) | 2003-01-08 | 2006-11-07 | Vtech Telecommunication Limited | System and method for identifying interferes in a communication spectrum |
| US7269151B2 (en) | 2002-04-22 | 2007-09-11 | Cognio, Inc. | System and method for spectrum management of a shared frequency band |
| US7457295B2 (en) | 2002-12-10 | 2008-11-25 | Adapt4 Llc | Radio communication system employing spectral reuse transceivers |
| US7656897B2 (en) | 2005-10-26 | 2010-02-02 | Utstarcom Telecom Co., Ltd. | CPRI-based multiprotocol signal transmission method and apparatus in distributed base station system |
| US7822105B2 (en) | 2003-09-02 | 2010-10-26 | Sirf Technology, Inc. | Cross-correlation removal of carrier wave jamming signals |
| US7860193B2 (en) | 2004-07-20 | 2010-12-28 | Qualcomm Incorporated | Coarse timing estimation system and methodology for wireless symbols |
| US7986922B2 (en) | 2006-12-15 | 2011-07-26 | Qualcomm Incorporated | Jammer detection and suppression for wireless communication |
| US8027643B2 (en) | 2007-11-21 | 2011-09-27 | Telefonaktiebolaget Lm Ericsson (Publ) | Method and a radio base station in a telecommunications system |
| US8144824B2 (en) | 2005-03-10 | 2012-03-27 | Qualcomm Incorporated | Trend influenced time tracking |
| US8295380B2 (en) | 2007-05-04 | 2012-10-23 | Amicus Wireless Technology Ltd | Automatic gain control circuit for MIMO OFDM receiver |
| US8320433B2 (en) | 2008-05-21 | 2012-11-27 | Integrated Device Technology Inc. | Compression of baseband signals in base transceiver system interfaces |
| US20130045705A1 (en) | 2010-05-31 | 2013-02-21 | St-Ericsson Sa | Filtering Interference Detected at Wireless Receiver |
| US8428203B1 (en) | 2009-01-06 | 2013-04-23 | Pmc-Sierra, Inc. | Integrated tunable RF notch filter |
| US20130115904A1 (en) | 2010-07-13 | 2013-05-09 | St-Ericsson Sa | Synchronizing and Detecting Interference in Wireless Receiver |
| US8649388B2 (en) | 2010-09-02 | 2014-02-11 | Integrated Device Technology, Inc. | Transmission of multiprotocol data in a distributed antenna system |
| US8694306B1 (en) | 2012-05-04 | 2014-04-08 | Kaonyx Labs LLC | Systems and methods for source signal separation |
| US20140323058A1 (en) | 2013-03-15 | 2014-10-30 | DGS Global Systems, Inc. | Systems, methods, and devices for electronic spectrum management for identifying open space |
| US9014052B2 (en) | 2013-01-14 | 2015-04-21 | Andrew Llc | Interceptor system for characterizing digital data in telecommunication system |
| US9071343B2 (en) | 2013-03-15 | 2015-06-30 | Isco International, Llc | Method and apparatus for avoiding interference |
| US9083567B2 (en) | 2010-02-17 | 2015-07-14 | Qualcomm Incorporated | Automatic gain control techniques for detecting RF saturation |
| US9125054B2 (en) | 2012-03-23 | 2015-09-01 | Broadcom Corporation | Configurable integrated radio processor |
| US20150358928A1 (en) | 2014-06-05 | 2015-12-10 | Qualcomm Incorporated | Automatic gain control for time division duplex lte |
| US9276605B2 (en) | 2013-01-16 | 2016-03-01 | Telefonaktiebolaget L M Ericsson (Publ) | Compression and de-compression of complex valued OFDM data for a radio base station |
| US9277424B2 (en) | 2013-02-28 | 2016-03-01 | Keysight Technologies, Inc. | Method and apparatus for determining the configuration of a cellular transmission system |
| US9288683B2 (en) | 2013-03-15 | 2016-03-15 | DGS Global Systems, Inc. | Systems, methods, and devices for electronic spectrum management |
| EP3035063A1 (en) | 2014-12-16 | 2016-06-22 | Alcatel Lucent | Testing system for passive inter-modulations, corresponding method and computer-readable medium |
| US9385780B2 (en) | 2012-10-15 | 2016-07-05 | Ikanos Communications, Inc. | Method and apparatus for detecting and analyzing noise and other events affecting a communication system |
| US20160277050A1 (en) | 2013-12-10 | 2016-09-22 | Hitachi Kokusai Electric Inc. | Receiver |
| US20170237484A1 (en)* | 2016-01-18 | 2017-08-17 | Qoscience, Inc. | Method and apparatus for the detection of distortion or corruption of cellular communication signals |
| US20170245162A1 (en) | 2016-02-19 | 2017-08-24 | Commscope Technologies Llc | Passive intermodulation (pim) testing in distributed base transceiver station architecture |
| US20170294928A1 (en) | 2012-11-29 | 2017-10-12 | Aceaxis Limited | Processing interference due to non-linear products in a wireless network |
| US20170317717A1 (en)* | 2014-11-25 | 2017-11-02 | Telefonaktiebolaget Lm Ericsson (Publ) | Testing a cable |
| US20170353929A1 (en) | 2016-06-01 | 2017-12-07 | Isco International, Llc | Method and apparatus for performing signal conditioning to mitigate interference detected in a communication system |
| US20180070254A1 (en) | 2016-09-08 | 2018-03-08 | Commscope Technologies Llc | Interference detection and identification in wireless network from rf or digitized signal |
| US20180081047A1 (en) | 2016-09-19 | 2018-03-22 | Commscope Technologies Llc | Determining distance to source of passive intermodulation product (pim) in a distributed base station |
| US9979600B2 (en) | 2015-12-15 | 2018-05-22 | Nxp Usa, Inc. | System and method for automatic load adaptive antenna carrier bandwidth dynamic reconfiguration in radio base station system |
| US10009784B1 (en) | 2016-06-01 | 2018-06-26 | Yupana, Inc. | Remote detection and analysis of passive intermodulation problems in radio base stations |
| US20180248576A1 (en) | 2015-10-26 | 2018-08-30 | Telefonaktiebolaget Lm Ericsson (Publ) | Cell site passive intermodulation detection receiver |
| US10067171B2 (en) | 2014-04-08 | 2018-09-04 | Analog Devices Global | Active antenna system and methods of determining intermodulation distortion performance |
| US10069607B2 (en) | 2016-04-06 | 2018-09-04 | Nxp Usa, Inc. | Common public radio interface, CPRI, lane controller and method of operating thereof |
| US20180269923A1 (en) | 2017-03-17 | 2018-09-20 | Corning Incorporated | Communication circuit enabling optimal synchronization for self-interference cancellation (sic) in a wireless communications system (wcs) |
| US20180295553A1 (en) | 2017-04-05 | 2018-10-11 | Isco International, Llc | Method and apparatus for increasing performance of communication paths for communication nodes |
| US20180323815A1 (en) | 2017-05-03 | 2018-11-08 | Telefonaktiebolaget Lm Ericsson (Publ) | Interference analysis in wireless networks |
| US20180359048A1 (en) | 2015-12-01 | 2018-12-13 | Telefonaktiebolaget Lm Ericsson (Publ) | Methods and devices for addressing passive intermodulation in wireless communication |
| US20180368077A1 (en) | 2015-07-08 | 2018-12-20 | Telefonaktiebolaget Lm Ericsson (Publ) | Uplink spectrum analysis technique for passive intermodulation (pim) detection |
| US20190052294A1 (en) | 2017-08-09 | 2019-02-14 | Isco International, Llc | Method and apparatus for detecting and analyzing passive intermodulation interference in a communication system |
| US20190058534A1 (en) | 2017-08-16 | 2019-02-21 | Keysight Technologies, Inc. | Systems and methods for detecting passive inter-modulation (pim) interference in cellular networks |
| US10237765B1 (en) | 2018-09-07 | 2019-03-19 | Anritsu Company | Passive intermodulation (PIM) measuring instrument and method of measuring PIM |
| US20190386753A1 (en)* | 2018-06-18 | 2019-12-19 | Exfo Inc. | Fronthaul remote access and monitoring systems and methods to test fiber optic infrastructure and RF spectrum |
- 2020
- 2020-12-01USUS17/108,716patent/US11540234B2/enactiveActive
- 2020-12-04EPEP20211952.5Apatent/EP3833089B1/enactiveActive
Patent Citations (58)
| Publication number | Priority date | Publication date | Assignee | Title |
|---|---|---|---|---|
| US7106781B2 (en) | 1997-02-24 | 2006-09-12 | Cingular Wireless Ii, Llc | Highly bandwidth-efficient communications |
| US6373909B2 (en) | 1999-10-22 | 2002-04-16 | Telefonaktiebolaget Lm Ericsson (Publ) | Communications terminal having a receiver and method for removing known interferers from a digitized intermediate frequency signal |
| US7024680B2 (en) | 2000-11-16 | 2006-04-04 | Broadcom Corporation | Method and apparatus for detection and classification of impairments on a RF modulated network |
| US6622044B2 (en) | 2001-01-04 | 2003-09-16 | Cardiac Pacemakers Inc. | System and method for removing narrowband noise |
| US7269151B2 (en) | 2002-04-22 | 2007-09-11 | Cognio, Inc. | System and method for spectrum management of a shared frequency band |
| US7457295B2 (en) | 2002-12-10 | 2008-11-25 | Adapt4 Llc | Radio communication system employing spectral reuse transceivers |
| US7133686B2 (en) | 2003-01-08 | 2006-11-07 | Vtech Telecommunication Limited | System and method for identifying interferes in a communication spectrum |
| US7822105B2 (en) | 2003-09-02 | 2010-10-26 | Sirf Technology, Inc. | Cross-correlation removal of carrier wave jamming signals |
| US7860193B2 (en) | 2004-07-20 | 2010-12-28 | Qualcomm Incorporated | Coarse timing estimation system and methodology for wireless symbols |
| US8144824B2 (en) | 2005-03-10 | 2012-03-27 | Qualcomm Incorporated | Trend influenced time tracking |
| US7656897B2 (en) | 2005-10-26 | 2010-02-02 | Utstarcom Telecom Co., Ltd. | CPRI-based multiprotocol signal transmission method and apparatus in distributed base station system |
| US7986922B2 (en) | 2006-12-15 | 2011-07-26 | Qualcomm Incorporated | Jammer detection and suppression for wireless communication |
| US8295380B2 (en) | 2007-05-04 | 2012-10-23 | Amicus Wireless Technology Ltd | Automatic gain control circuit for MIMO OFDM receiver |
| US8027643B2 (en) | 2007-11-21 | 2011-09-27 | Telefonaktiebolaget Lm Ericsson (Publ) | Method and a radio base station in a telecommunications system |
| US8320433B2 (en) | 2008-05-21 | 2012-11-27 | Integrated Device Technology Inc. | Compression of baseband signals in base transceiver system interfaces |
| US8428203B1 (en) | 2009-01-06 | 2013-04-23 | Pmc-Sierra, Inc. | Integrated tunable RF notch filter |
| US9083567B2 (en) | 2010-02-17 | 2015-07-14 | Qualcomm Incorporated | Automatic gain control techniques for detecting RF saturation |
| US20130045705A1 (en) | 2010-05-31 | 2013-02-21 | St-Ericsson Sa | Filtering Interference Detected at Wireless Receiver |
| US20130115904A1 (en) | 2010-07-13 | 2013-05-09 | St-Ericsson Sa | Synchronizing and Detecting Interference in Wireless Receiver |
| US8649388B2 (en) | 2010-09-02 | 2014-02-11 | Integrated Device Technology, Inc. | Transmission of multiprotocol data in a distributed antenna system |
| US9125054B2 (en) | 2012-03-23 | 2015-09-01 | Broadcom Corporation | Configurable integrated radio processor |
| US8694306B1 (en) | 2012-05-04 | 2014-04-08 | Kaonyx Labs LLC | Systems and methods for source signal separation |
| US9385780B2 (en) | 2012-10-15 | 2016-07-05 | Ikanos Communications, Inc. | Method and apparatus for detecting and analyzing noise and other events affecting a communication system |
| US20170294928A1 (en) | 2012-11-29 | 2017-10-12 | Aceaxis Limited | Processing interference due to non-linear products in a wireless network |
| US10158389B2 (en) | 2012-11-29 | 2018-12-18 | Aceaxis Limited | Processing interference due to non-linear products in a wireless network |
| US9014052B2 (en) | 2013-01-14 | 2015-04-21 | Andrew Llc | Interceptor system for characterizing digital data in telecommunication system |
| US9276605B2 (en) | 2013-01-16 | 2016-03-01 | Telefonaktiebolaget L M Ericsson (Publ) | Compression and de-compression of complex valued OFDM data for a radio base station |
| US9277424B2 (en) | 2013-02-28 | 2016-03-01 | Keysight Technologies, Inc. | Method and apparatus for determining the configuration of a cellular transmission system |
| US9288683B2 (en) | 2013-03-15 | 2016-03-15 | DGS Global Systems, Inc. | Systems, methods, and devices for electronic spectrum management |
| US20140323058A1 (en) | 2013-03-15 | 2014-10-30 | DGS Global Systems, Inc. | Systems, methods, and devices for electronic spectrum management for identifying open space |
| US9071343B2 (en) | 2013-03-15 | 2015-06-30 | Isco International, Llc | Method and apparatus for avoiding interference |
| US20160277050A1 (en) | 2013-12-10 | 2016-09-22 | Hitachi Kokusai Electric Inc. | Receiver |
| US10067171B2 (en) | 2014-04-08 | 2018-09-04 | Analog Devices Global | Active antenna system and methods of determining intermodulation distortion performance |
| US20150358928A1 (en) | 2014-06-05 | 2015-12-10 | Qualcomm Incorporated | Automatic gain control for time division duplex lte |
| US20170317717A1 (en)* | 2014-11-25 | 2017-11-02 | Telefonaktiebolaget Lm Ericsson (Publ) | Testing a cable |
| EP3035063A1 (en) | 2014-12-16 | 2016-06-22 | Alcatel Lucent | Testing system for passive inter-modulations, corresponding method and computer-readable medium |
| US20180368077A1 (en) | 2015-07-08 | 2018-12-20 | Telefonaktiebolaget Lm Ericsson (Publ) | Uplink spectrum analysis technique for passive intermodulation (pim) detection |
| US20180248576A1 (en) | 2015-10-26 | 2018-08-30 | Telefonaktiebolaget Lm Ericsson (Publ) | Cell site passive intermodulation detection receiver |
| US20180359048A1 (en) | 2015-12-01 | 2018-12-13 | Telefonaktiebolaget Lm Ericsson (Publ) | Methods and devices for addressing passive intermodulation in wireless communication |
| US9979600B2 (en) | 2015-12-15 | 2018-05-22 | Nxp Usa, Inc. | System and method for automatic load adaptive antenna carrier bandwidth dynamic reconfiguration in radio base station system |
| US20190326986A1 (en) | 2016-01-18 | 2019-10-24 | Viavi Solutions, Inc. | Method and apparatus for the detection of distortion or corruption of cellular communication signals |
| US9941959B2 (en) | 2016-01-18 | 2018-04-10 | Qoscience, Inc. | Method and apparatus for the detection of distortion or corruption of cellular communication signals |
| US10476589B2 (en) | 2016-01-18 | 2019-11-12 | Viavi Solutions Inc. | Method and apparatus for the detection of distortion or corruption of cellular communication signals |
| US20170237484A1 (en)* | 2016-01-18 | 2017-08-17 | Qoscience, Inc. | Method and apparatus for the detection of distortion or corruption of cellular communication signals |
| US20170245162A1 (en) | 2016-02-19 | 2017-08-24 | Commscope Technologies Llc | Passive intermodulation (pim) testing in distributed base transceiver station architecture |
| US10069607B2 (en) | 2016-04-06 | 2018-09-04 | Nxp Usa, Inc. | Common public radio interface, CPRI, lane controller and method of operating thereof |
| US10009784B1 (en) | 2016-06-01 | 2018-06-26 | Yupana, Inc. | Remote detection and analysis of passive intermodulation problems in radio base stations |
| US20170353929A1 (en) | 2016-06-01 | 2017-12-07 | Isco International, Llc | Method and apparatus for performing signal conditioning to mitigate interference detected in a communication system |
| US20180070254A1 (en) | 2016-09-08 | 2018-03-08 | Commscope Technologies Llc | Interference detection and identification in wireless network from rf or digitized signal |
| US20180081047A1 (en) | 2016-09-19 | 2018-03-22 | Commscope Technologies Llc | Determining distance to source of passive intermodulation product (pim) in a distributed base station |
| US20180269923A1 (en) | 2017-03-17 | 2018-09-20 | Corning Incorporated | Communication circuit enabling optimal synchronization for self-interference cancellation (sic) in a wireless communications system (wcs) |
| US20180295553A1 (en) | 2017-04-05 | 2018-10-11 | Isco International, Llc | Method and apparatus for increasing performance of communication paths for communication nodes |
| US20190222243A1 (en) | 2017-04-05 | 2019-07-18 | Isco International, Llc | Method and apparatus for increasing performance of communication paths for communication nodes |
| US20180323815A1 (en) | 2017-05-03 | 2018-11-08 | Telefonaktiebolaget Lm Ericsson (Publ) | Interference analysis in wireless networks |
| US20190052294A1 (en) | 2017-08-09 | 2019-02-14 | Isco International, Llc | Method and apparatus for detecting and analyzing passive intermodulation interference in a communication system |
| US20190058534A1 (en) | 2017-08-16 | 2019-02-21 | Keysight Technologies, Inc. | Systems and methods for detecting passive inter-modulation (pim) interference in cellular networks |
| US20190386753A1 (en)* | 2018-06-18 | 2019-12-19 | Exfo Inc. | Fronthaul remote access and monitoring systems and methods to test fiber optic infrastructure and RF spectrum |
| US10237765B1 (en) | 2018-09-07 | 2019-03-19 | Anritsu Company | Passive intermodulation (PIM) measuring instrument and method of measuring PIM |
Non-Patent Citations (13)
| Title |
|---|
| Anritsu Company, MT1000A MU100040A/MU100040B Network Master Pro Operation Manual, First Edition, Aug. 2017. |
| Anritsu Company, Spectrum Master Compact Handheld Spectrum Analyzer, Aug. 2019, United States. |
| Anritsu, Base Station Transmits: Test and Measurement, https://anritsu.typepad.com/basestationtransmits/test-and-measurement/, retrieved on Jun. 3, 2019. |
| Blackard et al., Measurements and Models of Radio Frequency Impulsive Noise for Indoor Wireless Communications, IEEE Journal on Selected Areas in Communications, vol. 11, No. 7, Sep. 1993. |
| Brian Weeden, Radio Frequency Spectrum, Interference and Satellites Fact Sheet, Secure World Foundation, Jun. 25, 2013. |
| Huang et al., Wireless Spectrum Occupancy Prediction Based on Partial Periodic Pattern Mining, IEEE Transactions on Parallel and Distributed Systems 25, No. 7 (2013): 1925-193, Nov. 8, 2013. |
| Murali et al., Design of Nano Base Stations for Future Broad Band Applications, International Journal for Modem Trends in Science and Technology, vol. 2, Special Issue 01, Oct. 2016. |
| ORF Intelligent OpticalRF, User Guide [online]. EXFO, Nov. 1, 2019 version: 3.0.0.3, [retrieved on Dec. 3, 2019] <URL: https://www.exfo.com/fr/ressources/documents-techniques/user-manuals/iorf/>. |
| Signalcraft Technologies Inc., CPRI test done brilliantly and affordably, SC2820, SIQMA, CPRI Analyzer, Jun. 6, 2018. |
| Viavi Solutions Inc., CellAdvisor JD746B/JD786B RF Analyzers, 30176018 901 0316, 2016. |
| Viavi Solutions Inc., Easy Remote Testing of Radiohead Operation with CPRI and OBSAI, 30173210 906 0317, 2017. |
| Viavi Solutions Inc., Increase RF Visibility with CPRIAdvisor, 30186095 900 0417, 2017. |
| Zhang et al., Compressed Impairment Sensing-Assisted and Interleaved-Double-FFT-Aided Modulation Improves Broadband Power Line Communications Subjected to Asynchronous Impulsive Noise, IEEE, 10.1109/Access.2015.2505676, Dec. 4, 2015. |
Cited By (3)
| Publication number | Priority date | Publication date | Assignee | Title |
|---|---|---|---|---|
| US20220294528A1 (en)* | 2020-10-01 | 2022-09-15 | Viavi Solutions Inc. | Modular cell site installation, testing, measurement, and maintenance tool |
| US11784712B2 (en)* | 2020-10-01 | 2023-10-10 | Viavi Solutions Inc. | Modular cell site installation, testing, measurement, and maintenance tool |
| US20240063900A1 (en)* | 2020-10-01 | 2024-02-22 | Viavi Solutions Inc. | Modular cell site installation, testing, measurement, and maintenance tool |
Also Published As
| Publication number | Publication date |
|---|---|
| EP3833089A1 (en) | 2021-06-09 |
| US20210176716A1 (en) | 2021-06-10 |
| EP3833089B1 (en) | 2023-05-03 |
Similar Documents
| Publication | Publication Date | Title |
|---|---|---|
| US10735109B1 (en) | Automated analysis of RF spectrum | |
| CN104853379B (en) | A kind of quality of wireless network appraisal procedure and device | |
| CN111126824A (en) | Multi-index association model training method and multi-index anomaly analysis method | |
| EP3694149B1 (en) | Network quality determining method and apparatus | |
| US11038587B2 (en) | Method and apparatus for locating fault cause, and storage medium | |
| US20200166546A1 (en) | Categorization of acquired data based on explicit and implicit means | |
| WO2019203704A1 (en) | Automated observational passive intermodulation (pim) interference detection in cellular networks | |
| CN116453437B (en) | Display screen module testing method, device, equipment and storage medium | |
| US9235463B2 (en) | Device and method for fault management of smart device | |
| US20240348525A1 (en) | Systems and methods for identifying defects in local loops | |
| US11540234B2 (en) | Automated narrow peak interference severity estimation | |
| US20170272305A1 (en) | Systems and methods for cellular network anomaly detection using spatially aggregated data | |
| KR101998972B1 (en) | Method of analyzing and visualizing the cause of process failure by deriving the defect occurrence index by variable sections | |
| US11121785B2 (en) | Detection and tracking of interferers in a RF spectrum with multi-lane processing | |
| CN112398706A (en) | Data evaluation standard determination method, device and storage medium, electronic equipment | |
| CN114745289A (en) | Method, device, storage medium and equipment for predicting network performance data | |
| CN108134703B (en) | Network cell hidden danger fault prediction analysis method and device | |
| CN117318847B (en) | Frequency shifting device testing method, system, device and medium | |
| Nugroho et al. | Performance evaluation of anomaly detection system on portable lte telecommunication networks using openairinterface and ELK | |
| US20240187970A1 (en) | Third-party enabled interference classification platform | |
| CN109963301B (en) | A method and device for analyzing network structure interference | |
| US11134496B2 (en) | Auto-detection of AxC mapping within a CPRI link | |
| CN115987376B (en) | Method and device for testing performance of radio frequency equipment in earth station | |
| Feng et al. | TelecomTS: A Multi-Modal Observability Dataset for Time Series and Language Analysis | |
| TWI597952B (en) | Broadband Internet service quality monitoring system |
Legal Events
| Date | Code | Title | Description |
|---|---|---|---|
| FEPP | Fee payment procedure | Free format text:ENTITY STATUS SET TO UNDISCOUNTED (ORIGINAL EVENT CODE: BIG.); ENTITY STATUS OF PATENT OWNER: LARGE ENTITY | |
| AS | Assignment | Owner name:EXFO INC., CANADA Free format text:ASSIGNMENT OF ASSIGNORS INTEREST;ASSIGNORS:DI PIETRO, MARCO;LEVESQUE, MARTIN;SIGNING DATES FROM 20201209 TO 20201210;REEL/FRAME:054613/0110 | |
| STPP | Information on status: patent application and granting procedure in general | Free format text:APPLICATION DISPATCHED FROM PREEXAM, NOT YET DOCKETED | |
| STPP | Information on status: patent application and granting procedure in general | Free format text:DOCKETED NEW CASE - READY FOR EXAMINATION | |
| STPP | Information on status: patent application and granting procedure in general | Free format text:NON FINAL ACTION MAILED | |
| STPP | Information on status: patent application and granting procedure in general | Free format text:RESPONSE TO NON-FINAL OFFICE ACTION ENTERED AND FORWARDED TO EXAMINER | |
| STPP | Information on status: patent application and granting procedure in general | Free format text:NOTICE OF ALLOWANCE MAILED -- APPLICATION RECEIVED IN OFFICE OF PUBLICATIONS | |
| STPP | Information on status: patent application and granting procedure in general | Free format text:NOTICE OF ALLOWANCE MAILED -- APPLICATION RECEIVED IN OFFICE OF PUBLICATIONS | |
| STPP | Information on status: patent application and granting procedure in general | Free format text:PUBLICATIONS -- ISSUE FEE PAYMENT VERIFIED | |
| STCF | Information on status: patent grant | Free format text:PATENTED CASE | |
| AS | Assignment | Owner name:NATIONAL BANK OF CANADA, CANADA Free format text:SECURITY INTEREST;ASSIGNORS:EXFO INC. (A CORPORATION RESULTING FROM THE AMALGAMATION OF 11172239 CANADA INC. AND EXFO INC.);ONTOLOGY-PARTNERS LIMITED;REEL/FRAME:072338/0500 Effective date:20210917 |