US11436911B2 - Sensor based system and method for premises safety and operational profiling based on drift analysis - Google Patents
Sensor based system and method for premises safety and operational profiling based on drift analysisDownload PDFInfo
- Publication number
- US11436911B2 US11436911B2US14/870,341US201514870341AUS11436911B2US 11436911 B2US11436911 B2US 11436911B2US 201514870341 AUS201514870341 AUS 201514870341AUS 11436911 B2US11436911 B2US 11436911B2
- Authority
- US
- United States
- Prior art keywords
- state
- premises
- time
- sensor
- sequence
- Prior art date
- Legal status (The legal status is an assumption and is not a legal conclusion. Google has not performed a legal analysis and makes no representation as to the accuracy of the status listed.)
- Active
Links
- 238000000034methodMethods0.000titleclaimsabstractdescription63
- 238000004458analytical methodMethods0.000titleabstractdescription18
- 230000007704transitionEffects0.000claimsabstractdescription109
- 239000011159matrix materialSubstances0.000claimsdescription47
- 230000009471actionEffects0.000claimsdescription43
- 238000004590computer programMethods0.000claimsdescription27
- 238000003860storageMethods0.000claimsdescription20
- 230000001960triggered effectEffects0.000claimsdescription8
- 230000004044responseEffects0.000claimsdescription7
- 238000012545processingMethods0.000description46
- 230000008569processEffects0.000description43
- 238000012502risk assessmentMethods0.000description40
- 238000012544monitoring processMethods0.000description31
- 238000010586diagramMethods0.000description26
- 238000001514detection methodMethods0.000description21
- 230000003190augmentative effectEffects0.000description17
- 238000012549trainingMethods0.000description10
- 230000006399behaviorEffects0.000description8
- 239000003623enhancerSubstances0.000description8
- 230000033001locomotionEffects0.000description8
- 238000004891communicationMethods0.000description7
- 239000000047productSubstances0.000description7
- 230000007423decreaseEffects0.000description6
- 238000010801machine learningMethods0.000description6
- 230000007717exclusionEffects0.000description5
- 230000006870functionEffects0.000description5
- 239000000126substanceSubstances0.000description5
- 230000000153supplemental effectEffects0.000description5
- 230000000875corresponding effectEffects0.000description4
- 230000000694effectsEffects0.000description4
- 235000013410fast foodNutrition0.000description4
- 230000003287optical effectEffects0.000description4
- 230000008901benefitEffects0.000description3
- 238000005516engineering processMethods0.000description3
- 230000002085persistent effectEffects0.000description3
- 230000003068static effectEffects0.000description3
- 239000013589supplementSubstances0.000description3
- 238000012360testing methodMethods0.000description3
- 230000001413cellular effectEffects0.000description2
- 230000008859changeEffects0.000description2
- 230000001276controlling effectEffects0.000description2
- 238000012937correctionMethods0.000description2
- 238000003066decision treeMethods0.000description2
- 230000003111delayed effectEffects0.000description2
- 238000011156evaluationMethods0.000description2
- 235000013305foodNutrition0.000description2
- 239000011521glassSubstances0.000description2
- 230000004048modificationEffects0.000description2
- 238000012986modificationMethods0.000description2
- 230000006855networkingEffects0.000description2
- 230000000737periodic effectEffects0.000description2
- 238000005057refrigerationMethods0.000description2
- 239000012855volatile organic compoundSubstances0.000description2
- 241001465754MetazoaSpecies0.000description1
- 241000269400SirenidaeSpecies0.000description1
- 230000002159abnormal effectEffects0.000description1
- 230000002411adverseEffects0.000description1
- 230000002776aggregationEffects0.000description1
- 238000004220aggregationMethods0.000description1
- 238000013459approachMethods0.000description1
- 239000000969carrierSubstances0.000description1
- 230000010267cellular communicationEffects0.000description1
- 238000006243chemical reactionMethods0.000description1
- 239000003795chemical substances by applicationSubstances0.000description1
- 239000003086colorantSubstances0.000description1
- 230000002596correlated effectEffects0.000description1
- 230000003247decreasing effectEffects0.000description1
- 230000001934delayEffects0.000description1
- 238000009826distributionMethods0.000description1
- 239000000284extractSubstances0.000description1
- 230000001815facial effectEffects0.000description1
- 239000007789gasSubstances0.000description1
- 239000004519greaseSubstances0.000description1
- 239000000383hazardous chemicalSubstances0.000description1
- 238000009434installationMethods0.000description1
- 238000002372labellingMethods0.000description1
- 239000000463materialSubstances0.000description1
- 238000013178mathematical modelMethods0.000description1
- 230000007246mechanismEffects0.000description1
- 230000001151other effectEffects0.000description1
- 238000013021overheatingMethods0.000description1
- 230000003334potential effectEffects0.000description1
- 238000002360preparation methodMethods0.000description1
- 230000009467reductionEffects0.000description1
- 210000001525retinaAnatomy0.000description1
- 239000004065semiconductorSubstances0.000description1
- 230000011664signalingEffects0.000description1
- 239000000779smokeSubstances0.000description1
- 239000000344soapSubstances0.000description1
- 238000005309stochastic processMethods0.000description1
- 239000002341toxic gasSubstances0.000description1
- 238000012546transferMethods0.000description1
Images


Classifications
- G—PHYSICS
- G08—SIGNALLING
- G08B—SIGNALLING OR CALLING SYSTEMS; ORDER TELEGRAPHS; ALARM SYSTEMS
- G08B23/00—Alarms responsive to unspecified undesired or abnormal conditions
- G—PHYSICS
- G08—SIGNALLING
- G08B—SIGNALLING OR CALLING SYSTEMS; ORDER TELEGRAPHS; ALARM SYSTEMS
- G08B31/00—Predictive alarm systems characterised by extrapolation or other computation using updated historic data
Definitions
- This descriptionrelates to operation of sensor networks such as those used for security, intrusion and alarm systems installed on industrial or commercial or residential premises.
- Such data recordscontain valuable information that is typically used for a very limited number of purposes. Described herein is a system that mines accumulated data and geographically related data to produce predictions with respect to a risk level that either equipment or a user's actions relative to the equipment pose to the premises and/or the equipment.
- a computer program product tangibly stored on a computer readable hardware storage device for detecting conditions at a physical premisesincludes instructions to cause a processor to collect sensor information from plural sensors deployed in a premises that are configured with an identity of the premises and physical objects being monitored by the sensors in the identified premises, execute one or more unsupervised learning models to continually analyze the collected sensor information to produce operational states of sensor information, produce sequences of state transitions, detect during the continual analysis of sensor data that one or more of the sequences of state transitions is a drift sequence, correlate determined drift state sequence to a stored determined condition at the premises, generate an alert based on the determined condition, and send the generated alert to a user device.
- aspectsalso include systems and methods.
- Additional features of the computer program product, systems and methodsmay include to these and other features. Aspects include convert states corresponding to sensor values into a semantic representation of the state and assign a label to the semantic representation of the state.
- the sensor datais collected continuously.
- the instructionsdetermine state transition metrics that are stored in a state transition matrix.
- the instructionsdetermine state transition sequences, store the determined state transition sequences in a state transition matrix, and populate a state time trigger and a state event trigger data structures according to the determined state transition sequences.
- the aspectscan include one or more of the following advantages.
- the aspectsdetermine an abstraction of a collection sensor signals as states that are converted into state sequences.
- the statesare a concise representation of the underlying behavior information of the premises being monitored, described by time and event data. Over time as the sensors produce different sensor values different states are determined and stored in a state transition matrix. Transitions are tracked by state transition matrix along with indicators of a trigger for the transition e.g., “time trigger” or “event trigger.” The state transitions are tagged as “safe”, i.e., normal or “unsafe”, e.g., drift state transitions.
- Empirical characteristics of these transitioncan be a model based and/or human based and are determined for the various states of the premises in terms of, e.g., safety of the occupants and operational conditions of the various systems within the premises. For such states predictions can be formed to predict if the premises will be in either a safe state or a drift state over a time period. This prediction has many uses for allowing timely correction of potential problem conditions by giving advance notice. These aspects determine the overall state of the premises and the systems by classifying the premises and these systems into a normal or “safe” state and the drift or unsafe state.
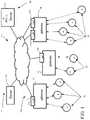
- FIG. 1is a schematic diagram of an exemplary networked security system.
- FIG. 2is a block diagram of a sensor.
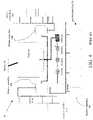
- FIG. 3is a schematic diagram of an example security system at premises.
- FIG. 4is a block diagram showing an example of an access control system.
- FIG. 4Ais a diagram depicting a conventional arrangement for access control.
- FIG. 5is a block diagram of a sensor based state prediction system.
- FIG. 5Ais a diagram of a logical view of the sensor based state prediction system of FIG. 5 .
- FIG. 6is a flow diagram of a state representation engine.
- FIG. 7is a flow diagram of sensor based state prediction system processing.
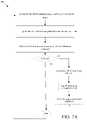
- FIG. 7Ais a flow diagram of training process for a Next state predictor engine that is part of the sensor based state prediction system.
- FIG. 7Bis a flow diagram of a Next state predictor engine model building process.
- FIG. 8is a flow diagram of operation processing by the sensor based state prediction system.
- FIG. 9is a diagram depicting an exemplary interface.
- FIG. 10is a flow diagram of an example of sensor based risk profiling.
- FIG. 11is a block diagram of an system architecture.
- FIG. 11Ais a flow diagram of an example of sensor based risk assessment.
- FIG. 12is a flow diagram of an example of service record processing.
- FIGS. 13A-13Bis a flow diagram of an example of sensor based proximity risk allocation.
- FIG. 14is a flow diagram of an example of sensor based augmented claim filing.
- FIG. 14Ais a block diagram of an exemplary format of supplemental data to augment a claim form.
- FIG. 15is a flow diagram of an example of sensor based augmented underwriting
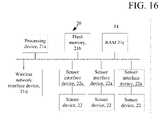
- FIG. 16is a block diagram of a sensor pack.
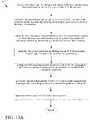
- FIG. 18is a flow diagram of an example of using drift analysis for sensor based predictions of equipment failure.
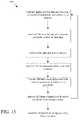
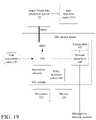
- FIG. 19is a flow diagram of an example of sensor based process for determining risk profile, adjusting insurance premiums and collecting premiums.
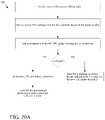
- FIGS. 20A and 20Bare flow diagrams of examples of processing for FIG. 19 .
- detectors/sensors 28include motion detectors, glass break detectors, noxious gas sensors, smoke/fire detectors, contact/proximity switches, video sensors, such as camera, audio sensors such as microphones, directional microphones, temperature sensors such as infrared sensors, vibration sensors, air movement/pressure sensors, chemical/electro-chemical sensors, e.g., VOC (volatile organic compound) detectors.
- those systems sensorsmay include weight sensors, LIDAR (technology that measures distance by illuminating a target with a laser and analyzing the reflected light), GPS (global positioning system) receivers, optical, biometric sensors, e.g., retina scan sensors, EGG/Heartbeat sensors in wearable computing garments, network hotspots and other network devices, and others.
- LIDARtechnology that measures distance by illuminating a target with a laser and analyzing the reflected light
- GPSglobal positioning system
- biometric sensorse.g., retina scan sensors, EGG/Heartbeat sensors in wearable computing garments, network hotspots and other network devices, and others.
- the surveillance/intrusion/fire/access systemsemploy wireless sensor networks and wireless devices, with remote, cloud-based server monitoring and report generation.
- the wireless sensor networkswireless links between sensors and servers, with the wireless links usually used for the lowest level connections (e.g., sensor node device to hub/gateway).
- the edge (wirelessly-connected) tier of the networkis comprised sensor devices that provide specific sensor functions. These sensor devices have a processor and memory, and may be battery operated and include a wireless network card.
- the edge devicesgenerally form a single wireless network in which each end-node communicates directly with its parent node in a hub-and-spoke-style architecture.
- the parent nodemay be, e.g., a network access point (not to be confused with an access control device or system) on a gateway or a sub-coordinator which is, in turn is connected to the access point or another sub-coordinator.
- an upper tier or hierarchical level 12 a of the networkare disposed servers and/or virtual servers 14 running a “cloud computing” paradigm that are networked together using well-established networking technology such as Internet protocols or which can be private networks that use none or part of the Internet.
- Applications that run on those servers 14communicate using various protocols such as for Web Internet networks XML/SOAP, RESTful web service, and other application layer technologies such as HTTP and ATOM.
- the distributed network 10has direct links between devices (nodes) as shown and discussed below.
- hierarchical level 12 aincludes a central monitoring station 49 comprised of one or more of the server computers 14 and which includes or receives information from a sensor based state prediction system 50 as will be described below.
- the distributed network 10includes a second logically divided tier or hierarchical level 12 b , referred to here as a middle tier that involves gateways 16 located at central, convenient places inside individual buildings and structures. These gateways 16 communicate with servers 14 in the upper tier whether the servers are stand-alone dedicated servers and/or cloud based servers running cloud applications using web programming techniques.
- the middle tier gateways 16are also shown with both local area network 17 a (e.g., Ethernet or 802.11) and cellular network interfaces 17 b.
- the distributed network topologyalso includes a lower tier (edge layer) 12 c set of devices that involve fully-functional sensor nodes 18 (e.g., sensor nodes that include wireless devices, e.g., transceivers or at least transmitters, which in FIG. 1 are marked in with an “F”), as well as wireless sensor nodes or sensor end-nodes 20 (marked in the FIG. 1 with “C”).
- fully-functional sensor nodes 18e.g., sensor nodes that include wireless devices, e.g., transceivers or at least transmitters, which in FIG. 1 are marked in with an “F”
- wireless sensor nodes or sensor end-nodes 20marked in the FIG. 1 with “C”.
- wired sensorscan be included in aspects of the distributed network 10 .
- the edge (wirelessly-connected) tier of the networkis largely comprised of devices with specific functions. These devices have a small-to-moderate amount of processing power and memory, and often are battery powered, thus requiring that they conserve energy by spending much of their time in sleep mode.
- a typical modelis one where the edge devices generally form a single wireless network in which each end-node communicates directly with its parent node in a hub-and-spoke-style architecture.
- the parent nodemay be, e.g., an access point on a gateway or a sub-coordinator which is, in turn, connected to the access point or another sub-coordinator.
- Each gatewayis equipped with an access point (fully functional sensor node or “F” sensor node) that is physically attached to that access point and that provides a wireless connection point to other nodes in the wireless network.
- the links(illustrated by lines not numbered) shown in FIG. 1 represent direct (single-hop MAC layer) connections between devices.
- a formal networking layer(that functions in each of the three tiers shown in FIG. 1 ) uses a series of these direct links together with routing devices to send messages (fragmented or non-fragmented) from one device to another over the network.
- the sensors 20are sensor packs (discussed below), which are configured for a particular types of business applications, whereas in other implementations the sensors are found in installed systems such as the example security systems discussed below.
- a pre-set suite of fixed/mobile sensor packs(discussed below) are used. These pre-set suite(s) of fixed/mobile sensor packs are especially selected for particular applications according to processing that is discussed below. In any event, either individual sensors conventionally deployed throughout a premises or one or more pre-set suite of fixed/mobile sensor packs are used.
- the intrusion detection system 32includes an intrusion detection panel 38 and sensors/detectors 20 ( FIGS. 1, 2 ) disbursed throughout the premises 36 .
- the intrusion detection system 32is in communication with a central monitoring station 49 (also referred to as central monitoring center) via one or more data or communication networks 52 (only one shown), such as the Internet; the phone system or cellular communication system being examples of others.
- the intrusion detection panel 38receives signals from plural detectors/sensors 20 that send to the intrusion detection panel 38 information about the status of the monitored premises.
- Sensor/detectorsmay be hard wired or communicate with the intrusion detection panel 38 wirelessly. Some or all of sensor/detectors 20 communicate wireless with the intrusion detection panel 38 and with the gateways. In general, detectors sense glass breakage, motion, gas leaks, fire, and/or breach of an entry point, and send the sensed information to the intrusion detection panel 38 . Based on the information received from the detectors 20 , the intrusion detection panel 38 determines whether to trigger alarms, e.g., by triggering one or more sirens (not shown) at the premises 36 and/or sending alarm messages to the monitoring station 49 . A user may access the intrusion detection panel 38 to control the intrusion detection system, e.g., disarm, arm, enter predetermined settings, etc.
- a dispatch center 29that in this example is part of the central monitoring station 49 .
- the dispatch center 29includes personnel stations (not shown), server(s) systems 14 running a program that populates a database (not shown) with historical data.
- the central monitoring station 49also includes the sensor based state prediction system 50 .
- An exemplary intrusion detection panel 38includes a processor and memory, storage, a key pad and a network interface card (NIC) coupled via a bus (all not shown).
- NICnetwork interface card
- Access control systemscan be installed in residences but are more commonly installed in businesses.
- a room(partially shown) has a doorway and has associated therein an access controller 16 and one or two card readers 14 , (e.g. an ingress card reader and an egress card reader) with door locks (not shown) controlled by the access controller.
- the access control system 14can include a plurality of access controllers and associated card readers, as shown in FIG. 4 .
- the access control system 34During installation of the access control system 34 , the access controllers 34 a are configured by a technician according to operational requirements of the facility.
- the access control system 34also can include master access controllers 34 b and includes a gateway that is coupled to the access controllers 34 a via one or more master controllers 34 b , as shown.
- the access control system 34also includes infrastructure such as a LAN, router, modem, the Internet and cellular or serial communications and a firewall, as illustrated, and a server 14 ( FIG. 1 ) that is coupled to the gateway 35 a . This infrastructure can be part of the wireless sensor network structure discussed in FIG. 1 .
- the prediction system 50executes on one or more of the cloud-based server computers and accesses database(s) 51 that sensor data and store state data in a state transition matrix.
- database(s) 51that sensor data and store state data in a state transition matrix.
- dedicated server computerscould be used as an alternative.
- the sensor based state prediction system 50includes a State Representation Engine 52 .
- the State Representation Engine 52executes on one or more of the servers described above and interfaces on the servers receive sensor signals from a large plurality of sensors deployed in various premises throughout an area. These sensor signals have sensor values and together with other monitoring data represent a data instance for a particular area of a particular premises in a single point in time. The data represent granular information collected continuously from the particular premises. The State Representation Engine takes these granular values and converts the values into a semantic representation.
- a set of sensor values and monitoring data for particular time durationare assigned a label, e.g., “State- 1 .”
- this Engine 52works in an unsupervised manner, as discussed below, to determine various states that may exist in the premises.
- this Engine 52determines state transition metrics that are stored in the form a state transition matrix.
- a simple state transition matrixhas all the states in its rows and columns, with cell entries being many times did the premises move from a state in cell i to a state in cell j are over a period of time and/or events. This matrix captures the operating behavior of the system. State transitions can happen either over time or due to events. Hence, the state transition metrics are captured using both time and events.
- a stateis a representation of a group of sensors grouped according to a clustering algorithm.
- the State transition matrixis a data structure that stores how many times the environment changed from State_i to State_j.
- the State transition matrixthus stores “knowledge” that the sensor based state prediction system 50 captures and which is used to determine predictions of the behavior of the premises.
- the State transition matrixis accessed by the Next prediction engine to make decisions and trigger actions by the sensor based state prediction system 50 .
- Unsupervised learninge.g., clustering is used to group sensor readings into states and conditions over a period of time that form a time trigger state and over events to form an event trigger state. Used to populate the state transition matrix per premises.
- State transitionsexpressed as a listing by instance with pointer to the state time and event trigger tables.
- the State time triggeris depicted below.
- the State time triggertracks the time periods t 1 . . . t 8 for each state transition corresponding to the number x in each particular cell.
- State event triggertracks the events E 1 . . . E 2 for each state transition corresponding to the number y in each particular cell (if any).
- the State Representation Engine 52in addition to populating the State transition matrix, also populates a State time trigger that is a data structure to store, the time value spent in each state and a distribution of the time duration for each state. Similar to the State transition matrix, the State time trigger also encapsulates the behavior knowledge of the environment. State transitions can be triggered using these values.
- the State Representation Engine 52also populates a State event trigger.
- the State event triggeris a data structure to store, event information.
- An example of an eventcan be sensor on a door sensing that a door was opened. There are many other types of events. This data structure captures how many times such captured events caused a state transition.
- the State Representation Engine 52populates the State Transition matrix and the State Time and State triggers, which together capture metrics, which provide a Knowledge Layer of the operational characteristics of the premises.
- the sensor based state prediction system 50also includes a Next State Prediction Engine 54 .
- the Next State Prediction Engine 54predicts an immediate Next state of the premises based the state transition matrix.
- the Next State Prediction Engine 54predicts if the premises will be in either a safe state or a drift state over a time period in the future.
- the term “future” as used hereinrefers to a defined window of time in the future, which is defined so that a response team has sufficient time to address a condition that is predicted by the Next State Prediction Engine 54 that may occur in the premises to restore the state of the premises to a normal state.
- the Next State Prediction Engineoperates as a Decision Layer in the sensor.
- the sensor based state prediction system 50also includes a State Representation graphical user interface generator 56 .
- State Representation graphical user interface generator 56provides a graphical user interface that is used by the response team to continuously monitor the state of the premises.
- the State Representation graphical user interface generator 56receives data from the Next State Prediction Engine 54 to graphically display whether the premises is either in the safe state or the drifting state.
- the State Representation graphical user interface generator 56operates as an Action Layer, where an action is performed based on input from Knowledge and Decision Layers.
- the sensor based state prediction system 50applies unsupervised algorithm learning models to analyze historical and current sensor data records from one or more customer premises and generates a model that can predict Next patterns, anomalies, conditions and events over a time frame that can be expected for a customer site.
- the sensor based state prediction system 50produces a list of one or more predictions that may result in on or more alerts being sent to one more user devices as well as other computing system, as will be described.
- the prediction system 50uses various types of unsupervised machine learning models including Linear/Non-Linear Models, Ensemble methods etc.
- FIG. 5Aa logical view 50 ′ of the sensor based state prediction system 50 is shown.
- the middle layeris an abstraction layer that abstracts these raw events as state (represented in FIG. 5A by the blocks “States” (State Representation Engine 52 ), STM (State Transition Matrix), STT (State Time Trigger) and SET (State Event Trigger) that produce a state as a concise semantic representation of the underlying behavior information of the environment described by time and various sensor values at that point in time.
- StatesState Representation Engine 52
- STMState Transition Matrix
- STTState Time Trigger
- SETState Event Trigger
- the State Representation Engine 55collects 62 (e.g., from the databases 51 or directly from interfaces on the servers) received sensor signals from a large plurality of sensors deployed in various premises throughout an area that is being monitored by the sensor based state prediction system 50 .
- the sensor data collected from the premisesincludes collected sensor values and monitoring data values.
- the State Representation Engine 52converts 64 this sensor data into semantic representations of the state of the premises at instances in time.
- the State Representation Engine 52uses 66 the converted sensor semantic representation of the sensor data collected from the premises to determine the empirical characteristics of the premises.
- the State Representation Engine 52assigns 67 an identifier to the state.
- the kitchen in a restaurant example for a premises identified in the system as “Site no.: 448192”uses the sensor values to produce a first state that is identified here as “State 1 .” Any labelling can be used and is typically consecutive identified and this state is semantically described as follows:
- the semantic descriptionincludes the identifier “State 1 ” as well as semantic descriptions of the various sensors, their values and dates and times.
- the State Representation Engine 52determines an abstraction of a collection of “events” i.e., the sensor signals as state.
- the statethus is a concise representation of the underlying behavior information of the premises being monitored, described by time and data and various sensor values at that point in time and at that date.
- the semantic representation of the stateis stored 68 by the State Representation Engine 52 as state transition metrics in the State Representation matrix. Over time and days, as the sensors produce different sensor values, the State Representation Engine 55 determines different states and converts these states into semantic representations that are stored the state transition metrics in the matrix, e.g., as in a continuous loop 70 .
- the kitchen exampleis further set out below:
- the State Representation Engine 52collects the following data (fictitious data) from these three sensors at a particular points in time,
- the state representation engine 52converts these raw values into state definitions and assigns (labels) each with a unique identifier for each state, as discussed above. As the premises is operated over a period of time, the Next transition matrix, the state time trigger matrix and the state event trigger matrix are filled.
- the state representation engine 52produces the following two states (State 1 is repeated here for clarity in explanation).
- the state representation engine 52adds to the state transition matrix an entry that corresponds to this transition, that the premises moved from state 1 to state 2 .
- the state representation engine 52also adds to the state transition matrix in that entry, an indicator that the transition was “time trigger,” causing the movement, and thus the state representation engine 52 adds an entry in state time trigger matrix.
- the state representation engine 52thus co-ordinates various activities inside the premises under monitoring and captures/determines various operating characteristics of the premises.
- This processing 80includes training processing 80 a ( FIG. 7A ) and model building processing 80 b ( FIG. 7B ), which are used in operation of the sensor based state prediction system 50 .
- training processing 80 ′trains the Next State Prediction Engine 54 .
- the Next State Prediction Engine 54accesses 82 the state transition matrix and retrieves a set of states from the state transition matrix. From the retrieved set of states the Next State Prediction Engine 54 generates 84 a list of most probable state transitions for a given time period, the time period can be measured in minutes, hours, days, weeks, months, etc. For example, consider the time period as a day. After a certain time period of active usage, the sensor based state prediction system 50 , through the state representation engine 52 , has acquired knowledge states s 1 to s 5 .
- Markov propertyis used in probability and statistics and refers to the “memoryless” property of a stochastic process.
- the Next State Prediction Engine 54determines 86 if a current sequence is different than an observed sequence in the list above. When there is a difference, the Next State Prediction Engine 54 determines 88 whether something unusual has happened in the premises being monitored or whether the state sequence is a normal condition of the premises being monitored.
- Next State Prediction Engine 54 90these state transitions as “safe” or “drift state” transitions. Either the Next State Prediction Engine 54 or manual intervention is used to label either at the state transition level or the underlying sensor value levels (fictitious) for those state transitions producing the follow:
- ThermostatStove Thermostat (label) 0 71.1755732 78.95655605 G 0 68.27180645 79.97821825 G 0 71.80483918 79.428149 G 0 70.46354628 81.90901291 G 0 69.83508114 81.12026772 G 0 71.46074066 81.613552 G 1 70.14174204 80.12242015 G 1 70.98180652 78.03049081 G 0 68.58285177 79.981358 G 0 69.91571802 79.4885171 G 1 69.89799953 79.3838372 G 0 70.42668373 80.20397118 G 1 70.23391637 81.80212485 Y 0 68.19244768 81.19203004 G
- Gis used to indicate green, e.g., a normal operating state, e.g., “a safe state” and “Y” is used to indicate yellow, e.g., an abnormal or drift state, e.g., an “unsafe state” and “R” (not shown above) would be used to represent red or a known unsafe state.
- This data and statescan be stored in the database 51 and serves as training data for a machine learning model that is part of the Next State Recommendation Engine 54 .
- the model building processing 80 buses the above training data to build a model that classify a system's state into either a safe state or an unsafe state.
- Other statescan be classified.
- three statescan be defined, as above, “G Y R states” or green (safe state) yellow (drifting state) and red (unsafe state).
- G Y R statesgreen (safe state) yellow (drifting state)
- redunsafe state
- the model building processing 80 baccesses 102 the training data and applies 104 one or more machine learning algorithms to the training data to produce the model that will execute in the Next State Recommendation Engine 54 during monitoring of systems.
- Machine learning algorithmssuch as Linear models and Non-Linear Models, Decision tree learning, etc., which are supplemented with Ensemble methods (where two or more models votes are tabulated to form a prediction) and so forth can be used. From this training data and the algorithms, the model is constructed 106 .
- fictitious Decision Treeusing the above fictitious data (again where “G” is used to indicate green, “a safe state” e.g., a normal operating state, and “Y” is used to indicate yellow, e.g., drifting state, and “R” (shown below) to represent red or a known unsafe state.
- This data and statescan be stored in the database 51 and serves as training data for a machine learning model that is part of the Next State Recommendation Engine 54 .
- Empirical characteristicscan be a model based and human based are determined 106 for various states of the premises in terms of, e.g., safety of the occupants and operational conditions of the various systems within the premises.
- Examples of such systemsinclude intrusion detection systems, fire alarm systems, public annunciation systems, burglar alarm systems, the sensors deployed at the premises, as well as other types of equipment, such as refrigeration equipment, stoves, and ovens that may be employed in the kitchen example that will be discussed below.
- Other instances of particular premiseswill have other types of systems that are monitored.
- the sensor based state prediction system 50will determine the overall state of the premises as well as individual states of the various systems within the premises being monitored, as will be discussed below.
- the sensor based prediction system 50receives 102 (by the State Representation Engine 52 ) sensor signals from a large plurality of sensors deployed in various premises throughout an area being monitored.
- the State Representation Engine 52converts 104 the sensor values from these sensor signals into a semantic representation that is identified, as discussed above.
- this Engine 52works in an unsupervised manner to determine various states that may exist in sensor data being received from the premises.
- the State Representation Engine 52also determines 106 state transition metrics that are stored in the state transition matrix using both time and events populating the State time trigger and the State event trigger, as discussed above.
- the State transition matrixis accessed by the Next prediction engine 54 to make decisions and trigger actions by the sensor based state prediction system 50 .
- the Next State Prediction Engine 54receives the various states (either from the database and/or from the State Representation Engine 52 and forms 108 predictions of an immediate Next state of the premises/systems based the state data stored in the state transition matrix. For such states the Next State Prediction Engine 54 predicts if the premises will be in either a safe state or a drift state over a time period in the Next as discussed above.
- the sensor based state prediction system 50also sends 110 the predictions to the State Representation engine 56 that generates a graphical user interface to provide a graphical user interface representation of predictions and states of various premises/systems.
- the stateis tagged 112 and stored 114 in the state transition matrix.
- the sensor based state prediction system 50using the State Representation Engine 52 that operates in a continuous loop to generate new states and the Next State Prediction Engine 54 that produces predictions together continually monitor the premises/systems looking for transition instances that result in drift in states that indicate potential problem conditions. As the sensors in the premises being monitored operate over a period of time, the state transition matrix, the state time trigger matrix and the state event trigger matrix are filled by the state representation engine 52 and the Next State Prediction Engine 54 processing 80 improves on predictions.
- the sensor based state prediction system 50determines the overall state of the premises and the systems by classifying the premises and these systems into a normal or “safe” state and the drift or unsafe state. Over a period of time, the sensor based state prediction system 50 collects information about the premises and the sensor based state prediction system 50 uses this information to construct a mathematical model that includes a state representation, state transitions and state triggers.
- the state triggerscan be time based triggers and event based triggers, as shown in the data structures above.
- the State Representation graphical user interface generator 56receives data from the Next State Prediction Engine 54 and generates a graphical user interface that is rendered on a display device of a client system.
- Several different graphical user interfacescan be generated.
- One such interfaceis depicted in FIG. 9 and shows premises conditions at a fictitious e.g., restaurant chain of fictitious restaurant locations (in Manhattan) with indicators (stars and squares) to indicated the predicted state of the premises as either in the safe state or the drifting state, respectively.
- Various shapes, colors and other effectscan be used.
- the State Representation graphical user interface generator 56operates as the Action Layer, where an action is performed based on input from Knowledge and Decision Layers.
- the sensor-based state prediction system 50receives 122 sensor data from sensors monitoring each physical object or physical quantity from the sensors ( FIG. 2 ) deployed in a premises.
- the sensor-based state prediction system 50is configured 124 with an identity of the premises and the physical objects being monitored by the sensors in the identified premises.
- the sensor based state machine 50processes 126 the received sensor data to produce states as set out above using the unsupervised learning models. Using these models the sensor-based state prediction system 50 monitors various physical elements to detect drift states.
- one of the sensorscan be a vibration sensor that sends the sensor-based state prediction system 50 a signal indicating a level of detected vibration from the vibration sensor. This signal indicates both magnitude and frequency of vibration.
- the sensor-based state prediction system 50determines over time normal operational levels for that sensor based on what system that sensor is monitoring and together with other sensors produces 128 series of states for the object and/or premises. These states are associated 130 with either a state status of “safe” or “unsafe” (also referred to herein as “normal” or “drift,” respectively). Part of this process of associating is provided by the learning process and this associating can be empirically determined based on human input.
- This processingthus develops more than a mere envelope or range of normal vibration amplitude and vibration frequency indications for normal operation for that particular vibration sensor, but rather produces a complex indication of a premises or object state status by combining these indications for that sensor with other indications from other sensors to produce the state transition sequences mentioned above.
- Statesare produced from the unsupervised learning algorithms (discussed above in FIGS. 7-7B ) based on that vibration sensor and states from other sensors, which are monitoring that object/premises.
- the unsupervised learning algorithmscontinually analyze that collected vibration data and producing state sequences and analyze state sequences that include that sensor. Overtime, as the analysis determines 134 that states including that sensor have entered into a drift state that corresponds to an unsafe condition, the sensor-based state prediction system 50 determines 136 a suitable action alert (in the Action layer) to indicate to a user that there may be something wrong with the physical object being monitored by that sensor.
- the analysis provided by the prediction systemsends the alert to indicate that there is something going wrong with object being monitored.
- the sensor-based state prediction system 50produces suggested actions 138 that the premises' owner should be taking with respect to the object being monitored.
- FIG. 11an architecture 139 that combines the sensor-based state prediction system 50 ( FIG. 5 ) in a cooperative relationship with business application servers 139 a in the cloud is shown.
- the sensor-based state prediction system 50receives sensor data from the sensor network 11 (or storage 51 ) for a particular premises, processes that data to produce states and state sequences, and uses this information in conjunction with business application servers to process risk-based adjustments in insurance policy premiums, underwriting of insurance policies, and augmented claims submission for insured events under an insurance policy.
- the sensor-based state prediction system 50includes a geographic proximity risk allocation module 180 (see processing 180 ′ FIGS. 13A, 13B ), an augmented claim filing module 220 (see processing 220 ′ FIG. 14 ) and an augmented underwriting module 250 (see processing 250 ′ FIG. 15 ).
- processing 140 in the sensor-based state prediction system 50includes providing a pre-set suite of sensor packs (discussed below) that are selected especially to collect data relevant to the type of business and relevant to the type of insurance being provided. (See discussion below regarding pre-set sensor packs).
- the sensor-based state prediction system 50receives 140 the sensor information and constructs states based on analyzes of the sensor data and provides the alert that is sent to the customer. That alert and selected information either the state and/or sensor data are sent 144 to a “continuous risk assessment and allocation” module that assesses insurance risk on a dynamic basis, as discussed below.
- the risk assessmentcan either be a risk assessment that is point in time based (e.g., the single episode discussed above) or the risk assessment can be continually based on the actions taken by the customer and the sensor data received.
- An example of risk assessment that is point in time basedis for instance risk assessment that is based on changes in the types of material that are housed in a premises or changing of types of machinery being operated or disabled in the premises or the types of activities that the premises are being used for. All of these changes can be monitored 148 by the sensor-based state prediction system 50 from data received from one or more sensor packs.
- the customized sensor packs that are deployed at customer premisesgather sensor data that are relevant to the type of insurance provided to the premises and the type of premises being insured.
- the sensor-based state prediction system 50in addition to providing monitoring of conditions at customer premises and generating alerts as needed, provides an architecture that can be used to change insurance rates on on-going basis.
- processing by the sensor-based state prediction system 50can also include processing 160 of service records of equipment/systems.
- Technicianscommonly service systems/equipment and as a result generate service records (historical records).
- These service recordsare stored 162 in e.g., the database 51 or some other database accessible by the sensor-based state prediction system 50 .
- the sensor-based state prediction system 50retrieves 164 historical service records from the database 51 according to the application.
- historical service recordsare available in multiple tables in a normalized form.
- Historical service records dataare preprocessed 166 from certain tables and certain columns to capture particulars data relevant to the systems and needed by the unsupervised learning algorithms.
- the following dataare captured from service records.
- the sensor-based state prediction system 50generates reports 168 that can supplement certain uses of the sensor-based state prediction system 50 , as discussed below.
- the sensor-based state prediction system 50also processes 170 data from the service records using the unsupervised learning algorithms, as discussed below.
- the sensor-based state prediction system 50includes a geographic proximity risk allocation module 180 .
- Processing 180 ahas the geographic proximity risk allocation module 180 receive 182 sensor data for each physical object or physical quantity being monitored based on one or more sets of data from the sensors ( FIG. 2 ) or sensor packs ( FIG. 16 ) that are deployed in many premises for many businesses.
- the sensor-based state prediction system 50is configured 184 with identities of the premises and the physical objects being monitored by each sensor in each of the identified premises.
- the sensor-based state prediction system 50is also configured 186 with numerous recipient systems to which alerts are sent and insurance carrier systems for continuous insurance monitoring, underwriting, and rating of some of the businesses.
- the sensor-based state prediction system 50is also configured 188 with geographic location data for each of the premises being monitored and is further configured 190 with geographic information of nearby businesses that are not being monitored by the prediction system 50 .
- the geographic proximity risk allocation modulereceives 192 results of the unsupervised learning models executing on the sensor-based state prediction system 50 . More particularly the sensor-based state prediction system 50 that monitors for drift states in various physical elements for at least some of the plurality of premises determines 194 existence of such drift states over time. As the analysis determines that signals from one or more sensors have entered a drift state sequence, the sensor-based state prediction system 50 determines 196 a suitable action alert (based on that drift state sequence) to indicate to a user that there may be something wrong with the physical object being monitored.
- the sensor-based state prediction system 50generates from the alerts and state data profiles for each current premises.
- the sensor-based state prediction system 50produces for a given premises listings of state sequences that can be safe sequences and unsafe, i.e., drift sequences that can be predicted events, and which result in alerts being sent with suggested actions that the premises' owner should take.
- the sensor-based state prediction system 50also tracks resolutions of those anomalies.
- the sensor-based state prediction system 50thus produces profiles based on the state sequences for each premises being monitored.
- the geographic proximity risk allocation module 180analyses 200 these profiles for geographic proximity among a group of business. That is, the sensor-based state prediction system 50 determines 202 for a current premises, other premises that are geographically proximate to the current premises. The geographic proximity risk allocation module 180 determines 204 potential effects on the current premises of determined profiles/drift state sequences of the other geographic proximate premises. That is, for a determined profiles/drift state sequences, the geographic proximity risk allocation module 180 (or the sensor-based state prediction system 50 proper) determines whether the determined profiles and/or drift state sequences of one or more of the other geographic proximate premises have any relevance to a risk assessment for the current premises.
- this determinationis based on examining the state sequence to determine whether the drift state detected is of a type that can have external effects on the current premises or whether the effects that result from the detected drift state would be confined to the one or more geographically proximate premises from which the detected drift state was produced.
- a second principal determinationis based on examining the state sequence to determine whether the drift state detected from the one or more geographically proximate premises, is of a type that is relevant to the type or lines of insurance carried by the current premises. Other determinations can be used. In any event, if so confined, the geographic proximity risk allocation module 180 can skip this drift state.
- the sensor-based state prediction system 50sends 206 messages to insurance carrier systems to cause rating systems to adjust rates upwards or downwards for the current one (or more) of such premises (insured by such insurance carriers) according to the state sequences generated by the geographic proximity risk allocation module based on state sequences for others of geographically proximate determined premises. That is, by using risk allocation data of customers in geographical proximity to each other, this data in the form of state sequences is used by automated risk assessment system to modify the risk assessments of the current premises and hence insurance rates for the current business.
- geographic proximityis meant as a premises being within a defined physical proximity to another premises and sharing a physical structure.
- Physical proximitycan be bounded in various ways such as with a physical distance, e.g., in a range of 0 feet up to, e.g., 500 feet, but typically can be set in an insurance contract over a longer or shorter range.
- an insured, monitored premisescan be in a strip mall.
- This businesscan be, e.g., a retail clothing store.
- In the strip mall in this exampleis also a restaurant that has its kitchen being monitored as per above.
- the sensor-based state prediction system 50determines by analyzing the profiles for geographic proximate group of business that this restaurant is not taking proper precautions regarding a monitored piece of equipment.
- This equipmentcould be any piece of equipment, for example, an exhaust hood over a grill, which is full of grease or a refrigerator compressor motor that is overheating (because the door does not close properly), etc.
- the sensor-based state prediction system 50determines that the kitchen or the hood has entered a drift state based on sensor readings from one or more sensors, (e.g., data from either one or both of sensors that sensor hood temperature or compressor temperature or vibration). Thus, the sensor-based state prediction system 50 has determined that the current conditions now increase the likelihood of a fire originating in the kitchen of that restaurant, thus increasing the likelihood of a fire for all the businesses in that strip mall, including the clothing store. In that case, the sensor-based state prediction system 50 determines that rates should rise for all businesses in that strip mall. When there is a resolution of the anomaly, either as verified or determined manually, or by removal of the drift in the sensors, rates would be readjusted down.
- This profile datacan also be used to build a community that finds similarities between similar establishments. Again using restaurants as an example, the profile data can be used to access how all restaurants for a chain of restaurants rank relative to each other restaurants in the restaurant chain.
- the augmented claim filing module 220executes processing 220 ′ as shown.
- the sensor-based state prediction system 50can be used in conjunction with an insurance claim module to populate and submit an insurance claim or at least supporting documentation upon an occurrence of an insured event.
- the insurance claim module in the sensor-based state prediction system 50receives sensor data 222 for each physical object or physical quantity being monitored based on one or more sets of data from sensors ( FIG. 2 ) or sensor packs ( FIG. 16 ).
- the insurance claim module 226prepares an electronic report that can be used to supplement or provide the insurance claim.
- the insurance claim modulereceives 228 a triggering message that triggers the insurance claim module to prepare an insurance claim(s) on for a business that suffered an insured loss.
- the insurance moduleis triggered by the sensor-based state prediction system 50 detecting a state indicative of a loss or by an owner or owner system starting a insurance claim process.
- the insurance claim moduleparses 230 the triggering message to extract information regarding the insured loss to extract identifying information regarding the premises that were insured, the nature of the loss, the insurance carrier, etc., as well as other generally conventional information.
- the insurance claim moduleconstructs 232 a request to the sensor-based state prediction system 50 to extract 236 service and usage data for one or more monitored units within the premises, and sends 234 the request to the sensor-based state prediction system 50 .
- the sensor-based state prediction system 50extracts service record data for each system within the premises, as well as states of the system/premises prior to the incident and/or actual sensor data of sensors monitoring the system/premises prior to the incident.
- the insurance claim modulegenerates 238 an insurance claim form from a template form used by the insurance carrier for the particular premises.
- the insurance claim module 50fills in the template with the conventional information such as the policy number, address, policyholder, etc.
- the insurance claim modulehowever also provides 240 either in the template form or as a supplemental form, the extracted operational data for each specific piece of equipment based upon service and usage records retrieved from the database 51 and sensor states prior to and subsequent to the insured event.
- the format of this supplemental formcan take various configurations. One such configuration is shown in FIG. 14A .
- the populated claim form(or the populated supplemental form, i.e., supporting documentation for the insurance claim form) is populated with the premises and system/equipment ID's and the extracted operational data that shows operational performance of the system/equipment ID before the event and after the event.
- the populated claim form or the populated supplemental formalso will show whether damaged, monitored systems were running properly, properly serviced etc., based on actual sensor data and historical service record data, as information provided are the actual conditions of the premises as measured by the sensor data and the calculated states as determined by the sensor based prediction system 50 showing the events before the insured event happened and possibly during the insured event. This could benefit customer by yielding more accurate reimbursement of insurance funds depending on the type of insurance coverage.
- a set of recordsare provided for historical state transitions (several before and during and after event, if any), sensor semantic records, and service records all pertaining to the specific ID equipment/system.
- the augmented underwriting module 250( FIG. 11 ) executing process 250 ′ for augmenting underwriting of insurance based upon data received from the sensors and service records as described above is shown.
- the augmented underwriting process 250is coupled to automated insurance underwriting systems that rate and underwrite insurance policies.
- the augmented underwriting insurance process 250provides a continuous underwriting process for insured premises that verifies states and conditions of insured premises and insured systems/equipment.
- the augmented underwriting processstarts 252 with a customer applying for insurance through a conventional application and underwriting process.
- an insurance companyissues a policy that insures a commercial premises.
- the insurance companyincludes as a term in the policy a provision that allows the insurance company to accept state data from a third party entity system and/or sensor data and service record data that originate at the insured premises from the prediction system 50 .
- the customer premisesare configured to supply sensor data to the prediction system 50 .
- the augmented underwriting processreceives 254 from the sensor-based state prediction system 50 that monitors for drift states in various physical elements state data and receives 256 historical service records pertaining to insured equipment and or equipment being monitored.
- the sensor-based state prediction system 50collects and analyzes sensor data and collects service record data from the premises.
- the sensor-based state prediction system 50monitors the sensor data from plural sensors for drift states in various physical systems for the insured premises, and when sensor-based state prediction system 50 determines existence of drift states, the sensor-based state prediction system 50 determines a suitable action alert (based on that drift state) to indicate to a user that there may be something wrong with the physical object being monitored, as discussed above.
- the augmented underwriting processreceives the determined drift states (and/or alerts) and evaluates 260 these drift states (and/or alerts) in real time against the particular insurance company's unique set of underwriting guidelines.
- the automated underwriting system of a typical insurance companyencodes that insurance company's underwriting guidelines into a set of underwriting rules.
- This processuses the augmented underwriting process to augment this automated underwriting process of an insurance company.
- the augmented underwriting processhas a set of augmented underwriting rules that are written based on the insurance companies underwriting guidelines.
- the augmented underwriting processevaluates the set of sensor-based underwriting rules against determined drift states received from the sensor-based state prediction system 50 , as well as service records, etc.
- the sensor-based underwriting moduleaugments the automated underwriting system used by the insurance company (or underwriting agent for the insurance company).
- the sensor-based underwriting modulecan be associated with the sensor-based state prediction system 50 or can generate data that is sent to an insurance company's automated underwriting system. In either event, whether the sensor-based underwriting module augments the automated underwriting system or is associated with the sensor-based state prediction system 50 , the sensor-based underwriting module may produce 262 underwriting changes. Underwriting changes, for example would be for conditions that increase risk, as measured by the sensor-based underwriting rules, increases in risk that are translated into increases in premiums. Conversely, for conditions that mitigate or reduce risk, as measured by sensor-based underwriting rules, decreases in risk are translated into either reductions in premiums and/or increases in insured coverage or other added value to the insured.
- sensor-based underwriting rulesare generated for each insured item type and insurance line. These sensor-based underwriting rules are used to supplement the unique underwriting guidelines for an insurance company. These sensor-based underwriting rules are evaluated against the predicted changes in conditions and/or alerts. These sensor-based underwriting rules are evaluated by the underwriting process on a continuous basis to assess on-going risk and exposures of customers based on the generated alert conditions, as measured against the company's unique underwriting guidelines. The underwriting process determines 264 a premium change for the amount of coverage (or conversely could modify the amount of coverage for the premises based on the premium). The underwriting process accomplishes this determination based on a new measure of risk exposure resulting evaluation of the sensor-based underwriting rules based on sensor data/alerts provided from the above-described prediction system 50 .
- This dynamic underwriting risk analysiscan tie alerts to a pricing table (and or a coverage table) that produces percentage increases or decreases in premiums (and/or coverage) according to the insurance carrier's underwriting rules.
- the customeracquires insurance coverage for a premises and equipment in the premises.
- the information useddepends on the type of coverage requested.
- the guidelinesare based on objective factors that insurers use to classify risks, which factors are based on historical experience.
- the sensor-based underwriting moduleeither associated with the sensor-based state prediction system 50 or which augments an insurance company's automated underwriting process underwriting risk can be more accurately determined based on predicted actions derived from current sensor readings.
- Two types of categories of exclusion in insurance underwritingare moral hazard and correlated losses.
- a moral hazardcan be considered as a condition where the consequences of the customer's actions are the responsibility of the insurance company rather than the customer. That is by an insurance company insuring for moral hazard that decision can make the customer more likely to take unnecessary risks or actions.
- the sensor-based underwriting modulecan assist insurance to avoid paying for the consequences of reckless behavior by examining alerts that result from such behavior. For example, alerts can constantly be raised for food storage or food preparation issues.
- sensor deviceswere shown. These sensor devices, whether wired or wireless were coupled to the network and provides sensor data for the above applications. A preferred manner for handling sensor monitoring is by use of “sensor packs.”
- FIG. 16a sensor pack is shown.
- the concept of a sensor packuses the processing concepts discussed above in conjunction with FIGS. 5-8 , as applied to individual business types and/or individual business areas.
- a specific sensor packthat has three sensor devices. Each of the sensor devices are of different types to sense different physical or thermal or chemical, etc. conditions. In this configuration the sensor pack is pre-configured for a specific business application and specific equipment.
- the three sensorsshare common infrastructure, i.e., a common processor device 21 a , e.g., a CPU, (or other type of controller device) that executes under an operating system, generally with 8-bit or 16-bit logic, as mentioned in FIG.
- a common processor device 21 ae.g., a CPU, (or other type of controller device) that executes under an operating system, generally with 8-bit or 16-bit logic, as mentioned in FIG.
- the device 20has a wireless network interface card 21 d that interfaces the device 20 to the network 10 .
- a transceiver chip driven by a wireless network protocol stacke.g., 802.15.4/6LoWPAN
- the sensor element 22 and a sensor interface 22 ainterface to the processor 21 a .
- Sensors 22can be of any type, but each are of different types, albeit, there can be several sensor of the same type within a pack provided that there are also sensors of different types within that pack.
- a sensor packis a pre-packaged group of sensors that have two or more different sensor elements to sense correspondingly two or more different properties, whether those properties are optical, thermal, physical, chemical, etc. parameters.
- a defined sensor packis configured according to results of the now to be described risk analysis based on specific business application process.
- a process 280 to determine specific sensor packs for specific business unitswill now be described.
- the architecture aboveFIG. 5
- some sensor datamay be more relevant to detection of specific anomalies than other sensors units and according to execution of the machine learning algorithms discussed above are more relevant to determine states, whether “safe” (normal) states or unsafe (drift) states. This recognition thus gives rise to the described sensor pack.
- Test units at various locations or premisesare selected. These test units are existing customer sites of a specific type. For example, two such unit types are restaurant kitchens and warehouses. Within each type there may be sub-types. For example there could be differences between fast food kitchens and higher-end steak houses. In addition, there could be differences between fast food kitchens in a national chain of fast food restaurants and a local mom and pop fast food restaurant. Depending on the sensor type, analysis of data and the need for specific types of sensors will vary greatly.
- the processstarts 282 with a selection of a unit type.
- sets of sensorsare deployed 284 in several premises of that unit type.
- several sets of different sensorsare deployed.
- Some sensorsare deployed to monitor specific types of equipment, whereas other sensors are deployed to monitor the general environment of the unit.
- sensorscan be deployed in a plurality of different kitchens in different restaurants.
- sensorscan be deployed to monitor a plurality of different equipment in the kitchens, e.g., exhaust hoods, refrigeration equipment, ovens, stoves, etc.
- the sensorsare configured 286 to connect with a gateway that sends sensor data from each sensor to the prediction system 50 .
- the types of sensors deployedcan be ubiquitous or can be selected based on some pre-existing notion of what kinds of sensors would be most useful for a given business type.
- the sensor-based state prediction system 50receives 288 sensor data from each of the sensors for each physical object or physical quantity being monitored for each of the instances of the establishments and based on the sets of data from the fixed/mobile sensors ( FIG. 2 ) that are deployed in the premises, the sensor-based state prediction system 50 applies 290 the above mentioned unsupervised algorithm learning models to analyze the sensor data from the premises, which generates 292 sensor states and a state model that can predict Next states, e.g., patterns, anomalies, conditions and events over a time frame that can be expected for the kitchen (generally as described above).
- the modelproduces 294 a listing the sensor types that were used in the analysis. This listing determines which sensors most contribute to various predictions and which deployments contribute most to such predictions.
- the results of this analysisis thus a listing of sensor types for specific deployments and/or a listing of specific deployments (which equipment to monitor and where to place sensors). Based on this testing, application specific types of sensor packs (and/or deployments) are determined for that unit type. The process is repeated for each unit type (or unit sub-type) for which a specific sensor pack configuration for specific a business application is desired.
- the analysis resultsalso include suggested “alerts” that would be generated by the prediction system 50 .
- Various types of premisesin addition to restaurants and warehouses, can be analyzed in this manner including large commercial facilities, such as office buildings, etc.
- the unsupervised algorithmsproduce states that are normal or safe states and drift or unsafe states as a self-learning outcome that result from executing such algorithms using the sensor data.
- the results of execution of these unsupervised algorithmsare these sensor states and state sequences for the various units. From these states and state sequences, the sensor-based state prediction system 50 can determine/detect drift states from which predictions and alerts are produced. From this process, different configurations of sensor packs and correspondingly processing and infrastructure to support processing of sensor signals from these sensor packs, are provided 296 for specific unit types.
- the sensor-based state prediction system 50by processing the sensor data and service records to determine normal operating ranges in equipment and determining drift information mentioned above can be used to form predictions of when equipment service is coming due or when equipment is about to fail.
- the equipment failure prediction processing 300can be part of the sensor based prediction system 50 that conducts an analysis of sensor signals from deployed individual sensors and/or sensor packs to detect one or more drift states that predict potential equipment failure.
- vibration and temperature sensorsare used to determine when a particular component is about to fail.
- Sensor packsare disposed about the premises and either in proximity to high-value equipment that is defined as equipment that is specifically insured or equipment whose failure can result in insured losses or specifically disposed to monitor such high-value equipment.
- the equipment failure prediction processing 300receives 302 from the sensor based prediction system sensors state and state transition data resulting from the processing of FIG. 5 , et seq.,) from the sensor packs signals that monitor specific equipment. In the example described, some of these signals can be from the vibration sensor and thermal sensors.
- the vibration sensorscan sense vibrations produced by mechanical equipment, whereas the thermal sensors produce signals proportional to temperatures of such equipment.
- the equipment failure prediction processing 300examines 304 sensors states according to equipment and these states and according to results of the unsupervised learning models, and over time the sensor-based state prediction system 50 detects drift states in the vibration and thermal sensor signals. Based on detecting a drift state or states, the sensor-based state prediction system 50 determines 306 a prediction and a suitable action alert to send to a user device/system.
- an alertis sent 310 to the equipment owner to schedule a service call.
- This failure predictioncan also be sent by the sensor-based state prediction system 50 to a sensor-based underwriting module (as discussed above) for either modification of insurance rates or possibly other action such as notice of insurance potential insurance cancelation absent rectification of the alerted condition.
- the service server 320executes on one or more computer servers that may or may not be part of the “cloud” ( FIG. 1 ) and which receives for a specific premises or a specific group of related premises, sensor states from an associated state transition matrix (e.g., on storage 51 ) for that specific premises or the specific group of related premises.
- the service server 320includes processors 322 coupled to memory 324 and storage 326 .
- the service server 320is coupled to the sensor-based state prediction system 50 via a network (not shown) to receive alerts generated by sensor-based state prediction system 50 . These alerts are messages that result from continuous analysis using the unsupervised learning models in the sensor-based state prediction system 50 that continually monitors for drift states of physical elements and/or premises.
- the service server 320receives alerts include the analysis results of the determined drift states that indicate specific events at the monitored premises (or group of premises).
- the sensor-based state prediction system 50also produces suggested actions for the premises owner should be taking with respect to the object being monitored.
- the suggested actionsare tracked by the sensor-based state prediction system 50 , as are results of corrective actions taken.
- One technique for tracking corrective actionsis to provide a mechanism through which the premises owner provides proof of the corrective action.
- Another way to track corrective actionsis to infer completion of the corrective action by virtue of states of the premises (or specific equipment) returning to a safe or normal state.
- Both the alerts and optionally selected information either the states and/or raw sensor dataare sent to a continuous risk assessment and allocation module 330 that is operated by the service server 300 .
- the continuous risk assessment and allocation module 330determines insurance risk based on the alerts generated from the sensor-based state prediction system, which are evaluated by continuous risk assessment and allocation module 330 with respect to sensor based risk assessment rules 338 .
- the sensor based risk assessment rules 338can be of various types and are modeled after an insurance carrier's risk factors, but which are modified so as to take into account the dynamic changing conditions at a premises as measured by the alerts, sensor states and drift states.
- alertsare evaluated on a dynamic basis by the continuous risk assessment and allocation module 330 .
- the continuous risk assessment and allocation module 330parses the alerts to extract semantic information that is evaluated against the risk assessment rules 338 of the insurance carrier to determine increases to risk with respect to existing conditions at the premises as measured by the alerts, sensor states and drift states. Concomitant therewith the continuous risk assessment and allocation module 330 uses the extracted information from the alerts, etc., which is evaluated against the risk assessment rules 338 to determine decreases in risk based on existing conditions at the premises as measured by the alerts, sensor states and drift states. Alerts are evaluated for presence of corrective actions that decrease risk or absence of drift conditions that provide an overall lower risk profile than a previous risk profile (e.g., an initial profile or an older profile).
- the sensor based prediction engine 50forms a state sequence S 34 S 24 S 60 . Assume for the example that this sequence indicates that the heat being generated by the stoves in the kitchen exceed M BTU. This rule would be evaluated by the continuous risk assessment and allocation module 330 to modify either coverage or pricing. Thus the assessment rules 338 are based on the carrier's underwriting rules, but modified to use as inputs to the rules, either raw sensor data or state sequences.
- a premium adjustment module 340which converts the risk changes into a value that is used to access a pricing table 342 (or coverage table not shown) and produce a policy premium enhancer amount that is added to (for increases in risk) or subtracted (for decreases in risk) from a base policy premium (or produces a coverage enhancer to modify coverage amounts).
- the conversionis performed in accordance with assessment rules 338 .
- the policy premium enhancersare adjustment values either positive to increase a premium or negative to decrease a premium that are collected and aggregated by a policy premium collector 346 module.
- the policy premium collector 346 moduleis a structure that periodically credits and debit changes to the policy premium for a particular policy for a particular premises (or group of premises) based on the aforementioned modules 334 , 340 , 342 , etc., and which periodically sends these changes to a policy holder system.
- the policy premium collector 346determines an actual amount for the policy at periodic points in time, e.g., monthly, during the term of the policy, and sends messages having these amounts out for delivery to the policy holder for either credit or debit to the policy holder.
- the risk assessmentcan be a risk assessment that is point in time based (e.g., the single episode discussed above) and/or the risk assessment can be continuous.
- the risk assessmentcan be a risk assessment that is point in time based (e.g., the single episode discussed above) and/or the risk assessment can be continuous.
- One type, such as the point in time based assessmentis a risk assessment that results in an adjustment in premiums contemporaneous with receiving of alert.
- Service server 330while rating a warehouse (not shown) receives 382 an alert that indicates that the warehouse is currently storing fireworks or other hazardous materials (as determined by one or more chemical sensors, for instance) for a day or week, but temporally.
- the alertis parsed to provide a semantic indicator that is used in evaluation 384 of the risk exposure for the facility presented with the new alert. That is, based on the alert, a new risk assessment is determined and concomitant therewith this new risk assessment is evaluated 386 against existing policy exclusions to determine whether the new risk assessment is within the policy coverage or whether it is excluded.
- the service server 300determines 388 new policy premiums for that policy (e.g., via modules 340 and 342 FIG. 19 ) when the new risk assessment is within the policy coverage and sends 390 the determined premiums to the policy premium collector module 346 , whereas when the service server determines that the new risk assessment is for an existing policy exclusion, the service server sends 392 a message to the policy holder indicating that there is no coverage for the new risk under the policy based on exclusion terms of the policy.
- the new policy premiums for the policy when the new risk assessment is within the policy coverageare determined by accessing the policy pricing table that stores policy premium enhancers (changes in premiums per base amount of coverage) as discussed above.
- a second type of classification of riskis a type where upon receipt of the alert, the carrier delays charging of new premiums giving the policy holder time to correct the conditions that caused determination of the alert.
- the processing 400 performed by the service server 300includes receiving 402 an alert either the new risk assessment is determined and evaluated to determine a new premium enhancer generally as discussed above (which assessment is delayed) or the determination is delayed. The delay is for a set amount of time/days to enable corrective action by the owner. In any event, upon expiration of the set delay period (fixed in the policy) if no corrective action has been taken, the policy premium enhancer is applied. Corrective action is verified by receipt by service server 300 of state messages indicating that the premises has re-entered a safe or normal state.
- the service server 300receives various policy premium enhancers for that policy based on new risk assessments and corrections to risk assessments, and determines new policy premiums and sends the determined new premiums to the policy premium collector module 346 that sends the new policy premium charges to the policy holder on a periodic bases along with reports showing application of the policy enhancers based on received states.
- Serversinterface to the sensor based state prediction system 50 via a cloud computing configuration and parts of some networks can be run as sub-nets.
- the sensorsprovide in addition to sensor data, detailed additional information that can be used in processing of sensor data evaluate.
- a motion detectorcould be configured to analyze the heat signature of a warm body moving in a room to determine if the body is that of a human or a pet. Results of that analysis would be a message or data that conveys information about the body detected.
- Various sensorsthus are used to sense sound, motion, vibration, pressure, heat, images, and so forth, in an appropriate combination to detect a true or verified alarm condition at the intrusion detection panel.
- Recognition softwarecan be used to discriminate between objects that are a human and objects that are an animal; further facial recognition software can be built into video cameras and used to verify that the perimeter intrusion was the result of a recognized, authorized individual.
- video cameraswould comprise a processor and memory and the recognition software to process inputs (captured images) by the camera and produce the metadata to convey information regarding recognition or lack of recognition of an individual captured by the video camera.
- the processingcould also alternatively or in addition include information regarding characteristic of the individual in the area captured/monitored by the video camera.
- the informationwould be either metadata received from enhanced motion detectors and video cameras that performed enhanced analysis on inputs to the sensor that gives characteristics of the perimeter intrusion or a metadata resulting from very complex processing that seeks to establish recognition of the object.
- Sensor devicescan integrate multiple sensors to generate more complex outputs so that the intrusion detection panel can utilize its processing capabilities to execute algorithms that analyze the environment by building virtual images or signatures of the environment to make an intelligent decision about the validity of a breach.
- Memorystores program instructions and data used by the processor of the intrusion detection panel.
- the memorymay be a suitable combination of random access memory and read-only memory, and may host suitable program instructions (e.g. firmware or operating software), and configuration and operating data and may be organized as a file system or otherwise.
- the stored program instructionmay include one or more authentication processes for authenticating one or more users.
- the program instructions stored in the memory of the panelmay further store software components allowing network communications and establishment of connections to the data network.
- the software componentsmay, for example, include an internet protocol (IP) stack, as well as driver components for the various interfaces. Other software components suitable for establishing a connection and communicating across network will be apparent to those of ordinary skill.
- IPinternet protocol
- Serversinclude one or more processing devices (e.g., microprocessors), a network interface and a memory (all not illustrated). Servers may physically take the form of a rack mounted card and may be in communication with one or more operator terminals (not shown).
- An example monitoring serveris a SURGARDTM SG-System III Virtual, or similar system.
- each monitoring serveracts as a controller for each monitoring server, and is in communication with, and controls overall operation, of each server.
- the processormay include, or be in communication with, the memory that stores processor executable instructions controlling the overall operation of the monitoring server.
- Suitable softwareenable each monitoring server to receive alarms and cause appropriate actions to occur.
- Softwaremay include a suitable Internet protocol (IP) stack and applications/clients.
- IPInternet protocol
- Each monitoring server of the central monitoring stationmay be associated with an IP address and port(s) by which it communicates with the control panels and/or the user devices to handle alarm events, etc.
- the monitoring server addressmay be static, and thus always identify a particular one of monitoring server to the intrusion detection panels.
- dynamic addressescould be used, and associated with static domain names, resolved through a domain name service.
- the network interface cardinterfaces with the network to receive incoming signals, and may for example take the form of an Ethernet network interface card (NIC).
- NICEthernet network interface card
- the serversmay be computers, thin-clients, or the like, to which received data representative of an alarm event is passed for handling by human operators.
- the monitoring stationmay further include, or have access to, a subscriber database that includes a database under control of a database engine.
- the databasemay contain entries corresponding to the various subscriber devices/processes to panels like the panel that are serviced by the monitoring station.
- a computer program producti.e., a computer program tangibly embodied in one or more tangible, physical hardware storage devices that are computer and/or machine-readable storage devices for execution by, or to control the operation of, data processing apparatus, e.g., a programmable processor, a computer, or multiple computers.
- a computer programcan be written in any form of programming language, including compiled or interpreted languages, and it can be deployed in any form, including as a stand-alone program or as a module, component, subroutine, or other unit suitable for use in a computing environment.
- a computer programcan be deployed to be executed on one computer or on multiple computers at one site or distributed across multiple sites and interconnected by a network.
- Actions associated with implementing the processescan be performed by one or more programmable processors executing one or more computer programs to perform the functions of the calibration process. All or part of the processes can be implemented as, special purpose logic circuitry, e.g., an FPGA (field programmable gate array) and/or an ASIC (application-specific integrated circuit).
- special purpose logic circuitrye.g., an FPGA (field programmable gate array) and/or an ASIC (application-specific integrated circuit).
- processors suitable for the execution of a computer programinclude, by way of example, both general and special purpose microprocessors, and any one or more processors of any kind of digital computer.
- a processorwill receive instructions and data from a read-only storage area or a random access storage area or both.
- Elements of a computerinclude one or more processors for executing instructions and one or more storage area devices for storing instructions and data.
- a computerwill also include, or be operatively coupled to receive data from, or transfer data to, or both, one or more machine-readable storage media, such as mass storage devices for storing data, e.g., magnetic, magneto-optical disks, or optical disks.
- Tangible, physical hardware storage devicesthat are suitable for embodying computer program instructions and data include all forms of non-volatile storage, including by way of example, semiconductor storage area devices, e.g., EPROM, EEPROM, and flash storage area devices; magnetic disks, e.g., internal hard disks or removable disks; magneto-optical disks; and CD-ROM and DVD-ROM disks and volatile computer memory, e.g., RAM such as static and dynamic RAM, as well as erasable memory, e.g., flash memory.
- semiconductor storage area devicese.g., EPROM, EEPROM, and flash storage area devices
- magnetic diskse.g., internal hard disks or removable disks
- magneto-optical diskse.g., magneto-optical disks
- CD-ROM and DVD-ROM diskse.g., RAM such as static and dynamic RAM, as well as erasable memory, e.g., flash memory.
Landscapes
- Business, Economics & Management (AREA)
- Emergency Management (AREA)
- Physics & Mathematics (AREA)
- General Physics & Mathematics (AREA)
- Engineering & Computer Science (AREA)
- Computing Systems (AREA)
- Alarm Systems (AREA)
Abstract
Description
| State | State | |||||
| tran- | tran- | State | State | State | State | |
| Instance | sition | sition | transition | transition | transition | transition |
| x, y | x, y | x, y | x, y | x, y | x, y | |
| x, y | x, y | x, y | x, y | x, y | x, y | |
| x, y | x, y | x, y | x, y | x, y | x, y | |
| t1 | t2 | t3 | *** | ||
| Instance | State | State | State | *** | ||
| transition 2 | transition 3 | |||||
| 1 | 1 | 1 | *** | |||
| 1 | 1 | 1 | *** | |||
| t1 t5 | t2 t3 | t4 t7 t8 | *** | |||
| e1 | e2 | e3 | *** | ||
| Instance | State | State | State | *** | ||
| transition 2 | transition 3 | |||||
| E2 | *** | |||||
| E2 | *** | |||||
| E1 | E1 | E3 | *** | |||
- Site no.: 448192
- Kitchen thermostat: 69,
- Stove thermostat: 72,
- Outdoor security panel: Active,
- Kitchen Lights: On,
- Delivery Door: Shutdown
- State1: Kitchen thermostat: 69, Stove thermostat: 72, Outdoor security panel: Active, Kitchen Lights: On, Delivery Door: Shutdown, current time: Monday 5:00 AM PST, start time: Sunday 10:00 PM PST
| Obstruction Detector | Room | Stove Thermostat | ||
| 0 | 71.1755732 | 78.95655605 | ||
| 0 | 68.27180645 | 79.97821825 | ||
| 0 | 71.80483918 | 79.428149 | ||
| 0 | 70.46354628 | 81.90901291 | ||
| 0 | 69.83508114 | 81.12026772 | ||
| 0 | 71.46074066 | 81.613552 | ||
| 1 | 70.14174204 | 80.12242015 | ||
| 1 | 70.98180652 | 78.03049081 | ||
- s1 s2 s4 s5
- s2 s2 s4 s5
| Room | Safety State | ||
| Obstruction Detector | Thermostat | Stove Thermostat | (label) |
| 0 | 71.1755732 | 78.95655605 | |
| 0 | 68.27180645 | 79.97821825 | |
| 0 | 71.80483918 | 79.428149 | |
| 0 | 70.46354628 | 81.90901291 | |
| 0 | 69.83508114 | 81.12026772 | |
| 0 | 71.46074066 | 81.613552 | |
| 1 | 70.14174204 | 80.12242015 | |
| 1 | 70.98180652 | 78.03049081 | |
| 0 | 68.58285177 | 79.981358 | |
| 0 | 69.91571802 | 79.4885171 | |
| 1 | 69.89799953 | 79.3838372 | |
| 0 | 70.42668373 | 80.20397118 | |
| 1 | 70.23391637 | 81.80212485 | |
| 0 | 68.19244768 | 81.19203004 | G |
- stoveThermoStat=‘(-inf-81.064396]’
- |obstructionDetector=0:G
- |obstructionDetector=1:G
- stoveThermoStat=‘(81.064396-84.098301]’
- |obstructionDetector=0:G
- |obstructionDetector=1:Y
- stove ThermoStat=‘(84.098301-87.132207]’:R
- stoveThermoStat=‘(87.132209-90.166112]’
- |obstructionDetector=0:R
- |obstructionDetector=1:R
- stoveThermoStat=‘(90.166112-inf)’
- |obstructionDetector=0:R
- |obstructionDetector=1:R
- Field Name Field Description
- Customer No: Uniquely identifies a customer
- Site No: Uniquely identifies a customer site/store
- Region No: Sites are categorized into regions, this uniquely identifies a region
- Job No: Uniquely identifies a job
- Date: Date job created
- Job Cause Number: A number that identifies a particular reason why the job was requested.
- Job Cause Desc: A textual description of the job cause, for example, “Faulty part”
- Resolution No: The resolution that was used to fix the problem.
- Resolution Desc: A textual description of the fix.
- Job Comments: A free text field, where the job done is described by the technician.
Claims (20)
Priority Applications (2)
| Application Number | Priority Date | Filing Date | Title |
|---|---|---|---|
| US14/870,341US11436911B2 (en) | 2015-09-30 | 2015-09-30 | Sensor based system and method for premises safety and operational profiling based on drift analysis |
| PCT/US2016/054316WO2017058997A1 (en) | 2015-09-30 | 2016-09-29 | Sensor based system and method for premises safety and operational profiling based on drift analysis |
Applications Claiming Priority (1)
| Application Number | Priority Date | Filing Date | Title |
|---|---|---|---|
| US14/870,341US11436911B2 (en) | 2015-09-30 | 2015-09-30 | Sensor based system and method for premises safety and operational profiling based on drift analysis |
Publications (2)
| Publication Number | Publication Date |
|---|---|
| US20170092108A1 US20170092108A1 (en) | 2017-03-30 |
| US11436911B2true US11436911B2 (en) | 2022-09-06 |
Family
ID=58409767
Family Applications (1)
| Application Number | Title | Priority Date | Filing Date |
|---|---|---|---|
| US14/870,341ActiveUS11436911B2 (en) | 2015-09-30 | 2015-09-30 | Sensor based system and method for premises safety and operational profiling based on drift analysis |
Country Status (2)
| Country | Link |
|---|---|
| US (1) | US11436911B2 (en) |
| WO (1) | WO2017058997A1 (en) |
Cited By (1)
| Publication number | Priority date | Publication date | Assignee | Title |
|---|---|---|---|---|
| US11605286B1 (en)* | 2021-10-22 | 2023-03-14 | X Development Llc | Alert generation algorithm for tracking devices |
Families Citing this family (19)
| Publication number | Priority date | Publication date | Assignee | Title |
|---|---|---|---|---|
| US11436911B2 (en) | 2015-09-30 | 2022-09-06 | Johnson Controls Tyco IP Holdings LLP | Sensor based system and method for premises safety and operational profiling based on drift analysis |
| US10354332B2 (en) | 2015-09-30 | 2019-07-16 | Sensormatic Electronics, LLC | Sensor based system and method for drift analysis to predict equipment failure |
| US11151654B2 (en) | 2015-09-30 | 2021-10-19 | Johnson Controls Tyco IP Holdings LLP | System and method for determining risk profile, adjusting insurance premiums and automatically collecting premiums based on sensor data |
| US10902524B2 (en) | 2015-09-30 | 2021-01-26 | Sensormatic Electronics, LLC | Sensor based system and method for augmenting underwriting of insurance policies |
| US10425702B2 (en) | 2015-09-30 | 2019-09-24 | Sensormatic Electronics, LLC | Sensor packs that are configured based on business application |
| US10708151B2 (en)* | 2015-10-22 | 2020-07-07 | Level 3 Communications, Llc | System and methods for adaptive notification and ticketing |
| US10593177B2 (en) | 2016-03-16 | 2020-03-17 | Sensormatic Electronics, LLC | Method and apparatus for tiered analytics in a multi-sensor environment |
| US10552914B2 (en) | 2016-05-05 | 2020-02-04 | Sensormatic Electronics, LLC | Method and apparatus for evaluating risk based on sensor monitoring |
| US10810676B2 (en) | 2016-06-06 | 2020-10-20 | Sensormatic Electronics, LLC | Method and apparatus for increasing the density of data surrounding an event |
| US10359771B2 (en) | 2017-06-08 | 2019-07-23 | Tyco Fire & Security Gmbh | Prediction of false alarms in sensor-based security systems |
| US11539794B1 (en)* | 2018-05-17 | 2022-12-27 | Td Ip Holdco, Llc | System and method for monitoring door usage |
| US11732916B2 (en) | 2020-06-08 | 2023-08-22 | Emerson Climate Technologies, Inc. | Refrigeration leak detection |
| US11359846B2 (en) | 2020-07-06 | 2022-06-14 | Emerson Climate Technologies, Inc. | Refrigeration system leak detection |
| US11885516B2 (en) | 2020-08-07 | 2024-01-30 | Copeland Lp | Refrigeration leak detection |
| US11754324B2 (en) | 2020-09-14 | 2023-09-12 | Copeland Lp | Refrigerant isolation using a reversing valve |
| US11609032B2 (en) | 2020-10-22 | 2023-03-21 | Emerson Climate Technologies, Inc. | Refrigerant leak sensor measurement adjustment systems and methods |
| US12196462B2 (en) | 2021-03-23 | 2025-01-14 | Copeland Lp | Heat-pump system with multiway valve |
| US11940188B2 (en) | 2021-03-23 | 2024-03-26 | Copeland Lp | Hybrid heat-pump system |
| CN114111905B (en)* | 2021-11-26 | 2023-04-28 | 中国电建集团成都勘测设计研究院有限公司 | High side slope construction scaffold frame safety monitoring system |
Citations (153)
| Publication number | Priority date | Publication date | Assignee | Title |
|---|---|---|---|---|
| US5453733A (en) | 1992-07-20 | 1995-09-26 | Digital Security Controls Ltd. | Intrusion alarm with independent trouble evaluation |
| US5587704A (en) | 1995-09-01 | 1996-12-24 | Foster; Samuel T. | Code blue light audio and visual alarm apparatus |
| JPH0911883A (en) | 1995-06-30 | 1997-01-14 | Honda Motor Co Ltd | Anti-lock brake control device for vehicle |
| US5708423A (en) | 1995-05-09 | 1998-01-13 | Sensormatic Electronics Corporation | Zone-Based asset tracking and control system |
| US5825283A (en) | 1996-07-03 | 1998-10-20 | Camhi; Elie | System for the security and auditing of persons and property |
| US5862201A (en) | 1996-09-12 | 1999-01-19 | Simplex Time Recorder Company | Redundant alarm monitoring system |
| US20010039525A1 (en) | 1999-12-30 | 2001-11-08 | Messmer Richard Paul | Methods and systems for finding value and reducing risk |
| US20020067259A1 (en) | 2000-09-29 | 2002-06-06 | Fufidio Michael Vincent | Portal intrusion detection apparatus and method |
| US20020161609A1 (en) | 2000-10-23 | 2002-10-31 | Zizzamia Frank M. | Commercial insurance scoring system and method |
| US20030083756A1 (en)* | 2000-03-10 | 2003-05-01 | Cyrano Sciences, Inc. | Temporary expanding integrated monitoring network |
| US20030117279A1 (en)* | 2001-12-25 | 2003-06-26 | Reiko Ueno | Device and system for detecting abnormality |
| US20030135450A1 (en) | 2002-01-10 | 2003-07-17 | Scott Aguais | System and methods for valuing and managing the risk of credit instrument portfolios |
| US20030136135A1 (en) | 2000-06-16 | 2003-07-24 | Lg Electronics Inc. | Refrigerator and method for controlling the same |
| US20030144932A1 (en) | 2002-01-25 | 2003-07-31 | Martin Peter G. | System and method for real-time activity-based accounting |
| US20040150519A1 (en) | 2003-01-31 | 2004-08-05 | Iftikhar Husain | System and method for monitoring having an embedded device |
| US20050055249A1 (en) | 2003-09-04 | 2005-03-10 | Jonathon Helitzer | System for reducing the risk associated with an insured building structure through the incorporation of selected technologies |
| US20050068165A1 (en) | 2003-09-26 | 2005-03-31 | General Electric Company | System and method of providing security for a site |
| US20050110637A1 (en) | 2003-11-26 | 2005-05-26 | International Business Machines Corporation | System and method for alarm generation based on the detection of the presence of a person |
| US20050184867A1 (en) | 2001-09-10 | 2005-08-25 | Osann Robert Jr. | Home intrusion confrontation avoidance system |
| US20050187860A1 (en) | 2004-02-20 | 2005-08-25 | Peterson Dale L. | System and method for matching loan consumers and lenders |
| US20050271250A1 (en) | 2004-03-16 | 2005-12-08 | Vallone Robert P | Intelligent event determination and notification in a surveillance system |
| US20060033625A1 (en) | 2004-08-11 | 2006-02-16 | General Electric Company | Digital assurance method and system to extend in-home living |
| US20060055543A1 (en)* | 2004-09-10 | 2006-03-16 | Meena Ganesh | System and method for detecting unusual inactivity of a resident |
| US20060195569A1 (en) | 2005-02-14 | 2006-08-31 | Barker Geoffrey T | System and method for using self-learning rules to enable adaptive security monitoring |
| US20060287783A1 (en) | 1998-01-15 | 2006-12-21 | Kline & Walker Llc | Automated accounting system that values, controls, records and bills the uses of equipment/vehicles for society |
| US20070061023A1 (en) | 1991-12-23 | 2007-03-15 | Hoffberg Linda I | Adaptive pattern recognition based controller apparatus and method and human-factored interface therefore |
| US20070085690A1 (en) | 2005-10-16 | 2007-04-19 | Bao Tran | Patient monitoring apparatus |
| US7233886B2 (en) | 2001-01-19 | 2007-06-19 | Smartsignal Corporation | Adaptive modeling of changed states in predictive condition monitoring |
| US20070142936A1 (en) | 2005-10-04 | 2007-06-21 | Fisher-Rosemount Systems, Inc. | Analytical Server Integrated in a Process Control Network |
| US20070282773A1 (en) | 2005-09-26 | 2007-12-06 | Harrison Gregory A | Method And System Of Monitoring And Prognostics |
| US20080036589A1 (en) | 2003-07-17 | 2008-02-14 | Sensicast Systems | Method and apparatus for wireless communication in a mesh network using connectivity assessment at multiple frequencies |
| US20080065427A1 (en) | 2003-09-04 | 2008-03-13 | Hartford Fire Insurance Company | Systems and methods for analyzing sensor data |
| US7346520B2 (en) | 2003-03-27 | 2008-03-18 | University Of Washington | Performing predictive pricing based on historical data |
| EP1921527A2 (en) | 2006-11-10 | 2008-05-14 | Rockwell Automation Technologies, Inc. | Adjustable data collection rate for embedded historians |
| EP1921572A1 (en) | 2006-11-09 | 2008-05-14 | Max J. Pucher | Method for training a system to specifically react on a specific input |
| US7386502B1 (en) | 2000-11-28 | 2008-06-10 | Goldman Sachs & Co. | Method, software program, and system for structuring risk in a financial transaction |
| US20080294690A1 (en) | 2007-05-22 | 2008-11-27 | Mcclellan Scott | System and Method for Automatically Registering a Vehicle Monitoring Device |
| US20090002148A1 (en)* | 2007-06-28 | 2009-01-01 | Microsoft Corporation | Learning and reasoning about the context-sensitive reliability of sensors |
| US20090022362A1 (en) | 2007-07-16 | 2009-01-22 | Nikhil Gagvani | Apparatus and methods for video alarm verification |
| US20090077167A1 (en) | 2005-03-16 | 2009-03-19 | Marc Baum | Forming A Security Network Including Integrated Security System Components |
| US20090132299A1 (en) | 2007-11-20 | 2009-05-21 | Hartford Fire Insurance Company | System and method for identifying and evaluating nanomaterial-related risk |
| US20090265193A1 (en) | 2008-04-17 | 2009-10-22 | Collins Dean | Methods and systems for automated property insurance inspection |
| US20090279734A1 (en) | 2008-05-09 | 2009-11-12 | Hartford Fire Insurance Company | System and method for assessing a condition of property |
| JP2009274660A (en) | 2008-05-16 | 2009-11-26 | Honda Motor Co Ltd | Vehicle body drifting suppresion device |
| US20100063954A1 (en) | 2008-09-11 | 2010-03-11 | Noel Wayne Anderson | Distributed knowledge base method for vehicular localization and work-site management |
| US20100063648A1 (en) | 2008-09-11 | 2010-03-11 | Noel Wayne Anderson | Distributed knowledge base program for vehicular localization and work-site management |
| US20100094661A1 (en) | 2008-10-14 | 2010-04-15 | American International Group | Method and system of determining and applying insurance profit scores |
| US20100115579A1 (en) | 2004-07-21 | 2010-05-06 | Beachhead Solutions, Inc. | System and method for lost data destruction of electronic data stored on portable electronic devices |
| US20100134285A1 (en) | 2008-12-02 | 2010-06-03 | Honeywell International Inc. | Method of sensor data fusion for physical security systems |
| US20100183160A1 (en) | 2007-03-21 | 2010-07-22 | Michael Charles Cosgrove | Vibration sensor assembly with ambient noise detection |
| US20110307221A1 (en) | 2010-06-10 | 2011-12-15 | Hach Company | Blind logger dynamic caller |
| US20110320389A1 (en)* | 2007-10-04 | 2011-12-29 | Kd Secure Llc | Systems and methods for safety and business productivity |
| US20120086550A1 (en) | 2009-02-24 | 2012-04-12 | Leblanc Donald Joseph | Pedobarographic biometric system |
| US20120158161A1 (en) | 2010-12-20 | 2012-06-21 | Alan Wade Cohn | Defining and implementing sensor triggered response rules |
| US20120185728A1 (en) | 2010-12-24 | 2012-07-19 | Commonwealth Scientific And Industrial Research Organisation | System and method for detecting and/or diagnosing faults in multi-variable systems |
| US20120192187A1 (en)* | 2011-01-21 | 2012-07-26 | David Mills | Customizing Automated Process Management |
| US20120226652A1 (en)* | 2011-03-03 | 2012-09-06 | Chetan Kumar Gupta | Event prediction |
| US20130027561A1 (en)* | 2011-07-29 | 2013-01-31 | Panasonic Corporation | System and method for improving site operations by detecting abnormalities |
| US20130057405A1 (en) | 2011-09-01 | 2013-03-07 | Ecolink Intelligent Technology, Inc. | Security apparatus and method |
| US20130066592A1 (en) | 2009-10-23 | 2013-03-14 | Commissariat A L'energie Atomique Et Aux Energies Alternatives | Method and system for evaluating the resemblance of a query object to reference objects |
| US20130091213A1 (en) | 2011-10-08 | 2013-04-11 | Broadcom Corporation | Management of social device interaction with social network infrastructure |
| US20130093896A1 (en)* | 2011-10-14 | 2013-04-18 | Samsung Techwin Co., Ltd. | Apparatus and method of storing and searching for image |
| US20130201316A1 (en) | 2012-01-09 | 2013-08-08 | May Patents Ltd. | System and method for server based control |
| US20130218603A1 (en) | 2012-02-21 | 2013-08-22 | Elwha Llc | Systems and methods for insurance based upon characteristics of a collision detection system |
| US20130307682A1 (en) | 2012-05-17 | 2013-11-21 | Honeywell International Inc. | System for advanced security management |
| US20130335219A1 (en) | 2012-05-07 | 2013-12-19 | Integrated Security Corporation | Intelligent sensor network |
| US20140006060A1 (en) | 2012-06-27 | 2014-01-02 | Hartford Fire Insurance Company | System and method for processing data related to worksite analyses |
| US20140005509A1 (en) | 2012-06-29 | 2014-01-02 | Dexcom, Inc. | Implantable sensor devices, systems, and methods |
| US8650048B1 (en) | 2010-04-28 | 2014-02-11 | United Services Automobile Association (Usaa) | Method and system for insuring real property in wildfire prone areas |
| US20140067734A1 (en) | 2012-09-05 | 2014-03-06 | Numenta, Inc. | Anomaly detection in spatial and temporal memory system |
| US20140136242A1 (en) | 2012-11-12 | 2014-05-15 | State Farm Mutual Automobile Insurance Company | Home sensor data gathering for insurance rating purposes |
| US20140132409A1 (en) | 2012-11-15 | 2014-05-15 | Wildfire Defense Systems, Inc. | Wildfire risk assessment |
| US20140149416A1 (en) | 2006-10-05 | 2014-05-29 | Trimble Navigation Limited | System and method for asset management |
| WO2014125769A1 (en) | 2013-02-18 | 2014-08-21 | 株式会社デンソー | Vehicle-orientation detection method and vehicle-orientation detection device |
| US20140247137A1 (en) | 2013-03-04 | 2014-09-04 | Hello Inc. | Base charging station for monitoring device |
| US20140266684A1 (en) | 2013-03-14 | 2014-09-18 | Comcast Cable Communications, Llc | Processing sensor data |
| US20140277718A1 (en) | 2013-03-15 | 2014-09-18 | Eugene Izhikevich | Adaptive predictor apparatus and methods |
| US20140266592A1 (en) | 2013-03-15 | 2014-09-18 | Digi International Inc. | Network gateway system and method |
| US20140279707A1 (en) | 2013-03-15 | 2014-09-18 | CAA South Central Ontario | System and method for vehicle data analysis |
| US20140278573A1 (en) | 2013-03-15 | 2014-09-18 | State Farm Mutual Automobile Insurance Company | Systems and methods for initiating insurance processing using ingested data |
| US20140313032A1 (en) | 2013-04-23 | 2014-10-23 | Canary Connect, Inc. | System and methods for notifying a community of security events |
| US20140358840A1 (en) | 2012-01-13 | 2014-12-04 | Pulse Function F6 Ltd | Apparatus, system and method for risk indicator calculation for driving behaviour and for reconstructing a vehicle trajectory |
| US20150019267A1 (en) | 2013-07-11 | 2015-01-15 | Fluor Technology Corporation | Post-disaster assessment systems and methods |
| US20150019266A1 (en) | 2013-07-15 | 2015-01-15 | Advanced Insurance Products & Services, Inc. | Risk assessment using portable devices |
| KR20150007913A (en) | 2013-07-12 | 2015-01-21 | 가부시끼가이샤 도시바 | Failure Prediction Device |
| US20150025917A1 (en) | 2013-07-15 | 2015-01-22 | Advanced Insurance Products & Services, Inc. | System and method for determining an underwriting risk, risk score, or price of insurance using cognitive information |
| US20150022357A1 (en) | 2013-07-16 | 2015-01-22 | Leeo, Inc. | Electronic device with environmental monitoring |
| EP2843636A1 (en) | 2013-08-23 | 2015-03-04 | E.I. Technology Limited | Monitoring and control of alarm systems |
| US20150077737A1 (en) | 2013-08-09 | 2015-03-19 | Cnry Inc. | System and methods for monitoring an environment |
| US20150106927A1 (en) | 2013-10-14 | 2015-04-16 | Ut-Battelle, Llc | Real-time detection and classification of anomalous events in streaming data |
| US20150120336A1 (en) | 2013-10-24 | 2015-04-30 | Tourmaline Labs, Inc. | Systems and methods for collecting and transmitting telematics data from a mobile device |
| US20150154715A1 (en) | 2013-05-31 | 2015-06-04 | OneEvent Technologies, LLC | Sensors for usage-based property insurance |
| US20150161882A1 (en) | 2013-12-11 | 2015-06-11 | Echostar Technologies, Llc | False alarm identification |
| US20150163121A1 (en) | 2013-12-06 | 2015-06-11 | Lookout, Inc. | Distributed monitoring, evaluation, and response for multiple devices |
| US20150170505A1 (en)* | 2013-12-17 | 2015-06-18 | At&T Mobility Ii Llc | Method, computer-readable storage device and apparatus for providing a collaborative standalone area monitor |
| US20150187192A1 (en) | 2005-12-08 | 2015-07-02 | Costa Verdi, Series 63 Of Allied Security Trust I | System and method for interactive security |
| US20150207796A1 (en) | 2013-12-27 | 2015-07-23 | Abbott Diabetes Care Inc. | Systems, devices, and methods for authentication in an analyte monitoring environment |
| US20150233718A1 (en) | 2014-02-17 | 2015-08-20 | Tourmaline Labs, Inc. | Systems and methods for estimating movements of a vehicle using a mobile device |
| US20150254972A1 (en) | 2014-03-10 | 2015-09-10 | Tyco Fire & Security Gmbh | False Alarm Avoidance In Security Systems Filtering Low In Network |
| US20150254330A1 (en) | 2013-04-11 | 2015-09-10 | Oracle International Corporation | Knowledge-intensive data processing system |
| US20150364027A1 (en) | 2007-10-23 | 2015-12-17 | La Crosse Technology, Ltd. | Location monitoring via a gateway |
| US20150375837A1 (en) | 2013-03-14 | 2015-12-31 | Flir Systems, Inc. | Wind sensor motion compensation systems and methods |
| US20150378715A1 (en)* | 2014-06-30 | 2015-12-31 | Google Inc. | Systems and methods for updating software in a hazard detection system |
| US20160005130A1 (en) | 2013-08-16 | 2016-01-07 | United Services Automobile Association | Systems and methods for utilizing sensor informatics to determine insurance coverage and recoverable depreciation for personal or business property |
| US20160003629A1 (en) | 2013-02-18 | 2016-01-07 | Denso Corporation | Vehicle trajectory calculation method |
| US20160029966A1 (en) | 2014-07-31 | 2016-02-04 | Sano Intelligence, Inc. | Method and system for processing and analyzing analyte sensor signals |
| US20160050264A1 (en) | 2014-08-13 | 2016-02-18 | Tyco Safety Products Cananda Ltd. | Method and apparatus for automation and alarm architecture |
| US20160048580A1 (en) | 2014-08-14 | 2016-02-18 | Verizon Patent And Licensing Inc. | Method and system for providing delegated classification and learning services |
| US20160072891A1 (en) | 2014-09-08 | 2016-03-10 | Leeo, Inc. | Sensor-data sub-contracting during environmental monitoring |
| US20160110833A1 (en) | 2014-10-16 | 2016-04-21 | At&T Mobility Ii Llc | Occupancy Indicator |
| US20160163186A1 (en) | 2014-12-09 | 2016-06-09 | Edison Global Circuits, Llc | Integrated hazard risk management and mitigation system |
| US20160171618A1 (en) | 2014-12-16 | 2016-06-16 | Hartford Fire Insurance Company | Calibrated underwriting system |
| US20160189510A1 (en) | 2014-12-30 | 2016-06-30 | Alarm.Com Incorporated | Digital fingerprint tracking |
| US20160275780A1 (en) | 2013-11-26 | 2016-09-22 | 9069569 Canada Inc. | System and method for providing subscribers a secure electronic emergency response portal on a network |
| US20160285904A1 (en) | 2015-03-26 | 2016-09-29 | Tyco Fire & Security Gmbh | Home Network Intrusion Detection and Prevention System and Method |
| US20170004226A1 (en) | 2015-07-05 | 2017-01-05 | Sas Institute Inc. | Stress testing by avoiding simulations |
| US20170006135A1 (en) | 2015-01-23 | 2017-01-05 | C3, Inc. | Systems, methods, and devices for an enterprise internet-of-things application development platform |
| US20170011465A1 (en) | 2015-07-08 | 2017-01-12 | Here Global B.V. | Method and apparatus for providing fee rate based on safety score |
| US20170061783A1 (en) | 2015-09-01 | 2017-03-02 | Honeywell International Inc. | System and method providing early prediction and forecasting of false alarms by applying statistical inference models |
| US9609003B1 (en) | 2007-06-12 | 2017-03-28 | Icontrol Networks, Inc. | Generating risk profile using data of home monitoring and security system |
| US20170092108A1 (en) | 2015-09-30 | 2017-03-30 | Sensormatic Electronics, LLC | Sensor Based System And Method For Premises Safety And Operational Profiling Based On Drift Analysis |
| US20170091869A1 (en) | 2015-09-30 | 2017-03-30 | Sensormatic Electronics, LLC | Sensor Based System And Method For Augmenting Underwriting Of Insurance Policies |
| US20170091868A1 (en) | 2015-09-30 | 2017-03-30 | Sensormatic Electronics, LLC | Sensor Based System And Method For Augmenting Insurance Claim Filing |
| US20170091867A1 (en) | 2015-09-30 | 2017-03-30 | Sensormatic Electronics, LLC | Sensor Based System And Method For Determining Allocation Based On Physical Proximity |
| US20170091870A1 (en) | 2015-09-30 | 2017-03-30 | Sensormatic Electronics, LLC | Sensor Based System And Method For Drift Analysis To Predict Equipment Failure |
| US20170091871A1 (en) | 2015-09-30 | 2017-03-30 | Sensormatic Electronics, LLC | System And Method For Determining Risk Profile, Adjusting Insurance Premiums And Automatically Collecting Premiums Based On Sensor Data |
| US20170094376A1 (en) | 2015-09-30 | 2017-03-30 | Sensormatic Electronics, LLC | Sensor Packs That Are Configured Based on Business Application |
| US20170153914A1 (en) | 2014-03-11 | 2017-06-01 | Sas Institute Inc. | Distributed data set task selection |
| US20170228661A1 (en) | 2014-04-17 | 2017-08-10 | Sas Institute Inc. | Systems and methods for machine learning using classifying, clustering, and grouping time series data |
| US20170299657A1 (en) | 2015-06-04 | 2017-10-19 | Silverback Advanced Motor Monitoring, LLC | System and Method for Monitoring an Electrical Pattern and Pattern Trends in Electrically Driven Systems |
| US20170308802A1 (en) | 2016-04-21 | 2017-10-26 | Arundo Analytics, Inc. | Systems and methods for failure prediction in industrial environments |
| US20170351787A1 (en) | 2016-06-06 | 2017-12-07 | Tyco Integrated Security Llc | Predicting Service for Intrusion and Alarm Systems Based on Signal Activity Patterns |
| US9852475B1 (en) | 2014-05-20 | 2017-12-26 | State Farm Mutual Automobile Insurance Company | Accident risk model determination using autonomous vehicle operating data |
| US20180062877A1 (en) | 2015-03-10 | 2018-03-01 | Elemental Machines, Inc. | Method and Apparatus for Environmental Sensing |
| US20180095004A1 (en)* | 2016-10-03 | 2018-04-05 | International Business Machines Corporation | Diagnostic fault detection using multivariate statistical pattern library |
| US20180136019A1 (en)* | 2016-11-11 | 2018-05-17 | Chevron U.S.A. Inc. | Fault detection system utilizing dynamic principal components analysis |
| US9996078B1 (en) | 2017-04-07 | 2018-06-12 | Pratt & Whitney Canada Corp. | Pre-emptive fault detection through advanced signal analysis |
| US20180376313A1 (en) | 2014-06-23 | 2018-12-27 | Google Llc | Methods and Apparatus for Using Smart Environment Devices Via Application Program Interfaces |
| US10180339B1 (en)* | 2015-05-08 | 2019-01-15 | Digimarc Corporation | Sensing systems |
| US10268660B1 (en) | 2013-03-15 | 2019-04-23 | Matan Arazi | Real-time event transcription system and method |
| US10325485B1 (en)* | 2018-09-11 | 2019-06-18 | Rockwell Automation Technologies, Inc. | System or process to detect, discriminate, aggregate, track, and rank safety related information in a collaborative workspace |
| US10374821B2 (en) | 2006-12-29 | 2019-08-06 | Kip Prod P1 Lp | System and method for providing network support services and premises gateway support infrastructure |
| US20190302719A1 (en)* | 2018-03-29 | 2019-10-03 | Saudi Arabian Oil Company | Intelligent Distributed Industrial Facility Safety System |
| US10515372B1 (en) | 2014-10-07 | 2019-12-24 | State Farm Mutual Automobile Insurance Company | Systems and methods for managing building code compliance for a property |
| US10650668B2 (en)* | 2015-05-13 | 2020-05-12 | Tyco Safety Products Canada Ltd. | Minimizing false alarms based on identified presence detection |
| US20200158291A1 (en)* | 2018-11-21 | 2020-05-21 | Tongji University | Method for detecting pipe burst in water distribution systems based on pressure disturbance extraction |
| US20200202487A1 (en)* | 2018-12-21 | 2020-06-25 | Here Global B.V. | Method, apparatus, and computer program product for generating an overhead view of an environment from a perspective image |
| US20200221055A1 (en)* | 2019-01-03 | 2020-07-09 | United Technologies Corporation | Systems and methods for compression and recovery of data in additive manufacturing applications |
| US10827951B2 (en)* | 2018-04-19 | 2020-11-10 | Careview Communications, Inc. | Fall detection using sensors in a smart monitoring safety system |
| US20210027602A1 (en)* | 2017-12-13 | 2021-01-28 | Alarm.Com Incorporated | Enhanced audiovisual analytics |
| US11036981B1 (en)* | 2020-02-26 | 2021-06-15 | Sas Institute Inc. | Data monitoring system |
| US11150778B2 (en)* | 2013-08-08 | 2021-10-19 | Honeywell International Inc. | System and method for visualization of history of events using BIM model |
| US11257314B2 (en)* | 2018-08-10 | 2022-02-22 | Scripps Safe, Inc. | Auditable security system for secure enclosures |
- 2015
- 2015-09-30USUS14/870,341patent/US11436911B2/enactiveActive
- 2016
- 2016-09-29WOPCT/US2016/054316patent/WO2017058997A1/enactiveApplication Filing
Patent Citations (163)
| Publication number | Priority date | Publication date | Assignee | Title |
|---|---|---|---|---|
| US20070061023A1 (en) | 1991-12-23 | 2007-03-15 | Hoffberg Linda I | Adaptive pattern recognition based controller apparatus and method and human-factored interface therefore |
| US5453733A (en) | 1992-07-20 | 1995-09-26 | Digital Security Controls Ltd. | Intrusion alarm with independent trouble evaluation |
| US5708423A (en) | 1995-05-09 | 1998-01-13 | Sensormatic Electronics Corporation | Zone-Based asset tracking and control system |
| JPH0911883A (en) | 1995-06-30 | 1997-01-14 | Honda Motor Co Ltd | Anti-lock brake control device for vehicle |
| US5587704A (en) | 1995-09-01 | 1996-12-24 | Foster; Samuel T. | Code blue light audio and visual alarm apparatus |
| US5825283A (en) | 1996-07-03 | 1998-10-20 | Camhi; Elie | System for the security and auditing of persons and property |
| US5862201A (en) | 1996-09-12 | 1999-01-19 | Simplex Time Recorder Company | Redundant alarm monitoring system |
| US20060287783A1 (en) | 1998-01-15 | 2006-12-21 | Kline & Walker Llc | Automated accounting system that values, controls, records and bills the uses of equipment/vehicles for society |
| US20010039525A1 (en) | 1999-12-30 | 2001-11-08 | Messmer Richard Paul | Methods and systems for finding value and reducing risk |
| US20080103751A1 (en) | 2000-03-10 | 2008-05-01 | Smiths Detection, Inc. | Temporary expanding integrated monitoring network |
| US20030109951A1 (en) | 2000-03-10 | 2003-06-12 | Hsiung Chang-Meng B. | Monitoring system for an industrial process using one or more multidimensional variables |
| US20030083756A1 (en)* | 2000-03-10 | 2003-05-01 | Cyrano Sciences, Inc. | Temporary expanding integrated monitoring network |
| US20030144746A1 (en) | 2000-03-10 | 2003-07-31 | Chang-Meng Hsiung | Control for an industrial process using one or more multidimensional variables |
| US20030136135A1 (en) | 2000-06-16 | 2003-07-24 | Lg Electronics Inc. | Refrigerator and method for controlling the same |
| US20020067259A1 (en) | 2000-09-29 | 2002-06-06 | Fufidio Michael Vincent | Portal intrusion detection apparatus and method |
| US20020161609A1 (en) | 2000-10-23 | 2002-10-31 | Zizzamia Frank M. | Commercial insurance scoring system and method |
| US7386502B1 (en) | 2000-11-28 | 2008-06-10 | Goldman Sachs & Co. | Method, software program, and system for structuring risk in a financial transaction |
| US7233886B2 (en) | 2001-01-19 | 2007-06-19 | Smartsignal Corporation | Adaptive modeling of changed states in predictive condition monitoring |
| US20050184867A1 (en) | 2001-09-10 | 2005-08-25 | Osann Robert Jr. | Home intrusion confrontation avoidance system |
| US20030117279A1 (en)* | 2001-12-25 | 2003-06-26 | Reiko Ueno | Device and system for detecting abnormality |
| US20030135450A1 (en) | 2002-01-10 | 2003-07-17 | Scott Aguais | System and methods for valuing and managing the risk of credit instrument portfolios |
| US20030144932A1 (en) | 2002-01-25 | 2003-07-31 | Martin Peter G. | System and method for real-time activity-based accounting |
| US20040150519A1 (en) | 2003-01-31 | 2004-08-05 | Iftikhar Husain | System and method for monitoring having an embedded device |
| US7346520B2 (en) | 2003-03-27 | 2008-03-18 | University Of Washington | Performing predictive pricing based on historical data |
| US20080036589A1 (en) | 2003-07-17 | 2008-02-14 | Sensicast Systems | Method and apparatus for wireless communication in a mesh network using connectivity assessment at multiple frequencies |
| US20100153140A1 (en) | 2003-09-04 | 2010-06-17 | Hartford Fire Insurance Company | System for reducing the risk associated with an insured building structure through the incorporation of selected technologies |
| US20100174566A1 (en) | 2003-09-04 | 2010-07-08 | Hartford Fire Insurance Company | Systems and methods for analyzing sensor data |
| US20130006676A1 (en) | 2003-09-04 | 2013-01-03 | Hartford Fire Insurance Company | System for adjusting insurance for a building structure through the incorporation of selected technologies |
| US20080065427A1 (en) | 2003-09-04 | 2008-03-13 | Hartford Fire Insurance Company | Systems and methods for analyzing sensor data |
| US20050055249A1 (en) | 2003-09-04 | 2005-03-10 | Jonathon Helitzer | System for reducing the risk associated with an insured building structure through the incorporation of selected technologies |
| US20050068165A1 (en) | 2003-09-26 | 2005-03-31 | General Electric Company | System and method of providing security for a site |
| US20050110637A1 (en) | 2003-11-26 | 2005-05-26 | International Business Machines Corporation | System and method for alarm generation based on the detection of the presence of a person |
| US20050187860A1 (en) | 2004-02-20 | 2005-08-25 | Peterson Dale L. | System and method for matching loan consumers and lenders |
| US20050271250A1 (en) | 2004-03-16 | 2005-12-08 | Vallone Robert P | Intelligent event determination and notification in a surveillance system |
| US20100115579A1 (en) | 2004-07-21 | 2010-05-06 | Beachhead Solutions, Inc. | System and method for lost data destruction of electronic data stored on portable electronic devices |
| US20060033625A1 (en) | 2004-08-11 | 2006-02-16 | General Electric Company | Digital assurance method and system to extend in-home living |
| US20060055543A1 (en)* | 2004-09-10 | 2006-03-16 | Meena Ganesh | System and method for detecting unusual inactivity of a resident |
| US20060195569A1 (en) | 2005-02-14 | 2006-08-31 | Barker Geoffrey T | System and method for using self-learning rules to enable adaptive security monitoring |
| US20090077167A1 (en) | 2005-03-16 | 2009-03-19 | Marc Baum | Forming A Security Network Including Integrated Security System Components |
| US20070282773A1 (en) | 2005-09-26 | 2007-12-06 | Harrison Gregory A | Method And System Of Monitoring And Prognostics |
| US20070142936A1 (en) | 2005-10-04 | 2007-06-21 | Fisher-Rosemount Systems, Inc. | Analytical Server Integrated in a Process Control Network |
| US20070085690A1 (en) | 2005-10-16 | 2007-04-19 | Bao Tran | Patient monitoring apparatus |
| US20150187192A1 (en) | 2005-12-08 | 2015-07-02 | Costa Verdi, Series 63 Of Allied Security Trust I | System and method for interactive security |
| US20140149416A1 (en) | 2006-10-05 | 2014-05-29 | Trimble Navigation Limited | System and method for asset management |
| EP1921572A1 (en) | 2006-11-09 | 2008-05-14 | Max J. Pucher | Method for training a system to specifically react on a specific input |
| EP1921527A2 (en) | 2006-11-10 | 2008-05-14 | Rockwell Automation Technologies, Inc. | Adjustable data collection rate for embedded historians |
| US10374821B2 (en) | 2006-12-29 | 2019-08-06 | Kip Prod P1 Lp | System and method for providing network support services and premises gateway support infrastructure |
| US20100183160A1 (en) | 2007-03-21 | 2010-07-22 | Michael Charles Cosgrove | Vibration sensor assembly with ambient noise detection |
| US20080294690A1 (en) | 2007-05-22 | 2008-11-27 | Mcclellan Scott | System and Method for Automatically Registering a Vehicle Monitoring Device |
| US9609003B1 (en) | 2007-06-12 | 2017-03-28 | Icontrol Networks, Inc. | Generating risk profile using data of home monitoring and security system |
| US20090002148A1 (en)* | 2007-06-28 | 2009-01-01 | Microsoft Corporation | Learning and reasoning about the context-sensitive reliability of sensors |
| US20090022362A1 (en) | 2007-07-16 | 2009-01-22 | Nikhil Gagvani | Apparatus and methods for video alarm verification |
| US20110320389A1 (en)* | 2007-10-04 | 2011-12-29 | Kd Secure Llc | Systems and methods for safety and business productivity |
| US20150364027A1 (en) | 2007-10-23 | 2015-12-17 | La Crosse Technology, Ltd. | Location monitoring via a gateway |
| US20090132299A1 (en) | 2007-11-20 | 2009-05-21 | Hartford Fire Insurance Company | System and method for identifying and evaluating nanomaterial-related risk |
| US20090265193A1 (en) | 2008-04-17 | 2009-10-22 | Collins Dean | Methods and systems for automated property insurance inspection |
| US20090279734A1 (en) | 2008-05-09 | 2009-11-12 | Hartford Fire Insurance Company | System and method for assessing a condition of property |
| JP2009274660A (en) | 2008-05-16 | 2009-11-26 | Honda Motor Co Ltd | Vehicle body drifting suppresion device |
| US20100063954A1 (en) | 2008-09-11 | 2010-03-11 | Noel Wayne Anderson | Distributed knowledge base method for vehicular localization and work-site management |
| US20100063648A1 (en) | 2008-09-11 | 2010-03-11 | Noel Wayne Anderson | Distributed knowledge base program for vehicular localization and work-site management |
| US20100094661A1 (en) | 2008-10-14 | 2010-04-15 | American International Group | Method and system of determining and applying insurance profit scores |
| US20100134285A1 (en) | 2008-12-02 | 2010-06-03 | Honeywell International Inc. | Method of sensor data fusion for physical security systems |
| US20120086550A1 (en) | 2009-02-24 | 2012-04-12 | Leblanc Donald Joseph | Pedobarographic biometric system |
| US20130066592A1 (en) | 2009-10-23 | 2013-03-14 | Commissariat A L'energie Atomique Et Aux Energies Alternatives | Method and system for evaluating the resemblance of a query object to reference objects |
| US8650048B1 (en) | 2010-04-28 | 2014-02-11 | United Services Automobile Association (Usaa) | Method and system for insuring real property in wildfire prone areas |
| US20110307221A1 (en) | 2010-06-10 | 2011-12-15 | Hach Company | Blind logger dynamic caller |
| US20120158161A1 (en) | 2010-12-20 | 2012-06-21 | Alan Wade Cohn | Defining and implementing sensor triggered response rules |
| US20120185728A1 (en) | 2010-12-24 | 2012-07-19 | Commonwealth Scientific And Industrial Research Organisation | System and method for detecting and/or diagnosing faults in multi-variable systems |
| US20120192187A1 (en)* | 2011-01-21 | 2012-07-26 | David Mills | Customizing Automated Process Management |
| US20120226652A1 (en)* | 2011-03-03 | 2012-09-06 | Chetan Kumar Gupta | Event prediction |
| US20130027561A1 (en)* | 2011-07-29 | 2013-01-31 | Panasonic Corporation | System and method for improving site operations by detecting abnormalities |
| US20130057405A1 (en) | 2011-09-01 | 2013-03-07 | Ecolink Intelligent Technology, Inc. | Security apparatus and method |
| US20130091213A1 (en) | 2011-10-08 | 2013-04-11 | Broadcom Corporation | Management of social device interaction with social network infrastructure |
| US20130093896A1 (en)* | 2011-10-14 | 2013-04-18 | Samsung Techwin Co., Ltd. | Apparatus and method of storing and searching for image |
| US20130201316A1 (en) | 2012-01-09 | 2013-08-08 | May Patents Ltd. | System and method for server based control |
| US20140358840A1 (en) | 2012-01-13 | 2014-12-04 | Pulse Function F6 Ltd | Apparatus, system and method for risk indicator calculation for driving behaviour and for reconstructing a vehicle trajectory |
| US20130218603A1 (en) | 2012-02-21 | 2013-08-22 | Elwha Llc | Systems and methods for insurance based upon characteristics of a collision detection system |
| US20130335219A1 (en) | 2012-05-07 | 2013-12-19 | Integrated Security Corporation | Intelligent sensor network |
| US20130307682A1 (en) | 2012-05-17 | 2013-11-21 | Honeywell International Inc. | System for advanced security management |
| US20140006060A1 (en) | 2012-06-27 | 2014-01-02 | Hartford Fire Insurance Company | System and method for processing data related to worksite analyses |
| US20140005509A1 (en) | 2012-06-29 | 2014-01-02 | Dexcom, Inc. | Implantable sensor devices, systems, and methods |
| US20140067734A1 (en) | 2012-09-05 | 2014-03-06 | Numenta, Inc. | Anomaly detection in spatial and temporal memory system |
| US20140136242A1 (en) | 2012-11-12 | 2014-05-15 | State Farm Mutual Automobile Insurance Company | Home sensor data gathering for insurance rating purposes |
| US20140132409A1 (en) | 2012-11-15 | 2014-05-15 | Wildfire Defense Systems, Inc. | Wildfire risk assessment |
| WO2014125769A1 (en) | 2013-02-18 | 2014-08-21 | 株式会社デンソー | Vehicle-orientation detection method and vehicle-orientation detection device |
| US20160003629A1 (en) | 2013-02-18 | 2016-01-07 | Denso Corporation | Vehicle trajectory calculation method |
| US20140247137A1 (en) | 2013-03-04 | 2014-09-04 | Hello Inc. | Base charging station for monitoring device |
| US20140266684A1 (en) | 2013-03-14 | 2014-09-18 | Comcast Cable Communications, Llc | Processing sensor data |
| US20150375837A1 (en) | 2013-03-14 | 2015-12-31 | Flir Systems, Inc. | Wind sensor motion compensation systems and methods |
| US20140266592A1 (en) | 2013-03-15 | 2014-09-18 | Digi International Inc. | Network gateway system and method |
| US20140279707A1 (en) | 2013-03-15 | 2014-09-18 | CAA South Central Ontario | System and method for vehicle data analysis |
| US20140278573A1 (en) | 2013-03-15 | 2014-09-18 | State Farm Mutual Automobile Insurance Company | Systems and methods for initiating insurance processing using ingested data |
| US20140277718A1 (en) | 2013-03-15 | 2014-09-18 | Eugene Izhikevich | Adaptive predictor apparatus and methods |
| US10268660B1 (en) | 2013-03-15 | 2019-04-23 | Matan Arazi | Real-time event transcription system and method |
| US20150254330A1 (en) | 2013-04-11 | 2015-09-10 | Oracle International Corporation | Knowledge-intensive data processing system |
| US20140313032A1 (en) | 2013-04-23 | 2014-10-23 | Canary Connect, Inc. | System and methods for notifying a community of security events |
| US20170301030A1 (en) | 2013-05-31 | 2017-10-19 | Oneevent Technologies, Inc. | Notification of the condition of a property |
| US20150154715A1 (en) | 2013-05-31 | 2015-06-04 | OneEvent Technologies, LLC | Sensors for usage-based property insurance |
| US20150019267A1 (en) | 2013-07-11 | 2015-01-15 | Fluor Technology Corporation | Post-disaster assessment systems and methods |
| KR20150007913A (en) | 2013-07-12 | 2015-01-21 | 가부시끼가이샤 도시바 | Failure Prediction Device |
| US20150019266A1 (en) | 2013-07-15 | 2015-01-15 | Advanced Insurance Products & Services, Inc. | Risk assessment using portable devices |
| US20150025917A1 (en) | 2013-07-15 | 2015-01-22 | Advanced Insurance Products & Services, Inc. | System and method for determining an underwriting risk, risk score, or price of insurance using cognitive information |
| US20150022357A1 (en) | 2013-07-16 | 2015-01-22 | Leeo, Inc. | Electronic device with environmental monitoring |
| US11150778B2 (en)* | 2013-08-08 | 2021-10-19 | Honeywell International Inc. | System and method for visualization of history of events using BIM model |
| US20150077737A1 (en) | 2013-08-09 | 2015-03-19 | Cnry Inc. | System and methods for monitoring an environment |
| US20160005130A1 (en) | 2013-08-16 | 2016-01-07 | United Services Automobile Association | Systems and methods for utilizing sensor informatics to determine insurance coverage and recoverable depreciation for personal or business property |
| EP2843636A1 (en) | 2013-08-23 | 2015-03-04 | E.I. Technology Limited | Monitoring and control of alarm systems |
| US20150106927A1 (en) | 2013-10-14 | 2015-04-16 | Ut-Battelle, Llc | Real-time detection and classification of anomalous events in streaming data |
| US20150120336A1 (en) | 2013-10-24 | 2015-04-30 | Tourmaline Labs, Inc. | Systems and methods for collecting and transmitting telematics data from a mobile device |
| US20160275780A1 (en) | 2013-11-26 | 2016-09-22 | 9069569 Canada Inc. | System and method for providing subscribers a secure electronic emergency response portal on a network |
| US20150163121A1 (en) | 2013-12-06 | 2015-06-11 | Lookout, Inc. | Distributed monitoring, evaluation, and response for multiple devices |
| US20150161882A1 (en) | 2013-12-11 | 2015-06-11 | Echostar Technologies, Llc | False alarm identification |
| US20150170505A1 (en)* | 2013-12-17 | 2015-06-18 | At&T Mobility Ii Llc | Method, computer-readable storage device and apparatus for providing a collaborative standalone area monitor |
| US20150207796A1 (en) | 2013-12-27 | 2015-07-23 | Abbott Diabetes Care Inc. | Systems, devices, and methods for authentication in an analyte monitoring environment |
| US20150233718A1 (en) | 2014-02-17 | 2015-08-20 | Tourmaline Labs, Inc. | Systems and methods for estimating movements of a vehicle using a mobile device |
| US20150254972A1 (en) | 2014-03-10 | 2015-09-10 | Tyco Fire & Security Gmbh | False Alarm Avoidance In Security Systems Filtering Low In Network |
| US20170153914A1 (en) | 2014-03-11 | 2017-06-01 | Sas Institute Inc. | Distributed data set task selection |
| US20170228661A1 (en) | 2014-04-17 | 2017-08-10 | Sas Institute Inc. | Systems and methods for machine learning using classifying, clustering, and grouping time series data |
| US9852475B1 (en) | 2014-05-20 | 2017-12-26 | State Farm Mutual Automobile Insurance Company | Accident risk model determination using autonomous vehicle operating data |
| US20180376313A1 (en) | 2014-06-23 | 2018-12-27 | Google Llc | Methods and Apparatus for Using Smart Environment Devices Via Application Program Interfaces |
| US20150378715A1 (en)* | 2014-06-30 | 2015-12-31 | Google Inc. | Systems and methods for updating software in a hazard detection system |
| US20160029966A1 (en) | 2014-07-31 | 2016-02-04 | Sano Intelligence, Inc. | Method and system for processing and analyzing analyte sensor signals |
| US20160050264A1 (en) | 2014-08-13 | 2016-02-18 | Tyco Safety Products Cananda Ltd. | Method and apparatus for automation and alarm architecture |
| US20160048580A1 (en) | 2014-08-14 | 2016-02-18 | Verizon Patent And Licensing Inc. | Method and system for providing delegated classification and learning services |
| US20160072891A1 (en) | 2014-09-08 | 2016-03-10 | Leeo, Inc. | Sensor-data sub-contracting during environmental monitoring |
| US10515372B1 (en) | 2014-10-07 | 2019-12-24 | State Farm Mutual Automobile Insurance Company | Systems and methods for managing building code compliance for a property |
| US20160110833A1 (en) | 2014-10-16 | 2016-04-21 | At&T Mobility Ii Llc | Occupancy Indicator |
| US20160163186A1 (en) | 2014-12-09 | 2016-06-09 | Edison Global Circuits, Llc | Integrated hazard risk management and mitigation system |
| US20160171618A1 (en) | 2014-12-16 | 2016-06-16 | Hartford Fire Insurance Company | Calibrated underwriting system |
| US20160189510A1 (en) | 2014-12-30 | 2016-06-30 | Alarm.Com Incorporated | Digital fingerprint tracking |
| US20170006135A1 (en) | 2015-01-23 | 2017-01-05 | C3, Inc. | Systems, methods, and devices for an enterprise internet-of-things application development platform |
| US20180062877A1 (en) | 2015-03-10 | 2018-03-01 | Elemental Machines, Inc. | Method and Apparatus for Environmental Sensing |
| US20160285904A1 (en) | 2015-03-26 | 2016-09-29 | Tyco Fire & Security Gmbh | Home Network Intrusion Detection and Prevention System and Method |
| US10180339B1 (en)* | 2015-05-08 | 2019-01-15 | Digimarc Corporation | Sensing systems |
| US10650668B2 (en)* | 2015-05-13 | 2020-05-12 | Tyco Safety Products Canada Ltd. | Minimizing false alarms based on identified presence detection |
| US20170299657A1 (en) | 2015-06-04 | 2017-10-19 | Silverback Advanced Motor Monitoring, LLC | System and Method for Monitoring an Electrical Pattern and Pattern Trends in Electrically Driven Systems |
| US20170004226A1 (en) | 2015-07-05 | 2017-01-05 | Sas Institute Inc. | Stress testing by avoiding simulations |
| US20170011465A1 (en) | 2015-07-08 | 2017-01-12 | Here Global B.V. | Method and apparatus for providing fee rate based on safety score |
| US20170061783A1 (en) | 2015-09-01 | 2017-03-02 | Honeywell International Inc. | System and method providing early prediction and forecasting of false alarms by applying statistical inference models |
| US20170091867A1 (en) | 2015-09-30 | 2017-03-30 | Sensormatic Electronics, LLC | Sensor Based System And Method For Determining Allocation Based On Physical Proximity |
| US20170094376A1 (en) | 2015-09-30 | 2017-03-30 | Sensormatic Electronics, LLC | Sensor Packs That Are Configured Based on Business Application |
| WO2017058993A1 (en) | 2015-09-30 | 2017-04-06 | Sensormatic Electronics, LLC | Sensor based system and method for drift analysis to predict equipment failure |
| US20170092108A1 (en) | 2015-09-30 | 2017-03-30 | Sensormatic Electronics, LLC | Sensor Based System And Method For Premises Safety And Operational Profiling Based On Drift Analysis |
| US20170091869A1 (en) | 2015-09-30 | 2017-03-30 | Sensormatic Electronics, LLC | Sensor Based System And Method For Augmenting Underwriting Of Insurance Policies |
| US20170091868A1 (en) | 2015-09-30 | 2017-03-30 | Sensormatic Electronics, LLC | Sensor Based System And Method For Augmenting Insurance Claim Filing |
| US10354332B2 (en) | 2015-09-30 | 2019-07-16 | Sensormatic Electronics, LLC | Sensor based system and method for drift analysis to predict equipment failure |
| US20170091871A1 (en) | 2015-09-30 | 2017-03-30 | Sensormatic Electronics, LLC | System And Method For Determining Risk Profile, Adjusting Insurance Premiums And Automatically Collecting Premiums Based On Sensor Data |
| US20170091870A1 (en) | 2015-09-30 | 2017-03-30 | Sensormatic Electronics, LLC | Sensor Based System And Method For Drift Analysis To Predict Equipment Failure |
| US10296979B2 (en) | 2015-09-30 | 2019-05-21 | Sensormatic Electronics, LLC | Sensor based system and method for augmenting insurance claim filing |
| US20170308802A1 (en) | 2016-04-21 | 2017-10-26 | Arundo Analytics, Inc. | Systems and methods for failure prediction in industrial environments |
| US20170351787A1 (en) | 2016-06-06 | 2017-12-07 | Tyco Integrated Security Llc | Predicting Service for Intrusion and Alarm Systems Based on Signal Activity Patterns |
| US20180095004A1 (en)* | 2016-10-03 | 2018-04-05 | International Business Machines Corporation | Diagnostic fault detection using multivariate statistical pattern library |
| US20180136019A1 (en)* | 2016-11-11 | 2018-05-17 | Chevron U.S.A. Inc. | Fault detection system utilizing dynamic principal components analysis |
| US9996078B1 (en) | 2017-04-07 | 2018-06-12 | Pratt & Whitney Canada Corp. | Pre-emptive fault detection through advanced signal analysis |
| US20210027602A1 (en)* | 2017-12-13 | 2021-01-28 | Alarm.Com Incorporated | Enhanced audiovisual analytics |
| US20190302719A1 (en)* | 2018-03-29 | 2019-10-03 | Saudi Arabian Oil Company | Intelligent Distributed Industrial Facility Safety System |
| US10827951B2 (en)* | 2018-04-19 | 2020-11-10 | Careview Communications, Inc. | Fall detection using sensors in a smart monitoring safety system |
| US11257314B2 (en)* | 2018-08-10 | 2022-02-22 | Scripps Safe, Inc. | Auditable security system for secure enclosures |
| US10325485B1 (en)* | 2018-09-11 | 2019-06-18 | Rockwell Automation Technologies, Inc. | System or process to detect, discriminate, aggregate, track, and rank safety related information in a collaborative workspace |
| US20200158291A1 (en)* | 2018-11-21 | 2020-05-21 | Tongji University | Method for detecting pipe burst in water distribution systems based on pressure disturbance extraction |
| US20200202487A1 (en)* | 2018-12-21 | 2020-06-25 | Here Global B.V. | Method, apparatus, and computer program product for generating an overhead view of an environment from a perspective image |
| US20200221055A1 (en)* | 2019-01-03 | 2020-07-09 | United Technologies Corporation | Systems and methods for compression and recovery of data in additive manufacturing applications |
| US11036981B1 (en)* | 2020-02-26 | 2021-06-15 | Sas Institute Inc. | Data monitoring system |
Non-Patent Citations (48)
| Title |
|---|
| "Unsupervised Hierarchical Modeling of Driving Behavior and Prediction of Contextual Changing Points," IEEE Transactions on Intelligent Transportation Systems, vol. 16, No. 4, Aug. 2015, 35 pages. |
| An overview of concept drift applications—Einhoven University of Technology, The Netherlands by I Zliobaite—2016 URL: https://www.win.tue.nl/˜mpechen/publications/pubs/CD_applications15.pdf. |
| Co-pending application. |
| CSC2515 Fall 2007 Introduction to Machine Learning, Lecture 10: Sequential Data Models, Fall 2007. |
| Datta, Somnath. "Learn More About Unsupervised Learning," Informatics for Materials Science and Engineering, 21 pages, 2013. |
| Fuchs et al: "Fire Monitoring—The Use of Medium Resolution Satellites . . . For Long Time Series Processing . . .", 36th International Symposium on Remote Sensing of Environment, Berlin, Germany, May 11-15, 2015 (Year: 2015). |
| Gaussian process based modeling and experimental design for sensor calibration in drifting environments by Zngyu Geng, Feng Yang, 2015 URL: https://www.ncbi.nlm.nih.gov/pmc/articles/PMC4764506. |
| International Preliminary Report on Patentability on PCT PCT/US2018/036699 dated Dec. 19, 2019, 11 pages. |
| International Preliminary Report on Patentability on PCT/US2016/054311, dated Apr. 3, 2018, 12 pages. |
| International Preliminary Report on Patentability on PCT/US2017/022641, dated Sep. 18, 2018, 12 pages. |
| International Preliminary Report on Patentability on PCT/US2017/030345, dated Nov. 6, 2018, 10 pages. |
| International Preliminary Report on Patentability on PCT/US2017/035091, dated Dec. 20, 2018, 10 pages. |
| International Search Report & Written Opinion on PCT/US2015/019381, dated Jun. 19, 2015, 15 pages. |
| International Search Report & Written Opinion on PCT/US2016/054310, dated Dec. 15, 2016, 13 pages. |
| International Search Report and Written Opinion on PCT/US2016/054310, dated Dec. 15, 2016, 8 pages. |
| International Search Report and Written Opinion on PCT/US2016/054310, dated Dec. 19, 2016, 13 pages. |
| International Search Report and Written Opinion on PCT/US2016/054311, dated Dec. 13, 2016, 12 pages. |
| International Search Report and Written Opinion on PCT/US2016/054311, dated Dec. 13, 2016, 17 pages. |
| International Search Report and Written Opinion on PCT/US2016/054312, dated Dec. 9, 2016, 14 pages. |
| International Search Report and Written Opinion on PCT/US2016/054316, dated Feb. 7, 2017, 10 pages. |
| International Search Report and Written Opinion on PCT/US2016/054320, dated Dec. 19, 2016, 10 pages. |
| International Search Report and Written Opinion on PCT/US2017/022641, dated Apr. 13, 2017, 13 pages. |
| International Search Report and Written Opinion on PCT/US2017/030345, dated Jul. 17, 2017, 10 pages. |
| International search Report and Written Opinion on PCT/US2017/035091, dated Oct. 9, 2017, 10 pages. |
| International Search Report and Written Opinion on PCT/US2017/22641, dated Apr. 13, 2017, 11 pages. |
| International Search Report and Written Opinion on PCT/US2018/036699, dated Oct. 16, 2018, 17 pages. |
| International Search Report and Written Opinion, PCT/US16/54312. |
| International Search Report and Written Opinion, PCT/US16/54317. |
| International Search Report and Written Opinion, PCT/US16/54324. |
| Luo et al., "Ant Colony Based Algorithm to Identify Alarm patterns for Predicting Equipment Failures," IECON 2006—32nd Annual Conference on IEEE Industrial Electronics, Paris, 2006, pp. 5017-5022. |
| Machine learning algorithms for Real Data Sources, Monteleoni, 46 pages, Feb. 2011. |
| Marxer [et al.,] "Unsupervised Incremental Learning and Prediction of Audio Signals," Proceedings of 20th International Symposium on Music Acoustics, 8 pages, Aug. 2010. |
| Office Action for U.S. Appl. No. 14/870,463, dated Jul. 25, 2018, 43 pages. |
| Office Action for U.S. Appl. No. 14/870,493, dated Feb. 8, 2018, 33 pages. |
| Office Action for U.S. Appl. No. 14/870,493, dated Jun. 30, 2017, 26 pages. |
| Office Action for U.S. Appl. No. 14/870,493, dated Sep. 20, 2018, 6 pages. |
| Office Action for U.S. Appl. No. 14/870,621, dated Jul. 20, 2018, 18 pages. |
| Ozawa et al: "Optimized sensor location for estimating story-drift angle for tall buildings subject to earthquakes," Health Monitoring of Structural and Biological Systems, Proc. of SPIE vol. 9805, 98052P, 2016, 8 pages. |
| Rosenberg, Jerry M. Dictionary of Computers, Information Processing, and Telecommunications, 2 ed., John Wiley & Sons, 2 pages, 1990. |
| Roush, C., "The Weather Has Home Insurers Running Scared," Businessweek, Bloomburg, New York, Apr. 5, 1993, No. 3313, p. 30 (4 pages total). |
| Search Report on EP 17767496.7, dated Oct. 13, 2021, 7 pages. |
| Search Report on EP 18752639.7, dated Oct. 15, 2021, 6 pages. |
| Statistical Learning Algorithms Applied to Automobile Insurance Ratemaking by Dugas et al., 60 pages. |
| Supplementary European Search Report on EP 17767496.7, dated Oct. 25, 2019, 8 pages. |
| Taniguchi [et al.,] "Semiotic Prediction of Driving Behavior using Unsupervised Double Articulation Analyzer," 2012 Intelligent Vehicles Symposium, 6 pages, Jun. 2012. |
| Turner, Don J., "High-value homeowner policies: a risk manager's dilemma," Canadian Insurance/Agent & Broker, Toronto, Aug. 1992, pp. 10 and 36. |
| Unsupervised Learning by Ghahramani, 32 pages, Sep. 2004. |
| Weaver, P., "Your Homeowner's Coverage May be Less Than You Need," Nation's Business, Feb. 1993, p. 61. |
Cited By (3)
| Publication number | Priority date | Publication date | Assignee | Title |
|---|---|---|---|---|
| US11605286B1 (en)* | 2021-10-22 | 2023-03-14 | X Development Llc | Alert generation algorithm for tracking devices |
| US20230186752A1 (en)* | 2021-10-22 | 2023-06-15 | X Development Llc | Alert generation algorithm for tracking devices |
| US11830345B2 (en)* | 2021-10-22 | 2023-11-28 | X Development Llc | Alert generation algorithm for tracking devices |
Also Published As
| Publication number | Publication date |
|---|---|
| US20170092108A1 (en) | 2017-03-30 |
| WO2017058997A1 (en) | 2017-04-06 |
Similar Documents
| Publication | Publication Date | Title |
|---|---|---|
| US20220076347A1 (en) | Systems and methods for detecting a drift state | |
| US20210217097A1 (en) | Sensor based system and method for augmenting underwriting of insurance policies | |
| US11068994B2 (en) | Sensor based system and method for augmenting insurance claim filing | |
| US10354332B2 (en) | Sensor based system and method for drift analysis to predict equipment failure | |
| US11436911B2 (en) | Sensor based system and method for premises safety and operational profiling based on drift analysis | |
| US10425702B2 (en) | Sensor packs that are configured based on business application | |
| US11250516B2 (en) | Method and apparatus for evaluating risk based on sensor monitoring | |
| US20170091867A1 (en) | Sensor Based System And Method For Determining Allocation Based On Physical Proximity | |
| US10810676B2 (en) | Method and apparatus for increasing the density of data surrounding an event | |
| US10359771B2 (en) | Prediction of false alarms in sensor-based security systems | |
| US11532006B1 (en) | Determining and initiating insurance claim events | |
| US12062278B2 (en) | Building security system with false alarm reduction recommendations and automated self-healing for false alarm reduction | |
| US11037420B2 (en) | Method and apparatus for tiered analytics in a multi-sensor environment |
Legal Events
| Date | Code | Title | Description |
|---|---|---|---|
| AS | Assignment | Owner name:SENSORMATIC ELECTRONICS, LLC, MASSACHUSETTS Free format text:ASSIGNMENT OF ASSIGNORS INTEREST;ASSIGNORS:TRAINOR, CHRISTINE;VAVRASEK, DAVID;SIGNING DATES FROM 20150929 TO 20150930;REEL/FRAME:036742/0995 | |
| STPP | Information on status: patent application and granting procedure in general | Free format text:NON FINAL ACTION MAILED | |
| STPP | Information on status: patent application and granting procedure in general | Free format text:RESPONSE TO NON-FINAL OFFICE ACTION ENTERED AND FORWARDED TO EXAMINER | |
| STPP | Information on status: patent application and granting procedure in general | Free format text:FINAL REJECTION MAILED | |
| STPP | Information on status: patent application and granting procedure in general | Free format text:DOCKETED NEW CASE - READY FOR EXAMINATION | |
| STPP | Information on status: patent application and granting procedure in general | Free format text:NON FINAL ACTION MAILED | |
| STPP | Information on status: patent application and granting procedure in general | Free format text:FINAL REJECTION MAILED | |
| STPP | Information on status: patent application and granting procedure in general | Free format text:RESPONSE AFTER FINAL ACTION FORWARDED TO EXAMINER | |
| STPP | Information on status: patent application and granting procedure in general | Free format text:ADVISORY ACTION MAILED | |
| STPP | Information on status: patent application and granting procedure in general | Free format text:DOCKETED NEW CASE - READY FOR EXAMINATION | |
| STPP | Information on status: patent application and granting procedure in general | Free format text:NON FINAL ACTION MAILED | |
| AS | Assignment | Owner name:JOHNSON CONTROLS TYCO IP HOLDINGS LLP, WISCONSIN Free format text:ASSIGNMENT OF ASSIGNORS INTEREST;ASSIGNOR:JOHNSON CONTROLS INC;REEL/FRAME:058600/0126 Effective date:20210617 Owner name:JOHNSON CONTROLS INC, WISCONSIN Free format text:ASSIGNMENT OF ASSIGNORS INTEREST;ASSIGNOR:JOHNSON CONTROLS US HOLDINGS LLC;REEL/FRAME:058600/0080 Effective date:20210617 Owner name:JOHNSON CONTROLS US HOLDINGS LLC, WISCONSIN Free format text:ASSIGNMENT OF ASSIGNORS INTEREST;ASSIGNOR:SENSORMATIC ELECTRONICS LLC;REEL/FRAME:058600/0001 Effective date:20210617 | |
| STPP | Information on status: patent application and granting procedure in general | Free format text:RESPONSE TO NON-FINAL OFFICE ACTION ENTERED AND FORWARDED TO EXAMINER | |
| AS | Assignment | Owner name:JOHNSON CONTROLS US HOLDINGS LLC, WISCONSIN Free format text:NUNC PRO TUNC ASSIGNMENT;ASSIGNOR:SENSORMATIC ELECTRONICS, LLC;REEL/FRAME:058957/0138 Effective date:20210806 Owner name:JOHNSON CONTROLS TYCO IP HOLDINGS LLP, WISCONSIN Free format text:NUNC PRO TUNC ASSIGNMENT;ASSIGNOR:JOHNSON CONTROLS, INC.;REEL/FRAME:058955/0472 Effective date:20210806 Owner name:JOHNSON CONTROLS, INC., WISCONSIN Free format text:NUNC PRO TUNC ASSIGNMENT;ASSIGNOR:JOHNSON CONTROLS US HOLDINGS LLC;REEL/FRAME:058955/0394 Effective date:20210806 | |
| STPP | Information on status: patent application and granting procedure in general | Free format text:NOTICE OF ALLOWANCE MAILED -- APPLICATION RECEIVED IN OFFICE OF PUBLICATIONS | |
| STPP | Information on status: patent application and granting procedure in general | Free format text:PUBLICATIONS -- ISSUE FEE PAYMENT VERIFIED | |
| STCF | Information on status: patent grant | Free format text:PATENTED CASE |