US11270066B2 - Temporary formatting and charting of selected data - Google Patents
Temporary formatting and charting of selected dataDownload PDFInfo
- Publication number
- US11270066B2 US11270066B2US12/770,992US77099210AUS11270066B2US 11270066 B2US11270066 B2US 11270066B2US 77099210 AUS77099210 AUS 77099210AUS 11270066 B2US11270066 B2US 11270066B2
- Authority
- US
- United States
- Prior art keywords
- chart
- data
- charts
- user
- selection
- Prior art date
- Legal status (The legal status is an assumption and is not a legal conclusion. Google has not performed a legal analysis and makes no representation as to the accuracy of the status listed.)
- Active, expires
Links
Images


Classifications
- G—PHYSICS
- G06—COMPUTING OR CALCULATING; COUNTING
- G06F—ELECTRIC DIGITAL DATA PROCESSING
- G06F17/00—Digital computing or data processing equipment or methods, specially adapted for specific functions
- G—PHYSICS
- G06—COMPUTING OR CALCULATING; COUNTING
- G06F—ELECTRIC DIGITAL DATA PROCESSING
- G06F40/00—Handling natural language data
- G06F40/10—Text processing
- G06F40/166—Editing, e.g. inserting or deleting
- G06F40/177—Editing, e.g. inserting or deleting of tables; using ruled lines
- G06F40/18—Editing, e.g. inserting or deleting of tables; using ruled lines of spreadsheets
- G—PHYSICS
- G06—COMPUTING OR CALCULATING; COUNTING
- G06F—ELECTRIC DIGITAL DATA PROCESSING
- G06F3/00—Input arrangements for transferring data to be processed into a form capable of being handled by the computer; Output arrangements for transferring data from processing unit to output unit, e.g. interface arrangements
- G06F3/01—Input arrangements or combined input and output arrangements for interaction between user and computer
- G06F3/048—Interaction techniques based on graphical user interfaces [GUI]
- G06F3/0481—Interaction techniques based on graphical user interfaces [GUI] based on specific properties of the displayed interaction object or a metaphor-based environment, e.g. interaction with desktop elements like windows or icons, or assisted by a cursor's changing behaviour or appearance
- G06F3/0482—Interaction with lists of selectable items, e.g. menus
- G—PHYSICS
- G06—COMPUTING OR CALCULATING; COUNTING
- G06F—ELECTRIC DIGITAL DATA PROCESSING
- G06F3/00—Input arrangements for transferring data to be processed into a form capable of being handled by the computer; Output arrangements for transferring data from processing unit to output unit, e.g. interface arrangements
- G06F3/01—Input arrangements or combined input and output arrangements for interaction between user and computer
- G06F3/048—Interaction techniques based on graphical user interfaces [GUI]
- G06F3/0484—Interaction techniques based on graphical user interfaces [GUI] for the control of specific functions or operations, e.g. selecting or manipulating an object, an image or a displayed text element, setting a parameter value or selecting a range
- G—PHYSICS
- G06—COMPUTING OR CALCULATING; COUNTING
- G06F—ELECTRIC DIGITAL DATA PROCESSING
- G06F3/00—Input arrangements for transferring data to be processed into a form capable of being handled by the computer; Output arrangements for transferring data from processing unit to output unit, e.g. interface arrangements
- G06F3/14—Digital output to display device ; Cooperation and interconnection of the display device with other functional units
Definitions
- Selected datais temporarily formatted and charted to assist a user in visualizing the selected data without the user having to manually create the display of the charted data.
- a usermay interact with the visual formatting and charts to gain additional information.
- the chartmay be formatted differently, reference lines may be added, the chart may be sorted, the type of chart(s) displayed may be changed, the user may graphically navigate over the chart to obtain more detailed information, and the like.
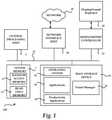
- FIG. 1illustrates a computer architecture for a computer
- FIG. 2shows an example temporary formatting and charting system
- FIGS. 3-5show exemplary user interfaces and displays for temporarily formatting and charting selected data
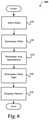
- FIG. 6illustrates a process for temporarily charting selected data
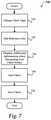
- FIG. 7shows a process for formatting temporarily displayed charts.
- FIG. 1and the corresponding discussion are intended to provide a brief, general description of a suitable computing environment in which embodiments may be implemented.
- program modulesinclude routines, programs, components, data structures, and other types of structures that perform particular tasks or implement particular abstract data types.
- Other computer system configurationsmay also be used, including multiprocessor systems, microprocessor-based or programmable consumer electronics, minicomputers, mainframe computers, and the like.
- Distributed computing environmentsmay also be used where tasks are performed by remote processing devices that are linked through a communications network.
- program modulesmay be located in both local and remote memory storage devices.
- the computer architecture shown in FIG. 1may be configured as a desktop, a server, or mobile computer and includes a central processing unit 5 (“CPU”), a system memory 7 , including a random access memory 9 (“RAM”) and a read-only memory (“ROM”) 11 , and a system bus 12 that couples the memory to the CPU 5 .
- CPUcentral processing unit
- RAMrandom access memory
- ROMread-only memory
- the computer 100further includes a mass storage device 14 for storing an operating system 16 , application programs, and other program modules, which will be described in greater detail below.
- the mass storage device 14is connected to the CPU 5 through a mass storage controller (not shown) connected to the bus 12 .
- the mass storage device 14 and its associated computer-readable mediaprovide non-volatile storage for the computer 100 .
- computer-readable mediacan be any available media that can be accessed by the computer 100 .
- Computer-readable mediamay comprise computer storage mediums and communication media.
- Computer storage mediumsincludes volatile and non-volatile, removable and non-removable media implemented in any method or technology for storage of information such as computer-readable instructions, data structures, program modules or other data.
- Computer storage mediaincludes, but is not limited to, RAM, ROM, EPROM, EEPROM, flash memory or other solid state memory technology, CD-ROM, digital versatile disks (“DVD”), or other optical storage, magnetic cassettes, magnetic tape, magnetic disk storage or other magnetic storage devices, or any other medium which can be used to store the desired information and which can be accessed by the computer 100 .
- computer 100operates in a networked environment using logical connections to remote computers through a network 18 , such as the Internet.
- the computer 100may connect to the network 18 through a network interface unit 20 connected to the bus 12 .
- the network connectionmay be wireless and/or wired.
- the network interface unit 20may also be utilized to connect to other types of networks and remote computer systems.
- the computer 100may also include an input/output controller 22 for receiving and processing input from a number of other devices, including a keyboard, mouse, or electronic stylus (not shown in FIG. 1 ).
- an input/output controller 22may provide output to a display screen that includes a user interface 28 , a printer, or other type of output device.
- User interface (UI) 28is designed to provide a user with a visual way to interact with productivity application 24 that incorporates a temporary display of automatically formatted charts(s), as well as to interact with other functionality that is included on computing device 100 .
- a number of program modules and data filesmay be stored in the mass storage device 14 and RAM 9 of the computer 100 , including an operating system 16 suitable for controlling the operation of a networked computer, such as the WINDOWS 7® operating system from MICROSOFT CORPORATION of Redmond, Wash.
- the mass storage device 14 and RAM 9may also store one or more program modules.
- the mass storage device 14 and the RAM 9may store one or more application programs.
- One of the application programsis a productivity application 24 , such as one of the MICROSOFT EXCEL® or one of the other MICROSOFT OFFICE® programs.
- productivity application 24is an application that a user utilizes when viewing and interacting with a block of data, such as within a spreadsheet and/or a table.
- Productivity application 24is an application such as a spreadsheet program, a database program, a word-processing program, a presentation program and the like.
- Visual manager 26is configured to automatically temporarily format and chart selected data to assist a user in viewing and understanding the selected data. Since the charting is automatically performed on the charted data, the user does not have to manually create the display of the charted data. Once the temporary formatting and charting is automatically applied to the selected data, the user may interact with the visual formatting and charts to gain additional information. For example, the chart may be formatted differently, reference lines may be added, the chart may be sorted, the type of chart(s) displayed may be changed, the user may navigate over the chart to obtain more detailed information, and the like. Once the user has completed interacting with the temporarily formatted and created chart(s) they are removed from the display 28 .
- FIG. 2shows an example temporary formatting and charting system.
- system 200includes display 28 , visual manager 26 , input 205 , productivity application 24 , data store 240 , and other applications 230 .
- Visual manager 26may be implemented within presentation application 24 as shown in FIG. 2 or may be implemented externally from application 24 as shown in FIG. 1 .
- callback code 210may be implemented.
- the visual manager 26may query for additional information used in temporarily formatting and charting data selected from within productivity application 24 .
- visual manager 26may request to be informed when a user selects data, selects a user interface element that is associated with one of the temporarily displayed charts and/or move and navigates over a displayed chart.
- Other informationmay also be provided that relate to the features of the application.
- visual manager 26is configured to automatically format and create charts from data that is selected within productivity application 24 such that the selected data may be understood in a graphical manner.
- Display 28is configured to provide the user with a visual display of the temporarily formatted and displayed chart(s) based on the selected data (See FIGS. 3-5 for exemplary displays).
- Input 205is configured to receive input from one or more input sources, such as a keyboard, mouse, a touch screen, and/or some other input device.
- the inputmay be a mouse movement over a displayed chart, a selection of data, a selection of a menu item, hovering over an item, and the like.
- Data store 240is configured to store data relating to productivity application 24 .
- data store 240may be used to store the data that is displayed within the rows and columns of a spreadsheet.
- Visual manager 26may also coupled to other applications 230 such that data to be temporarily formatted and charted may be received from the other applications.
- visual manager 26may be coupled to another productivity application and/or a networking site that provides data that is used in temporarily formatting and creating charts.
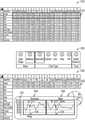
- FIGS. 3-5show exemplary user interfaces and displays for temporarily formatting and charting selected data.
- display 310shows a spreadsheet containing rows and columns of data.
- the datamay be provided by a variety of sources.
- the datamay be obtained from a database, a file, another application, a live data source, and the like.
- a userwould like to temporarily format and view data from the data source they enter a temporary charting mode and select the data they would like to be temporarily formatted and charted.
- the userhas selected the women's row and the men's row of data ( 315 ).
- the usermay select as much data as they wish to view in a chart.
- the usermay select a single row, two rows, three rows, and the like.
- the usermay also select as few or as many columns as they desire to view. For example, the user may select only a portion of the columns presented within the data.
- the usermay enter the temporary chart view in a variety of manners.
- the userselects the selection option and the automatic option shown in user interface 320 .
- Other user interfacesmay be used to enter the mode.
- the usercould right click to bring up a context menu, select a menu option from a toolbar or menu, and the like.
- the chartmay be automatically displayed upon the selection of data without first selecting a temporary charting option.
- a selection of datadisplays the selected data in a chart form.
- display 330shows chart 334 that displays a chart for the values in the selected women's row and chart 336 that displays a chart for the values in the selected men's row.
- a separate chartis created for each row of data that is selected.
- a single chartis created using the data.
- the chart typewas set to be automatically selected based on the selected data.
- Many different types of chartsmay be displayed, such as, but not limited too: column; line; area; and pie charts.
- charts 334 and 336share a common axis ( 337 ) such that the charts may be easily compared.
- each chartis individually created such that each axis depends on the data within its selected row.
- the userhas moved over point 338 on line chart 334 .
- a graphical representation of the corresponding value in the selected datais displayed.
- point 338corresponds to the May value in the Women's row which is $7,071.
- a corresponding graphical displayis provided in the other displayed charts at the corresponding location to point 338 .
- point 338 in chart 334corresponds to point 339 in chart 336 .
- the value for point 339is $7,027 which is the May value from the Men's row.
- a differencemay also be graphically shown such that a direct comparison between the values of the charts may be readily determined. In the present example, the difference is $44 (7,071-7,027).
- More formatting of the datamay be provided to assist the user in visualizing the data. For example, different colors may be used within the display, different values may be highlighted within the data, some data may be hidden from view, and the like.
- display 330it can be seen that the rows of data that are not selected are hidden from view while the charts are temporarily displayed. According to another embodiment, the charts that are temporarily displayed may be presented in one or more different windows from the display of the data.
- FIG. 4shows exemplary displays that illustrate different charting and formatting options.
- Display 410shows a display of a bar chart 412 for a women's row and a bar chart 414 for a men's row of data ( 416 ).
- the type of chartmay be preconfigured, automatically selected based on the selected data ( 416 ) and/or changed from a default chart type. For example, a user may use a user interface such as user interface 320 that is displayed in FIG. 3 to select the chart type.
- Display 420shows a reference line 422 that is added to the display of the charts 412 and 414 .
- the reference lineis set to a value of $8,000.
- the reference line 422spans across the displayed charts.
- values that fall below the reference line 422are formatted differently from the values that are at or above the reference line 422 .
- the values below the reference linemay be colored/shaded differently from the values that fall at or above the reference line.
- values above the reference lineare illustrated darker than the values at or below the reference line.
- the displayed values within data 424may also be formatted based on the reference line 422 that is created.
- Display 430illustrates selecting a value in a displayed chart.
- a userhas selected point 432 .
- a usermay select a point in different manners. For example, a user may navigate and hover over a point, click on the point, and the like.
- Point 432corresponds to the December value for the women's row of data.
- the additional displayed informationincludes the value for the point as well as the difference between the point and the reference line.
- the corresponding pointis highlighted on the display of the other charts (in this case chart 414 ) and a corresponding display of information is presented.
- the value for the men's December valueis presented along with the difference between the value and the reference line.
- Other informationmay also be included in the display. For example, a comparison could be made between the men's and women's data values and/or different formatting applied to the value that is larger/smaller then the selected point.
- FIG. 5illustrates a display of a bar chart in which the displayed charts have been sorted.
- display 510shows a display of a men's chart 512 and a display of a women's chart 514 .
- a usermay sort the displayed charts based on various criteria. For example, in the current example, the charts displayed in FIG. 4 were sorted based on the chart title resulting in the display of the men's chart 512 to the left of the display of the women's chart 514 .
- Spin control 516is a control that may be used to sort the display of the charts. Other controls and/or user interfaces may also be used to control the sorting of the charts. Generally, spin control 516 is configured such that a user may cycle through a variety of options by selecting one of the displayed arrows on spin control 516 .
- the chartscould be sorted based on downward trends, upward trends, chart title, low to high values, high to low values, average values, and the like.
- the selected optionis illustrated within the display of spin control 516 .
- the current option selectedis “Chart Title.”
- FIGS. 6-7illustrative processes for temporarily formatting and charting selected data is described.
- FIG. 6illustrates a process 600 for temporarily charting selected data.
- the processflows to operation 610 , where data to be temporarily formatted and charted is selected.
- data to be temporarily formatted and chartedis selected.
- a usermay select as much or as little data to view within a chart as desired. For example, a user may select one or more full or partial rows of data.
- the chart title and axis informationis determined from the selected data.
- the data selecteddoes not include the title information for the selected rows and/or columns
- the datais traversed until the corresponding title for the row/column is obtained.
- row datamay be traversed from the right to the left until the title column for the row is reached.
- each of the selected rowsis traversed until the Women's title (Women) is obtained and the Men's title (Men) is obtained.
- each columnmay be traversed to determine the title for each column.
- the datamay be traversed until a title for the column is determined.
- the column titlesare the selected months (i.e. January-December). While the column titles may not be initially displayed in the charts, this information may be used when a point is selected within a displayed chart (e.g. see point 338 in FIG. 3 ).
- each displayed chartshares a common axis.
- the shared axisis determined from the range of the selected values.
- the chart type to displayis determined.
- the chart typemay be predetermined or the chart type may be determined based on a variety of factors such as: the number of values selected; the type of data selected; a range of values selected, and the like.
- the chart typemay also be selected by a user. For example, a user may select an option to enter the temporary charting mode and select the type of chart that they would like to display when data is selected.
- the chart(s)are displayed.
- a separate chartis displayed for each row of data that is selected. For example, when one row is selected a single chart is displayed and when five rows are selected, five charts are displayed.
- a single chartmay be used to display the selected data.
- the data for each rowmay be visually formatted to distinguish the values from one row of selected data from another row of selected data.
- the chartsmay be displayed within the same window as the selected data or one or more different windows. For example, the charts may be displayed in a pop-up window over the displayed data.
- the data that is not selectedis not displayed when the charts are displayed.
- the unselected datais displayed during the display of the charts.
- the selected datamay be formatted to further provide visual differences to the user.
- the processthen flows to an end operation and returns to processing other actions.
- FIG. 7shows a process 700 for formatting temporarily displayed charts.
- the processflows to operation 710 , where the chart type is changed for the temporarily displayed charts.
- the chart type that is displayedmay be different types of charts.
- the chart typemay be a line chart, an area chart, a column chart, a pie chart, and the like.
- the usermay also switch the rows/columns.
- each of the displayed chartsis displayed using the selected type of chart.
- each chart that is displayedmay be of a different type.
- one or more reference linesis added to the display of the charts.
- the reference linespans across each of the displayed charts and provides a user with a visualization of how the values within the displayed chart compare to the reference value.
- the formatting of the values within the chartare determined based on whether the currently displayed value is above or below the reference line. For example, the values above the reference line are formatted in one manner (i.e. a first shade) and values below the reference line are formatted in a different manner (i.e. a second shade).
- the values between the two reference linesmay be displayed in a third manner (i.e. a third shade).
- the values within the selected datamay also be changed.
- additional informationis displayed to a user in response to navigating over points of the displayed charts. For example, as the user navigates over the chart, the current value of the navigated point may be displayed. According to one embodiment, the corresponding values in the other charts are also displayed. When a reference line is displayed, the current value of the navigated point may also be compared to the reference line.
- different sorting optionsmay also be selected by a user.
- the chartscould be sorted based on downward trends, upward trends, chart title, low to high values, high to low values, average values, and the like.
- one or more of the chartsmay be saved for later display.
- the chartsmay be saved as a group or each chart may be individually selected for saving.
- the chartsmay be saved in many different ways. For example, the charts may be saved using a copy operation and saved to a clipboard, the charts may be saved as an image file, and the like.
- the processthen flows to an end operation and returns to processing other actions.
Landscapes
- Engineering & Computer Science (AREA)
- Theoretical Computer Science (AREA)
- General Engineering & Computer Science (AREA)
- Physics & Mathematics (AREA)
- General Physics & Mathematics (AREA)
- Human Computer Interaction (AREA)
- General Health & Medical Sciences (AREA)
- Health & Medical Sciences (AREA)
- Computational Linguistics (AREA)
- Audiology, Speech & Language Pathology (AREA)
- Artificial Intelligence (AREA)
- Data Mining & Analysis (AREA)
- Databases & Information Systems (AREA)
- Mathematical Physics (AREA)
- Software Systems (AREA)
- User Interface Of Digital Computer (AREA)
- Information Retrieval, Db Structures And Fs Structures Therefor (AREA)
- Document Processing Apparatus (AREA)
- Digital Computer Display Output (AREA)
- Signal Processing For Digital Recording And Reproducing (AREA)
- Financial Or Insurance-Related Operations Such As Payment And Settlement (AREA)
- Processing Or Creating Images (AREA)
- Investigating Or Analysing Biological Materials (AREA)
Abstract
Description
Claims (11)
Priority Applications (30)
| Application Number | Priority Date | Filing Date | Title |
|---|---|---|---|
| US12/770,992US11270066B2 (en) | 2010-04-30 | 2010-04-30 | Temporary formatting and charting of selected data |
| US12/771,422US9367198B2 (en) | 2010-04-30 | 2010-04-30 | Spin control user interface for selecting options |
| TW100110806ATWI531953B (en) | 2010-04-30 | 2011-03-29 | Temporary formatting and charting of selected data |
| CN201180021493.1ACN102870106B (en) | 2010-04-30 | 2011-04-13 | The interim of selected data formats and draws |
| PCT/US2011/032383WO2011136932A1 (en) | 2010-04-30 | 2011-04-13 | Temporary formatting and charting of selected data |
| MX2012012420AMX2012012420A (en) | 2010-04-30 | 2011-04-13 | Temporary formatting and charting of selected data. |
| AU2011245657AAU2011245657B2 (en) | 2010-04-30 | 2011-04-13 | Temporary formatting and charting of selected data |
| NZ603049ANZ603049A (en) | 2010-04-30 | 2011-04-13 | Temporary formatting and charting of selected data |
| CA2795183ACA2795183C (en) | 2010-04-30 | 2011-04-13 | Temporary formatting and charting of selected data |
| EP11775430.9AEP2564325B1 (en) | 2010-04-30 | 2011-04-13 | Temporary formatting and charting of selected data |
| SG2012073755ASG184806A1 (en) | 2010-04-30 | 2011-04-13 | Temporary formatting and charting of selected data |
| KR1020127028253AKR101794373B1 (en) | 2010-04-30 | 2011-04-13 | Temporary formatting and charting of selected data |
| RU2012146096ARU2607980C2 (en) | 2010-04-30 | 2011-04-13 | Temporary formatting and charting of selected data |
| MYPI2012004395AMY166722A (en) | 2010-04-30 | 2011-04-13 | Temporary formatting and charting of selected data |
| JP2013507996AJP6018045B2 (en) | 2010-04-30 | 2011-04-13 | Temporary formatting and graphing of selected data |
| CA2795367ACA2795367C (en) | 2010-04-30 | 2011-04-25 | Spin control user interface for selecting options |
| AU2011245430AAU2011245430B2 (en) | 2010-04-30 | 2011-04-25 | Spin control user interface for selecting options |
| KR1020127028267AKR101811464B1 (en) | 2010-04-30 | 2011-04-25 | Spin control user interface for selecting options |
| PCT/US2011/033804WO2011137079A2 (en) | 2010-04-30 | 2011-04-25 | Spin control user interface for selecting options |
| SG10201503311TASG10201503311TA (en) | 2010-04-30 | 2011-04-25 | Spin control user interface for selecting options |
| JP2013508129AJP5792287B2 (en) | 2010-04-30 | 2011-04-25 | Spin control user interface for selecting options |
| EP11775487.9AEP2564299B1 (en) | 2010-04-30 | 2011-04-25 | Spin control user interface for selecting options |
| SG2012073797ASG184807A1 (en) | 2010-04-30 | 2011-04-25 | Spin control user interface for selecting options |
| CN2011800214946ACN102859482A (en) | 2010-04-30 | 2011-04-25 | Spin control user interface for selecting options |
| ARP110101496AAR080990A1 (en) | 2010-04-30 | 2011-04-29 | LEGIBLE STORAGE MEANS BY COMPUTER, METHOD AND SYSTEM FOR TEMPORARY FORMAT AND GRAPHIC REPRESENTATION OF SELECTED DATA |
| IL222259AIL222259A (en) | 2010-04-30 | 2012-10-09 | Temporary formatting and charting of selected data |
| IL222260AIL222260A (en) | 2010-04-30 | 2012-10-09 | Spin control user interface for selecting options |
| CL2012003002ACL2012003002A1 (en) | 2010-04-30 | 2012-10-26 | Method for formatting and diagramming data temporarily comprising receiving a selection of data, determining the values within the selected data and presenting a diagram temporarily representing the values from the selected data, where the diagram is created and presented automatic way upon receiving the selection of data; storage medium and associated system |
| CO12215867ACO6592043A2 (en) | 2010-04-30 | 2012-11-28 | Temporary formatting and graphing of selected data |
| US15/180,934US11385786B2 (en) | 2010-04-30 | 2016-06-13 | Spin control user interface for selecting options |
Applications Claiming Priority (1)
| Application Number | Priority Date | Filing Date | Title |
|---|---|---|---|
| US12/770,992US11270066B2 (en) | 2010-04-30 | 2010-04-30 | Temporary formatting and charting of selected data |
Related Child Applications (1)
| Application Number | Title | Priority Date | Filing Date |
|---|---|---|---|
| US12/771,422Continuation-In-PartUS9367198B2 (en) | 2010-04-30 | 2010-04-30 | Spin control user interface for selecting options |
Publications (2)
| Publication Number | Publication Date |
|---|---|
| US20110271172A1 US20110271172A1 (en) | 2011-11-03 |
| US11270066B2true US11270066B2 (en) | 2022-03-08 |
Family
ID=44859285
Family Applications (1)
| Application Number | Title | Priority Date | Filing Date |
|---|---|---|---|
| US12/770,992Active2032-04-09US11270066B2 (en) | 2010-04-30 | 2010-04-30 | Temporary formatting and charting of selected data |
Country Status (18)
| Country | Link |
|---|---|
| US (1) | US11270066B2 (en) |
| EP (1) | EP2564325B1 (en) |
| JP (1) | JP6018045B2 (en) |
| KR (1) | KR101794373B1 (en) |
| CN (1) | CN102870106B (en) |
| AR (1) | AR080990A1 (en) |
| AU (1) | AU2011245657B2 (en) |
| CA (1) | CA2795183C (en) |
| CL (1) | CL2012003002A1 (en) |
| CO (1) | CO6592043A2 (en) |
| IL (1) | IL222259A (en) |
| MX (1) | MX2012012420A (en) |
| MY (1) | MY166722A (en) |
| NZ (1) | NZ603049A (en) |
| RU (1) | RU2607980C2 (en) |
| SG (1) | SG184806A1 (en) |
| TW (1) | TWI531953B (en) |
| WO (1) | WO2011136932A1 (en) |
Families Citing this family (24)
| Publication number | Priority date | Publication date | Assignee | Title |
|---|---|---|---|---|
| US9041730B2 (en) | 2010-02-12 | 2015-05-26 | Dexcom, Inc. | Receivers for analyzing and displaying sensor data |
| US9367198B2 (en) | 2010-04-30 | 2016-06-14 | Microsoft Technology Licensing, Llc | Spin control user interface for selecting options |
| US9633110B2 (en)* | 2011-11-15 | 2017-04-25 | Microsoft Technology Licensing, Llc | Enrichment of data using a semantic auto-discovery of reference and visual data |
| US9552557B2 (en)* | 2012-02-16 | 2017-01-24 | Microsoft Technology Licensing, Llc | Visual representation of chart scaling |
| JP6340169B2 (en)* | 2012-07-26 | 2018-06-06 | ピーアンドダブリューソリューションズ株式会社 | Display control apparatus, display control method, and program |
| CN103970978B (en)* | 2013-02-06 | 2018-07-31 | 华为技术有限公司 | A kind of method and apparatus that business quality data is handled |
| JP2014215690A (en)* | 2013-04-23 | 2014-11-17 | 日本電信電話株式会社 | Measurement data management device, method, and program |
| US9026897B2 (en) | 2013-07-12 | 2015-05-05 | Logic9S, Llc | Integrated, configurable, sensitivity, analytical, temporal, visual electronic plan system |
| US9183650B2 (en) | 2013-07-24 | 2015-11-10 | Microsoft Technology Licensing, Llc | Data point calculations on a chart |
| US10831356B2 (en)* | 2014-02-10 | 2020-11-10 | International Business Machines Corporation | Controlling visualization of data by a dashboard widget |
| JP6327445B2 (en)* | 2014-03-13 | 2018-05-23 | カシオ計算機株式会社 | Data analysis apparatus, data analysis method, and data analysis program |
| CN106033495B (en)* | 2015-03-13 | 2019-11-26 | 腾讯科技(深圳)有限公司 | A kind of processing method and processing device of human body physiological characteristics data |
| US10025980B2 (en) | 2015-12-29 | 2018-07-17 | International Business Machines Corporation | Assisting people with understanding charts |
| US20180150981A1 (en)* | 2016-11-29 | 2018-05-31 | Sap Se | Dynamic Micro Chart |
| US10147159B2 (en)* | 2017-04-07 | 2018-12-04 | Microsoft Technology Licensing, Llc | Ink render using high priority queues |
| US10726252B2 (en) | 2017-05-17 | 2020-07-28 | Tab2Ex Llc | Method of digitizing and extracting meaning from graphic objects |
| US10785337B2 (en)* | 2017-06-29 | 2020-09-22 | Microsoft Technology Licensing, Llc | Analytics and data visualization through file attachments |
| CN109213823A (en)* | 2018-09-13 | 2019-01-15 | 广东创我科技发展有限公司 | A kind of method and device of the type intelligent sequencing chart based on chart classification axis |
| WO2020059025A1 (en)* | 2018-09-18 | 2020-03-26 | 日本電気株式会社 | Data analysis support device, data analysis support method, and computer-readable recording medium |
| US11055358B1 (en)* | 2020-05-16 | 2021-07-06 | TADA Cognitive Solutions, LLC | Smart interactions for a digital duplicate |
| CN113505170A (en)* | 2021-06-30 | 2021-10-15 | 永中软件股份有限公司 | Graph display method, computer device, and computer-readable medium |
| JP7644683B2 (en)* | 2021-08-20 | 2025-03-12 | 株式会社日立製作所 | Data analysis support device and data analysis support method |
| CN113885770B (en)* | 2021-10-27 | 2024-02-02 | 北京字跳网络技术有限公司 | Table data display method and device, electronic equipment and storage medium |
| CN116243828A (en)* | 2023-02-02 | 2023-06-09 | 深圳市万翼数字技术有限公司 | Temporary display object management method, device, equipment and storage medium |
Citations (71)
| Publication number | Priority date | Publication date | Assignee | Title |
|---|---|---|---|---|
| JPS515485A (en) | 1974-07-02 | 1976-01-17 | Tokyo Shibaura Electric Co | |
| JPH033089A (en) | 1989-05-31 | 1991-01-09 | Meidensha Corp | Method for recognizing pattern |
| JPH03225572A (en) | 1990-01-31 | 1991-10-04 | Pfu Ltd | Graph forming processor |
| US5461708A (en)* | 1993-08-06 | 1995-10-24 | Borland International, Inc. | Systems and methods for automated graphing of spreadsheet information |
| US5548703A (en) | 1993-11-30 | 1996-08-20 | International Business Machines Corporation | Navigation within a compound graphical object in a graphical user interface |
| JPH08227348A (en) | 1991-02-18 | 1996-09-03 | Pfu Ltd | Spreadsheet display |
| JPH09153101A (en) | 1995-11-29 | 1997-06-10 | Hitachi Ltd | Data analysis method by the displayed graph |
| US5706448A (en) | 1992-12-18 | 1998-01-06 | International Business Machines Corporation | Method and system for manipulating data through a graphic user interface within a data processing system |
| US5745717A (en) | 1995-06-07 | 1998-04-28 | Vayda; Mark | Graphical menu providing simultaneous multiple command selection |
| US5940076A (en) | 1997-12-01 | 1999-08-17 | Motorola, Inc. | Graphical user interface for an electronic device and method therefor |
| US5999193A (en) | 1996-01-25 | 1999-12-07 | Direct Business Technologies, Inc. | Method and system for generating color indicia coded bar graphs which usually convey comparisons with threshold values and for generating comparator lines for use with such bar graphs |
| US6028600A (en) | 1997-06-02 | 2000-02-22 | Sony Corporation | Rotary menu wheel interface |
| US6223189B1 (en)* | 1997-12-31 | 2001-04-24 | International Business Machines Corporation | System and method using metalanguage keywords to generate charts |
| JP2001188805A (en) | 1999-12-28 | 2001-07-10 | Sony Corp | Device, method and system for processing information and program storage medium |
| JP2001357344A (en) | 2000-06-13 | 2001-12-26 | Hitachi Ltd | Data visualization support system |
| US6337698B1 (en) | 1998-11-20 | 2002-01-08 | Microsoft Corporation | Pen-based interface for a notepad computer |
| CN1335951A (en) | 1999-08-28 | 2002-02-13 | 皇家菲利浦电子有限公司 | Menu Display of the Graphical User Interface |
| US20020122072A1 (en) | 1999-04-09 | 2002-09-05 | Edwin J. Selker | Pie menu graphical user interface |
| US6448987B1 (en) | 1998-04-03 | 2002-09-10 | Intertainer, Inc. | Graphic user interface for a digital content delivery system using circular menus |
| US6480194B1 (en) | 1996-11-12 | 2002-11-12 | Silicon Graphics, Inc. | Computer-related method, system, and program product for controlling data visualization in external dimension(s) |
| US20020194095A1 (en)* | 2000-11-29 | 2002-12-19 | Dov Koren | Scaleable, flexible, interactive real-time display method and apparatus |
| JP2003016226A (en) | 2001-07-03 | 2003-01-17 | Ricoh Co Ltd | Product market quality information analysis support device, product market quality information analysis support system, and product market quality information analysis support program |
| US6515682B1 (en) | 1996-05-09 | 2003-02-04 | National Instruments Corporation | System and method for editing a control utilizing a preview window to view changes made to the control |
| US20030154443A1 (en) | 2002-02-13 | 2003-08-14 | Ncr Corporation | Visual discovery tool |
| US20030169295A1 (en) | 2002-03-07 | 2003-09-11 | Becerra Santiago E. | Method and system for creating graphical and interactive representations of input and output data |
| JP3515485B2 (en) | 1999-05-27 | 2004-04-05 | インターナショナル・ビジネス・マシーンズ・コーポレーション | System and method for controlling dynamic display of data relationships between static charts on a display using thresholds |
| US20040143485A1 (en)* | 2002-09-18 | 2004-07-22 | Naples Mike V. | Methods, systems, and computer readable media containing instructions for evaluating the return on direct mail marketing and for evaluating shipping services |
| US20040212617A1 (en) | 2003-01-08 | 2004-10-28 | George Fitzmaurice | User interface having a placement and layout suitable for pen-based computers |
| US6920608B1 (en)* | 1999-05-21 | 2005-07-19 | E Numerate Solutions, Inc. | Chart view for reusable data markup language |
| JP2005258548A (en) | 2004-03-09 | 2005-09-22 | Matsushita Electric Ind Co Ltd | Graph information management apparatus and graph information management method |
| JP2005269243A (en) | 2004-03-18 | 2005-09-29 | Matsushita Electric Ind Co Ltd | Electronic device and icon display control method |
| US7002580B1 (en) | 2003-05-14 | 2006-02-21 | At&T Corp | Method and apparatus for automatically generating charts |
| US20060059414A1 (en) | 2004-09-15 | 2006-03-16 | Microsoft Corporation | Common charting using shapes |
| US7036090B1 (en) | 2001-09-24 | 2006-04-25 | Digeo, Inc. | Concentric polygonal menus for a graphical user interface |
| CN1794220A (en) | 2004-12-20 | 2006-06-28 | 微软公司 | Method, system, and computer-readable medium for the layout of automatically placed elements |
| WO2006108159A2 (en) | 2005-04-05 | 2006-10-12 | Lehman Brothers Inc. | Systems and methods for order analysis, enrichment, and execution |
| TW200636551A (en) | 2004-12-03 | 2006-10-16 | Motorola Inc | Portable electronic device having user interactive visual interface |
| TW200704121A (en) | 2005-05-27 | 2007-01-16 | Nokia Corp | Improved mobile communications terminal and method therefor |
| US20070063995A1 (en) | 2005-09-22 | 2007-03-22 | Bailey Eric A | Graphical user interface for use with a multi-media system |
| US20070083547A1 (en) | 2005-08-01 | 2007-04-12 | Thomas Schnauffer | Method and device for automatically representing data filed in data areas |
| US7210107B2 (en) | 2003-06-27 | 2007-04-24 | Microsoft Corporation | Menus whose geometry is bounded by two radii and an arc |
| US20070101255A1 (en) | 2005-11-02 | 2007-05-03 | Microsoft Corporation | Chart element variations |
| JP2007140625A (en) | 2005-11-15 | 2007-06-07 | Omron Corp | Production management device, production management system, production management method, control program and recording medium |
| RU2005140146A (en) | 2005-01-24 | 2007-07-20 | Майкрософт Корпорейшн (Us) | ACCESS TO DATA AND ORGANIZATION OF DATA BY THE DIAGRAMS |
| US20070260970A1 (en) | 2002-10-24 | 2007-11-08 | Dorwart Richard W | System and method for creating a graphical presentation |
| US20080082908A1 (en)* | 2006-09-29 | 2008-04-03 | Business Objects, S.A. | Apparatus and method for data charting with adaptive learning |
| US20080115049A1 (en) | 2006-11-14 | 2008-05-15 | Microsoft Corporation | Dynamically generating mini-graphs to represent style and template icons |
| CN101253494A (en) | 2005-08-30 | 2008-08-27 | 微软公司 | Customizable Spreadsheet Styles |
| US20080222569A1 (en) | 2007-03-08 | 2008-09-11 | International Business Machines Corporation | Method, Apparatus and Program Storage Device For Providing Customizable, Immediate and Radiating Menus For Accessing Applications and Actions |
| US20080229245A1 (en) | 2007-03-15 | 2008-09-18 | Ulerich Rhys D | Multiple Sorting of Columns in a Displayed Table in a User Interactive Computer Display Interface Through Sequential Radial Menus |
| US20080250349A1 (en) | 2007-04-05 | 2008-10-09 | Hewlett-Packard Development Company, L.P. | Graphical user interface |
| US20090007015A1 (en) | 2007-06-29 | 2009-01-01 | Microsoft Corporation | Segment ring menu |
| TW200905490A (en) | 2007-07-26 | 2009-02-01 | Chii Ying Co Ltd | Method of graphic representation, method of charting numerical data, method of generating graphs representing numerical data and storage media storing software program of executing the same |
| US20090037813A1 (en) | 2007-07-31 | 2009-02-05 | Palo Alto Research Center Incorporated | Space-constrained marking menus for mobile devices |
| KR20090018927A (en) | 2006-06-01 | 2009-02-24 | 마이크로소프트 코포레이션 | How to format charts, systems for modifying charts, and computer-readable media |
| US20090079731A1 (en) | 2007-09-26 | 2009-03-26 | Autodesk, Inc. | Navigation system for a 3d virtual scene |
| US7516419B2 (en) | 2003-11-27 | 2009-04-07 | Sony Corproation | Information retrieval device |
| TW200928950A (en) | 2007-09-24 | 2009-07-01 | Yahoo Inc | User-defined media annotations on dynamic charts |
| US20090313537A1 (en) | 2008-06-17 | 2009-12-17 | Microsoft Corporation | Micro browser spreadsheet viewer |
| US20090327963A1 (en) | 2008-06-28 | 2009-12-31 | Mouilleseaux Jean-Pierre M | Radial menu selection |
| KR20100016487A (en) | 2007-05-24 | 2010-02-12 | 마이크로소프트 코포레이션 | Data visualization |
| US20100057693A1 (en)* | 2008-09-04 | 2010-03-04 | At&T Intellectual Property I, L.P. | Software development test case management |
| CN101689179A (en) | 2007-06-29 | 2010-03-31 | 微软公司 | Task-specific spreadsheet worksheets |
| US20100182264A1 (en) | 2007-09-10 | 2010-07-22 | Vanilla Breeze Co. Ltd. | Mobile Device Equipped With Touch Screen |
| US20100185985A1 (en) | 2009-01-19 | 2010-07-22 | International Business Machines Corporation | Managing radial menus in a computer system |
| US20100214243A1 (en) | 2008-07-15 | 2010-08-26 | Immersion Corporation | Systems and Methods For Interpreting Physical Interactions With A Graphical User Interface |
| US20110055771A1 (en)* | 2009-09-01 | 2011-03-03 | Oracle International Corporation | Method and system for providing user interface representing organization hierarchy |
| US20110095993A1 (en) | 2009-10-26 | 2011-04-28 | Adobe Systems Incorporated | Zoom adjustment process |
| US8402391B1 (en) | 2008-09-25 | 2013-03-19 | Apple, Inc. | Collaboration system |
| JP5397574B1 (en) | 2013-03-15 | 2014-01-22 | 三菱電機株式会社 | Terminal structure, terminal structure of circuit breaker and terminal selection method |
| US20160357425A1 (en) | 2010-04-30 | 2016-12-08 | Microsoft Technology Licensing, Llc | Spin control user interface for selecting options |
- 2010
- 2010-04-30USUS12/770,992patent/US11270066B2/enactiveActive
- 2011
- 2011-03-29TWTW100110806Apatent/TWI531953B/ennot_activeIP Right Cessation
- 2011-04-13MXMX2012012420Apatent/MX2012012420A/enactiveIP Right Grant
- 2011-04-13MYMYPI2012004395Apatent/MY166722A/enunknown
- 2011-04-13SGSG2012073755Apatent/SG184806A1/enunknown
- 2011-04-13CNCN201180021493.1Apatent/CN102870106B/enactiveActive
- 2011-04-13NZNZ603049Apatent/NZ603049A/ennot_activeIP Right Cessation
- 2011-04-13CACA2795183Apatent/CA2795183C/enactiveActive
- 2011-04-13EPEP11775430.9Apatent/EP2564325B1/enactiveActive
- 2011-04-13RURU2012146096Apatent/RU2607980C2/ennot_activeIP Right Cessation
- 2011-04-13KRKR1020127028253Apatent/KR101794373B1/ennot_activeExpired - Fee Related
- 2011-04-13JPJP2013507996Apatent/JP6018045B2/ennot_activeExpired - Fee Related
- 2011-04-13AUAU2011245657Apatent/AU2011245657B2/enactiveActive
- 2011-04-13WOPCT/US2011/032383patent/WO2011136932A1/enactiveApplication Filing
- 2011-04-29ARARP110101496Apatent/AR080990A1/enactiveIP Right Grant
- 2012
- 2012-10-09ILIL222259Apatent/IL222259A/enactiveIP Right Grant
- 2012-10-26CLCL2012003002Apatent/CL2012003002A1/enunknown
- 2012-11-28COCO12215867Apatent/CO6592043A2/enactiveIP Right Grant
Patent Citations (78)
| Publication number | Priority date | Publication date | Assignee | Title |
|---|---|---|---|---|
| JPS515485A (en) | 1974-07-02 | 1976-01-17 | Tokyo Shibaura Electric Co | |
| JPH033089A (en) | 1989-05-31 | 1991-01-09 | Meidensha Corp | Method for recognizing pattern |
| JPH03225572A (en) | 1990-01-31 | 1991-10-04 | Pfu Ltd | Graph forming processor |
| JPH08227348A (en) | 1991-02-18 | 1996-09-03 | Pfu Ltd | Spreadsheet display |
| US5706448A (en) | 1992-12-18 | 1998-01-06 | International Business Machines Corporation | Method and system for manipulating data through a graphic user interface within a data processing system |
| US5461708A (en)* | 1993-08-06 | 1995-10-24 | Borland International, Inc. | Systems and methods for automated graphing of spreadsheet information |
| US5548703A (en) | 1993-11-30 | 1996-08-20 | International Business Machines Corporation | Navigation within a compound graphical object in a graphical user interface |
| US5745717A (en) | 1995-06-07 | 1998-04-28 | Vayda; Mark | Graphical menu providing simultaneous multiple command selection |
| JPH09153101A (en) | 1995-11-29 | 1997-06-10 | Hitachi Ltd | Data analysis method by the displayed graph |
| US5999193A (en) | 1996-01-25 | 1999-12-07 | Direct Business Technologies, Inc. | Method and system for generating color indicia coded bar graphs which usually convey comparisons with threshold values and for generating comparator lines for use with such bar graphs |
| US6515682B1 (en) | 1996-05-09 | 2003-02-04 | National Instruments Corporation | System and method for editing a control utilizing a preview window to view changes made to the control |
| US6480194B1 (en) | 1996-11-12 | 2002-11-12 | Silicon Graphics, Inc. | Computer-related method, system, and program product for controlling data visualization in external dimension(s) |
| US6028600A (en) | 1997-06-02 | 2000-02-22 | Sony Corporation | Rotary menu wheel interface |
| US5940076A (en) | 1997-12-01 | 1999-08-17 | Motorola, Inc. | Graphical user interface for an electronic device and method therefor |
| US6223189B1 (en)* | 1997-12-31 | 2001-04-24 | International Business Machines Corporation | System and method using metalanguage keywords to generate charts |
| US6448987B1 (en) | 1998-04-03 | 2002-09-10 | Intertainer, Inc. | Graphic user interface for a digital content delivery system using circular menus |
| US6337698B1 (en) | 1998-11-20 | 2002-01-08 | Microsoft Corporation | Pen-based interface for a notepad computer |
| US20020122072A1 (en) | 1999-04-09 | 2002-09-05 | Edwin J. Selker | Pie menu graphical user interface |
| US6920608B1 (en)* | 1999-05-21 | 2005-07-19 | E Numerate Solutions, Inc. | Chart view for reusable data markup language |
| US20050198042A1 (en) | 1999-05-21 | 2005-09-08 | E-Numerate Solutions, Inc. | Chart view for reusable data markup language |
| JP3515485B2 (en) | 1999-05-27 | 2004-04-05 | インターナショナル・ビジネス・マシーンズ・コーポレーション | System and method for controlling dynamic display of data relationships between static charts on a display using thresholds |
| CN1335951A (en) | 1999-08-28 | 2002-02-13 | 皇家菲利浦电子有限公司 | Menu Display of the Graphical User Interface |
| JP2001188805A (en) | 1999-12-28 | 2001-07-10 | Sony Corp | Device, method and system for processing information and program storage medium |
| JP2001357344A (en) | 2000-06-13 | 2001-12-26 | Hitachi Ltd | Data visualization support system |
| US20020194095A1 (en)* | 2000-11-29 | 2002-12-19 | Dov Koren | Scaleable, flexible, interactive real-time display method and apparatus |
| JP2003016226A (en) | 2001-07-03 | 2003-01-17 | Ricoh Co Ltd | Product market quality information analysis support device, product market quality information analysis support system, and product market quality information analysis support program |
| US7036090B1 (en) | 2001-09-24 | 2006-04-25 | Digeo, Inc. | Concentric polygonal menus for a graphical user interface |
| US20030154443A1 (en) | 2002-02-13 | 2003-08-14 | Ncr Corporation | Visual discovery tool |
| US20030169295A1 (en) | 2002-03-07 | 2003-09-11 | Becerra Santiago E. | Method and system for creating graphical and interactive representations of input and output data |
| US20040143485A1 (en)* | 2002-09-18 | 2004-07-22 | Naples Mike V. | Methods, systems, and computer readable media containing instructions for evaluating the return on direct mail marketing and for evaluating shipping services |
| US20070260970A1 (en) | 2002-10-24 | 2007-11-08 | Dorwart Richard W | System and method for creating a graphical presentation |
| US20040212617A1 (en) | 2003-01-08 | 2004-10-28 | George Fitzmaurice | User interface having a placement and layout suitable for pen-based computers |
| US7002580B1 (en) | 2003-05-14 | 2006-02-21 | At&T Corp | Method and apparatus for automatically generating charts |
| US7210107B2 (en) | 2003-06-27 | 2007-04-24 | Microsoft Corporation | Menus whose geometry is bounded by two radii and an arc |
| US7516419B2 (en) | 2003-11-27 | 2009-04-07 | Sony Corproation | Information retrieval device |
| JP2005258548A (en) | 2004-03-09 | 2005-09-22 | Matsushita Electric Ind Co Ltd | Graph information management apparatus and graph information management method |
| JP2005269243A (en) | 2004-03-18 | 2005-09-29 | Matsushita Electric Ind Co Ltd | Electronic device and icon display control method |
| US20060059414A1 (en) | 2004-09-15 | 2006-03-16 | Microsoft Corporation | Common charting using shapes |
| TW200636551A (en) | 2004-12-03 | 2006-10-16 | Motorola Inc | Portable electronic device having user interactive visual interface |
| CN1794220A (en) | 2004-12-20 | 2006-06-28 | 微软公司 | Method, system, and computer-readable medium for the layout of automatically placed elements |
| US7548925B2 (en) | 2005-01-24 | 2009-06-16 | Microsoft Corporation | Diagrammatic access and arrangement of data |
| RU2005140146A (en) | 2005-01-24 | 2007-07-20 | Майкрософт Корпорейшн (Us) | ACCESS TO DATA AND ORGANIZATION OF DATA BY THE DIAGRAMS |
| JP2008535125A (en) | 2005-04-05 | 2008-08-28 | リーマン・ブラザーズ・インコーポレーテッド | System and method for order analysis, enhancement and execution |
| WO2006108159A2 (en) | 2005-04-05 | 2006-10-12 | Lehman Brothers Inc. | Systems and methods for order analysis, enrichment, and execution |
| TW200704121A (en) | 2005-05-27 | 2007-01-16 | Nokia Corp | Improved mobile communications terminal and method therefor |
| US20070083547A1 (en) | 2005-08-01 | 2007-04-12 | Thomas Schnauffer | Method and device for automatically representing data filed in data areas |
| CN101253494A (en) | 2005-08-30 | 2008-08-27 | 微软公司 | Customizable Spreadsheet Styles |
| US20070063995A1 (en) | 2005-09-22 | 2007-03-22 | Bailey Eric A | Graphical user interface for use with a multi-media system |
| US20070101255A1 (en) | 2005-11-02 | 2007-05-03 | Microsoft Corporation | Chart element variations |
| CN101300571A (en) | 2005-11-02 | 2008-11-05 | 微软公司 | Chart element variations |
| JP2007140625A (en) | 2005-11-15 | 2007-06-07 | Omron Corp | Production management device, production management system, production management method, control program and recording medium |
| KR20090018927A (en) | 2006-06-01 | 2009-02-24 | 마이크로소프트 코포레이션 | How to format charts, systems for modifying charts, and computer-readable media |
| US8605090B2 (en) | 2006-06-01 | 2013-12-10 | Microsoft Corporation | Modifying and formatting a chart using pictorially provided chart elements |
| US20080082908A1 (en)* | 2006-09-29 | 2008-04-03 | Business Objects, S.A. | Apparatus and method for data charting with adaptive learning |
| US20080115049A1 (en) | 2006-11-14 | 2008-05-15 | Microsoft Corporation | Dynamically generating mini-graphs to represent style and template icons |
| US20080222569A1 (en) | 2007-03-08 | 2008-09-11 | International Business Machines Corporation | Method, Apparatus and Program Storage Device For Providing Customizable, Immediate and Radiating Menus For Accessing Applications and Actions |
| US8352881B2 (en) | 2007-03-08 | 2013-01-08 | International Business Machines Corporation | Method, apparatus and program storage device for providing customizable, immediate and radiating menus for accessing applications and actions |
| US20080229245A1 (en) | 2007-03-15 | 2008-09-18 | Ulerich Rhys D | Multiple Sorting of Columns in a Displayed Table in a User Interactive Computer Display Interface Through Sequential Radial Menus |
| US20080250349A1 (en) | 2007-04-05 | 2008-10-09 | Hewlett-Packard Development Company, L.P. | Graphical user interface |
| KR20100016487A (en) | 2007-05-24 | 2010-02-12 | 마이크로소프트 코포레이션 | Data visualization |
| US20090007015A1 (en) | 2007-06-29 | 2009-01-01 | Microsoft Corporation | Segment ring menu |
| CN101689179A (en) | 2007-06-29 | 2010-03-31 | 微软公司 | Task-specific spreadsheet worksheets |
| TW200905490A (en) | 2007-07-26 | 2009-02-01 | Chii Ying Co Ltd | Method of graphic representation, method of charting numerical data, method of generating graphs representing numerical data and storage media storing software program of executing the same |
| US20090037813A1 (en) | 2007-07-31 | 2009-02-05 | Palo Alto Research Center Incorporated | Space-constrained marking menus for mobile devices |
| US20100182264A1 (en) | 2007-09-10 | 2010-07-22 | Vanilla Breeze Co. Ltd. | Mobile Device Equipped With Touch Screen |
| TW200928950A (en) | 2007-09-24 | 2009-07-01 | Yahoo Inc | User-defined media annotations on dynamic charts |
| US20090079731A1 (en) | 2007-09-26 | 2009-03-26 | Autodesk, Inc. | Navigation system for a 3d virtual scene |
| US20090313537A1 (en) | 2008-06-17 | 2009-12-17 | Microsoft Corporation | Micro browser spreadsheet viewer |
| US20090327963A1 (en) | 2008-06-28 | 2009-12-31 | Mouilleseaux Jean-Pierre M | Radial menu selection |
| US20100214243A1 (en) | 2008-07-15 | 2010-08-26 | Immersion Corporation | Systems and Methods For Interpreting Physical Interactions With A Graphical User Interface |
| US20100057693A1 (en)* | 2008-09-04 | 2010-03-04 | At&T Intellectual Property I, L.P. | Software development test case management |
| US8402391B1 (en) | 2008-09-25 | 2013-03-19 | Apple, Inc. | Collaboration system |
| US20100185985A1 (en) | 2009-01-19 | 2010-07-22 | International Business Machines Corporation | Managing radial menus in a computer system |
| US20110055771A1 (en)* | 2009-09-01 | 2011-03-03 | Oracle International Corporation | Method and system for providing user interface representing organization hierarchy |
| US20110095993A1 (en) | 2009-10-26 | 2011-04-28 | Adobe Systems Incorporated | Zoom adjustment process |
| US20160357425A1 (en) | 2010-04-30 | 2016-12-08 | Microsoft Technology Licensing, Llc | Spin control user interface for selecting options |
| JP5397574B1 (en) | 2013-03-15 | 2014-01-22 | 三菱電機株式会社 | Terminal structure, terminal structure of circuit breaker and terminal selection method |
| WO2014141323A1 (en) | 2013-03-15 | 2014-09-18 | 三菱電機株式会社 | Terminal structure, terminal structure for circuit breaker, and method for selecting terminal |
Non-Patent Citations (105)
| Title |
|---|
| "Add a Horizontal Line to a Column or Line Chart: Error Bar Method", Retrieved From: https://web.archive.org/web/20100202074134/http://peltiertech.com/Excel/Charts/AddLineHorzErrBar.html, Retrieved on: Feb. 2, 2020, 6 Pages. |
| "Change chart colors based on value?", mrexcel.com forums, May 21, 2007, http://www.mrexcel.com/forum/excel-questions/262749-change-chart-colors-based-value.html.* |
| "Chart View"; accessed on Feb. 25, 2010 at http://help.creator.zoho.com/chart-view.html; 4 pgs. |
| "Final Office Action Issued in U.S. Appl. No. 15/180,934", dated Jul. 19, 2019, 21 Pages. |
| "Final Office Action Issued in U.S. Appl. No. 15/180,934", dated Sep. 20, 2018, 21 Pages. |
| "Final Office Action Received in China Patent Application No. 201180021494.6", dated Mar. 6, 2014. Filed Date: Apr. 25, 2011, 6 Pages. |
| "First Office Action and Search Report Issued in Chinese Patent Application No. 201180021493.1", dated Oct. 27, 2014, 14 Pages. |
| "First Office Action Received in Australia Patent Application No. 2011245430", dated Feb. 14, 2014, Filed Date: Apr. 25, 2011, 2 Pages. |
| "Further Examination Report issued in New Zealand Patent Application No. 603049", dated Sep. 30, 2013, 2 Pages. |
| "Non Final Office Action Issued in U.S. Appl. No. 15/180,934", dated Jan. 7, 2019, 18 Pages. |
| "Notice of Allowance Issued in Russian Patent Application No. 2012146096", dated Sep. 7, 2016, 16 Pages. |
| "Office Action Issued in Australia Patent Application No. 2011245657", dated Apr. 16, 2014, 3 Pages. |
| "Office Action Issued in Australia Patent Application No. 2011245657", dated Aug. 26, 2014, 5 Pages. |
| "Office Action Issued in Australia Patent Application No. 2011245657", dated Feb. 26, 2014, 3 Pages. |
| "Office Action Issued in Canada Patent Application No. 2,795,367", dated May 15, 2019, 4 Pages. |
| "Office Action Issued in Canadian Patent Application No. 2,795,367", dated Oct. 22, 2018, 4 Pages. |
| "Office Action Issued in Canadian Patent Application No. 2795183", dated Jul. 14, 2017, 3 Pages. |
| "Office Action issued in Chile Patent Application No. 201203002", dated Mar. 20, 2015, 5 Pages. (w/o English Translation). |
| "Office Action Issued in Colombia Patent Application No. 12-215867", dated Apr. 28, 2014, 6 Pages. |
| "Office Action Issued in European Patent Application No. 11775430.9", dated Jan. 16, 2020, 5 Pages. |
| "Office Action Issued in European Patent Application No. 11775430.9", dated Mar. 5, 2019, 05 Pages. |
| "Office Action Issued in Indian Patent Application No. 8602/CHENP/2012", dated Apr. 30, 2019, 7 Pages. |
| "Office Action Issued in Indian Patent Application No. 8738/CHENP/2012", dated Jun. 26, 2019, 6 Pages. |
| "Office Action issued In Japan Patent Application No. 2013-508129", dated Mar. 3, 2015, 4 Pages. |
| "Office Action issued in Japanese Patent Application No. 2013-507996", dated Feb. 24, 2015, 12 Pages. |
| "Office Action Issued in Malaysian Patent Application No. PI2012004395", dated Jul. 14, 2017, 4 Pages. |
| "Office Action Issued in Taiwan Patent Application No. 100110806", dated Sep. 1, 2015, 10 Pages. |
| "Office Action Issued in Thailand Patent Application No. 1201005632", dated Jun. 4, 2020, 3 Pages. |
| "Office Action Issued in Thailand Patent Application No. 1201005632", dated Sep. 3, 2019, 3 Pages. |
| "Office Action Received for Russian Patent Application No. 2012146096", dated Apr. 2, 2015, 6 Pages. (w/o English Translation). |
| "Office Action Received for Taiwan Patent Application No. 100109576", dated Jun. 3, 2015, 11 Pages. |
| "Second Office Action Received for China Patent Application No. 201180021493 1", dated Jun. 11, 2015, 11 Pages. |
| "Third Office Action and Search Report Issued in Chinese Patent Application No. 201180021494.6", dated Mar. 17, 2015, 12 Pages. |
| Abe, Kaori, "Hitome De Wakaru Excel 2013", 1st Edition, Nikkei Business Publications, Inc., Feb. 12, 2013, pp. 138 and 139 (with English Translation). |
| Amazon, "Wordperfect Office X4 Standard", online since at least Apr. 16, 2008, Amazon.com, 4 pages. (Used to diclose Corel WordPerfect Office X4/Quattro Pro X4 was available to the public since Apr. 16, 2008).* |
| Amendment filed Apr. 3, 2013, in U.S. Appl. No. 12/771,422. |
| Amendment filed Jul. 19, 2012, in U.S. Appl. No. 12/771,422. |
| Amendment filed Jun. 16, 2014, in U.S. Appl. No. 12/771,422. |
| Amendment filed Mar. 10, 2015, in U.S. Appl. No. 12/771,422. |
| Amendment filed Nov. 19, 2013, in U.S. Appl. No. 12/771,422. |
| Australia Notice of Allowance Issued in Australia Patent Application No. 2011245657, dated Oct. 24, 2014, 2 Pages. |
| Australia Notice of allowance Received in Patent Application No. 2011245430, dated May 2, 2014, 2 Pages. |
| Cahill, C.; "Silverlight Chart Data-Point Markers and Mouse Events"; Nov. 19, 2009; http://www.componentart.com/community/blogs/corey/archive/2009/11/19/silverlight-chart-data-point-markers-on-mouse-hover.aspx; 5 pgs. |
| Cameron, A. Colin., "Excel 2007 Charts: Column Bar, Pie and Line", Available at: http://cameron.econ.ucdavis.edu/excel/ex12charts.html, Jan. 2009, 10 Pages. |
| Canada Office Action Issued in Patent Application No. 2795183 dated Dec. 29, 2016, 4 Pages. |
| Canada Office Action Issued in Patent Application No. 2795367 dated Feb. 9, 2017, 6 Pages. |
| Chinese Fifth Office Action Issued in Patent Application No. 201180021494.6, dated Dec. 25, 2015, 7 Pages. |
| Chinese Fourth Office Action for Application No. 201180021494.6 dated Aug. 4, 2015. |
| Chinese Notice of Allownace in Chinese Patent Application No. 201180021493.1, dated Apr. 7, 2016 with English translation. 4 Pages. |
| Chinese Office Action Issued in Patent Application No. 201180021494.6, dated Feb. 20, 2017, with English translation 7 Pages. |
| Chinese Office Action Issued in Patent Application No. 201180021494.6, dated May 17, 2016, with English translation 8 Pages. |
| Chinese Third Office Action Issued in Chinese Patent Application No. 201180021493.1, dated Dec. 21, 2015, 12 Pages. |
| Corel, "Quattro Pro X4", copyrighted 1996-2009, Corel Corp., 2 Screenshots (SS1-2)(2 pages total).* |
| Davis, Y.; "Google Docs: Creating Charts in Spreadsheets"; Bright Hub!; Jun. 18, 2009; http://www.brighthub.com/internet/google/articles/5747.aspx; 2 pgs. |
| Elaine Marmel, Absolute Beginner's Guide to Quattro Pro® X3, Feb. 8, 2006, Que, Chapter 11, "Creating a Chart".* |
| Extended European Search Report in Patent Application No. 11775430.9, dated Dec. 11, 2017, 7 Pages. |
| Extended European Search Report in Patent Application No. 11775487.9, dated Dec. 11, 2017, 7 Pages. |
| Harvey, Greg , "Hiding Graphic Objects in Excel 2007". 2 pages http://www.dummies.com/software/microsoft-office/excel/hiding-graphic-objects-in-excel-2007/ (Year: 2007).* |
| Harvey, Greg "Microsoft Office Excel 2007 for Dummies", 405 pages (Year: 2007).* |
| International Search Report dated Feb. 17, 2012, issued in PCT/US2011/033804. |
| International Search Report dated Sep. 28, 2011, in PCT/US2011/032383. |
| Israel Office Action Issued in Patent Application No. 222259, dated May 22, 2016, with English translation. 3 Pages. |
| Japanese Notice of Allowance for Application No. 2013-508129—dated Jul. 7, 2015. |
| Japanese Office Action Issued in Japanese Patent Application No. 2013-507996, dated Jan. 20, 2016, 6 Pages. |
| Josh Wilson, "Excel 2003: Charting, Learning Guide", Tufts University ITS, May 4, 2006 http://ase.tufts.edu/its/trainDocuments/excel03Charting.pdf.* |
| Korean Office Action Issued in Patent Application No. 10-2012-7028253, dated Dec. 21, 2016, 8 Pages. |
| Korean Office Action Issued in Patent Application No. 10-2012-7028267, dated Mar. 17, 2017. with English Translation. 14 pages. |
| Microsoft; "Microsoft Office Online—Microsoft Office Excel—Change the format of chart elements"; accessed on Feb. 25, 2010, at http://office.microsoft.com/en-us/excel/HA101534471033,aspx; 5 pgs. |
| Mitchell, S.; "Using Microsoft's Chart Controls in an ASP.NET Application: Serializing Chart Data"; http://www.4guysfromrolla.com/articles/021010-1.aspx; 7 pgs. |
| New Zealand Notice of Allowance dated Jan. 22, 2015, in New Zealand Patent Appl. No. 603049.1 page. |
| Notice of Allowance dated May 7, 2015, in related Mexican Patent Appl. No. MX/a/2012/012420 with English Translation, 2 pages. |
| Notice of Allowance issued in related Japanese Patent Application No. 2013-507996, dated Aug. 31, 2016, 4 Pages, with English Translation. |
| Notice of Allowance Issued in related Korean Patent Application No. 10-2012-7028253, dated Jul. 31, 2017, 4 Pages, with English Translation. |
| Notice of Allowance Issued in related Malaysian Patent Application No. PI2012004395,dated May 15, 2018, 2 Pages, with English Translation. |
| Office Action dated Apr. 11, 2012, issued in U.S. Appl. No. 12/771,422. |
| Office Action dated Apr. 25, 2013, in Chinese Patent Appl. No. 201180021494.6, w/translation. |
| Office Action dated Aug. 29, 2013, in Columbia Patent Appl. No. 12-215867, w/summary. |
| Office Action dated Dec. 16, 2013, issued in U.S. Appl. No. 12/771,422. |
| Office Action dated Jul. 2, 2015, issued in U.S. Appl. No. 12/771,422. |
| Office Action dated Jul. 9, 2013, in New Zealand Patent Appl. No. 603049. |
| Office Action dated Jun. 6, 2013, issued in U.S. Appl. No. 12/771,422. |
| Office Action dated Nov. 14, 2014, issued in U.S. Appl. No. 12/771,422. |
| Office Action dated Oct. 17, 2013, in Chinese Patent Appl. No. 201180021494.6, w/translation. |
| Office Action dated Oct. 3, 2012, issued in U.S. Appl. No. 12/771,422. |
| Office Action dated Sep. 30, 2013, in New Zealand Patent Appl. No. 603049. |
| Office Action Issued in related Argentina Patent Application No. P110101497, dated Mar. 26, 2018, 9 Pages, with English Translation. |
| Office Action Issued in related Canadian Patent Application No. 2,795,367, dated Jan. 10, 2018, 5 Pages. |
| Office Action Issued in related Canadian Patent Application No. 2795183, dated May 23, 2018, 4 Pages. |
| Office Action Issued in related Israel Patent Application No. 222259, dated Aug. 30, 2015, 4 Pages, with English Translation. |
| Office Action Issued in related Korean Patent Application No. 10-2012-7028253, dated Dec. 21, 2016, 8 Pages, with English Translation. |
| Office Action Issued in related Korean Patent Application No. 10-2012-7028267, dated Mar. 17, 2017, 14 pages, with English Translation. |
| Office Action Issued in related Russian Patent Application No. 2012146096, dated Dec. 16, 2015, 8 Pages, with English Translation. |
| Officelabs, Chart Advisor, [video] retrieved from http://www.youtube.com/watch?v=kNGOQMzBu3l on Sep. 9, 2013, screenshots and transcript created Sep. 9, 2013, video published Aug. 28, 2008.* |
| Oppenheimer, Diego, "Chart Advisor", Published on: Sep. 25, 2008, Avaialble at: http://blogs.office.com/2008/09/25/chart-advisor/. |
| Russian Notice of Allowance Issued in Russian Patent Application No. 2012146096, dated Sep. 5, 2016, 16 Pages. |
| SAS Institute, Inc.; "Defining a Data Source"; accessed Feb. 25, 2010, at http://support.sas.com/documentation/cdl/en/bidbrdug/61856.html; 11 pgs. |
| Sorting in an Excel Chart won't work properly, pcreview.com, Jan. 8, 2007 http://www.pcreview.co.uk/forums/sorting-excel-chart-wont-work-properly-t2810060.html.* |
| South Africa Notice of Allowance Issued in Patent Application No. 2012/07368 dated Oct. 9, 2013, 1 Page. |
| South Africa Notice of Allowance Issued in Patent Application No. 2012/07369 dated Oct. 9, 2013, 1 Page. |
| Taiwan Notice of Allowance Issued in Patent Application No. 100109576, dated Sep. 25, 2015, 4 Pages. |
| Taiwan Notice of Allowance Issued in Patent Application No. 100110806, dated Dec. 23, 2015, 4 Pages. |
| The MathWorks; Displaying Query Results :: Using Visual Query Builder (Databse Toolbox™); accessed Feb. 25, 2010, at http://www.mathworks.com/access/helpdesk/help/toolbox/database/ug/f7-27823.html; 10 pgs. |
| U.S. Appl. No. 12/771,422 Notice of Allowance dated Jan. 8, 2016. 22 pages. |
| U.S. Appl. No. 15/180,934 Amendment filed Jun. 1, 2018, 18 pages. |
| U.S. Appl. No. 15/180,934 Office Action dated Feb. 26, 2018, 19 pages. |
Also Published As
| Publication number | Publication date |
|---|---|
| CN102870106A (en) | 2013-01-09 |
| AR080990A1 (en) | 2012-05-23 |
| CO6592043A2 (en) | 2013-01-02 |
| US20110271172A1 (en) | 2011-11-03 |
| CN102870106B (en) | 2016-08-03 |
| IL222259A0 (en) | 2012-12-31 |
| JP6018045B2 (en) | 2016-11-02 |
| AU2011245657B2 (en) | 2014-11-06 |
| WO2011136932A1 (en) | 2011-11-03 |
| MY166722A (en) | 2018-07-18 |
| RU2607980C2 (en) | 2017-01-11 |
| NZ603049A (en) | 2015-01-30 |
| TWI531953B (en) | 2016-05-01 |
| SG184806A1 (en) | 2012-11-29 |
| IL222259A (en) | 2017-04-30 |
| CL2012003002A1 (en) | 2013-05-03 |
| CA2795183A1 (en) | 2011-11-03 |
| KR20130095176A (en) | 2013-08-27 |
| RU2012146096A (en) | 2014-05-10 |
| TW201203084A (en) | 2012-01-16 |
| MX2012012420A (en) | 2012-11-29 |
| JP2013528860A (en) | 2013-07-11 |
| EP2564325B1 (en) | 2020-10-28 |
| AU2011245657A1 (en) | 2012-09-27 |
| CA2795183C (en) | 2019-09-10 |
| KR101794373B1 (en) | 2017-12-01 |
| EP2564325A4 (en) | 2018-01-10 |
| EP2564325A1 (en) | 2013-03-06 |
Similar Documents
| Publication | Publication Date | Title |
|---|---|---|
| US11270066B2 (en) | Temporary formatting and charting of selected data | |
| US11385786B2 (en) | Spin control user interface for selecting options | |
| US8429194B2 (en) | Document-based workflows | |
| US7487442B2 (en) | Method, system, and computer-readable medium for the layout of automatically-placed elements and user-placed elements in a chart | |
| KR20120026053A (en) | Hierarchically-organized control galleries | |
| EP2189883B1 (en) | Method, apparatus and program for facilitating object selection on display screen | |
| US10809904B2 (en) | Interactive time range selector | |
| US20080005675A1 (en) | Method, system and program product for displaying nodes of a network | |
| US20080319780A1 (en) | Defining reports for dimension based enterprise resource planning systems | |
| TWI520042B (en) | Method and system for spin control user interface for selecting options, and computer-readable storage medium for recording related instructions thereon | |
| US20170357664A1 (en) | Hierarchical navigation apparatus and method |
Legal Events
| Date | Code | Title | Description |
|---|---|---|---|
| AS | Assignment | Owner name:MICROSOFT CORPORATION, WASHINGTON Free format text:ASSIGNMENT OF ASSIGNORS INTEREST;ASSIGNORS:RADAKOVITZ, SAMUEL CHOW;RUBLE, BRIAN SCOTT;REEL/FRAME:024315/0898 Effective date:20100429 | |
| AS | Assignment | Owner name:MICROSOFT TECHNOLOGY LICENSING, LLC, WASHINGTON Free format text:ASSIGNMENT OF ASSIGNORS INTEREST;ASSIGNOR:MICROSOFT CORPORATION;REEL/FRAME:034564/0001 Effective date:20141014 | |
| STPP | Information on status: patent application and granting procedure in general | Free format text:NON FINAL ACTION MAILED | |
| STPP | Information on status: patent application and granting procedure in general | Free format text:RESPONSE TO NON-FINAL OFFICE ACTION ENTERED AND FORWARDED TO EXAMINER | |
| STPP | Information on status: patent application and granting procedure in general | Free format text:FINAL REJECTION MAILED | |
| STCV | Information on status: appeal procedure | Free format text:NOTICE OF APPEAL FILED | |
| STCV | Information on status: appeal procedure | Free format text:APPEAL BRIEF (OR SUPPLEMENTAL BRIEF) ENTERED AND FORWARDED TO EXAMINER | |
| STCV | Information on status: appeal procedure | Free format text:EXAMINER'S ANSWER TO APPEAL BRIEF MAILED | |
| STCV | Information on status: appeal procedure | Free format text:ON APPEAL -- AWAITING DECISION BY THE BOARD OF APPEALS | |
| STCV | Information on status: appeal procedure | Free format text:BOARD OF APPEALS DECISION RENDERED | |
| STPP | Information on status: patent application and granting procedure in general | Free format text:AMENDMENT / ARGUMENT AFTER BOARD OF APPEALS DECISION | |
| STPP | Information on status: patent application and granting procedure in general | Free format text:NOTICE OF ALLOWANCE MAILED -- APPLICATION RECEIVED IN OFFICE OF PUBLICATIONS | |
| STCF | Information on status: patent grant | Free format text:PATENTED CASE | |
| MAFP | Maintenance fee payment | Free format text:PAYMENT OF MAINTENANCE FEE, 4TH YEAR, LARGE ENTITY (ORIGINAL EVENT CODE: M1551); ENTITY STATUS OF PATENT OWNER: LARGE ENTITY Year of fee payment:4 |