US11143649B2 - Free-solution response function interferometry - Google Patents
Free-solution response function interferometryDownload PDFInfo
- Publication number
- US11143649B2 US11143649B2US16/813,565US202016813565AUS11143649B2US 11143649 B2US11143649 B2US 11143649B2US 202016813565 AUS202016813565 AUS 202016813565AUS 11143649 B2US11143649 B2US 11143649B2
- Authority
- US
- United States
- Prior art keywords
- analyte
- sample
- further aspect
- channel
- protein
- Prior art date
- Legal status (The legal status is an assumption and is not a legal conclusion. Google has not performed a legal analysis and makes no representation as to the accuracy of the status listed.)
- Active
Links
- 238000005305interferometryMethods0.000titleclaimsabstractdescription56
- 238000005316response functionMethods0.000titledescription6
- 238000000034methodMethods0.000claimsabstractdescription227
- 230000004001molecular interactionEffects0.000claimsabstractdescription137
- 238000001514detection methodMethods0.000claimsabstractdescription90
- 238000005259measurementMethods0.000claimsabstractdescription68
- 239000012491analyteSubstances0.000claimsdescription260
- 238000009739bindingMethods0.000claimsdescription166
- 230000027455bindingEffects0.000claimsdescription162
- 230000003993interactionEffects0.000claimsdescription153
- 230000008859changeEffects0.000claimsdescription89
- 239000012530fluidSubstances0.000claimsdescription86
- 238000004458analytical methodMethods0.000claimsdescription84
- 108090000623proteins and genesProteins0.000claimsdescription77
- 102000004169proteins and genesHuman genes0.000claimsdescription76
- 239000000758substrateSubstances0.000claimsdescription59
- 108020003175receptorsProteins0.000claimsdescription41
- 102000005962receptorsHuman genes0.000claimsdescription41
- 210000004027cellAnatomy0.000claimsdescription38
- 238000010494dissociation reactionMethods0.000claimsdescription29
- 230000005593dissociationsEffects0.000claimsdescription29
- 230000000694effectsEffects0.000claimsdescription24
- 238000002983circular dichroismMethods0.000claimsdescription22
- 108020004707nucleic acidsProteins0.000claimsdescription21
- 150000007523nucleic acidsChemical class0.000claimsdescription21
- 102000039446nucleic acidsHuman genes0.000claimsdescription21
- 150000003384small moleculesChemical class0.000claimsdescription20
- 102000004190EnzymesHuman genes0.000claimsdescription18
- 108090000790EnzymesProteins0.000claimsdescription18
- 239000000427antigenSubstances0.000claimsdescription12
- 239000003814drugSubstances0.000claimsdescription11
- 230000015572biosynthetic processEffects0.000claimsdescription8
- 241000894006BacteriaSpecies0.000claimsdescription7
- 241000700605VirusesSpecies0.000claimsdescription7
- 108091023037AptamerProteins0.000claimsdescription6
- 108091007433antigensProteins0.000claimsdescription6
- 102000036639antigensHuman genes0.000claimsdescription6
- 150000001720carbohydratesChemical class0.000claimsdescription6
- 229940079593drugDrugs0.000claimsdescription6
- 239000012528membraneSubstances0.000claimsdescription6
- 108091034117OligonucleotideProteins0.000claimsdescription4
- 210000000170cell membraneAnatomy0.000claimsdescription4
- 239000002523lectinSubstances0.000claimsdescription4
- 102000013138Drug ReceptorsHuman genes0.000claimsdescription3
- 108010065556Drug ReceptorsProteins0.000claimsdescription3
- 108090001090LectinsProteins0.000claimsdescription3
- 102000004856LectinsHuman genes0.000claimsdescription3
- 230000002209hydrophobic effectEffects0.000claimsdescription3
- 239000002245particleSubstances0.000claimsdescription3
- 239000001257hydrogenSubstances0.000claimsdescription2
- 229910052739hydrogenInorganic materials0.000claimsdescription2
- 108091070501miRNAProteins0.000claimsdescription2
- 239000002679microRNASubstances0.000claimsdescription2
- 230000000670limiting effectEffects0.000abstractdescription2
- 239000000523sampleSubstances0.000description345
- 239000000243solutionSubstances0.000description206
- 239000013074reference sampleSubstances0.000description121
- 241000894007speciesSpecies0.000description82
- 239000003446ligandSubstances0.000description62
- 102000000584CalmodulinHuman genes0.000description46
- 108010041952CalmodulinProteins0.000description46
- PEDCQBHIVMGVHV-UHFFFAOYSA-NGlycerineChemical compoundOCC(O)COPEDCQBHIVMGVHV-UHFFFAOYSA-N0.000description45
- 230000004044responseEffects0.000description45
- 238000003556assayMethods0.000description40
- 230000003287optical effectEffects0.000description40
- 239000000126substanceSubstances0.000description34
- 239000000872bufferSubstances0.000description33
- 239000000047productSubstances0.000description31
- 108020004414DNAProteins0.000description30
- 238000002198surface plasmon resonance spectroscopyMethods0.000description29
- 238000006243chemical reactionMethods0.000description24
- 230000036571hydrationEffects0.000description24
- 238000006703hydration reactionMethods0.000description24
- 238000004364calculation methodMethods0.000description23
- UHOVQNZJYSORNB-UHFFFAOYSA-NBenzeneChemical compoundC1=CC=CC=C1UHOVQNZJYSORNB-UHFFFAOYSA-N0.000description21
- 239000000203mixtureSubstances0.000description21
- 230000035945sensitivityEffects0.000description21
- BHPQYMZQTOCNFJ-UHFFFAOYSA-NCalcium cationChemical compound[Ca+2]BHPQYMZQTOCNFJ-UHFFFAOYSA-N0.000description20
- 108010062580Concanavalin AProteins0.000description20
- WQZGKKKJIJFFOK-QTVWNMPRSA-ND-mannopyranoseChemical compoundOC[C@H]1OC(O)[C@@H](O)[C@@H](O)[C@@H]1OWQZGKKKJIJFFOK-QTVWNMPRSA-N0.000description20
- 229920002521macromoleculePolymers0.000description20
- 239000000463materialSubstances0.000description20
- 239000002904solventSubstances0.000description20
- TYNBFJJKZPTRKS-UHFFFAOYSA-Ndansyl amideChemical compoundC1=CC=C2C(N(C)C)=CC=CC2=C1S(N)(=O)=OTYNBFJJKZPTRKS-UHFFFAOYSA-N0.000description18
- 238000012360testing methodMethods0.000description18
- BZKPWHYZMXOIDC-UHFFFAOYSA-NacetazolamideChemical compoundCC(=O)NC1=NN=C(S(N)(=O)=O)S1BZKPWHYZMXOIDC-UHFFFAOYSA-N0.000description17
- 229940088598enzymeDrugs0.000description17
- 238000002474experimental methodMethods0.000description17
- 239000007788liquidSubstances0.000description17
- 238000013459approachMethods0.000description15
- 239000011575calciumSubstances0.000description15
- 239000011159matrix materialSubstances0.000description15
- 230000006870functionEffects0.000description13
- 238000012549trainingMethods0.000description13
- IAZDPXIOMUYVGZ-UHFFFAOYSA-NDimethylsulphoxideChemical compoundCS(C)=OIAZDPXIOMUYVGZ-UHFFFAOYSA-N0.000description12
- 150000001875compoundsChemical class0.000description12
- 230000009466transformationEffects0.000description12
- KHBQMWCZKVMBLN-UHFFFAOYSA-NBenzenesulfonamideChemical compoundNS(=O)(=O)C1=CC=CC=C1KHBQMWCZKVMBLN-UHFFFAOYSA-N0.000description11
- 102000018697Membrane ProteinsHuman genes0.000description11
- 108010052285Membrane ProteinsProteins0.000description11
- 102000018210RecoverinHuman genes0.000description11
- 108010076570RecoverinProteins0.000description11
- 229960000571acetazolamideDrugs0.000description11
- 125000004429atomChemical group0.000description11
- 230000001419dependent effectEffects0.000description11
- 238000010790dilutionMethods0.000description11
- 239000012895dilutionSubstances0.000description11
- 238000002156mixingMethods0.000description11
- -1polyethylenePolymers0.000description11
- 102000004631CalcineurinHuman genes0.000description10
- 108010042955CalcineurinProteins0.000description10
- 102000004310Ion ChannelsHuman genes0.000description10
- 230000008901benefitEffects0.000description10
- 230000012846protein foldingEffects0.000description10
- 238000000926separation methodMethods0.000description10
- 229940124530sulfonamideDrugs0.000description10
- HBOMLICNUCNMMY-KJFJCRTCSA-N1-[(4s,5s)-4-azido-5-(hydroxymethyl)oxolan-2-yl]-5-methylpyrimidine-2,4-dioneChemical compoundO=C1NC(=O)C(C)=CN1C1O[C@H](CO)[C@@H](N=[N+]=[N-])C1HBOMLICNUCNMMY-KJFJCRTCSA-N0.000description9
- 101710167917Carbonic anhydrase 2Proteins0.000description9
- 102100024633Carbonic anhydrase 2Human genes0.000description9
- WQZGKKKJIJFFOK-VFUOTHLCSA-Nbeta-D-glucoseChemical compoundOC[C@H]1O[C@@H](O)[C@H](O)[C@@H](O)[C@@H]1OWQZGKKKJIJFFOK-VFUOTHLCSA-N0.000description9
- 239000013078crystalSubstances0.000description9
- 238000009396hybridizationMethods0.000description9
- 238000000111isothermal titration calorimetryMethods0.000description9
- 239000007787solidSubstances0.000description9
- 239000011550stock solutionSubstances0.000description9
- 238000000844transformationMethods0.000description9
- XLYOFNOQVPJJNP-UHFFFAOYSA-NwaterSubstancesOXLYOFNOQVPJJNP-UHFFFAOYSA-N0.000description9
- WQZGKKKJIJFFOK-GASJEMHNSA-NGlucoseNatural productsOC[C@H]1OC(O)[C@H](O)[C@@H](O)[C@@H]1OWQZGKKKJIJFFOK-GASJEMHNSA-N0.000description8
- 102000000588Interleukin-2Human genes0.000description8
- 108010002350Interleukin-2Proteins0.000description8
- COLNVLDHVKWLRT-QMMMGPOBSA-NL-phenylalanineChemical compoundOC(=O)[C@@H](N)CC1=CC=CC=C1COLNVLDHVKWLRT-QMMMGPOBSA-N0.000description8
- VYPSYNLAJGMNEJ-UHFFFAOYSA-NSilicium dioxideChemical compoundO=[Si]=OVYPSYNLAJGMNEJ-UHFFFAOYSA-N0.000description8
- 108090000190ThrombinProteins0.000description8
- 238000013375chromatographic separationMethods0.000description8
- 238000010586diagramMethods0.000description8
- LOKCTEFSRHRXRJ-UHFFFAOYSA-Idipotassium trisodium dihydrogen phosphate hydrogen phosphate dichlorideChemical compoundP(=O)(O)(O)[O-].[K+].P(=O)(O)([O-])[O-].[Na+].[Na+].[Cl-].[K+].[Cl-].[Na+]LOKCTEFSRHRXRJ-UHFFFAOYSA-I0.000description8
- 238000011067equilibrationMethods0.000description8
- 239000008103glucoseSubstances0.000description8
- 238000002347injectionMethods0.000description8
- 239000007924injectionSubstances0.000description8
- 229950000964pepstatinDrugs0.000description8
- 108010091212pepstatinProteins0.000description8
- FAXGPCHRFPCXOO-LXTPJMTPSA-Npepstatin AChemical compoundOC(=O)C[C@H](O)[C@H](CC(C)C)NC(=O)[C@H](C)NC(=O)C[C@H](O)[C@H](CC(C)C)NC(=O)[C@H](C(C)C)NC(=O)[C@H](C(C)C)NC(=O)CC(C)CFAXGPCHRFPCXOO-LXTPJMTPSA-N0.000description8
- 239000002953phosphate buffered salineSubstances0.000description8
- 239000012488sample solutionSubstances0.000description8
- 229960004072thrombinDrugs0.000description8
- 230000007704transitionEffects0.000description8
- 101000998011Homo sapiens Keratin, type I cytoskeletal 19Proteins0.000description7
- 102100033420Keratin, type I cytoskeletal 19Human genes0.000description7
- 108091028043Nucleic acid sequenceProteins0.000description7
- 230000009471actionEffects0.000description7
- 108010036226antigen CYFRA21.1Proteins0.000description7
- 238000004630atomic force microscopyMethods0.000description7
- 239000007795chemical reaction productSubstances0.000description7
- 238000013461designMethods0.000description7
- 230000007613environmental effectEffects0.000description7
- 238000004519manufacturing processMethods0.000description7
- 239000012071phaseSubstances0.000description7
- 229920000642polymerPolymers0.000description7
- 238000011002quantificationMethods0.000description7
- 239000012088reference solutionSubstances0.000description7
- 238000010897surface acoustic wave methodMethods0.000description7
- 239000003298DNA probeSubstances0.000description6
- 230000004075alterationEffects0.000description6
- 238000004166bioassayMethods0.000description6
- YCIMNLLNPGFGHC-UHFFFAOYSA-NcatecholChemical compoundOC1=CC=CC=C1OYCIMNLLNPGFGHC-UHFFFAOYSA-N0.000description6
- 238000006911enzymatic reactionMethods0.000description6
- 238000001768microscale thermophoresisMethods0.000description6
- 108090000765processed proteins & peptidesProteins0.000description6
- 210000002966serumAnatomy0.000description6
- 150000003456sulfonamidesChemical class0.000description6
- 238000005406washingMethods0.000description6
- 239000003643water by typeSubstances0.000description6
- 108091032973(ribonucleotides)n+mProteins0.000description5
- 108020003215DNA ProbesProteins0.000description5
- 238000005481NMR spectroscopyMethods0.000description5
- 239000002585baseSubstances0.000description5
- 210000004369bloodAnatomy0.000description5
- 239000008280bloodSubstances0.000description5
- 235000014633carbohydratesNutrition0.000description5
- 238000007796conventional methodMethods0.000description5
- 238000011156evaluationMethods0.000description5
- 239000011521glassSubstances0.000description5
- 238000011835investigationMethods0.000description5
- 150000002500ionsChemical class0.000description5
- 230000004048modificationEffects0.000description5
- 238000012986modificationMethods0.000description5
- 238000012544monitoring processMethods0.000description5
- 239000000178monomerSubstances0.000description5
- 238000006213oxygenation reactionMethods0.000description5
- 229920000435poly(dimethylsiloxane)Polymers0.000description5
- 238000006116polymerization reactionMethods0.000description5
- 230000004845protein aggregationEffects0.000description5
- 238000000159protein binding assayMethods0.000description5
- 230000002829reductive effectEffects0.000description5
- 210000002700urineAnatomy0.000description5
- JWZZKOKVBUJMES-UHFFFAOYSA-N(+-)-IsoprenalineChemical compoundCC(C)NCC(O)C1=CC=C(O)C(O)=C1JWZZKOKVBUJMES-UHFFFAOYSA-N0.000description4
- BGRJTUBHPOOWDU-NSHDSACASA-N(S)-(-)-sulpirideChemical compoundCCN1CCC[C@H]1CNC(=O)C1=CC(S(N)(=O)=O)=CC=C1OCBGRJTUBHPOOWDU-NSHDSACASA-N0.000description4
- 102000015279BasiginHuman genes0.000description4
- 108010064528BasiginProteins0.000description4
- ISWSIDIOOBJBQZ-UHFFFAOYSA-NPhenolChemical compoundOC1=CC=CC=C1ISWSIDIOOBJBQZ-UHFFFAOYSA-N0.000description4
- RHQDFWAXVIIEBN-UHFFFAOYSA-NTrifluoroethanolChemical compoundOCC(F)(F)FRHQDFWAXVIIEBN-UHFFFAOYSA-N0.000description4
- 238000010521absorption reactionMethods0.000description4
- 239000002253acidSubstances0.000description4
- 239000000654additiveSubstances0.000description4
- PAZJSJFMUHDSTF-UHFFFAOYSA-NalprenololChemical compoundCC(C)NCC(O)COC1=CC=CC=C1CC=CPAZJSJFMUHDSTF-UHFFFAOYSA-N0.000description4
- 229960002213alprenololDrugs0.000description4
- 230000004888barrier functionEffects0.000description4
- 230000006399behaviorEffects0.000description4
- 239000007853buffer solutionSubstances0.000description4
- 230000001413cellular effectEffects0.000description4
- 238000012512characterization methodMethods0.000description4
- 230000001427coherent effectEffects0.000description4
- 238000013480data collectionMethods0.000description4
- 239000004205dimethyl polysiloxaneSubstances0.000description4
- 201000010099diseaseDiseases0.000description4
- 208000037265diseases, disorders, signs and symptomsDiseases0.000description4
- 238000009826distributionMethods0.000description4
- 210000003743erythrocyteAnatomy0.000description4
- 238000004401flow injection analysisMethods0.000description4
- 239000007850fluorescent dyeSubstances0.000description4
- 239000007789gasSubstances0.000description4
- 229940039009isoproterenolDrugs0.000description4
- 239000002636mycotoxinSubstances0.000description4
- 229960005190phenylalanineDrugs0.000description4
- 229920003229poly(methyl methacrylate)Polymers0.000description4
- 102000004196processed proteins & peptidesHuman genes0.000description4
- 230000006916protein interactionEffects0.000description4
- 238000010926purgeMethods0.000description4
- 238000001448refractive index detectionMethods0.000description4
- 238000011160researchMethods0.000description4
- FDDDEECHVMSUSB-UHFFFAOYSA-NsulfanilamideChemical compoundNC1=CC=C(S(N)(=O)=O)C=C1FDDDEECHVMSUSB-UHFFFAOYSA-N0.000description4
- 229960004940sulpirideDrugs0.000description4
- 239000004094surface-active agentSubstances0.000description4
- 229920002307DextranPolymers0.000description3
- LFQSCWFLJHTTHZ-UHFFFAOYSA-NEthanolChemical compoundCCOLFQSCWFLJHTTHZ-UHFFFAOYSA-N0.000description3
- OKKJLVBELUTLKV-UHFFFAOYSA-NMethanolChemical compoundOCOKKJLVBELUTLKV-UHFFFAOYSA-N0.000description3
- 239000007864aqueous solutionSubstances0.000description3
- 239000000090biomarkerSubstances0.000description3
- 230000000903blocking effectEffects0.000description3
- 238000011088calibration curveMethods0.000description3
- 238000005251capillar electrophoresisMethods0.000description3
- 238000002045capillary electrochromatographyMethods0.000description3
- 239000003153chemical reaction reagentSubstances0.000description3
- 238000001142circular dichroism spectrumMethods0.000description3
- 238000000576coating methodMethods0.000description3
- 230000002596correlated effectEffects0.000description3
- 238000001704evaporationMethods0.000description3
- 230000008020evaporationEffects0.000description3
- 238000002032lab-on-a-chipMethods0.000description3
- 229910052751metalInorganic materials0.000description3
- 239000002184metalSubstances0.000description3
- 230000010287polarizationEffects0.000description3
- 239000004926polymethyl methacrylateSubstances0.000description3
- 238000002360preparation methodMethods0.000description3
- 230000008569processEffects0.000description3
- 238000012545processingMethods0.000description3
- 238000004445quantitative analysisMethods0.000description3
- 238000013515scriptMethods0.000description3
- 238000013207serial dilutionMethods0.000description3
- 239000000377silicon dioxideSubstances0.000description3
- 210000001519tissueAnatomy0.000description3
- 238000010200validation analysisMethods0.000description3
- YBJHBAHKTGYVGT-ZKWXMUAHSA-N(+)-BiotinChemical compoundN1C(=O)N[C@@H]2[C@H](CCCCC(=O)O)SC[C@@H]21YBJHBAHKTGYVGT-ZKWXMUAHSA-N0.000description2
- 102000013455Amyloid beta-PeptidesHuman genes0.000description2
- 108010090849Amyloid beta-PeptidesProteins0.000description2
- 241000283690Bos taurusSpecies0.000description2
- OYPRJOBELJOOCE-UHFFFAOYSA-NCalciumChemical group[Ca]OYPRJOBELJOOCE-UHFFFAOYSA-N0.000description2
- 102000005701Calcium-Binding ProteinsHuman genes0.000description2
- 108010045403Calcium-Binding ProteinsProteins0.000description2
- 102000003846Carbonic anhydrasesHuman genes0.000description2
- 108090000209Carbonic anhydrasesProteins0.000description2
- HEDRZPFGACZZDS-UHFFFAOYSA-NChloroformChemical compoundClC(Cl)ClHEDRZPFGACZZDS-UHFFFAOYSA-N0.000description2
- 102000052510DNA-Binding ProteinsHuman genes0.000description2
- 101000867232Escherichia coli Heat-stable enterotoxin IIProteins0.000description2
- NTYJJOPFIAHURM-UHFFFAOYSA-NHistamineChemical compoundNCCC1=CN=CN1NTYJJOPFIAHURM-UHFFFAOYSA-N0.000description2
- 108010001336Horseradish PeroxidaseProteins0.000description2
- 108010058683Immobilized ProteinsProteins0.000description2
- UQSXHKLRYXJYBZ-UHFFFAOYSA-NIron oxideChemical compound[Fe]=OUQSXHKLRYXJYBZ-UHFFFAOYSA-N0.000description2
- RRHGJUQNOFWUDK-UHFFFAOYSA-NIsopreneChemical compoundCC(=C)C=CRRHGJUQNOFWUDK-UHFFFAOYSA-N0.000description2
- 108010085220Multiprotein ComplexesProteins0.000description2
- 102000007474Multiprotein ComplexesHuman genes0.000description2
- 231100000678MycotoxinToxicity0.000description2
- CVRALZAYCYJELZ-UHFFFAOYSA-NO-(4-bromo-2,5-dichlorophenyl) O-methyl phenylphosphonothioateChemical compoundC=1C=CC=CC=1P(=S)(OC)OC1=CC(Cl)=C(Br)C=C1ClCVRALZAYCYJELZ-UHFFFAOYSA-N0.000description2
- 102000001253Protein KinaseHuman genes0.000description2
- 241000725643Respiratory syncytial virusSpecies0.000description2
- 230000000996additive effectEffects0.000description2
- 239000002099adlayerSubstances0.000description2
- 239000002156adsorbateSubstances0.000description2
- 125000000217alkyl groupChemical group0.000description2
- 229940024606amino acidDrugs0.000description2
- 150000001413amino acidsChemical class0.000description2
- 235000013405beerNutrition0.000description2
- 238000012575bio-layer interferometryMethods0.000description2
- 239000008364bulk solutionSubstances0.000description2
- 229910052791calciumInorganic materials0.000description2
- 238000007707calorimetryMethods0.000description2
- HVYWMOMLDIMFJA-DPAQBDIFSA-NcholesterolChemical compoundC1C=C2C[C@@H](O)CC[C@]2(C)[C@@H]2[C@@H]1[C@@H]1CC[C@H]([C@H](C)CCCC(C)C)[C@@]1(C)CC2HVYWMOMLDIMFJA-DPAQBDIFSA-N0.000description2
- 239000011248coating agentSubstances0.000description2
- 229920001577copolymerPolymers0.000description2
- 230000018109developmental processEffects0.000description2
- VYFYYTLLBUKUHU-UHFFFAOYSA-NdopamineChemical compoundNCCC1=CC=C(O)C(O)=C1VYFYYTLLBUKUHU-UHFFFAOYSA-N0.000description2
- 229940000406drug candidateDrugs0.000description2
- 238000009509drug developmentMethods0.000description2
- 238000007876drug discoveryMethods0.000description2
- 229920001971elastomerPolymers0.000description2
- 230000005684electric fieldEffects0.000description2
- 238000002848electrochemical methodMethods0.000description2
- 238000005516engineering processMethods0.000description2
- 231100000655enterotoxinToxicity0.000description2
- 230000002255enzymatic effectEffects0.000description2
- 238000000605extractionMethods0.000description2
- 238000011049fillingMethods0.000description2
- 235000013305foodNutrition0.000description2
- 239000012634fragmentSubstances0.000description2
- 125000000524functional groupChemical group0.000description2
- 230000002068genetic effectEffects0.000description2
- RWSXRVCMGQZWBV-WDSKDSINSA-NglutathioneChemical compoundOC(=O)[C@@H](N)CCC(=O)N[C@@H](CS)C(=O)NCC(O)=ORWSXRVCMGQZWBV-WDSKDSINSA-N0.000description2
- 238000004128high performance liquid chromatographyMethods0.000description2
- AMWRITDGCCNYAT-UHFFFAOYSA-Lhydroxy(oxo)manganese;manganeseChemical compound[Mn].O[Mn]=O.O[Mn]=OAMWRITDGCCNYAT-UHFFFAOYSA-L0.000description2
- 229940027941immunoglobulin gDrugs0.000description2
- 238000011534incubationMethods0.000description2
- 239000003112inhibitorSubstances0.000description2
- 230000010354integrationEffects0.000description2
- 230000009878intermolecular interactionEffects0.000description2
- 238000003368label free methodMethods0.000description2
- 239000010410layerSubstances0.000description2
- 201000004792malariaDiseases0.000description2
- 238000004949mass spectrometryMethods0.000description2
- 239000000693micelleSubstances0.000description2
- 230000035772mutationEffects0.000description2
- 239000002105nanoparticleSubstances0.000description2
- 229930027945nicotinamide-adenine dinucleotideNatural products0.000description2
- BOPGDPNILDQYTO-NNYOXOHSSA-Nnicotinamide-adenine dinucleotideChemical compoundC1=CCC(C(=O)N)=CN1[C@H]1[C@H](O)[C@H](O)[C@@H](COP(O)(=O)OP(O)(=O)OC[C@@H]2[C@H]([C@@H](O)[C@@H](O2)N2C3=NC=NC(N)=C3N=C2)O)O1BOPGDPNILDQYTO-NNYOXOHSSA-N0.000description2
- 230000009871nonspecific bindingEffects0.000description2
- 238000005457optimizationMethods0.000description2
- 150000002894organic compoundsChemical class0.000description2
- 244000052769pathogenSpecies0.000description2
- 230000037361pathwayEffects0.000description2
- 230000010363phase shiftEffects0.000description2
- 230000000704physical effectEffects0.000description2
- 238000003825pressingMethods0.000description2
- 108060006633protein kinaseProteins0.000description2
- 230000002285radioactive effectEffects0.000description2
- 239000005060rubberSubstances0.000description2
- 150000003839saltsChemical class0.000description2
- QZAYGJVTTNCVMB-UHFFFAOYSA-NserotoninChemical compoundC1=C(O)C=C2C(CCN)=CNC2=C1QZAYGJVTTNCVMB-UHFFFAOYSA-N0.000description2
- 230000009870specific bindingEffects0.000description2
- 230000003068static effectEffects0.000description2
- 238000004416surface enhanced Raman spectroscopyMethods0.000description2
- 239000002344surface layerSubstances0.000description2
- 238000004448titrationMethods0.000description2
- 238000012546transferMethods0.000description2
- 238000013520translational researchMethods0.000description2
- 238000012800visualizationMethods0.000description2
- WOAHJDHKFWSLKE-UHFFFAOYSA-N1,2-benzoquinoneChemical compoundO=C1C=CC=CC1=OWOAHJDHKFWSLKE-UHFFFAOYSA-N0.000description1
- OWEGMIWEEQEYGQ-UHFFFAOYSA-N100676-05-9Natural productsOC1C(O)C(O)C(CO)OC1OCC1C(O)C(O)C(O)C(OC2C(OC(O)C(O)C2O)CO)O1OWEGMIWEEQEYGQ-UHFFFAOYSA-N0.000description1
- SPSSULHKWOKEEL-UHFFFAOYSA-N2,4,6-trinitrotolueneChemical compoundCC1=C([N+]([O-])=O)C=C([N+]([O-])=O)C=C1[N+]([O-])=OSPSSULHKWOKEEL-UHFFFAOYSA-N0.000description1
- DIVQKHQLANKJQO-UHFFFAOYSA-N3-methoxytyramineChemical compoundCOC1=CC(CCN)=CC=C1ODIVQKHQLANKJQO-UHFFFAOYSA-N0.000description1
- FBTSQILOGYXGMD-LURJTMIESA-N3-nitro-L-tyrosineChemical compoundOC(=O)[C@@H](N)CC1=CC=C(O)C([N+]([O-])=O)=C1FBTSQILOGYXGMD-LURJTMIESA-N0.000description1
- BRLRJZRHRJEWJY-VCOUNFBDSA-N5-[(3as,4s,6ar)-2-oxo-1,3,3a,4,6,6a-hexahydrothieno[3,4-d]imidazol-4-yl]-n-[3-[3-(4-azido-2-nitroanilino)propyl-methylamino]propyl]pentanamideChemical compoundC([C@H]1[C@H]2NC(=O)N[C@H]2CS1)CCCC(=O)NCCCN(C)CCCNC1=CC=C(N=[N+]=[N-])C=C1[N+]([O-])=OBRLRJZRHRJEWJY-VCOUNFBDSA-N0.000description1
- 102000002260Alkaline PhosphataseHuman genes0.000description1
- 108020004774Alkaline PhosphataseProteins0.000description1
- 238000012935AveragingMethods0.000description1
- 108090001008AvidinProteins0.000description1
- 102100026189Beta-galactosidaseHuman genes0.000description1
- 229910004383CaIIInorganic materials0.000description1
- 241000252506CharaciformesSpecies0.000description1
- 241000819038ChichesterSpecies0.000description1
- XDTMQSROBMDMFD-UHFFFAOYSA-NCyclohexaneChemical compoundC1CCCCC1XDTMQSROBMDMFD-UHFFFAOYSA-N0.000description1
- 102000004127CytokinesHuman genes0.000description1
- 108090000695CytokinesProteins0.000description1
- 101710112752CytotoxinProteins0.000description1
- 101710116602DNA-Binding protein G5PProteins0.000description1
- 230000004568DNA-bindingEffects0.000description1
- 101710096438DNA-binding proteinProteins0.000description1
- 101710088194DehydrogenaseProteins0.000description1
- 108090000204Dipeptidase 1Proteins0.000description1
- 206010061818Disease progressionDiseases0.000description1
- 238000002965ELISAMethods0.000description1
- 238000008157ELISA kitMethods0.000description1
- 241000196324EmbryophytaSpecies0.000description1
- 239000004593EpoxySubstances0.000description1
- OTMSDBZUPAUEDD-UHFFFAOYSA-NEthaneChemical compoundCCOTMSDBZUPAUEDD-UHFFFAOYSA-N0.000description1
- 108010024636GlutathioneProteins0.000description1
- 102000003886GlycoproteinsHuman genes0.000description1
- 108090000288GlycoproteinsProteins0.000description1
- 108010093096Immobilized EnzymesProteins0.000description1
- QIVBCDIJIAJPQS-VIFPVBQESA-NL-tryptophaneChemical compoundC1=CC=C2C(C[C@H](N)C(O)=O)=CNC2=C1QIVBCDIJIAJPQS-VIFPVBQESA-N0.000description1
- OUYCCCASQSFEME-QMMMGPOBSA-NL-tyrosineChemical compoundOC(=O)[C@@H](N)CC1=CC=C(O)C=C1OUYCCCASQSFEME-QMMMGPOBSA-N0.000description1
- 108060001084LuciferaseProteins0.000description1
- 239000005089LuciferaseSubstances0.000description1
- GUBGYTABKSRVRQ-PICCSMPSSA-NMaltoseNatural productsO[C@@H]1[C@@H](O)[C@H](O)[C@@H](CO)O[C@@H]1O[C@@H]1[C@@H](CO)OC(O)[C@H](O)[C@H]1OGUBGYTABKSRVRQ-PICCSMPSSA-N0.000description1
- 241000124008MammaliaSpecies0.000description1
- 241001465754MetazoaSpecies0.000description1
- 206010028980NeoplasmDiseases0.000description1
- 102000007999Nuclear ProteinsHuman genes0.000description1
- 108010089610Nuclear ProteinsProteins0.000description1
- 102000007079Peptide FragmentsHuman genes0.000description1
- 108010033276Peptide FragmentsProteins0.000description1
- 239000004698PolyethyleneSubstances0.000description1
- 239000004743PolypropyleneSubstances0.000description1
- 239000004793PolystyreneSubstances0.000description1
- 238000001069Raman spectroscopyMethods0.000description1
- 101710162453Replication factor AProteins0.000description1
- 101710176758Replication protein A 70 kDa DNA-binding subunitProteins0.000description1
- 108010046983Ribonuclease T1Proteins0.000description1
- 101710176276SSB proteinProteins0.000description1
- 108010070996Salicylate 1-monooxygenaseProteins0.000description1
- 101710126859Single-stranded DNA-binding proteinProteins0.000description1
- VMHLLURERBWHNL-UHFFFAOYSA-MSodium acetateChemical compound[Na+].CC([O-])=OVMHLLURERBWHNL-UHFFFAOYSA-M0.000description1
- 238000003646Spearman's rank correlation coefficientMethods0.000description1
- 108010090804StreptavidinProteins0.000description1
- QIVBCDIJIAJPQS-UHFFFAOYSA-NTryptophanNatural productsC1=CC=C2C(CC(N)C(O)=O)=CNC2=C1QIVBCDIJIAJPQS-UHFFFAOYSA-N0.000description1
- 102000003425TyrosinaseHuman genes0.000description1
- 108060008724TyrosinaseProteins0.000description1
- 108090000848UbiquitinProteins0.000description1
- 102000044159UbiquitinHuman genes0.000description1
- JLCPHMBAVCMARE-UHFFFAOYSA-N[3-[[3-[[3-[[3-[[3-[[3-[[3-[[3-[[3-[[3-[[3-[[5-(2-amino-6-oxo-1H-purin-9-yl)-3-[[3-[[3-[[3-[[3-[[3-[[5-(2-amino-6-oxo-1H-purin-9-yl)-3-[[5-(2-amino-6-oxo-1H-purin-9-yl)-3-hydroxyoxolan-2-yl]methoxy-hydroxyphosphoryl]oxyoxolan-2-yl]methoxy-hydroxyphosphoryl]oxy-5-(5-methyl-2,4-dioxopyrimidin-1-yl)oxolan-2-yl]methoxy-hydroxyphosphoryl]oxy-5-(6-aminopurin-9-yl)oxolan-2-yl]methoxy-hydroxyphosphoryl]oxy-5-(6-aminopurin-9-yl)oxolan-2-yl]methoxy-hydroxyphosphoryl]oxy-5-(6-aminopurin-9-yl)oxolan-2-yl]methoxy-hydroxyphosphoryl]oxy-5-(6-aminopurin-9-yl)oxolan-2-yl]methoxy-hydroxyphosphoryl]oxyoxolan-2-yl]methoxy-hydroxyphosphoryl]oxy-5-(5-methyl-2,4-dioxopyrimidin-1-yl)oxolan-2-yl]methoxy-hydroxyphosphoryl]oxy-5-(4-amino-2-oxopyrimidin-1-yl)oxolan-2-yl]methoxy-hydroxyphosphoryl]oxy-5-(5-methyl-2,4-dioxopyrimidin-1-yl)oxolan-2-yl]methoxy-hydroxyphosphoryl]oxy-5-(5-methyl-2,4-dioxopyrimidin-1-yl)oxolan-2-yl]methoxy-hydroxyphosphoryl]oxy-5-(6-aminopurin-9-yl)oxolan-2-yl]methoxy-hydroxyphosphoryl]oxy-5-(6-aminopurin-9-yl)oxolan-2-yl]methoxy-hydroxyphosphoryl]oxy-5-(4-amino-2-oxopyrimidin-1-yl)oxolan-2-yl]methoxy-hydroxyphosphoryl]oxy-5-(4-amino-2-oxopyrimidin-1-yl)oxolan-2-yl]methoxy-hydroxyphosphoryl]oxy-5-(4-amino-2-oxopyrimidin-1-yl)oxolan-2-yl]methoxy-hydroxyphosphoryl]oxy-5-(6-aminopurin-9-yl)oxolan-2-yl]methoxy-hydroxyphosphoryl]oxy-5-(4-amino-2-oxopyrimidin-1-yl)oxolan-2-yl]methyl [5-(6-aminopurin-9-yl)-2-(hydroxymethyl)oxolan-3-yl] hydrogen phosphatePolymersCc1cn(C2CC(OP(O)(=O)OCC3OC(CC3OP(O)(=O)OCC3OC(CC3O)n3cnc4c3nc(N)[nH]c4=O)n3cnc4c3nc(N)[nH]c4=O)C(COP(O)(=O)OC3CC(OC3COP(O)(=O)OC3CC(OC3COP(O)(=O)OC3CC(OC3COP(O)(=O)OC3CC(OC3COP(O)(=O)OC3CC(OC3COP(O)(=O)OC3CC(OC3COP(O)(=O)OC3CC(OC3COP(O)(=O)OC3CC(OC3COP(O)(=O)OC3CC(OC3COP(O)(=O)OC3CC(OC3COP(O)(=O)OC3CC(OC3COP(O)(=O)OC3CC(OC3COP(O)(=O)OC3CC(OC3COP(O)(=O)OC3CC(OC3COP(O)(=O)OC3CC(OC3COP(O)(=O)OC3CC(OC3COP(O)(=O)OC3CC(OC3CO)n3cnc4c(N)ncnc34)n3ccc(N)nc3=O)n3cnc4c(N)ncnc34)n3ccc(N)nc3=O)n3ccc(N)nc3=O)n3ccc(N)nc3=O)n3cnc4c(N)ncnc34)n3cnc4c(N)ncnc34)n3cc(C)c(=O)[nH]c3=O)n3cc(C)c(=O)[nH]c3=O)n3ccc(N)nc3=O)n3cc(C)c(=O)[nH]c3=O)n3cnc4c3nc(N)[nH]c4=O)n3cnc4c(N)ncnc34)n3cnc4c(N)ncnc34)n3cnc4c(N)ncnc34)n3cnc4c(N)ncnc34)O2)c(=O)[nH]c1=OJLCPHMBAVCMARE-UHFFFAOYSA-N0.000description1
- 238000002835absorbanceMethods0.000description1
- 238000000862absorption spectrumMethods0.000description1
- 150000007513acidsChemical class0.000description1
- 229920006397acrylic thermoplasticPolymers0.000description1
- 230000004913activationEffects0.000description1
- 238000012644addition polymerizationMethods0.000description1
- 230000032683agingEffects0.000description1
- 239000013566allergenSubstances0.000description1
- 229920005603alternating copolymerPolymers0.000description1
- 238000004164analytical calibrationMethods0.000description1
- 210000001742aqueous humorAnatomy0.000description1
- 238000000149argon plasma sinteringMethods0.000description1
- 239000012298atmosphereSubstances0.000description1
- QVGXLLKOCUKJST-UHFFFAOYSA-Natomic oxygenChemical compound[O]QVGXLLKOCUKJST-UHFFFAOYSA-N0.000description1
- 230000001580bacterial effectEffects0.000description1
- 108010005774beta-GalactosidaseProteins0.000description1
- 102000006635beta-lactamaseHuman genes0.000description1
- GUBGYTABKSRVRQ-QUYVBRFLSA-Nbeta-maltoseChemical compoundOC[C@H]1O[C@H](O[C@H]2[C@H](O)[C@@H](O)[C@H](O)O[C@@H]2CO)[C@H](O)[C@@H](O)[C@@H]1OGUBGYTABKSRVRQ-QUYVBRFLSA-N0.000description1
- 210000000941bileAnatomy0.000description1
- 239000011230binding agentSubstances0.000description1
- 238000010256biochemical assayMethods0.000description1
- 230000004071biological effectEffects0.000description1
- 230000005540biological transmissionEffects0.000description1
- 230000029918bioluminescenceEffects0.000description1
- 238000005415bioluminescenceMethods0.000description1
- 229920001222biopolymerPolymers0.000description1
- 229960002685biotinDrugs0.000description1
- 235000020958biotinNutrition0.000description1
- 239000011616biotinSubstances0.000description1
- 229920001400block copolymerPolymers0.000description1
- 210000001124body fluidAnatomy0.000description1
- 239000010839body fluidSubstances0.000description1
- 239000000337buffer saltSubstances0.000description1
- 210000004899c-terminal regionAnatomy0.000description1
- 238000004422calculation algorithmMethods0.000description1
- 201000011510cancerDiseases0.000description1
- 238000004850capillary HPLCMethods0.000description1
- 230000003915cell functionEffects0.000description1
- 239000013592cell lysateSubstances0.000description1
- 230000019522cellular metabolic processEffects0.000description1
- 230000004098cellular respirationEffects0.000description1
- 229920002678cellulosePolymers0.000description1
- 239000001913celluloseSubstances0.000description1
- 210000001175cerebrospinal fluidAnatomy0.000description1
- 210000003756cervix mucusAnatomy0.000description1
- 150000005829chemical entitiesChemical class0.000description1
- 239000003795chemical substances by applicationSubstances0.000description1
- 235000012000cholesterolNutrition0.000description1
- 238000004587chromatography analysisMethods0.000description1
- 239000000084colloidal systemSubstances0.000description1
- 238000004891communicationMethods0.000description1
- 230000006854communicationEffects0.000description1
- 230000000295complement effectEffects0.000description1
- 230000001276controlling effectEffects0.000description1
- 238000012937correctionMethods0.000description1
- 230000000875corresponding effectEffects0.000description1
- 230000008878couplingEffects0.000description1
- 238000010168coupling processMethods0.000description1
- 238000005859coupling reactionMethods0.000description1
- 231100000599cytotoxic agentToxicity0.000description1
- 239000002619cytotoxinSubstances0.000description1
- 230000007423decreaseEffects0.000description1
- 230000003247decreasing effectEffects0.000description1
- 238000004925denaturationMethods0.000description1
- 230000036425denaturationEffects0.000description1
- 238000011161developmentMethods0.000description1
- 206010012601diabetes mellitusDiseases0.000description1
- 238000002405diagnostic procedureMethods0.000description1
- 230000003292diminished effectEffects0.000description1
- 230000005750disease progressionEffects0.000description1
- 239000006185dispersionSubstances0.000description1
- 229960003638dopamineDrugs0.000description1
- 238000007877drug screeningMethods0.000description1
- 239000000975dyeSubstances0.000description1
- 238000013399early diagnosisMethods0.000description1
- 230000005670electromagnetic radiationEffects0.000description1
- 230000005274electronic transitionsEffects0.000description1
- 238000001962electrophoresisMethods0.000description1
- 238000002330electrospray ionisation mass spectrometryMethods0.000description1
- 238000000572ellipsometryMethods0.000description1
- 238000003366endpoint assayMethods0.000description1
- 239000002532enzyme inhibitorSubstances0.000description1
- 229940125532enzyme inhibitorDrugs0.000description1
- 230000001747exhibiting effectEffects0.000description1
- 239000002360explosiveSubstances0.000description1
- 239000000835fiberSubstances0.000description1
- 238000005206flow analysisMethods0.000description1
- 238000000684flow cytometryMethods0.000description1
- GNBHRKFJIUUOQI-UHFFFAOYSA-NfluoresceinChemical compoundO1C(=O)C2=CC=CC=C2C21C1=CC=C(O)C=C1OC1=CC(O)=CC=C21GNBHRKFJIUUOQI-UHFFFAOYSA-N0.000description1
- 238000001917fluorescence detectionMethods0.000description1
- 238000000799fluorescence microscopyMethods0.000description1
- 230000004907fluxEffects0.000description1
- 239000005350fused silica glassSubstances0.000description1
- IZOOGPBRAOKZFK-UHFFFAOYSA-KgadopentetateChemical compound[Gd+3].OC(=O)CN(CC([O-])=O)CCN(CC([O-])=O)CCN(CC(O)=O)CC([O-])=OIZOOGPBRAOKZFK-UHFFFAOYSA-K0.000description1
- 230000002496gastric effectEffects0.000description1
- 102000034238globular proteinsHuman genes0.000description1
- 108091005896globular proteinsProteins0.000description1
- 229960003180glutathioneDrugs0.000description1
- PCHJSUWPFVWCPO-UHFFFAOYSA-NgoldChemical compound[Au]PCHJSUWPFVWCPO-UHFFFAOYSA-N0.000description1
- 239000010931goldSubstances0.000description1
- 229910052737goldInorganic materials0.000description1
- 229920000578graft copolymerPolymers0.000description1
- 229960001340histamineDrugs0.000description1
- HNDVDQJCIGZPNO-UHFFFAOYSA-NhistidineNatural productsOC(=O)C(N)CC1=CN=CN1HNDVDQJCIGZPNO-UHFFFAOYSA-N0.000description1
- 239000000710homodimerSubstances0.000description1
- 125000004435hydrogen atomChemical group[H]*0.000description1
- 239000012216imaging agentSubstances0.000description1
- 238000003384imaging methodMethods0.000description1
- 230000006872improvementEffects0.000description1
- 238000000338in vitroMethods0.000description1
- 238000012623in vivo measurementMethods0.000description1
- 238000011065in-situ storageMethods0.000description1
- 238000012482interaction analysisMethods0.000description1
- 239000000138intercalating agentSubstances0.000description1
- 230000002452interceptive effectEffects0.000description1
- 238000002955isolationMethods0.000description1
- 230000009191jumpingEffects0.000description1
- 238000011898label-free detectionMethods0.000description1
- 238000012923label-free techniqueMethods0.000description1
- 238000002372labellingMethods0.000description1
- 229910052747lanthanoidInorganic materials0.000description1
- 150000002602lanthanoidsChemical class0.000description1
- 238000012417linear regressionMethods0.000description1
- 150000002632lipidsChemical group0.000description1
- 230000007774longtermEffects0.000description1
- 238000004020luminiscence typeMethods0.000description1
- 239000006249magnetic particleSubstances0.000description1
- 239000003550markerSubstances0.000description1
- 230000007246mechanismEffects0.000description1
- 230000010534mechanism of actionEffects0.000description1
- 230000004066metabolic changeEffects0.000description1
- 238000000386microscopyMethods0.000description1
- 230000003278mimic effectEffects0.000description1
- 238000007479molecular analysisMethods0.000description1
- 230000009149molecular bindingEffects0.000description1
- 238000000329molecular dynamics simulationMethods0.000description1
- 230000003990molecular pathwayEffects0.000description1
- 238000004651near-field scanning optical microscopyMethods0.000description1
- 239000002773nucleotideSubstances0.000description1
- 125000003729nucleotide groupChemical group0.000description1
- 239000003960organic solventSubstances0.000description1
- 230000008520organizationEffects0.000description1
- 230000010355oscillationEffects0.000description1
- 230000003647oxidationEffects0.000description1
- 238000007254oxidation reactionMethods0.000description1
- 239000001301oxygenSubstances0.000description1
- 229910052760oxygenInorganic materials0.000description1
- 238000009304pastoral farmingMethods0.000description1
- 210000005259peripheral bloodAnatomy0.000description1
- 239000011886peripheral bloodSubstances0.000description1
- ISWSIDIOOBJBQZ-UHFFFAOYSA-MphenolateChemical compound[O-]C1=CC=CC=C1ISWSIDIOOBJBQZ-UHFFFAOYSA-M0.000description1
- 229940031826phenolateDrugs0.000description1
- 238000005375photometryMethods0.000description1
- OXNIZHLAWKMVMX-UHFFFAOYSA-Npicric acidChemical compoundOC1=C([N+]([O-])=O)C=C([N+]([O-])=O)C=C1[N+]([O-])=OOXNIZHLAWKMVMX-UHFFFAOYSA-N0.000description1
- 229920003023plasticPolymers0.000description1
- 239000004417polycarbonateSubstances0.000description1
- 229920000515polycarbonatePolymers0.000description1
- 238000012643polycondensation polymerizationMethods0.000description1
- 229920000573polyethylenePolymers0.000description1
- 229920001155polypropylenePolymers0.000description1
- 229920002223polystyrenePolymers0.000description1
- 239000004810polytetrafluoroethyleneSubstances0.000description1
- 229920001343polytetrafluoroethylenePolymers0.000description1
- 238000004886process controlMethods0.000description1
- 230000001902propagating effectEffects0.000description1
- 230000002685pulmonary effectEffects0.000description1
- 239000002096quantum dotSubstances0.000description1
- 239000010453quartzSubstances0.000description1
- 230000005855radiationEffects0.000description1
- 229920005604random copolymerPolymers0.000description1
- 239000000376reactantSubstances0.000description1
- 230000009467reductionEffects0.000description1
- 230000001105regulatory effectEffects0.000description1
- 230000029058respiratory gaseous exchangeEffects0.000description1
- 230000002441reversible effectEffects0.000description1
- PYWVYCXTNDRMGF-UHFFFAOYSA-Nrhodamine BChemical compound[Cl-].C=12C=CC(=[N+](CC)CC)C=C2OC2=CC(N(CC)CC)=CC=C2C=1C1=CC=CC=C1C(O)=OPYWVYCXTNDRMGF-UHFFFAOYSA-N0.000description1
- YGSDEFSMJLZEOE-UHFFFAOYSA-MsalicylateChemical compoundOC1=CC=CC=C1C([O-])=OYGSDEFSMJLZEOE-UHFFFAOYSA-M0.000description1
- 229960001860salicylateDrugs0.000description1
- 210000003296salivaAnatomy0.000description1
- 238000012216screeningMethods0.000description1
- 238000007423screening assayMethods0.000description1
- 238000005204segregationMethods0.000description1
- 238000010187selection methodMethods0.000description1
- 239000002094self assembled monolayerSubstances0.000description1
- 239000013545self-assembled monolayerSubstances0.000description1
- 210000000582semenAnatomy0.000description1
- 238000012163sequencing techniqueMethods0.000description1
- 229940076279serotoninDrugs0.000description1
- 230000019491signal transductionEffects0.000description1
- 238000004557single molecule detectionMethods0.000description1
- 238000001542size-exclusion chromatographyMethods0.000description1
- 238000001374small-angle light scatteringMethods0.000description1
- 239000008149soap solutionSubstances0.000description1
- 235000017281sodium acetateNutrition0.000description1
- 239000001632sodium acetateSubstances0.000description1
- 239000007790solid phaseSubstances0.000description1
- 230000000392somatic effectEffects0.000description1
- 238000004611spectroscopical analysisMethods0.000description1
- 238000001228spectrumMethods0.000description1
- 230000007480spreadingEffects0.000description1
- 238000003892spreadingMethods0.000description1
- 230000006641stabilisationEffects0.000description1
- 238000011105stabilizationMethods0.000description1
- 229920003179starch-based polymerPolymers0.000description1
- 239000004628starch-based polymerSubstances0.000description1
- 238000012916structural analysisMethods0.000description1
- 238000006467substitution reactionMethods0.000description1
- 238000010189synthetic methodMethods0.000description1
- 229920001059synthetic polymerPolymers0.000description1
- 230000009897systematic effectEffects0.000description1
- ISXSCDLOGDJUNJ-UHFFFAOYSA-Ntert-butyl prop-2-enoateChemical compoundCC(C)(C)OC(=O)C=CISXSCDLOGDJUNJ-UHFFFAOYSA-N0.000description1
- 239000012085test solutionSubstances0.000description1
- 238000004861thermometryMethods0.000description1
- 230000036962time dependentEffects0.000description1
- 230000001988toxicityEffects0.000description1
- 231100000419toxicityToxicity0.000description1
- 239000003053toxinSubstances0.000description1
- 231100000765toxinToxicity0.000description1
- 108700012359toxinsProteins0.000description1
- 238000010361transductionMethods0.000description1
- 230000026683transductionEffects0.000description1
- 230000032258transportEffects0.000description1
- ZEWQUBUPAILYHI-UHFFFAOYSA-NtrifluoperazineChemical compoundC1CN(C)CCN1CCCN1C2=CC(C(F)(F)F)=CC=C2SC2=CC=CC=C21ZEWQUBUPAILYHI-UHFFFAOYSA-N0.000description1
- 229960002324trifluoperazineDrugs0.000description1
- 239000000015trinitrotolueneSubstances0.000description1
- 239000002753trypsin inhibitorSubstances0.000description1
- OUYCCCASQSFEME-UHFFFAOYSA-NtyrosineNatural productsOC(=O)C(N)CC1=CC=C(O)C=C1OUYCCCASQSFEME-UHFFFAOYSA-N0.000description1
- 241001515965unidentified phageSpecies0.000description1
- 230000003612virological effectEffects0.000description1
- 238000000196viscometryMethods0.000description1
- 210000004127vitreous bodyAnatomy0.000description1
- 238000001262western blotMethods0.000description1
- 239000002676xenobiotic agentSubstances0.000description1
Images


Classifications
- G—PHYSICS
- G01—MEASURING; TESTING
- G01N—INVESTIGATING OR ANALYSING MATERIALS BY DETERMINING THEIR CHEMICAL OR PHYSICAL PROPERTIES
- G01N33/00—Investigating or analysing materials by specific methods not covered by groups G01N1/00 - G01N31/00
- G01N33/48—Biological material, e.g. blood, urine; Haemocytometers
- G01N33/50—Chemical analysis of biological material, e.g. blood, urine; Testing involving biospecific ligand binding methods; Immunological testing
- G01N33/53—Immunoassay; Biospecific binding assay; Materials therefor
- G01N33/536—Immunoassay; Biospecific binding assay; Materials therefor with immune complex formed in liquid phase
- G—PHYSICS
- G01—MEASURING; TESTING
- G01N—INVESTIGATING OR ANALYSING MATERIALS BY DETERMINING THEIR CHEMICAL OR PHYSICAL PROPERTIES
- G01N21/00—Investigating or analysing materials by the use of optical means, i.e. using sub-millimetre waves, infrared, visible or ultraviolet light
- G01N21/17—Systems in which incident light is modified in accordance with the properties of the material investigated
- G01N21/19—Dichroism
- G—PHYSICS
- G01—MEASURING; TESTING
- G01N—INVESTIGATING OR ANALYSING MATERIALS BY DETERMINING THEIR CHEMICAL OR PHYSICAL PROPERTIES
- G01N21/00—Investigating or analysing materials by the use of optical means, i.e. using sub-millimetre waves, infrared, visible or ultraviolet light
- G01N21/17—Systems in which incident light is modified in accordance with the properties of the material investigated
- G01N21/41—Refractivity; Phase-affecting properties, e.g. optical path length
- G01N21/4133—Refractometers, e.g. differential
- G—PHYSICS
- G01—MEASURING; TESTING
- G01N—INVESTIGATING OR ANALYSING MATERIALS BY DETERMINING THEIR CHEMICAL OR PHYSICAL PROPERTIES
- G01N21/00—Investigating or analysing materials by the use of optical means, i.e. using sub-millimetre waves, infrared, visible or ultraviolet light
- G01N21/17—Systems in which incident light is modified in accordance with the properties of the material investigated
- G01N21/41—Refractivity; Phase-affecting properties, e.g. optical path length
- G01N21/45—Refractivity; Phase-affecting properties, e.g. optical path length using interferometric methods; using Schlieren methods
- G—PHYSICS
- G01—MEASURING; TESTING
- G01N—INVESTIGATING OR ANALYSING MATERIALS BY DETERMINING THEIR CHEMICAL OR PHYSICAL PROPERTIES
- G01N2201/00—Features of devices classified in G01N21/00
- G01N2201/02—Mechanical
- G01N2201/022—Casings
- G01N2201/0221—Portable; cableless; compact; hand-held
Definitions
- back-scattering interferometryis a free-solution label-free technique with the added benefit of sensitivity that rivals fluorescence (Bornhop et al. (2007) Free-solution, label-free molecular interactions studied by back-scattering interferometry. Science 317(5845):1732-1736).
- MSmass spectrometry
- the inventionin one aspect, relates to free-solution analytical methods for use in the detection of molecular interactions between non-immobilized analytes and/or characteristic properties of a sample.
- Disclosed are free-solution analytical methodscomprising detecting molecular interactions between a first non-immobilized analyte and a second non-immobilized analyte, wherein the detection is performed by refractive index sensing other than backscattering interferometry or by circular dichroism.
- free-solution analytical methodscomprising the steps of: (a) providing a refractive index sensor for reception of a fluid sample to be analyzed; (b) introducing a first sample comprising a first non-immobilized analyte to be analyzed and a second sample comprising a second non-immobilized analyte to be analyzed onto the sensor, wherein the first analyte is allowed to interact with the second analyte; (c) interrogating the fluid sample with light; (d) detecting the light after interaction with the fluid sample, wherein the detected light is not backscattered; and (e) detecting a molecular interaction between the first and second analyte.
- free-solution analytical methodscomprising detecting molecular interactions between a first non-immobilized analyte and a second non-immobilized analyte, wherein the determination comprises determining the degree of polymerization, protein folding, protein aggregation, blood oxygenation, the conformational state of an ion channel or membrane protein, or the hydration state of an ion channel or membrane protein, and wherein the determination is performed by refractive index sensing.
- free-solution analytical methodscomprising determining the degree of polymerization, protein folding, protein aggregation, blood oxygenation, the conformational state of an ion channel or membrane protein, or the hydration state of an ion channel or membrane protein, and wherein the determination is performed by refractive index sensing.
- Also disclosed are systemscomprising a refractive index sensor for detecting molecular interactions between a first non-immobilized analyte and a second non-immobilized analyte, and a pressure change compensator.
- free-solution analytical methodscomprising detecting a molecular change, wherein the detection is performed by refractive index sensing other than backscattering interferometry.
- FIG. 1A and FIG. 1Bshow representative block diagrams of a refractometer ( 1 A) and a forward scattering interferometer ( 1 B).
- FIG. 2shows a representative block diagram of a circular dichroism spectrometer.
- FIG. 3shows a representative diagram of exemplary reference and sample contents.
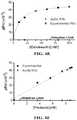
- FIG. 4A and FIG. 4Bshow representative data illustrating the A-form to B-form transition of the DNA duplex.
- FIG. 4Ashows a representative CD spectra of the DNA duplex (inset shows the A-form to B-form transition monitored at 270 nm by ellipticity).
- FIG. 4Bshows a representative correlation for BSI signal and ellipticity.
- FIG. 5A and FIG. 5Bshow representative data illustrating the predicted versus BSI experimental values for the CaM binding system ( 5 A) and the correlation of ⁇ exp and ⁇ model of the unsegregated learning set ( 5 B).
- FIG. 6A-Fshow representative data related to the predicted d ⁇ /dc ⁇ RIU.
- FIG. 7A and FIG. 7Bshow representative comparisons of experimental and modeled d ⁇ /dc signal. Specifically, plots showing the experimental BSI signal in RIU with the calculated d ⁇ /dc signal for recoverin binding Ca 2+ ( 7 A) and carbonic anhydrase II binding dansylamide ( 7 B).
- FIG. 8shows a representative illustration of the procedure for using BSI to measure a binding affinity.
- FIG. 9A-Fshow representative BSI block diagrams showing the orientation of the beam relative to the chip ( 7 A-C), a representative image of the fringe pattern ( 7 D), a representative line profile of the region of interest for a good fringe pattern ( 7 E), and a representative FFT spectrum for that region of interest (ROI) ( 7 F).
- FIG. 10A and FIG. 10Bshow representative fringe patterns with good ( 7 A) and bad ( 7 B) alignment.
- FIG. 11A and FIG. 11Bshow representative images illustrating the optical modeling of the beam path for BSI.
- FIG. 11Ashows a representative image of ten parallel rays impinged on a chip from the right that are allowed to refract and reflect and exit to the right and interfering.
- FIG. 11Bshows a representative image of a many beam optical ray trace of a semicircular channel in a microfluidic chip.
- FIG. 12A-Dshow representative ribbon drawings for Calmodulin unbound (PDB: 1CFD) ( 12 A), bound to Calcium (PDB: 1OSA) ( 12 B), bound to M13 (PDB: 1CDL) ( 12 C), and bound to TFP (PDB: 1CTR) ( 12 D).
- FIG. 13A and FIG. 13Bshow representative plots showing the correlation of ⁇ exp and ⁇ model when the learning sets are split into small ( 13 A) and large ( 13 B) ⁇ values.
- FIG. 14A and FIG. 14Bshow representative flow diagrams for predicting the suitable model (small or large) for a binding pair ( 14 A) and for predicting the model for the entire learning set ( 14 B).
- FIG. 15A and FIG. 15Bshow representative experimental and modeled FreeSRF binding curves for Recoverin-Ca 2+ ( 15 A) and carbonic anhydrase II-Dansylamide ( 15 B).
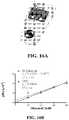
- FIG. 16A-Dshow representative data illustrating Cyfra 21-1 binding CK19 as measured via a hand-held refractometer. Specifically, FIG. 16A shows a representative image of a hand-held Reichert RI Detector. FIG. 16B shows representative data illustrating the response of a hand-held RI detector for glycerol calibration standards.
- FIG. 16Cshows representative data illustrating label-free, free-solution detection of Cyfra 21-1 in PBS using a hand-held RI detector.
- FIG. 16Dshows representative data illustrating the comparison of signal at 50 ng/mL using a hand-held RI detector and a BSI detector.
- FIG. 17A and FIG. 17Bshow representative images of recoverin before ( 17 A) and after ( 17 B) Ca 2+ binding.
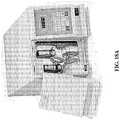
- FIG. 18A and FIG. 18Bshow representative images of a RI detector ( 18 A) and the flow path within a RI detector ( 18 B).
- FIG. 19shows representative data illustrating the response of a RI detector for glycerol calibration standards.
- FIG. 20shows representative data illustrating label-free, free-solution detection of mannose in buffer using a RI detector.
- FIG. 21A and FIG. 21Bshow representative data illustrating label-free, free-solution detection of benzene sulfonamide in buffer binding to 50 nM CAII ( 21 A) and 10 nM CAII ( 21 B) using a RI detector.
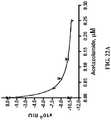
- FIG. 22A and FIG. 22Bshow representative data illustrating label-free, free-solution detection of acetazolamide in buffer using a RI detector.
- Rangescan be expressed herein as from “about” one particular value, and/or to “about” another particular value. When such a range is expressed, another aspect includes from the one particular value and/or to the other particular value. Similarly, when values are expressed as approximations, by use of the antecedent “about,” it will be understood that the particular value forms another aspect. It will be further understood that the endpoints of each of the ranges are significant both in relation to the other endpoint, and independently of the other endpoint. It is also understood that there are a number of values disclosed herein, and that each value is also herein disclosed as “about” that particular value in addition to the value itself. For example, if the value “10” is disclosed, then “about 10” is also disclosed. It is also understood that each unit between two particular units are also disclosed. For example, if 10 and 15 are disclosed, then 11, 12, 13, and 14 are also disclosed.
- the terms “optional” or “optionally”means that the subsequently described event or circumstance may or may not occur, and that the description includes instances where the event or circumstance occurs and instances where it does not.
- polymerrefers to a relatively high molecular weight organic compound, natural or synthetic (e.g., polyethylene, rubber, cellulose), whose structure can be represented by a repeated small unit, the monomer (e.g., ethane, isoprene, ⁇ -glucose).
- synthetic polymersare typically formed by addition or condensation polymerization of monomers.
- copolymerrefers to a polymer formed from two or more different repeating units (monomer residues).
- a copolymercan be an alternating copolymer, a random copolymer, a block copolymer, or a graft copolymer.
- bioassayrefers to a procedure for determining the concentration, purity, and/or biological activity of a substance.
- the term “chemical event”refers to a change in a physical or chemical property of an analyte in a sample that can be detected by the disclosed systems and methods.
- a change in refractive index (RI), solute concentration and/or temperaturecan be a chemical event.
- a biochemical binding or association (e.g., DNA hybridization) between two chemical or biological speciescan be a chemical event. That is, a chemical event can be the formation of one or more interaction products of the interaction of a first analyte with a second analyte.
- a disassociation of a complex or moleculecan also be detected as an RI change.
- a change in temperature, concentration, and association/dissociationcan be observed as a function of time.
- bioassayscan be performed and can be used to observe a chemical event.
- the terms “equilibrium constant” and “Kc” and “Keq”refer to the ratio of concentrations when equilibrium is reached in a reversible reaction.
- the equilibrium constantcan be expressed by:
- K c[ C ] c ⁇ [ D ] d [ A ] a ⁇ [ B ] b .
- An equilibrium constantcan be temperature- and pressure-dependent but has the same value, irrespective of the amounts of A, B, C, and D.
- a specific type of equilibrium constant that measures the propensity of a larger object to separate (dissociate) reversibly into smaller componentsis a “dissociation constant” or “Kd.”
- a dissociation constantis the inverse of an “affinity constant.”
- dissociation rateis a concentration dependent quantity and involves the “dissociation rate constant” or “K D .”
- the dissociation rate constantrelates the rate at which molecules dissociate to the concentration of the molecules.
- a dissociationcan be described as AB ⁇ A+B, and the rate of dissociation (dissociation rate) is equal to K D [AB]. In general, the larger the value of K D , the faster the inherent rate of dissociation.
- association rateis a concentration dependent quantity and involves the “association rate constant” or “K A .”
- the association rate constantrelates the rate at which molecules associate to the concentration of the molecules.
- An associationcan be described as A+B ⁇ AB, and the rate of association (association rate) is equal to K A [A][B].
- K Athe rate of association
- the larger the value of K Athe faster the inherent rate of association.
- free-solutionrefers to a lack of surface immobilization.
- the termis not meant to exclude the possibility that one or more molecules or atoms of analyte may associate with a surface. Rather, the term can describe the detection of an analyte without the requirement for surface immobilization during analysis.
- label-free and “unlabeled”describe a detection method wherein the detectability of an analyte is not dependent upon the presence or absence of a detectable label.
- label-freecan refer to the lack of a detectable label. It is understood that the ability of a label to be detected can be dependent upon the detection method. That is, an analyte having a moiety capable of serving as a detectable label for a first detection method can be considered “label-free” or “unlabeled” when a second detection method (wherein the label is not detectable) is employed.
- the analytes employed in the disclosed systems and methodscan lack detectable labels.
- the term “detectable label”refers to any moiety that can be selectively detected in a screening assay. Examples include without limitation, radiolabels (e.g., 3 H, 14 C, 35 S, 125 I, 131 I), affinity tags (e.g. biotin/avidin or streptavidin), metal binding domains, epitope tags, FLASH binding domains (see U.S. Pat. Nos. 6,451,569; 6,054,271; 6,008,378 and 5,932,474), glutathione or maltose binding domains, photometric absorbing moieties, fluorescent or luminescent moieties (e.g.
- detectable labelscan be formed in situ, for example, through use of an unlabeled primary antibody which can be detected by a secondary antibody having an attached detectable label.
- imaging agentssuch as radioconjugate, cytotoxin, cytokine, Gadolinium-DTPA, a quantum dot, iron oxide, and manganese oxide.
- compositions of the inventionDisclosed are the components to be used to prepare the compositions of the invention as well as the compositions themselves to be used within the methods disclosed herein.
- these and other materialsare disclosed herein, and it is understood that when combinations, subsets, interactions, groups, etc., of these materials are disclosed that while specific reference of each various individual and collective combinations and permutation of these compounds may not be explicitly disclosed, each is specifically contemplated and described herein. For example, if a particular compound is disclosed and discussed and a number of modifications that can be made to a number of molecules including the compound are discussed, specifically contemplated is each and every combination and permutation of the compound and the modifications that are possible unless specifically indicated to the contrary.
- compositions disclosed hereinhave certain functions. Disclosed herein are certain structural requirements for performing the disclosed functions, and it is understood that there are a variety of structures that can perform the same function that are related to the disclosed structures, and that these structures will typically achieve the same result.
- systemscomprising a refractive index sensor for detecting molecular interactions between a first non-immobilized analyte and a second non-immobilized analyte, and a pressure change compensator.
- both analytesare unlabeled.
- at least one of the analytesis present in an amount of less than about 1.0 ⁇ 10 ⁇ 3 M.
- refractive sensingrefers to the measurement of the refractive index of a sample, for example, a fluid sample.
- the refractive index or change in refractive index of a samplecan be used to determine a variety of biologically important measurements including, but not limited to, an equilibrium constant, a dissociation constant, a dissociation rate, an association rate, a concentration of an analyte, and the presence of an analyte.
- Refractive index measurementsare also used in other applications such as, for example, process control and the detection of explosives (Bowen et al. (2003) “Gas phase detection of trinitrotoluene utilizing a solid-phase antibody immobilized on a gold film by means of surface plasmon resonance spectroscopy” Appl. Spectrosc. 57(8): 906-914).
- FIG. 1AVarious devices and techniques for measuring refractive index are known. These include the Abbe-type refractometer (see FIG. 1A ), and sensors based on surface plasmon resonance.
- Optical waveguidescan also be used. The presence of a liquid adjacent to an optical waveguide can alter the effective modal index of light propagating within the waveguide. This modification of index can be measured using techniques that are sensitive to changes in optical path length. For example, interferometer structures have been used to measure index changes and hence to sense the presence of proteins (Heideman et al. (1993) “Performance of a highly sensitive optical wave-guide Mach-Zehnder interferometer immunosensor” Sensors and Actuators B—Chemical 10(3): 209-217) (see FIG. 1B ).
- FIG. 1Aa block diagram of an exemplary Abbe-type refractometer is illustrated.
- the sampleis contained between two prisms, the illuminating prism and the measuring prism.
- the light sourcegenerates light, which enters the sample from the illuminating prism.
- the surface of the illuminating prismis matted, so that light enters the sample at all possible angles, including those almost parallel to the surface.
- the lightis then refracted at the critical angle at the bottom surface of the measuring prism and directed into the telescope.
- two Amici prisms that can be rotatedare located within the telescope (not shown), which can be used to correct the dispersion.
- the telescopeis used to measure the position of the border between dark and light areas. Knowing the angle and refractive index of the measurement prism allows for the refractive index of the sample to be calculated.
- FIG. 1Ba block diagram of an exemplary Michelson interferometer is illustrated.
- a coherent light sourceemits light that hits a beam splitter. A portion of the light is transmitted directly through beam splitter to mirror A, while some is reflected in the direction of mirror B. Both beams are then reflected back onto the beam splitter to produce an interference pattern incident on the detector. If an angle is observed between the two returning beams the detector will record a sinusoidal fringe pattern. Alternatively, if there is perfect spatial alignment between the two returning beams, the detector will record a constant intensity over the beam dependent on the differential path length.
- the disclosed inventionprovides a method for detecting molecular interactions between a first non-immobilized analyte and a second non-immobilized analyte, wherein the detection is performed by refractive index sensing other than backscattering interferometry.
- refractive index (RI) detectorsinclude, but are not limited to, RI detectors based on the angle of deviation method of measurement, RI detectors based on the Fresnel method of RI measurement, a Christiansen effect detector, an interferometer detector, or a differential refractometer detector.
- Additional examplesinclude a refractomax 521 RI detector, a RID-20A RI detector, a RID-10A RI detector, a Waters RI detector, a Waters RI detector, a Wyatt RI detector, a HPLC, an Acquity RI detector, a 1260 Infinity RI detector, an Optilab RI detector, a Knauer RI detector, a Shimadzu RI detector, a Shodex RI detector, a LC-4000 Series RI detector, or other suitably sensitive RI detectors.
- detectionis performed by refractive index sensing other than forward scattering or side scattering interferometry.
- the first and/or second analytemay be contained in, e.g. flowed through, a capillary dimensioned flow channel such as a capillary tube.
- the cross-sectional depth of the channelis limited only by the coherence length of the light and its breadth is limited only by the width of the light beam.
- the depth of the channelis from 1 to 10 ⁇ m, but it may be from 1 to 20 ⁇ m or up to 50 ⁇ m or more, e.g. up to 1 mm or more. However, sizes of up to 5 mm or 10 mm or more are possible.
- the breadth of the channelis from 0.5 to 2 times its depth, e.g., equal to its depth.
- the channelmay comprise a substantially circular, generally semi-circular, or rectangular cross-section.
- the sampleis typically a liquid, and can be flowing or stationary. However, the sample can also be a solid or a gas in various aspects of the present invention.
- the first and/or further materialswill normally be solid but in principle can be liquid, e.g., can be formed by a sheathing flow of guidance liquid(s) in a microfluidic device, with the sample being sheathed flow of liquid between such guidance flows.
- the samplemay also be contained in a flow channel of appropriate dimensions in substrate such as a microfluidic chip. The method may therefore be employed to obtain a read out of the result of a reaction conducted on a “lab on a chip” type of device.
- the inventionincludes apparatus for use in performing a method as described, which apparatus comprises a source of spatially coherent light, a sample holder for receiving a sample upon which to perform the method positioned in a light path from the light source, a detector for detecting light, and data processing means for receiving measurements of light intensity from the detector and for conducting an analysis thereon, wherein the analysis comprised determining an equilibrium constant, a dissociation constant, a dissociation, rate an association rate, calculating a change in hydrodynamic volume, entropy, or enthalpy, the concentration of the first and/or second analyte, identifying the presence of the first and/or second analyte, or identifying the presence of a third analyte.
- the analysiscomprises quantification of the sample.
- the RI sensorcomprises a channel formed in a substrate, the channel has a longitudinal direction and a transverse direction, and a light source for generating a light, wherein the light is elongated in the longitudinal direction of the channel
- the channel of the present inventioncan be formed from a substrate such as a piece of silica or other suitable optically transmissive material.
- the material of composition of the substratehas a different index of refraction than that of the sample to be analyzed.
- the substratecan optionally be mounted and/or connected to a temperature control device.
- the substratecan be tilted, for example, about 7°, such that scattered light from channel can be directed to a detector.
- the channelhas a generally semi-circular cross-sectional shape.
- a unique multi-pass optical configurationis inherently created by the channel characteristics, and is based on the interaction of the unfocused laser beam and the curved surface of the channel that allows interferometric measurements in small volumes at high sensitivity.
- the channelcan have a substantially circular or generally rectangular cross-sectional shape.
- the substrate and channel togethercomprise a capillary tube.
- the substrate and channel togethercomprise a microfluidic device, for example, a silica substrate, or a polymeric substrate [e.g., polydimethylsiloxane (PDMS) or polymethyl methacrylate (PMMA)], and an etched channel formed in the substrate for reception of a sample, the channel having a cross sectional shape.
- a microfluidic devicefor example, a silica substrate, or a polymeric substrate [e.g., polydimethylsiloxane (PDMS) or polymethyl methacrylate (PMMA)], and an etched channel formed in the substrate for reception of a sample, the channel having a cross sectional shape.
- the cross sectional shape of a channelis semi-circular.
- the cross sectional shape of a channelis square, rectangular, or elliptical.
- the cross sectional shape of a channelcan comprise any shape suitable for use in a BSI technique.
- a substratecan comprise one or multiple channels of the same or varying dimensions.
- the channelcan have a radius of from about 5 to about 250 micrometers, for example, about 5, 10, 20, 30, 40, 50, 75, 100, 150, 200, or 250 micrometers.
- the channelcan have a radius of up to about 1 millimeter or larger, such as, for example, 0.5 millimeters, 0.75 millimeters, 1 millimeter, 1.25 millimeters, 1.5 millimeters, 1.75 millimeters, 2 millimeters, or more.
- the source of coherent lightis a laser, suitably a He—Ne laser or a diode laser or VCSEL.
- the laser lightmay be coupled to the site of measurement by known wave-guiding techniques or may be conventionally directed to the measurement site by free space transmission.
- the detected lightis representative of the refractive index of the sample.
- the measured refractive indexcan be indicative of a number of properties of the sample including, but not limited to, the presence or concentration of a solute substance, e.g., a reaction product, pressure, temperature, or flow rate (e.g., by determining when a thermal perturbation in a liquid flow reaches a detector).
- the detectoris a CCD array of suitable resolution.
- the apparatuscan comprise means for controlling the temperature of the sample, e.g., a heater and/or a Peltier cooler and a temperature measuring device.
- means for controlling the temperature of the samplee.g., a heater and/or a Peltier cooler and a temperature measuring device.
- the inventionincludes apparatus as described herein, wherein the sample holder is configured to allow a sample to flow there through and wherein the sample holder is connected to receive a separated sample from a sample separation device in which components of a mixed sample are separated, e.g., by capillary electrophoresis, capillary electrochromatography, or HPLC. Accordingly, viewed from another perspective, the invention provides chromatography apparatus having a refractive index measuring unit as described herein as a detector.
- the sample holder of the apparatus described abovecan be a flow through passage so that the contents of the channel may be continuously monitored to observe changes in the content thereof. These changes may include the temporary presence of cells and the out flow from the sample holder may be diverted to a selected one of two or more outlet channels according to the measurements of refractive index observed in the sample holder, e.g., to achieve sorting of cells in response to such measurements.
- the sample holdercan contain a stationary analytical reagent (e.g., a coating of an antibody, oligonucleotide, or other selective binding agent) and changes in the refractive index caused by the binding of a binding partner to the reagent may be observed.
- the sample holdercan contain a biological cell and metabolic changes therein may be observed as changes in the refractive index of the cell.
- the sample solution and the reference solutionmay be picked up individually into a cell such as, for example, a capillary tube.
- a cellsuch as, for example, a capillary tube.
- Each sampleis then loaded into a tray for reading.
- the traycan have several cells (e.g., capillaries) integrated into it. In this way, the samples are delivered to the individual cells for introduction into the sensor for analysis.
- the inventionrelates to a method for detecting molecular interactions between a first non-immobilized analyte and a second non-immobilized analyte, wherein the detection is performed by refractive index sensing other than backscattering interferometry, wherein the detection comprises determining refractive index variations in the intensity of reflections of light which has passed through the first and second analyte.
- detectionis performed by refractive index sensing other than forward scattering or side scattering interferometry.
- the systemmay comprise a pressure change compensator.
- a pressure change compensatorcan balance the pressure inside and outside of the detection system by compensating for variations in the volume of the liquid within the system, which may be due to variations in the ambient pressure and/or temperature.
- pressure compensatorsinclude, but are not limited to, a back-pressure restrictor and a capillary restrictor.
- the systemmay comprise a temperature change compensator.
- a temperature change compensatorcan balance the temperature inside and outside of the detection system by compensating for variations in the temperature of the liquid within the system, which may be due to, for example, variations in the ambient pressure and/or temperature.
- the temperature change compensatorcan change the temperature of the incoming mobile phase to match that of the solvent in the detector.
- temperature compensatorsinclude, but are not limited to, a thermostat cabinet, a thermoelectric temperature controller (e.g., Peltier) and a heat exchanger.
- Circular dichroismis the difference in the absorption of left-handed circularly polarized light (L-CPL) and right-handed circularly polarized light (R-CPL) and occurs when a molecule contains one or more chiral chromophores (light-absorbing groups).
- CDhas a wide range of applications including, but not limited to, analyzing the structure of small molecules, DNA, peptides, nucleic acids, carbohydrates, and proteins, identifying charge-transfer transitions, determining geometric and electronic structure, and analyzing molecular interactions.
- CD spectraare measured using a circular dichroism spectrometer (see FIG. 2 ).
- the disclosed inventionprovides a method for detecting molecular interactions between a first non-immobilized analyte and a second non-immobilized analyte, wherein the detection is performed by circular dichroism.
- FIG. 2a block diagram of an exemplary CD spectrometer is illustrated.
- the light sourceemits light that hits the monochromator (MC).
- a narrow band of wavelengthsthen pass through the linear polarizer (LP), which splits the unpolarized monochromatic beam into two linearly polarized beams.
- LPlinear polarizer
- one of the two linearly polarized beamspasses through the photoelastic modulator (PEM), which consists of a plate made of a transparent, optically isotropic material bonded to a piezoelectric quartz crystal.
- PEMphotoelastic modulator
- the light emerging from the PEMswitches from L-CPL to R-CPL and back with the frequency of the applied electric field.
- the detector outputconsists of a signal with a small alternating current (AC) component superimposed on a direct current (DC) component.
- the AC componentis filtered out and amplified.
- the ratio of the AC to the DC componentis directly proportional to the circular dichroism of the sample, and this quantity is recorded as a function of wavelength to provide a CD spectrum.
- free-solution analytical methodscomprising detecting molecular interactions between a first non-immobilized analyte and a second non-immobilized analyte, wherein the detection is performed by refractive index sensing other than backscattering interferometry or by circular dichroism. In a further aspect, detection is performed by refractive index sensing other than forward scattering or side scattering interferometry.
- free-solution analytical methodscomprising the steps of: (a) providing a refractive index sensor for reception of a fluid sample to be analyzed; (b) introducing a first sample comprising a first non-immobilized analyte to be analyzed and a second sample comprising a second non-immobilized analyte to be analyzed onto the sensor, wherein the first analyte is allowed to interact with the second analyte; (c) interrogating the fluid sample with light; (d) detecting the light after interaction with the fluid sample, wherein the detected light is not backscattered; and (e) detecting a molecular interaction between the first and second analyte.
- free-solution analytical methodscomprising detecting molecular interactions between a first non-immobilized analyte and a second non-immobilized analyte, wherein the determination comprises determining the degree of polymerization, protein folding, protein aggregation, blood oxygenation, the conformational state of an ion channel or membrane protein, or the hydration state of an ion channel or membrane protein, and wherein the determination is performed by refractive index sensing.
- the methodcomprises the steps of: (a) providing a refractive index sensor for reception of a fluid sample to be analyzed; (b) introducing a first sample comprising a first non-immobilized analyte to be analyzed and a second sample comprising a second non-immobilized analyte to be analyzed onto the sensor, wherein the first analyte is allowed to interact with the second analyte to form one or more interaction products; (c) interrogating the fluid sample with light; (d) detecting the deflected and/or refracted light after interaction with the fluid sample, wherein the light is not backscattered; and (e) detecting a molecular interaction between the first and second analyte.
- free-solution analytical methodscomprising determining the degree of polymerization, protein folding, protein aggregation, blood oxygenation, the conformational state of an ion channel or membrane protein, or the hydration state of an ion channel or membrane protein, and wherein the determination is performed by refractive index sensing.
- refractive index sensingis not via backscattering interferometry.
- the lightis not scattered.
- refractive index sensingis via a refractometer. In a still further aspect, refractive index sensing is via interferometry. In yet a further aspect, refractive index sensing is via forward scattering interferometry. In an even further aspect, refractive index sensing is via backscattering interferometry. In a still further aspect, refractive index sensing is via a hand-held refractive index sensing device.
- the methodcan be used to determine, for example, one or more of an equilibrium constant, a dissociation constant, a dissociation rate, a dissociation rate constant, an association rate, and/or an association rate constant of the interaction.
- the methodcan be used to determine, for example, the concentration of the first and/or second analyte.
- the methodcan be used to determine, for example, the presence of the first and/or second analyte.
- the methodcan be used to determine, for example, the presence of a third analyte.
- Each of the one or more analytescan be introduced onto the sensor in a sample. Two or more analytes can be present in the same or in different samples. Each of the one or more analytes can independently be present in a suitable concentration, for example, a concentration of less than about 5.0 ⁇ 10 ⁇ 4 M, of less than about 1.0 ⁇ 10 ⁇ 4 M, of less than about 5.0 ⁇ 10 ⁇ 5 M, of less than about 1.0 ⁇ 10 ⁇ 5 M, of less than about 5.0 ⁇ 10 ⁇ 6 M, of less than about 1.0 ⁇ 10 ⁇ 6 M, of less than about 5.0 ⁇ 10 ⁇ 7 M, of less than about 1.0 ⁇ 10 ⁇ 7 M, a concentration of less than about 5.0 ⁇ 10 ⁇ 8 M, of less than about 1.0 ⁇ 10 ⁇ 8 M, of less than about 5.0 ⁇ 10 ⁇ 9 M, of less than about 1.0 ⁇ 10 ⁇ 9 M, of less than about 1.0 ⁇ 10 ⁇ 10 M, of less than about 5.0 ⁇ 10 ⁇ 10 M, of less than about
- the interactioncan be a biomolecular interaction.
- two analytescan associate to provide an interaction product (e.g., adduct, complex, or new compound).
- an analytecan dissociate to provide two or more interaction products.
- more than two analytescan be involved in the interaction.
- the first and/or second analyteis a complex.
- the complexis a chemical or biochemical complex.
- the complexwas formed prior to the introducing step. In an even further aspect, the complex was formed subsequent to the introducing step.
- the disclosed techniquescan determine the interaction between one or more analytes by monitoring, measuring, and/or detecting the formation and/or steady state relative abundance of one or more analyte interaction products from the interaction of the one or more analytes.
- the determinationcan be performed qualitatively or quantitatively.
- Interaction rate informationcan be derived from various measurements of the interaction.
- the first sampleis combined with the second sample prior to introduction. That is, the analytes are combined (and potentially interacting) prior to performing the disclosed methods.
- the step of introducing the first sample and the step of introducing the second sampleare performed simultaneously.
- the first sampleis combined with the second sample after introduction. That is, the analytes can be combined at a point before the sensor, or at a point on the sensor, when performing the disclosed methods.
- the step of introducing the first analyte and the step of introducing the second analyteare performed either simultaneously or sequentially.
- the detecting stepis performed during the interaction of the first analyte with the second analyte.
- the first and second samplesare introduced simultaneously.
- the first and second samplesare introduced sequentially.
- the first analyteis allowed to interact with the second analyte prior to introducing the first and/or second sample onto the sensor.
- the first analyteis allowed to interact with the second analyte after introducing the first and/or second sample onto the sensor.
- the first analyteis allowed to interact with the second act while introducing the first and/or second sample onto the sensor.
- a first sample(e.g., a solution including a first non-immobilized analyte to be analyzed) can be introduced onto the refractive index sensor.
- the first samplecan be provided having a known concentration of the first analyte.
- a baseline responsecan then be established by directing light onto the first sample.
- a second sample(e.g., a solution including a second non-immobilized analyte to be analyzed) can then be introduced onto the refractive index sensor.
- the second samplecan be provided as a pre-mixed sample of the first non-immobilized analyte and the second non-immobilized analyte or provided by adding a sample comprising the second non-immobilized analyte to the first sample.
- the first sampleis a solution of the first analyte, which is displaced on the sensor by the introduction of the second sample, which is a solution of both the first analyte and the second analyte.
- the second samplecan be provided having a known concentration of the first analyte, which can be the same as the concentration of the first analyte in the first solution.
- the second samplecan also be provided having a known concentration of the second analyte. Light can then be directed onto the sensor.
- a reference samplecan be introduced onto the refractive index sensor.
- the reference samplecan be introduced onto the refractive index sensor prior to or subsequent to introduction of the first and/or second sample.
- the reference samplecomprises a first non-immobilized analyte to be analyzed.
- the methodfurther comprises the steps of: (a) interrogating the reference sample with light; (b) detecting the light after interaction with the reference sample, wherein the detected light is not backscattered; (c) determining a characteristic of the reference sample; and (e) employing the characteristic of the reference sample to compensate for background interference effects in the determination of the molecular interaction between the first and second analyte. Exemplary reference samples are illustrated in FIG. 3 .
- the reference samplecan be a ligand alone in the absence of the matrix, more often referred to as a blank.
- Reference samplesare typically comprised of the ligand in the experimental matrix (cell vesicle, cell lysate, serum, urine, other biofluids, etc.) that does not contain the receptor. Examples include, but are not limited to, cell-based matrices that do not contain the receptor, null lipoparticles (devoid of the target receptor), empty viral particle/bacteriophage scaffolds, and an experimental matrix stripped of receptor.
- the reference samplecan be the experimental matrix containing the receptor with a non-binding analyte molecule that is similar to the ligand.
- examplesinclude, but are not limited to, a denatured ligand, an isotype matched antibody for a different compound, a compound with a similar structural backbone as the ligand that has additional or removed functional groups (e.g., phenol versus 2,4,6-trinitrophenol, dopamine versus 3-methoxytyramine, tyrosine versus 3-nitrotyrosine, serotonin versus tryptophan, histamine versus histidine), a nonsense nucleic acid strand of the same length, a nucleic acid stand with >3 base-pair mismatch, a compound of similar size as the ligand known to not bind the receptor, and other molecules known to non-specifically bind to the matrix (e.g., cholesterol for membrane based experiments).
- a denatured ligandan isotype matched antibody for a
- the reference samplecan be the ligand with the experimental matrix containing the receptor (cell-based matrices, tissues-based matrices, serum, urine, other biofluids, etc.) that has been treated to inhibit binding.
- the receptorinclude, but are not limited to, enzyme treatment of the receptor, blocking of the receptor with an antibody, blocking of the receptor with a known binding compound, blocking of the receptor with an inhibitor, denaturation of the receptor, receptor without the cofactors necessary for binding, (e.g., calmodulin without Ca 2+ , concanavalin A without Mn 2+ and Ca 2+ , recoverin without Ca 2+ , etc.).
- the first analyte and/or the second analyteis/are unlabeled. While the disclosed methods can be used in connection with unlabeled analytes, it is contemplated that the analytes can be optionally labeled. Such labeling can be convenient for preceding, subsequent, or simultaneous analysis by other analytical methods. In a still further aspect, at least one of the analytes is unlabeled. In yet a further aspect, both analytes are unlabeled.
- the first and/or second analyteis one or more of an antibody, an antigen, a protein, a small molecule, a drug, a receptor, a cell, an oligonucleotide, a carbohydrate, an enzyme, a substrate, a DNA, an aptamer, a RNA, a nucleic acid, a biomolecule, a molecular imprint, a protein mimetic, an antibody derivative, a lectin, a cell membrane, an ion, a virus particle, a bacteria, and a micro-RNA.
- detecting a molecular interactioncomprises determining a change in a physical or chemical property of the first and/or second sample.
- the change in a physical or chemical property of the first and/or second samplecorresponds to the formation of one or more interaction products.
- detecting a molecular interactioncomprises determining an equilibrium constant, a dissociation constant, a dissociation rate, or an association rate. In a still further aspect, detecting comprises determining the concentration of the first and/or second analyte. In yet a further aspect, detecting comprises identifying the presence of a third analyte. In an even further aspect, calculating a change in hydrodynamic volume, entropy, or enthalpy.
- detecting a molecular interactioncomprises determining a change in a physical or chemical property of the fluid sample.
- the change in physical or chemical property of the fluid samplecorresponds to the formation of one or more interaction products.
- the molecular interactionis the formation of one or more covalent bonds, electrostatic bonds, hydrogen bonds, or hydrophobic interactions.
- the molecular interactionis a binding event between one or more of antibody-antigen, protein-protein, small molecule-small molecule, small molecule-protein, drug-receptor, antibody-cell, virus-cell, virus-protein, bacteria-cell, bacteria-protein, virus-DNA, virus-RNA, bacteria-DNA, bacteria-RNA, protein-cell, oligonucleotide-cell, carbohydrate-cell, cell-cell, enzyme-substrate, protein-DNA, protein-aptamer, DNA-DNA, RNA-DNA, DNA-RNA, protein-RNA, small molecule-nucleic acid, biomolecule-molecular imprint, biomolecule-protein mimetic, biomolecule-antibody derivatives, lectin-carbohydrate, biomolecule-carbohydrate, small molecule-cell membrane, ion-protein, and protein-protein.
- the molecular interactioncomprises one or more of a change in conformational structure of the first and/or second analyte and a change in hydration of the first and/or second analyte. In a still further aspect, the molecular interaction comprises a change in conformational structure of the first and/or second analyte. In yet a further aspect, the molecular interaction comprises a change in hydration of the first and/or second analyte. In an even further aspect, the molecular interaction comprises a change in conformational structure of the first and/or second analyte and a change in hydration of the first and/or second analyte.
- the molecular interactionlacks a change in mass. In a still further aspect, the molecular interaction is a chemical reaction.
- the first and/or second sampleis a fluid sample.
- a fluid samplecan comprise at least one of a liquid or a gas.
- a fluid samplecomprises a solution of one or more analytes and one or more liquid solvents.
- a solutioncan be provided in an organic solvent or in water.
- the solutioncan comprise man-made preparations or naturally occurring substances.
- the solutioncan comprise a body fluid (e.g., peripheral blood, urine, cerebrospinal fluid, pulmonary lavage, gastric lavage, bile, vaginal secretions, seminal fluid, aqueous humor, vitreous humor, serum, and saliva) from a human, a mammal, another animal, or a plant.
- the refractive index sensorcomprises a prism.
- the refractive index sensorcomprises a substrate having a first channel formed therein for reception of a fluid sample to be analyzed and wherein the first and second analyte are introduced into the channel.
- the substrate and channelcan comprise any material suitable for containing and providing a sample for analysis and capable of being interrogated by light.
- the substrate and channel togethercomprise a capillary tube.
- the substrate and channel togethercomprise a microfluidic device.
- the microfluidic devicecomprises a polymeric substrate and an etched channel formed in the substrate for reception of a fluid sample, the channel having a cross sectional shape.
- the polymeric substratecan be selected from rigid and transparent plastics.
- the polymeric substratecomprises one or more polymers selected from polycarbonate, polydimethylsiloxane, fluorosilicone, polytetrafluoroethylene, poly(methyl methacrylate), polyhexamethyldisilazane, polypropylene, starch-based polymers, epoxy, and acrylics.
- the microfluidic devicecomprises a silica substrate and an etched channel formed in the substrate for reception of a fluid sample, the channel having a cross sectional shape, which can be substantially circular, substantially semi-circular, or substantially rectangular, as disclosed herein.
- the first channelis configured for reception of two or more fluid samples by having at least two inlets positioned at opposing locations of the channel, and at least one outlet positioned at a point between the at least two inlets, thereby defining a right side of the channel and a left side of the channel and wherein the first sample is introduced into the right side of the channel and the second sample is introduced into the left side of the channel.
- the substratecan comprise one or more than one channel.
- the substratefurther comprises a second channel.
- the first analyteis introduced into the first channel and the second analyte is introduced into the second channel.
- the first and second analyteare introduced into the first channel.
- the substratefurther comprises a reference channel.
- the methodfurther comprises the steps of: (a) introducing a reference sample; (b) interrogating the reference sample with light; (c) detecting the light after interaction with the reference sample, wherein the detected light is not backscattered; (d) determining a characteristic of the reference sample; and (e) employing the characteristic of the reference sample to compensate for background interference effects in the determination of the molecular interaction between the first and second analyte in the first channel.
- the disclosed methodscan provide real-time, free-solution detection of molecular interactions with very low detection limits. That is, in one aspect, the invention relates to a free-solution analytical method for detecting molecular interactions comprising the step of detecting a molecular interaction between two non-immobilized analytes, wherein at least one of the analytes is present during the determination at a concentration of less than about 5.0 ⁇ 10 ⁇ 4 M.
- the concentrationcan be less than about 1.0 ⁇ 10 ⁇ 4 M, for example, less than about 5.0 ⁇ 10 ⁇ 5 M, less than about 1.0 ⁇ 10 ⁇ 5 M, less than about 5.0 ⁇ 10 ⁇ 6 M, less than about 1.0 ⁇ 10 ⁇ 6 M, less than about 5.0 ⁇ 10 ⁇ 7 M, less than about 1.0 ⁇ 10 ⁇ 7 M, less than about 5.0 ⁇ 10 ⁇ 8 M, less than about 1.0 ⁇ 10 ⁇ 8 M, less than about 5.0 ⁇ 10 ⁇ 9 M, or less than about 1.0 ⁇ 10 ⁇ 9 M.
- the concentrationcan be less than about 5.0 ⁇ 10 ⁇ 10 M, for example, less than about 1.0 ⁇ 10 ⁇ 10 M, less than about 5.0 ⁇ 10 ⁇ 11 M, less than about 1.0 ⁇ 10 ⁇ 11 M, less than about 5.0 ⁇ 10 ⁇ 12 M, less than about 1.0 ⁇ 10 ⁇ 12 M, less than about 5.0 ⁇ 10 ⁇ 13 M, less than about 1.0 ⁇ 10 ⁇ 13 M, less than about 5.0 ⁇ 10 ⁇ 14 M, less than about 1.0 ⁇ 10 ⁇ 14 M, less than about 5.0 ⁇ 10 15 M, or less than about 1.0 ⁇ 10 ⁇ 15 M.
- the disclosed methodscan provide real-time, free-solution detection of molecular interactions with very low sample volume requirements. That is, in one aspect, the invention relates to a free-solution analytical method for detecting molecular interactions comprising the step of detecting a molecular interaction between two non-immobilized analytes, wherein at least one of the analytes is present during the determination in a solution with a volume in the detection zone of less than about 500 ⁇ L.
- the sample volumecan be less than about 250 ⁇ L, for example, less than about 100 ⁇ L, less than about 10 ⁇ L, less than about 1 ⁇ L, less than about 500 nL, less than about 250 nL, less than about 100 nL, less than about 10 nL, less than about 1 nL, less than about 500 pL, less than about 250 pL, or less than about 100 pL.
- the first and/or second samplecomprises an additive.
- the additiveis selected from an alcohol, an acid, a base, a high refractive index solvent, a surfactant, and an intercalating agent.
- the alcoholis deuterated.
- the alcoholis fluorous.
- the disclosed methodsfurther comprise the step of determining a change in refractive index.
- the change in refractive indexis at least about 10 ⁇ 3 RIU.
- the change in refractive indexis at least about 10 ⁇ 4 RIU.
- the change in refractive indexis at least about 10 ⁇ 5 RIU.
- the change in refractive indexis at least about 10 ⁇ 6 RIU.
- the change in refractive indexis at least about 10 ⁇ 7 RIU.
- the change in refractive indexis at least about 10 ⁇ 8 RIU.
- the disclosed methodsfurther comprise the step of performing a chromatographic separation and/or an electrophoretic separation on the sample before, during, or after the determining the determining step.
- the methodfurther comprises the step of performing a chromatographic separation or an electrophoretic separation on the sample prior to the determining the determining step.
- the methodfurther comprises performing a chromatographic separation or an electrophoretic separation on the sample during the determining the determining step.
- the methodfurther comprises performing a chromatographic separation or an electrophoretic separation on the sample after the determining the determining step.
- the methodfurther comprises performing a chromatographic separation and an electrophoretic separation on the sample prior to the determining the determining step. In yet a further aspect, the method further comprises performing a chromatographic separation and an electrophoretic separation on the sample during the determining the determining step. In an even further aspect, the method further comprises performing a chromatographic separation and an electrophoretic separation on the sample after the determining the determining step.
- a characteristic property of a samplecomprising the steps of: (a) providing a refractive index sensor for reception of a fluid sample to be analyzed; (b) introducing a fluid sample to be analyzed onto the sensor; (c) interrogating the fluid sample with light; (d) detecting the light after interaction with the fluid sample, wherein the detected light is not backscattered; and (e) determining the characteristic property of the sample.
- the fluid sample to be analyzedcomprises an analyte.
- the analyteis non-immobilized.
- the analyteis unlabeled.
- detecting a molecular changecomprises determining the degree of polymerization, protein folding, protein aggregation, blood oxygenation, the conformational state of an ion channel or membrane protein, or the hydration state of an ion channel or membrane protein.
- the lightis not scattered.
- the refractive index sensorcomprises a substrate having a first channel formed therein for reception of a fluid sample to be analyzed and wherein the sample is introduced into the channel.
- the substrate and channelcan comprise any material suitable for containing and providing a sample for analysis and capable of being interrogated by light.
- the substrate and channel togethercomprise a capillary tube.
- the substrate and channel togethercomprise a microfluidic device.
- a channelis formed in the substrate and the method further comprises the steps of: (a) introducing a reference sample in the second channel; (b) determining a characteristic of the reference sample; and (c) employing the characteristic of the reference sample to compensate for background interference effects in the determination of the characteristic of the sample in the first channel.
- the substratehas a channel formed therein with a generally hemispherical cross sectional shape.
- the channelis formed with first and second curved potions, each curved portion defining a 90° arc, and a first flat portion connecting the first and second curved portions.
- the sampleis positioned inside a channel formed in a substrate, the channel has a longitudinal direction and a transverse direction, and the light is elongated in the longitudinal direction of the channel.
- the lightis incident on at least a portion of the channel greater than 4 mm in length along the longitudinal direction.
- the light sourcegenerates an easy to align optical beam that is incident on the etched channel for generating scattered light.
- the light sourcegenerates an optical beam that is collimated, such as, for example, the light emitted from a HeNe laser.
- the light sourcegenerates an optical beam that is not well collimated and disperses in, for example, a Gaussian profile, such as that generated by a diode laser.
- one lasercreates a laser beam that is elongated in the longitudinal direction of the channel.
- the othercreates a laser beam that is not elongated longitudinally along the length of the channel, but can be later elongated longitudinally along the length of the channel by beam-stretching optics.
- These methodscan both achieve the same end of an elongated beam impinging upon the channel, but do so through different means. It can be noted that, in certain aspects, when the diameter of the laser beam is the same as the thickness of the glass chip, new interference phenomena can arise. This can be avoided by selecting the width of the beam to be smaller than the thickness of the glass chip (0.8 mm width laser and 1.7 mm thickness glass chip).
- a single light beamis incident upon the substrate.
- the light beamhas a substantially uniform intensity profile across at least a portion of the plurality of discrete zones.
- the light beamhas a substantially Gaussian intensity profile in the axis perpendicular to the zones.
- the portion of the light beam impinging the channelhas an elongated intensity profile.
- the light beamis incident on at least a portion of the channel greater than 4 mm in length along the longitudinal direction. In a further aspect, the light beam is incident on at least a portion of the channel greater than 5 mm of length of the channel in the longitudinal direction. In a still further aspect, the light beam is incident on at least a portion of the channel greater than 6 mm of length of the channel in the longitudinal direction. In yet a further aspect, the light beam is incident on at least a portion of the channel greater than 7 mm of length of the channel in the longitudinal direction. In an even further aspect, the light beam is incident on at least a portion of the channel greater than 8 mm of length of the channel in the longitudinal direction.
- the light beamis incident on at least a portion of the channel greater than 9 mm of length of the channel in the longitudinal direction. In yet a further aspect, the light beam is incident on at least a portion of the channel greater than 10 mm, 12 mm, 14 mm, 16 mm, 18 mm, or 20 mm of length of the channel in the longitudinal direction.
- At least a portion of the light beam incident on the channelcovers at least two discrete zones. In a still further aspect, at least a portion of the light beam is incident on the channel such that the intensity of the light on each of at least two zones is the same or substantially the same. In yet a further aspect, at least a portion of the light beam is incident on the channel such that the each of the zones along the channel receive the same or substantially the same intensity of light. For example, a light beam having a Gaussian intensity profile can be incident on a channel such that at least two zones along the channel are within the peak of the intensity profile, receiving the same or substantially the same intensity of light.
- the portion of the light beam incident on the channelcan have a non-Gaussian profile, such as, for example, a plateau (e.g., top-hat).
- a plateaue.g., top-hat
- the portion of the light beam in the wings of the Gaussian intensity profilecan be incident upon other portions of the channel or can be directed elsewhere.
- variations in light intensity across zones of interestcan result in measurement errors.
- a calibrationcan be performed wherein the expected intensity of light, resulting interaction, and scattering is determined for correlation of future measurements.
- the light sourcecan comprise any suitable equipment and/or means for generating light, provided that the frequency and intensity of the generated light are sufficient to interact with a sample and/or a marker compound and provide elongated fringe patterns as described herein.
- Light sourcessuch as HeNe lasers and diode lasers, are commercially available and one of skill in the art could readily select an appropriate light source for use with the systems and methods of the present invention.
- the light beamis directed from a laser formed integrally on the substrate.
- the photodetectoris formed integrally on the substrate.
- the characteristic propertycomprises the index of refraction of the sample. In a still further aspect, the characteristic property comprises the temperature of the sample.
- the characteristic property to be determinedis whether first and second biochemical functional species bind with one another
- the step of introducing a sample to be analyzed onto the sensorcomprises introducing the first biochemical functional species into the channel and introducing the second biochemical functional species into the channel to facilitate a binding reaction between the first and second biochemical species.
- first and second biochemical functional speciesare introduced sequentially. In a still further aspect, the first and second biochemical functional species are introduced simultaneously.
- the first biochemical functional speciesis allowed to interact with the second biochemical functional species prior to introducing the first and/or second biochemical species onto the sensor. In a still further aspect, the first biochemical functional species is allowed to interact with the second biochemical functional species after introducing the first and/or second biochemical species onto the sensor.
- the first and second biochemical functional speciesare selected from the group comprising complimentary strands of DNA, complimentary proteins, and antibody antigen pairs.
- the substrateis selected to be formed from PDMS.
- the laser beamis selected to have a diameter of 2 mm or less.
- the channelwhen present, is selected to have a width that is no larger than the diameter of the laser beam.
- the refractive index sensorcomprises a prism.
- a collimated laser beamis expanded, for example, to approximately 8-10 mm, in the axis along the channel, while maintaining the Gaussian shape in the axis perpendicular to the channel.
- this beamis impinged onto the microfluidic channel, at least two samples can be interrogated in the channel simultaneously.
- the samplesmay be probed in the same channel simultaneously, with the same laser.
- the sample and the referencemay be interrogated in the same refractive index sensing device.
- refractive index sensingis via a refractometer. In a still further aspect, refractive index sensing is via interferometry. In yet a further aspect, refractive index sensing is via forward scattering interferometry. In an even further aspect, refractive index sensing is via backscattering interferometry. In a still further aspect, refractive index sensing is via a hand-held refractive index sensing device.
- the methodcan be used to determine, for example, one or more of an equilibrium constant, a dissociation constant, a dissociation rate, a dissociation rate constant, an association rate, and/or an association rate constant of the interaction.
- the methodcan be used to determine, for example, the concentration of the first and/or second analyte.
- the methodcan be used to determine, for example, the presence of the first and/or second analyte.
- the methodcan be used to determine, for example, the presence of a third analyte.
- the samplemay be contained in, e.g. flowed through, a capillary dimensioned flow channel such as a capillary tube.
- a capillary dimensioned flow channelsuch as a capillary tube.
- the cross-sectional depth of the channelis limited only by the length of the light and its breadth is limited only by the width of the light beam.
- the depth of the channelis from 1 to 10 ⁇ m, but it may be from 1 to 20 ⁇ m or up to 50 ⁇ m or more, e.g. up to 1 mm or more. However, sizes of up to 5 mm or 10 mm or more are possible.
- the breadth of the channelis from 0.5 to 2 times its depth, e.g., equal to its depth.
- At least one the interfaces involving the sample at which light is reflectedis curved in a plane containing the light path, the curved interface being convex in the direction facing the incoming light if it is the interface between the first material and the sample and being concave in the direction facing the incoming light if it is the interface between the sample and the further material.
- the sampleis typically a liquid, and can be flowing or stationary. However, the sample can also be a solid or a gas in various aspects of the present invention.
- the first and/or further materialswill normally be solid but in principle can be liquid, e.g., can be formed by a sheathing flow of guidance liquid(s) in a microfluidic device, with the sample being sheathed flow of liquid between such guidance flows.
- the samplemay also be contained in a flow channel of appropriate dimensions in substrate such as a microfluidic chip. The method may therefore be employed to obtain a read out of the result of a reaction conducted on a “lab on a chip” type of device.
- the disclosed methodsare capable of measuring multiple signals, for example, along a length of a capillary channel, simultaneously or substantially simultaneously.
- a plugcould be incorporated in the center of the capillary, allowing the sample and the reference to be drawn into the capillary without them coming in contact with each other or mixing.
- two or more capillariescould be used.
- a tray of capillariesmay be used.
- each capillarymay be analyzed one at a time.
- more than one capillarymay be analyzed at one time.
- the refractive index changes that can be measured by the disclosed methodscan arise from molecular dipole alterations associated with conformational changes of sample-ligand interaction as well as density fluctuations due to changes in waters of hydration. These RI changes also arise from redistribution of the electron density of an ion, atom, or molecule resulting from changes in, for example, sample pH, solvent composition, or molecular interactions.
- the detection systemhas numerous applications, including, for example, the observation and quantification of molecular interactions, molecular concentrations, bioassays, universal/RI detection for CE (capillary electrophoresis), CEC (capillary electrochromatography) and FIA (flow injection analysis), physiometry, cell sorting/detection by scatter, ultra micro calorimetry, flow rate sensing, PCR quantification, and temperature sensing.
- CEcapillary electrophoresis
- CECcapillary electrochromatography
- FIAflow injection analysis
- physiometrycell sorting/detection by scatter
- ultra micro calorimetryultra micro calorimetry
- flow rate sensingPCR quantification
- temperature sensinga sample measurement and reference measurement can be acquired simultaneously or substantially simultaneously from the same channel. As both measurements occur in the same capillary and, in one aspect, in immediately adjacent portions of the capillary, the thermal properties attributable to each measurement will be uniform, resulting in higher signal to noise levels.
- the detection systems and methods described hereincan be useful as a bench-top molecular interaction photometer. In a further aspect, the detection systems and methods described herein can be useful for performing near patient diagnostics. In a still further aspect, the detection system can be useful for performing assays in the field, in the home, in space, or in remote locations.
- the detection systems and methods described herecan be useful as a hand-held version of a refractive index sensing device. In a further aspect, the detection systems and methods described here can be useful as a hand-held version of a refractometer. In a still further aspect, the detection systems and methods described here can be useful as a hand-held version of an interferometer.
- a characteristic property of a samplecomprising the steps of: (a) providing a channel formed in a substrate, wherein the channel has a longitudinal direction and a transverse direction, and wherein the channel is configured for reception of two or more fluid samples by having at least two inlets positioned at opposing locations of the channel, and at least one outlet positioned at a point between the at least two inlets, thereby defining a right side of the channel and a left side of the channel; (b) introducing a first sample comprising a first non-immobilized analyte to be analyzed into the left side of the channel; (c) introducing a second sample comprising a second non-immobilized analyte to be analyzed into the right side of the channel; (d) simultaneously interrogating the samples with light, wherein the light is elongated in the longitudinal direction of the channel, such that the light beam is incident on at least a portion of the left side of the channel and the right side of the channel
- the single channel sample reference (SCSR) configurationutilizes a new sample introduction methodology, whereby a droplet of the sample is placed in a well at one end of the microfluidic chip, and capillary action serves to pull the material into the interrogating region.
- An inlet well at each end of the channel and a hole drilled through the centerallows for three goals to be accomplished. First, the hole allows air to escape as the sample is pulled in by capillary action, keeping the pressure within the microfluidic channel stable.
- the holeallows the sample to be removed post measurement by simple vacuum.
- the holeacts as a barrier for the samples so they do not mix during measurements.
- the holeallows a sample and a reference to be placed at each end of the channel, with both able to be pulled into the chip independently by capillary action, but reaching the same temperature and pressure rapidly. Proper design of the hole or gap to keeps the samples from jumping across the gap, from mixing and to come rapidly to equilibrium.
- an inletmay be located at each end of the channel and a single outlet in between. It is also envisioned, however, that the channel may comprise more than two inlets, each with a hole in between them.
- Samplesalso cover a wide range of compositions and properties. Some are hydrophobic and some are hydrophilic. They can be aqueous, organic, mixed aqueous-organic and mixed with additives such as salts, surfactants, and acids or bases. Aqueous solutions with surfactant constitute samples that are less hydrophilic than water alone, so dispensing them can be challenging. Samples can contain high concentrations of salt as with buffers, or both buffer salts and surfactant (as required for some protein interaction studies) making them prone to evaporation and changing their capillary action power in glass channels. In this case, the capillary action problem may be overcome by specially coating the injection guide (miscellaneous vendors) to insure wicking into the chip channel.
- Samplescan be sticky, with the matrix and/or samples adhering non-specifically to the introduction guide. Samples such as serum, urine, cells, cell-derived vesicles, tissue-derived vesicles, membrane preps, etc., are particularly challenging. Without wishing to be bound by theory, the approach described herein may enable a minimally trained user to introduce all of these samples with the reproducibility ( ⁇ 2.0 milliradians) required to perform assays and with considerably improved reproducibility.
- the methodfurther comprises the steps of receiving the intensity signals with a signal analyzer and determining therefrom one or more characteristic properties of at least one of the samples.
- the light beamis incident on greater than 4 mm of length of the channel in the longitudinal direction. In a still further aspect, the light beam is incident on greater than 4 mm of length of the left side of the channel in the longitudinal direction. In yet a further aspect, the light beam is incident on greater than 4 mm of length of the right side of the channel in the longitudinal direction.
- the disclosed techniquescan determine the interaction between one or more analytes by monitoring, measuring, and/or detecting the formation and/or steady state relative abundance of one or more analyte interaction products from the interaction of the one or more analytes.
- the determinationcan be performed qualitatively or quantitatively.
- Interaction rate informationcan be derived from various measurements of the interaction.
- the first sampleis combined with the second sample prior to introduction. That is, the analytes are combined (and potentially interacting) prior to performing the disclosed methods.
- the step of introducing the first sample and the step of introducing the second sampleare performed simultaneously.
- the first sampleis combined with the second sample after introduction. That is, the analytes can be combined at a point before the sensor, or at a point on the sensor, when performing the disclosed methods.
- the step of introducing the first analyte and the step of introducing the second analyteare performed either simultaneously or sequentially.
- the detecting stepis performed during the interaction of the first analyte with the second analyte.
- the first and second samplesare introduced simultaneously.
- the first and second samplesare introduced sequentially.
- the first analyteis allowed to interact with the second analyte prior to introducing the first and/or second sample onto the sensor.
- the first analyteis allowed to interact with the second analyte after introducing the first and/or second sample onto the sensor.
- the first analyteis allowed to interact with the second act while introducing the first and/or second sample onto the sensor.
- a characteristic property of a samplecomprising the steps of: (a) providing a sample comprising a non-immobilized analyte to be analyzed, wherein the sample is positioned inside a channel formed in a substrate, and wherein the channel has a longitudinal direction and a transverse direction; (b) interrogating the sample with a light beam, wherein the light beam is elongated in the longitudinal direction of the channel, such that the light beam is incident on at least a portion of the channel greater than 4 mm in length along the longitudinal direction; and (c) detecting the light after interaction with the sample, wherein the detected light is not backscattered. In a further aspect, the detected light is not scattered.
- the light beammay be elongated to take more measurements, e.g., by spreading the light in the direction of the sample and/or reference, and then averaging the data.
- This techniqueserves to increase the S/N ratio. In this way, a single measurement may provide data comparable to taking multiple measurements.
- the light beamis incident on greater than 4 mm of length of the channel in the longitudinal direction. In a further aspect, the light beam is incident on greater than 5 mm of length of the channel in the longitudinal direction. In a still further aspect, the light beam is incident on greater than 6 mm of length of the channel in the longitudinal direction. In yet a further aspect, the light beam is incident on greater than 7 mm of length of the channel in the longitudinal direction. In an even further aspect, the light beam is incident on greater than 8 mm of length of the channel in the longitudinal direction. In a still further aspect, the light beam is incident on greater than 9 mm of length of the channel in the longitudinal direction. In yet a further aspect, the light beam is incident on greater than 10 mm, 12 mm, 14 mm, 16 mm, 18 mm, or 20 mm of length of the channel in the longitudinal direction.
- the methodfurther comprises the steps of receiving the intensity signals with a signal analyzer and determining therefrom one or more characteristic properties of the sample.
- the inventionrelates to methods for determining a characteristic property of a sample comprising the steps of: (a) providing a sample comprising a first non-immobilized analyte to be analyzed, wherein the sample is positioned inside a channel formed in a substrate, and wherein the channel has a longitudinal direction and a transverse direction; (b) interrogating the sample with a light beam, wherein the light beam is elongated in the longitudinal direction of the channel, wherein the photodetector is positioned less than 40 cm from the channel during interrogation; and (c) detecting the light after interaction with the sample, wherein the detected light is not backscattered. In a further aspect, the detected light is not scattered.
- Optimum photodetector integration dimensionsis dependent on chip configurations (e.g., chip material, substrate and top plate thickness, channel dimensions, shape, etc.) and the distances from the channel (e.g., chip top) surface to the camera sensor.
- the photodetectoris positioned less than about 40 cm (e.g., less than about 36 cm, less than about 32 cm, less than about 30 cm, less than about 28 cm, less than about 26 cm, less than about 24 cm, less than about 22 cm, less than about 20 cm, less than about 18 cm, less than about 16 cm, less than about 14 cm, less than about 12 cm, less than about 10 cm, less than about 9 cm, less than about 8 cm, less than 7 cm, less than about 6 cm, less than about 5 cm, less than about 4 cm, less than about 3 cm, less than about 2 cm, less than about 1 cm) from the channel during interrogation.
- the photodetectorcan be positioned from about 2 cm to about 40 cm, from about 2 cm to about 20 cm, from about 2 cm to about 10 cm, from about 5 cm to about 20 cm, from about 5 cm to about 10 cm, from about 5 cm to about 40 cm, from about 10 cm to about 40 cm, from about 10 cm to about 30 cm, or from about 5 cm to about 30 cm from the channel during interrogation.
- the camera resolutionincluding pixel size, spacing, and photon flux sensitivity, must also conform to a minimum specification.
- between about 30 camera pixels and 500 camera pixelsmay be interrogated.
- between about 30 camera pixels and 350 camera pixelsmay be interrogated.
- between about 30 camera pixels and 300 camera pixelsmay be interrogated.
- between about 30 camera pixels and 250 camera pixelsmay be interrogated.
- between about 30 camera pixels and 200 camera pixelsmay be interrogated.
- between about 30 camera pixels and 150 camera pixelsmay be interrogated.
- between about 50 camera pixels and 100 camera pixelsmay be interrogated.
- between about 100 camera pixels and 500 camera pixelsmay be interrogated. In a still further aspect, between about 150 camera pixels and 500 camera pixels may be interrogated. In yet a further aspect, between about 200 camera pixels and 500 camera pixels may be interrogated. In an even further aspect, between about 250 camera pixels and 500 camera pixels may be interrogated. In a still further aspect, between about 300 camera pixels and 500 camera pixels may be interrogated.
- This optical configurationmay allow for several advantages. For example, the effect of air currents and temperature perturbations may be reduced thereby decreasing environmental noise.
- the light beamis incident on at least a portion of the channel greater than 4 mm in length along the longitudinal direction. In a further aspect, the light beam is incident on at least a portion of the channel greater than 5 mm of length of the channel in the longitudinal direction. In a still further aspect, the light beam is incident on at least a portion of the channel greater than 6 mm of length of the channel in the longitudinal direction. In yet a further aspect, the light beam is incident on at least a portion of the channel greater than 7 mm of length of the channel in the longitudinal direction. In an even further aspect, the light beam is incident on at least a portion of the channel greater than 8 mm of length of the channel in the longitudinal direction.
- the light beamis incident on at least a portion of the channel greater than 9 mm of length of the channel in the longitudinal direction. In yet a further aspect, the light beam is incident on at least a portion of the channel greater than 10 mm of length of the channel in the longitudinal direction.
- the methodfurther comprises the steps of receiving the intensity signals with a signal analyzer and determining therefrom one or more characteristic properties of the sample.
- the inventionrelates to a method for determining a characteristic property of a sample comprising the steps of: (a) providing a channel formed in a substrate, wherein the channel has a longitudinal direction and a transverse direction, and wherein the channel is configured for reception of two or more fluid samples by having at least two inlets positioned at opposing locations of the channel, and at least one outlet positioned at a point between the at least two inlets, thereby defining a right side of the channel and a left side of the channel; (b) introducing a first sample comprising a first non-immobilized analyte to be analyzed into the left side of the channel and then closing the inlet of the left side of the channel with a first closure element, thereby reducing evaporation of the first sample; (c) introducing a second sample comprising a second non-immobilized analyte to be analyzed into the right side of the channel and then closing the inlet of the right side of the channel with a second closure element, thereby
- the methodfurther comprises the steps of receiving the intensity signals with a signal analyzer and determining therefrom one or more characteristic properties of at least one of the sample.
- the light beamis incident on greater than 4 mm of length of the channel in the longitudinal direction. In a still further aspect, the light beam is incident on greater than 4 mm of length of the left side of the channel in the longitudinal direction. In yet a further aspect, the light beam is incident on greater than 4 mm of length of the right side of the channel in the longitudinal direction.
- the disclosed methodscan be used in connection with the detection and determination of a wide variety of characteristic properties of a sample.
- the inventioncan be used to determine absolute or relative refractive index (RI) of a sample, for example a fluid either flowing or static.
- RIrefractive index
- the disclosed systems and methodscan also be used in connection with detection and determination of chemical events, for example label-free analysis of hybridization reactions such as DNA-DNA binding reactions.
- the disclosed systems and methodscan also be used in bioassays, monitoring enzymatic activity, drug screening, and clinical diagnostics.
- the disclosed methodscan be performed wherein the characteristic to be determined is whether first and second biochemical functional species (i.e., first and second analytes) bind with one another, and the step of introducing a sample to be analyzed into the first channel comprise introducing the first biochemical functional species into the channel and then introducing the second biochemical functional species into the channel to facilitate a binding reaction between the first and second biochemical species.
- the first and second biochemical functional speciescan be selected from the group comprising complimentary strands of DNA, complimentary proteins, enzyme-substrate pairs, and antibody antigen pairs. That is, in a further aspect, the characteristic to be determined can be a label-free analysis of a hybridization reaction in the channel.
- the positional shifts in the light bandscan correspond to a chemical event occurring in the sample.
- Examples of chemical events that can be detected and bioassays conducted with the disclosed systems and methodsinclude a binding event between one or more of antibody-antigen, protein-protein, small molecule-small molecule, small molecule-protein, drug-receptor, antibody-cell, virus-cell, virus-protein, bacteria-cell, bacteria-protein, virus-DNA, virus-RNA, bacteria-DNA, bacteria-RNA, protein-cell, oligonucleotide-cell, carbohydrate-cell, cell-cell, enzyme-substrate, protein-DNA, protein-aptamer, DNA-DNA, RNA-DNA, DNA-RNA, protein-RNA, small molecule-nucleic acid, biomolecule-molecular imprint, biomolecule-protein mimetic, biomolecule-antibody derivatives, lectin-carbohydrate, biomolecule-carbohydrate, small molecule-cell membrane, ion-protein, and protein-protein.
- the disclosed systems and methodscan be used in connection with a step of performing a chromatographic separation or an electrophoretic separation on the sample prior to the determining the characteristic property step.
- the inventionalso finds use as a detector for other chip-scale analytical schemes including electrophoresis, ⁇ -HPLC separations, and FIA. It is possible to detect molecules important to cellular function, high throughput analysis, and pharmaceutical screening.
- the refractive index sensing devicecan also be used in biochemical assays and to quantify environmental analytes. It is also possible to perform micro-thermometry, the device has the capability of measuring small temperature changes (in the 10 ⁇ 3 ° C. range) allowing for cellular respiration, protein folding, calorimetry, and fundamental chemical binding studies to be performed in picoliter volumes. Furthermore, when using special surface chemistry to selectively bind solutes, such as DNA oligomers, proteins, or antibodies, without sacrificing specificity/sensitivity.
- Molecular interaction analysisis an active area of biomedical research as scientists look for understanding of which molecules bind to other molecules. This information can be critical on any number of levels, especially as it pertains to an understanding of the mechanism of action of pharmaceutical small molecules or biological macromolecules.
- the study of interactionscan also elucidate possible mechanisms of toxicity and can help identify how best to modify molecules to become more effective therapeutics.
- a thorough understanding of which molecules bind which moleculescan also lead to a more comprehensive understanding of the molecular pathways involved in gene function which can help identify new points of intervention in disease states such as cancer or diabetes, or new points of intervention in the pathways that contribute to aging.
- Molecular interactionscan also provide a rapid diagnostic tool for the presence or absence of molecules that are correlated with disease or with the presence of pathogens in the environment.
- Biosensorshave been defined as any type of device that contains a bioreceptor and a transducer.
- the bioreceptorcan be a biological molecular species such as a nucleic acid, a protein, enzyme, antibody or even a living biological system such as cells or whole organisms that would bind the target species.
- the transducerwould then convert this binding event into a measurement that could be recorded or displayed.
- Several types of transducershave been developed, including optical measurements (including fluorescence, luminescence, absorption, phosphorescence, Raman, SERS, surface Plasmon resonance, and back-scattering interferometry), electrochemical, and mass-sensitive (including surface acoustic wave and microbalance).
- the antibody bioreceptorsbind the target of interest and then are visualized by binding a secondary antibody labeled with radioisotopes or conjugated to an enzyme such as horseradish peroxidase that catalyzes a chemiluminescence reaction that can be visualized with photographic film or appropriate photometric sensor.
- the inventionrelates to an antibody biosensor because refractometry in the absence of a secondary antibody can detect the primary antibody binding the target due to a change in the refractive index caused by the binding event, for example due to a change in polarizability of the target.
- the inventionrelates to a free-solution analytical method for detecting molecular interactions comprising the steps of: (a) providing a refractive index sensor for reception of a fluid sample to be analyzed; (b) introducing a first sample comprising a first non-immobilized analyte to be analyzed and a second sample comprising a second non-immobilized analyte to be analyzed onto the sensor, wherein the first analyte is allowed to interact with the second analyte; (c) interrogating the fluid sample with light; and (d) detecting the light after interaction with the fluid sample, wherein the detected light is not backscattered, wherein the method is employed to detect a target of interest in the absence of a second antibody.
- the detected lightis not scattered.
- the methodfurther comprises the steps of: (a) introducing a reference sample; (b) interrogating the reference sample with light; (c) detecting the light after interaction with the reference sample, wherein the detected light is not backscattered; (d) determining a characteristic of the reference sample; and (e) employing the characteristic of the reference sample to compensate for background interference effects in the determination of the molecular interaction between the first and second analyte in the first channel.
- the reference samplecan be introduced, for example, onto the refractive index sensor.
- the reference samplecan be introduced into a channel.
- the reference samplecan be introduced into the first channel.
- the reference samplecan be introduced into the second channel.
- the inventionrelates to a free-solution analytical method for detecting molecular interactions comprising the step of detecting a molecular interaction between two non-immobilized analytes, wherein at least one of the analytes is present in the sample during the determination at a concentration of less than about 5.0 ⁇ 10 ⁇ 4 M, wherein the method is employed to detect a target of interest in the absence of a second antibody.
- the inventionrelates to a free-solution analytical method for detecting molecular interactions comprising the step of detecting a molecular interaction between two non-immobilized analytes, wherein at least one of the analytes is present during the determination in a solution with a volume in the detection zone of less than about 500 nL, wherein the method is employed to detect a target of interest in the absence of a second antibody.
- the inventionrelates to a free-solution analytical method for detecting molecular interactions comprising the steps of: (a) providing a refractive index sensor for reception of a fluid sample to be analyzed; (b) introducing a reference sample; (c) establishing a baseline interferometric response by interrogating the reference sample with light; (d) introducing a first sample comprising a mixture of a first non-immobilized analyte and a second non-immobilized analyte to be analyzed, wherein the first analyte is allowed to interact with the second analyte, onto the sensor; (e) interrogating the fluid sample with light; and (f) detecting the light after interaction with the fluid sample, wherein the detected light is not backscattered, wherein the method is employed to detect a target of interest in the absence of a second antibody.
- the specific sequence of bases that define a segment of DNAcan be used as a probe to bind other DNA sequences, and these DNA sequences can be labeled with radioactive or other labels.
- the inventionrelates to a DNA biosensor because refractometry in the absence of a labeled secondary DNA probe can detect the primary DNA binding the target DNA due to a change in the refractive index caused by the binding event.
- the inventionrelates to a free-solution analytical method for detecting molecular interactions comprising the steps of: (a) providing a refractive index sensor for reception of a fluid sample to be analyzed; (b) introducing a first sample comprising a first non-immobilized analyte to be analyzed and a second sample comprising a second non-immobilized analyte to be analyzed onto the sensor, wherein the first analyte is allowed to interact with the second analyte; (c) interrogating the fluid sample with light; and (d) detecting the light after interaction with the fluid sample, wherein the detected light is not backscattered, wherein the method is employed to detect a DNA sequence of interest in the absence of a labeled secondary DNA probe.
- the methodfurther comprises the steps of: (a) introducing a reference sample; (b) interrogating the reference sample with light; (c) detecting the light after interaction with the reference sample, wherein the detected light is not backscattered; (d) determining a characteristic of the reference sample; and (e) employing the characteristic of the reference sample to compensate for background interference effects in the determination of the molecular interaction between the first and second analyte in the first channel.
- the detected lightis not scattered.
- the reference samplecan be introduced, for example, onto the refractive index sensor.
- the reference samplecan be introduced into a channel.
- the reference samplecan be introduced into the first channel.
- the reference samplecan be introduced into the second channel.
- the inventionrelates to a free-solution analytical method for detecting molecular interactions comprising the step of detecting a molecular interaction between two non-immobilized analytes, wherein at least one of the analytes is present during the determination at a concentration of less than about 5.0 ⁇ 10 ⁇ 4 M, wherein the method is employed to detect a DNA sequence of interest in the absence of a labeled secondary DNA probe.
- the inventionrelates to a free-solution analytical method for detecting molecular interactions comprising the step of detecting a molecular interaction between two non-immobilized analytes, wherein at least one of the analytes is present during the determination in a solution with a volume in the detection zone of less than about 500 nL, wherein the method is employed to detect a DNA sequence of interest in the absence of a labeled secondary DNA probe.
- the inventionrelates to a free-solution analytical method for detecting molecular interactions comprising the steps of: (a) providing a refractive index sensor for reception of a fluid sample to be analyzed; (b) introducing a reference sample; (c) establishing a baseline interferometric response by interrogating the reference sample with light; (d) introducing a first sample comprising a mixture of a first non-immobilized analyte and a second non-immobilized analyte to be analyzed, wherein the first analyte is allowed to interact with the second analyte, onto the sensor; (e) interrogating the fluid sample with light; and (f) detecting the light after interaction with the fluid sample, wherein the detected light is not backscattered, wherein the method is employed to detect a DNA sequence of interest in the absence of a labeled secondary DNA probe.
- the presence or absence of substrate moleculescan be determined by measuring the production of the enzymatic reaction end products.
- the inventionrelates to an enzyme biosensor because refractometry can be used to measure the amount of the initial substrate or the enzymatic reaction end products as long as they are binding a molecular species where the binding can be detected by a change in the refractive index of the solution.
- the inventionrelates to a free-solution analytical method for detecting molecular interactions comprising the steps of: (a) providing a refractive index sensor for reception of a fluid sample to be analyzed; (b) introducing a first sample comprising a first non-immobilized analyte to be analyzed and a second sample comprising a second non-immobilized analyte to be analyzed onto the sensor, wherein the first analyte is allowed to interact with the second analyte; (c) interrogating the fluid sample with light; and (d) detecting the light after interaction with the fluid sample, wherein the detected light is not backscattered, wherein the method is employed to measure the production of the enzymatic reaction end products in the absence of specifically modified recombinant GBP including a fluorescent probe.
- the detected lightis not scattered.
- the methodfurther comprises the steps of: (a) introducing a reference sample; (b) interrogating the reference sample with light; (c) detecting the light after interaction with the reference sample, wherein the detected light is not backscattered; (d) determining a characteristic of the reference sample; and (e) employing the characteristic of the reference sample to compensate for background interference effects in the determination of the molecular interaction between the first and second analyte in the first channel.
- the reference samplecan be introduced, for example, onto the refractive index sensor.
- the reference samplecan be introduced into a channel.
- the reference samplecan be introduced into the first channel.
- the reference samplecan be introduced into the second channel.
- the inventionrelates to a free-solution analytical method for detecting molecular interactions comprising the step of detecting a molecular interaction between two non-immobilized analytes, wherein at least one of the analytes is present during the determination at a concentration of less than about 5.0 ⁇ 10 ⁇ 4 M, wherein the method is employed to measure the production of the enzymatic reaction end products in the absence of specifically modified recombinant GBP including a fluorescent probe.
- the inventionrelates to a free-solution analytical method for detecting molecular interactions comprising the step of detecting a molecular interaction between two non-immobilized analytes, wherein at least one of the analytes is present during the determination in a solution with a volume in the detection zone of less than about 500 nL, wherein the method is employed to measure the production of the enzymatic reaction end products in the absence of specifically modified recombinant GBP including a fluorescent probe.
- the inventionrelates to a free-solution analytical method for detecting molecular interactions comprising the steps of: (a) providing a refractive index sensor for reception of a fluid sample to be analyzed; (b) introducing a reference sample; (c) establishing a baseline interferometric response by interrogating the reference sample with light; (d) introducing a first sample comprising a mixture of a first non-immobilized analyte and a second non-immobilized analyte to be analyzed, wherein the first analyte is allowed to interact with the second analyte, onto the sensor; (e) interrogating the fluid sample with light; and (f) detecting the light after interaction with the fluid sample, wherein the detected light is not backscattered, wherein the method is employed to measure the production of the enzymatic reaction end products in the absence of specifically modified recombinant GBP including a fluorescent probe.
- the presence or absence of substrate moleculescan be measured by measuring cellular metabolism, cell respiration, or bacterial bioluminescence.
- the inventionrelates to a cellular biosensor because refractometry can be used to measure the amount of the initial substrate as long as it is binding a molecular species where the binding can be detected by a change in the refractive index of the solution.
- the inventionrelates to a free-solution analytical method for detecting molecular interactions comprising the steps of: (a) providing a refractive index sensor for reception of a fluid sample to be analyzed; (b) introducing a first sample comprising a first non-immobilized analyte to be analyzed and a second sample comprising a second non-immobilized analyte to be analyzed onto the sensor, wherein the first analyte is allowed to interact with the second analyte; (c) interrogating the fluid sample with light; and (d) detecting the light after interaction with the fluid sample, wherein the detected light is not backscattered, wherein the method is employed to directly assay an analyte of interest in the absence of genetically engineered bacteria.
- the detected lightis not scattered.
- the methodfurther comprises the steps of: (a) introducing a reference sample; (b) interrogating the reference sample with light; (c) detecting the light after interaction with the reference sample, wherein the detected light is not backscattered; (d) determining a characteristic of the reference sample; and (e) employing the characteristic of the reference sample to compensate for background interference effects in the determination of the molecular interaction between the first and second analyte in the first channel.
- the reference samplecan be introduced, for example, onto the refractive index sensor.
- the reference samplecan be introduced into a channel.
- the reference samplecan be introduced into the first channel.
- the reference samplecan be introduced into the second channel.
- the inventionrelates to a free-solution analytical method for detecting molecular interactions comprising the step of detecting a molecular interaction between two non-immobilized analytes, wherein at least one of the analytes is present during the determination at a concentration of less than about 5.0 ⁇ 10 ⁇ 4 M, wherein the method is employed to directly assay an analyte of interest in the absence of genetically engineered bacteria.
- the inventionrelates to a free-solution analytical method for detecting molecular interactions comprising the step of detecting a molecular interaction between two non-immobilized analytes, wherein at least one of the analytes is present during the determination in a solution with a volume in the detection zone of less than about 500 nL, wherein the method is employed to directly assay an analyte of interest in the absence of genetically engineered bacteria.
- the inventionrelates to a free-solution analytical method for detecting molecular interactions comprising the steps of: (a) providing a refractive index sensor for reception of a fluid sample to be analyzed; (b) introducing a reference sample; (c) establishing a baseline interferometric response by interrogating the reference sample with light; (d) introducing a first sample comprising a mixture of a first non-immobilized analyte and a second non-immobilized analyte to be analyzed, wherein the first analyte is allowed to interact with the second analyte, onto the sensor; (e) interrogating the fluid sample with light; and (f) detecting the light after interaction with the fluid sample, wherein the detected light is not backscattered, wherein the method is employed to directly assay an analyte of interest in the absence of genetically engineered bacteria.
- refractometrycan measure end-point values of phase (which is a measure of the change in RI when using an interferometer) for the reaction between molecule A and molecule B as a function of the concentration of molecule B to determine the binding affinity of the complex and/or to quantitatively determine the concentration of the A ⁇ B product at reaction equilibrium.
- End-point concentration bioassayscan be used in both research and clinical diagnostic applications.
- a calibration curve for a first analyte (e.g., antibody) at a known concentrationcan be generated by measuring the response to interaction between the first analyte and a second analyte (e.g., antigen) at systematically varied known concentrations. Comparison of a subsequent response measured when an unknown concentration of the second analyte is allowed to interact (e.g., antibody-antigen binding, aptamer binding, etc.) with a known concentration of the first analyte to the calibration curve yields the concentration of the second analyte in the sample analyzed. Amount of the second analyte in the sample can then be determined as a function of sample volume.
- a first analytee.g., antibody
- a second analytee.g., antigen
- the end point of the interaction between a first non-immobilized analyte and a second non-immobilized analytecan be determined by a free-solution analytical method for detecting molecular interactions comprising the steps of: (a) providing a refractive index sensor for reception of a fluid sample to be analyzed; (b) introducing a first sample comprising a first non-immobilized analyte to be analyzed and a second sample comprising a second non-immobilized analyte to be analyzed onto the sensor, wherein the first analyte is allowed to interact with the second analyte; (c) interrogating the fluid sample with light; and (d) detecting the light after interaction with the fluid sample, wherein the detected light is not backscattered.
- the detected lightis not scattered.
- the methodfurther comprises the steps of: (a) introducing a reference sample; (b) interrogating the reference sample with light; (c) detecting the light after interaction with the reference sample, wherein the detected light is not backscattered; (d) determining a characteristic of the reference sample; and (e) employing the characteristic of the reference sample to compensate for background interference effects in the determination of the molecular interaction between the first and second analyte in the first channel.
- the reference samplecan be introduced, for example, onto the refractive index sensor.
- the reference samplecan be introduced into a channel.
- the reference samplecan be introduced into the first channel.
- the reference samplecan be introduced into the second channel.
- the end point of the interaction between a first non-immobilized analyte and a second non-immobilized analytecan be determined by a free-solution analytical method for detecting molecular interactions comprising the step of detecting a molecular interaction between two non-immobilized analytes, wherein at least one of the analytes is present during the determination at a concentration of less than about 5.0 ⁇ 10 ⁇ 4 M.
- the end point of the interaction between a first non-immobilized analyte and a second non-immobilized analytecan be determined by a free-solution analytical method for detecting molecular interactions comprising the step of detecting a molecular interaction between two non-immobilized analytes, wherein at least one of the analytes is present during the determination in a solution with a volume in the detection zone of less than about 500 nL.
- first and second analytescan be combined prior to introduction. That is, the analytes can be combined (and thus can potentially interact) prior to performing the disclosed methods.
- the step of introducing the first analyte and the step of introducing the second analyteare performed simultaneously.
- the first and second analytesare combined after introduction. That is, the analytes can be combined at a point before the sensor, or at a point on the sensor, when performing the disclosed methods.
- the step of introducing the first analyte and the step of introducing the second analyteare performed either simultaneously or sequentially.
- the detecting stepis performed during the interaction of the first analyte with the second analyte.
- refractometrycan determine kinetic parameters. That is, the refractometry techniques described herein can be used to monitor various kinetic parameters, such as, for example, binding affinities, of a chemical and/or biochemical analyte species.
- the use of refractometry for the determination of a kinetic parametercan provide one or more advantages over traditional techniques, for example, free-solution measurements of label-free species, high throughput, small sample volume, high sensitivity, and broad dynamic range.
- a refractometry techniquecan be performed on a free-solution species, a surface immobilized species, or a combination thereof.
- the species of interestis a free-solution species, wherein at least a portion of the species of interest is not bound or otherwise immobilized. In another aspect, at least a portion of the species of interest is surface immobilized.
- a refractometry techniquecan be used to analyze and/or quantify one or more molecular interactions, such as, for example, a dissociation constant for one or more binding pair species.
- a binding pair speciescan be, in various aspects, a protein-protein, peptide-protein, small molecule-protein, ion-protein, or an antibody-antigen pair.
- Other reactions and/or molecular interactionscan be likewise analyzed via refractometry and the present invention is not intended to be limited to the specific binding pairs and/or reactions recited herein.
- the sensitivity of a refractometry techniquecan allow analysis and/or determination of at least one kinetic parameter to be performed on a small volume sample.
- the volume of a sample comprising at least one species of interestcan, in various aspects, be less than about 1 nL, for example, about 900, 850, 800, 700, 600, 500, 400, 350, 300, 250, or 200 pL; less than about 600 pL, for example, about 580, 550, 500, 450, 400, 350, 300, 250, or 200 pL; or less than about 400 pL, for example, about 390, 380, 370, 360, 350, 340, 330, 320, 310, 300, 280, 250, 230, or 200 pL.
- the sample volumeis about 500 pL. In another aspect, the sample volume is about 350 pL.
- the sample volumecan also be greater than or less than the volumes described above, depending on the concentration of a species of interest and the design of a particular refractometry apparatus.
- a species that can be analyzed via refractometrycan be present in neat form, in diluted form, such as, for example, in a dilute solution, or any other form suitable for analysis by a refractometry technique.
- the concentration of a species of interestcan likewise vary depending upon, for example, the design of a particular refractometry apparatus, the volume of sample in the optical path, the intensity of a response of a specific species to the radiation used in the experiment.
- the speciescan be present at a concentration of from about 1 fM to greater than 100 mM.
- Analysis of a kinetic parameter via a refractometry techniquecan be performed on a static sample, a flowing sample, for example, 75-120 ⁇ L/min, or a combination thereof.
- an analysiscan be a stop-flow determination that can allow an estimation of the dissociation constant (K D ) of one or more binding pairs of species.
- K Ddissociation constant
- the speed at which one or more samples can be analyzedcan be dependent upon, inter alia, the data acquisition and/or processing speed of the detector element and/or processing electronics.
- Methods for adjusting the throughput speed of a refractometry apparatussuch as signal multiplexing, can be utilized and are considered to be included in various aspects of the present invention.
- An apparatus for analyzing a kinetic parameter using a refractometry techniquecan comprise an optical system and a sample comprising the one or more species of interest.
- the optical systemcan comprise, a laser, such as, for example, a He—Ne laser, and a detector, such as, for example, a CCD array detector, such as a high resolution linear CCD.
- the detectoris a CCD bar code scanner.
- the samplecan be positioned on a refractive index sensor.
- the samplecan be positioned on a prism.
- the samplecan be positioned in or on a channel, such as, for example, a microfluidic channel on a poly(dimethylsiloxane) chip.
- a microfluidic channelif present, can comprise a pattern, such as, for example, a serpentine flow pattern, and/or a mixing zone, such as, for example, a squeeze.
- the samplecan be positioned in a rectangular channel approximately 50 ⁇ m by 70 ⁇ m.
- a microfluidic channelif present, can be semicircular or cylindrical, such as, for example, a fused silica capillary, and the present invention is not intended to be limited to any particular microfluidic channel geometry.
- a microfluidic channelcan comprise one or multiple channels that can hold and/or transport the same or varying samples, and a mixing zone.
- the design of a mixing zonecan allow at least initial mixing of, for example, one or more binding pair species.
- the at least initially mixed samplecan then be subjected to a stop-flow analysis, provided that the reaction and/or interaction between the binding pair species continues or is not complete at the time of analysis.
- the specific design of a microfluidic channel, mixing zone, and the conditions of mixingcan vary, depending on such factors as, for example, the concentration, response, and volume of a sample and/or species.
- the concentration of one or more analyte species in a samplecan be determined with a refractometry technique by, for example, monitoring the refractive index of a sample solution comprising an analyte species.
- a propertysuch as, for example, refractive index
- refractive indexcan be measured in real-time and the kinetics of an interaction between analyte species determined therefrom.
- Other experimental conditionssuch as, for example, temperature and pH, can optionally be controlled during analysis.
- the number of real-time data points acquired for determination of a kinetic parametercan vary based on, for example, the acquisition rate and the desired precision of a resulting kinetic parameter.
- the length of time of a specific experimentshould be sufficient to allow acquisition of at least the minimal number of data points to calculate and/or determine a kinetic parameter. In one aspect, an experiment can be performed in about 60 seconds.
- An apparent binding affinity between binding pair speciescan subsequently be extracted from the acquired data using conventional kinetics models and/or calculations.
- a modelassumes first order kinetics (a single mode binding) and the observed rate (k obs ) can be plotted versus the concentration of one of the species.
- a desired kinetic parametersuch as, for example, K D
- K Dcan be determined by, for example, a least squares analysis of the relationship plotted above.
- a suitable fitting modelcan be selected based on the particular experimental condition such that a rate approximation can be determined at the end of the analysis.
- One of skill in the artcan readily select an appropriate model or calculation to determine a particular kinetic parameter from data obtained via refractometry analysis.
- refractometrycan measure immobilized bait measurements.
- the baitcan be one of two interacting species, and, in conventional immobilized bait measurements, the bait is immobilized at a surface of the analysis system, wherein the interaction and analysis occur.
- the disclosed methodscan involve free-solution measurements.
- the disclosed methodscan be used to interrogate analytes that are non-immobilized, yet bound. That is, the analyte can be selectively bound to another species, yet neither analyte is immobilized at a surface of the analysis system.
- the baitcan be bound upon a substrate that is introduced as a free solution with respect to the detection zone.
- the baitcould be immobilized in a micelle, upon a nanoparticle, or within a cell membrane fragment.
- the disclosed systems and methodscan be applied to molecules embedded in micelles, cell membrane segments, intact cells, and/or nanoparticles with derivatized surfaces.
- one binding partnercan be bound upon a nano- or microsupport that can then be analyzed within the disclosed systems under free solution conditions by using the disclosed methods.
- an analytecan be bound to a magnetic particle and delivered (or held) by magnetic fields at a desired detection zone within a larger system (e.g., a biological system such as an organism).
- a larger systeme.g., a biological system such as an organism.
- one or more of the interacting analytescan be bound by “tether” to a surface of the system within the detection zone. Another, free-solution analyte can then be allowed to interact with the bound analyte, thereby forming one or more interaction products, which can remain bound via the tether or can be released into free solution.
- the tethercan be, for example, attachment via covalent bond or other strong interaction. The attachment directly to the surface, attachment via a relatively short tether (e.g., functionalized alkyl chain, oligomer, or self-assembled monolayer) or via a long tether (e.g., functionalized alkyl chain or polymer—potentially hundreds or thousands of nanometers in length).
- a first analyteis attached to a surface (e.g., via tether attachment).
- the attachmentis typically followed by a wash step to remove remaining unattached first analyte from the sample or detection zone; this wash can be necessary to eliminate or minimize any interaction due to non-immobilized first analyte.
- the wash stepis followed by the addition of a second analyte, which interacts with the immobilized first analyte to form one or more immobilized interaction products.
- this stepis followed by a second wash step to remove remaining non-interacted second analyte from the sample or detection zone; this wash can be necessary to eliminate or minimize any interaction due to non-interacted second analyte.
- the second wash stepcan be unnecessary, as the signal observed in response to the formation and presence of the one or more interaction products is strong relative to any response due unreacted analytes. Similarly, if the proper control or reference is used for comparison the second wash step may be unnecessary.
- the disclosed methodscan be performed for the analysis of interaction between an immobilized or tethered analyte and a non-immobilized analyte while omitting the second wash step.
- the inventionrelates to a free-solution analytical method for detecting molecular interactions comprising the steps of: (a) providing a refractive index sensor for reception of a fluid sample to be analyzed; (b) introducing a first sample comprising a first non-immobilized analyte to be analyzed and a second sample comprising a second non-immobilized analyte to be analyzed onto the sensor, wherein the first analyte is allowed to interact with the second analyte; (c) interrogating the fluid sample with light; and (d) detecting the light after interaction with the fluid sample, wherein the detected light is not backscattered, wherein the method is employed to investigate non-immobilized, yet bound analytes.
- the methodfurther comprises the steps of: (a) introducing a reference sample; (b) interrogating the reference sample with light; (c) detecting the light after interaction with the reference sample, wherein the detected light is not backscattered; (d) determining a characteristic of the reference sample; and (e) employing the characteristic of the reference sample to compensate for background interference effects in the determination of the molecular interaction between the first and second analyte in the first channel.
- the detected lightis not scattered.
- the reference samplecan be introduced, for example, onto the refractive index sensor.
- the reference samplecan be introduced into a channel.
- the reference samplecan be introduced into the first channel.
- the reference samplecan be introduced into the second channel.
- the inventionrelates to a free-solution analytical method for detecting molecular interactions comprising the step of detecting a molecular interaction between two non-immobilized analytes, wherein at least one of the analytes is present during the determination at a concentration of less than about 5.0 ⁇ 10 ⁇ 4 M, wherein the method is employed to investigate non-immobilized, yet bound analytes.
- the inventionrelates to a free-solution analytical method for detecting molecular interactions comprising the step of detecting a molecular interaction between two non-immobilized analytes, wherein at least one of the analytes is present during the determination in a solution with a volume in the detection zone of less than about 500 nL, wherein the method is employed to investigate non-immobilized, yet bound analytes.
- the inventionrelates to a free-solution analytical method for detecting molecular interactions comprising the steps of: (a) providing a refractive index sensor for reception of a fluid sample to be analyzed; (b) introducing a reference sample; (c) establishing a baseline interferometric response by interrogating the reference sample with light; (d) introducing a first sample comprising a mixture of a first non-immobilized analyte and a second non-immobilized analyte to be analyzed, wherein the first analyte is allowed to interact with the second analyte, onto the sensor; (e) interrogating the fluid sample with light; and (f) detecting the light after interaction with the fluid sample, wherein the detected light is not backscattered, wherein the method is employed to investigate non-immobilized, yet bound analytes.
- refractometrycan measure free solution measurements.
- Conventional methodstypically require measuring the amount of bound analyte by for example Western blotting that requires tethering a protein to a solid support, binding the antibody, and then binding a secondary antibody that has a label attached to it for visualization.
- the disclosed refractometry methoddoes not require that the protein being examined be bound to a solid support, as the measurement could be made in free solution.
- SPRsurface plasmon resonance
- optical wave-guide techniquesgrating coupled optical waveguide techniques
- micro-cantilever techniquesatomic force microscopy
- acoustic techniquesas well as labeled techniques (including chemiluminescence, ELISA, fluorescence detection, and solid or liquid scintillation) can be achieved with the disclosed systems and methods.
- labeled techniquesincluding chemiluminescence, ELISA, fluorescence detection, and solid or liquid scintillation
- the inventionrelates to a free-solution analytical method for detecting molecular interactions comprising the steps of: (a) providing a refractive index sensor for reception of a fluid sample to be analyzed; (b) introducing a first sample comprising a first non-immobilized analyte to be analyzed and a second sample comprising a second non-immobilized analyte to be analyzed onto the sensor, wherein the first analyte is allowed to interact with the second analyte; (c) interrogating the fluid sample with light; and (d) detecting the light after interaction with the fluid sample, wherein the detected light is not backscattered. In a further aspect, the detected light is not scattered.
- the methodfurther comprises the steps of: (a) introducing a reference sample; (b) interrogating the reference sample with light; (c) detecting the light after interaction with the reference sample, wherein the detected light is not backscattered; (d) determining a characteristic of the reference sample; and (e) employing the characteristic of the reference sample to compensate for background interference effects in the determination of the molecular interaction between the first and second analyte in the first channel.
- the reference samplecan be introduced, for example, onto the refractive index sensor.
- the reference samplecan be introduced into a channel.
- the reference samplecan be introduced into the first channel.
- the reference samplecan be introduced into the second channel.
- the inventionrelates to a free-solution analytical method for detecting molecular interactions comprising the step of detecting a molecular interaction between two non-immobilized analytes, wherein at least one of the analytes is present during the determination at a concentration of less than about 5.0 ⁇ 10 ⁇ 4 M.
- the inventionrelates to a free-solution analytical method for detecting molecular interactions comprising the step of detecting a molecular interaction between two non-immobilized analytes, wherein at least one of the analytes is present during the determination in a solution with a volume in the detection zone of less than about 500 nL.
- the inventionrelates to a free-solution analytical method for detecting molecular interactions comprising the steps of: (a) providing a refractive index sensor for reception of a fluid sample to be analyzed; (b) introducing a reference sample; (c) establishing a baseline interferometric response by interrogating the reference sample with light; (d) introducing a second sample comprising a mixture of a first non-immobilized analyte and a second non-immobilized analyte to be analyzed, wherein the first analyte is allowed to interact with the second analyte, onto the sensor; (e) interrogating the fluid sample with light; and (f) detecting the light after interaction with the fluid sample, wherein the detected light is not backscattered.
- refractometrycan measure label-free molecular interactions.
- a label-free measurement in life science applicationscan be when the RI instrument is used to interrogate the binding of two biological macromolecules, such as a DNA binding protein and the fragment of DNA that contains the sequence that the protein binds by examining a change in the interference pattern produced from the reflection and refraction of the solution upon mixing the two biological macromolecules.
- conventional methodsrequire DNA oligonucleotides to be immobilized prior to measuring the binding of a single-stranded DNA binding protein which was visualized using surface plasmon resonance (1999 JACS Brockman et al., 121:8044-51).
- the disclosed refractometry methoddoes not require that the protein being examined be labeled or be bound to a solid support, since the measurement could be made in free solution
- refractometrycan measure classes of biomolecular interaction studies as described herein.
- proteinsincludes glycoproteins, lectins, peptides, antibodies, protein antibody mimetic and any antibody subclasses including SCFV, Fab, Fc, or molecular imprints (MIP).
- the biomolecular interactionis an interaction of a protein with a protein.
- the biomolecular interactionis an interaction of an antibody with an antigen.
- the biomolecular interactionis an interaction of an enzyme and a substrate.
- the biomolecular interactionis an interaction of a protein and a virus.
- virusincludes phage.
- the biomolecular interactionis an interaction of a receptor and a ligand.
- the biomolecular interactionis an interaction of a protein and a carbohydrate.
- the biomolecular interactionis an interaction of a protein and a nucleic acid.
- nucleic acidincludes DNA, RNA, and aptamers.
- the biomolecular interactionis an interaction of a receptor and a ligand.
- the biomolecular interactionis an interaction of a nucleic acid with a nucleic acid.
- the biomolecular interactionis an interaction of a small molecule with a protein. In a further aspect of the invention, the biomolecular interaction is an interaction of a small molecule with a nucleic acid. In a further aspect of the invention, the biomolecular interaction is an interaction of a small molecule with a receptor. In a further aspect of the invention, the biomolecular interaction is an interaction of a small molecule and a carbohydrate. In a further aspect of the invention, the biomolecular interaction is an interaction of a small molecule and a virus. In a further aspect of the invention, the biomolecular interaction is an interaction of a small molecule with a small molecule.
- the biomolecular interactionis an interaction of a cell with a protein. In a further aspect of the invention, the biomolecular interaction is an interaction of a cell with a carbohydrate. In a further aspect of the invention, the biomolecular interaction is an interaction of a cell with a cell. In a further aspect of the invention, the biomolecular interaction is an interaction of a cell with a small molecule. In a further aspect of the invention, the biomolecular interaction is an interaction of a cell with a nucleic acid. In a further aspect of the invention, the biomolecular interaction is an interaction of a cell with a virus.
- the inventionrelates to a free-solution analytical method for detecting molecular interactions comprising the steps of: (a) providing a refractive index sensor for reception of a fluid sample to be analyzed; (b) introducing a first sample comprising a first non-immobilized analyte to be analyzed and a second sample comprising a second non-immobilized analyte to be analyzed onto the sensor, wherein the first analyte is allowed to interact with the second analyte; (c) interrogating the fluid sample with light; and (d) detecting the light after interaction with the fluid sample, wherein the detected light is not backscattered, wherein the method is employed to measure one or more characteristic properties and/or chemical events of unlabelled (i.e., substantially label-free) analytes.
- the detected lightis not scattered.
- the methodfurther comprises the steps of: (a) introducing a reference sample; (b) interrogating the reference sample with light; (c) detecting the light after interaction with the reference sample, wherein the detected light is not backscattered; (d) determining a characteristic of the reference sample; and (e) employing the characteristic of the reference sample to compensate for background interference effects in the determination of the molecular interaction between the first and second analyte in the first channel.
- the reference samplecan be introduced, for example, onto the refractive index sensor.
- the reference samplecan be introduced into a channel.
- the reference samplecan be introduced into the first channel.
- the reference samplecan be introduced into the second channel.
- the inventionrelates to a free-solution analytical method for detecting molecular interactions comprising the step of detecting a molecular interaction between two non-immobilized analytes, wherein at least one of the analytes is present during the determination at a concentration of less than about 5.0 ⁇ 10 ⁇ 4 M, wherein the method is employed to measure one or more characteristic properties and/or chemical events of unlabelled (i.e., substantially label-free) analytes.
- the inventionrelates to a free-solution analytical method for detecting molecular interactions comprising the step of detecting a molecular interaction between two non-immobilized analytes, wherein at least one of the analytes is present during the determination in a solution with a volume in the detection zone of less than about 500 nL, wherein the method is employed to measure one or more characteristic properties and/or chemical events of unlabelled (i.e., substantially label-free) analytes.
- the inventionrelates to a free-solution analytical method for detecting molecular interactions comprising the steps of: (a) providing a refractive index sensor for reception of a fluid sample to be analyzed; (b) introducing a reference sample; (c) establishing a baseline interferometric response by interrogating the reference sample with light; (d) introducing a first sample comprising a mixture of a first non-immobilized analyte and a second non-immobilized analyte to be analyzed, wherein the first analyte is allowed to interact with the second analyte, onto the sensor; (e) interrogating the fluid sample with light; and (f) detecting the light after interaction with the fluid sample, wherein the detected light is not backscattered, wherein the method is employed to measure one or more characteristic properties and/or chemical events of unlabelled (i.e., substantially label-free) analytes.
- SPRSurface enhanced Raman spectroscopy
- SPRSurface Plasmon Resonance
- BBIBiolayer Interferometry
- SPRis an optical phenomenon used for measuring molecular interactions but requires that one molecular species be immobilized.
- the SPR signalarises in thin metal films and the signal depends on the refractive index of solutions in contact with the metal surface.
- a challenging aspect of using SPRis the dependence on the relative mass of the binding partners. For example, measuring a small molecule in solution binding a large, immobilized protein is quite difficult. Direct immobilization of one of the molecular species without disrupting its binding activity is an additional challenge.
- refractometrycan be used to measure the binding of macromolecules without either macromolecule being fixed to a surface.
- SPRit was recently shown that soluble monomeric beta-amyloid peptides can bind anti-beta-amyloid monoclonal antibodies (J Phys Chem B 2007; 111: 1238-43).
- refractometrycan also be used to measure soluble monomeric beta-amyloid peptides binding an anti-beta-amyloid monoclonal antibodies in free solution.
- An additional challenge of SPRis the dependence on relative mass of the binding partners. For example, measuring a small molecule in solution binding a large, immobilized protein can be extremely difficult.
- a further type of detector that can be replaced or used in combination with refractometryis one that utilizes grating based approaches such as optical waveguide lightmode spectroscopy (OWLS).
- OWLSmeasures the surface immobilization of biomolecules in an aqueous solution.
- the techniqueis based on the incoupling of a laser into a waveguide by an optical grating. The incoupling only occurs at two defined angles that are sensitive to a change in the refractive index above the surface in the evanescent field.
- the OWLS methoduses the change in the refractive index to measure the adsorbed mass.
- a challenging aspect of using OWLSis direct immobilization of one of the molecular species.
- refractometrycan be used to measure the binding of macromolecules without either macromolecule being fixed to a surface.
- OWLSthe interaction between mycotoxins and anti-mycotoxin monoclonal antibodies was measured (Biosens Bioelectron 2007 22:797-802).
- RIcan also be used to measure the binding of soluble mycotoxins binding anti-mycotoxin monoclonal antibodies in free solution.
- a further type of detector that can be replaced or used in combination with refractometryis one that utilizes mass-sensitive measurements such as surface acoustic wave (SAW).
- SAWsurface acoustic wave
- small mass changescan be measured that result from molecules binding the receptor molecules coupled to the active sensor surface.
- Small mass changes at the sensor surfaceaffects the propagation velocity of acoustic shear waves traveling through a guiding layer at the sensor surface.
- a challenging aspect of using SAWis direct immobilization of one of the molecular species.
- refractometrycan be used to measure the binding of macromolecules without either macromolecule being fixed to a surface.
- a further type of detector that can be replaced or used in combination with refractometryis one that utilizes mass-sensitive measurements utilizing a piezoelectric crystal. For example, small mass changes can be measured that result from molecules binding the receptor molecules coupled to the active sensor surface due to a change in the oscillation frequency of a piezoelectric crystal. Piezoelectric crystals oscillate as a function of both the electrical frequency applied to the crystal and the crystal's mass. Small mass changes can therefore be measured electrically. In contrast to a microbalance, refractometry can be used to measure the binding of macromolecules without either macromolecule being fixed to a surface.
- a further type of detector that can be replaced or used in combination with refractometryis one that utilizes electrochemical measurements.
- one electrochemical biosensorcan detect L-phenylalanine via activity of three immobilized enzymes. The three enzymes are immobilized on an electrode wherein first L-phenylalanine dehydrogenase binds and reacts with L-phenylalanine producing NADH. Then salicylate hydroxylase uses oxygen and NADH to convert salicylate to catechol. Then tyrosinase oxidizes catechol to o-quinone which is reduced back to catechol with an electrode potential of ⁇ 50 mV (Anal Commun 1999 36:281).
- refractometrycan be used to directly measure the presence of L-phenylalanine by its binding to another macromolecule in free solution.
- the inventionrelates to a free-solution analytical method for determination of molecular interactions comprising the steps of: (a) providing a refractive index sensor for reception of a fluid sample to be analyzed; (b) introducing a first sample comprising a first non-immobilized analyte to be analyzed and a second sample comprising a second non-immobilized analyte to be analyzed onto the sensor, wherein the first analyte is allowed to interact with the second analyte; (c) interrogating the fluid sample with light; and (d) detecting the light after interaction with the fluid sample, wherein the detected light is not backscattered, wherein the method is employed to directly assay an analyte of interest in the absence of one or more specially modified enzymes, or an enzyme cascade.
- the detected lightis not scattered.
- the methodfurther comprises the steps of: (a) introducing a reference sample; (b) interrogating the reference sample with light; (c) detecting the light after interaction with the reference sample, wherein the detected light is not backscattered; (d) determining a characteristic of the reference sample; and (e) employing the characteristic of the reference sample to compensate for background interference effects in the determination of the molecular interaction between the first and second analyte in the first channel.
- the reference samplecan be introduced, for example, onto the refractive index sensor.
- the reference samplecan be introduced into a channel.
- the reference samplecan be introduced into the first channel.
- the reference samplecan be introduced into the second channel.
- the inventionrelates to a free-solution analytical method for detecting molecular interactions comprising the step of detecting a molecular interaction between two non-immobilized analytes, wherein at least one of the analytes is present during the determination at a concentration of less than about 5.0 ⁇ 10 ⁇ 4 M, wherein the method is employed to directly assay an analyte of interest in the absence of one or more specially modified enzymes, or an enzyme cascade.
- the inventionrelates to a free-solution analytical method for detecting molecular interactions comprising the step of detecting a molecular interaction between two non-immobilized analytes, wherein at least one of the analytes is present during the determination in a solution with a volume in the detection zone of less than about 500 nL, wherein the method is employed to directly assay an analyte of interest in the absence of one or more specially modified enzymes, or an enzyme cascade.
- the inventionrelates to a free-solution analytical method for detecting molecular interactions comprising the steps of: (a) providing a refractive index sensor for reception of a fluid sample to be analyzed; (b) introducing a reference sample; (c) establishing a baseline interferometric response by interrogating the reference sample with light; (d) introducing a first sample comprising a mixture of a first non-immobilized analyte and a second non-immobilized analyte to be analyzed, wherein the first analyte is allowed to interact with the second analyte, onto the sensor; (e) interrogating the fluid sample with light; and (f) detecting the light after interaction with the fluid sample, wherein the detected light is not backscattered, wherein the method is employed to directly assay an analyte of interest in the absence of one or more specially modified enzymes, or an enzyme cascade.
- a further type of detector that can be replaced or used in combination with refractometryis one that utilizes atomic force microscopy (AFM).
- AFMutilizes the deflection of a microscale cantilever by forces such as electrostatic or Van Der Waal etc. in order to scan a specimen at the nanometer scale.
- the techniquecan be used to image, measure or manipulate matter.
- AFMhas been used to measure the dissociation rate constants of aptamer protein complexes (Chem Asian J 2007 2:284-9).
- refractometrycan be used to measure equilibrium dissociation rate constants of aptamer protein complexes in free solution.
- Refractometrycan be used in any market where measuring macromolecular interactions is desired.
- basic life science researchbetter understanding of how proteins interact with one another in the complex networks that form biochemical and genetic regulatory pathways can lead to a better understanding of new potential intervention points.
- improperly functioning networksdue to inherited or somatic genetic mutations, can be probed with the disclosed methods.
- Drug discovery and development, as well as translational research,can also greatly benefit from the disclosed invention, because it offers alternatives for analysis wherein therapeutics bind a target molecule, thereby enabling further development of drug candidates. Modifications to drug candidates can also be assessed using refractometry as a tool to determine binding properties to the target of interest. Strong and specific binding can be important for effective therapeutics. Moreover, understandings of which biomarkers are useful for predicting drug efficacy can benefit from tests for their presence in patients, as well as tests that help elucidate their basic biochemical and physiologic properties. It is contemplated that the disclosed invention can facilitate drug discovery, drug development, and translational research.
- the disclosed inventioncan also be used in clinical diagnostics for early diagnosis of disease, monitoring disease progression, measurement of drug response to disease, and other applications of personalized medicine diagnostics, such as determining optimum drug dosage or drug for each individual based on diagnostic testing.
- RU obsis the observed instrument response in resonance units after blank subtraction
- ⁇is the refractive index at the surface which increases as ligand binds to immobilized macromolecule
- Xis a factor to convert ⁇ to RU obs
- ( ⁇ / ⁇ C) ligandis the refractive index increment (RII) of the bound ligand
- Cis the concentration of ligand bound at the biospecific surface in mass/volume.
- (RU pred ) maxis the predicted maximum instrument response in resonance units for binding at a single site
- RU Mis the experimental amount of macromolecule immobilized on the chip in resonance units
- MW Lis the molecular weight of the ligand
- MW Mis the molecular weight of the immobilized macromolecule
- ( ⁇ / ⁇ C) L /( ⁇ / ⁇ C) Mis the RII of the macromolecule. Note that the predicted signal is directly proportional to the relative mass of the binding pair.
- the first attempt at modeling the free-solution assayswas heuristic and based on the assumption that binding-induced change in hydrodynamic radius dominated the signal for CaM interactions.
- the preliminary calculationsutilized the PDB structural information to estimate the radius of gyration (R gyr ) and solvent accessible surface area (SASA) of the bound and unbound species ( ⁇ R gyr and ⁇ SASA).
- R gyrradius of gyration
- SASAsolvent accessible surface area
- K DA binding system's dissociation constant (K D ) is related to the concentration of free protein [P], free ligand [A] and bound complex [PA] by the mass-balance equation:
- K D( [ P ] tot - [ PA ] ) ⁇ ( [ A ] tot - [ PA ] ) [ PA ] ( 10 )
- K D [ PA ]([ P ] tot ⁇ [ PA ])([ A ] tot ⁇ [ PA ])
- K D [ PA ][ P ] tot [ A ] tot ⁇ [ A ] tot [ PA ] ⁇ [ P ] tot [ PA ]+[ PA ] 2
- the concentration [PA]can then be solved for by using the concentration [PA] can then be solved for by using the
- [ PA ]( [ P ] tot + [ A ] tot + K D ) ( [ P ] tot + [ A ] tot + K D ) 2 - 4 ⁇ [ P ] tot ⁇ [ A ] tot 2 ( 12 )
- This resultwill yield two outcomes, only one of which will be physically relevant, which is used to calculate the amount of complex present in a binding assay based upon known concentrations of the protein, ligand, and the K D .
- the refractive index increment (RII) values usedwere 0.146 mL/g (Tumolo et al. (2004) Determination of the refractive index increment (dn/dc) of molecule and macromolecule solutions by surface plasmon resonance. Anal Biochem 333(2):273-279) for mannose and 0.190 mL/g for ConA (Zhao et al. (2011) On the Distribution of Protein Refractive Index Increments. Biophys J 100(9):2309-2317). Using a molecular weight for mannose of 180 Daltons and 26.5 kDa for ConA and equation 13, the calculated mass weighted RII for the binding system (d ⁇ /dc complex ) is 0.1897 mL/g.
- RII valueswere then used to predict the refractive index change in both the reference and test sample solutions.
- the referencesare samples that do not contain the receptor (ligand alone), so ⁇ RIU calculated by multiplying the RII by the concentration of ligand (Eq 14).
- ⁇ RIU referenceRII ligand ⁇ [ligand] (14)
- the ⁇ RIU predicted for the d ⁇ /dc complexwhich is the difference between the reference and test samples at the same ligand concentration, was plotted versus ligand concentration in FIG. 6B .
- the plotalso presents the experimentally measured binding signal produced by BSI ( FIG. 6B ), clearly showing the difference in measured signal and that predicted by the currently accepted theory and FreeSRF.
- This exampleis in agreement with the statement (Jepsen et al. (2015) Evaluation of back scatter interferometry, a method for detecting protein binding in solution. Analyst 140(3):895-901): “that it would be in conflict with the conventional theory to expect a protein binding event would produce a measureable RI change expected by pure dn/dc considerations.”
- the concentration of complex at maximum bindingwas found to be 1.79 ⁇ M (4.76 ⁇ 10 ⁇ 5 g/mL) or a maximum ⁇ RIU of 1.4 ⁇ 10 ⁇ 8 . This value is considerably below the detection limit of most RI detectors (ca. 10 ⁇ 6 ).
- the experimental ⁇ RIUwas set equal to the difference between the ⁇ RIU of the test sample (17) and the ⁇ RIU of the reference sample (14) at the highest concentration. It was found that the RII of the ConA-mannose complex would need to be 3164.1 mL/g to generate the experimental signal. The RII calculated using the Qain equation predicts a value of 0.1897 mL/g.
- FIG. 6D-Fillustrate similar results are obtained for the protein-protein binding pair.
- the ligandis much larger in mass (and absolute RI)
- the ⁇ RIU of the reference (calcineurin) and the test samples, (Eqs 14-17)are below the detection limits of the instrument. This result is attributed to the use of considerably lower concentrations of the ligand.
- the FreeSRF (binding) signal quantified by the interferometerwas large and reproducible at ⁇ RIU (4.41 ⁇ 10 ⁇ 4 ).
- FIG. 7A and FIG. 7Bpresent the results for performing the calculations shown in Eqs 14-17 for two other binding systems ( 7 A) Recoverin binding Ca 2+ ; and ( 7 B) Carbonic Anhydrase II binding dansylamide).
- 7 ARecoverin binding Ca 2+
- 7 BCarbonic Anhydrase II binding dansylamide
- Zhao et al.large proteins ( ⁇ 10 kDa) exhibit a RII of 0.190 with a Gaussian standard deviation of 0.003 mL/g (Zhao et al. (2011) On the Distribution of Protein Refractive Index Increments. Biophys J 100(9):2309-2317), so this value was used for all species that met that criteria. In all cases, a 0.003 mL/g deviation produced minimal change in the final mass weighted refractive index change calculation.
- Free-solution assaysmust be prepared to purposely minimize the difference in RI between the sample and the reference (and/or control).
- the procedureis illustrated in FIG. 8 and, in short, the sample and reference are prepared from the same matrix (buffer, serum, urine, RBCs, etc.).
- a fixed concentration solution of the receptoris prepared in the matrix and then combined with the ligand dilution series, which is typically prepared in buffer.
- Reference solutionsare matrix solutions, devoid of the receptor/target that have been combined with the dilution series.
- the reference sampleconsists of a preparation with the receptor either absent from the matrix or inactivated (expression knocked out, chemically blocked, etc.).
- Test samplesare prepared by combining the dilution series with the receptor-in-matrix solutions. Reference and test samples are then allowed to reach equilibrium, often on ice when proteins are evaluated, and then introduced sequentially into the interferometer. The difference in fringe position (shift) between the reference and test sample reports the binding/interaction in a concentration dependent manner.
- Channel rinsesserves to improve replicate assay reproducibility by minimizing the contribution of non-specific binding.
- a wide variety of rinse solutionshave been found to be successful, ranging from simply buffer to light acid/base to Piranha, to methanol and chloroform. Since the chip is the optics, the baseline shift from sample to sample can be used to determine if something has been adsorbed to the surface and when it has been removed.
- nM-pMConcentrations of nM-pM are typically used, a regime where neither the ligand nor the probe exhibits a quantifiable response. In this case, there is no d ⁇ /dC response expected, yet procedures always include the d ⁇ /dC determination for a dilution series of the ligand. This procedure allows for compensation of species with higher RI values that would potentially skew the saturation isotherm (Bornhop et al. (2007) Free-solution, label-free molecular interactions studied by back-scattering interferometry. Science 317(5845):1732-1736; Kussrow A, Enders C S, & Bornhop D J (2012) Interferometric Methods for Label-Free Molecular Interaction Studies. Anal Chem 84(2):779-792).
- Free-solution measurementsdo quantify solution-phase RI changes; thus effective, long-term environmental control is needed to succeed. Since d ⁇ /dT is large for fluids, temperature control of the sample/chip is required at the level of a couple millidegrees C. Accomplishing this level of thermal stability consists of isolating the optical train, using a high-performance Peltier controller and thermoelectric device (TE), and a chip mount with a large thermal mass and designed to have intimate contact with TE and the chip (Bornhop et al. (2007) Free-solution, label-free molecular interactions studied by back-scattering interferometry. Science 317(5845):1732-1736; Kussrow A, Enders C S, & Bornhop D J (2012) Interferometric Methods for Label-Free Molecular Interaction Studies. Anal Chem 84(2):779-792).
- TEPeltier controller and thermoelectric device
- the best angleis 90° direct backscatter configuration, but to prevent light reentering the laser cavity and to direct the fringes onto the camera, it has been found that ⁇ 7° angle is acceptable. If the chip/capillary is not in maxima of the Gaussian profile the intensity profile will change significantly with different fringes reporting optical path length changes other than those desired. Optimization here is easily accomplished by translating the beam or chip so as to obtain equal intensity on both sides of the centroid.
- FIG. 11A and FIG. 11Bpresents optical ray traces of the optical train using ASAP® modeling software.
- FIG. 11Bpresents a higher resolution modeling outcome, showing, as empirical evidence suggests (Swinney et al.
- the probe volumewas determined by calculating the volume of fluid within the intersection of the beam and the channel.
- the cross sectional area of channelis two quarter circles connected by a 10 ⁇ m wide rectangle (width of the etch mask) and can be calculated by:
- A⁇ ⁇ ⁇ r 2 2 + 10 ⁇ r ( 18 )
- ris the etch radius of the channel in ⁇ m.
- the channelshave an etch radius of 100 ⁇ m, yielding a cross sectional area of 16708 ⁇ m 2 .
- This areais then multiplied by the beam diameter (d) to determine the probe volume.
- the beam diameteris 450 ⁇ m and results in a probe volume of 7.5 nL.
- FIG. 9A-CThe optical train depicted in FIG. 9A-C is quite simple for a highly sensitive, small volume interferometer, consisting of a coherent source, an object (channel in a chip or capillary) and a transducer. Probing the object with an unfocused He—Ne beam at nearly 90° ( ⁇ 7° to allow fringes to be viewed), results in a high-contrast interference fringe pattern ( FIG. 9D-F ) in the back-scattered direction.
- the sample/chipis probed with both planes of polarization as a result of coupling a linearly polarized laser into a non-polarization maintaining single mode fiber coupler. Misalignment will lead to slanted fringes and/or fringes with poor contrast. All of the configurations of BSI investigated exhibit a classical d ⁇ /dC and d ⁇ /dT response expected of an RI detector.
- FIG. 12A-Dthe structural diversity found in calmodulin (CaM) was used ( FIG. 12A-D ). Binding of Ca 2+ to CaM ( FIG. 12A ) leads to a significant conformation and hydration change (Project et al. (2006) A molecular dynamics study of the effect of Ca2+ removal on calmodulin structure. Biophys J 90(11): 3842-3850), resulting in a new complex, Ca 2+ -CaM ( FIG. 12B ) which has a considerable and quantifiably different electromagnetic cross-section (dielectric constant). Then, if the Ca 2+ -CaM complex reacts with the M13 protein kinase ( FIG.
- the subsequent complexis unique and has a quantifiably different RI due to induced structural and hydration changes (Torok K (2002) Calmodulin conformational changes in the activation of protein kinases. Biochem Soc T 30:55-61). Binding the small-molecule inhibitor, TFP, induces changes in atomic arrangement and hydration that leads to yet another unique chemical entity ( FIG. 12D ) (Vandonselaar et al. (1994) Trifluoperazine-induced conformational change in Ca(2+)-calmodulin. Nat Struct Biol 1(11):795-801).
- FreeSRFis not proportional to the sum of the mass-weighted change in RI for the reactants (Eq 13-17 and FIG. 7A , FIG. 7B , and FIG. 6A-F ), this property does not preclude non-reacting or non-interacting analytes from exhibiting an RI response. Only the proper preparation of the sample and reference, typically from the same matrix, enables the extraction of the free-solution signal by canceling out (often) very large bulk RI background signals. In other words, the determination is not made by comparing samples with huge RI differences, but nearly identical ⁇ RI values.
- ⁇ RI6 ⁇ 10 ⁇ 6 .
- the use of relative measurementsensures that the interaction is the predominant signal. Further, to minimize the influence of non-specific binding at the surface a base-line is established with the receptor present in the buffer or matrix under investigation and then using rinse solutions, reestablish this level before introduction of every new concentration for the assay.
- the first attempt to formulate a model for label-free, free-solution assayswas heuristic and based on the assumption that binding-induced change in hydrodynamic radius dominated the signal for CaM interactions.
- Preliminary calculationsutilized the Protein Data Bank (RCSD/PDB) structural information to estimate the radius of gyration (R gyr ) and solvent accessible surface area (SASA) of the bound and unbound species ( ⁇ R gyr and ⁇ SASA).
- RSD/PDBProtein Data Bank
- SASAsolvent accessible surface area
- 5Ashows the correlation between the predicted and experimental values for free-solution interaction studies of CaM binding Ca 2+ , Ca 2+ -CaM—TFP, Ca 2+ -CaM—calcineurin, Ca 2+ -CaM—M13 peptide.
- the surprisingly good correlation (R 20.88) between the actual and predicted signal magnitude for these binding events encouraged further investigation.
- this simple equationdemonstrates that the fringe shift (in radians) can be quantified by an interferometer or RI sensor when measuring a folding, binding, or hybridization event in free-solution (no labels) is directly proportional to: a) the magnitude of structural change (predominantly conformation and hydration) of the sample; b) the d ⁇ /dn sensitivity of the interferometer (which incorporates the optical path length); and c) the concentration of the analyte.
- ⁇is not a function of the RII or the relative mass of the interacting species and that it can be estimated for a binding pair with reasonable confidence.
- ⁇as the molar refractometry, it is recognized that the structural changes observed are a consequence of processes (folding, interactions, chemical reactions, biochemical transformations, etc.) that lead to changes in the analyte intrinsic properties, such as the dielectric constant, the molecular dipole moment, or other third order parameters.
- This premiseis supported by evidence from complementary techniques including CD, ellipsometry ( FIG. 4A and FIG. 4B ), ITC, DLS (Sulmann et al. (2014) Conformational Changes in Calcium-Sensor Proteins under Molecular Crowding Conditions. Chem - Eur J 20(22):6756-6762) and NMR.
- Accuracy in ⁇is dominated by the quality of the initial training set data and the correctness of the structure prediction method and data derived from it.
- Several combined resourcescan provide quality structural data: the PDB; 2) PYMOL/MOLMOL (molecular analysis and display programs) and 3) M-FOLD for structure prediction and 4) Chimera for structural analysis.
- Running a d ⁇ /dC calibration experimentallows ⁇ to be determined in radians/RIU for the specific instrument used in the binding assay.
- This experimentconsists of measuring the phase shift as a function of glycerol concentration in mM (or another suitable analyte). From this linear relationship, the slope was obtained, expressed in radians/mM.
- the response of BSI 4 (instrument #4 of 9) for a glycerol calibration curvewas found to be 0.011 radians/mM, a typical value for this chip-based device.
- ⁇was expressed in RIU per mM glycerol using a conversion factor from the CRC for d ⁇ /dC; in the case of glycerol this parameter is 1.04863 ⁇ 10 ⁇ 5 RIU/mM (Anonymous (1996-1997) CRC Handbook of Chemistry and Physics (Chemical Rubber Publishing Company, Boca Raton) 77th Ed.).
- BSI 4
- ⁇ modelA ( ⁇ SASA)+ B (aveSASA)+ C ( ⁇ R Gyr )+ D (ave R Gyr )+ E (22)
- ⁇ SASAis the difference in solvent addressable surface area for bound complex and the unbound species in ⁇ 2
- aveSASAis the sum of SASA values divided by the number of values (PDB structures)
- ⁇ R Gyris difference for the radius of gyration for the unbound species and that of the complex (bound species) in ⁇
- aveR Gyris sum of radius of gyration values divided by the number of values (PDB structures)
- A, B, C, D, and Eare fitting coefficients.
- the first atomis selected, and the probe is placed at a distance of the radius of the atom, and then moved around the atom in the tangential direction until the probe comes into contact with the nearest neighbor atom. Then, the probe is moved along a path of equal radial distance between the two atoms until it encounters a third atom. This process is repeated to find the junctions between all atoms and their neighbors until the probe has been moved across the entire structure and the whole surface of the structure has been constructed.
- Table 5presents the values for SASA for each of the learning set structures.
- the modelcan really be split in any number of ways (2 subsets or 3, 4, 5 subsets) and provide similar results, yet a division into just large and small sets results in a relatively simple and easy-to-use model that produces a reasonably high quality result. It is also possible that as the training set expands a group of intermediate species will emerge. To the best of knowledge, there's not really a way to ascribe a physical property to E, which is the error term, disturbance term, or noise. This variable captures all other factors which influence the dependent variable y i other than the regressors x i and is dissimilar for the large/small sets because of the significant difference in error between the two models.
- the training set usedhas a significant level of diversity, including ion-protein, protein-protein, small molecule-protein, protein-aptamer, membrane-protein targets analyzed as cell-derived vesicles, an antibody-antigen pair, and unaltered human erythrocytes (Saetear et al. (2015) Quantification of Plasmodium -host protein interactions on intact, unmodified erythrocytes by back-scattering interferometry. Malaria J 14). Further, the highly correlated results were obtained over a period spanning more than three years, by numerous BSI operators and on six different BSI instruments.
- FIG. 14Aillustrates the work flow used to estimate the applicability of using the small vs. large model.
- the structural information (PDB) and the large and small model-fitting parameters (A, B, C, D, and E)are used to calculate ⁇ model .
- the final complex concentrationis estimated by setting it equal to K D /10 (Table 1).
- FIG. 14Aillustrates that in most cases (23 of 27) or 85% of the time the prediction properly classifies the binding pair.
- An additional calculation using the instrument response function ⁇enables the determination of the actual ⁇ RI produced for a binding pair (Table 1). Two important observations can be gleaned from this table. The first is that the experimentally measured value ⁇ correlates well with the predicted signal. Second, the table and FIG. 7A , FIG. 7B , and FIG. 6A-F illustrate that the magnitude of ⁇ RI for a binding event is relatively large.
- the RI detectwas calibrated before the first data-recording session of each day using the procedure defined by the manufacturer. To do so, 70 ⁇ L of filtered water was injected into the sample well on the device, followed by a one minute waiting period for temperature equilibration. Then calibration function on the device was activated.
- the deviceis set to the correct units, which in this case was Refractive Index Units in “Temperature Corrected 20° C. Mode”. In this mode the device calculates (corrects for) what the RI of the solution would be when the solution is at 20° C. This setting was chosen based on the knowledge that minute changes in temperature can strongly affect RI.
- BSIwas used to determine the absolute RI signal expected for an interaction that had been previously characterized.
- Glycerol(Sigma) and DDI water was used to make a series of standards. Dilutions resulted in solutions with the final concentrations of 0, 10, 20, 30, and 40 mM.
- the glycerol solutionswere dispensed onto the RI detector sequentially from lowest to highest concentration, following the manufacturer's procedures, which included temperature equilibration and rinsing of the prism where the sample resides. Analysis was performed for the entire calibration set in triplicate.
- FIG. 16Billustrates the results from these experiments, showing that the Reichert detector operates at a ⁇ RI sensitivity level of about 1 ⁇ 10 ⁇ 4 RIU. As expected, the response is linear over the concentration range covered. For reference the ⁇ RI response predicted for these concentrations of glycerol by the CRC Handbook of Chemistry and Physics was plotted. There is an excellent correlation, thus it can be confirmed that the Reichert instrument is correctly measuring ⁇ RI values.
- CyfraAs with glycerol a stock solution of Cyfra was prepared. Here a stock solution concentration was made 50 ng/mL in using phosphate-buffered saline (PBS). This solution was then used to perform serial dilutions with PBS. The final Cyfra concentrations were 0, 6.25, 12.5, and 25 ng/mL. The 0 ng/mL concentration was simply a tube of PBS.
- PBSphosphate-buffered saline
- the stock solution of the (probe) antibody that binds to Cyfra, CK19was 10 ⁇ g/mL.
- Non-binding reference sampleswere also prepared by combining 240 ⁇ L of each Cyfra-spiked sample with 12.6 ⁇ L of PBS.
- FIG. 16Cdisplays the result for the detection of Cyfra-21-1 by RI sensing by using the label-free and free-solution binding of the antibody CK19 to the Cyfra target in buffer. It is noteworthy that the response slope of both the BSI and the Reichert RI compare favorably, as does the absolute magnitude of the ⁇ RI response.
- the reference sidewas filled with buffer by pressing “2 nd ” and the “Purge” button and then injecting the buffer (see purge flow path in FIG. 18B ).
- purgingwas stopped by pressing “2 nd ,” “Purge,” and then “Enter.” In order to ensure the buffer was in both reference and sample cells, “2 nd ” and then the “Auto zero” button were pressed.
- Glycerol(Sigma) and DDI water was used to make a series of standards. Dilutions resulted in solutions with the final concentrations of 0, 0.5, 1.0, 3.0, and 5.0 mM.
- the glycerol solutionswere inject directly through the flow cell at a volume of 1 mL/injection sequentially from lowest to highest concentration, following the manufacturer's procedures, which included temperature equilibration to 35° C. Analysis was performed for the entire calibration set in triplicate.
- a stock solution of mannosewas prepared at a concentration of 1.6 mM in buffer (50 mM sodium acetate+1 mM Ca 2+ +1 mM Mn 2+ ). This solution was then used to perform dilutions with buffer. The final mannose concentrations were 0, 100, 200, 800, and 1600 ⁇ M. The 0 ⁇ M concentration was simply a tube of buffer.
- the stock solution of Con Awas 8 ⁇ M.
- To prepare binding samples2.5 mL of Con A were combined with 2.5 mL of each mannose solution to insure that there was an excess of probe with respect to the target concentration. This dilution step led to the final mannose concentrations being equal to 0, 50, 100, 400, and 800 ⁇ M and a final Con A concentration of 4 ⁇ M.
- Non-binding reference sampleswere also prepared by combining 2.5 mL of each mannose-spiked sample with 2.5 mL of buffer.
- the procedureinvolved measuring the reference sample first, followed by the binding sample, with rinsing in between each trial as detailed above. This entire procedure was performed on each sample (spiked concentration), starting with the lowest concentration and ending with the highest concentration. The entire set of measurements was then repeated for three trials.
- Table 10 and FIG. 20displays the result for the detection of mannose by RI sensing using the label-free and free-solution binding of mannose to Con A in buffer. The results using BSI are shown for comparison.
- a stock solution of benzene sulfonamidewas prepared at a concentration of 1 mM in buffer (1% DMSO+PBS). This solution was then used to perform serial dilutions with buffer. The final benzene sulfonamide concentrations were 0.625, 1.25, 2.5, 5 and 10 ⁇ M.
- Non-binding reference sampleswere also prepared by combining 2.5 mL of each benzene sulfonamide-spiked sample with 2.5 mL of buffer.
- the procedureinvolved measuring the reference sample first, followed by the binding sample, with rinsing in between each trial as detailed above. This entire procedure was performed on each sample (spiked concentration), starting with the lowest concentration and ending with the highest concentration. The entire set of measurements was then repeated for three trials.
- FIG. 21A , and FIG. 21Bdisplay the results for the detection of benzene sulfonamide by RI sensing using the label-free and free-solution binding of benzene sulfonamide to CAII in buffer. The results using BSI are shown for comparison.
- a stock solution of azetazolamidewas prepared at a concentration of 1 mM in buffer (1% DMSO+PBS). This solution was then used to perform serial dilutions with buffer. The final azetazolamide concentrations were 0.0315, 0.0625, 0.125, 0.25, and 0.5 ⁇ m.
- Non-binding reference sampleswere also prepared by combining 2.5 mL of each azetazolamide-spiked sample with 2.5 mL of buffer.
- the procedureinvolved measuring the reference sample first, followed by the binding sample, with rinsing in between each trial as detailed above. This entire procedure was performed on each sample (spiked concentration), starting with the lowest concentration and ending with the highest concentration. The entire set of measurements was then repeated for three trials.
- FIG. 22A , and FIG. 22Bdisplay the results for the detection of azetazolamide by RI sensing using the label-free and free-solution binding of azetazolamide to CAII in buffer. The results using BSI are shown for comparison.
Landscapes
- Health & Medical Sciences (AREA)
- Life Sciences & Earth Sciences (AREA)
- Immunology (AREA)
- Chemical & Material Sciences (AREA)
- Physics & Mathematics (AREA)
- Analytical Chemistry (AREA)
- Biochemistry (AREA)
- General Health & Medical Sciences (AREA)
- General Physics & Mathematics (AREA)
- Pathology (AREA)
- Engineering & Computer Science (AREA)
- Biomedical Technology (AREA)
- Hematology (AREA)
- Molecular Biology (AREA)
- Urology & Nephrology (AREA)
- Biotechnology (AREA)
- Cell Biology (AREA)
- Microbiology (AREA)
- Food Science & Technology (AREA)
- Medicinal Chemistry (AREA)
- Investigating Or Analysing Materials By Optical Means (AREA)
Abstract
Description
aA+bB⇄cC+dD,
the equilibrium constant can be expressed by:
ηlayer=ηliquid+(dη/dC)dextranCdextran+(dη/dC)proteinCprotein (1)
In addition, the thickness of the protein at the surface, represented by a closely packed protein crystal was calculated. In the absence of values for solvent content and specific volume, they used Matthews report (Matthews, B. W. (1977)The Proteins III, (Academic Press, New York), pp 403-590) that indicated the fractional solvent content for globular protein crystals ranged from 30-78% to show the extreme values gave a surface thickness range of 60 and 200 nm.
ηsoln=fjηj+fkηk=fj(ηj−ηk)+ηk (2)
where f is the volume fraction of the species. Using a literature derived value for protein specific volume (Darnell et al. (1990)Molecular Cell Biology(Scientific American Books, New York; Leslie and Lilley (1985) Aqueous-Solutions Containing Amino-Acids and Peptides 0.20. Volumetric Behavior of Some Terminally Substituted Amino-Acids and Peptides at 298.15 K. Biopolymers 24(4):695-710) (0.77 mL/g) in
RUobs=η*X=X[(δn/δC)ligandC] (3)
where RUobsis the observed instrument response in resonance units after blank subtraction, η is the refractive index at the surface which increases as ligand binds to immobilized macromolecule, X is a factor to convert η to RUobs, (δη/δC)ligandis the refractive index increment (RII) of the bound ligand, and C is the concentration of ligand bound at the biospecific surface in mass/volume. In a plot of Δη versus concentration they showed that the RII range for small molecules can be quite large (0.15-0.34), and that the value measured for the protein BSA corresponded well with literature values of 0.17-0.18. They predicted the maximum SPR instrument (BIACORE) response for binding of a single ligand to be:
(RUpred)max=RUM·(MWL/MWM)*(δη/δC)L/(δη/δC)M (4)
Cligand=Δθ/X(δη/δC)ligand (5)
could be used to determine the RII of the ligand/molecule and macromolecule solutions, where C is concentration of molecules adsorbing over surfaces, Δθ shift detected and X is the instrument calibration constant.
Since the total amount of protein and ligand can be defined as:
[P]total=[P]free+[PA] (8)
[A]total=[A]free+[PA] (9)
these equations can be solved for amount of free protein and free ligand as:
[P]free=[P]tot−[PA]
[A]free=[A]tot−[PA]
The equation for KDcan then be rewritten as:
This can be rearranged to a quadratic in the following manner:
KD[PA]=([P]tot−[PA])([A]tot−[PA])
KD[PA]=[P]tot[A]tot−[A]tot[PA]−[P]tot[PA]+[PA]2
0=[PA]2−[A]tot[PA]−[P]tot[PA]−KD[PA]+[P]tot[A]tot
0=[PA]2−([P]tot+[A]tot+KD)[PA]+[P]tot[A]tot (11)
The concentration [PA] can then be solved for by using the quadratic equation:
This result will yield two outcomes, only one of which will be physically relevant, which is used to calculate the amount of complex present in a binding assay based upon known concentrations of the protein, ligand, and the KD.
where Wris the mass percentage of the receptor in the complex (Qian et al. (1997) Characterization of antigen-antibody complexes by size-exclusion chromatography coupled with low-angle light-scattering photometry and viscometry.J Chromatogr A787(1-2):101-109). For the example calculation the mannose binding to Concanavalin A (ConA) system was used. The refractive index increment (RII) values used were 0.146 mL/g (Tumolo et al. (2004) Determination of the refractive index increment (dn/dc) of molecule and macromolecule solutions by surface plasmon resonance.Anal Biochem333(2):273-279) for mannose and 0.190 mL/g for ConA (Zhao et al. (2011) On the Distribution of Protein Refractive Index Increments.Biophys J100(9):2309-2317). Using a molecular weight for mannose of 180 Daltons and 26.5 kDa for ConA and equation 13, the calculated mass weighted RII for the binding system (dη/dccomplex) is 0.1897 mL/g.
ΔRIUreference=RIIligand×[ligand] (14)
[receptor]=[receptor]initial−[product] (15)
[ligand]=[lingand]initial−[product] (16)
Using these concentration values and the RII's, the maximum ΔRIU of the binding samples can be calculated as:
ΔRIUtest=RIIproduct×[product]+RIIreceptor×[receptor]+RIIligand×[ligand] (17)
These values were plotted versus ligand concentration (
where r is the etch radius of the channel in μm. Here, the channels have an etch radius of 100 μm, yielding a cross sectional area of 16708 μm2.
| TABLE 1 | |||||
| Predicted ΔRIU | |||||
| BSI | Large | Small | ||||
| Receptor | Ligand | KD(M) | ΔRIU | Model | Model | |
| Large | IL-2 Antibody | Interleukin-2 | 2.59E−11 | 8.17E−05 | 2.13E−06 | 2.23E−09 |
| β2AR | Alprenolol | 5.50E−10 | 1.51E−05 | 3.33E−05 | 3.54E−08 | |
| β2AR | Isoproterenol | 1.52E−09 | 7.45E−06 | 4.25E−05 | 4.95E−08 | |
| Basigin | Rh5 | 1.08E−06 | 2.33E−05 | 2.30E−02 | 3.46E−05 | |
| Carbonic | Acetazolamide | 1.06E−08 | 2.87E−05 | 4.50E−05 | 2.56E−08 | |
| Anhydrase II | ||||||
| Carbonic | Acetazolamide | 1.06E−08 | 2.87E−05 | 196E−05 | 3.04E−08 | |
| Anhydrase II | ||||||
| Calmodulin | Calcineurin | 1.14E−08 | 4.90E−04 | 4.26E−05 | 9.66E−08 | |
| Calmodulin | Calcineurin | 1.14E−08 | 4.90E−04 | 5.88E−05 | 1.11E−07 | |
| Calmodulin | M13 | 9.87E−09 | 8.76E−05 | 1.52E−05 | 6.95E−08 | |
| Thrombin | Bock | 5.96E−09 | 1.90E−05 | 9.70E−06 | 4.84E−08 | |
| Thrombin | Tasset | 3.84E−09 | 1.45E−05 | 4.78E−06 | 3.00E−08 | |
| Carbonic | Benzene | 5.68E−07 | 1.38E−05 | 9.53E−04 | 2.65E−06 | |
| Anhydrase II | Sulfonamide | |||||
| Carbonic | Benzene | 5.68E−07 | 1.38E−05 | 2.62E−04 | 3.24E−06 | |
| Anhydrase II | Sulfonamide | |||||
| Carbonic | Sulfanilamide | 1.76E−06 | 3.92E−05 | 2.99E−03 | 8.15E−06 | |
| Anhydrase II | ||||||
| Carbonic | Dansylamide | 4.45E−07 | 1.72E−05 | 1.81E−03 | 1.15E−06 | |
| Anhydrase II | ||||||
| Small | Calmodulin | TFP | 7.82E−06 | 1.56E−04 | 1.42E−02 | 5.75E−05 |
| Calmodulin | TFP | 7.82E−06 | 1.56E−04 | 1.85E−02 | 6.15E−05 | |
| Calmodulin | TFP | 7.82E−06 | 1.56E−04 | 1.37E−02 | 5.72E−05 | |
| Carbonic | Sulpiride | 5.90E−06 | 3.11E−05 | 6.00E−04 | 3.55E−05 | |
| Anhydrase II | ||||||
| Calmodulin | Calmodulin- | 1.82E−05 | 2.89E−04 | 1.10E−02 | 1.03E−04 | |
| Ca2+ | ||||||
| HIV PR | Pepstatin | 5.30E−06 | 3.04E−05 | 2.24E−02 | 7.28E−06 | |
| 1F1N | ||||||
| HIV PR | Pepstatin 1F1 | 1.45E−05 | 4.52E−05 | 7.18E−02 | 1.04E−05 | |
| Concanavalin | Mannose* | 9.63E−05 | 1.55E−05 | 4.46E−01 | 1.39E−04 | |
| A | ||||||
| Concanavalin | Mannose* | 9.63E−05 | 1.55E−05 | 5.21E−01 | 7.38E−05 | |
| A | ||||||
| Concanavalin | Glucose* | 3.44E−04 | 1.46E−05 | 2.21E+00 | 4.41E−05 | |
| A | ||||||
| Concanavalin | Glucose* | 3.44E−04 | 1.46E−05 | 1.97E+00 | 1.60E−04 | |
| A | ||||||
| Recoverin | Ca2+ | 7.35E−07 | 4.42E−05 | 2.06E−03 | 5.74E−06 | |
ρ=χβC (19)
where: ρ is the FreeSRF measured in radians, χ is the Molar Refractometry in RIU/moles/L, β is the instrument response function in radians/RIU, and C is the concentration in moles/L. Without wishing to be bound by theory, this simple equation demonstrates that the fringe shift (in radians) can be quantified by an interferometer or RI sensor when measuring a folding, binding, or hybridization event in free-solution (no labels) is directly proportional to: a) the magnitude of structural change (predominantly conformation and hydration) of the sample; b) the dθ/dn sensitivity of the interferometer (which incorporates the optical path length); and c) the concentration of the analyte. Below, it is demonstrated that ρ is not a function of the RII or the relative mass of the interacting species and that it can be estimated for a binding pair with reasonable confidence.
| TABLE 2A |
| Large Model |
| Experimental | Model | Percent | ||
| Chi | Chi | Error | ||
| Receptor | Ligand | (RIU/M) | (RIU/M) | (%) |
| IL-2 Antibody | Interleukin-2 | 827964 | 823965 | 0.5 |
| β2AR | Alprenolol | 591423 | 604924 | 2.3 |
| β2AR | Isoproterenol | 290953 | 278649 | 4.2 |
| Basigin | Rh5 | 215777 | 212174 | 1.7 |
| Carbonic | Acetazolamide | −57291 | −42419 | 26.0 |
| Anhydrase II | ||||
| Carbonic | Acetazolamide | −57291 | −37288 | 34.9 |
| Anhydrase II | ||||
| Calmodulin | Calcineurin | 46087 | 37389 | 18.9% |
| Calmodulin | Calcineurin | 46087 | 51594 | 11.9% |
| Calmodulin | M13 | 16458 | 15393 | 6.5% |
| Thrombin | Bock | 9409 | 16261 | 72.8 |
| Thrombin | Tasset | 7109 | 12462 | 75.3 |
| Carbonic | Benzene | −1379 | −16771 | 1116.4 |
| Anhydrase II | Sulfonamide | |||
| Carbonic | Benzene | −1379 | −4607 | 234.2 |
| Anhydrase II | Sulfonamide | |||
| Carbonic | Sulfanilamide | 782 | −17018 | 2276.2 |
| Anhydrase II | ||||
| Carbonic | Dansylamide | −34377 | −40557 | 18.0 |
| Anhydrase II | ||||
| TABLE 2B |
| Small Model |
| Experimental | Model | Percent | ||
| Chi | Chi | Error | ||
| Receptor | Ligand | (RIU/M) | (RIU/M) | (%) |
| Calmodulin | TFP | 75.2 | 73.6 | 2.2 |
| Calmodulin | TFP | 75.2 | 78.7 | 4.6 |
| Calmodulin | TFP | 75.2 | 73.2 | 2.7 |
| Carbonic | Sulpiride | 62.0 | 60.2 | 2.9 |
| Anhydrase II | ||||
| Calmodulin | Calmodulin- | 56.1 | 56.5 | 0.6 |
| Ca2+ | ||||
| HIV PR | Pepstatin | 13.7 | 13.7 | 0.5 |
| 1F1N | ||||
| HIV PR | Pepstatin | 10.2 | 7.2 | 29.9 |
| 1F1 | ||||
| Concanavalin A | Mannose | 7.8 | 14.4 | 85.4 |
| Concanavalin A | Mannose | 7.8 | 7.7 | 1.2 |
| Concanavalin A | Glucose | 2.6 | −1.3 | 149.2 |
| Concanavalin A | Glucose | 2.6 | 4.6 | 78.1 |
| Recoverin | Ca2+ | 78.0 | 78.1 | 0.1 |
| TABLE 3 | |||||
| Ligand | ρexp | ρmodel | |||
| Con- | Experimental | Predicted | |||
| centration | BSI signal | BSI signal | Percent | ||
| (M) | (mrad) | C (M)* | (mrad) | Error | |
| Carbonic | 0.00 | 0.00 | 0.00 | 0.00 | 0.0% |
| Anhydrase | 3.90 × 10⁻⁸ | −3.81 | 4.07 × 10⁻¹¹ | −2.37 | 37.8% |
| 7.80 × 10⁻⁸ | −4.57 | 7.52 × 10⁻¹¹ | −4.38 | 4.1% | |
| 1.56 × 10⁻⁷ | −5.91 | 1.31 × 10⁻¹⁰ | −7.62 | 29.0% | |
| 3.12 × 10⁻⁷ | −9.68 | 2.07 × 10⁻¹⁰ | −12.09 | 24.9% | |
| 6.25 × 10⁻⁷ | −14.32 | 2.93 × 10⁻¹⁰ | −17.10 | 19.4% | |
| 1.25 × 10⁻⁶ | −17.89 | 3.70 × 10⁻¹⁰ | −21.55 | 20.5% | |
| 2.50 × 10⁻⁶ | −21.36 | 4.25 × 10⁻¹⁰ | −24.78 | 16.0% | |
| Recoverin | 0.00 | 0.00 | 0.00 | 0.00 | 0.00% |
| 2.50 × 10⁻⁷ | 9.73 | 1.90 × 10⁻⁷ | 12.20 | 25.43% | |
| 5.00 × 10⁻⁷ | 17.71 | 3.29 × 10⁻⁷ | 21.12 | 19.25% | |
| 1.00 × 10⁻⁶ | 29.39 | 4.50 × 10⁻⁷ | 31.06 | 5.69% | |
| 2.00 × 10⁻⁶ | 36.17 | 5.03 × 10⁻⁷ | 37.88 | 4.75% | |
| 4.00 × 10⁻⁶ | 40.93 | 5.23 × 10⁻⁷ | 41.33 | 0.97% | |
| 8.00 × 10⁻⁶ | 40.11 | 5.32 × 10⁻⁷ | 42.97 | 7.13% | |
| *Solution to the mass balance equation | |||||
χmodel=A(ΔSASA)+B(aveSASA)+C(ΔRGyr)+D(aveRGyr)+E (22)
where ΔSASA is the difference in solvent addressable surface area for bound complex and the unbound species in Å2, the aveSASA is the sum of SASA values divided by the number of values (PDB structures), ΔRGyris difference for the radius of gyration for the unbound species and that of the complex (bound species) in Å, aveRGyris sum of radius of gyration values divided by the number of values (PDB structures), and A, B, C, D, and E are fitting coefficients. The inclusion of the average quantities for Rgyr and SASA was motivated by a report by Marsh and Tiechmann (Marsh and Teichmann (2011) Relative Solvent Accessible Surface Area Predicts Protein Conformational Changes upon Binding.Structure19(6):859-867) where it is demonstrated that that the absolute SASA value of a protein taken from a complex is an indicator for the amount of conformational change expected upon binding and is thus expected to affect Xmodel. The absolute Rgyr value is required to normalize the effects of the absolute SASA value with protein size as described by Marsh in equation 2 (Marsh and Teichmann (2011) Relative Solvent Accessible Surface Area Predicts Protein Conformational Changes upon Binding.Structure19(6):859-867).
| TABLE 4 | ||||
| Bound | Unbound | |||
| Receptor | Ligand | PDB ID | PDB ID | |
| Large | IL-2 Antibody | Interleukin-2 | 4YUE | 1M4C |
| and | ||||
| 1F8T | ||||
| β2AR | Alprenolol | 3NYA | 2RH1 | |
| β2AR | Isoproterenol | 2Y03 | 2RH1 | |
| Basigin | Rh5 | 4U0Q | 3I84 and | |
| 4WAT | ||||
| Carbonic Anhydrase II | Acetazolamide | 1ZSB | 1CA2 | |
| Carbonic Anhydrase II | Acetazolamide | 1YDA | 1CA2 | |
| Calmodulin | Calcineurin | 2R28 | 1OSA | |
| Calmodulin | Calcineurin | 2F2O | 1OSA | |
| Calmodulin | M13 | 1CDL | 1OSA | |
| Thrombin | Bock | 1HUT | 3U69 | |
| Thrombin | Tasset | 4I7Y | 3U69 | |
| Carbonic Anhydrase II | Benzene Sulfonamide | 4JSA | 1CA2 | |
| Carbonic Anhydrase II | Benzene Sulfonamide | 2WEJ | 1CA2 | |
| Carbonic Anhydrase II | Sulfanilamide | 2NNG | 1CA2 | |
| Carbonic Anhydrase II | Dansylamide | 1OKL | 1CA2 | |
| Small | Calmodulin | TFP | 1CTR | 1OSA |
| Calmodulin | TFP | 1LIN | 1OSA | |
| Calmodulin | TFP | 1A29 | 1OSA | |
| Carbonic Anhydrase II | Sulpiride | 1G4O | 1CA2 | |
| Calmodulin | Calmodulin-Ca2+ | 1OSA | 1CFD | |
| HIV PR | Pepstatin 1F1N | 4EJK | 5HVP | |
| HIV PR | Pepstatin 1F1 | 4EJD | 5HVP | |
| Concanavalin A | Mannose* | 5CNA | 1JBC | |
| Concanavalin A | Mannose* | 1I3H | 1JBC | |
| Concanavalin A | Glucose* | 1CJP | 1JBC | |
| Concanavalin A | Glucose* | 1GIC | 1JBC | |
| Recoverin | Ca2+ | 1OMV | 1REC | |
where r is the position and m is the mass of each atom in the molecule. Hydrogens were removed for this calculation for consistency across species, because the Chimera program automatically adds these when displaying a new PDB file. Non-interacting species, such as ions, solvents and accessory ligands were also removed prior to determining the Rgyr. The results for these calculations are compiled in Table 5. The values obtained from Chimera correlated well with a self-written MatLab© script using the same coordinates obtained from the PDB files.
| TABLE 5 | ||||||
| Bound | ||||||
| Bound | Surface | Unbound | ||||
| Radius | Unbound | Area | Surface | |||
| of Gyration | Radius of | Gyration | Area | |||
| Receptor | Ligand | (Å) | (Å) | (Å2) | (Å2) | |
| Large | IL-2 Antibody | Interleukin-2 | 28.11 | 38.98 | 24399.8 | 26849.7 |
| β2AR | Alprenolol | 28.84 | 29.21 | 22944.5 | 22633.3 | |
| β2AR | Isoproterenol | 22.00 | 21.43 | 17028.6 | 15726.8 | |
| Basigin | Rh5 | 29.56 | 19.19 | 25215.0 | 27363.2 | |
| Carbonic | Acetazolamide | 17.40 | 17.40 | 11420.8 | 11549.7 | |
| Anhydrase II | ||||||
| Carbonic | Acetazolamide | 17.35 | 17.40 | 11490.0 | 11549.7 | |
| Anhydrase II | ||||||
| Calmodulin | Calcineurin | 21.68 | 22.45 | 9457.7 | 10129.7 | |
| Calmodulin | Calcineurin | 21.43 | 22.45 | 9645.2 | 10129.7 | |
| Calmodulin | M13 | 16.5 | 22.45 | 8965.9 | 10129.7 | |
| Thrombin | Bock | 17.82 | 17.76 | 12849.4 | 12684.2 | |
| Thrombin | Tasset | 17.67 | 17.76 | 12791.4 | 12684.2 | |
| Carbonic | Benzene | 17.39 | 17.40 | 11775.4 | 11549.7 | |
| Anhydrase II | Sulfonamide | |||||
| Carbonic | Benzene | 17.53 | 17.40 | 11948.8 | 11549.7 | |
| Anhydrase II | Sulfonamide | |||||
| Carbonic | Sulfanilamide | 17.41 | 17.40 | 11772.7 | 11549.7 | |
| Anhydrase II | ||||||
| Carbonic | Dansylamide | 17.41 | 17.40 | 11448.1 | 11549.7 | |
| Anhydrase II | ||||||
| Small | Calmodulin | TFP | 15.78 | 22.45 | 8977.8 | 10129.7 |
| Calmodulin | TFP | 15.54 | 22.45 | 9046.4 | 10129.7 | |
| Calmodulin | TFP | 15.54 | 22.45 | 8960.0 | 10129.7 | |
| Carbonic | Sulpiride | 17.61 | 17.40 | 12001.4 | 11549.7 | |
| Anhydrase II | ||||||
| Calmodulin | Calmodulin- | 22.45 | 20.29 | 10129.7 | 10290.8 | |
| Ca2+ | ||||||
| HIV PR | Pepstatin | 17.34 | 17.22 | 10160.4 | 9556.4 | |
| 1F1N | ||||||
| HIV PR | Pepstatin 1F1 | 17.60 | 17.22 | 10069.7 | 9556.4 | |
| Concanavalin | Mannose* | 17.19 | 17.32 | 10559.5 | 10303.9 | |
| A | ||||||
| Concanavalin | Mannose* | 17.08 | 17.32 | 10447.5 | 10303.9 | |
| A | ||||||
| Concanavalin | Glucose* | 17.17 | 17.32 | 10310.7 | 10303.9 | |
| A | ||||||
| Concanavalin | Glucose* | 17.19 | 17.32 | 10405.4 | 10303.9 | |
| A | ||||||
| Recoverin | Ca2+ | 18.30 | 16.50 | 12014.0 | 10333.0 | |
| TABLE 6 | |||||
| ρ | All | Small | Large | ||
| Number of | 25 | 11 | 14 | ||
| R2 | 0.986 | 0.991 | 0.998 | ||
| Spearman's | 0.853 | 0.936 | 0.979 | ||
| ρs | |||||
| Average | 20248.88 | 2.28 | 9441.28 | ||
| Residuals | |||||
| A | 8.04 | 0.05 | 60.42 | ||
| B | 23.63 | 0.026 | 23.66 | ||
| C | −16617.55 | −16.05 | −17529.18 | ||
| D | 29031.93 | 25.62 | 29830.00 | ||
| E | −796478.05 | −713.38 | −825460.48 | ||
| TABLE 9 | ||||
| LOQ | 0.180 | mM | ||
| 1.89 × 10⁻⁶ | RIU | |||
| LOD | 0.01 | mM | ||
| 1.3 × 10⁻⁷ | RIU | |||
| TABLE 10 | ||||
| Parameters | RI detector | BSI | ||
| [ConA] | 4 | 2 μM | ||
| Bmax(10−6 RIU) | 12.04 ± 0.59 | 15.5 | ||
| Kd (μM) | 81.63 ± 14.65 | 96 | ||
| R2 | 0.9594 | |||
| TABLE 11 | ||||
| Parameters | RI detector | BSI | ||
| [CAII] | 50 | 10 | 10 nM | ||
| Bmax(10−6 RIU) | 19.98 ± 1.29 | 4.52 ± 0.165 | 13.81 | ||
| Kd (μM) | 0.43 ± 0.11 | 0.31 ± 0.051 | 0.57 ± 0.09 | ||
| R2 | 0.9076 | 0.9636 | |||
| TABLE 12 | ||||
| Parameters | RI detector | BSI | ||
| [CaII] | 2.5 nM | 2.5 nM | 0.5 nM | ||
| Bmax(10−6 RIU) | 11.36 ± 2.93 | 1.25 ± 0.12 | 28.7 | ||
| Kd (μM) | 0.015 ± 0.022 | 0.028 ± 0.009 | 0.011 ± 0.001 | ||
| R2 | 0.9897 | 0.8828 | |||
Claims (19)
Priority Applications (1)
| Application Number | Priority Date | Filing Date | Title |
|---|---|---|---|
| US16/813,565US11143649B2 (en) | 2016-01-29 | 2020-03-09 | Free-solution response function interferometry |
Applications Claiming Priority (4)
| Application Number | Priority Date | Filing Date | Title |
|---|---|---|---|
| US201662288926P | 2016-01-29 | 2016-01-29 | |
| PCT/US2017/015296WO2017132483A1 (en) | 2016-01-29 | 2017-01-27 | Free-solution response function interferometry |
| US201816073630A | 2018-07-27 | 2018-07-27 | |
| US16/813,565US11143649B2 (en) | 2016-01-29 | 2020-03-09 | Free-solution response function interferometry |
Related Parent Applications (2)
| Application Number | Title | Priority Date | Filing Date |
|---|---|---|---|
| PCT/US2017/015296ContinuationWO2017132483A1 (en) | 2016-01-29 | 2017-01-27 | Free-solution response function interferometry |
| US16/073,630ContinuationUS10627396B2 (en) | 2016-01-29 | 2017-01-27 | Free-solution response function interferometry |
Publications (2)
| Publication Number | Publication Date |
|---|---|
| US20200209227A1 US20200209227A1 (en) | 2020-07-02 |
| US11143649B2true US11143649B2 (en) | 2021-10-12 |
Family
ID=59398699
Family Applications (2)
| Application Number | Title | Priority Date | Filing Date |
|---|---|---|---|
| US16/073,630ActiveUS10627396B2 (en) | 2016-01-29 | 2017-01-27 | Free-solution response function interferometry |
| US16/813,565ActiveUS11143649B2 (en) | 2016-01-29 | 2020-03-09 | Free-solution response function interferometry |
Family Applications Before (1)
| Application Number | Title | Priority Date | Filing Date |
|---|---|---|---|
| US16/073,630ActiveUS10627396B2 (en) | 2016-01-29 | 2017-01-27 | Free-solution response function interferometry |
Country Status (3)
| Country | Link |
|---|---|
| US (2) | US10627396B2 (en) |
| EP (1) | EP3408649B1 (en) |
| WO (1) | WO2017132483A1 (en) |
Families Citing this family (9)
| Publication number | Priority date | Publication date | Assignee | Title |
|---|---|---|---|---|
| WO2009039466A1 (en) | 2007-09-20 | 2009-03-26 | Vanderbilt University | Free solution measurement of molecular interactions by backscattering interferometry |
| EP3247988A4 (en) | 2015-01-23 | 2018-12-19 | Vanderbilt University | A robust interferometer and methods of using same |
| EP3408649B1 (en) | 2016-01-29 | 2023-06-14 | Vanderbilt University | Free-solution response function interferometry |
| AT520258B1 (en)* | 2017-07-26 | 2022-02-15 | Univ Wien Tech | Process for the spectroscopic or spectrometric analysis of a sample |
| US11965900B2 (en) | 2018-11-09 | 2024-04-23 | Wyatt Technology, Llc | Indicating a status of an analytical instrument on a screen of the analytical instrument |
| CN109799220B (en)* | 2018-12-21 | 2021-03-26 | 中国科学院合肥物质科学研究院 | Method for detecting histamine in tissue fluid based on metal chelate Raman label technology |
| US12153505B2 (en)* | 2019-10-01 | 2024-11-26 | Weiland Innovations Llc | Automated system for generating properly tagged training data for and verifying the efficacy of artificial intelligence algorithms |
| US20230129832A1 (en)* | 2021-10-22 | 2023-04-27 | Terumo Bct, Inc. | Method And System For Determining Plasma Protein Content Of Whole Blood Using Refractometry |
| US20240068941A1 (en)* | 2022-08-24 | 2024-02-29 | Miami University | Label-free bacterial detection |
Citations (326)
| Publication number | Priority date | Publication date | Assignee | Title |
|---|---|---|---|---|
| US3567113A (en) | 1969-03-18 | 1971-03-02 | Us Air Force | Miniature, portable, self-powered, high speed, clinical centrifuge |
| US3687808A (en) | 1969-08-14 | 1972-08-29 | Univ Leland Stanford Junior | Synthetic polynucleotides |
| US4042304A (en) | 1972-11-06 | 1977-08-16 | Gow-Mac Instruments, Inc. | Christiansen effect detector |
| US4093759A (en) | 1972-12-23 | 1978-06-06 | Toyo Ink Manufacturing Co., Ltd. | Glass container coated with polyurethane |
| US4265554A (en) | 1978-05-22 | 1981-05-05 | International Business Machines Corporation | Paragraph indent |
| US4268554A (en) | 1977-10-13 | 1981-05-19 | Rainer Gras | Process for the coating of glass surfaces |
| US4443106A (en) | 1981-08-22 | 1984-04-17 | Nippon Paint Co., Ltd. | Measuring device for measuring the amount of change in thickness of the paint layer |
| US4469863A (en) | 1980-11-12 | 1984-09-04 | Ts O Paul O P | Nonionic nucleic acid alkyl and aryl phosphonates and processes for manufacture and use thereof |
| US4476301A (en) | 1982-04-29 | 1984-10-09 | Centre National De La Recherche Scientifique | Oligonucleotides, a process for preparing the same and their application as mediators of the action of interferon |
| US4587044A (en) | 1983-09-01 | 1986-05-06 | The Johns Hopkins University | Linkage of proteins to nucleic acids |
| US4605735A (en) | 1983-02-14 | 1986-08-12 | Wakunaga Seiyaku Kabushiki Kaisha | Oligonucleotide derivatives |
| US4660974A (en) | 1984-04-14 | 1987-04-28 | Carl-Zeiss-Stiftung | Arrangement for determining the spectral characteristic of the refractive index of a fluid |
| US4667025A (en) | 1982-08-09 | 1987-05-19 | Wakunaga Seiyaku Kabushiki Kaisha | Oligonucleotide derivatives |
| US4683195A (en) | 1986-01-30 | 1987-07-28 | Cetus Corporation | Process for amplifying, detecting, and/or-cloning nucleic acid sequences |
| US4683202A (en) | 1985-03-28 | 1987-07-28 | Cetus Corporation | Process for amplifying nucleic acid sequences |
| US4699951A (en) | 1984-11-13 | 1987-10-13 | Nalco Chemical Company | Bimodal cationics for water clarification |
| US4762779A (en) | 1985-06-13 | 1988-08-09 | Amgen Inc. | Compositions and methods for functionalizing nucleic acids |
| US4824941A (en) | 1983-03-10 | 1989-04-25 | Julian Gordon | Specific antibody to the native form of 2'5'-oligonucleotides, the method of preparation and the use as reagents in immunoassays or for binding 2'5'-oligonucleotides in biological systems |
| US4828979A (en) | 1984-11-08 | 1989-05-09 | Life Technologies, Inc. | Nucleotide analogs for nucleic acid labeling and detection |
| US4835263A (en) | 1983-01-27 | 1989-05-30 | Centre National De La Recherche Scientifique | Novel compounds containing an oligonucleotide sequence bonded to an intercalating agent, a process for their synthesis and their use |
| US4845205A (en) | 1985-01-08 | 1989-07-04 | Institut Pasteur | 2,N6 -disubstituted and 2,N6 -trisubstituted adenosine-3'-phosphoramidites |
| US4876335A (en) | 1986-06-30 | 1989-10-24 | Wakunaga Seiyaku Kabushiki Kaisha | Poly-labelled oligonucleotide derivative |
| US4895431A (en) | 1986-11-13 | 1990-01-23 | Olympus Optical Co., Ltd. | Method of processing endoscopic images |
| US4904582A (en) | 1987-06-11 | 1990-02-27 | Synthetic Genetics | Novel amphiphilic nucleic acid conjugates |
| US4908112A (en) | 1988-06-16 | 1990-03-13 | E. I. Du Pont De Nemours & Co. | Silicon semiconductor wafer for analyzing micronic biological samples |
| WO1990005317A1 (en) | 1988-11-10 | 1990-05-17 | Pharmacia Ab | Optical interface means |
| US4948882A (en) | 1983-02-22 | 1990-08-14 | Syngene, Inc. | Single-stranded labelled oligonucleotides, reactive monomers and methods of synthesis |
| US4950074A (en) | 1988-05-02 | 1990-08-21 | IOT Entwicklungsgesellshaft fur Integrierte Optik-Technologie mbH | Method of determining the refractive index of a substance and apparatus thereof |
| US4958013A (en) | 1989-06-06 | 1990-09-18 | Northwestern University | Cholesteryl modified oligonucleotides |
| US4976154A (en) | 1986-08-11 | 1990-12-11 | Endress U. Hauser Gmbh U. Co. | Arrangement for contactless measurement of the volume flow or mass flow of a moving medium |
| US4981957A (en) | 1984-07-19 | 1991-01-01 | Centre National De La Recherche Scientifique | Oligonucleotides with modified phosphate and modified carbohydrate moieties at the respective chain termini |
| US4990925A (en) | 1984-05-07 | 1991-02-05 | Hughes Aircraft Company | Interferometric radiometer |
| US5023243A (en) | 1981-10-23 | 1991-06-11 | Molecular Biosystems, Inc. | Oligonucleotide therapeutic agent and method of making same |
| US5034506A (en) | 1985-03-15 | 1991-07-23 | Anti-Gene Development Group | Uncharged morpholino-based polymers having achiral intersubunit linkages |
| US5073024A (en) | 1988-11-04 | 1991-12-17 | Commissariat A L'energie Atomique | Integrated optical device for measuring the refractive index of a fluid |
| US5082830A (en) | 1988-02-26 | 1992-01-21 | Enzo Biochem, Inc. | End labeled nucleotide probe |
| US5108179A (en) | 1989-08-09 | 1992-04-28 | Myers Stephen A | System and method for determining changes in fluorescence of stained nucleic acid in electrophoretically separated bands |
| US5109124A (en) | 1988-06-01 | 1992-04-28 | Biogen, Inc. | Nucleic acid probe linked to a label having a terminal cysteine |
| US5112963A (en) | 1987-11-12 | 1992-05-12 | Max-Planck-Gesellschaft Zur Foerderung Der Wissenschaften E.V. | Modified oligonucleotides |
| US5118800A (en) | 1983-12-20 | 1992-06-02 | California Institute Of Technology | Oligonucleotides possessing a primary amino group in the terminal nucleotide |
| US5118802A (en) | 1983-12-20 | 1992-06-02 | California Institute Of Technology | DNA-reporter conjugates linked via the 2' or 5'-primary amino group of the 5'-terminal nucleoside |
| US5120131A (en) | 1988-02-14 | 1992-06-09 | Walter Lukosz | Method and apparatus for selecting detection of changes in samples by integrated optical interference |
| US5125740A (en) | 1989-03-17 | 1992-06-30 | Hitachi, Ltd. | Method and apparatus for measuring optical constants of a thin film as well as method and apparatus for fabricating a thin film utilizing same |
| US5130302A (en) | 1989-12-20 | 1992-07-14 | Boron Bilogicals, Inc. | Boronated nucleoside, nucleotide and oligonucleotide compounds, compositions and methods for using same |
| US5134066A (en) | 1989-08-29 | 1992-07-28 | Monsanto Company | Improved probes using nucleosides containing 3-dezauracil analogs |
| US5138045A (en) | 1990-07-27 | 1992-08-11 | Isis Pharmaceuticals | Polyamine conjugated oligonucleotides |
| US5165005A (en) | 1988-01-29 | 1992-11-17 | Fiberchem Inc. | Planar and other waveguide refractive index sensors using metal cladding |
| US5166315A (en) | 1989-12-20 | 1992-11-24 | Anti-Gene Development Group | Sequence-specific binding polymers for duplex nucleic acids |
| US5173747A (en) | 1990-09-20 | 1992-12-22 | Battelle Memorial Institute | Integrated optical directional-coupling refractometer apparatus |
| US5175273A (en) | 1988-07-01 | 1992-12-29 | Genentech, Inc. | Nucleic acid intercalating agents |
| US5177196A (en) | 1990-08-16 | 1993-01-05 | Microprobe Corporation | Oligo (α-arabinofuranosyl nucleotides) and α-arabinofuranosyl precursors thereof |
| US5185444A (en) | 1985-03-15 | 1993-02-09 | Anti-Gene Deveopment Group | Uncharged morpolino-based polymers having phosphorous containing chiral intersubunit linkages |
| US5188897A (en) | 1987-10-22 | 1993-02-23 | Temple University Of The Commonwealth System Of Higher Education | Encapsulated 2',5'-phosphorothioate oligoadenylates |
| US5214136A (en) | 1990-02-20 | 1993-05-25 | Gilead Sciences, Inc. | Anthraquinone-derivatives oligonucleotides |
| US5214134A (en) | 1990-09-12 | 1993-05-25 | Sterling Winthrop Inc. | Process of linking nucleosides with a siloxane bridge |
| US5215883A (en) | 1990-07-09 | 1993-06-01 | The Research Foundation | Electrophoretic mobility of fluorophore labeled particles in gels by fluorophore movement after photobleaching |
| US5216141A (en) | 1988-06-06 | 1993-06-01 | Benner Steven A | Oligonucleotide analogs containing sulfur linkages |
| US5218105A (en) | 1990-07-27 | 1993-06-08 | Isis Pharmaceuticals | Polyamine conjugated oligonucleotides |
| US5235033A (en) | 1985-03-15 | 1993-08-10 | Anti-Gene Development Group | Alpha-morpholino ribonucleoside derivatives and polymers thereof |
| US5245022A (en) | 1990-08-03 | 1993-09-14 | Sterling Drug, Inc. | Exonuclease resistant terminally substituted oligonucleotides |
| US5254469A (en) | 1989-09-12 | 1993-10-19 | Eastman Kodak Company | Oligonucleotide-enzyme conjugate that can be used as a probe in hybridization assays and polymerase chain reaction procedures |
| US5258506A (en) | 1984-10-16 | 1993-11-02 | Chiron Corporation | Photolabile reagents for incorporation into oligonucleotide chains |
| US5262536A (en) | 1988-09-15 | 1993-11-16 | E. I. Du Pont De Nemours And Company | Reagents for the preparation of 5'-tagged oligonucleotides |
| US5264423A (en) | 1987-03-25 | 1993-11-23 | The United States Of America As Represented By The Department Of Health And Human Services | Inhibitors for replication of retroviruses and for the expression of oncogene products |
| US5264562A (en) | 1989-10-24 | 1993-11-23 | Gilead Sciences, Inc. | Oligonucleotide analogs with novel linkages |
| US5264564A (en) | 1989-10-24 | 1993-11-23 | Gilead Sciences | Oligonucleotide analogs with novel linkages |
| US5268305A (en) | 1989-06-15 | 1993-12-07 | Biocircuits Corporation | Multi-optical detection system |
| US5272250A (en) | 1992-07-10 | 1993-12-21 | Spielvogel Bernard F | Boronated phosphoramidate compounds |
| US5273633A (en) | 1992-07-10 | 1993-12-28 | Tiansong Wang | Capillary multireflective cell |
| US5276019A (en) | 1987-03-25 | 1994-01-04 | The United States Of America As Represented By The Department Of Health And Human Services | Inhibitors for replication of retroviruses and for the expression of oncogene products |
| US5278302A (en) | 1988-05-26 | 1994-01-11 | University Patents, Inc. | Polynucleotide phosphorodithioates |
| US5292873A (en) | 1989-11-29 | 1994-03-08 | The Research Foundation Of State University Of New York | Nucleic acids labeled with naphthoquinone probe |
| US5305071A (en) | 1988-10-03 | 1994-04-19 | Wyatt Technology Corporation | Differential refractometer |
| US5304487A (en) | 1992-05-01 | 1994-04-19 | Trustees Of The University Of Pennsylvania | Fluid handling in mesoscale analytical devices |
| US5309330A (en) | 1993-01-11 | 1994-05-03 | Citation Medical Corporation | Light box |
| US5317098A (en) | 1986-03-17 | 1994-05-31 | Hiroaki Shizuya | Non-radioisotope tagging of fragments |
| US5319080A (en) | 1991-10-17 | 1994-06-07 | Ciba-Geigy Corporation | Bicyclic nucleosides, oligonucleotides, process for their preparation and intermediates |
| US5321131A (en) | 1990-03-08 | 1994-06-14 | Hybridon, Inc. | Site-specific functionalization of oligodeoxynucleotides for non-radioactive labelling |
| US5325170A (en) | 1990-05-31 | 1994-06-28 | Thermo Instrument Systems Inc. | Laser-based refractive index detector using backscatter |
| US5350697A (en) | 1990-08-28 | 1994-09-27 | Akzo N.V. | Scattered light detection apparatus |
| US5351678A (en) | 1992-09-01 | 1994-10-04 | Citation Medical Corporation | Endoscope scope assembly for full hemisphere view |
| US5359044A (en) | 1991-12-13 | 1994-10-25 | Isis Pharmaceuticals | Cyclobutyl oligonucleotide surrogates |
| US5367066A (en) | 1984-10-16 | 1994-11-22 | Chiron Corporation | Oligonucleotides with selectably cleavable and/or abasic sites |
| US5371241A (en) | 1991-07-19 | 1994-12-06 | Pharmacia P-L Biochemicals Inc. | Fluorescein labelled phosphoramidites |
| US5377008A (en) | 1990-09-20 | 1994-12-27 | Battelle Memorial Institute | Integrated optical compensating refractometer apparatus |
| US5391723A (en) | 1989-05-31 | 1995-02-21 | Neorx Corporation | Oligonucleotide conjugates |
| US5399676A (en) | 1989-10-23 | 1995-03-21 | Gilead Sciences | Oligonucleotides with inverted polarity |
| US5405938A (en) | 1989-12-20 | 1995-04-11 | Anti-Gene Development Group | Sequence-specific binding polymers for duplex nucleic acids |
| US5405939A (en) | 1987-10-22 | 1995-04-11 | Temple University Of The Commonwealth System Of Higher Education | 2',5'-phosphorothioate oligoadenylates and their covalent conjugates with polylysine |
| US5414077A (en) | 1990-02-20 | 1995-05-09 | Gilead Sciences | Non-nucleoside linkers for convenient attachment of labels to oligonucleotides using standard synthetic methods |
| US5426505A (en) | 1992-11-25 | 1995-06-20 | Ciba-Geigy Corporation | Interferometric apparatus for monitoring changes of the refractive index of fluid samples in capillary tubes |
| US5432272A (en) | 1990-10-09 | 1995-07-11 | Benner; Steven A. | Method for incorporating into a DNA or RNA oligonucleotide using nucleotides bearing heterocyclic bases |
| US5434257A (en) | 1992-06-01 | 1995-07-18 | Gilead Sciences, Inc. | Binding compentent oligomers containing unsaturated 3',5' and 2',5' linkages |
| WO1995022058A1 (en) | 1994-02-10 | 1995-08-17 | Affymax Technologies N.V. | Method and apparatus for detection of fluorescently labeled materials |
| US5446137A (en) | 1993-12-09 | 1995-08-29 | Syntex (U.S.A.) Inc. | Oligonucleotides containing 4'-substituted nucleotides |
| US5451463A (en) | 1989-08-28 | 1995-09-19 | Clontech Laboratories, Inc. | Non-nucleoside 1,3-diol reagents for labeling synthetic oligonucleotides |
| WO1995025116A1 (en) | 1994-03-16 | 1995-09-21 | California Institute Of Technology | Method and apparatus for performing multiple sequential reactions on a matrix |
| US5455233A (en) | 1989-11-30 | 1995-10-03 | University Of North Carolina | Oligoribonucleoside and oligodeoxyribonucleoside boranophosphates |
| US5456885A (en) | 1993-07-12 | 1995-10-10 | Coleman; Charles M. | Fluid collection, separation and dispensing tube |
| US5456245A (en) | 1993-09-20 | 1995-10-10 | Sofamor Danek Properties, Inc. | Flexible endoscope probe and method of manufacture |
| US5457187A (en) | 1993-12-08 | 1995-10-10 | Board Of Regents University Of Nebraska | Oligonucleotides containing 5-fluorouracil |
| US5459255A (en) | 1990-01-11 | 1995-10-17 | Isis Pharmaceuticals, Inc. | N-2 substituted purines |
| US5466677A (en) | 1993-03-06 | 1995-11-14 | Ciba-Geigy Corporation | Dinucleoside phosphinates and their pharmaceutical compositions |
| US5470967A (en) | 1990-04-10 | 1995-11-28 | The Dupont Merck Pharmaceutical Company | Oligonucleotide analogs with sulfamate linkages |
| US5476925A (en) | 1993-02-01 | 1995-12-19 | Northwestern University | Oligodeoxyribonucleotides including 3'-aminonucleoside-phosphoramidate linkages and terminal 3'-amino groups |
| US5479257A (en) | 1993-04-05 | 1995-12-26 | Olympus Optical Co., Ltd. | Method of and apparatus for detecting object position using a fourier transform of the object image and processing system using the same |
| US5484908A (en) | 1991-11-26 | 1996-01-16 | Gilead Sciences, Inc. | Oligonucleotides containing 5-propynyl pyrimidines |
| US5485312A (en) | 1993-09-14 | 1996-01-16 | The United States Of America As Represented By The Secretary Of The Air Force | Optical pattern recognition system and method for verifying the authenticity of a person, product or thing |
| US5485277A (en) | 1994-07-26 | 1996-01-16 | Physical Optics Corporation | Surface plasmon resonance sensor and methods for the utilization thereof |
| US5486603A (en) | 1990-01-08 | 1996-01-23 | Gilead Sciences, Inc. | Oligonucleotide having enhanced binding affinity |
| US5489677A (en) | 1990-07-27 | 1996-02-06 | Isis Pharmaceuticals, Inc. | Oligonucleoside linkages containing adjacent oxygen and nitrogen atoms |
| US5502561A (en) | 1988-09-15 | 1996-03-26 | Board Of Trustees Of The University Of Arkansas | Characterization of particles by modulated dynamic light scattering |
| US5502177A (en) | 1993-09-17 | 1996-03-26 | Gilead Sciences, Inc. | Pyrimidine derivatives for labeled binding partners |
| US5510475A (en) | 1990-11-08 | 1996-04-23 | Hybridon, Inc. | Oligonucleotide multiple reporter precursors |
| US5512667A (en) | 1990-08-28 | 1996-04-30 | Reed; Michael W. | Trifunctional intermediates for preparing 3'-tailed oligonucleotides |
| US5512439A (en) | 1988-11-21 | 1996-04-30 | Dynal As | Oligonucleotide-linked magnetic particles and uses thereof |
| US5514785A (en) | 1990-05-11 | 1996-05-07 | Becton Dickinson And Company | Solid supports for nucleic acid hybridization assays |
| US5519134A (en) | 1994-01-11 | 1996-05-21 | Isis Pharmaceuticals, Inc. | Pyrrolidine-containing monomers and oligomers |
| US5519126A (en) | 1988-03-25 | 1996-05-21 | University Of Virginia Alumni Patents Foundation | Oligonucleotide N-alkylphosphoramidates |
| US5525465A (en) | 1987-10-28 | 1996-06-11 | Howard Florey Institute Of Experimental Physiology And Medicine | Oligonucleotide-polyamide conjugates and methods of production and applications of the same |
| US5525711A (en) | 1994-05-18 | 1996-06-11 | The United States Of America As Represented By The Secretary Of The Department Of Health And Human Services | Pteridine nucleotide analogs as fluorescent DNA probes |
| EP0721016A2 (en) | 1994-10-21 | 1996-07-10 | Affymax Technologies N.V. | Nucleic acid library arrays, methods for synthesizing them and methods for sequencing and sample screening using them |
| US5539082A (en) | 1993-04-26 | 1996-07-23 | Nielsen; Peter E. | Peptide nucleic acids |
| US5541307A (en) | 1990-07-27 | 1996-07-30 | Isis Pharmaceuticals, Inc. | Backbone modified oligonucleotide analogs and solid phase synthesis thereof |
| US5545730A (en) | 1984-10-16 | 1996-08-13 | Chiron Corporation | Multifunctional nucleic acid monomer |
| US5550111A (en) | 1984-07-11 | 1996-08-27 | Temple University-Of The Commonwealth System Of Higher Education | Dual action 2',5'-oligoadenylate antiviral derivatives and uses thereof |
| EP0728520A1 (en) | 1995-02-27 | 1996-08-28 | Affymax Technologies N.V. | Printing molecular library arrays |
| US5552540A (en) | 1987-06-24 | 1996-09-03 | Howard Florey Institute Of Experimental Physiology And Medicine | Nucleoside derivatives |
| US5556852A (en) | 1989-04-28 | 1996-09-17 | Sankyo Company, Limited | N-acryloylpiperazine compounds |
| US5561225A (en) | 1990-09-19 | 1996-10-01 | Southern Research Institute | Polynucleotide analogs containing sulfonate and sulfonamide internucleoside linkages |
| US5565552A (en) | 1992-01-21 | 1996-10-15 | Pharmacyclics, Inc. | Method of expanded porphyrin-oligonucleotide conjugate synthesis |
| US5567811A (en) | 1990-05-03 | 1996-10-22 | Amersham International Plc | Phosphoramidite derivatives, their preparation and the use thereof in the incorporation of reporter groups on synthetic oligonucleotides |
| US5571799A (en) | 1991-08-12 | 1996-11-05 | Basco, Ltd. | (2'-5') oligoadenylate analogues useful as inhibitors of host-v5.-graft response |
| US5574142A (en) | 1992-12-15 | 1996-11-12 | Microprobe Corporation | Peptide linkers for improved oligonucleotide delivery |
| US5576427A (en) | 1993-03-30 | 1996-11-19 | Sterling Winthrop, Inc. | Acyclic nucleoside analogs and oligonucleotide sequences containing them |
| US5578832A (en) | 1994-09-02 | 1996-11-26 | Affymetrix, Inc. | Method and apparatus for imaging a sample on a device |
| US5578718A (en) | 1990-01-11 | 1996-11-26 | Isis Pharmaceuticals, Inc. | Thiol-derivatized nucleosides |
| US5580731A (en) | 1994-08-25 | 1996-12-03 | Chiron Corporation | N-4 modified pyrimidine deoxynucleotides and oligonucleotide probes synthesized therewith |
| US5585481A (en) | 1987-09-21 | 1996-12-17 | Gen-Probe Incorporated | Linking reagents for nucleotide probes |
| US5587361A (en) | 1991-10-15 | 1996-12-24 | Isis Pharmaceuticals, Inc. | Oligonucleotides having phosphorothioate linkages of high chiral purity |
| US5587371A (en) | 1992-01-21 | 1996-12-24 | Pharmacyclics, Inc. | Texaphyrin-oligonucleotide conjugates |
| US5591722A (en) | 1989-09-15 | 1997-01-07 | Southern Research Institute | 2'-deoxy-4'-thioribonucleosides and their antiviral activity |
| US5593839A (en) | 1994-05-24 | 1997-01-14 | Affymetrix, Inc. | Computer-aided engineering system for design of sequence arrays and lithographic masks |
| US5594121A (en) | 1991-11-07 | 1997-01-14 | Gilead Sciences, Inc. | Enhanced triple-helix and double-helix formation with oligomers containing modified purines |
| US5596091A (en) | 1994-03-18 | 1997-01-21 | The Regents Of The University Of California | Antisense oligonucleotides comprising 5-aminoalkyl pyrimidine nucleotides |
| US5595726A (en) | 1992-01-21 | 1997-01-21 | Pharmacyclics, Inc. | Chromophore probe for detection of nucleic acid |
| US5596086A (en) | 1990-09-20 | 1997-01-21 | Gilead Sciences, Inc. | Modified internucleoside linkages having one nitrogen and two carbon atoms |
| WO1997002357A1 (en) | 1995-06-29 | 1997-01-23 | Affymetrix, Inc. | Integrated nucleic acid diagnostic device |
| US5597909A (en) | 1994-08-25 | 1997-01-28 | Chiron Corporation | Polynucleotide reagents containing modified deoxyribose moieties, and associated methods of synthesis and use |
| US5597696A (en) | 1994-07-18 | 1997-01-28 | Becton Dickinson And Company | Covalent cyanine dye oligonucleotide conjugates |
| US5599928A (en) | 1994-02-15 | 1997-02-04 | Pharmacyclics, Inc. | Texaphyrin compounds having improved functionalization |
| US5602240A (en) | 1990-07-27 | 1997-02-11 | Ciba Geigy Ag. | Backbone modified oligonucleotide analogs |
| US5608046A (en) | 1990-07-27 | 1997-03-04 | Isis Pharmaceuticals, Inc. | Conjugated 4'-desmethyl nucleoside analog compounds |
| US5610289A (en) | 1990-07-27 | 1997-03-11 | Isis Pharmaceuticals, Inc. | Backbone modified oligonucleotide analogues |
| US5610300A (en) | 1992-07-01 | 1997-03-11 | Ciba-Geigy Corporation | Carbocyclic nucleosides containing bicyclic rings, oligonucleotides therefrom, process for their preparation, their use and intermediates |
| US5613013A (en) | 1994-05-13 | 1997-03-18 | Reticula Corporation | Glass patterns in image alignment and analysis |
| US5614617A (en) | 1990-07-27 | 1997-03-25 | Isis Pharmaceuticals, Inc. | Nuclease resistant, pyrimidine modified oligonucleotides that detect and modulate gene expression |
| US5618704A (en) | 1990-07-27 | 1997-04-08 | Isis Pharmacueticals, Inc. | Backbone-modified oligonucleotide analogs and preparation thereof through radical coupling |
| US5623070A (en) | 1990-07-27 | 1997-04-22 | Isis Pharmaceuticals, Inc. | Heteroatomic oligonucleoside linkages |
| US5625050A (en) | 1994-03-31 | 1997-04-29 | Amgen Inc. | Modified oligonucleotides and intermediates useful in nucleic acid therapeutics |
| US5627053A (en) | 1994-03-29 | 1997-05-06 | Ribozyme Pharmaceuticals, Inc. | 2'deoxy-2'-alkylnucleotide containing nucleic acid |
| US5633312A (en) | 1994-02-28 | 1997-05-27 | Toshiba Silicone Co., Ltd. | Process for preparing polyorganosilane |
| US5633360A (en) | 1992-04-14 | 1997-05-27 | Gilead Sciences, Inc. | Oligonucleotide analogs capable of passive cell membrane permeation |
| US5633708A (en) | 1993-11-08 | 1997-05-27 | Svendsen; David A. | Apparatus for measuring refractive index |
| US5636017A (en) | 1993-03-18 | 1997-06-03 | Ciba-Geigy Corporation | Optical detection arrangement for small volume chemical analysis of fluid samples |
| US5639873A (en) | 1992-02-05 | 1997-06-17 | Centre National De La Recherche Scientifique (Cnrs) | Oligothionucleotides |
| US5646265A (en) | 1990-01-11 | 1997-07-08 | Isis Pharmceuticals, Inc. | Process for the preparation of 2'-O-alkyl purine phosphoramidites |
| EP0785280A2 (en) | 1995-11-29 | 1997-07-23 | Affymetrix, Inc. (a California Corporation) | Polymorphism detection |
| WO1997027317A1 (en) | 1996-01-23 | 1997-07-31 | Affymetrix, Inc. | Nucleic acid analysis techniques |
| WO1997029212A1 (en) | 1996-02-08 | 1997-08-14 | Affymetrix, Inc. | Chip-based speciation and phenotypic characterization of microorganisms |
| US5658873A (en) | 1993-04-10 | 1997-08-19 | Degussa Aktiengesellschaft | Coated sodium percarbonate particles, a process for their production and detergent, cleaning and bleaching compositions containing them |
| US5659318A (en) | 1996-05-31 | 1997-08-19 | California Institute Of Technology | Interferometric SAR processor for elevation |
| US5663790A (en) | 1993-04-08 | 1997-09-02 | Pharmacia Biosensor Ab | Method and apparatus for determination of refractive index |
| US5663312A (en) | 1993-03-31 | 1997-09-02 | Sanofi | Oligonucleotide dimers with amide linkages replacing phosphodiester linkages |
| US5670633A (en) | 1990-01-11 | 1997-09-23 | Isis Pharmaceuticals, Inc. | Sugar modified oligonucleotides that detect and modulate gene expression |
| EP0799797A1 (en) | 1996-04-03 | 1997-10-08 | UNITECHNIK-THURNER Anlagenbaugesellschaft mbH | Continuous process for the production of precipitated calcium carbonate |
| US5677439A (en) | 1990-08-03 | 1997-10-14 | Sanofi | Oligonucleotide analogues containing phosphate diester linkage substitutes, compositions thereof, and precursor dinucleotide analogues |
| US5677437A (en) | 1990-07-27 | 1997-10-14 | Isis Pharmaceuticals, Inc. | Heteroatomic oligonucleoside linkages |
| US5681941A (en) | 1990-01-11 | 1997-10-28 | Isis Pharmaceuticals, Inc. | Substituted purines and oligonucleotide cross-linking |
| US5688941A (en) | 1990-07-27 | 1997-11-18 | Isis Pharmaceuticals, Inc. | Methods of making conjugated 4' desmethyl nucleoside analog compounds |
| US5694210A (en) | 1996-06-28 | 1997-12-02 | The Board Of Trustees Of The University Of Illinois | Multi-purpose sensor system and sensing method using internally reflected light beams |
| US5698518A (en) | 1994-03-30 | 1997-12-16 | Oklahoma Medical Research Foundation | Method for regulating inflammation and tumor growth with calmodulin, calmodulin analogues or calmodulin antagonists |
| US5712321A (en) | 1996-02-01 | 1998-01-27 | Dymax Corporation | Dual-curing coating formulation and method |
| US5714331A (en) | 1991-05-24 | 1998-02-03 | Buchardt, Deceased; Ole | Peptide nucleic acids having enhanced binding affinity, sequence specificity and solubility |
| US5719262A (en) | 1993-11-22 | 1998-02-17 | Buchardt, Deceased; Ole | Peptide nucleic acids having amino acid side chains |
| US5740291A (en) | 1995-10-13 | 1998-04-14 | The University Of Western Ontario | Fiber optic sensor for sensing particle movement in a catalytic reactor |
| US5770029A (en) | 1996-07-30 | 1998-06-23 | Soane Biosciences | Integrated electrophoretic microdevices |
| US5781304A (en) | 1994-09-19 | 1998-07-14 | Textron Systems Corporation | Laser ultrasonics-based material analysis system and method |
| US5804453A (en) | 1996-02-09 | 1998-09-08 | Duan-Jun Chen | Fiber optic direct-sensing bioprobe using a phase-tracking approach |
| US5815258A (en) | 1996-02-15 | 1998-09-29 | Shimadzu Corporation | Liquid sample cell for an optical measurement apparatus |
| US5817462A (en) | 1995-02-21 | 1998-10-06 | Applied Spectral Imaging | Method for simultaneous detection of multiple fluorophores for in situ hybridization and multicolor chromosome painting and banding |
| US5824204A (en) | 1996-06-27 | 1998-10-20 | Ic Sensors, Inc. | Micromachined capillary electrophoresis device |
| US5841914A (en) | 1996-04-17 | 1998-11-24 | Motorola, Inc. | Molecular detection apparatus and method using optical waveguide detection |
| US5846708A (en) | 1991-11-19 | 1998-12-08 | Massachusetts Institiute Of Technology | Optical and electrical methods and apparatus for molecule detection |
| US5852495A (en) | 1996-07-16 | 1998-12-22 | Caliper Technologies Corporation | Fourier detection of species migrating in a microchannel |
| US5867266A (en) | 1996-04-17 | 1999-02-02 | Cornell Research Foundation, Inc. | Multiple optical channels for chemical analysis |
| FR2766922A1 (en) | 1997-07-30 | 1999-02-05 | France Etat | INSTRUMENT FOR MEASURING THE REFRACTION INDEX OF A FLUID |
| US5915034A (en) | 1995-05-02 | 1999-06-22 | Yamatake-Honeywell, Co., Ltd. | Pattern collation apparatus based on spatial frequency characteristics |
| US5922594A (en) | 1994-09-26 | 1999-07-13 | Biacore Ab | Method of producing bilayer lipid membranes |
| US5928627A (en) | 1996-04-19 | 1999-07-27 | The Dow Chemical Company | Fluorescent chelates as visual tissue specific imaging agents |
| US5932474A (en) | 1997-10-21 | 1999-08-03 | The Regents Of The University Of California | Target sequences for synthetic molecules |
| US5953439A (en) | 1994-11-04 | 1999-09-14 | Ishihara; Ken | Apparatus for and method of extracting time series image information |
| US5976336A (en) | 1997-04-25 | 1999-11-02 | Caliper Technologies Corp. | Microfluidic devices incorporating improved channel geometries |
| US5995645A (en) | 1993-08-18 | 1999-11-30 | Applied Spectral Imaging Ltd. | Method of cancer cell detection |
| US6008378A (en) | 1997-10-21 | 1999-12-28 | The Regents Of The University Of California | Synthetic molecules that specifically react with target sequences |
| US6054271A (en) | 1997-10-21 | 2000-04-25 | The Regents Of The University Of California | Methods of using synthetic molecules and target sequences |
| US6108458A (en) | 1996-07-03 | 2000-08-22 | Massachusetts Institute Of Technology | Sparse array image correlation |
| US6118536A (en) | 1997-11-14 | 2000-09-12 | Jasco Corporation | Circular dichroism detector for HPLC |
| US6123798A (en) | 1998-05-06 | 2000-09-26 | Caliper Technologies Corp. | Methods of fabricating polymeric structures incorporating microscale fluidic elements |
| US6130439A (en) | 1997-07-30 | 2000-10-10 | Delegation Generale Pour L'armement | Instrument for measuring the refractive index of a fluid |
| US6167910B1 (en) | 1998-01-20 | 2001-01-02 | Caliper Technologies Corp. | Multi-layer microfluidic devices |
| WO2001014858A1 (en) | 1999-08-19 | 2001-03-01 | Texas Tech University Health Sciences Center | Interferometric detection system and method |
| US6198532B1 (en) | 1991-02-22 | 2001-03-06 | Applied Spectral Imaging Ltd. | Spectral bio-imaging of the eye |
| US6251343B1 (en) | 1998-02-24 | 2001-06-26 | Caliper Technologies Corp. | Microfluidic devices and systems incorporating cover layers |
| US6322683B1 (en) | 1999-04-14 | 2001-11-27 | Caliper Technologies Corp. | Alignment of multicomponent microfabricated structures |
| US20010045358A1 (en) | 2000-03-27 | 2001-11-29 | Kopf-Sill Anne R. | Ultra high throughput microfluidic analytical systems and methods |
| US20010050821A1 (en) | 2000-04-11 | 2001-12-13 | Gunter Bickleder | System for geometric beam shaping of a light beam profile |
| US20020002353A1 (en) | 1998-01-30 | 2002-01-03 | Advanced Cardiovascular Systems, Inc. | Therapeutic, diagnostic, or hydrophilic coating for an intracorporeal medical device |
| US20020022603A1 (en) | 2000-04-07 | 2002-02-21 | Lichtenberger Lenard M. | Unique compositions of zwitterionic phospholipids and bisphosphonates and use of the compositions as bisphosphate delivery systems with reduced GI toxicity |
| US20020034580A1 (en) | 1999-03-08 | 2002-03-21 | Caliper Technologies Corp. | Surface coating for microfluidic devices that incorporate a biopolymer resistant moiety |
| US6381925B2 (en) | 1999-07-27 | 2002-05-07 | Mars, Incorporated | Method for forming a compressed grouping of objects |
| US20020057432A1 (en) | 2000-10-12 | 2002-05-16 | Amnis Corporation | Multipass cavity for illumination and excitation of moving objects |
| US20020094528A1 (en) | 2000-11-29 | 2002-07-18 | Salafsky Joshua S. | Method and apparatus using a surface-selective nonlinear optical technique for detection of probe-target interations |
| WO2002059579A1 (en) | 2001-01-25 | 2002-08-01 | Texas Tech University | Universal detector for biological and chemical separations or assays using plastic microfluidic devices |
| US20020128234A1 (en) | 1999-04-28 | 2002-09-12 | Hubbell Jeffrey A. | Multifunctional polymeric surface coatings in analytic and sensor devices |
| US20020155625A1 (en) | 2001-04-18 | 2002-10-24 | Chapman Robert G. | Method and apparatus for detection of molecular events using temperature control of detection environment |
| US6480282B1 (en) | 1999-05-06 | 2002-11-12 | University Of Washington | Capillary surface plasmon resonance sensors and multisensors |
| US6493090B1 (en) | 1998-01-23 | 2002-12-10 | Torsana A/S | Detection of a substance by refractive index change |
| US20030020915A1 (en) | 1998-03-23 | 2003-01-30 | Schueller Olivier J. A. | Optical modulator/detector based on reconfigurable diffraction grating |
| US6529279B2 (en) | 1998-02-23 | 2003-03-04 | Zygo Corporation | Interferometer and method for measuring the refractive index and optical path length effects of air |
| US6532061B2 (en) | 2000-08-25 | 2003-03-11 | Amnis Corporation | Measuring the velocity of small moving objects such as cells |
| US6533914B1 (en) | 1999-07-08 | 2003-03-18 | Shaorong Liu | Microfabricated injector and capillary array assembly for high-resolution and high throughput separation |
| US20030082516A1 (en) | 2001-09-06 | 2003-05-01 | Don Straus | Rapid detection of replicating cells |
| US6559947B1 (en) | 1998-08-28 | 2003-05-06 | Wallesley International C.V. | Reference fringe counting fourier transform spectroscopy |
| US20030087099A1 (en) | 1995-11-17 | 2003-05-08 | Massachusetts Institute Of Technology | Poly(ethylene oxide) coated surfaces |
| US20030099598A1 (en) | 2001-10-22 | 2003-05-29 | Kiefer Gary E. | Tissue specific fluorescent chelates possessing long wavelength UV excitation |
| US6576430B1 (en) | 2000-11-20 | 2003-06-10 | Becton, Dickinson And Company | Detection of ligands by refractive surface methods |
| US20030129579A1 (en) | 2001-09-04 | 2003-07-10 | Bornhop Darryl J. | Multi-use multimodal imaging chelates |
| US20030148922A1 (en) | 1997-04-04 | 2003-08-07 | Caliper Technologies Corp. | Closed-loop biochemical analyzers |
| US6660517B1 (en) | 1992-05-01 | 2003-12-09 | Trustees Of The University Of Pennsylvania | Mesoscale polynucleotide amplification devices |
| WO2004023115A1 (en) | 2002-09-05 | 2004-03-18 | Texas Tech University System | Refractive index determination by micro interferometric reflection detection |
| US20040058058A1 (en) | 2000-04-12 | 2004-03-25 | Shchegolikhin Alexander Nikitovich | Raman-active taggants and thier recognition |
| US6741361B2 (en) | 2002-06-24 | 2004-05-25 | Lightgage, Inc. | Multi-stage data processing for frequency-scanning interferometer |
| US6744950B2 (en) | 2001-01-18 | 2004-06-01 | Veridian Systems | Correlators and cross-correlators using tapped optical fibers |
| US20040110276A1 (en) | 2002-12-04 | 2004-06-10 | International Business Machines Corporation | Surface treatment |
| US20040115721A1 (en) | 2001-06-26 | 2004-06-17 | Guoqiang Mao | Functional surface coating |
| US6760103B2 (en) | 2000-09-06 | 2004-07-06 | Metso Automation Oy | Measurement of paper or board |
| US6798509B2 (en) | 2001-08-20 | 2004-09-28 | Hitachi, Ltd. | Methods and instruments for fluorescence detection |
| US20040218184A1 (en) | 1999-01-25 | 2004-11-04 | Amnis Corporation | Imaging platform for nanoparticle detection applied to SPR biomolecular interaction analysis |
| US20040241765A1 (en) | 2002-06-17 | 2004-12-02 | Zweig Stephen Eliot | Membrane receptor reagent and assay |
| US20050004348A1 (en) | 2002-12-23 | 2005-01-06 | Miyamoto Ken-Ichi | Novel type II Na/Pi cotransporters and type II Na/Pi cotransporter expression regulatory factors |
| US20050014179A1 (en) | 2003-06-06 | 2005-01-20 | Biacore Ab | Method and system for determination of molecular interaction parameters |
| US20050019956A1 (en) | 2002-07-30 | 2005-01-27 | Peter Martin | Optical sensor and methods for measuring molecular binding interactions |
| US20050083505A1 (en) | 2001-10-18 | 2005-04-21 | Walter Augustyn | System and method for laser beam expansion |
| US20050106570A1 (en) | 2002-04-03 | 2005-05-19 | Japan Science And Technology Agency | Biochip sensor surface carrying polyethylene glycolated nanoparticles |
| US20050175273A1 (en) | 2002-08-02 | 2005-08-11 | Kazuhiro Iida | Microchip, method of manufacturing microchip, and method of detecting compositions |
| US20050190372A1 (en) | 2003-08-14 | 2005-09-01 | Aristide Dogariu | Interferometric sensor for characterizing materials |
| US20050227374A1 (en) | 2000-10-30 | 2005-10-13 | Sru Biosystems, Inc. | Label-free high-throughput optical technique for detecting biomolecular interactions |
| US20050244863A1 (en) | 2002-09-19 | 2005-11-03 | The Chancellor, Master And Scholars Of The University Of Oxford | Molecular arrays and single molecule detection |
| US20050264819A1 (en) | 2003-08-04 | 2005-12-01 | Carl Zeiss Smt Ag | Device for the range-resolved determination of scattered light, operating method, illumination mask and image-field mask |
| US6980299B1 (en) | 2001-10-16 | 2005-12-27 | General Hospital Corporation | Systems and methods for imaging a sample |
| US20060012800A1 (en) | 2002-09-05 | 2006-01-19 | Bornhop Darryl J | Refractive index determination by micro interferometric reflection detection |
| US20060012777A1 (en) | 2004-07-13 | 2006-01-19 | Talbot Nicholas C | Combination laser system and global navigation satellite system |
| US20060039004A1 (en) | 2004-08-06 | 2006-02-23 | The General Hospital Corporation | Process, system and software arrangement for determining at least one location in a sample using an optical coherence tomography |
| US7011948B2 (en) | 2002-07-17 | 2006-03-14 | Mds Sciex | Detection of ligand-antiligand complex formation by electromagnetically detectable bulk property measurement |
| CA2584824A1 (en) | 2004-10-22 | 2006-05-04 | Vanderbilt University | On-chip polarimetry for high-throughput screening of nanoliter and smaller sample volumes |
| US7045171B2 (en) | 2000-03-23 | 2006-05-16 | Corning Incorporated | Method for fabricating supported bilayer-lipid membranes |
| US20060147379A1 (en) | 2005-01-03 | 2006-07-06 | Bornhop Darryl J | Targeted, NIR imaging agents for therapy efficacy monitoring, deep tissue disease demarcation and deep tissue imaging |
| US20060183700A1 (en) | 2002-05-06 | 2006-08-17 | Noxxon Pharma Ag | Cgrp binding nucleic acids |
| US20060256343A1 (en) | 2005-01-20 | 2006-11-16 | Michael Choma | Methods, systems and computer program products for characterizing structures based on interferometric phase data |
| US20060263777A1 (en) | 2003-01-27 | 2006-11-23 | Tong William G | Sensitive sensing based on optical optical nonlinear wave mixing |
| US20060268260A1 (en) | 2005-05-31 | 2006-11-30 | Nanyang Technological University | Cell analysis using laser with external cavity |
| US20060275179A1 (en) | 2003-05-21 | 2006-12-07 | Centre National De La Recherche Scientifique | Microfluidic device |
| US20060275825A1 (en) | 2005-04-12 | 2006-12-07 | Sru Biosystems, Inc. | Proteolipid membrane and lipid membrane biosensor |
| WO2007002178A2 (en) | 2005-06-21 | 2007-01-04 | The Government Of The United States Of America As Represented By The Secretary Of The Department Of Health And Human Services | Methods, immunoassays and devices for detection of anti-lipoidal antibodies |
| US20070012777A1 (en) | 1998-03-24 | 2007-01-18 | Tsikos Constantine J | Planar laser illumination and imaging (PLIIM) systems with integrated despeckling mechanisms provided therein |
| EP1746385A1 (en) | 2004-04-22 | 2007-01-24 | The University of Electro-Communications | Small displacement measuring method and instrument |
| US7173986B2 (en) | 2003-07-23 | 2007-02-06 | Ali Corporation | Nonlinear overlap method for time scaling |
| US7172897B2 (en) | 2000-01-11 | 2007-02-06 | Clinical Micro Sensors, Inc. | Devices and methods for biochip multiplexing |
| US20070030481A1 (en) | 2002-07-10 | 2007-02-08 | E2V Technologies (Uk) Limited | Molecular detector arrangement |
| US20070030841A1 (en) | 2005-05-12 | 2007-02-08 | Lee Richard M | System and methods for IP and VoIP device location determination |
| US20070048747A1 (en) | 2005-09-01 | 2007-03-01 | Leslie Thomas M | Methods for assaying analytes |
| US20070054339A1 (en) | 2000-10-30 | 2007-03-08 | Sru Biosystems, Inc. | Label-free methods for performing assays using a colorimetric resonant reflectance optical biosensor |
| US7202076B2 (en) | 2000-10-30 | 2007-04-10 | Sru Biosystems, Inc. | Label-free high-throughput optical technique for detecting biomolecular interactions |
| US20070146888A1 (en) | 2005-12-22 | 2007-06-28 | Palo Alto Research Center Incorporated | Propagating light to be sensed |
| US20070195321A1 (en) | 2002-12-23 | 2007-08-23 | Francoise Soussaline | Chip reader for biochips and associated methods |
| US20070202495A1 (en) | 2006-02-06 | 2007-08-30 | Michael Mayer | Use of resistive-pulse sensing with submicrometer pores or nanopores for the detection of the assembly of submicrometer or nanometer sized objects |
| US20080160187A1 (en) | 2004-12-17 | 2008-07-03 | Central Glass Company, Limited | Antifog Article, Method for Producing Same, and Coating Material for Forming Antifog Coating Film |
| US20080182239A1 (en) | 2007-01-26 | 2008-07-31 | Mullinax Rebecca L | Methods, Compositions, and Kits for Detection of microRNA |
| US20080186488A1 (en) | 2007-02-05 | 2008-08-07 | Palo Alto Research Center Incorporated | Distinguishing objects |
| US20080194723A1 (en) | 2007-02-12 | 2008-08-14 | Hwang Jing-Zhong | Ambient Temperature Curable Hydrophilic PU Oligomer, Method for Synthesizing the same and Surface Treatment Method of using the same |
| US20080248502A1 (en) | 2004-04-28 | 2008-10-09 | Eisai R&D Management Co., Ltd. | Methods For Detecting Th1 Cells |
| US20080259313A1 (en) | 2004-08-19 | 2008-10-23 | Berndt Klaus W | Apparatus for Performing Optical Measurements on Blood Culture Bottles |
| WO2008144496A1 (en) | 2007-05-18 | 2008-11-27 | Vanderbilt University | Improved interferometric detection system and method |
| US20090009759A1 (en) | 2006-05-12 | 2009-01-08 | Vadim Backman | Systems, methods and apparatuses of elastic light scattering spectroscopy and low coherence enhanced backscattering spectroscopy |
| WO2009039466A1 (en) | 2007-09-20 | 2009-03-26 | Vanderbilt University | Free solution measurement of molecular interactions by backscattering interferometry |
| US20090135421A1 (en) | 2001-07-25 | 2009-05-28 | Applera Corporation | System for detecting markers |
| US20090147264A1 (en)* | 2007-04-30 | 2009-06-11 | The University Of Pittsburgh - Of The Commonwealth System Of Higher Education | Label-free, real-time detection system for molecular interaction analysis |
| US20090155832A1 (en) | 2005-10-28 | 2009-06-18 | Lo Yu-Hwa | Apparatus and Method for Improved Optical Detection of Particles in Fluid |
| US20090185190A1 (en) | 2007-12-10 | 2009-07-23 | Molecular Sensing, Inc. | Temperature-stable interferometer |
| US20090325199A1 (en) | 2005-08-02 | 2009-12-31 | University Of Maryland Biotechnology Institute | Nanostructures for polarized imaging and receptor/ligan quantization: breaking the diffraction limit for imaging |
| US20100099203A1 (en) | 2008-10-03 | 2010-04-22 | Molecular Sensing, Inc. | Substrates with surfaces modified with PEG |
| WO2010080710A2 (en) | 2009-01-12 | 2010-07-15 | Molecular Sensing, Inc. | Sample collection and measurement in a single container by back scattering interferometry |
| US20100188665A1 (en) | 2009-01-12 | 2010-07-29 | Molecular Sensing, Inc. | Methods and systems for interferometric analysis |
| US20100191482A1 (en) | 2009-01-26 | 2010-07-29 | Canon U.S. Life Sciences, Inc. | Microfluidic flow monitoring |
| US20100210029A1 (en) | 2007-04-27 | 2010-08-19 | The Regents Of The University Of California | Device and methods of detection of airborne agents |
| WO2010129494A2 (en) | 2009-05-04 | 2010-11-11 | Oregon Health & Science University | Method and apparatus for quantitative imaging of blood perfusion in living tissue |
| US20110045993A1 (en)* | 2008-02-05 | 2011-02-24 | Nigel Kent | Microfluidic device for assessing object/test material interactions |
| US20110109907A1 (en) | 2009-11-12 | 2011-05-12 | General Electric Company | Optical sensor system and method of sensing |
| US20110155927A1 (en) | 2007-12-04 | 2011-06-30 | Particle Measuring Systems, Inc. | Non-Orthogonal Particle Detection Systems and Methods |
| US20110157692A1 (en) | 2009-12-30 | 2011-06-30 | National Sun Yat-Sen University | Objective-type dark-field illumination device for microfluidic channel |
| WO2011156713A1 (en) | 2010-06-11 | 2011-12-15 | Vanderbilt University | Multiplexed interferometric detection system and method |
| WO2012051429A1 (en) | 2010-10-13 | 2012-04-19 | Vanderbilt University | Methods, systems and compositions for nucleic acid analysis using back-scattering interferometry |
| US20120199742A1 (en) | 2010-11-16 | 2012-08-09 | 1087 Systems, Inc. | Single particle qcl-based mid-ir spectroscopy system with analysis of scattering |
| US20130021608A1 (en) | 2011-02-22 | 2013-01-24 | Bornhop Darryl J | Nonaqueous Backscattering Interferometric Methods |
| US20130040306A1 (en) | 2011-03-01 | 2013-02-14 | Darryl J. Bornhop | Backscattering interferometric analysis of membrane materials |
| US8450118B2 (en) | 2009-05-04 | 2013-05-28 | Molecular Sensing, Inc. | Method for detecting binding interactions between membrane proteins and analytes in a homogenous assay |
| US20130224886A1 (en) | 2008-01-16 | 2013-08-29 | Nippon Telegraph And Telephone Corporation | Flow rate measurement apparatus, antigen concentration measurement apparatus, flow cell, flow rate measurement method, and antigen concentration measurement method |
| US20130301055A1 (en) | 2012-05-11 | 2013-11-14 | Vanderbilt University | Backscattering interferometric methods |
| US8673827B1 (en) | 2007-11-28 | 2014-03-18 | Los Alamos National Security, Llc | Method of analysis of polymerizable monomeric species in a complex mixture |
| US20140285803A1 (en) | 2011-06-23 | 2014-09-25 | Centre National De La Recherche Scientifique (Cnrs) | System and method of analysis by determining a depolarizing or dichroic character of an object |
| WO2015127298A1 (en) | 2014-02-20 | 2015-08-27 | Vanderbilt University | Physiologically-relevant affinity measurements in vitro with backscattering interferometry |
| US20160000239A1 (en) | 2014-07-03 | 2016-01-07 | Target Brands Inc. | Mattress display fixture |
| US20160000329A1 (en) | 2013-02-20 | 2016-01-07 | Sloan-Kettering Institute For Cancer Research | Wide field raman imaging apparatus and associated methods |
| WO2017132483A1 (en) | 2016-01-29 | 2017-08-03 | Vanderbilt University | Free-solution response function interferometry |
| US9990464B1 (en) | 2012-10-09 | 2018-06-05 | Pall Corporation | Label-free biomolecular interaction analysis using a rapid analyte dispersion injection method |
- 2017
- 2017-01-27EPEP17744954.3Apatent/EP3408649B1/enactiveActive
- 2017-01-27USUS16/073,630patent/US10627396B2/enactiveActive
- 2017-01-27WOPCT/US2017/015296patent/WO2017132483A1/ennot_activeCeased
- 2020
- 2020-03-09USUS16/813,565patent/US11143649B2/enactiveActive
Patent Citations (375)
| Publication number | Priority date | Publication date | Assignee | Title |
|---|---|---|---|---|
| US3567113A (en) | 1969-03-18 | 1971-03-02 | Us Air Force | Miniature, portable, self-powered, high speed, clinical centrifuge |
| US3687808A (en) | 1969-08-14 | 1972-08-29 | Univ Leland Stanford Junior | Synthetic polynucleotides |
| US4042304A (en) | 1972-11-06 | 1977-08-16 | Gow-Mac Instruments, Inc. | Christiansen effect detector |
| US4093759A (en) | 1972-12-23 | 1978-06-06 | Toyo Ink Manufacturing Co., Ltd. | Glass container coated with polyurethane |
| US4268554A (en) | 1977-10-13 | 1981-05-19 | Rainer Gras | Process for the coating of glass surfaces |
| US4265554A (en) | 1978-05-22 | 1981-05-05 | International Business Machines Corporation | Paragraph indent |
| US4469863A (en) | 1980-11-12 | 1984-09-04 | Ts O Paul O P | Nonionic nucleic acid alkyl and aryl phosphonates and processes for manufacture and use thereof |
| US4443106A (en) | 1981-08-22 | 1984-04-17 | Nippon Paint Co., Ltd. | Measuring device for measuring the amount of change in thickness of the paint layer |
| US5023243A (en) | 1981-10-23 | 1991-06-11 | Molecular Biosystems, Inc. | Oligonucleotide therapeutic agent and method of making same |
| US4476301A (en) | 1982-04-29 | 1984-10-09 | Centre National De La Recherche Scientifique | Oligonucleotides, a process for preparing the same and their application as mediators of the action of interferon |
| US4667025A (en) | 1982-08-09 | 1987-05-19 | Wakunaga Seiyaku Kabushiki Kaisha | Oligonucleotide derivatives |
| US4789737A (en) | 1982-08-09 | 1988-12-06 | Wakunaga Seiyaku Kabushiki Kaisha | Oligonucleotide derivatives and production thereof |
| US4835263A (en) | 1983-01-27 | 1989-05-30 | Centre National De La Recherche Scientifique | Novel compounds containing an oligonucleotide sequence bonded to an intercalating agent, a process for their synthesis and their use |
| US4605735A (en) | 1983-02-14 | 1986-08-12 | Wakunaga Seiyaku Kabushiki Kaisha | Oligonucleotide derivatives |
| US5541313A (en) | 1983-02-22 | 1996-07-30 | Molecular Biosystems, Inc. | Single-stranded labelled oligonucleotides of preselected sequence |
| US4948882A (en) | 1983-02-22 | 1990-08-14 | Syngene, Inc. | Single-stranded labelled oligonucleotides, reactive monomers and methods of synthesis |
| US4824941A (en) | 1983-03-10 | 1989-04-25 | Julian Gordon | Specific antibody to the native form of 2'5'-oligonucleotides, the method of preparation and the use as reagents in immunoassays or for binding 2'5'-oligonucleotides in biological systems |
| US4587044A (en) | 1983-09-01 | 1986-05-06 | The Johns Hopkins University | Linkage of proteins to nucleic acids |
| US5118800A (en) | 1983-12-20 | 1992-06-02 | California Institute Of Technology | Oligonucleotides possessing a primary amino group in the terminal nucleotide |
| US5118802A (en) | 1983-12-20 | 1992-06-02 | California Institute Of Technology | DNA-reporter conjugates linked via the 2' or 5'-primary amino group of the 5'-terminal nucleoside |
| US4660974A (en) | 1984-04-14 | 1987-04-28 | Carl-Zeiss-Stiftung | Arrangement for determining the spectral characteristic of the refractive index of a fluid |
| US4990925A (en) | 1984-05-07 | 1991-02-05 | Hughes Aircraft Company | Interferometric radiometer |
| US5550111A (en) | 1984-07-11 | 1996-08-27 | Temple University-Of The Commonwealth System Of Higher Education | Dual action 2',5'-oligoadenylate antiviral derivatives and uses thereof |
| US4981957A (en) | 1984-07-19 | 1991-01-01 | Centre National De La Recherche Scientifique | Oligonucleotides with modified phosphate and modified carbohydrate moieties at the respective chain termini |
| US5258506A (en) | 1984-10-16 | 1993-11-02 | Chiron Corporation | Photolabile reagents for incorporation into oligonucleotide chains |
| US5367066A (en) | 1984-10-16 | 1994-11-22 | Chiron Corporation | Oligonucleotides with selectably cleavable and/or abasic sites |
| US5545730A (en) | 1984-10-16 | 1996-08-13 | Chiron Corporation | Multifunctional nucleic acid monomer |
| US5552538A (en) | 1984-10-16 | 1996-09-03 | Chiron Corporation | Oligonucleotides with cleavable sites |
| US5578717A (en) | 1984-10-16 | 1996-11-26 | Chiron Corporation | Nucleotides for introducing selectably cleavable and/or abasic sites into oligonucleotides |
| US4828979A (en) | 1984-11-08 | 1989-05-09 | Life Technologies, Inc. | Nucleotide analogs for nucleic acid labeling and detection |
| US4699951A (en) | 1984-11-13 | 1987-10-13 | Nalco Chemical Company | Bimodal cationics for water clarification |
| US4845205A (en) | 1985-01-08 | 1989-07-04 | Institut Pasteur | 2,N6 -disubstituted and 2,N6 -trisubstituted adenosine-3'-phosphoramidites |
| US5034506A (en) | 1985-03-15 | 1991-07-23 | Anti-Gene Development Group | Uncharged morpholino-based polymers having achiral intersubunit linkages |
| US5235033A (en) | 1985-03-15 | 1993-08-10 | Anti-Gene Development Group | Alpha-morpholino ribonucleoside derivatives and polymers thereof |
| US5185444A (en) | 1985-03-15 | 1993-02-09 | Anti-Gene Deveopment Group | Uncharged morpolino-based polymers having phosphorous containing chiral intersubunit linkages |
| US4683202B1 (en) | 1985-03-28 | 1990-11-27 | Cetus Corp | |
| US4683202A (en) | 1985-03-28 | 1987-07-28 | Cetus Corporation | Process for amplifying nucleic acid sequences |
| US4762779A (en) | 1985-06-13 | 1988-08-09 | Amgen Inc. | Compositions and methods for functionalizing nucleic acids |
| US4683195B1 (en) | 1986-01-30 | 1990-11-27 | Cetus Corp | |
| US4683195A (en) | 1986-01-30 | 1987-07-28 | Cetus Corporation | Process for amplifying, detecting, and/or-cloning nucleic acid sequences |
| US5317098A (en) | 1986-03-17 | 1994-05-31 | Hiroaki Shizuya | Non-radioisotope tagging of fragments |
| US4876335A (en) | 1986-06-30 | 1989-10-24 | Wakunaga Seiyaku Kabushiki Kaisha | Poly-labelled oligonucleotide derivative |
| US4976154A (en) | 1986-08-11 | 1990-12-11 | Endress U. Hauser Gmbh U. Co. | Arrangement for contactless measurement of the volume flow or mass flow of a moving medium |
| US4895431A (en) | 1986-11-13 | 1990-01-23 | Olympus Optical Co., Ltd. | Method of processing endoscopic images |
| US5264423A (en) | 1987-03-25 | 1993-11-23 | The United States Of America As Represented By The Department Of Health And Human Services | Inhibitors for replication of retroviruses and for the expression of oncogene products |
| US5286717A (en) | 1987-03-25 | 1994-02-15 | The United States Of America As Represented By The Department Of Health And Human Services | Inhibitors for replication of retroviruses and for the expression of oncogene products |
| US5276019A (en) | 1987-03-25 | 1994-01-04 | The United States Of America As Represented By The Department Of Health And Human Services | Inhibitors for replication of retroviruses and for the expression of oncogene products |
| US4904582A (en) | 1987-06-11 | 1990-02-27 | Synthetic Genetics | Novel amphiphilic nucleic acid conjugates |
| US5552540A (en) | 1987-06-24 | 1996-09-03 | Howard Florey Institute Of Experimental Physiology And Medicine | Nucleoside derivatives |
| US5585481A (en) | 1987-09-21 | 1996-12-17 | Gen-Probe Incorporated | Linking reagents for nucleotide probes |
| US5188897A (en) | 1987-10-22 | 1993-02-23 | Temple University Of The Commonwealth System Of Higher Education | Encapsulated 2',5'-phosphorothioate oligoadenylates |
| US5405939A (en) | 1987-10-22 | 1995-04-11 | Temple University Of The Commonwealth System Of Higher Education | 2',5'-phosphorothioate oligoadenylates and their covalent conjugates with polylysine |
| US5525465A (en) | 1987-10-28 | 1996-06-11 | Howard Florey Institute Of Experimental Physiology And Medicine | Oligonucleotide-polyamide conjugates and methods of production and applications of the same |
| US5112963A (en) | 1987-11-12 | 1992-05-12 | Max-Planck-Gesellschaft Zur Foerderung Der Wissenschaften E.V. | Modified oligonucleotides |
| US5165005A (en) | 1988-01-29 | 1992-11-17 | Fiberchem Inc. | Planar and other waveguide refractive index sensors using metal cladding |
| US5120131A (en) | 1988-02-14 | 1992-06-09 | Walter Lukosz | Method and apparatus for selecting detection of changes in samples by integrated optical interference |
| US5082830A (en) | 1988-02-26 | 1992-01-21 | Enzo Biochem, Inc. | End labeled nucleotide probe |
| US5519126A (en) | 1988-03-25 | 1996-05-21 | University Of Virginia Alumni Patents Foundation | Oligonucleotide N-alkylphosphoramidates |
| US4950074A (en) | 1988-05-02 | 1990-08-21 | IOT Entwicklungsgesellshaft fur Integrierte Optik-Technologie mbH | Method of determining the refractive index of a substance and apparatus thereof |
| US5278302A (en) | 1988-05-26 | 1994-01-11 | University Patents, Inc. | Polynucleotide phosphorodithioates |
| US5453496A (en) | 1988-05-26 | 1995-09-26 | University Patents, Inc. | Polynucleotide phosphorodithioate |
| US5109124A (en) | 1988-06-01 | 1992-04-28 | Biogen, Inc. | Nucleic acid probe linked to a label having a terminal cysteine |
| US5216141A (en) | 1988-06-06 | 1993-06-01 | Benner Steven A | Oligonucleotide analogs containing sulfur linkages |
| US4908112A (en) | 1988-06-16 | 1990-03-13 | E. I. Du Pont De Nemours & Co. | Silicon semiconductor wafer for analyzing micronic biological samples |
| US5175273A (en) | 1988-07-01 | 1992-12-29 | Genentech, Inc. | Nucleic acid intercalating agents |
| US5502561A (en) | 1988-09-15 | 1996-03-26 | Board Of Trustees Of The University Of Arkansas | Characterization of particles by modulated dynamic light scattering |
| US5262536A (en) | 1988-09-15 | 1993-11-16 | E. I. Du Pont De Nemours And Company | Reagents for the preparation of 5'-tagged oligonucleotides |
| US5305071A (en) | 1988-10-03 | 1994-04-19 | Wyatt Technology Corporation | Differential refractometer |
| US5073024A (en) | 1988-11-04 | 1991-12-17 | Commissariat A L'energie Atomique | Integrated optical device for measuring the refractive index of a fluid |
| WO1990005317A1 (en) | 1988-11-10 | 1990-05-17 | Pharmacia Ab | Optical interface means |
| US5512439A (en) | 1988-11-21 | 1996-04-30 | Dynal As | Oligonucleotide-linked magnetic particles and uses thereof |
| US5599923A (en) | 1989-03-06 | 1997-02-04 | Board Of Regents, University Of Tx | Texaphyrin metal complexes having improved functionalization |
| US5125740A (en) | 1989-03-17 | 1992-06-30 | Hitachi, Ltd. | Method and apparatus for measuring optical constants of a thin film as well as method and apparatus for fabricating a thin film utilizing same |
| US5556852A (en) | 1989-04-28 | 1996-09-17 | Sankyo Company, Limited | N-acryloylpiperazine compounds |
| US5391723A (en) | 1989-05-31 | 1995-02-21 | Neorx Corporation | Oligonucleotide conjugates |
| US5416203A (en) | 1989-06-06 | 1995-05-16 | Northwestern University | Steroid modified oligonucleotides |
| US4958013A (en) | 1989-06-06 | 1990-09-18 | Northwestern University | Cholesteryl modified oligonucleotides |
| US5268305A (en) | 1989-06-15 | 1993-12-07 | Biocircuits Corporation | Multi-optical detection system |
| US5108179A (en) | 1989-08-09 | 1992-04-28 | Myers Stephen A | System and method for determining changes in fluorescence of stained nucleic acid in electrophoretically separated bands |
| US5451463A (en) | 1989-08-28 | 1995-09-19 | Clontech Laboratories, Inc. | Non-nucleoside 1,3-diol reagents for labeling synthetic oligonucleotides |
| US5134066A (en) | 1989-08-29 | 1992-07-28 | Monsanto Company | Improved probes using nucleosides containing 3-dezauracil analogs |
| US5254469A (en) | 1989-09-12 | 1993-10-19 | Eastman Kodak Company | Oligonucleotide-enzyme conjugate that can be used as a probe in hybridization assays and polymerase chain reaction procedures |
| US5591722A (en) | 1989-09-15 | 1997-01-07 | Southern Research Institute | 2'-deoxy-4'-thioribonucleosides and their antiviral activity |
| US5399676A (en) | 1989-10-23 | 1995-03-21 | Gilead Sciences | Oligonucleotides with inverted polarity |
| US5264562A (en) | 1989-10-24 | 1993-11-23 | Gilead Sciences, Inc. | Oligonucleotide analogs with novel linkages |
| US5264564A (en) | 1989-10-24 | 1993-11-23 | Gilead Sciences | Oligonucleotide analogs with novel linkages |
| US5292873A (en) | 1989-11-29 | 1994-03-08 | The Research Foundation Of State University Of New York | Nucleic acids labeled with naphthoquinone probe |
| US5455233A (en) | 1989-11-30 | 1995-10-03 | University Of North Carolina | Oligoribonucleoside and oligodeoxyribonucleoside boranophosphates |
| US5166315A (en) | 1989-12-20 | 1992-11-24 | Anti-Gene Development Group | Sequence-specific binding polymers for duplex nucleic acids |
| US5130302A (en) | 1989-12-20 | 1992-07-14 | Boron Bilogicals, Inc. | Boronated nucleoside, nucleotide and oligonucleotide compounds, compositions and methods for using same |
| US5405938A (en) | 1989-12-20 | 1995-04-11 | Anti-Gene Development Group | Sequence-specific binding polymers for duplex nucleic acids |
| US5486603A (en) | 1990-01-08 | 1996-01-23 | Gilead Sciences, Inc. | Oligonucleotide having enhanced binding affinity |
| US5587469A (en) | 1990-01-11 | 1996-12-24 | Isis Pharmaceuticals, Inc. | Oligonucleotides containing N-2 substituted purines |
| US5681941A (en) | 1990-01-11 | 1997-10-28 | Isis Pharmaceuticals, Inc. | Substituted purines and oligonucleotide cross-linking |
| US5459255A (en) | 1990-01-11 | 1995-10-17 | Isis Pharmaceuticals, Inc. | N-2 substituted purines |
| US5670633A (en) | 1990-01-11 | 1997-09-23 | Isis Pharmaceuticals, Inc. | Sugar modified oligonucleotides that detect and modulate gene expression |
| US5646265A (en) | 1990-01-11 | 1997-07-08 | Isis Pharmceuticals, Inc. | Process for the preparation of 2'-O-alkyl purine phosphoramidites |
| US5578718A (en) | 1990-01-11 | 1996-11-26 | Isis Pharmaceuticals, Inc. | Thiol-derivatized nucleosides |
| US5414077A (en) | 1990-02-20 | 1995-05-09 | Gilead Sciences | Non-nucleoside linkers for convenient attachment of labels to oligonucleotides using standard synthetic methods |
| US5214136A (en) | 1990-02-20 | 1993-05-25 | Gilead Sciences, Inc. | Anthraquinone-derivatives oligonucleotides |
| US5541306A (en) | 1990-03-08 | 1996-07-30 | Worcester Foundation For Biomedical Research | Aminoalkylphosphotriester oligonucleotide derivatives |
| US5321131A (en) | 1990-03-08 | 1994-06-14 | Hybridon, Inc. | Site-specific functionalization of oligodeoxynucleotides for non-radioactive labelling |
| US5536821A (en) | 1990-03-08 | 1996-07-16 | Worcester Foundation For Biomedical Research | Aminoalkylphosphorothioamidate oligonucleotide deratives |
| US5563253A (en) | 1990-03-08 | 1996-10-08 | Worcester Foundation For Biomedical Research | Linear aminoalkylphosphoramidate oligonucleotide derivatives |
| US5470967A (en) | 1990-04-10 | 1995-11-28 | The Dupont Merck Pharmaceutical Company | Oligonucleotide analogs with sulfamate linkages |
| US5567811A (en) | 1990-05-03 | 1996-10-22 | Amersham International Plc | Phosphoramidite derivatives, their preparation and the use thereof in the incorporation of reporter groups on synthetic oligonucleotides |
| US5514785A (en) | 1990-05-11 | 1996-05-07 | Becton Dickinson And Company | Solid supports for nucleic acid hybridization assays |
| US5325170A (en) | 1990-05-31 | 1994-06-28 | Thermo Instrument Systems Inc. | Laser-based refractive index detector using backscatter |
| US5215883A (en) | 1990-07-09 | 1993-06-01 | The Research Foundation | Electrophoretic mobility of fluorophore labeled particles in gels by fluorophore movement after photobleaching |
| US5489677A (en) | 1990-07-27 | 1996-02-06 | Isis Pharmaceuticals, Inc. | Oligonucleoside linkages containing adjacent oxygen and nitrogen atoms |
| US5677437A (en) | 1990-07-27 | 1997-10-14 | Isis Pharmaceuticals, Inc. | Heteroatomic oligonucleoside linkages |
| US5602240A (en) | 1990-07-27 | 1997-02-11 | Ciba Geigy Ag. | Backbone modified oligonucleotide analogs |
| US5608046A (en) | 1990-07-27 | 1997-03-04 | Isis Pharmaceuticals, Inc. | Conjugated 4'-desmethyl nucleoside analog compounds |
| US5610289A (en) | 1990-07-27 | 1997-03-11 | Isis Pharmaceuticals, Inc. | Backbone modified oligonucleotide analogues |
| US5541307A (en) | 1990-07-27 | 1996-07-30 | Isis Pharmaceuticals, Inc. | Backbone modified oligonucleotide analogs and solid phase synthesis thereof |
| US5614617A (en) | 1990-07-27 | 1997-03-25 | Isis Pharmaceuticals, Inc. | Nuclease resistant, pyrimidine modified oligonucleotides that detect and modulate gene expression |
| US5688941A (en) | 1990-07-27 | 1997-11-18 | Isis Pharmaceuticals, Inc. | Methods of making conjugated 4' desmethyl nucleoside analog compounds |
| US5618704A (en) | 1990-07-27 | 1997-04-08 | Isis Pharmacueticals, Inc. | Backbone-modified oligonucleotide analogs and preparation thereof through radical coupling |
| US5623070A (en) | 1990-07-27 | 1997-04-22 | Isis Pharmaceuticals, Inc. | Heteroatomic oligonucleoside linkages |
| US5138045A (en) | 1990-07-27 | 1992-08-11 | Isis Pharmaceuticals | Polyamine conjugated oligonucleotides |
| US5218105A (en) | 1990-07-27 | 1993-06-08 | Isis Pharmaceuticals | Polyamine conjugated oligonucleotides |
| US5567810A (en) | 1990-08-03 | 1996-10-22 | Sterling Drug, Inc. | Nuclease resistant compounds |
| US5677439A (en) | 1990-08-03 | 1997-10-14 | Sanofi | Oligonucleotide analogues containing phosphate diester linkage substitutes, compositions thereof, and precursor dinucleotide analogues |
| US5245022A (en) | 1990-08-03 | 1993-09-14 | Sterling Drug, Inc. | Exonuclease resistant terminally substituted oligonucleotides |
| US5177196A (en) | 1990-08-16 | 1993-01-05 | Microprobe Corporation | Oligo (α-arabinofuranosyl nucleotides) and α-arabinofuranosyl precursors thereof |
| US5512667A (en) | 1990-08-28 | 1996-04-30 | Reed; Michael W. | Trifunctional intermediates for preparing 3'-tailed oligonucleotides |
| US5350697A (en) | 1990-08-28 | 1994-09-27 | Akzo N.V. | Scattered light detection apparatus |
| US5214134A (en) | 1990-09-12 | 1993-05-25 | Sterling Winthrop Inc. | Process of linking nucleosides with a siloxane bridge |
| US5561225A (en) | 1990-09-19 | 1996-10-01 | Southern Research Institute | Polynucleotide analogs containing sulfonate and sulfonamide internucleoside linkages |
| US5377008A (en) | 1990-09-20 | 1994-12-27 | Battelle Memorial Institute | Integrated optical compensating refractometer apparatus |
| US5173747A (en) | 1990-09-20 | 1992-12-22 | Battelle Memorial Institute | Integrated optical directional-coupling refractometer apparatus |
| US5596086A (en) | 1990-09-20 | 1997-01-21 | Gilead Sciences, Inc. | Modified internucleoside linkages having one nitrogen and two carbon atoms |
| US5432272A (en) | 1990-10-09 | 1995-07-11 | Benner; Steven A. | Method for incorporating into a DNA or RNA oligonucleotide using nucleotides bearing heterocyclic bases |
| US5510475A (en) | 1990-11-08 | 1996-04-23 | Hybridon, Inc. | Oligonucleotide multiple reporter precursors |
| US6198532B1 (en) | 1991-02-22 | 2001-03-06 | Applied Spectral Imaging Ltd. | Spectral bio-imaging of the eye |
| US5714331A (en) | 1991-05-24 | 1998-02-03 | Buchardt, Deceased; Ole | Peptide nucleic acids having enhanced binding affinity, sequence specificity and solubility |
| US5371241A (en) | 1991-07-19 | 1994-12-06 | Pharmacia P-L Biochemicals Inc. | Fluorescein labelled phosphoramidites |
| US5571799A (en) | 1991-08-12 | 1996-11-05 | Basco, Ltd. | (2'-5') oligoadenylate analogues useful as inhibitors of host-v5.-graft response |
| US5587361A (en) | 1991-10-15 | 1996-12-24 | Isis Pharmaceuticals, Inc. | Oligonucleotides having phosphorothioate linkages of high chiral purity |
| US5319080A (en) | 1991-10-17 | 1994-06-07 | Ciba-Geigy Corporation | Bicyclic nucleosides, oligonucleotides, process for their preparation and intermediates |
| US5393878A (en) | 1991-10-17 | 1995-02-28 | Ciba-Geigy Corporation | Bicyclic nucleosides, oligonucleotides, process for their preparation and intermediates |
| US5594121A (en) | 1991-11-07 | 1997-01-14 | Gilead Sciences, Inc. | Enhanced triple-helix and double-helix formation with oligomers containing modified purines |
| US5846708A (en) | 1991-11-19 | 1998-12-08 | Massachusetts Institiute Of Technology | Optical and electrical methods and apparatus for molecule detection |
| US5484908A (en) | 1991-11-26 | 1996-01-16 | Gilead Sciences, Inc. | Oligonucleotides containing 5-propynyl pyrimidines |
| US5359044A (en) | 1991-12-13 | 1994-10-25 | Isis Pharmaceuticals | Cyclobutyl oligonucleotide surrogates |
| US5595726A (en) | 1992-01-21 | 1997-01-21 | Pharmacyclics, Inc. | Chromophore probe for detection of nucleic acid |
| US5587371A (en) | 1992-01-21 | 1996-12-24 | Pharmacyclics, Inc. | Texaphyrin-oligonucleotide conjugates |
| US5565552A (en) | 1992-01-21 | 1996-10-15 | Pharmacyclics, Inc. | Method of expanded porphyrin-oligonucleotide conjugate synthesis |
| US5639873A (en) | 1992-02-05 | 1997-06-17 | Centre National De La Recherche Scientifique (Cnrs) | Oligothionucleotides |
| US5633360A (en) | 1992-04-14 | 1997-05-27 | Gilead Sciences, Inc. | Oligonucleotide analogs capable of passive cell membrane permeation |
| US5304487A (en) | 1992-05-01 | 1994-04-19 | Trustees Of The University Of Pennsylvania | Fluid handling in mesoscale analytical devices |
| US6660517B1 (en) | 1992-05-01 | 2003-12-09 | Trustees Of The University Of Pennsylvania | Mesoscale polynucleotide amplification devices |
| US5434257A (en) | 1992-06-01 | 1995-07-18 | Gilead Sciences, Inc. | Binding compentent oligomers containing unsaturated 3',5' and 2',5' linkages |
| US5610300A (en) | 1992-07-01 | 1997-03-11 | Ciba-Geigy Corporation | Carbocyclic nucleosides containing bicyclic rings, oligonucleotides therefrom, process for their preparation, their use and intermediates |
| US5700920A (en) | 1992-07-01 | 1997-12-23 | Novartis Corporation | Carbocyclic nucleosides containing bicyclic rings, oligonucleotides therefrom, process for their preparation, their use and intermediates |
| US5272250A (en) | 1992-07-10 | 1993-12-21 | Spielvogel Bernard F | Boronated phosphoramidate compounds |
| US5273633A (en) | 1992-07-10 | 1993-12-28 | Tiansong Wang | Capillary multireflective cell |
| US5351678A (en) | 1992-09-01 | 1994-10-04 | Citation Medical Corporation | Endoscope scope assembly for full hemisphere view |
| US5426505A (en) | 1992-11-25 | 1995-06-20 | Ciba-Geigy Corporation | Interferometric apparatus for monitoring changes of the refractive index of fluid samples in capillary tubes |
| US5574142A (en) | 1992-12-15 | 1996-11-12 | Microprobe Corporation | Peptide linkers for improved oligonucleotide delivery |
| US5309330A (en) | 1993-01-11 | 1994-05-03 | Citation Medical Corporation | Light box |
| US5476925A (en) | 1993-02-01 | 1995-12-19 | Northwestern University | Oligodeoxyribonucleotides including 3'-aminonucleoside-phosphoramidate linkages and terminal 3'-amino groups |
| US5466677A (en) | 1993-03-06 | 1995-11-14 | Ciba-Geigy Corporation | Dinucleoside phosphinates and their pharmaceutical compositions |
| US5636017A (en) | 1993-03-18 | 1997-06-03 | Ciba-Geigy Corporation | Optical detection arrangement for small volume chemical analysis of fluid samples |
| US5576427A (en) | 1993-03-30 | 1996-11-19 | Sterling Winthrop, Inc. | Acyclic nucleoside analogs and oligonucleotide sequences containing them |
| US5663312A (en) | 1993-03-31 | 1997-09-02 | Sanofi | Oligonucleotide dimers with amide linkages replacing phosphodiester linkages |
| US5479257A (en) | 1993-04-05 | 1995-12-26 | Olympus Optical Co., Ltd. | Method of and apparatus for detecting object position using a fourier transform of the object image and processing system using the same |
| US5663790A (en) | 1993-04-08 | 1997-09-02 | Pharmacia Biosensor Ab | Method and apparatus for determination of refractive index |
| US5658873A (en) | 1993-04-10 | 1997-08-19 | Degussa Aktiengesellschaft | Coated sodium percarbonate particles, a process for their production and detergent, cleaning and bleaching compositions containing them |
| US5539082A (en) | 1993-04-26 | 1996-07-23 | Nielsen; Peter E. | Peptide nucleic acids |
| US5456885A (en) | 1993-07-12 | 1995-10-10 | Coleman; Charles M. | Fluid collection, separation and dispensing tube |
| US5995645A (en) | 1993-08-18 | 1999-11-30 | Applied Spectral Imaging Ltd. | Method of cancer cell detection |
| US5485312A (en) | 1993-09-14 | 1996-01-16 | The United States Of America As Represented By The Secretary Of The Air Force | Optical pattern recognition system and method for verifying the authenticity of a person, product or thing |
| US5502177A (en) | 1993-09-17 | 1996-03-26 | Gilead Sciences, Inc. | Pyrimidine derivatives for labeled binding partners |
| US5456245A (en) | 1993-09-20 | 1995-10-10 | Sofamor Danek Properties, Inc. | Flexible endoscope probe and method of manufacture |
| US5633708A (en) | 1993-11-08 | 1997-05-27 | Svendsen; David A. | Apparatus for measuring refractive index |
| US5719262A (en) | 1993-11-22 | 1998-02-17 | Buchardt, Deceased; Ole | Peptide nucleic acids having amino acid side chains |
| US5457187A (en) | 1993-12-08 | 1995-10-10 | Board Of Regents University Of Nebraska | Oligonucleotides containing 5-fluorouracil |
| US5446137B1 (en) | 1993-12-09 | 1998-10-06 | Behringwerke Ag | Oligonucleotides containing 4'-substituted nucleotides |
| US5446137A (en) | 1993-12-09 | 1995-08-29 | Syntex (U.S.A.) Inc. | Oligonucleotides containing 4'-substituted nucleotides |
| US5519134A (en) | 1994-01-11 | 1996-05-21 | Isis Pharmaceuticals, Inc. | Pyrrolidine-containing monomers and oligomers |
| US5631734A (en) | 1994-02-10 | 1997-05-20 | Affymetrix, Inc. | Method and apparatus for detection of fluorescently labeled materials |
| WO1995022058A1 (en) | 1994-02-10 | 1995-08-17 | Affymax Technologies N.V. | Method and apparatus for detection of fluorescently labeled materials |
| US5599928A (en) | 1994-02-15 | 1997-02-04 | Pharmacyclics, Inc. | Texaphyrin compounds having improved functionalization |
| US5633312A (en) | 1994-02-28 | 1997-05-27 | Toshiba Silicone Co., Ltd. | Process for preparing polyorganosilane |
| WO1995025116A1 (en) | 1994-03-16 | 1995-09-21 | California Institute Of Technology | Method and apparatus for performing multiple sequential reactions on a matrix |
| US5596091A (en) | 1994-03-18 | 1997-01-21 | The Regents Of The University Of California | Antisense oligonucleotides comprising 5-aminoalkyl pyrimidine nucleotides |
| US5627053A (en) | 1994-03-29 | 1997-05-06 | Ribozyme Pharmaceuticals, Inc. | 2'deoxy-2'-alkylnucleotide containing nucleic acid |
| US5698518A (en) | 1994-03-30 | 1997-12-16 | Oklahoma Medical Research Foundation | Method for regulating inflammation and tumor growth with calmodulin, calmodulin analogues or calmodulin antagonists |
| US5625050A (en) | 1994-03-31 | 1997-04-29 | Amgen Inc. | Modified oligonucleotides and intermediates useful in nucleic acid therapeutics |
| US5613013A (en) | 1994-05-13 | 1997-03-18 | Reticula Corporation | Glass patterns in image alignment and analysis |
| US5525711A (en) | 1994-05-18 | 1996-06-11 | The United States Of America As Represented By The Secretary Of The Department Of Health And Human Services | Pteridine nucleotide analogs as fluorescent DNA probes |
| US5593839A (en) | 1994-05-24 | 1997-01-14 | Affymetrix, Inc. | Computer-aided engineering system for design of sequence arrays and lithographic masks |
| US5597696A (en) | 1994-07-18 | 1997-01-28 | Becton Dickinson And Company | Covalent cyanine dye oligonucleotide conjugates |
| US5485277A (en) | 1994-07-26 | 1996-01-16 | Physical Optics Corporation | Surface plasmon resonance sensor and methods for the utilization thereof |
| US5580731A (en) | 1994-08-25 | 1996-12-03 | Chiron Corporation | N-4 modified pyrimidine deoxynucleotides and oligonucleotide probes synthesized therewith |
| US5591584A (en) | 1994-08-25 | 1997-01-07 | Chiron Corporation | N-4 modified pyrimidine deoxynucleotides and oligonucleotide probes synthesized therewith |
| US5597909A (en) | 1994-08-25 | 1997-01-28 | Chiron Corporation | Polynucleotide reagents containing modified deoxyribose moieties, and associated methods of synthesis and use |
| US5578832A (en) | 1994-09-02 | 1996-11-26 | Affymetrix, Inc. | Method and apparatus for imaging a sample on a device |
| US5781304A (en) | 1994-09-19 | 1998-07-14 | Textron Systems Corporation | Laser ultrasonics-based material analysis system and method |
| US5922594A (en) | 1994-09-26 | 1999-07-13 | Biacore Ab | Method of producing bilayer lipid membranes |
| EP0721016A2 (en) | 1994-10-21 | 1996-07-10 | Affymax Technologies N.V. | Nucleic acid library arrays, methods for synthesizing them and methods for sequencing and sample screening using them |
| US5953439A (en) | 1994-11-04 | 1999-09-14 | Ishihara; Ken | Apparatus for and method of extracting time series image information |
| US5817462A (en) | 1995-02-21 | 1998-10-06 | Applied Spectral Imaging | Method for simultaneous detection of multiple fluorophores for in situ hybridization and multicolor chromosome painting and banding |
| EP0728520A1 (en) | 1995-02-27 | 1996-08-28 | Affymax Technologies N.V. | Printing molecular library arrays |
| US5599695A (en) | 1995-02-27 | 1997-02-04 | Affymetrix, Inc. | Printing molecular library arrays using deprotection agents solely in the vapor phase |
| US5915034A (en) | 1995-05-02 | 1999-06-22 | Yamatake-Honeywell, Co., Ltd. | Pattern collation apparatus based on spatial frequency characteristics |
| WO1997002357A1 (en) | 1995-06-29 | 1997-01-23 | Affymetrix, Inc. | Integrated nucleic acid diagnostic device |
| US5740291A (en) | 1995-10-13 | 1998-04-14 | The University Of Western Ontario | Fiber optic sensor for sensing particle movement in a catalytic reactor |
| US20030087099A1 (en) | 1995-11-17 | 2003-05-08 | Massachusetts Institute Of Technology | Poly(ethylene oxide) coated surfaces |
| EP0785280A2 (en) | 1995-11-29 | 1997-07-23 | Affymetrix, Inc. (a California Corporation) | Polymorphism detection |
| WO1997027317A1 (en) | 1996-01-23 | 1997-07-31 | Affymetrix, Inc. | Nucleic acid analysis techniques |
| US5712321A (en) | 1996-02-01 | 1998-01-27 | Dymax Corporation | Dual-curing coating formulation and method |
| WO1997029212A1 (en) | 1996-02-08 | 1997-08-14 | Affymetrix, Inc. | Chip-based speciation and phenotypic characterization of microorganisms |
| US5804453A (en) | 1996-02-09 | 1998-09-08 | Duan-Jun Chen | Fiber optic direct-sensing bioprobe using a phase-tracking approach |
| US5815258A (en) | 1996-02-15 | 1998-09-29 | Shimadzu Corporation | Liquid sample cell for an optical measurement apparatus |
| EP0799797A1 (en) | 1996-04-03 | 1997-10-08 | UNITECHNIK-THURNER Anlagenbaugesellschaft mbH | Continuous process for the production of precipitated calcium carbonate |
| US5841914A (en) | 1996-04-17 | 1998-11-24 | Motorola, Inc. | Molecular detection apparatus and method using optical waveguide detection |
| US5867266A (en) | 1996-04-17 | 1999-02-02 | Cornell Research Foundation, Inc. | Multiple optical channels for chemical analysis |
| US5928627A (en) | 1996-04-19 | 1999-07-27 | The Dow Chemical Company | Fluorescent chelates as visual tissue specific imaging agents |
| US5659318A (en) | 1996-05-31 | 1997-08-19 | California Institute Of Technology | Interferometric SAR processor for elevation |
| US5824204A (en) | 1996-06-27 | 1998-10-20 | Ic Sensors, Inc. | Micromachined capillary electrophoresis device |
| US5694210A (en) | 1996-06-28 | 1997-12-02 | The Board Of Trustees Of The University Of Illinois | Multi-purpose sensor system and sensing method using internally reflected light beams |
| US6108458A (en) | 1996-07-03 | 2000-08-22 | Massachusetts Institute Of Technology | Sparse array image correlation |
| US5852495A (en) | 1996-07-16 | 1998-12-22 | Caliper Technologies Corporation | Fourier detection of species migrating in a microchannel |
| US5770029A (en) | 1996-07-30 | 1998-06-23 | Soane Biosciences | Integrated electrophoretic microdevices |
| US20030148922A1 (en) | 1997-04-04 | 2003-08-07 | Caliper Technologies Corp. | Closed-loop biochemical analyzers |
| US5976336A (en) | 1997-04-25 | 1999-11-02 | Caliper Technologies Corp. | Microfluidic devices incorporating improved channel geometries |
| US6130439A (en) | 1997-07-30 | 2000-10-10 | Delegation Generale Pour L'armement | Instrument for measuring the refractive index of a fluid |
| FR2766922A1 (en) | 1997-07-30 | 1999-02-05 | France Etat | INSTRUMENT FOR MEASURING THE REFRACTION INDEX OF A FLUID |
| US6008378A (en) | 1997-10-21 | 1999-12-28 | The Regents Of The University Of California | Synthetic molecules that specifically react with target sequences |
| US6054271A (en) | 1997-10-21 | 2000-04-25 | The Regents Of The University Of California | Methods of using synthetic molecules and target sequences |
| US6451569B1 (en) | 1997-10-21 | 2002-09-17 | The Regents Of The University Of California | Synthetic molecules that specifically react with target sequences |
| US5932474A (en) | 1997-10-21 | 1999-08-03 | The Regents Of The University Of California | Target sequences for synthetic molecules |
| US6118536A (en) | 1997-11-14 | 2000-09-12 | Jasco Corporation | Circular dichroism detector for HPLC |
| US6321791B1 (en) | 1998-01-20 | 2001-11-27 | Caliper Technologies Corp. | Multi-layer microfluidic devices |
| US6167910B1 (en) | 1998-01-20 | 2001-01-02 | Caliper Technologies Corp. | Multi-layer microfluidic devices |
| US6493090B1 (en) | 1998-01-23 | 2002-12-10 | Torsana A/S | Detection of a substance by refractive index change |
| US20020002353A1 (en) | 1998-01-30 | 2002-01-03 | Advanced Cardiovascular Systems, Inc. | Therapeutic, diagnostic, or hydrophilic coating for an intracorporeal medical device |
| US6529279B2 (en) | 1998-02-23 | 2003-03-04 | Zygo Corporation | Interferometer and method for measuring the refractive index and optical path length effects of air |
| US6251343B1 (en) | 1998-02-24 | 2001-06-26 | Caliper Technologies Corp. | Microfluidic devices and systems incorporating cover layers |
| US20030020915A1 (en) | 1998-03-23 | 2003-01-30 | Schueller Olivier J. A. | Optical modulator/detector based on reconfigurable diffraction grating |
| US20070012777A1 (en) | 1998-03-24 | 2007-01-18 | Tsikos Constantine J | Planar laser illumination and imaging (PLIIM) systems with integrated despeckling mechanisms provided therein |
| US6123798A (en) | 1998-05-06 | 2000-09-26 | Caliper Technologies Corp. | Methods of fabricating polymeric structures incorporating microscale fluidic elements |
| US6559947B1 (en) | 1998-08-28 | 2003-05-06 | Wallesley International C.V. | Reference fringe counting fourier transform spectroscopy |
| US20040218184A1 (en) | 1999-01-25 | 2004-11-04 | Amnis Corporation | Imaging platform for nanoparticle detection applied to SPR biomolecular interaction analysis |
| US20020034580A1 (en) | 1999-03-08 | 2002-03-21 | Caliper Technologies Corp. | Surface coating for microfluidic devices that incorporate a biopolymer resistant moiety |
| US6322683B1 (en) | 1999-04-14 | 2001-11-27 | Caliper Technologies Corp. | Alignment of multicomponent microfabricated structures |
| US20020128234A1 (en) | 1999-04-28 | 2002-09-12 | Hubbell Jeffrey A. | Multifunctional polymeric surface coatings in analytic and sensor devices |
| US6480282B1 (en) | 1999-05-06 | 2002-11-12 | University Of Washington | Capillary surface plasmon resonance sensors and multisensors |
| US6533914B1 (en) | 1999-07-08 | 2003-03-18 | Shaorong Liu | Microfabricated injector and capillary array assembly for high-resolution and high throughput separation |
| US6381925B2 (en) | 1999-07-27 | 2002-05-07 | Mars, Incorporated | Method for forming a compressed grouping of objects |
| EP1210581A1 (en) | 1999-08-19 | 2002-06-05 | Texas Tech University Health Sciences Center | Interferometric detection system and method |
| US6381025B1 (en) | 1999-08-19 | 2002-04-30 | Texas Tech University | Interferometric detection system and method |
| WO2001014858A1 (en) | 1999-08-19 | 2001-03-01 | Texas Tech University Health Sciences Center | Interferometric detection system and method |
| US7172897B2 (en) | 2000-01-11 | 2007-02-06 | Clinical Micro Sensors, Inc. | Devices and methods for biochip multiplexing |
| US7045171B2 (en) | 2000-03-23 | 2006-05-16 | Corning Incorporated | Method for fabricating supported bilayer-lipid membranes |
| US20010045358A1 (en) | 2000-03-27 | 2001-11-29 | Kopf-Sill Anne R. | Ultra high throughput microfluidic analytical systems and methods |
| US20020022603A1 (en) | 2000-04-07 | 2002-02-21 | Lichtenberger Lenard M. | Unique compositions of zwitterionic phospholipids and bisphosphonates and use of the compositions as bisphosphate delivery systems with reduced GI toxicity |
| US20010050821A1 (en) | 2000-04-11 | 2001-12-13 | Gunter Bickleder | System for geometric beam shaping of a light beam profile |
| US20040058058A1 (en) | 2000-04-12 | 2004-03-25 | Shchegolikhin Alexander Nikitovich | Raman-active taggants and thier recognition |
| US6532061B2 (en) | 2000-08-25 | 2003-03-11 | Amnis Corporation | Measuring the velocity of small moving objects such as cells |
| US6760103B2 (en) | 2000-09-06 | 2004-07-06 | Metso Automation Oy | Measurement of paper or board |
| US20020057432A1 (en) | 2000-10-12 | 2002-05-16 | Amnis Corporation | Multipass cavity for illumination and excitation of moving objects |
| US20070054339A1 (en) | 2000-10-30 | 2007-03-08 | Sru Biosystems, Inc. | Label-free methods for performing assays using a colorimetric resonant reflectance optical biosensor |
| US7202076B2 (en) | 2000-10-30 | 2007-04-10 | Sru Biosystems, Inc. | Label-free high-throughput optical technique for detecting biomolecular interactions |
| US7300803B2 (en) | 2000-10-30 | 2007-11-27 | Sru Biosystems, Inc. | Label-free methods for performing assays using a colorimetric resonant reflectance optical biosensor |
| US20050227374A1 (en) | 2000-10-30 | 2005-10-13 | Sru Biosystems, Inc. | Label-free high-throughput optical technique for detecting biomolecular interactions |
| US6576430B1 (en) | 2000-11-20 | 2003-06-10 | Becton, Dickinson And Company | Detection of ligands by refractive surface methods |
| US20020094528A1 (en) | 2000-11-29 | 2002-07-18 | Salafsky Joshua S. | Method and apparatus using a surface-selective nonlinear optical technique for detection of probe-target interations |
| US6744950B2 (en) | 2001-01-18 | 2004-06-01 | Veridian Systems | Correlators and cross-correlators using tapped optical fibers |
| US20020135772A1 (en) | 2001-01-25 | 2002-09-26 | Bornhop Darryl J. | Universal detector for biological and chemical separations or assays using plastic microfluidic devices |
| WO2002059579A1 (en) | 2001-01-25 | 2002-08-01 | Texas Tech University | Universal detector for biological and chemical separations or assays using plastic microfluidic devices |
| US6809828B2 (en) | 2001-01-25 | 2004-10-26 | Texas Tech University | Universal detector for biological and chemical separations or assays using plastic microfluidic devices |
| US20020155625A1 (en) | 2001-04-18 | 2002-10-24 | Chapman Robert G. | Method and apparatus for detection of molecular events using temperature control of detection environment |
| US20040115721A1 (en) | 2001-06-26 | 2004-06-17 | Guoqiang Mao | Functional surface coating |
| US20090135421A1 (en) | 2001-07-25 | 2009-05-28 | Applera Corporation | System for detecting markers |
| US6798509B2 (en) | 2001-08-20 | 2004-09-28 | Hitachi, Ltd. | Methods and instruments for fluorescence detection |
| US20030129579A1 (en) | 2001-09-04 | 2003-07-10 | Bornhop Darryl J. | Multi-use multimodal imaging chelates |
| US20030082516A1 (en) | 2001-09-06 | 2003-05-01 | Don Straus | Rapid detection of replicating cells |
| US6980299B1 (en) | 2001-10-16 | 2005-12-27 | General Hospital Corporation | Systems and methods for imaging a sample |
| US20050083505A1 (en) | 2001-10-18 | 2005-04-21 | Walter Augustyn | System and method for laser beam expansion |
| US20030099598A1 (en) | 2001-10-22 | 2003-05-29 | Kiefer Gary E. | Tissue specific fluorescent chelates possessing long wavelength UV excitation |
| US6962690B2 (en) | 2001-10-22 | 2005-11-08 | Dow Global Technologies Inc. | Tissue specific fluorescent chelates possessing long wavelength UV excitation |
| US20050106570A1 (en) | 2002-04-03 | 2005-05-19 | Japan Science And Technology Agency | Biochip sensor surface carrying polyethylene glycolated nanoparticles |
| US20060183700A1 (en) | 2002-05-06 | 2006-08-17 | Noxxon Pharma Ag | Cgrp binding nucleic acids |
| US20040241765A1 (en) | 2002-06-17 | 2004-12-02 | Zweig Stephen Eliot | Membrane receptor reagent and assay |
| US6741361B2 (en) | 2002-06-24 | 2004-05-25 | Lightgage, Inc. | Multi-stage data processing for frequency-scanning interferometer |
| US20070030481A1 (en) | 2002-07-10 | 2007-02-08 | E2V Technologies (Uk) Limited | Molecular detector arrangement |
| US7011948B2 (en) | 2002-07-17 | 2006-03-14 | Mds Sciex | Detection of ligand-antiligand complex formation by electromagnetically detectable bulk property measurement |
| US20050019956A1 (en) | 2002-07-30 | 2005-01-27 | Peter Martin | Optical sensor and methods for measuring molecular binding interactions |
| US20050175273A1 (en) | 2002-08-02 | 2005-08-11 | Kazuhiro Iida | Microchip, method of manufacturing microchip, and method of detecting compositions |
| WO2004023115A1 (en) | 2002-09-05 | 2004-03-18 | Texas Tech University System | Refractive index determination by micro interferometric reflection detection |
| US20060012800A1 (en) | 2002-09-05 | 2006-01-19 | Bornhop Darryl J | Refractive index determination by micro interferometric reflection detection |
| US7130060B2 (en) | 2002-09-05 | 2006-10-31 | Texas Tech University System | Refractive index determination by micro interferometric reflection detection |
| US20050244863A1 (en) | 2002-09-19 | 2005-11-03 | The Chancellor, Master And Scholars Of The University Of Oxford | Molecular arrays and single molecule detection |
| US20040110276A1 (en) | 2002-12-04 | 2004-06-10 | International Business Machines Corporation | Surface treatment |
| US20050004348A1 (en) | 2002-12-23 | 2005-01-06 | Miyamoto Ken-Ichi | Novel type II Na/Pi cotransporters and type II Na/Pi cotransporter expression regulatory factors |
| US20070195321A1 (en) | 2002-12-23 | 2007-08-23 | Francoise Soussaline | Chip reader for biochips and associated methods |
| US20060263777A1 (en) | 2003-01-27 | 2006-11-23 | Tong William G | Sensitive sensing based on optical optical nonlinear wave mixing |
| US20060275179A1 (en) | 2003-05-21 | 2006-12-07 | Centre National De La Recherche Scientifique | Microfluidic device |
| US20050014179A1 (en) | 2003-06-06 | 2005-01-20 | Biacore Ab | Method and system for determination of molecular interaction parameters |
| US7173986B2 (en) | 2003-07-23 | 2007-02-06 | Ali Corporation | Nonlinear overlap method for time scaling |
| US20050264819A1 (en) | 2003-08-04 | 2005-12-01 | Carl Zeiss Smt Ag | Device for the range-resolved determination of scattered light, operating method, illumination mask and image-field mask |
| US20050190372A1 (en) | 2003-08-14 | 2005-09-01 | Aristide Dogariu | Interferometric sensor for characterizing materials |
| EP1746385A1 (en) | 2004-04-22 | 2007-01-24 | The University of Electro-Communications | Small displacement measuring method and instrument |
| US20080248502A1 (en) | 2004-04-28 | 2008-10-09 | Eisai R&D Management Co., Ltd. | Methods For Detecting Th1 Cells |
| US20060012777A1 (en) | 2004-07-13 | 2006-01-19 | Talbot Nicholas C | Combination laser system and global navigation satellite system |
| US20060039004A1 (en) | 2004-08-06 | 2006-02-23 | The General Hospital Corporation | Process, system and software arrangement for determining at least one location in a sample using an optical coherence tomography |
| US20080259313A1 (en) | 2004-08-19 | 2008-10-23 | Berndt Klaus W | Apparatus for Performing Optical Measurements on Blood Culture Bottles |
| CA2584824A1 (en) | 2004-10-22 | 2006-05-04 | Vanderbilt University | On-chip polarimetry for high-throughput screening of nanoliter and smaller sample volumes |
| WO2006047408A2 (en) | 2004-10-22 | 2006-05-04 | Vanderbilt University | On-chip polarimetry for high-throughput screening of nanoliter and smaller sample volumes |
| US8134707B2 (en) | 2004-10-22 | 2012-03-13 | Vanderbilt University | On-chip polarimetry for high-throughput screening of nanoliter and smaller sample volumes |
| EP1805498A2 (en) | 2004-10-22 | 2007-07-11 | Vanderbilt University | On-chip polarimetry for high-throughput screening of nanoliter and smaller sample volumes |
| US20080160187A1 (en) | 2004-12-17 | 2008-07-03 | Central Glass Company, Limited | Antifog Article, Method for Producing Same, and Coating Material for Forming Antifog Coating Film |
| US20060147379A1 (en) | 2005-01-03 | 2006-07-06 | Bornhop Darryl J | Targeted, NIR imaging agents for therapy efficacy monitoring, deep tissue disease demarcation and deep tissue imaging |
| US20060256343A1 (en) | 2005-01-20 | 2006-11-16 | Michael Choma | Methods, systems and computer program products for characterizing structures based on interferometric phase data |
| US20060275825A1 (en) | 2005-04-12 | 2006-12-07 | Sru Biosystems, Inc. | Proteolipid membrane and lipid membrane biosensor |
| US20070030841A1 (en) | 2005-05-12 | 2007-02-08 | Lee Richard M | System and methods for IP and VoIP device location determination |
| US20060268260A1 (en) | 2005-05-31 | 2006-11-30 | Nanyang Technological University | Cell analysis using laser with external cavity |
| WO2007002178A2 (en) | 2005-06-21 | 2007-01-04 | The Government Of The United States Of America As Represented By The Secretary Of The Department Of Health And Human Services | Methods, immunoassays and devices for detection of anti-lipoidal antibodies |
| US20090325199A1 (en) | 2005-08-02 | 2009-12-31 | University Of Maryland Biotechnology Institute | Nanostructures for polarized imaging and receptor/ligan quantization: breaking the diffraction limit for imaging |
| US20070048747A1 (en) | 2005-09-01 | 2007-03-01 | Leslie Thomas M | Methods for assaying analytes |
| US20090155832A1 (en) | 2005-10-28 | 2009-06-18 | Lo Yu-Hwa | Apparatus and Method for Improved Optical Detection of Particles in Fluid |
| US20070146888A1 (en) | 2005-12-22 | 2007-06-28 | Palo Alto Research Center Incorporated | Propagating light to be sensed |
| US20070202495A1 (en) | 2006-02-06 | 2007-08-30 | Michael Mayer | Use of resistive-pulse sensing with submicrometer pores or nanopores for the detection of the assembly of submicrometer or nanometer sized objects |
| US20090009759A1 (en) | 2006-05-12 | 2009-01-08 | Vadim Backman | Systems, methods and apparatuses of elastic light scattering spectroscopy and low coherence enhanced backscattering spectroscopy |
| US20080182239A1 (en) | 2007-01-26 | 2008-07-31 | Mullinax Rebecca L | Methods, Compositions, and Kits for Detection of microRNA |
| US20080186488A1 (en) | 2007-02-05 | 2008-08-07 | Palo Alto Research Center Incorporated | Distinguishing objects |
| US20080194723A1 (en) | 2007-02-12 | 2008-08-14 | Hwang Jing-Zhong | Ambient Temperature Curable Hydrophilic PU Oligomer, Method for Synthesizing the same and Surface Treatment Method of using the same |
| US20100210029A1 (en) | 2007-04-27 | 2010-08-19 | The Regents Of The University Of California | Device and methods of detection of airborne agents |
| US20090147264A1 (en)* | 2007-04-30 | 2009-06-11 | The University Of Pittsburgh - Of The Commonwealth System Of Higher Education | Label-free, real-time detection system for molecular interaction analysis |
| US20090103091A1 (en) | 2007-05-18 | 2009-04-23 | Jones Richard D | interferometric detection system and method |
| WO2008144496A1 (en) | 2007-05-18 | 2008-11-27 | Vanderbilt University | Improved interferometric detection system and method |
| US7835013B2 (en) | 2007-05-18 | 2010-11-16 | Vanderbilt University | Interferometric detection system and method |
| EP2160590A1 (en) | 2007-05-18 | 2010-03-10 | Vanderbilt University | Improved interferometric detection system and method |
| WO2009039466A1 (en) | 2007-09-20 | 2009-03-26 | Vanderbilt University | Free solution measurement of molecular interactions by backscattering interferometry |
| US8445217B2 (en) | 2007-09-20 | 2013-05-21 | Vanderbilt University | Free solution measurement of molecular interactions by backscattering interferometry |
| US20130309661A1 (en) | 2007-09-20 | 2013-11-21 | Vanderbilt University | Free solution measurement of molecular interactions by backscattering interferometry |
| US20120015376A1 (en) | 2007-09-20 | 2012-01-19 | Vanderbilt University | Free Solution Measurement Of Molecular Interactions By Backscattering Interferometry |
| US8673827B1 (en) | 2007-11-28 | 2014-03-18 | Los Alamos National Security, Llc | Method of analysis of polymerizable monomeric species in a complex mixture |
| US20110155927A1 (en) | 2007-12-04 | 2011-06-30 | Particle Measuring Systems, Inc. | Non-Orthogonal Particle Detection Systems and Methods |
| US8120777B2 (en) | 2007-12-10 | 2012-02-21 | Molecular Sensing, Inc. | Temperature-stable interferometer |
| US20090185190A1 (en) | 2007-12-10 | 2009-07-23 | Molecular Sensing, Inc. | Temperature-stable interferometer |
| US20130224886A1 (en) | 2008-01-16 | 2013-08-29 | Nippon Telegraph And Telephone Corporation | Flow rate measurement apparatus, antigen concentration measurement apparatus, flow cell, flow rate measurement method, and antigen concentration measurement method |
| US20110045993A1 (en)* | 2008-02-05 | 2011-02-24 | Nigel Kent | Microfluidic device for assessing object/test material interactions |
| US20100099203A1 (en) | 2008-10-03 | 2010-04-22 | Molecular Sensing, Inc. | Substrates with surfaces modified with PEG |
| US20100184056A1 (en) | 2009-01-12 | 2010-07-22 | Molecular Sensing, Inc. | Sample collection and measurement in a single container by back scattering interferometry |
| EP2386060A2 (en) | 2009-01-12 | 2011-11-16 | Molecular Sensing, Inc. | Sample collection and measurement in a single container by back scattering interferometry |
| US20100188665A1 (en) | 2009-01-12 | 2010-07-29 | Molecular Sensing, Inc. | Methods and systems for interferometric analysis |
| WO2010080710A2 (en) | 2009-01-12 | 2010-07-15 | Molecular Sensing, Inc. | Sample collection and measurement in a single container by back scattering interferometry |
| US20100191482A1 (en) | 2009-01-26 | 2010-07-29 | Canon U.S. Life Sciences, Inc. | Microfluidic flow monitoring |
| WO2010129494A2 (en) | 2009-05-04 | 2010-11-11 | Oregon Health & Science University | Method and apparatus for quantitative imaging of blood perfusion in living tissue |
| US8450118B2 (en) | 2009-05-04 | 2013-05-28 | Molecular Sensing, Inc. | Method for detecting binding interactions between membrane proteins and analytes in a homogenous assay |
| US20110109907A1 (en) | 2009-11-12 | 2011-05-12 | General Electric Company | Optical sensor system and method of sensing |
| US20110157692A1 (en) | 2009-12-30 | 2011-06-30 | National Sun Yat-Sen University | Objective-type dark-field illumination device for microfluidic channel |
| US9638632B2 (en) | 2010-06-11 | 2017-05-02 | Vanderbilt University | Multiplexed interferometric detection system and method |
| US20120019834A1 (en) | 2010-06-11 | 2012-01-26 | Bornhop Darryl J | Multiplexed interferometric detection system and method |
| WO2011156713A1 (en) | 2010-06-11 | 2011-12-15 | Vanderbilt University | Multiplexed interferometric detection system and method |
| US20130280715A1 (en) | 2010-10-13 | 2013-10-24 | Vanderbilt University | Methods, Systems and Compositions for Nucleic Acid Analysis Using Back-Scattering Interferometry |
| WO2012051429A1 (en) | 2010-10-13 | 2012-04-19 | Vanderbilt University | Methods, systems and compositions for nucleic acid analysis using back-scattering interferometry |
| US20120199742A1 (en) | 2010-11-16 | 2012-08-09 | 1087 Systems, Inc. | Single particle qcl-based mid-ir spectroscopy system with analysis of scattering |
| US9562853B2 (en) | 2011-02-22 | 2017-02-07 | Vanderbilt University | Nonaqueous backscattering interferometric methods |
| US20130021608A1 (en) | 2011-02-22 | 2013-01-24 | Bornhop Darryl J | Nonaqueous Backscattering Interferometric Methods |
| US20130040306A1 (en) | 2011-03-01 | 2013-02-14 | Darryl J. Bornhop | Backscattering interferometric analysis of membrane materials |
| US20140285803A1 (en) | 2011-06-23 | 2014-09-25 | Centre National De La Recherche Scientifique (Cnrs) | System and method of analysis by determining a depolarizing or dichroic character of an object |
| US9273949B2 (en) | 2012-05-11 | 2016-03-01 | Vanderbilt University | Backscattering interferometric methods |
| US20130301055A1 (en) | 2012-05-11 | 2013-11-14 | Vanderbilt University | Backscattering interferometric methods |
| US9990464B1 (en) | 2012-10-09 | 2018-06-05 | Pall Corporation | Label-free biomolecular interaction analysis using a rapid analyte dispersion injection method |
| US20160000329A1 (en) | 2013-02-20 | 2016-01-07 | Sloan-Kettering Institute For Cancer Research | Wide field raman imaging apparatus and associated methods |
| WO2015127298A1 (en) | 2014-02-20 | 2015-08-27 | Vanderbilt University | Physiologically-relevant affinity measurements in vitro with backscattering interferometry |
| US20160000239A1 (en) | 2014-07-03 | 2016-01-07 | Target Brands Inc. | Mattress display fixture |
| WO2017132483A1 (en) | 2016-01-29 | 2017-08-03 | Vanderbilt University | Free-solution response function interferometry |
| US20190033301A1 (en) | 2016-01-29 | 2019-01-31 | Vanderbilt University | Free-solution response function interferometry |
| US10627396B2 (en) | 2016-01-29 | 2020-04-21 | Vanderbilt University | Free-solution response function interferometry |
Non-Patent Citations (312)
| Title |
|---|
| Ababou et al., (2007) Survey of the year 2005: literature on applications of isothermal titration calorimetry. J. Mol. Recognit. |
| Abato P, "An enzymatic method for determining enantiomeric excess," Journal of the American Chemical Society, 123: 9206-9207 (2001). |
| Adams et al. (2013) The effect of hybridization-induced secondary structure alterations on RNA detection using backscattering. |
| Adanyi, et al., "Development of immunosensor based on OWLS technique for determining Aflatoxin B1 and Ochratoxin A," Biosens Bioe/ectron 22:797-802 (2007). |
| Ahlert J, et al., "The calicheamicin gene cluster and its iterative type I enediyne PKS," Science, 297: 1173-1176 (2002). |
| Alunni S, et al., "Mechanisms ofinhibition of phenylalanine ammonia-lyase by phenol inhibitors and phenol/glycine synergistic inhibitors," Archives of Biochemistry and Biophysics, 412: 170-175 (2003). |
| Anderson JR, et al., "Fabrication of topologically complex three-dimensional microfluidic systems in PDMS by rapid prototyping," Analytical Chemistry, 72: 3158-3164 (2000). |
| Andersson, et at., "TV sherography: quantitative measurement of shear-magnitude fields by use of digital speckle photography," Applied Optics, 39: 2565 (2000). |
| Anonymous (2001) The human genome. Unsung heroes. Science 291(5507): 1207. |
| Anuta, "Digital Registration of Multispectral Video Imagery," Society of Photooptical Instrumentation Engineers Journal, vol. 7:168 (1969). |
| Arnold F, et al., "Directed Enzyme Evolution," Methods in Molecular Biology, 230 (2003). |
| Arnold FH, "Design by directed evolution," Accounts of Chemical Research, 31: 125-131 (1998). |
| Bachmann BO, et al., "Kinetic mechanism of the β-lactam synthetase of Streptomyces clavuligerus," Biochemistry, 39: 11187-11193 (2000). |
| Bachmann O, et al., "Beta-Lcatam synthetase: A new biosynthetic enzyme," Proc. Nat. Acad. Sci. USA, 95: 9082-9086. |
| Bachmann O, et al., "β-Lcatam synthetase: A new biosynthetic enzyme," Proc. Nat. Acad. Sci. USA, 95: 9082-9086. |
| Baksh MM, et al., "Label-free quantification of membrane-ligand interactions using backscattering interferometry," Nature Biotechnology, 29: 357-360 (2011). |
| Baldino F, et al., "High-resolution in situ hybridization histochemistry," Methods Enzymol, 168: 761-777 (1989). |
| Betzig et al., (1993) Single Molecules Observed by near Field Scanning Optical Microscopy. Science 262(5138): 1422-1425. |
| Bobbitt DR, et al., "Direct and Indirect Polarimetry for Detection in Micro bore Liquid-Chromatography," Analytical Chemistry, 56: 1577-1581 (1984). |
| Boger, D.L. et al., Discovery of a Potent, Selective, and Efficacious Class of Reversible a-Ketoheterocycle Inhibitors of Fatty Acid Amide Hydrolase Effective as Analgesics. J Med Chem. 2005; 48(6):1849-56. |
| Borman S, "Combinatorial chemistry," Chemical & Engineering News, 80: 43 (2002). |
| Bornhop D.J. et al (2016) Elucidation of the signal origin for label-free, free-solution interactions, PNAS 113(34): E4931-E4932. |
| Bornhop DJ, et al., "Detection in Capillary Electrophoresis: A Review," Electrophoresis, 21: 1239-1250 (2000). |
| Bornhop DJ, et al., "Polarimetry in capillary dimensions," Analytical Chemistry, 68: 1677-1684 (1996). |
| Bornhop et al., Free-Solution, Label-Free Molecular Interactions Studief by Back-Scattering Interferometry. Science. 2007; 317(5845):1732-6. |
| Bornhop, "Microvolume index of refraction determinations by interferometric backscatter," Applied Optics, val. 34:3234-3239 (1995). |
| Bornhop, et al., "Free-Solution, Label-Free Molecular Interactions Studied by Back-Scattering Interferometry," Science, val. 317 No. 5485:1732-1736 (2007). |
| Bouchara, "Efficient algorithm for computation of the second-order moment of subpixel-edge position," Applied Optics, vol. 43:4550 (2004). |
| Bowen et al. (2003) "Gas phase detection of trinitrotoluene utilizing a solid-phase antibody immobilized on a gold film by means of surface plasmon resonance spectroscopy" Appl. Spectrosc. 57(8): 906-914. |
| Bracey, M.H. et al., Structural Adaptations in a Membrane Enzyme Thar Terminates Endocannabinoid Signaling. Science. 2002; 298(5599): 1793-6. |
| Brawer, et al., "Screening for prostatic carcinoma with prostate specific antigen," J. Ural., 147:841-845 (1992). |
| Bray P, et al., "Human cDNA clones for four species of G Alpha s signal transduction protein," Proc Natl Sci USA, 83: 8893-8897 (1986). Wrong author is specs—Bresleaur. |
| Brenan, et al., "High throughput, nanoliter quantitative PCR," Drug Discovery Today: Tech, 2:247-253 (2005). |
| Brockhaus et al., "Thermadynamic studies on the interaction of antibodies with β-amyloid peptide," J Phys Chem B, 111:1238-1243 (2007). |
| Brockman et al., "A Multistep Chemical Modification Procedure To Create DNA Arrays on Gold Surfaces for the Study of Protein-DNA Interactions with Surface Plasmon Resonance Imaging," J Am Chem Soc, vol. 121 issue 35:8044-8051 (1999). |
| Burggraf N, et al., "Holographic Refractive Index Detector for Application in Microchip-based Separation Systems," Analyst, 123: 1443-1447 (1998). |
| Burke et al., "Stopped-flow enzyme assays on a chip using a microfabricated mixer," Anal Chem, 75(8):1786-1791 (2003). |
| Buynak JD, et al., "7-alkylidenecephalosporin esters as inhibitors of human leukocyte elastase," J. Med. Chem., 40: 3423-3433 (1997). |
| Buynak JD, et al., "Synthesis and Mechanistic Evaluation of 7-Vinylidenecephem Sulfones as P-Lactamase Inhibitors," J. Am. Chem. Soc., 116: 10955-10965 (1994). |
| Buynak JD, et al., "The Synthesis and Beta-Lactamase Inhibitory Activity of 6-(Carboxymethylene)Penicillins and 7-(Carboxymethylene) Cephalosporins," Bioorg. Med. Chem. Lett., 5: 1513-1518 (1995). |
| Buynak JD, et al., "The Synthesis and β-Lactamase Inhibitory Activity of 6-(Carboxymethylene)Penicillins and 7-(Carboxymethylene) Cephalosporins," Bioorg. Med. Chem. Lett., 5: 1513-1518 (1995). |
| Campitelli et al., "Shear horizontal surface acoustic wave based immunosensing system," Int Conf on Solid State Sensors and Actuators, Jun. 16-19, 1:187-190 (1997). |
| Carl K. Fredrickson and Z. Hugh Fan, Macro-to-micro interfaces for microfluidic devices, Lab Chip, (2004), 4, 526-533. |
| Cecchi, A. et al., Carbonic Anhydrase Inhibitors: Inhibition of the Human Isozymes I, II, VA, and IX with a Library of Substituted Difluoromethanesulfonamides. Bioorg med Chem Lett. 2005; 15(23):5192-6. |
| Choquette et al., "Wavenumber Standards for Near-infrared Spectrometry," Handbook of Vibrational Spectroscopy, John M. Chalmers and Peter R. Griffiths (Editors), 2002, p. 1-7. |
| Cohen N, et al., "In vitro enzyme evolution: the screening challenge of isolating the one in a million," Trends in Biotechnology, 19: 507-510. |
| Collignon et al., "Automated multimodality image registration based on information theory", Information Processing in Medical Imaging (Y. Bizais, C. Barillot and R. Di Paola, eds.), Kluwer Academic Publishers, Dordrecht, pp. 263-274, (1995). |
| Cravatt, B.F. et al., Chemical Characterization of a Family of Brain Lipids That Induce Sleep. Science. 1995; 268(5216):1506-9. |
| Crooke ST, et al., "Pharmacokinetic properties of several novel oligonucleotide analogs in mice," J Pharmacol Exp Ther, 277: 923-937 (1996). |
| Day, Y.S.N. et al., Direct Comparison of Binding Equilibrium, Thermodynamic, and Rate Constants Determined by Surface- and Solution-Based Biophysical Methods. Protein Sci. 2002; 11(5):1017-25. |
| DeGrandpre, "Measurement of seawater pCO2 using a renewable-reagent fiber optic sensor with colorimetric detection," Anal. Chem., 65: 331-337 (1993). |
| Dendane et al., "Surface patterning of (bio)molecules onto the inner wall of fused-silica capillary tubes," Lab Chip, 8: 2161 (2008). |
| Deng Y, et al., "On-column Refractive-index detection Based on Retroreflected Beam Interference for Capillary Electrophoresis," Applied Optics, 37(6): 998-1005 (1998). |
| Devane, W.A. et al., Isolation and Structure of a Brain Constituent That Binds to the Cannabinoid Receptor. Science. 1992; 258(5090):1946-9. |
| Dickinson et al. (1996) A chemical-detecting system based on a crossreactive optical sensor array. Nature 382(6593):697-700. |
| Dissertation Defense Retrieved from http://calendar.vanderbilt.edu/calendar/2009/11/30/amanda-kathryn-kussrow-dissertation-defense.95024 on Dec. 22, 2013 p. 1. |
| Dotson SS, et al., "Development of the Ultra Small Volume Polarimeter," Manuscript, Vanderbilt University, 1-11. |
| Duffy DC, et al., "Rapid Prototyping of Microfluidic Systems in Poly(dimethylsiloxane)," Analytical Chemistry, 70: 4974-4984 (1998). |
| European Search Report and Written Opinion dated Feb. 12, 2020 by the European Patent Office for EP Application No. 17744954.3, filed on Jan. 27, 2017 and published as EP3408649 on Dec. 5, 2018 (Applicant—Vanderbilt University) (10 Pages). |
| Fan, et al., "Electrochemical interrogation of conformational changes as a reagentless method for the sequence-specific detection of DNA" Proc Natl Acad Sci U S A, 100(16): 9134-9137 (2003). |
| Fasman et al. (1970) Conformational Changes Associated with F-1 HistoneDeoxyribonucleic Acid Complexes—Circular Dichroism Studies. Biochemistry 9(14):2814-2822. |
| Final Office Action in U.S. Appl. No. 15/714,713, dated Jun. 16, 2020. |
| Finn MG, "Emerging methods for the rapid determination ofenantiomeric excess," Chirality, 14: 534-540 (2002). |
| Fintschenko Y, et al., "Silicon Microtechnology and Microstructures in Separation Science," Journal of Chromotography A, 819: 3-12 (1998). |
| Fixman, M. (1962) Radius of Gyration of Polymer Chains. II. Segment Density and Excluded Volume Effects. The Journal of Chemical Physics 36(12):3123-3129. |
| Fox SJ, et al., "Assay Innovations Vital to Improving HTS," Drug Discovery and Development, 40-43 (2000). |
| Fredrickson, C.K. and Fan, Z.H., Macro-to-Micro Interfaces for Microfluidic Devices. Lab Chip. 2004; 4(6):526-33. |
| Fricke-Begemann et al., "Speckle interferometry: three-dimensional deformation field measurement with a single interferogram," Applied Optics, vol. 40:5011 (2001). |
| Froestl, W. et al., Phosphinic Acid Analogs of GABA. 1. New Potent and Selective GABAB Agonists. J Med Chem. 1995; 38(17):3297-312. |
| Garfunkle, J. et al., Optimization of the Central Heterocycle of a-Ketoheterocycle Inhibitors of Fatty Acid Amide Hydrolase. J Med Chem. 2008; 51(15):4392-403. |
| Gavutis, et al., "Lateral ligand-receptor interaction on membranes probed by simultaneous fluorescence-interference detection," Biophysics Journal, 88(6): 4289-4302 (2005). |
| Gharagheizi et al. (2014) Group Contribution Model for the Prediction of Refractive Indices of Organic Compounds. J Chem Eng Data 59(6): 1930-1943. |
| Gibbs PR, et al., "Imaging polarimetry for high throughput chiral screening," Biotechnology Progress, 19: 1329-1334 (2003). |
| Gloge A, et al., "The behavior of substrate analogues and secondary deuterium isotope effects in the phenylalanine ammonia-lyase reaction," Archives of Biochemistry and Biophysics, 359: 1-7 (1998). |
| Golge A, et al., "Phenylalanine ammonia-lyase: The use of its broad substrate specificity for mechanistic investigations and biocatalysis—Synthesis of Larylalanines," Chemistry-a European Journal, 6: 3386-3390 (2000). |
| Grant CHE 0848788 awarded by the National Science Foundation. |
| Grant No. F49620-01-1-0429. |
| Grant No. R01 EB003537-01A2 awarded by National Institutes of Health. |
| Greisen, et al., "PCR primers and probes for the 16S rRNA gene of most species of pathogenic bacteria, including bacteria found in cerebrospinal fluid," J Clin Microbiol, 32:335-351 (1994). |
| Grosse A, et al., "Deep wet etching of fused silica glass for hollow capillary optical leaky waveguides in microfluidic devices," Journal of Micromechanics and Microengineering, 11: 257-262 (2001). |
| Guizar-Sicairos et al., "Efficient subpixel image registration algorithms," Optics Letters, vol. 33:156-158 (2008). |
| Guo JH, et al., "Measurement of enantiomeric excess by kinetic resolution and mass spectrometry," Angewandte Chemie-International Edition, 38: 1755-1758 (1999). |
| Harrison DJ, et al., "Capillary Electrophoresis and Sample Injection Systems Integrated on a Planar Glass Chip," Analytical Chemistry, 64: 1926-1932 (1992). |
| Harteveld et al., "Detection of Staphylococcal Enterotoxin B employing a piezoelectric crystal immunosensor," Biosens Bioelectron 12(7):661-667 (1997). |
| Heideman et al. (1993) Performance of a highly sensitive optical wave-guide Mach-Zehnder interferometer immunosensor, Sensors and Actuators B-Chemical 10(3): 209-217. |
| Heideman, et al., "Remote opto-chemical sensing with extreme sensitivity: design, fabrication and performance of a pigtailed integrated optical phase-modulated Mach-Zehnder interferometer system," Sensors and Actuators, B 61: 100-127 (1999). |
| Heikkinen H, et al., "Interpretation of interference signals in label free integrated interferometric biosensors," Proceedings of the SPIE, 6094: 60940P-1 (2006). |
| Hell SW & Wichmann J (1994) Breaking the diffraction resolution limit by stimulated emission: stimulated-emission-depletion fluorescence microscopy. Opt Lett 19(11):780-782). |
| Hodgins DS, "Yeast Phenylalanine Ammonia-Lyase—Purification, Properties, and Identification of Catalytically Essential Dehydroalanine," Journal of Biological Chemistry, 246: 2977 (1971). |
| Hofstetter O, et al., "Antibodies as chiral selectors for the determination of enantioenrichment," Enantiomer, 6: 153-158 (2001). |
| Horton et al., "Interference patterns of a plane-polarized wave from a hollow glass fiber," J Opt Soc Am, 63:1204-1210 (1973). |
| Hu et al. (2004) The mode of action of centrin—Binding of Ca2+ and a peptide fragment of Kar1 p to the C-terminal domain. J Biol Chem 279(49):50895-50903. |
| Hubbard et al., "Calmodulin binding by calcineurin," J Biol Chem 262(31):15062-15070 (1987). |
| Hudlicky TM, et al., "Microbial Oxidation of Aromatics in Enantiocontrolled Synthesis .1. Expedient and General AsymmetricSynthesis of Inositols and Carbohydrates Via an Unusual Oxidation of a Polarized Diene with Potassium Permanganate," J. Chem. Soc. Perkin Trans., 1: 1553-1567. |
| Huntley, "Speckle photography fringe analysis: assessment of current algorithms," Applied Optics, vol. 28:4316 (1989). |
| International Preliminary Reporton Patentability dated Jul. 31, 2018 by the International Searching Authority for International Application No. PCT/US2017/015296, filed on Jan. 27, 2017 and published as WO 2017/132483 on Aug. 3, 2017 (Applicant—Vanderbilt University) (6 Pages). |
| International Search Report and Written Opinion dated Apr. 26, 2006 for PCT/US2005/38168 filed Oct. 24, 2005 and published as WO 2006/047408 on May 4, 2006 (Applicants—Vanderbilt University// Inventors—Bornhop et al.) (7 pages). |
| International Search Report and Written Opinion dated Aug. 19, 2008 for US/PCT/2008/063879 filed May 16, 2008 and published as WO 2008/144496 on Nov. 27, 2008 (Applicant—Vanderbilt University// Inventors—Jones et al.) (11 pages). |
| International Search Report and Written Opinion dated Dec. 8, 2008 for PCT/US2008/077145 filed Sep. 20, 2008 and published as WO 2009/039466 on Mar. 26, 2009 (Applicant—Vanderbilt University // Inventors—Bornhop et al.) (9 pages). |
| International Search Report and Written Opinion dated Mar. 24, 2016 for International Patent Application No. PCT/US2016/014439, which was filed on Jan. 22, 2016(lnventor-Bornhop et al;Applicant-Vanderbilt University)(13 Pages). |
| International Search Report and Written Opinion dated Mar. 8, 2012 for PCT/US2011/056171 filed Oct. 13, 2011 and published as WO 2012/051429 on Apr. 19, 2012 (Applicants—Vanderbilt University // Inventors—Bornhop et al.) (8 pages). |
| International Search Report and Written Opinion dated May 25, 2017 by the International Searching Authority for International Application No. PCT/US2017/015296, filed on Jan. 27, 2017 and published as WO 2017/132483 on Aug. 3, 2017 (Applicant—Vanderbilt University) (9 Pages). |
| International Search Report and Written Opinion dated Oct. 5, 2011 for PCT/US2011/039982 filed Jun. 10, 2011 and published as WO 2011/156713 on Dec. 15, 2011 (Applicants—Vanderbilt University // Inventors—Bornhop et al.) (6 pages). |
| International Search Report and Written Opinion dated Sep. 30, 2010 for PCT/US2010/000047 filed Jan. 8, 2010 and published as WO 2010/080710 on Jul. 15, 2010 (Applicants—Molecular Sensing, Inc et al. // Inventors—Weinberger et al.) (7 pages). |
| Ivanov et al. (1974) The B to A transition of DNA in solution. J Mol Biol87(4):817-833. |
| Jacobson SC, et al., "Fused Quartz Substrates for Microchip Electrophoresis," Analytical Chemistry, 67: 2059-2063 (1995). |
| Jacobson SC, et al., "Microfluidic devices for electrokinetically driven parallel and serial mixing," Analytical Chemistry, 71: 4455-4459 (1995). |
| Jass, J. et al., From Liposomes to Supported, Planar Bilayer Structures on Hydrophilic and Hidrophobic Surfaces: an Atomic Force Microscopy Study. Biophys J. 2000; 79(6):3153-63. |
| Jepsen et al. (2015) Evaluation of back scatter interferometry, a method for detecting protein binding in solution. Analyst 140(3):895-901. |
| Jepsen S.T. (2016) Back Scatter Interferometric Sensor for Label-Free Medical Diagnostic Assays, Aalborg University (1-120 pages). |
| Jepsen S.T. et al., (2015) Evaluation of back scatter interferometry, a method for detecting protein binding in solution, Analyst, 140(3):895-901. |
| Jorgensen T.M. et al. (2015) Back scattering interferometry revisited—A theoretical and experimental investigation, Sensors and Actuators B 220 : 1328-1337. |
| Jung LS, et al., (1998) Quantitative Interpretation of the Response of Surface Plasmon Resonance Sensors to Adsorbed Films. Langmuir 14(19):5636-5648). |
| Kabanov AV, et al., "A new class of antivirals: antisense oligonucleotides combined with a hydrophobic substituent effectively inhibit influenza virus reproduction and synthesis of virus-specific proteins in MDCK cells," FEBS Letters, 259(2): 327-330 (1990). |
| Kalghatgi KK, et al., "Microbial L-phenylalanine ammonia-lyase. Purification, subunit structure and kinetic properties of the enzyme from Rhizoctonia sol ani," Biochemical Journal, 149: 65-75 (1975). |
| Kalinina, et al., "Nanoliter scale PCR with TaqMan detection," Nucleic Acid Research, 25(10):1999-2004 (1997). |
| Kaltashov et al. (2012) Advances and challenges in analytical characterization of biotechnology products: Mass spectrometry-based approaches to study properties and behavior of protein therapeutics. Biotechnol Adv 30(1):210-222. |
| Katritzky et al. (1998) Correlation and prediction of the refractive indices of polymers by QSPR. J Chem Inf Comp Sci 38(6): 1171-1176. |
| Kaupmann, K. et al., Expression Cloning of GABAB Receptors Uncovers Similarity to Metabotropic Gultamate Receptors. Nature. 1997; 386(6622):239-46. |
| Keen et al., "Rapid detection of single base mismatches as heteroduplexes on Hydrolilnk gels," Trends Genet., 7:5 (1991). |
| Kenmore CK, et al., "Refractive-index Detection by interferometric Backscatter in Packed-capillary High-performance Liquid Chromatography," Journal of Chromatography A, 762: 219-225 (1997). |
| Kerker M,e t al., "Scattering of Electomagnetic Waves from Concentric Infinite Cylinders,"Journal of the Optical Society of Americai,51: 506-508 (1961). |
| Khasnis D, et al., "Synthesis and Biological-Activity of 7-Alkylidenecephems," J. Med. Chem., 38: 1022-1034 (1995). |
| Klee et al., "Purification of cyclic 3′,5′-nucleotide phosphodiesterase inhibitory protein by affinity chromatography on activator protein couples to sepharose," Biochem 17:120-126 (1978). |
| Koradi et al. (1996) MOLMOL: A program for display and analysis of macromolecular structures. J Mol Graphics 14(1 ):51-55. |
| Korbel GA, et al., "Reaction microarrays: A method for rapidly determining the enantiomeric excess of thousands of samples," Journal of the American Chemical Society, 123: 361-362. |
| Kramer, M.N. et al., A Highly Compensated Interferometer for Biochemical Analysis. ACS Sens. 2018; 3:1546-52. |
| Kramer, M.N. et al., Longitudinal Pixel Averaging for Improved Compensation in Backscattering Interferometry. Opt Lett. 2018; 43(3):482-5. |
| Krummel, M.F. and Davis,M.M., Dynamics of the Immunological Synapse: Finding, Establishing and Solidifying a Connection. Curr Opin Immunol. 2002; 14(1):66-74. |
| Kuhlmann J, "Drug Research: From the Idea to the Product," International Journal of Clinical Pharmacology and Therapeutics, 541-552 (1997). |
| Kunkel TA, et al., "Rapid and efficient site-specific mutagenesis without phenotypic selection," Methods Enzymol, 154: 367-382 (1987). |
| Kussrow A, et al., "Measurement of Mono- and Polyvalent Carbohydrate-Lectin Binding by Back-Scattering Interferometry," Anal. Chem., 81: 4889-4897 (2009). |
| Kussrow et al. (2009) Measurement of Monovalent and Polyvalent Carbohydrate-Lectin Binding by Back-Scattering Interferometry. Anal Chem 81(12):4889-4897). |
| Kussrow et al. (2012) Interferometric Methods for Label-Free Molecular Interaction Studies. Anal Chem 84(2):779-792. |
| Kussrow, "Interogation of Biomolecular Interactions Utilizing Backscattering Interferometry," Dissertation, Vanderbilt University (2009), pages i-xii and 1-115 (127 pages total), retrieved from http://etd.library.vanderbilt.edu/available/etd-12042009-092927 on Apr. 29, 2013. |
| Kussrow, A. et al., Measurement of Mono- and Polyvalent Carbohydrate-Lectin Binding by Back-Scattering Interferometry. Anal Chem. 2009; 81(12):4889-97. |
| Kussrow, A. et al., Universal Sensing by Transduction of Antibody Binding with Backscattering Interferometry. Chembiochem. 2011; 12(3):367-70. |
| Kypr et al. (2009) Circular dichroism and conformational polymorphism of DNA Nucleic Acids Res 37( 6): 1713-1725. |
| Lan et al., "Non-mechanical sub-pixel image shifter for acquiring super-resolution digital images," Optics Express, vol. 17:22992-23002 (2009). |
| Langone, "Protein A of Staphylococcus aureus and related immunoglobulin receptors produced by streptococci and pneumonococci," Adv Immunol, 32:157-252 (1982). |
| Latham et al., "Photobiotin surface chemistry improves label-free interferometric sensing of biochemical interactions," Angew Chem Int Ed, 45:955-958 (2006). |
| Leslie and Lilley (1985) Aqueous solutions containing amino acids and peptides. Part 20. Volumetric behavior of some terminally substituted amino acids and peptides at 298.15 K. Biopolymers 24(4):695-710. |
| Letsinger, et al., "Cholesteryl-conjugated oligonucleotides: Synthesis, properties, and activity as inhibitors of replication of human immunodeficiency virus in cell culture," Proc. Natl. Acad. Sci. USA, 86: 6553-6556 (1989). |
| Levene et al. (2003) Zero-mode waveguides for single-molecule analysis at high concentrations. Science 299(5607):682-686). |
| Liang, Y. (2006) Applications of isothermal titration calorimetry in protein folding and molecular recognition. J Iran Chem Soc 3(3):209-219. |
| Liedberg et al. (1995) Biosensing with Surface-Plasmon Resonance—How It All Started. Biosens Bioelectron 10(8):R1-R9. |
| Liu S, "Microfabricated injector and capillary array assembly for high-resolution and high throughput separation," USA (2003). |
| Liu SR, et al., "Optimization of high-speed DNA sequencing on microfabricated capillary electrophoresis channels," Analytical Chemistry, 71: 566-573 (1999). |
| Malacara D, et al., "Interferogram Analysis for Optical Testing," New York: Marcel Dekker, Inc (1998). |
| Manoharan M, et al., "Chemical modifications to improve uptake, and bioavailability of antisense oligonucleotides," Ann. NY Acad. Sci., 660: 306-309 (1992). |
| Manoharan M, et al., "Cholic acid-oligonucleotide conjugates for antisense applications," Biorg. Med. Chem. Lett., 4:1053-1060 (1994). |
| Manoharan M, et al., "Introduction of a Lipophilic Thioether Tether in the Minor Groove of Nucleic Acids for Antisense Applications," Bioorg. Med. Chem. Lett., 3: 2765-2770 (1993). |
| Manoharan M, et al., "Lipidic nucleic acids," Tetrahedron Lett., 36: 3651-3654 (1995). |
| Manoharan M, et al., "Oligonucleotide conjugates: alteration of the pharmacokinetic properties of antisense agents," Nucleosides & Nucleotides, 14: 969-973 (1995). |
| Manz A, et al., "Micromachining of Monocrystalline Silicon and Glass for Chemical-Analysis Systems—a Look into Next Century Technology or Just a Fashionable Craze," Trac-Trends in Analytical Chemistry, 10: 144-149 (1991). |
| Manz A, et al., "Miniaturized Total Chemical-Analysis Systems—a Novel Concept for Chemical Sensing," Sensors and Actuators B-Chemical, 1: 244-248 (1990). |
| Marcuse et al., "Light scattering from optical fibers with arbitrary refractive-index distributions," J Opt Soc Am, 65:367-375 (1975). |
| Marketwired, "Molecular Sensing, Inc. and VIB Enter Agreement in Alzheimer's Disease Research." Internet Publication http://www.marketwired.com/press-release/molecular-sensing-inc-and-vib-enter-agreement-in-alzheimers-disease-research-1231768.htm (2009). |
| Markov D, et al., "A Fourier Analysis Approach for Capillary Polarimetry," Electrophoresis, 23(5): 809-812 (2002). |
| Markov D, et al., "Breaking the 10-7 B arrierfor RI Measurements in Nanoliter Volumes," Analytical Chemistry, 74: 5438-5441 (2002). |
| Markov D, et al., "Nanoliter-scale Non-invasive Flow-Rate Quantification using Micro-Interferometric Backscatter and Phase Detection," Fresenius' Journal of Analytical Chemistry, 371: 234-237 (2001). |
| Markov DA, et al., "Non-Invasive Fluid Flow Measurements in Microfluidic Channels with Backscatter Interferometry," Submitted to Electrophoresis Dec. 2003. |
| Markov et al., "Label-Free Molecular Interaction Determinations with Nanoscale Interferometry," J Am Chem Soc 126:16659-16664 (2004). |
| Marsh and Teichmann (2011) Relative Solvent Accessible Surface Area Predicts Protein Conformational Changes upon Binding. Structure 19(6):859-867. |
| Martynova L, et al., "Fabrication of plastic micro fluid channels by imprinting methods," Analytical Chemistry, 69: 4782-4789 (1997). |
| Mathworks, "Registering an Image Using Normalized Cross-Correlation," http://www.mathworks.com/products/demos/image/cross-correlation/imreg.html, last accessed May 15, 2014. |
| May O, et al., "Inverting enantioselectivity by directed evolution of hydantoinase for improved production ofL-methionine," Nature Biotechnology, 18: 317-320 (2000). |
| Maystre F, et al., "Enhanced Polarimetric Detection in Hplc Using a Refractive-Index Equalizer," Analytical Chemistry, 66: 2882-2887 (1994). |
| Miller MT, et al., "Structure of β-lactam synthetase reveals how to synthesize antibiotics instead of asparagine," Nature Struct. Biol., 8: 684-689 (2001). |
| Miller MT, et al., "The catalytic cycle of β-lactam synthetase observed by x-ray crystallographic snapshots," Proc. Nat. Acad. Sci. USA, 99: 14752-14757 (2002). |
| Minor, L.K., Label-Free Cell-Based Functional Assays. Comb Chem High Throughput Screen. 2008; 11(7):573-80. |
| Miroshnikova et al., "Percussion hole drilling of metals with a fourth-harmonic Nd:YAG laser studied by defocused laser speckle correlation," Applied Optics, vol. 44:3403 (2005). |
| Mishra RK, et al., "Improved leishmanicidal effect of phosphorotioate antisense oligonucleotides by LDL-mediated delivery," Biochim Biophys Acta, 1264: 229-327 (1995). |
| Molphy et al., "Surface Modification of Kaolin. 1. Covalent Attachement of Polyethylene Glycol using a Urethane Linker," Polymer International, 34: 425-431 (1994). |
| Montigiani et al., "Alanine substitutions on calmodulin-binding peptides result in unexpected affinity enhancement," J Mol Biol 258:6-13 (1996). |
| Morcos, E.F. et al., Free-Solution Interaction Assay of Carbonic Anhydrase to Its Inhibitors Using Back-Scattering Interferometry. Electrophoresis. 2010; 31(22):3691-5. |
| Moreira et al. (2005) Effects of fluorescent dyes, quenchers, and dangling ends on DNA duplex stability. Biochem Bioph Res Co 327(2):473-484. |
| Morrison, et al., "Nanoliter high throughput quantitative PCR," Nucleic Acid Res, 34(18):e123 (2004). |
| Neifeld, "Information, resolution, and space-bandwidth product," Optics Letters, vol. 23:1477-1479 (1998). |
| Nielson PE, et al., "Sequence-selective recognition of DNA by strand displacement with a thymine-substitued polyamide," Science, 254: 1497-1500 (1991). |
| Oberhauser B, et al, "Effective incorporation of 2′-O-methyl-obligoribonucleotides into liposomes and enhanced cell association through modification with thiocholesterol," Nucleic Acids Research, 20(3): 533-538 (1992). |
| Olmsted et al. (2012) Comparison of Free-Solution and Surface-Immobilized Molecular Interactions Using a Single Platform. Anal Chem 84(24): 10817-10822. |
| Olmsted et al. (2014) Toward Rapid, High-Sensitivity, Volume-Constrained Biomarker Quantification and Validation using. |
| Olmsted, I.R. et al., Comparison of Free-solution and Surface—Immobilized Molecular Interactions Using a Single Platform, Back-Scattering Interferometry. Anal Chem. 2012; 84(24):10817-22. |
| Orita et al., "Rapid and sensitive detection of point mutations and DNA polymorphisms using the polymerase chain reaction," Genomics, 5:874-879 (1989). |
| Overington, J.P. et al., How Many Drug Targets Are There? Nat Rev Drug Discov. 2006; 5(12):993-6. |
| Papalia, G.A. et al., Comparative Anaylsis of 10 Small Molecules Binding to Carbonic Anhydrase II by Different Investigators Using Biacore Technology. Anal Biochem. 2006; 359(1):94-105. |
| Persson et al., "Lipid-Based Passivation in Nanofluidics," Nano Letters, 12: 2260-2265 (2012). |
| Pesciotta et al. (2011) Back-Scattering Interferometry: A Versatile Platform for the Study of Free-Solution versus Surface-Immobilized Hybridization. Chemistry-an Asian Journal 6(1 ): 70-73. |
| Pettersen et al. (2004) UCSF chimera—A visualization system for exploratory research and analysis. J Comput Chem 25(13): 1605-1612). |
| Pin, J.P. et al., Activation Mechanism of the Heterodimeric GABAB Receptor. Biochem Pharmacol. 2005; 68(8): 1565-72. |
| Pitter et al., "Focus errors and their correction in microscopic deformation analysis using correlation," Optics Express, vol. 10:1361-1367 (2002). |
| Project et al. (2006) A molecular dynamics study of the effect of Ca2+ removal on calmodulin structure. Biophys J 90(11): 3842-3850. |
| Qian et al. (1997) Characterization of antigen-antibody complexes by size-exclusion chromatography coupled with low-angle light-scattering photometry and viscometry. J Chromatogr A 787(1-2): 101-109. |
| Quake SR, et al., "From micro-to nanofabrication with soft materials," Science, 290: 1536-1540 (2000). |
| Read, et al., "Aseptic meningitis and encephalitis: the role of PCR in the diagnostic laboratory," Clin Microbiol, 35:691-696 (1997). |
| Reem et al, "Induction and upregulation by interleukin 2 of high-affinity interleukin 2 receptors on thymocytes and T cells," Proc Natl Acad Sci USA, 82:8663-8666 (1985). |
| Reetz MT, "Combinatorial and evolution-based methods in the creation of enantioselective catalysts," Angewandte Chemie-International Edition, 40: 284-310 (2001). |
| Reetz MT, "New methods for the high-throughput screening of enantioselective catalysts and biocatalysts," Angewandte Chemie-International Edition, 41: 1335-1338 (2002). |
| Rich et al., "High-resolution and high-throughput protocols for measuring drug/human serum albumin interactions using BIACORE," Anal Biochem 296:197-207 (2001). |
| Romero, F.A. et al., Potent and Selective a-Ketoheterocycle-Based Inhibitors of the Anandamide and Oleamide Catabolizing Enzyme, Fatty Acid Amide Hydrolase. J Med Chem. 2007; 50(5):1058-68. |
| Rother D, et al., "An active site homology model of phenylalanine ammonia-lyase from Petroselinum crispum," European Journal of; Biochemistry, 269: 3065-3075 (2002). |
| Rouhi Am, "Chiral chemistry," Chemical & Engineering News, 82: 47 (2001). |
| Rouhi Am, "Taking a measure of chiral riches—Researchers respond to high demand for ways to measure enantioenrichment quickly," Chemical & Engineering News, 80: 51 (2002). |
| Rouhi Am, Rouhi Am, "Chiral roundup—As pharmaceutical companies face bleak prospects, their suppliers diligently tend the fertile fields of chiral chemistry in varied ways," Chemical & Engineering News, 80: 43 (2002). |
| Rudolph Research Analytical, "Polarimetry," webpage retried from www.rudolphresearch.com/polarimetry.htm, (last accessed Aug. 3, 2009). |
| Rychlik W, et al., "New algorithm for determining primer efficiency in PCR and sequencing," J. NIH Res., 6: 78 (1994). |
| Saetear et al. (2015) Quantification of Plasmodium-host protein interactions on intact, unmodified erythrocytes by back-scattering interferometry. Malaria Journal, 14:88. |
| Saha et al., "Comparative study of IgG binding to proteins G and A: Nonequilibrium kinetic and binding constant determination with the acoustic waveguide device," Anal Chem, 75:835-842 (2003). |
| Saison-Behmoaras T, et al., "Short modified antisense oligonucleotides directed against ha-ras point mutations induce selective cleavage of the messenger RNA and inhibit T24 cell proliferation," EMGO J., 10: 1111-1118 (1991). |
| Schipper EF, et al., "The Waveguide Mach-Zender Interferometer as Atrazine Sensor," Analytical Chemistry, 70: 1192-1197 (1998). |
| Schonfeld DL, et al., "Polarimetric assay for the medium-throuput determination of alpha-amino acid racemase activity," Analytical Chemistry, 76: 1184-1188 (2004). |
| Schuster B, et al., "The Mechanism of Action of Phenylalanine Ammonia-Lyase—the Role of Prosthetic Dehydroalanine," Proceedings of the National Academy of Sciences of the United States of America, 92: 8433-8437 (1995). |
| Shea RG, et al., "Synthesis, hybridization properties and antiviral activity of lipid-oligodeoxynucleotide conjugates," Nucl. Acids Res., 8: 3777-3783 (1990). |
| Sidick et al., "Adaptive cross-correlation algorithm for extended scene Shack-Hartmann wavefront sensing," Optics Letters, vol. 33:213-215 (2008). |
| Sjodahl et al., "Electronic speckle photography: analysis of an algorithm giving the displacement with subpixel accuracy," Applied Optics, vol. 32:2278-2284 (1993). |
| Sjodahl et al., "Measurement of shape by using projected random patterns and temporal digital speckle photography," Applied Optics, vol. 38:1990-1997 (1999). |
| Sjodahl, "Accuracy in electronic speckle photography," Applied Optics, vol. 36:2875-2885 (1997). |
| Sjodahl, "Electronic speckle photography: increased accuracy by nonintegral pixel shifting," Applied Optics, vol. 33:6667-6673 (1994). |
| Sorensen HS, "Self Calibrating Interferometric Sensor," PhD thesis Riso-PhD-19(EN), Riso National Laboratory, Denmark, Jan. 2006, pp. 1-145. |
| Sorensen HS, et al., "Absolute refractive index determination by microinterferometric backscatter detection," Analytical Chemistry, 75: 1946-1953 (2003). |
| Sorenson HS, et al., "Highly sensitive biosensing based on interference from light scattering in capillary tubes," Applied Physics Letters, 89(15) (2006). |
| Soumet, et al., "Identification by a multiplex PCR-based assay of Salmonella typhimurium and Salmonella enteritidis strains from environmental swabs of poultry houses ," Lett Appl Microbiol, 29(1) 1-6 (1999). |
| Speaker, et al., "Characterization of a calmodulin-binding protein that is deficient in trifluoperazine-resistant variants of the macrophage-like cell line J774," Proc Natl Acad Sci USA, 80:329-333 (1983). |
| StClaire JC, "Heat Index Flow Monitoring in Capillaries with Interferometric Backscatter Detection," Analytical Chemistry, 72(19): 4726-4730 (2000). |
| Stenberg et al. (1991) Quantitative-Determination of Surface Concentration of Protein with Surface-Plasmon Resonance Using Radiolabeled Proteins. Journal of Colloid and Interface Science 143(2):513-526. |
| STN Entry retrieved from STN Oct. 10, 2013 p. 1. |
| Stone H.A., et al., Microfluidics Toward a Lab-on-a-Chip, Annu. Rev. Fluid Mech. (2004) 36:381-411. |
| Stone, H.A. et al., Engineering Flows in Small Devices: Microfluidics Toward a Lab-on-a-Chip. Annu Rev Fluid Mech. 2004; 36:381-411. |
| Sulmann et al. (2014) Conformational Changes in Calcium-Sensor Proteins under Molecular Crowding Conditions. Chemistry 20 (22):6756-6762. |
| Sun et al. (1980) The Coil-Globule Transition—Radius of Gyration of Polystyrene in Cyclohexane. The Journal of Chemical Physics 73, 5971 73(12):5971-5975. |
| Supplementary European Search Report dated Nov. 21, 2018 by the European Patent Office for Patent Application No. 1674080.7, which was filed on Jan. 22, 2016 and published as EP 3247988 on Nov. 29, 2017 (Inventor—Bornhop et al.; Applicant—Vanderbilt University) (10 pages). |
| Supplementary International Search Report dated Oct. 5, 2012 for US/PCT/2008/063879 filed May 16, 2008 and published as WO 2008/144496 on Nov. 27, 2008 (Applicant—Vanderbilt University // Inventors—Jones et al.) (8 pages). |
| Suzuki, et al., "Planar lipid bilayer reconstitution with a micro-fluidic system," Lab Chip, 4: 502-505 (2004). |
| Svanbro et al., "Complex amplitude correlation for compensation of large in-plane motion in digital speckle pattern interferometry," Applied Optics, vol. 45:8641-8647 (2006). |
| Sviarchuk FP, et al., "Inhibition of HIV proliferation in MT-4 cells by antisense oligonucleotide conjugated to lipophilic groups," Biochimi, 75(1-2): 49-54 (1993). |
| Swinney K, et al., "A chip-scale universal detector for electrophoresis based on backscattering interferometry," Analyst, 125: 1713-1717 (2000). |
| Swinney K, et al., "Capillary-Scale Polarimetry for Flowing Streams," Analyst, 126: 673-675 (2001). |
| Swinney K, et al., "Chip-Scale Universal Detection Based on Backscatter Interferometry," Analytical Chemistry, 72: 2690-2695 (2000). |
| Swinney K, et al., "D-beta-Hydroxybutrate Reaction Kinetics Studied in Nanoliter Volumes using a Capillary Polarimeter," Applied Spectroscopy, 54: 1458-1469 (2000). |
| Swinney K, et al., "Ion Analysis Using Capillary Electrophoresis with Refractive Index Detection," Microchemical Journal, 62: 154-163 (1999). |
| Swinney K, et al., "Label-Free Molecular Interaction Determinations with Nanoscale Interferometry," Accepted in JACS (2004). |
| Swinney K, et al., "Laser-Based Capillary Polarimetry," J. Capillary Electrophoresis and Microchip Technology, 6: 93-96 (1999). |
| Swinney K, et al., "Micro-interferometric backscatter detection using a diode laser," Analytica Chimica Acta, 400: 265-280 (1999). |
| Swinney K, et al., "Miniaturization—Quantification and evaluation of Joule heating in on-chip capillary electrophoresis," Electrophoresis, 23:8 (2002). |
| Swinney K, et al., "Nanoliter Volume Polarimetry," Applied Spectroscopy, 56(1): 134-138 (2002). |
| Swinney K, et al., "Non-Invasive Picoliter Volume Thermometry Based on Backscatter Interferometry," Electrohporesis, 22: 2032-2036 (2001). |
| Swinney K, et al., "Quantification and Evaluation of Joule Heating in On-Chip CE," Electrophoresis, 23(4): 621-625 (2002). |
| Swinney K, et al., "Ultrasmall volume refractive index detection using microinterferometry," Review of Scientific Instruments, 71: 2684-2692 (2000). |
| Swinney K, et al., "Universal Detection in Capillary Electrophoresis by Micro-Interferometric Backscatter," Analyst, 124: 221-226 (1999). |
| Swinney K,e t al., "Universal Detection for Capillary Electrophoresis-Using Micro-Interferometric Backscatter Detection," J. MicroColumn Separation, 11: 596-604 (1999). |
| Swinney, et la., "A Review of CE Detection Methodologies," CRC Critical Reviews in Analytical Chemistry, 30(1): 1-30. |
| Synnergren et al. "Optical in-plane strain field sensor," Applied Optics, vol. 41:1323-1329 (2002). |
| Synnergren et al., "Application of digital speckle photography to flash x-ray studies of internal deformation fields in impact experiments," Applied Optics, vol. 36:4030-4036 (1999). |
| Synnergren et al., "Digital speckle photography: visualization of mesoflow through clustered fiber networks," Applied Optics, vol. 41:1368-1373 (2002). |
| Takushima et al., "Optical reflectometry based on correlation detection and its application to the in-service monitoring of WDM passive optical network," Optics Express, vol. 15:5318-5326 (2007). |
| Tan AM, et al., "Rapid fabrication of microfluidic devices in poly(dimethylsiloxane) by photocopying," Lab on a Chip, 1: 7-9 (2001). |
| Tarigan H, et al., "Capillary-Scale Refractive Index Detection by Interferometric Backscatter," Analytical Chemistry, 68: 1762-1770 (1996). |
| Theze, et al., "Interleukin 2 and its receptors: recent advances and new immunological functions," Immunology Today 17:481-486 (1996). |
| Török, "Calmodulin conformational changes in the activation of protein kinases," Biochem Soc Trans 30:55-61 (2002). |
| Tsukamoto M, et al., "Recent advances in the measurement of enantiomeric excesses," Advanced Synthesis & Catalysis, 344: 453-463. |
| Tumolo et al. (2004) Determination of the refractive index increment (dn/dc) of molecule and macromolecule solutions by surface plasmon resonance. Anal Biochem 333(2):273-279. |
| Tzeng and Kalodimos (2011) Protein dynamics and allostery: an NMR view. Curr Opin Struc Struc Biol 21(1):62-67. |
| U.S. Appl. No. 13/401,303, Bornhop et al. |
| U.S. Appl. No. 60/620,661, Bornhop et al. |
| U.S. Appl. No. 60/938,887, Jones et al. |
| U.S. Appl. No. 60/973,829, Bornhop. |
| U.S. Appl. No. 60/991,599, Jones et al. |
| U.S. Appl. No. 61/012,752, Weinberger et al. |
| U.S. Appl. No. 61/106,552, Bornhop et al. |
| U.S. Appl. No. 61/144,054, Weinberger et al. |
| U.S. Appl. No. 61/354,045, Bornhop et al. |
| U.S. Appl. No. 61/392,890, Bornhop et al. |
| U.S. Appl. No. 61/445,352, Bornhop et al. |
| U.S. Appl. No. 61/447,802, Bornhop et al. |
| Upload Page Retrieved from http://calendar.vanderbilt.edu/calendar/2009/11/30/amanda-kathryn-kussrow-dissertation-defense.95024 on Dec. 22, 2013 p. 1. |
| Urwyler, S. et al., Positive Allosteric Modulation of Native and Recombinant ?-Amniobutyric AcidB receptors by 2,6-Di-tert-butyl-4-(3-hydroxy-2,2-dimethyl-propyl)-pheol (CGP7930) and Its Aldehyde Analog CGP13501. Mol Pharmacol. 2001; 60(5):963-71. |
| Van Delden RA, et al., "Color indicators of molecular chirality based on doped liquid crystals," Angewandte Chemie-International Edition, 40: 3198 (2001). |
| Vandonselaar et al. (1994) Trifluoperazine-induced conformational change in Ca(2+)-calmodulin. Nat Struct Biol. 1(11):795-801. |
| Varma (2016) Article does not explain the origin of free-solution protein interaction signals, PNAS 113(34):E4930. |
| Velazquez-Campoy and Freire (2006) Isothermal titration calorimetry to determine association constants for high-affinity ligands. Nat Protoc 1(1): 186-191. |
| Veldhuis GJ, et al., "Highly-sensitive Passive Integrated Optical Spiral-Shaped Waveguide Refractometer," Applied Physics Letters, 71 (20): 2895-2897 (1997). |
| Viola et al., "Alignment by maximization of mutual information", International Conference on Computer Vision (E. Grimson, S. Shafer, A. Blake and K. Sugihara, eds.), IEEE Computer Society Press, Los Alamitos, CA, pp. 16-23, 1995. |
| Vogelstein, et al., "Digital PCR," Proc Natl Acad Sci USA, 96(16):9236-9241 (1999). |
| Volanthen M, et al., "Multiplexed optical fibre strain sensing using cross-correlation of subcarrier interferometric spectra," Electronics Letters, IEE Stevenage, GB, 32(3): 243-244 (1996). |
| Wang and Bornhop (2005) Dual-capillary backscatter interferometry for high-sensitivity nanoliter-volume refractive index detection with density gradient compensation. Anal Chem 77(24):7872-7877. |
| Wang et al., "Pseudophase information from the complex analytic signal of speckle fields and its applications. Part 1: Microdisplacement observation based on phase-only correlation in the signal domain," Applied Optics, vol. 44:4909-4915 (2005). |
| Wang et al.,"Optical vortex metrology for nanometric speckle displacement measurement," Optics Express, vol. 14:120-127 (2006). |
| Wang Z, et al., "Attomole Sensitivity for Proteins and Polypeptides with On-chip CE and Universal Detection by Interferometric Backscatter," Electrophoresis, 24(5): 865-873 (2003). |
| Wang, et al., "High-speed digital-image correlation method," Optics Letters, vol. 34:1955-1957 (2009). |
| Watkins, "Scattering from side-illuminated clad glass fibers for determination of fiber parameters," J Opt Soc Am, 64:767-772 (1974). |
| Wetmur JG, et al., "DNA Probes: Applications of the Principles of Nucleic Acid Hybridization," Crit. Rev. Biochem. Mol. Biol., 26: 227-259 (1991). |
| Whitesides et al., "Soft lithography in biology and biochemistry," Annu Rev Biomed Eng, 3:335-373 (2001). |
| Wienken et al. (2010) Protein-binding assays in biological liquids using microscale thermophoresis. Nat Commun. 1:100. |
| Wu ZY, et al., "Polymer microchips bonded by O-2-plasma activation," Electrophoresis, 23: 782-790 (2002). |
| Yamaguchi, "Fringe formation in speckle photography," J. Opt. Soc. Am. A, vol. 1:81-86 (1984). |
| Yanik, et al., "Development of a New Laser Based Polarimetric Detector and Its Application to High-performance Liquid Chromatography," PDR-Chiral, 1998. |
| Yeung, et al., "Electrochemistry-Based Real-Time PCR on a Microchip," Anal Chem, 80:363-368 (2008). |
| Ymeti, et al., "Realization of a multichannel integrated young interferometer chemical sensor," Applied Optics, 42: 5649-5660. |
| Young, et al., "Novel Recombinant-Antigen Enzyme Immunoassay for Serological Diagnosis of Syphilis," J Clin Microbio, 36(4):913-917 (1998). |
| Yu et al., "Energy landscape of aptamer/protein complexes studies by single-molecule force spectroscopy," Chem Asian J, 2:284-289 (2007). |
| Yu et al., "Interaction of an artificial antimicrobial peptide with lipid membranes," Biochemica et Biophysica Acta, 1788: 333-344 (2009). |
| Yu, J., et al., Energy Landscape of aptamer/ protein complexes studied by single molecule force spectroscopy. Chem Asian J (2007); 2:284-9. |
| Zandonella C, "Cell nanotechnology: The tiny toolkit," Nature, 423: 10-12 (2003). |
| Zazopoulos E, et al., "A genomics-guided approach for discovering and expressing cryptic metabolic pathways," Nature Biotech., 21: 187-190 (2003). |
| Zhang et al. (2014) Microscale thermophoresis for the assessment of nuclear protein-binding affinities. Methods Mol Biol. 1094:269-76. |
| Zhang et al., "Proteins and cells on PEG immovilized silicon surfaces," Biomaterials, 19: 953-960. |
| Zhao et al. (2011) On the Distribution of Protein Refractive Index Increments. Biophysical Journal 100(9):2309-2317. |
| Zhihong et al., "A new sandwich-type assay of estrogen using piezoelectric biosensor immobilized with estrogen response element," Anal Commun, 36:281-283 (1999). |
| Zhou J, et al., "Spectroscopic studies of substrate interactions with clavaminate synthase 2, a multifunctional a-KG-dependent non-heme iron enzyme: Correlation with mechanisms and reactivities," J. Am. Chem. Soc., 123: 7388-7398(2001). |
| Zhou JM, et al., "Spectroscopic studies of substrates and cosubstrate binding to the a-ketoglutarate-dependent non-heme iron enzyme clavaminate synthase 2: correlation to reactivities and mechanisms," Journal of Inorganic Biochemistry, 74: 350-350 (1999). |
| Zhou JM, et al., "Substrate binding to the α-keoglutarate-dependent non-heme iron enzyme clavaminate synthase 2: Coupling mechanism of oxidative decarboxylation and hydroxylation," J. Am. Chem. Soc., 120: 13539-13540 (1998). |
Also Published As
| Publication number | Publication date |
|---|---|
| EP3408649A4 (en) | 2020-03-11 |
| WO2017132483A9 (en) | 2019-04-04 |
| US20190033301A1 (en) | 2019-01-31 |
| WO2017132483A1 (en) | 2017-08-03 |
| EP3408649B1 (en) | 2023-06-14 |
| EP3408649A1 (en) | 2018-12-05 |
| US10627396B2 (en) | 2020-04-21 |
| US20200209227A1 (en) | 2020-07-02 |
Similar Documents
| Publication | Publication Date | Title |
|---|---|---|
| US11143649B2 (en) | Free-solution response function interferometry | |
| US10900961B2 (en) | Free solution measurement of molecular interactions by backscattering interferometry | |
| US9638632B2 (en) | Multiplexed interferometric detection system and method | |
| Khansili et al. | Label-free optical biosensors for food and biological sensor applications | |
| Xinglong et al. | A surface plasmon resonance imaging interferometry for protein micro-array detection | |
| Damborský et al. | Optical biosensors | |
| Ray et al. | Label‐free detection techniques for protein microarrays: Prospects, merits and challenges | |
| Couture et al. | Modern surface plasmon resonance for bioanalytics and biophysics | |
| Dostálek et al. | Surface plasmon resonance sensor based on an array of diffraction gratings for highly parallelized observation of biomolecular interactions | |
| Xu et al. | Measurement of chiral molecular parameters based on a combination of surface plasmon resonance and weak value amplification | |
| JP5855246B2 (en) | Determination of active concentration by calibration-free analysis | |
| Sun | Optical biosensors for label-free detection of biomolecular interactions | |
| Kammer et al. | A highly compensated interferometer for biochemical analysis | |
| Yang et al. | How to convincingly measure low concentration samples with optical label-free biosensors | |
| Fechner et al. | Through the looking-glass-Recent developments in reflectometry open new possibilities for biosensor applications | |
| Liu et al. | Characterization of drug-binding levels to serum albumin using a wavelength modulation surface plasmon resonance sensor | |
| Cusano et al. | Metasurface-assisted Lab-on-fiber optrode for highly sensitive detection of vitamin D | |
| Dourbash et al. | Label-free immunoassay using droplet-based brewster’s angle straddle interferometry | |
| Gesellchen et al. | Direct optical detection of protein-ligand interactions | |
| Loyez et al. | Insulin biotrapping using plasmofluidic optical fiber chips: A benchmark | |
| Yuk et al. | Sensitivity of ex situ and in situ spectral surface plasmon resonance sensors in the analysis of protein arrays | |
| US20140065640A1 (en) | Interferometric Detection Using Nanoparticles | |
| Ivarsson et al. | Surface plasmon resonance: development and use of BIACORE instruments for biomolecular interaction analysis | |
| Wang et al. | Label-free and real-time detections of the interactions of swine IgG with goat anti-swine IgG by oblique-incidence reflectivity difference technique | |
| US8965737B2 (en) | Ultrasensitive biological and chemical detection using surface plasmon resonance |
Legal Events
| Date | Code | Title | Description |
|---|---|---|---|
| FEPP | Fee payment procedure | Free format text:ENTITY STATUS SET TO UNDISCOUNTED (ORIGINAL EVENT CODE: BIG.); ENTITY STATUS OF PATENT OWNER: SMALL ENTITY | |
| FEPP | Fee payment procedure | Free format text:ENTITY STATUS SET TO SMALL (ORIGINAL EVENT CODE: SMAL); ENTITY STATUS OF PATENT OWNER: SMALL ENTITY | |
| STPP | Information on status: patent application and granting procedure in general | Free format text:APPLICATION DISPATCHED FROM PREEXAM, NOT YET DOCKETED | |
| STPP | Information on status: patent application and granting procedure in general | Free format text:DOCKETED NEW CASE - READY FOR EXAMINATION | |
| STPP | Information on status: patent application and granting procedure in general | Free format text:NON FINAL ACTION MAILED | |
| STPP | Information on status: patent application and granting procedure in general | Free format text:RESPONSE TO NON-FINAL OFFICE ACTION ENTERED AND FORWARDED TO EXAMINER | |
| STPP | Information on status: patent application and granting procedure in general | Free format text:NOTICE OF ALLOWANCE MAILED -- APPLICATION RECEIVED IN OFFICE OF PUBLICATIONS | |
| AS | Assignment | Owner name:VANDERBILT UNIVERSITY, TENNESSEE Free format text:ASSIGNMENT OF ASSIGNORS INTEREST;ASSIGNORS:BORNHOP, DARRYL J.;KUSSROW, AMANDA;KAMMER, MICHAEL;SIGNING DATES FROM 20160203 TO 20160208;REEL/FRAME:056560/0400 | |
| STPP | Information on status: patent application and granting procedure in general | Free format text:PUBLICATIONS -- ISSUE FEE PAYMENT RECEIVED | |
| STPP | Information on status: patent application and granting procedure in general | Free format text:PUBLICATIONS -- ISSUE FEE PAYMENT VERIFIED | |
| STCF | Information on status: patent grant | Free format text:PATENTED CASE | |
| AS | Assignment | Owner name:KRAMMER, MICHAEL, FRANCE Free format text:ASSIGNMENT OF ASSIGNORS INTEREST;ASSIGNOR:VANDERBILT UNIVERSITY;REEL/FRAME:070168/0242 Effective date:20231114 Owner name:KUSSROW, AMANDA, TENNESSEE Free format text:ASSIGNMENT OF ASSIGNORS INTEREST;ASSIGNOR:VANDERBILT UNIVERSITY;REEL/FRAME:070168/0242 Effective date:20231114 Owner name:BORNHOP, DARRYL, CALIFORNIA Free format text:ASSIGNMENT OF ASSIGNORS INTEREST;ASSIGNOR:VANDERBILT UNIVERSITY;REEL/FRAME:070168/0242 Effective date:20231114 | |
| AS | Assignment | Owner name:KAMMER, MICHAEL, FRANCE Free format text:CORRECTIVE ASSIGNMENT TO CORRECT THE ASSIGNEE PREVIOUSLY RECORDED ON REEL 70168 FRAME 242. ASSIGNOR(S) HEREBY CONFIRMS THE ASSIGNMENT;ASSIGNOR:VANDERBILT UNIVERSITY;REEL/FRAME:070205/0988 Effective date:20231114 Owner name:KUSSROW, AMANDA, TENNESSEE Free format text:CORRECTIVE ASSIGNMENT TO CORRECT THE ASSIGNEE PREVIOUSLY RECORDED ON REEL 70168 FRAME 242. ASSIGNOR(S) HEREBY CONFIRMS THE ASSIGNMENT;ASSIGNOR:VANDERBILT UNIVERSITY;REEL/FRAME:070205/0988 Effective date:20231114 Owner name:BORNHOP, DARRYL, CALIFORNIA Free format text:CORRECTIVE ASSIGNMENT TO CORRECT THE ASSIGNEE PREVIOUSLY RECORDED ON REEL 70168 FRAME 242. ASSIGNOR(S) HEREBY CONFIRMS THE ASSIGNMENT;ASSIGNOR:VANDERBILT UNIVERSITY;REEL/FRAME:070205/0988 Effective date:20231114 | |
| AS | Assignment | Owner name:FREESRF HOLDINGS LLC, CALIFORNIA Free format text:ASSIGNMENT OF ASSIGNORS INTEREST;ASSIGNOR:KUSSROW, AMANDA, PHD;REEL/FRAME:070664/0516 Effective date:20250304 Owner name:FREESRF HOLDINGS LLC, CALIFORNIA Free format text:ASSIGNMENT OF ASSIGNORS INTEREST;ASSIGNOR:KAMER, MICHAEL, PHD;REEL/FRAME:070667/0416 Effective date:20250304 Owner name:FREESRF HOLDINGS LLC, GEORGIA Free format text:ASSIGNMENT OF ASSIGNORS INTEREST;ASSIGNOR:BORNHOP, DARRYL;REEL/FRAME:070664/0713 Effective date:20250304 | |
| MAFP | Maintenance fee payment | Free format text:PAYMENT OF MAINTENANCE FEE, 4TH YR, SMALL ENTITY (ORIGINAL EVENT CODE: M2551); ENTITY STATUS OF PATENT OWNER: SMALL ENTITY Year of fee payment:4 |