US10983249B2 - Indicator interpolation to predict a weather state - Google Patents
Indicator interpolation to predict a weather stateDownload PDFInfo
- Publication number
- US10983249B2 US10983249B2US16/127,851US201816127851AUS10983249B2US 10983249 B2US10983249 B2US 10983249B2US 201816127851 AUS201816127851 AUS 201816127851AUS 10983249 B2US10983249 B2US 10983249B2
- Authority
- US
- United States
- Prior art keywords
- weather
- location
- measurement
- representative
- sector
- Prior art date
- Legal status (The legal status is an assumption and is not a legal conclusion. Google has not performed a legal analysis and makes no representation as to the accuracy of the status listed.)
- Active, expires
Links
Images


Classifications
- G—PHYSICS
- G01—MEASURING; TESTING
- G01W—METEOROLOGY
- G01W1/00—Meteorology
- G01W1/10—Devices for predicting weather conditions
- G—PHYSICS
- G06—COMPUTING OR CALCULATING; COUNTING
- G06F—ELECTRIC DIGITAL DATA PROCESSING
- G06F16/00—Information retrieval; Database structures therefor; File system structures therefor
- G06F16/20—Information retrieval; Database structures therefor; File system structures therefor of structured data, e.g. relational data
- G06F16/29—Geographical information databases
- G—PHYSICS
- G06—COMPUTING OR CALCULATING; COUNTING
- G06F—ELECTRIC DIGITAL DATA PROCESSING
- G06F16/00—Information retrieval; Database structures therefor; File system structures therefor
- G06F16/90—Details of database functions independent of the retrieved data types
- G06F16/95—Retrieval from the web
- G06F16/953—Querying, e.g. by the use of web search engines
- G06F16/9537—Spatial or temporal dependent retrieval, e.g. spatiotemporal queries
- G—PHYSICS
- G01—MEASURING; TESTING
- G01W—METEOROLOGY
- G01W1/00—Meteorology
- G01W2001/006—Main server receiving weather information from several sub-stations
- G—PHYSICS
- G01—MEASURING; TESTING
- G01W—METEOROLOGY
- G01W2203/00—Real-time site-specific personalized weather information, e.g. nowcasting
- Y—GENERAL TAGGING OF NEW TECHNOLOGICAL DEVELOPMENTS; GENERAL TAGGING OF CROSS-SECTIONAL TECHNOLOGIES SPANNING OVER SEVERAL SECTIONS OF THE IPC; TECHNICAL SUBJECTS COVERED BY FORMER USPC CROSS-REFERENCE ART COLLECTIONS [XRACs] AND DIGESTS
- Y02—TECHNOLOGIES OR APPLICATIONS FOR MITIGATION OR ADAPTATION AGAINST CLIMATE CHANGE
- Y02A—TECHNOLOGIES FOR ADAPTATION TO CLIMATE CHANGE
- Y02A90/00—Technologies having an indirect contribution to adaptation to climate change
- Y02A90/10—Information and communication technologies [ICT] supporting adaptation to climate change, e.g. for weather forecasting or climate simulation
Definitions
- This descriptionrelates to estimation of weather information using field-driven data obtained from multiple remote weather stations.
- Farm management and agricultural management systemscommonly require a variety of data inputs to perform necessary calculations for the agricultural management cycle. Many of these inputs are categorical variables and properties that support agricultural management life cycles, including and not limited to, soil properties, elevation, seed type, crop variety, nutrient applications, weather, and so on.
- Describedis a method for predicting a weather state by interpolating weather information from weather measurement systems located in or near a query location such as an agricultural field.
- the methodis more efficient, less computationally expensive, easier to interpret and more accurate than more traditional weather interpolation methods.
- a weather prediction modelaccesses a number of indicator weather states from known and nearby weather measurement systems.
- Each weather measurement systemis at a measurement location and configured to determine a weather state at the measurement location.
- the weather prediction modelpredicts a weather state for a query location using the weather states determined by the weather measurement systems. Predicting the weather state at the query location may consider the number of weather measurement systems near the query location, their geometrical configuration, and the values that are measured by each such weather measurements system. The values measured by the weather measurement systems are used to predict a weather state at the query location.
- Using the wearer prediction modelreduces the need to have a weather measurement system installed on every desired location in an area.
- Predicted weather states at the query locationmay impact decisions that agronomists, producers, farmers, or farm managers make throughout the year. For example, this the weather prediction model may be applied to historical data that has already been collected, determine a weather forecast, and a farmer may choose a farming process based on the forecast.
- FIG. 1is an illustration of a system environment for predicting a weather state at a location using a weather prediction model, according to one example embodiment.
- FIG. 2is a flow diagram illustrating an example method for predicting a weather state at a query location, according to one example embodiment.
- FIG. 3is an illustration of an area including a query location and a number of weather measurement systems, according to one example embodiment.
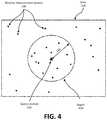
- FIG. 4is an illustration of weather measurement systems in a region within a proximity distance from the query location, according to one example embodiment.
- FIG. 5is an illustration of a proximal weather measurement system within the prediction area, according to one example embodiment.
- FIG. 6is an illustration of the region partitioned into four sectors, according to one example embodiment.
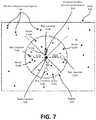
- FIG. 7is an illustration of representative locations at representative distances for each sector of a region used to predict a weather state at the query location, according to one example embodiment.
- This methodseeks to predict a weather state at a query location, or locations, in an area by interpolating results obtained from one or more weather measurements systems in the area.
- An areais some amount of geographic area that may include weather measurement systems and agricultural fields.
- a weather stateis a quantification or measurement of some aspect of the weather such as, for example, precipitation, humidity, temperature, pressure, wind speed, etc.
- a predicted weather stateis a predicted value of a weather state at a particular location in the area.
- Location and area centric weather information(e.g., weather states) is obtained from weather measurement systems or other sources of data to drive better and more efficient interpolated results for any missing locations within the area.
- FIG. 1illustrates a system environment 100 for predicting a weather state at a query location within an area.
- a client system 110predicts a weather state at a query location using a weather prediction model 112 .
- a network system 120accesses current and historical weather states (“indicator weather states” in aggregate) from a weather measurement system 130 via a network 140 .
- indicator weather statesin aggregate
- a client system 110may request indicator weather states via the network 140 and the network system 120 may provide the indicator weather states in response.
- a client system 110is any system capable of executing a weather prediction model 112 to predict a weather state at a query location l q .
- the client system 110may be a computing device, such as, for example, a personal computer.
- Network system 120may also be a computing device, such as, for example, a set of servers that can operate with or as part of another system that implements network services for facilitating determining predicted weather states.
- Network system 120 and client system 110comprise any number of hardware components and/or computational logic for providing the specified functionality.
- systems hereincan be implemented in hardware, firmware, and/or software (e.g., a hardware server comprising computational logic), other embodiments can include additional functionality, can distribute functionality between systems, can attribute functionality to more or fewer systems, can be implemented as a standalone program or as part of a network of programs, and can be loaded into memory executable by processors.
- a hardware servercomprising computational logic
- other embodimentscan include additional functionality, can distribute functionality between systems, can attribute functionality to more or fewer systems, can be implemented as a standalone program or as part of a network of programs, and can be loaded into memory executable by processors.
- a client system 110is operated by a user responsible for managing crop production in an agricultural field within the area, but could be operated by any other user.
- the user of the client system 110inputs a query location l q into the weather prediction model 112 and the weather prediction model 112 predicts a weather state for that query location l q in response.
- the query location l qis the location of the agricultural field, or a portion of the agricultural field, managed by the user, but could be any other query location l q .
- the query location l qmay be the location of the client system 110 .
- a client system 110is connected to a network system 120 via a network 140 .
- the network system 120facilitates the weather prediction model 112 accurately predicting a weather state at the query location l q .
- the network system 120may access indicator weather states from weather measurement systems 130 in the area.
- the network system 120can provide the indicator weather states to the client system 110 such that the weather prediction model 112 can predict a weather state at the query location l q .
- the network system 120(or the client system 110 ) may store any of the indicator weather states in a datastore. Stored indicator weather states may be accessed by weather prediction model 112 to predict a weather state at a query location l q .
- the weather prediction model 112is executed on a network system 120 and a client system 110 accesses the weather prediction model via the network 140 .
- a weather measurement system 130is any system or device that can provide indicator weather states to the network system 120 and client system 110 .
- a weather measurement system 130is a system or device capable of measuring and/or quantifying an aspect of the current weather (i.e., current weather states).
- a weather measurement system 130may be a weather station operated the National Weather Service, but could be any other weather measurement system 130 .
- a weather measurement system 130may be an external system that stores previously measured weather states (i.e., historical weather states).
- the weather measurement system 130may be a database that stores historical records of weather in the area as indicator weather states.
- a weather measurement systemmay provide indicator weather states to network system 120 or client system 110 .
- system environment 100illustrates two weather measurement systems 130
- the system environment 100can include any number of weather measurement systems 130 .
- the network 140represents the communication pathways between systems in the environment 100 .
- the networkis the Internet, but can also be any network, including but not limited to a LAN, a MAN, a WAN, a mobile, wired or wireless network, a cloud computing network, a private network, or a virtual private network, and any combination thereof.
- all or some of linkscan be encrypted using conventional encryption technologies such as the secure sockets layer (SSL), Secure HTTP and/or virtual private networks (VPNs).
- the entitiescan use custom and/or dedicated data communications technologies instead of, or in addition to, the ones described above.
- each indicator weather stateis associated with a measurement location l m .
- Each measurement location l mis a distance d m away from the query location l q .
- the measurement location l m of an indicator weather stateis the location at which a weather measurement system 130 determined the indicator weather state.
- the distance d m between the query location l q and the measurement location l mcan be determined by the weather prediction model 112 when predicting a weather state.
- the client system 110uses a weather prediction model 112 to predict a weather state for a query location l q .
- the weather prediction model 112receives a query location l q as input and provides a predicted weather state at the query location l q as output.
- the weather prediction model 112may request and receive indicator weather states from network system 120 to facilitate predicting the weather state.
- Network system 120may access the indicator weather states from a storage database of the network system 120 or from weather measurement systems 130 as previously described.
- FIG. 2illustrates a method 200 to predict a weather state.
- the method 200may be executed by a weather prediction model 112 executing on client system 110 .
- the method 200will be described in reference to FIGS. 3-7 .
- the method 200can include additional or fewer steps and the steps may occur in any order.
- a weather prediction model 112receives 210 a request to predict a weather state at a query location l q in an area.
- an operator of the client system 110inputs the query into the weather prediction model 112 and initializes the request.
- the query location l qis an agricultural field in an area and the operator is a person responsible for managing crop production of the agricultural field.
- the areaalso includes a number of weather measurement systems 130 that can provide indicator weather states for the weather prediction model 112 .
- FIG. 3is an illustration of an area 310 .
- the area 310is shown as a rectangle with a black boundary.
- Within the area 310is a query location l q 320 and weather measurement systems 130 .
- the query location l q 320is illustrated as a triangle and the weather measurement systems 130 are illustrated as dots.
- the weather prediction model 112receives 212 a set of indicator weather states from weather measurement systems 130 in the area 310 .
- the weather prediction model 112receives the indicator weather states in response to the client system 110 requesting the indicator weather states from network system 120 .
- the indicator weather statesare stored on a database of client system 110 and the weather prediction model 112 receives (or accesses) the predictive states from the database.
- the measurement location l m for each indicator weather stateis the location of the weather measurement system 130 in the area 310 that measured the indicator weather state.
- each of the weather measurement systems 130is a measurement location l m for an indicator weather state used by the weather prediction model 112 .
- the weather prediction model 112determines 214 a region within the area.
- the regionis a geographical extent within the area 310 that is within a proximity distance d p from the query location l q .
- a proximity distance d p for a regionmay be approximately 100 km.
- a regionmay be approximately thirty thousand square kilometers while an area is over a hundred thousand square kilometers, but an area and a region may be any other size.
- the weather prediction model 112only uses indicator weather states from measurement locations l m within the region to predict a weather state.
- the proximity distance d pmay be predetermined (e.g., 75 km), selected by an operator of a client system 110 (e.g., as a user input), or dynamically determined based on a variety of criteria. Some of the criteria for determining a proximity distance d p may include the density of weather measurement systems 130 surrounding the query location l q 320 , a threshold number of weather measurement systems 130 to include in a region, the reliability of weather measurement systems 130 , etc. Take, for example, a query location l q 320 surrounded by weather measurement systems 130 at a density of 3 weather measurement systems 130 per 50 square km. In this case, weather prediction model 112 determines a proximity distance d p of 100 km.
- a query location l q 320is surrounded by weather measurements systems 130 with a density of 10 weather measurement systems 130 per 50 square km.
- the weather prediction model 112selects a proximity distance d p of 60 km because of the increased density of weather measurement systems 130 .
- FIG. 4illustrates a region 410 determined by a weather prediction model 112 within an area 310 .
- the region 410is illustrated as a grey circle bounded by a black ring and includes all the area within a proximity distance d p 412 from the query location l q 320 .
- the proximity distance d p 412is indicated as a line.
- the region 410is approximately circular with the query location l q 320 at the center of the circle. In this example, the proximity distance d p 412 is predetermined.
- weather measurement systems 130that are nearer the query location l q 320 than the proximity distance d p 412 . That is, d m ⁇ d p for all of the weather measurement systems 130 within the region 410 .
- the weather prediction model 112only uses indicator weather states from weather measurement systems 140 within the region 410 to predict a weather state.
- the method 200may determine a region 410 before receiving weather indicator states. In this case, only indicator weather states from weather measurement systems 130 within the region 410 are provided to the weather prediction model 112 .
- the weather prediction model 112determines 216 a proximal weather measurement system 130 within a region 410 and, thereby, determines a proximal indicator weather state.
- a proximal indicator weather stateis the most important indicator weather state for accurately predicting a weather state.
- a proximal weather measurement systemis the weather measurement system 130 whose measurement location l m is nearest the query location l q 320 . That is, the proximal weather measurement system is the weather measurement system 130 in the region 410 with the smallest measurement distance d m .
- FIG. 5illustrates a proximal weather measurement system 510 determined by the weather prediction model 112 .
- the proximal weather measurement system 130is the weather measurement system 130 nearest the query location 320 in the region 410 .
- the proximal weather measurement system 510is illustrated as a star, however, the proximal weather measurement system was previously illustrated as a dot in FIG. 3 and FIG. 4 .
- each sectorhas approximately the same amount of area, but could have different areas.
- each sectorsare sectors of a circle, but could form any other shape (e.g., boxes forming a rectangle, triangles forming a triangle, etc.).
- the border between each pair of sectorsis a line passing from the query location l q 320 to a point the proximity distance d p 412 away.
- Weather prediction model 112may determine the position of sectors within a region 410 based on the location of the proximal weather measurement system 510 .
- a first sector of the determined sectorsis positioned within the region such that a line from the proximal weather measurement system 510 to the query location l q 320 approximately bisects the first sector.
- the remaining sectorsare equally spaced about the region 410 based on the location of the first sector. For example, if the region 410 is a circle, the weather prediction model 112 may partition the region 410 into six equally sized sectors. Each of the six sectors have an arc of approximately 60 degrees.
- the first sectoris placed within the region 410 such that a line between the proximal weather measurement system 510 and the query location l q approximately bisects a sector such that 30 degrees of the sectors arc is on each side of the line.
- the remaining sectorsare placed around the first sector to complete the circle.
- FIG. 6illustrates a region 410 that has been partitioned into four sectors 610 A- 610 D by the weather prediction model 112 .
- the region 410is approximately circular and surrounds the query location l q 320 such that the radius of the region 410 is approximately the proximity distance d p 412 .
- a line 612 that connects the proximal weather measurement system 510 to the query 320 locationis illustrated. Because the region 410 is partitioned into four sectors 610 , each sector 610 spans a 90° arc of the circular region 410 .
- a first sector 610 A of the sectors 610is positioned within the region 410 such that the illustrated line 612 approximately bisects the sector 610 A.
- the first sector 610 Ais positioned such that 45° of the 90° arc of the first sector 610 A is on each side of the illustrated line 612 .
- the remaining sectors 610 B-Dare positioned such that they complete the circular region 410 with the query location l q 320 at the center.
- the weather prediction modeldetermines 220 a representative weather state at a representative location l r for each of the sectors 610 .
- the representative weather stateis a weather state that represents the weather in the sector 610 .
- the representative weather state for a sector 610is an average of the indicator weather states for each weather measurement system 130 located in the sector 610 .
- the representative weather state for a sector 610uses an inverse distance weighting method. That is, indicator weather states that have measurement locations l m closer to the query location l q are assigned larger weights compared to indicator weather states whose measurement locations l m are farther away. In other examples, some other function may be used to determine a representative weather state for a sector 610 .
- weather prediction model 112may only use a pre-determined number of indicator weather states from weather measurement systems 510 located within a sector 610 . For example, if a sector 610 includes indicator weather states from 20 weather measurement systems 130 , weather prediction model 112 may only use 10 of the indicator weather states. Further, in some examples, weather prediction model 112 may only use the indicator states from the weather measurement systems 130 in the sector 610 that are closest to the query location l q 320 .
- the representative location l r for each sectors 610is located within the sector 610 such that a line connecting the representative location l r and the query location l q approximately bisects the sector 610 . In other examples, the line may not bisect the sector.
- the weather determination model 112can determine the representative distance d r based on the sector 610 .
- the weather prediction model 112determines the representative distance d r for that sector 610 is the distance between the measurement location l m of the proximal weather measurement system 510 and the query location l q 320 .
- the representative location l ris the measurement location l m of the proximal weather measurement system 510 .
- the weather prediction model 112determines a representative distance d r that is a harmonic average of the distances between the query location and the measurement locations l q of the weather measurement systems 130 in that sector.
- the representative distance d rmay not coincide with a measurement location l m of a weather measurement system 130 .
- the weather prediction model 112can determine a representative distance d r using any other technique to average distances.
- FIG. 7illustrates a region 410 with determined representative locations 710 at representative distances 712 .
- Each representative location 710is illustrated as a dashed circle and each representative distance 712 is illustrated as a dashed line.
- the representative location 710 Ais at the measurement location l m of the proximal weather measurement system 510 .
- the representative locations 710 B-Dare at a representative distance d r 712 B-D on a line bisecting its respective sector 610 B-D.
- the representative distances d r 712 B-D for a sector 610 B-Dis the harmonic mean of the distances between the query location l q and the measurement locations l m of the weather measurement systems 130 in that sector 610 B-D.
- the weather prediction modelpredicts 222 a weather state for the query location l q using the representative weather state, representative locations l r 710 , and representative distances d r 712 for each sector 610 .
- the weather prediction model 112performs a linear interpolation of representative weather states between representative locations l r 710 at representative distances d r 712 within sectors 610 on opposite sides of the query location l q 520 to determine the predicted weather state.
- the predicted weather state at the query location l qis some function of the interpolated pairs such as, for example, mean, median, etc. In other examples, another function may be used to predict a weather state.
- the predicted weather stateis any weather state that can be predicted by indicator weather states. For example, if all of the weather measurement systems 130 have an indicator weather state indicating a current amount of rain fall, the weather prediction model generates a representative weather state at a representative location l r 710 indicating rain fall for each sector 610 . The weather prediction model 112 interpolates the representative weather states at the representative distances d r 712 of the representative locations l r 710 to predict an amount of rainfall at the query location l q 520 . Of course, this is just an example of predicting a weather state. Weather prediction model 112 can use any indicator weather states described herein to predict a state.
- Weather prediction model 112outputs the predicted weather state to the operator of the client system 110 .
- the operator of the client system 110may use the predicted weather state to apply real-time decision making for the current agricultural life cycle in the agricultural field.
- the predicted weather statemay be stored on a database of client system 110 or network system 120 .
- predicted weather statescan be combined with other predicted weather states to generate a predicted weather map of the area.
- the predicted weather mapcan include any number of zones such that the predicted weather map represents a zone-by-zone map (or table) displaying current, historical, and/or predicted weather states in the area.
- the weather mapincludes no empty zones because of the predicted weather states.
- current, historical, and/or predicted weather statesmay be combined about a sector 610 or zone in an area 310 to provide a holistic view of the sector 610 or zone. For example, if the weather states in the sector indicate current rain fall, high humidity, and a large amount of historical rain fall, the holistic view may include “flood risk.” In another example, if the weather states in a zone indicate no rain fall, high temperatures, a low amount of historical rain fall, the holistic view may include “drought.”
- the predicted weather statesmay be analyzed to predict a future trend.
- weather prediction model 112can use predicted weather states from a previous growing season, or seasons, to predict a weather state for the current season.
- a predicted weather statemay be used by a machine in a field to take an action.
- a predicted weather state indicating droughtmay be sent to a boom sprayer in a field and the boom sprayer may increase the amount of water provided to plants in response.
- Other examples of a farming machine utilizing a predicted weather stateare also possible.
- the terms “comprises,” “comprising,” “includes,” “including,” “has,” “having” or any other variation thereof,are intended to cover a non-exclusive inclusion.
- a process, method, article, or apparatus that comprises a list of elementsis not necessarily limited to only those elements but may include other elements not expressly listed or inherent to such process, method, article, or apparatus.
- any reference to “one embodiment” or “an embodiment”means that a particular element, feature, structure, or characteristic described in connection with the embodiment is included in at least one embodiment.
- the appearances of the phrase “in one embodiment” in various places in the specificationare not necessarily all referring to the same embodiment.
Landscapes
- Engineering & Computer Science (AREA)
- Databases & Information Systems (AREA)
- Environmental & Geological Engineering (AREA)
- Theoretical Computer Science (AREA)
- Environmental Sciences (AREA)
- Ecology (AREA)
- Biodiversity & Conservation Biology (AREA)
- Atmospheric Sciences (AREA)
- Data Mining & Analysis (AREA)
- Physics & Mathematics (AREA)
- General Engineering & Computer Science (AREA)
- General Physics & Mathematics (AREA)
- Life Sciences & Earth Sciences (AREA)
- Remote Sensing (AREA)
- Management, Administration, Business Operations System, And Electronic Commerce (AREA)
Abstract
Description
Claims (20)
Priority Applications (1)
| Application Number | Priority Date | Filing Date | Title |
|---|---|---|---|
| US16/127,851US10983249B2 (en) | 2017-09-14 | 2018-09-11 | Indicator interpolation to predict a weather state |
Applications Claiming Priority (2)
| Application Number | Priority Date | Filing Date | Title |
|---|---|---|---|
| US201762558643P | 2017-09-14 | 2017-09-14 | |
| US16/127,851US10983249B2 (en) | 2017-09-14 | 2018-09-11 | Indicator interpolation to predict a weather state |
Publications (2)
| Publication Number | Publication Date |
|---|---|
| US20190079214A1 US20190079214A1 (en) | 2019-03-14 |
| US10983249B2true US10983249B2 (en) | 2021-04-20 |
Family
ID=65631078
Family Applications (1)
| Application Number | Title | Priority Date | Filing Date |
|---|---|---|---|
| US16/127,851Active2039-08-08US10983249B2 (en) | 2017-09-14 | 2018-09-11 | Indicator interpolation to predict a weather state |
Country Status (5)
| Country | Link |
|---|---|
| US (1) | US10983249B2 (en) |
| AR (1) | AR113061A1 (en) |
| BR (1) | BR112020004805B1 (en) |
| CA (1) | CA3073290C (en) |
| WO (1) | WO2019051590A1 (en) |
Families Citing this family (2)
| Publication number | Priority date | Publication date | Assignee | Title |
|---|---|---|---|---|
| US10408973B2 (en)* | 2017-03-20 | 2019-09-10 | International Business Machines Corporation | Collection vessel for collecting, measuring, and aggregrating precipitation accumulation data |
| JP6788288B2 (en)* | 2019-03-18 | 2020-11-25 | 株式会社オーガニックnico | How to generate environmental data in the house |
Citations (58)
| Publication number | Priority date | Publication date | Assignee | Title |
|---|---|---|---|---|
| US6549852B2 (en) | 2001-07-13 | 2003-04-15 | Mzb Technologies, Llc | Methods and systems for managing farmland |
| US6651005B2 (en) | 2000-09-25 | 2003-11-18 | O'neall Donald L. | Method for establishing universal standards for yield measurement |
| US20050100220A1 (en) | 2002-11-06 | 2005-05-12 | Keaton Patricia A. | Method and apparatus for automatically extracting geospatial features from multispectral imagery suitable for fast and robust extraction of landmarks |
| US20100079333A1 (en) | 2008-09-30 | 2010-04-01 | Janky James M | Method and system for location-dependent time-specific correction data |
| US7702597B2 (en) | 2004-04-20 | 2010-04-20 | George Mason Intellectual Properties, Inc. | Crop yield prediction using piecewise linear regression with a break point and weather and agricultural parameters |
| WO2010126783A2 (en) | 2009-04-30 | 2010-11-04 | Roman Gitlin | Method and apparatus for streamlined implementation of interpolation in multiple dimensions |
| CA2697608A1 (en) | 2010-03-23 | 2011-09-23 | Dennis Bulani | Method of predicting crop yield |
| US20110276336A1 (en) | 2010-03-25 | 2011-11-10 | Tracy Sweely | Method and apparatus for managing production complexity of high yield, multiple crop gardening and sustainable farming operations |
| US8065124B2 (en) | 2007-07-19 | 2011-11-22 | China Institute Of Water Resources And Hydropower Research | Method for predicting micro-topographic distribution of terrain |
| US20130066666A1 (en) | 2010-01-22 | 2013-03-14 | Monsanto Technology Llc | Enhancing Performance of Crops Within An Area of Interest |
| US8412419B1 (en) | 2009-09-17 | 2013-04-02 | Helena Chemical Company | System for mapping GIS layers |
| US20130124239A1 (en) | 2011-11-15 | 2013-05-16 | Uriel Rosa | Crop yield per location measurer |
| US20130322753A1 (en) | 2012-05-31 | 2013-12-05 | Apple Inc. | Systems and methods for local tone mapping |
| US20130321677A1 (en) | 2012-05-31 | 2013-12-05 | Apple Inc. | Systems and methods for raw image processing |
| US20140032271A1 (en) | 2012-07-20 | 2014-01-30 | Environmental Systems Research Institute (ESRI) | System and method for processing demographic data |
| US20140067270A1 (en)* | 2012-09-06 | 2014-03-06 | Global Weather Corporation | Weather information system |
| US20140358486A1 (en) | 2014-08-19 | 2014-12-04 | Iteris, Inc. | Continual crop development profiling using dynamical extended range weather forecasting with routine remotely-sensed validation imagery |
| US8917336B2 (en) | 2012-05-31 | 2014-12-23 | Apple Inc. | Image signal processing involving geometric distortion correction |
| US20140379228A1 (en) | 2013-06-21 | 2014-12-25 | Appareo Systems, Llc | Method and system for optimizing planting operations |
| CA2663917C (en) | 2009-04-22 | 2014-12-30 | Dynagra Corp. | Variable zone crop-specific inputs prescription method and systems therefor |
| US20150015692A1 (en) | 2012-01-30 | 2015-01-15 | Scanadu Incorporated | Spatial resolution enhancement in hyperspectral imaging |
| US20150116330A1 (en) | 2013-10-31 | 2015-04-30 | Trimble Navigation Limited | Crop yield data adjustments |
| CN104635281A (en) | 2015-02-17 | 2015-05-20 | 南京信息工程大学 | Method for controlling data quality of automatic meteorological station based on strong weather process correction |
| WO2015092800A1 (en) | 2013-12-19 | 2015-06-25 | Phytech Ltd. | Method and system for treating crop according to predicted yield |
| US20150206255A1 (en) | 2011-05-13 | 2015-07-23 | HydroBio, Inc | Method and system to prescribe variable seeding density across a cultivated field using remotely sensed data |
| US9113118B2 (en) | 2012-05-31 | 2015-08-18 | Apple Inc. | Green non-uniformity correction |
| US9131196B2 (en) | 2012-05-31 | 2015-09-08 | Apple Inc. | Systems and methods for defective pixel correction with neighboring pixels |
| US20150327440A1 (en) | 2014-05-16 | 2015-11-19 | Deere And Company | Multi-sensor crop yield determination |
| US9195891B2 (en) | 2006-11-07 | 2015-11-24 | The Curators Of The University Of Missouri | Method of predicting crop yield loss due to n-deficiency |
| US20150371161A1 (en) | 2013-01-30 | 2015-12-24 | The Board Of Trustees Of The University Of Illinois | System and methods for identifying, evaluating and predicting land use and agricultural production |
| US20150370935A1 (en) | 2014-06-24 | 2015-12-24 | 360 Yield Center, Llc | Agronomic systems, methods and apparatuses |
| US9230177B2 (en) | 2012-01-17 | 2016-01-05 | LimnTech LLC | Apparatus, systems, and methods for determining the location of a roadway mark or portion thereof not meeting standards |
| US20160055593A1 (en) | 2014-08-21 | 2016-02-25 | David P. Groeneveld | System and Method to Predict Field Access and the Potential for Prevented Planting Claims for Use by Crop Insurers |
| US20160050840A1 (en) | 2014-08-22 | 2016-02-25 | The Climate Corporation | Methods for agronomic and agricultural monitoring using unmanned aerial systems |
| US20160063639A1 (en) | 2014-08-26 | 2016-03-03 | David P. Groeneveld | System and Method to Assist Crop Loss Adjusting of Variable Impacts Across Agricultural Fields Using Remotely-Sensed Data |
| US20160066505A1 (en) | 2014-09-05 | 2016-03-10 | The Climate Corporation | Collecting data to generate an agricultural prescription |
| US20160078570A1 (en) | 2014-09-12 | 2016-03-17 | The Climate Corporation | Methods and systems for managing crop harvesting activities |
| US20160073573A1 (en) | 2014-09-12 | 2016-03-17 | The Climate Corporation | Methods and systems for managing agricultural activities |
| US20160078304A1 (en) | 2014-09-12 | 2016-03-17 | Appareo Systems, Llc | Crop quality sensor based on specular reflectance |
| US20160084813A1 (en) | 2014-09-23 | 2016-03-24 | Deere And Company | Yield estimation |
| US20160084987A1 (en) | 2014-09-23 | 2016-03-24 | Deere And Company | Yield estimation |
| GB2531908A (en) | 2014-09-22 | 2016-05-04 | Deere & Co | Method and system for collecting image data |
| US9342858B2 (en) | 2012-05-31 | 2016-05-17 | Apple Inc. | Systems and methods for statistics collection using clipped pixel tracking |
| EP2491721B1 (en) | 2009-10-20 | 2016-06-08 | Apple Inc. | System and method for demosaicing image data using weighted gradients |
| US20160171680A1 (en) | 2014-12-16 | 2016-06-16 | The Board of Trustees of the Land Stanford Junior University | Systems and Methods for Satellite Image Processing to Estimate Crop Yield |
| US20160180473A1 (en) | 2011-05-13 | 2016-06-23 | Hydrobio, Inc. | Systems to prescribe and deliver fertilizer over agricultural fields and related methods |
| WO2016099723A2 (en) | 2014-11-12 | 2016-06-23 | SlantRange, Inc. | Systems and methods for aggregating and facilitating the display of spatially variable geographic data acquired by airborne vehicles |
| US20160202227A1 (en) | 2015-01-14 | 2016-07-14 | Accenture Global Services Limited | Precision agriculture system |
| US20160232621A1 (en) | 2015-02-06 | 2016-08-11 | The Climate Corporation | Methods and systems for recommending agricultural activities |
| US20160247082A1 (en) | 2013-10-03 | 2016-08-25 | Farmers Business Network, Llc | Crop Model and Prediction Analytics System |
| US20160259089A1 (en)* | 2015-03-06 | 2016-09-08 | The Climate Corporation | Estimating temperature values at field level based on less granular data |
| WO2016160384A1 (en) | 2015-04-01 | 2016-10-06 | The Climate Corporation | Forecasting national crop yield during the growing season |
| US20160290918A1 (en) | 2014-09-12 | 2016-10-06 | The Climate Corporation | Forecasting national crop yield during the growing season |
| WO2016164147A1 (en) | 2015-04-08 | 2016-10-13 | The Climate Corporation | Improving weather forecasts through post-processing |
| WO2017104882A1 (en) | 2015-12-18 | 2017-06-22 | 부경대학교 산학협력단 | System for restoring high-resolution precipitation data and method for same |
| CN107300703A (en) | 2017-07-27 | 2017-10-27 | 华云信息技术工程有限公司 | A kind of networking processing system of radar data |
| US20180188417A1 (en) | 2017-01-03 | 2018-07-05 | UBIMET GmbH | Method for increasing the spatial resolution of a weather forecast |
| CN108375807A (en) | 2017-12-01 | 2018-08-07 | 国网北京市电力公司 | The acquisition methods and device of meteorological data |
- 2018
- 2018-09-11USUS16/127,851patent/US10983249B2/enactiveActive
- 2018-09-12WOPCT/CA2018/051127patent/WO2019051590A1/ennot_activeCeased
- 2018-09-12CACA3073290Apatent/CA3073290C/enactiveActive
- 2018-09-12BRBR112020004805-4Apatent/BR112020004805B1/enactiveIP Right Grant
- 2018-09-14ARARP180102628Apatent/AR113061A1/enactiveIP Right Grant
Patent Citations (66)
| Publication number | Priority date | Publication date | Assignee | Title |
|---|---|---|---|---|
| US6651005B2 (en) | 2000-09-25 | 2003-11-18 | O'neall Donald L. | Method for establishing universal standards for yield measurement |
| US6549852B2 (en) | 2001-07-13 | 2003-04-15 | Mzb Technologies, Llc | Methods and systems for managing farmland |
| US20050100220A1 (en) | 2002-11-06 | 2005-05-12 | Keaton Patricia A. | Method and apparatus for automatically extracting geospatial features from multispectral imagery suitable for fast and robust extraction of landmarks |
| US7702597B2 (en) | 2004-04-20 | 2010-04-20 | George Mason Intellectual Properties, Inc. | Crop yield prediction using piecewise linear regression with a break point and weather and agricultural parameters |
| US9195891B2 (en) | 2006-11-07 | 2015-11-24 | The Curators Of The University Of Missouri | Method of predicting crop yield loss due to n-deficiency |
| US8065124B2 (en) | 2007-07-19 | 2011-11-22 | China Institute Of Water Resources And Hydropower Research | Method for predicting micro-topographic distribution of terrain |
| US20100079333A1 (en) | 2008-09-30 | 2010-04-01 | Janky James M | Method and system for location-dependent time-specific correction data |
| CA2663917C (en) | 2009-04-22 | 2014-12-30 | Dynagra Corp. | Variable zone crop-specific inputs prescription method and systems therefor |
| WO2010126783A3 (en) | 2009-04-30 | 2011-01-20 | Roman Gitlin | Method and apparatus for streamlined implementation of interpolation in multiple dimensions |
| WO2010126783A2 (en) | 2009-04-30 | 2010-11-04 | Roman Gitlin | Method and apparatus for streamlined implementation of interpolation in multiple dimensions |
| US8412419B1 (en) | 2009-09-17 | 2013-04-02 | Helena Chemical Company | System for mapping GIS layers |
| EP2491721B1 (en) | 2009-10-20 | 2016-06-08 | Apple Inc. | System and method for demosaicing image data using weighted gradients |
| US20130066666A1 (en) | 2010-01-22 | 2013-03-14 | Monsanto Technology Llc | Enhancing Performance of Crops Within An Area of Interest |
| CA2697608A1 (en) | 2010-03-23 | 2011-09-23 | Dennis Bulani | Method of predicting crop yield |
| US20110276336A1 (en) | 2010-03-25 | 2011-11-10 | Tracy Sweely | Method and apparatus for managing production complexity of high yield, multiple crop gardening and sustainable farming operations |
| US20150206255A1 (en) | 2011-05-13 | 2015-07-23 | HydroBio, Inc | Method and system to prescribe variable seeding density across a cultivated field using remotely sensed data |
| US20160180473A1 (en) | 2011-05-13 | 2016-06-23 | Hydrobio, Inc. | Systems to prescribe and deliver fertilizer over agricultural fields and related methods |
| US20130124239A1 (en) | 2011-11-15 | 2013-05-16 | Uriel Rosa | Crop yield per location measurer |
| US9230177B2 (en) | 2012-01-17 | 2016-01-05 | LimnTech LLC | Apparatus, systems, and methods for determining the location of a roadway mark or portion thereof not meeting standards |
| US20150015692A1 (en) | 2012-01-30 | 2015-01-15 | Scanadu Incorporated | Spatial resolution enhancement in hyperspectral imaging |
| US8917336B2 (en) | 2012-05-31 | 2014-12-23 | Apple Inc. | Image signal processing involving geometric distortion correction |
| US20130321677A1 (en) | 2012-05-31 | 2013-12-05 | Apple Inc. | Systems and methods for raw image processing |
| US9342858B2 (en) | 2012-05-31 | 2016-05-17 | Apple Inc. | Systems and methods for statistics collection using clipped pixel tracking |
| US20130322753A1 (en) | 2012-05-31 | 2013-12-05 | Apple Inc. | Systems and methods for local tone mapping |
| US9131196B2 (en) | 2012-05-31 | 2015-09-08 | Apple Inc. | Systems and methods for defective pixel correction with neighboring pixels |
| US9113118B2 (en) | 2012-05-31 | 2015-08-18 | Apple Inc. | Green non-uniformity correction |
| US20140032271A1 (en) | 2012-07-20 | 2014-01-30 | Environmental Systems Research Institute (ESRI) | System and method for processing demographic data |
| US20140067270A1 (en)* | 2012-09-06 | 2014-03-06 | Global Weather Corporation | Weather information system |
| US20150371161A1 (en) | 2013-01-30 | 2015-12-24 | The Board Of Trustees Of The University Of Illinois | System and methods for identifying, evaluating and predicting land use and agricultural production |
| US20140379228A1 (en) | 2013-06-21 | 2014-12-25 | Appareo Systems, Llc | Method and system for optimizing planting operations |
| US20160247082A1 (en) | 2013-10-03 | 2016-08-25 | Farmers Business Network, Llc | Crop Model and Prediction Analytics System |
| US20150116330A1 (en) | 2013-10-31 | 2015-04-30 | Trimble Navigation Limited | Crop yield data adjustments |
| WO2015092800A1 (en) | 2013-12-19 | 2015-06-25 | Phytech Ltd. | Method and system for treating crop according to predicted yield |
| US20150327440A1 (en) | 2014-05-16 | 2015-11-19 | Deere And Company | Multi-sensor crop yield determination |
| US20150370935A1 (en) | 2014-06-24 | 2015-12-24 | 360 Yield Center, Llc | Agronomic systems, methods and apparatuses |
| WO2015200489A1 (en) | 2014-06-24 | 2015-12-30 | 360 Yield Center, Llc | Agronomic system, methods and apparatuses |
| US20140358486A1 (en) | 2014-08-19 | 2014-12-04 | Iteris, Inc. | Continual crop development profiling using dynamical extended range weather forecasting with routine remotely-sensed validation imagery |
| US9131644B2 (en) | 2014-08-19 | 2015-09-15 | Iteris, Inc. | Continual crop development profiling using dynamical extended range weather forecasting with routine remotely-sensed validation imagery |
| US20160055593A1 (en) | 2014-08-21 | 2016-02-25 | David P. Groeneveld | System and Method to Predict Field Access and the Potential for Prevented Planting Claims for Use by Crop Insurers |
| US20160050840A1 (en) | 2014-08-22 | 2016-02-25 | The Climate Corporation | Methods for agronomic and agricultural monitoring using unmanned aerial systems |
| US20160063639A1 (en) | 2014-08-26 | 2016-03-03 | David P. Groeneveld | System and Method to Assist Crop Loss Adjusting of Variable Impacts Across Agricultural Fields Using Remotely-Sensed Data |
| US20160066505A1 (en) | 2014-09-05 | 2016-03-10 | The Climate Corporation | Collecting data to generate an agricultural prescription |
| US20160071410A1 (en) | 2014-09-05 | 2016-03-10 | The Climate Corporation | Updating execution of tasks of an agricultural prescription |
| US20160071223A1 (en) | 2014-09-05 | 2016-03-10 | The Climate Corporation | Estimating crop yield data |
| WO2016037105A1 (en) | 2014-09-05 | 2016-03-10 | The Climate Corporation | Updating execution of tasks of an agricultural prescription |
| US20160078570A1 (en) | 2014-09-12 | 2016-03-17 | The Climate Corporation | Methods and systems for managing crop harvesting activities |
| US20160073573A1 (en) | 2014-09-12 | 2016-03-17 | The Climate Corporation | Methods and systems for managing agricultural activities |
| US20160078304A1 (en) | 2014-09-12 | 2016-03-17 | Appareo Systems, Llc | Crop quality sensor based on specular reflectance |
| US20160290918A1 (en) | 2014-09-12 | 2016-10-06 | The Climate Corporation | Forecasting national crop yield during the growing season |
| GB2531908A (en) | 2014-09-22 | 2016-05-04 | Deere & Co | Method and system for collecting image data |
| US20160084987A1 (en) | 2014-09-23 | 2016-03-24 | Deere And Company | Yield estimation |
| US20160084813A1 (en) | 2014-09-23 | 2016-03-24 | Deere And Company | Yield estimation |
| WO2016099723A2 (en) | 2014-11-12 | 2016-06-23 | SlantRange, Inc. | Systems and methods for aggregating and facilitating the display of spatially variable geographic data acquired by airborne vehicles |
| US20160171680A1 (en) | 2014-12-16 | 2016-06-16 | The Board of Trustees of the Land Stanford Junior University | Systems and Methods for Satellite Image Processing to Estimate Crop Yield |
| US20160202227A1 (en) | 2015-01-14 | 2016-07-14 | Accenture Global Services Limited | Precision agriculture system |
| US20160232621A1 (en) | 2015-02-06 | 2016-08-11 | The Climate Corporation | Methods and systems for recommending agricultural activities |
| WO2016127094A1 (en) | 2015-02-06 | 2016-08-11 | The Climate Corporation | Methods and systems for recommending agricultural activities |
| CN104635281A (en) | 2015-02-17 | 2015-05-20 | 南京信息工程大学 | Method for controlling data quality of automatic meteorological station based on strong weather process correction |
| WO2016144818A1 (en) | 2015-03-06 | 2016-09-15 | The Climate Corporation | Estimating temperature values at field level based on less granular data |
| US20160259089A1 (en)* | 2015-03-06 | 2016-09-08 | The Climate Corporation | Estimating temperature values at field level based on less granular data |
| WO2016160384A1 (en) | 2015-04-01 | 2016-10-06 | The Climate Corporation | Forecasting national crop yield during the growing season |
| WO2016164147A1 (en) | 2015-04-08 | 2016-10-13 | The Climate Corporation | Improving weather forecasts through post-processing |
| WO2017104882A1 (en) | 2015-12-18 | 2017-06-22 | 부경대학교 산학협력단 | System for restoring high-resolution precipitation data and method for same |
| US20180188417A1 (en) | 2017-01-03 | 2018-07-05 | UBIMET GmbH | Method for increasing the spatial resolution of a weather forecast |
| CN107300703A (en) | 2017-07-27 | 2017-10-27 | 华云信息技术工程有限公司 | A kind of networking processing system of radar data |
| CN108375807A (en) | 2017-12-01 | 2018-08-07 | 国网北京市电力公司 | The acquisition methods and device of meteorological data |
Non-Patent Citations (7)
| Title |
|---|
| European Commission—Joint Research Centre, "Interpolation of observed weather," Apr. 2018, 7 pages [Online] [Retrieved Nov. 28, 2018], Retrieved from the internet: <URL https://marswiki.jrc.ec.europa.eu/agri4castwiki/index.php/Interpolation of observed weather>. |
| Hofstra, N. et al., "Comparison of Six Methods for the Interpolation of Daily, European Climate Data," American Geophysical Union, Journal of Geophysical Research, vol. 113, D21110, 2008, 19 pages. |
| Li, J. et al., "A Review of Spatial Interpolation Methods for Environmental Scientists," Australian Government, Record 2008/23, Geocat#68229, 2008, 154 pages. |
| PCT International Search Report and Written Opinion, PCT Application No. PCT/CA2018/051127, dated Sep. 12, 2018, nine pages. |
| Sluiter, R., "Interpolation Methods for Climate Data", Intern Rapport; IR Apr. 2009, Literature review, KNMI, R&D Information and Observation Technology, De Bilt, Nov. 19, 2008, Version 1.0, 28 pages. |
| Stahl, K. et al., "Comparison of approaches for spatial interpolation of daily air temperature in a large region with complex topography and highly variable station density," Agricultural and Forest Meteorology, vol. 139, No. 3-4, 2006, pp. 224-236. |
| Van Der Voet, P. et al., "Spatial interpolation of daily meteorological data," DLO Winand Staring Centre, vol. 53, No. 3, 1994, 100 pages. |
Also Published As
| Publication number | Publication date |
|---|---|
| BR112020004805B1 (en) | 2023-12-12 |
| CA3073290A1 (en) | 2019-03-21 |
| BR112020004805A2 (en) | 2020-09-24 |
| AR113061A1 (en) | 2020-01-22 |
| WO2019051590A1 (en) | 2019-03-21 |
| CA3073290C (en) | 2022-01-18 |
| US20190079214A1 (en) | 2019-03-14 |
Similar Documents
| Publication | Publication Date | Title |
|---|---|---|
| US11022719B2 (en) | Statistical blending of weather data sets | |
| JP7572135B2 (en) | Estimation of crop pest and/or disease risk at farm subdivision level | |
| US10772269B2 (en) | Predicting crop productivity via intervention planning on small-scale farms | |
| AU2016320792B2 (en) | Generating probabilistic estimates of rainfall rates from radar reflectivity measurements | |
| AU2016326330B2 (en) | Ponding water detection on satellite imagery | |
| Lorite et al. | Using weather forecast data for irrigation scheduling under semi-arid conditions | |
| EP3465257B1 (en) | Computing radar based precipitation estimate errors based on precipitation gauge measurements | |
| Souza et al. | Interpolation type and data computation of crop yield maps is important for precision crop production | |
| BR112019000719B1 (en) | METHOD FOR GENERATING PIXEL MAPS FROM NON-IMAGE DATA AND DIFFERENCE METRICS FOR PIXEL MAPS | |
| WO2017106962A1 (en) | System and method for real-time water management | |
| US20230360389A1 (en) | Systems and methods of urban rooftop agriculture with smart city data integration | |
| Luedeling | Interpolating hourly temperatures for computing agroclimatic metrics | |
| Wang et al. | Evaluation of dynamically downscaled extreme temperature using a spatially-aggregated generalized extreme value (GEV) model | |
| US10983249B2 (en) | Indicator interpolation to predict a weather state | |
| Tisseyre et al. | How to define the optimal grid size to map high resolution spatial data? | |
| Heuvelink et al. | Space-time geostatistics | |
| US11523248B2 (en) | Inference of logistical relationships from device location data | |
| Kumar et al. | Integrating wireless sensing and decision support technologies for real-time farmland monitoring and support for effective decision making: Designing and deployment of WSN and DSS for sustainable growth of Indian agriculture | |
| US20240168961A1 (en) | Methods and systems for soil data interpolation | |
| Zanella et al. | Internet of things for hydrology: Potential and challenges | |
| Gommes et al. | 29 Beyond simple, one-station rainfall indices | |
| Diodato et al. | Finding simplicity in storm erosivity modelling | |
| El-Naggar et al. | Field evaluation of a commercial variable-rate irrigation decision support system–a study for maize and sweet corn | |
| Sylka et al. | Use of the Web GIS for the post-disaster management: A case of mapping the damaged vineyards areas caused by hailstorm | |
| Mitrofanova et al. | Approach for Long-Term Forecasting of Frosts and Droughts in Smart Agriculture |
Legal Events
| Date | Code | Title | Description |
|---|---|---|---|
| FEPP | Fee payment procedure | Free format text:ENTITY STATUS SET TO UNDISCOUNTED (ORIGINAL EVENT CODE: BIG.); ENTITY STATUS OF PATENT OWNER: SMALL ENTITY Free format text:ENTITY STATUS SET TO UNDISCOUNTED (ORIGINAL EVENT CODE: BIG.); ENTITY STATUS OF PATENT OWNER: LARGE ENTITY | |
| FEPP | Fee payment procedure | Free format text:ENTITY STATUS SET TO SMALL (ORIGINAL EVENT CODE: SMAL); ENTITY STATUS OF PATENT OWNER: SMALL ENTITY Free format text:ENTITY STATUS SET TO SMALL (ORIGINAL EVENT CODE: SMAL); ENTITY STATUS OF PATENT OWNER: LARGE ENTITY | |
| AS | Assignment | Owner name:FARMERS EDGE INC., CANADA Free format text:ASSIGNMENT OF ASSIGNORS INTEREST;ASSIGNOR:MASHHOORI, ALI;REEL/FRAME:047057/0348 Effective date:20180912 | |
| STPP | Information on status: patent application and granting procedure in general | Free format text:APPLICATION DISPATCHED FROM PREEXAM, NOT YET DOCKETED | |
| STPP | Information on status: patent application and granting procedure in general | Free format text:DOCKETED NEW CASE - READY FOR EXAMINATION | |
| FEPP | Fee payment procedure | Free format text:ENTITY STATUS SET TO UNDISCOUNTED (ORIGINAL EVENT CODE: BIG.); ENTITY STATUS OF PATENT OWNER: SMALL ENTITY Free format text:ENTITY STATUS SET TO UNDISCOUNTED (ORIGINAL EVENT CODE: BIG.); ENTITY STATUS OF PATENT OWNER: LARGE ENTITY | |
| STPP | Information on status: patent application and granting procedure in general | Free format text:NOTICE OF ALLOWANCE MAILED -- APPLICATION RECEIVED IN OFFICE OF PUBLICATIONS | |
| STPP | Information on status: patent application and granting procedure in general | Free format text:PUBLICATIONS -- ISSUE FEE PAYMENT RECEIVED | |
| STPP | Information on status: patent application and granting procedure in general | Free format text:PUBLICATIONS -- ISSUE FEE PAYMENT VERIFIED | |
| STCF | Information on status: patent grant | Free format text:PATENTED CASE | |
| FEPP | Fee payment procedure | Free format text:ENTITY STATUS SET TO SMALL (ORIGINAL EVENT CODE: SMAL); ENTITY STATUS OF PATENT OWNER: SMALL ENTITY | |
| FEPP | Fee payment procedure | Free format text:MAINTENANCE FEE REMINDER MAILED (ORIGINAL EVENT CODE: REM.); ENTITY STATUS OF PATENT OWNER: SMALL ENTITY | |
| FEPP | Fee payment procedure | Free format text:SURCHARGE FOR LATE PAYMENT, SMALL ENTITY (ORIGINAL EVENT CODE: M2554); ENTITY STATUS OF PATENT OWNER: SMALL ENTITY | |
| MAFP | Maintenance fee payment | Free format text:PAYMENT OF MAINTENANCE FEE, 4TH YR, SMALL ENTITY (ORIGINAL EVENT CODE: M2551); ENTITY STATUS OF PATENT OWNER: SMALL ENTITY Year of fee payment:4 |