US10740772B2 - Systems and methods for forecasting based upon time series data - Google Patents
Systems and methods for forecasting based upon time series dataDownload PDFInfo
- Publication number
- US10740772B2 US10740772B2US15/154,697US201615154697AUS10740772B2US 10740772 B2US10740772 B2US 10740772B2US 201615154697 AUS201615154697 AUS 201615154697AUS 10740772 B2US10740772 B2US 10740772B2
- Authority
- US
- United States
- Prior art keywords
- data
- datasets
- forecast
- dataset
- indicators
- Prior art date
- Legal status (The legal status is an assumption and is not a legal conclusion. Google has not performed a legal analysis and makes no representation as to the accuracy of the status listed.)
- Active, expires
Links
Images


Classifications
- G—PHYSICS
- G06—COMPUTING OR CALCULATING; COUNTING
- G06Q—INFORMATION AND COMMUNICATION TECHNOLOGY [ICT] SPECIALLY ADAPTED FOR ADMINISTRATIVE, COMMERCIAL, FINANCIAL, MANAGERIAL OR SUPERVISORY PURPOSES; SYSTEMS OR METHODS SPECIALLY ADAPTED FOR ADMINISTRATIVE, COMMERCIAL, FINANCIAL, MANAGERIAL OR SUPERVISORY PURPOSES, NOT OTHERWISE PROVIDED FOR
- G06Q30/00—Commerce
- G06Q30/02—Marketing; Price estimation or determination; Fundraising
- G06Q30/0201—Market modelling; Market analysis; Collecting market data
- G06Q30/0202—Market predictions or forecasting for commercial activities
- G—PHYSICS
- G06—COMPUTING OR CALCULATING; COUNTING
- G06F—ELECTRIC DIGITAL DATA PROCESSING
- G06F16/00—Information retrieval; Database structures therefor; File system structures therefor
- G06F16/20—Information retrieval; Database structures therefor; File system structures therefor of structured data, e.g. relational data
- G06F16/24—Querying
- G06F16/245—Query processing
- G06F16/2455—Query execution
- G06F16/24553—Query execution of query operations
- G—PHYSICS
- G06—COMPUTING OR CALCULATING; COUNTING
- G06F—ELECTRIC DIGITAL DATA PROCESSING
- G06F16/00—Information retrieval; Database structures therefor; File system structures therefor
- G06F16/20—Information retrieval; Database structures therefor; File system structures therefor of structured data, e.g. relational data
- G06F16/25—Integrating or interfacing systems involving database management systems
- G06F16/252—Integrating or interfacing systems involving database management systems between a Database Management System and a front-end application
Definitions
- the present inventionrelates to systems and methods for analyzing time series data to generate forecasts. These forecasts enable the analysis and display of statistical relationships between data series.
- systems and methods for forecasting using time series dataare provided. Such systems and methods enable more efficient generation of relevant and usable forecast models and enhanced business analytics.
- a compositemay be generated by receiving datasets, normalizing them, and receiving formula configurations in order to combine the datasets together. As new data becomes available the composites are automatically updated.
- the datasets utilizedmay be any internal or external data source, including demographics data, meteorological data, climatic data, weather conditions, environmental data, industrial data and international financial market conditions. Normalizing the datasets includes shifting a time domain for the datasets such that all of the normalized datasets have a common time domain, converting the selected datasets into a percentage value, converting the selected datasets into a dollar value, or converting the selected datasets into a dollar versus time value.
- the transformation of a datasetmay be restricted if the accuracy of the transformation would be decreased, and if no suitable alternate dataset is available.
- These transformationsmight include aggregation of the dataset for use in a forecast. Aggregation may include a roll up of a rate of change. Accuracy is measured as an impact upon the forecast. Upon rejection the user may be notified, and if available, an alternate dataset may be suggested for use.
- a forecastmay be generated.
- the userlogs into an account and selects a forecast type, a calculation type, a cutoff period, a pre-adjustment and a post adjustment.
- the usermay search for desired indicators and select ones that are to be utilized. Indicators presented to the user may be limited due to the user's account access controls. The user may then set weights and time offsets for each of the selected indicators.
- the forecastermay then generate an R 2 value, a procyclic value and a countercyclic value for each of the indicators given the weight factor and time offset received. This allows the user to adjust these values until the statistical measures for the indicator match the user's desires. Then the forecast may be generated using the selection of indicators and corresponding weight factor and time offset, the forecast type, the calculation type, the cutoff period, the pre-adjustment and the post adjustment. Forecasts may be updated as updates to the underlying data become available.
- the forecastmay be generated by applying a transformation to the selection of indicators, calculating a percent change based upon date for each selection of indicators, arranging the percent change over a set period defined by the cutoff period, and multiplying the arranged percent change by previous years' value.
- the transformationmay include normalizing each of the indicators, applying the time offset corresponding to each of the indicators, and multiplying the indicators by their corresponding weight factor.
- the forecast analysismay be updated by locking the time domain for one or more of the indicators.
- the time domain for the other indicatorsmay be altered, and new statistical measures may be generated accordingly.
- Forecast resultsmay be outputted to a spreadsheet or other system utilizing add-ins.
- Any composite or forecast generatedmay be stored within a model repository for later use as an indicator. This allows for ‘nested’ forecasts. Any update to the underlying data percolates up through the nested composites and forecasts ensuring that no forecast becomes stale.
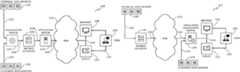
- FIG. 1Ais an example logical diagram of a data management and forecasting system, in accordance with some embodiments.
- FIG. 1Bis a second example logical diagram of a data management and forecasting system, in accordance with some embodiments.
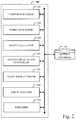
- FIG. 2is an example logical diagram of an application server, in accordance with some embodiments.
- FIG. 3is a flow chart diagram of an example high level process for forecasting utilizing time series datasets, in accordance with some embodiments
- FIG. 4is a flow chart diagram of an example high level process for the generation of composites, in accordance with some embodiments.
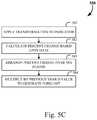
- FIG. 5A-Care flow chart diagrams of an example processes for the generation of the forecasts, in accordance with some embodiments.
- FIG. 6is a flow chart diagram of an example process for the analysis of the forecasts, in accordance with some embodiments.
- FIGS. 7-15Bare example screenshots illustrating the forecasting using time series datasets, in accordance with some embodiments.
- FIGS. 16A and 16Billustrate exemplary computer systems capable of implementing embodiments of the data management and forecasting system.
- the present inventionrelates to systems and methods for using time series data to generate composites, forecasts, and to analyze said forecasts to derive insights. Such systems and methods allow for superior forecasting ability, efficient model development, and enhanced analysis tools. Ultimately, any analyst may utilize embodiments of the disclosed systems and methods to generate more effective recommendations, or alter behaviors.
- FIG. 1Ais an example logical diagram of a data management and forecasting system 100 .
- the data analysis system 100connects a given analyst user 105 through a network 110 to the system application server 115 .
- An database 120(or other suitable dataset based upon forecast sought) is linked to the system application server via connection 121 and the database 120 thus provides access to the data necessary for utilization by the application server 115 .
- the database 120is populated with data delivered by and through the data aggregation server 125 via connection 126 .
- Data aggregation server 125is configured to have access to a number of data sources, for instance external data sources 130 through connection 131 .
- the data aggregation servercan also be configured to have access to proprietary or internal data sources, i.e. customer data sources, 132 , through connection 133 .
- the aggregated datamay be stored in a relational database (RDBM) or in big data-related storage facilities (e.g., Hadoop, NoSQL), with its formatting pre-processed to some degree (if desired) to conform to the data format requirement of the analysis component.
- RDBMrelational database
- big data-related storage facilitiese.g., Hadoop, NoSQL
- Network 110provides access to the user or data analyst (the user analyst).
- User analyst 105will typically access the system through an internet browser, such as Mozilla Firefox, or a standalone application, such as an app on tablet 151 .
- the user analyst(as shown by arrow 135 ) may use an internet connected device such as browser terminal 150 , whether a personal computer, mainframe computer, or VT100 emulating terminal.
- mobile devicessuch as a tablet computer 151 , smart telephone, or wirelessly connected laptop, whether operated over the internet or other digital telecommunications networks, such as a 3G network.
- a data connection 140is established between the terminal (i.e. 150 or 151 ) through network 110 to the application server 115 through connection 116 .
- Network 110is depicted as a network cloud and as such is representative of a wide variety of telecommunications networks, for instance the world wide web, the internet, secure data networks, such as those provided by financial institutions or government entities such as the Department of Treasury or Department of Commerce, internal networks such as local Ethernet networks or intranets, direct connections by fiber optic networks, analog telephone networks, through satellite transmission, or through any combination thereof.
- secure data networkssuch as those provided by financial institutions or government entities such as the Department of Treasury or Department of Commerce
- internal networkssuch as local Ethernet networks or intranets
- the database 120serves as an online available database repository for collected data including such data as internal metrics.
- Internal metricscan be comprised of, for instance, company financial data of a company or other entity, or data derived from proprietary subscription sources. Economic, demographic, and statistical data that are collected from various sources and stored in a relational database, may reside in a local hardware set or within a company intranet, or may be hosted and maintained by a third-party and made accessible via the internet.
- the application server 115provides access to a system that provides a set of calculations based on system formula used to calculate the leading, lagging, coincident, procyclic, acyclic, and counter-cyclic nature of economic, demographic, or statistical data compared to internal metrics, e.g., company financial results, or other external metrics.
- the systemalso provides for formula that may be used to calculate forecast results based on projected or actual economic, demographic, and statistical data and company financial or sold volume or quantity data. These calculations can be displayed by the system in chart or other graphical format.
- a chartmay be displayed showing the various relationships between leading, lagging, coincident, procyclic, acyclic, or counter-cyclic company data when compared to macroeconomic, demographic, or statistical data, for instance.
- Another set of charting systemsis configurable to display forecasted results of company financial, or sold volume or quantity data and economic, demographic, or statistical data as a highlighted plot on a software-based chart that compares the raw or formatted indicator data to a selected indicator.
- the change observed in a metricis also classified according to its direction of change relative to the indicator that it is being measured against.
- the relationshipis said to be ‘procyclic’.
- the changeis in the opposite direction as the indicator, the relationship is said to be ‘countercyclic’. Because it is rare that any two metrics will be fully procyclic or countercyclic, it is also possible that a metric and an indicator can be acyclic—i.e., the metric exhibits both procyclic and countercyclic movement with respect to the indicator.
- the application residing on server 115is provided access to interact with the customer datasource(s) 132 through the database 120 to perform automatic calculations which identify leading, lagging, and coincident indicators as well as the procyclic, acyclic, and counter-cyclic relationships between customer data and the available economic, demographic, and statistical data.
- Users 105 of the software applications that can be made available on the application server 115are able to select and view charts or monitor dashboard modules displaying the results of the calculations performed by the system.
- the user 105can select data in the customer repository for use in the calculations that may allow the user to forecast future performance.
- the types of indicators and internal dataare discussed in more detail in connection with the discourse accompanying the following figures. Alternatively, users can view external economic, demographic, and statistical data only and do not have to interface with internal results, at the option of the user.
- Datais collected for external indicators and internal metrics of a company through the data aggregation server 125 .
- the formulas built into the applicationassist the users 105 to identify relationships between the data. Users 105 can then use the charting components to view the results of the calculations and forecasts.
- the datacan be entered into the database 120 manually, as opposed to utilizing the data aggregation server 125 and interface for calculation and forecasting. Users 105 can enter and view any type of data and use the applications to view charts and graphs of the data.
- FIG. 1Bdepicts components of the system in an exemplary configuration to achieve enhanced data security and internal accessibility while maintaining the usefulness of the system and methods disclosed herein.
- the data management and analysis system 101may be configured in such a manner so that the application and aggregation server functions described in connection with FIG. 1A are provided by one or more internal application/aggregation servers 160 .
- the internal server 160access external data sources 180 through metrics database 190 , which may have its own aggregation implementation as well.
- the internal serveraccesses the metrics database 190 through the web or other such network 110 via connections 162 and 192 .
- the metrics database 190acquires the appropriate data sets from one or more external sources, as at 180 , through connection 182 .
- the one or more customer data sources 170may be continue to be housed internally and securely within the internal network.
- the internal server 160accesses the various internal sources 170 via connection 172 , and implements the same type of aggregation techniques described above.
- the user 105 of the systemthen accesses the application server 160 with a tablet 151 or other browser software 150 via connections 135 and 140 , as in FIG. 1A .
- External data sources 130 and 180may be commercial data subscriptions, public data sources, or data entered into an accessible form manually.
- FIG. 2is an example logical diagram of an application server 160 that includes various subcomponents that act in concert to enable the analysis of the aggregated data.
- the data being leveraged for forecasting and analysisincludes economic, demographic, geopolitical, public record and statistical data.
- the systemutilizes any time series dataset. This time series data stored in the metrics database 120 , is available to all subsystems of the application server 160 for manipulation, transformation, aggregation, and analysis.
- the subcomponents of the application server 160are illustrated as unique modules within the server coupled by a common bus. While this embodiment is useful for clarification purposes, it should be understood that the presently discussed application server may consist of logical subcomponents operating within a single or distributed computing architecture, may include individual and dedicated hardware for each of the enumerated subcomponents, may include hard coded firmware devices within a server architecture, or any permutation of the embodiments described above. Further, it should be understood that the listed subcomponents are not an exhaustive listing of the functionality of the application server 160 , and as such more or fewer than the listed subcomponents could exist in any given embodiment of the application server when deployed.
- the application server 160includes a composite builder 210 that is capable of combining various metrics from the metric database 120 (also referred to as factors or indicators), and manipulate them in order to generate composite indexes. These composites enable are entirely new datasets generated by transforming one or more existing datasets.
- the composite builder 210also has the ability to assign access controls to the composites (to ensure organizational security and protection of intellectual property), and automatically update the composites as updated underlying data becomes available.
- the composite builder 210may provide suggestions to a user for inclusion of particular indicator data and possible manipulations based upon data type and statistical measures.
- the application server 160also includes a forecast builder 220 which is the heart of the analytics tools available to the user.
- the forecast builder's 220 functionalityshall be discussed in considerable details below; however, at its root it allows for the advanced compilation of many indicators (including other published composite metrics and forecasts) and enables unique manipulation of these datasets in order to generate forecasts from any time series datasets. Some of the manipulations enabled by the forecast builder are the ability to visualize, on the fly, the R 2 , procyclic and countercyclic values for each indicator compared to the forecast, and further allows for the locking of any indicators time domain, and to shift other indicators and automatically update statistical measures.
- the forecast builder 220may provide the user suggestions of suitable indicators, and manipulations to indicators to ensure a ‘best’ fit between prior actuals and the forecast over the same time period.
- the ‘best’ fitmay include a localized maxima optimization of weighted statistical measures.
- the R 2 , procyclic and countercyclic valuescould each be assigned a multiplier and the time domain offset used for any given indicator could be optimized for accordingly.
- the multipliers/weightscould, in some embodiments, be user defined.
- the application server 160also includes a Rate of Change of Economic Trends (ROCET) calculator 230 .
- This calculatoris capable of generating trend information, including determining the speed of which the trend is changing. This may be accomplished by generating an equation that matches the trend line (via figure of merit or other method) and taking the derivative to determine the rate of change of the trend.
- ROCETRate of Change of Economic Trends
- the application server 160also includes an access controller 240 to protect various data from improper access. Even within an organization, it may be desirable for various employees or agents to have split access to various sensitive data sources, forecasts or models. Further, within a service or consulting organization, it is very important to separate various client's data, and role access control enables this data from being improperly comingled.
- a model display engine 250enables the graphical presentation of the models and forecasts. This module provides interfaces that allow for efficient and easy manipulation of data in a graphical format. In subsequent sections examples of screenshots of these interfaces will be provided for greater clarification.
- An add-in manager 260provides add-in application interfaces (APIs), emails, XLS and/or via subscriptions in order to export data for various external systems.
- APIsadd-in application interfaces
- emailsemail
- XLSXLS
- subscriptionsin order to export data for various external systems.
- the systemmay include Microsoft Excel®, SAP® and similar extensions for outputting raw data sets, forecast calculations and models.
- a publisher 270allows for the composites generated by the composite builder 210 , and forecasts generated via the forecast builder 220 to be published, with appropriate access controls, into a model library.
- This librarymay be stored in the metrics database 120 for search and utilization in order composite and forecast builds.
- Such a publishing capacityenables subsequent forecasts to have nested composite or forecasts incorporated into the calculation.
- Nesting forecastsenables more modular forecast builds. Any composite or forecast that has been published in the model library is updated as the underlying data sources are updated.
- the application serverreduces the time and effort in statistics analysis of data.
- the application serverno longer requires user expertise. The result is substantially reduced user effort needed for the generation of timely and accurate predictive forecasts.
- FIG. 3is a flow chart diagram of an example high level process 300 for forecasting utilizing time series datasets.
- the user of the systeminitially logs in (at 310 ) using a user name and password combination, biometric identifier, physical or software key, or other suitable method for accessing the system with a defined user account.
- the user accountenables proper access control to datasets to ensure that data is protected within an organization and between organizations.
- the user role accessis confirmed (at 320 ) and the user is able to search and manipulate appropriate datasets. This allows the user to generate composites (at 330 ) for enhanced analysis.
- a compositeis an entirely new dataset generated via the compilation, transformation and aggregation of existing indicator data sets.
- FIG. 4provides a more detailed example high level process for the generation of composites.
- the userinitially selects a dataset to be utilized (at 410 ).
- This selectionmay employ the user searching for a specific dataset using a keyword search.
- the datasets matching the keywordmay be presented to the user for selection.
- the search resultsmay be ordered by best match to the keyword.
- the search resultsmay be ordered by alternate metrics, such as popularity of a given indicator (used in many other forecast models), accuracy of indicator data, frequency of indicator data being updated, or ‘fit’ between the indicator and the composite.
- Search resultsmay further be sorted and filtered by certain characteristics of the data series, for instance, by region, industry, category, attribute, or the like. In some cases, search display may depend upon a weighted algorithm of any combination of the above factors.
- a ‘fit’ between the composite and the indicatormay be measured by the R 2 , procyclic and/or countercyclic value when comparing the indicator to the composite.
- indicators with a high degree of ‘fit’may include stock prices for home improvement companies, number of building permit starts reported by the government, and raw material costs for concrete, lumber and steel, for example.
- some embodiments of the methodmay generate suggestions for indicators to the user independent of the search feature. Likewise, when a user selects an indicator, the system may be able to provide alternate recommendations of ‘better’ indicators based on any of the above factors.
- the next stepis to normalize the datasets (at 420 ). This may include transforming all the datasets into a percent change over a given time period, an absolute dollar amount over a defined time period, or the like. Likewise, periods of time may also be normalized, such that the analysis window for all factors is equal.
- the useris able to configure a formula that takes each indicator and allows them to be combined (at 430 ). In some embodiments, this formula is freeform, allowing the user to tailor the formula however desired.
- the formula configurationincludes a set of discrete transformations, including providing each indicator with a weight, and allowing the indicators to be added/subtracted and/or multiplied or divided against any other single or group of indicators.
- the systemcalculates the composite (at 440 ) and waits for a change in the underlying datasets (at 450 ). At any time the composite may be output for usage by another tool, such as a forecast (at 470 ), but upon a change to one of the indicators that comprises the composite, the method may cause a real-time update of the composite calculation (at 460 ). Any downstream tool the composite has been incorporated into will likewise receive an update.
- the methoddetermines if it is desirable to publish the composite as an indicator (at 340 ) within the model library (as previously discussed). If so, then the composite is published (at 350 ) with appropriate access controls. Any access controls applied to the underlying datasets are automatically applied to the composite, in some embodiments, and further access controls may be enforced by the composite author as well.
- a forecastmay be generated (at 360 ), which is described in considerably more detail in reference to FIGS. 5A-5C .
- the forecast generation process 360initially begins with the selection of an indicator (at 510 ).
- This selection processmay include searches or suggestions of indicators in much the same manner as described above in relation to the building of a composite.
- the suggestion of an indicator(or display or search results, depending upon embodiment), may be driven by popularity of a given indicator, accuracy of indicator data, frequency of indicator data being updated, or ‘fit’ between the indicator and the forecast.
- the systemAfter the indicator has been selected, the system performs a check on whether the selected indicator is relative to the forecast (at 520 ). This step enables data that loses granularity, or becomes less accurate, upon transformation for the forecast, to be identified and either replaced or weeded out. For example, in some cases a set of revenue data may be needed to be converted into a year-over-year indicator. This aggregation may cause an artificial suppression of the indicator's value, and thus negatively impact the forecast. Such data is deemed not relative, and the method looks for whether raw data is available for the metric being sought (at 530 ). For example, maybe there is a metric for such year-over-year measure, or other revenue data of sufficient frequency that the system could generate such data without a loss of accuracy.
- the methodmay forecast using the appropriate data (at 540 ). Otherwise, the method may outright reject the indicator as being included in the forecast (at 550 ). This may include an error message provided to the user explaining why the dataset is improper for the forecast.
- Forecast typeis selected by the user (at 571 ).
- Forecast typemay include segmented multivariate forecast, linear regression models, piecewise linear models, or the like.
- the calculation typemay be selected (at 572 ). Calculation types include year-over-year percent changes, month-over-month, three month moving averages, actual values, and the like.
- the userselects the cutoff period for the forecast (at 573 ).
- thisis a time period in the future that provides the user with useful insight into business decisions, or other actions, that are to be taken in the near future.
- Many forecastsperform very well for some limited period of time, but then rapidly degrade.
- These forecast modelswhen viewed in the aggregate, are seen as very poor predictors.
- these modelswhen subject to a cutoff period, these models may in fact be extremely high performing over the time period of concern. For this reason, the cutoff period is initially set in order to select the best forecast parameters and indicators over the period of interest.
- pre-adjustment factors and post-adjustment factorsare set (at 574 and 575 respectively). These factors are multipliers to the forecast and/or indicators that account for some anomaly in the data. For example, a major snowstorm impacting the eastern seaboard may have an exaggerated impact upon heating costs in the region. If the forecast is for global demand for heating oil, this unusual event may skew the final forecast. An adjustment factor may be leveraged in order to correct for such events.
- a weight and a time offsetis provided (at 576 and 577 respectively).
- the weightmay be any positive or negative number, and is a multiplier against the indicator to vary the influence of the indicator in the final model.
- a negative weightwill reverse procyclic and countercyclic indicators. Determining whether an indicator relationship exists between two data series, as well as the nature and characteristics of such a relationship, if found, can be a very valuable tool. Armed with the knowledge, for example, that certain macroeconomic metrics are predictors of future internal metrics, business leaders can adjust internal processes and goals to increase productivity, profitability, and predictability.
- the time offsetallows the user to move the time domain of any indicator relevant to the forecast.
- the global temperaturemay have a thirty day lag in reflecting in heating oil prices.
- refining capacity versus crude supplymay be a leading indicator of the heating oil prices.
- an R 2 value, procyclic value and countercyclic valueis generated in real time for any given weight and time offset.
- These statistical measuresenable the user to tailor their model according to their concerns.
- the weights and offsets for the indicatorsmay be auto-populated by the method with suggested values. These values, as previously touched upon, may employ an optimization algorithm of weighted statistical measures.
- the R 2 value, procyclic value and countercyclic valuesmay be weighted and combined, and maximum value generated by a specific weight and offset can be suggested.
- FIG. 5Cdetails this example process 580 for calculating the forecast.
- the indicatorsare transformed (at 581 ) according to the previously defined parameters.
- the indicatormay be transformed into a common format such as year-over-year percent change.
- the percent changeis determined for each date based upon the transformed indicators (at 582 ), and the percent change is arranged over the set period (at 583 ) defined by the cutoff period.
- the previous year's valueis multiplied by this percent change for each given date to generate the forward forecast (at 584 ).
- Forward forecasted indicatorsmay then be weighted and offset according to the defined parameters.
- the forecasted indicatorsmay also be summed and have the pre and post adjustments applied in order to generate the final forecast value.
- the forecastis subsequently analyzed (at 370 ). The process continues by determining if the forecast is to be published as an indicator. As previously mentioned, the published indicators may be access controlled for particular users, and may be incorporated into further forecasts.
- FIG. 6provides further details regarding the example process 370 for the analysis of the forecasts.
- the forecastis charted overlying each indicator value (at 610 ). This charting allows a user to rapidly ascertain, using visual cues, the relationship between the forecast and each given metric. Humans are very visual, and being able to graphically identify trends is often much easier than using numerical data sets.
- the R2, procyclic values, and countercyclic valuesmay be presented (at 620 ) alongside the charted indicators.
- one or more time domain outer bound drag barsmay be utilized to alter the time domain of indicators.
- the time domain defining drag barmay be graphically manipulated by the user. Moving the drag bar will alter and redefine the time domain in which the selected metrics for a report are displayed. For example, in one situation a set of charts could display five metrics for the time period starting January 2006 and ending May 2012. By manipulating the drag bar, the time domain and thus the range of available data viewed in the report dashboard can be altered. In this example, the metrics are now displayed for the time period starting in March 2005 and ending in May 2012.
- the entire time domain defining controlmay be graphically manipulated along a line, in some embodiments, where a lower and upper bound of the time domain are able to be manipulated, or the entire range may be merely shifted, thereby maintaining the same range, or length, of data represented.
- the forecastmay be displayed versus actual values (for the past time period), trends for the forecast are likewise displayed, as well as the future forecast values (at 660 ).
- Forecast horizon, mean absolute percent error, and additional statistical accuracy measures for the forecastmay also be provided (at 670 ).
- modifying behaviorsmay be dependent upon the user to formulate and implement.
- suggested behaviors based upon the forecast analysis(such as commodity hedging, investment trends, or securing longer or shorter term contracts) may be automatically suggested to the user for implementation.
- the systemutilizes rules regarding the user, or organization, related to objectives or business goals. These rules/objectives are cross referenced against the forecasted values, and advanced machine learning algorithms may be employed in order to generate the resulting behavior modification suggestions.
- the usermay configure state machines in order to leverage forecasts to generate these behavior modification suggestions.
- the systemmay be further capable of acting upon the suggestions autonomously.
- the usermay configure a set of rules under which the system is capable of autonomous activity. For example the forecast may be required to have above a specific accuracy threshold, and the action may be limited to a specific dollar amount for example.
- FIG. 7provides an initial login screenshot.
- the user, organization, or provider of the systemmay have a branded logo 710 presented on this screen.
- the usermay select to sign into their account via the sign in button 740 .
- social media loginssuch as Twitter®, Facebook®, LinkedIn® or the like.
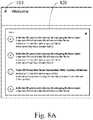
- FIGS. 8A-8DAfter a user logs in, they may be presented with a home screen as seen in reference with FIGS. 8A-8D .
- This screenmay include feeds for alerts 820 , news 830 , and recent or frequently utilized indicator feeds 840 . The content displayed in any of these feeds may be configured by the user, in some embodiments.
- the home screenmay further include a dropdown “hamburger” menu 810 , or similar menu selection, for navigating the forecasting system. Recent forecasts 860 may also be presented for easy access and reference. Additional field may further be added to the home page, via the addition button 850 , to provide a truly customized and user friendly interface.
- FIGS. 9A & 9Bthe user has navigated to a recent forecast by either selecting it from the homepage at 860 , or via the menu 810 .
- the userhas two tabs to select from. The first is graphs 910 of the indicator and forecast data, and the second is for raw numbers 920 .
- the graphs 910has been selected.
- the frequency 930 for the forecastmay be selected from a drop down menu, as well as the type of calculations 940 being displayed, and how the graph data is being displayed 950 .
- forecast four indicators and their associated graphsare being illustrated: total public construction spend 960 , dodge momentum index 970 , architectural billings index 980 , and the stock price for a construction company 990 .
- the forecast(darker line) is provided with an overlay of the index movement (lighter line).
- Two of these indicatorshave been time domain locked, as seen by the icon 965 .
- the time domainis illustrated as a timeline with an initial time and end time clearly marked. As noted above, the user may drag either of these ‘dots’ in order to alter the period considered for the indicators (outside of those indicators that have been locked).
- FIGS. 10A & 10Bprovide such an example illustration where the data tab 920 has been selected by the user. Again, the top options regarding frequency 930 for the forecast, type of calculations 940 being displayed, and how the data is being displayed 950 , as well as the graph tab 910 and data tab 920 are illustrated. However, in this view, rather than showing graphs, raw data values of time periods may be illustrated. The dollar value 1010 for this specific forecast is illustrated on top. Percentages of the period are provided, as well as direction of any shift in value and actual values are likewise illustrated.
- each of the indicators contributing to the forecastis provided. As previously noted these include total public construction spend 1020 , dodge momentum index 1030 , architectural billings index 1040 , the stock price for a construction company 1050 , and new project inquiries 1060 . Due to screen real-estate more indicator values are able to be displayed at one time in this view as compared to the graphical view.
- the first two indicatorsare seen to be time domain locked, as indicated by the lock icon 1025 and 1035 . All indicators include metrics including R 2 value, procyclic value and countercyclic value as compare to the forecast. Non-time locked indicators also show their offset amount, and a time domain selector that may be modified by the user.
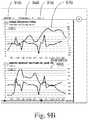
- FIGS. 11A & 11Bprovide a forecast graphical screen for the indicators previously discussed.
- a number of tabsare selectable by the user. These include the forecast 1110 , which is currently being illustrated, growth analytics 1120 , performance measures 1130 , risk analysis 1140 , statistics of the forecast 1150 , and suggestions 1160 .
- the forecast graph 1170is prominently illustrated. This includes actuals (solid line), the forecast (closely spaced dashes) and a trend line (widely spaced dashes). Note that in this example the forecast and actuals are in close agreement for much of the period displayed.
- Below the forecast graph 1170is raw data regarding the actuals 1190 , and the indicators 1195 used to compile the forecast. These values are each presented over a set of time periods. Each indicator has metrics illustrated, including lead time 1181 , directionality 1182 , accuracy 1183 , mean absolute percent error (MAPE) 1184 , and total values over the time period 1185 .
- MPEmean absolute percent error
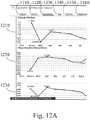
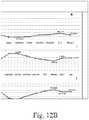
- FIGS. 12A & 12Bthe performance tab 1130 is being illustrated for the forecast.
- graphs for the forecast horizon 1210mean absolute percent error 1220 , accuracy 1230 , and other statistical measures may be illustrated. This allows a user to determine, at any time period, the fidelity of the forecast.
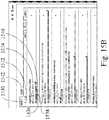
- FIGS. 13A & 13Bthe statistics tab 1150 is being illustrated.
- This taballows a user to delve into the details of any time segment of the forecast.
- two segmentsare shown at 1310 and 1320 respectively; however, a user may scroll down on the page to view the remaining time segments.
- a series of statistical measuresare provided, including a P value, F statistic, R 2 , adjusted and predictive R 2 values, standard error estimate, and any other desired statistical measure as is well known in the arts of statistical analysis.
- the individual indicatorsare each illustrated along with their actual values, error, standard error, T value and 95% confidence interval. This allows the user to delve deeply into the factors influencing any given time segment, and truly understand the risks and validity of the forecast for these time periods.
- an example screenshotis provided for the searching of indicators 1410 for inclusion into a forecast.
- a text field 1420is provided which allows the user to search for any term.
- the resultsare provided in a list format along with the sources.
- Datasets that include seasonal adjustmentsmay include an icon 1430 that readily indicates this to the user.
- the search resultsmay be presented to the user in a number of ways. For example, common or respected indicators may be displayed before more obscure or less reliable indicators. Further indicators that are more commonly predictive for a forecast may be provided before less predictive indicators. Of course, as previously discussed, there are a wide variety of means to display and order search results.
- indicatorsAfter the user selects indicators, they may be utilized in a forecast builder, as seen in relation to FIGS. 15A & 15B to edit a forecast model 1510 .
- the useris able to name the model in field 1512 .
- the file for the indicator being forecasted formay be selected at field 1514 .
- the frequency of the forecastmay be selected from a drop down menu 1516 .
- the forecast typemay likewise be selected from a drop down menu 1518 , and calculation used from drop down menu 1520 .
- a pre-adjustment factormay be applied by selecting the appropriate indicator from field 1522 .
- a post-adjustment factormay be applied by selecting the appropriate indicator from field 1524 .
- the start date for the regressionis selected from a field 1526 , as well as a cutoff period using a slider bar 1528 . The user is able to save or cancel the forecast model at any time.
- the useralso have the ability in the forecast builder to model indicators via the indicator tab 1530 , or define overlays vie the overlay tab 1542 .
- the indicator tab 1530the user is able to add additional indicators using the add button 1532 .
- the weight and offset for an indicatormay be altered on the fly, and the resulting statistical measures may be likewise updated such that the use is able to fully appreciate the impact the indicator has upon the forecast, and is best able to decide the most advantageous parameters for a given indicator.
- the systemis enabled to provide suggestions for the best weights and offsets in order to optimize the R 2 value 1536 , procyclic value 1538 , and countercyclic value 1540 for the indicator.
- FIGS. 16A and 16Billustrate a Computer System 1600 , which is suitable for implementing embodiments of the present invention.
- FIG. 16Ashows one possible physical form of the Computer System 1600 .
- the Computer System 1600may have many physical forms ranging from a printed circuit board, an integrated circuit, and a small handheld device up to a huge super computer.
- Computer system 1600may include a Monitor 1602 , a Display 1604 , a Housing 1606 , a Disk Drive 1608 , a Keyboard 1610 , and a Mouse 1612 .
- Disk 1614is a computer-readable medium used to transfer data to and from Computer System 1600 .
- FIG. 16Bis an example of a block diagram for Computer System 1600 . Attached to System Bus 1620 are a wide variety of subsystems.
- Processor(s) 1622also referred to as central processing units, or CPUs
- Memory 1624includes random access memory (RAM) and read-only memory (ROM).
- RAMrandom access memory
- ROMread-only memory
- RAMrandom access memory
- ROMread-only memory
- Both of these types of memoriesmay include any suitable of the computer-readable media described below.
- a Fixed Disk 1626may also be coupled bi-directionally to the Processor 1622 ; it provides additional data storage capacity and may also include any of the computer-readable media described below.
- Fixed Disk 1626may be used to store programs, data, and the like and is typically a secondary storage medium (such as a hard disk) that is slower than primary storage. It will be appreciated that the information retained within Fixed Disk 1626 may, in appropriate cases, be incorporated in standard fashion as virtual memory in Memory 1624 .
- Removable Disk 1614may take the form of any of the computer-readable media described below.
- Processor 1622is also coupled to a variety of input/output devices, such as Display 1604 , Keyboard 1610 , Mouse 1612 and Speakers 1630 .
- an input/output devicemay be any of: video displays, track balls, mice, keyboards, microphones, touch-sensitive displays, transducer card readers, magnetic or paper tape readers, tablets, styluses, voice or handwriting recognizers, biometrics readers, motion sensors, brain wave readers, or other computers.
- Processor 1622optionally may be coupled to another computer or telecommunications network using Network Interface 1640 .
- the Processor 1622might receive information from the network, or might output information to the network in the course of performing the above-described big data analysis for consumer sentiment. Furthermore, method embodiments of the present invention may execute solely upon Processor 1622 or may execute over a network such as the Internet in conjunction with a remote CPU that shares a portion of the processing.
- Softwareis typically stored in the non-volatile memory and/or the drive unit. Indeed, for large programs, it may not even be possible to store the entire program in the memory. Nevertheless, it should be understood that for software to run, if necessary, it is moved to a computer readable location appropriate for processing, and for illustrative purposes, that location is referred to as the memory in this disclosure. Even when software is moved to the memory for execution, the processor will typically make use of hardware registers to store values associated with the software, and local cache that, ideally, serves to speed up execution.
- a software programis assumed to be stored at any known or convenient location (from non-volatile storage to hardware registers) when the software program is referred to as “implemented in a computer-readable medium.”
- a processoris considered to be “configured to execute a program” when at least one value associated with the program is stored in a register readable by the processor.
- the computer system 1600can be controlled by operating system software that includes a file management system, such as a disk operating system.
- operating system softwarewith associated file management system software is the family of operating systems known as Windows® from Microsoft Corporation of Redmond, Wash., and their associated file management systems.
- Windows®from Microsoft Corporation of Redmond, Wash.
- Windows®is the family of operating systems known as Windows® from Microsoft Corporation of Redmond, Wash.
- Linux operating systemis the Linux operating system and its associated file management system.
- the file management systemis typically stored in the non-volatile memory and/or drive unit and causes the processor to execute the various acts required by the operating system to input and output data and to store data in the memory, including storing files on the non-volatile memory and/or drive unit.
- the machineoperates as a standalone device or may be connected (e.g., networked) to other machines.
- the machinemay operate in the capacity of a server or a client machine in a client-server network environment or as a peer machine in a peer-to-peer (or distributed) network environment.
- the machinemay be a server computer, a client computer, a personal computer (PC), a tablet PC, a laptop computer, a set-top box (STB), a personal digital assistant (PDA), a cellular telephone, an iPhone, a Blackberry, a processor, a telephone, a web appliance, a network router, switch or bridge, or any machine capable of executing a set of instructions (sequential or otherwise) that specify actions to be taken by that machine.
- PCpersonal computer
- PDApersonal digital assistant
- machine-readable medium or machine-readable storage mediumis shown in an exemplary embodiment to be a single medium, the term “machine-readable medium” and “machine-readable storage medium” should be taken to include a single medium or multiple media (e.g., a centralized or distributed database, and/or associated caches and servers) that store the one or more sets of instructions.
- the term “machine-readable medium” and “machine-readable storage medium”shall also be taken to include any medium that is capable of storing, encoding or carrying a set of instructions for execution by the machine and that cause the machine to perform any one or more of the methodologies of the presently disclosed technique and innovation.
- routines executed to implement the embodiments of the disclosuremay be implemented as part of an operating system or a specific application, component, program, object, module or sequence of instructions referred to as “computer programs.”
- the computer programstypically comprise one or more instructions set at various times in various memory and storage devices in a computer, and when read and executed by one or more processing units or processors in a computer, cause the computer to perform operations to execute elements involving the various aspects of the disclosure.
Landscapes
- Engineering & Computer Science (AREA)
- Theoretical Computer Science (AREA)
- Business, Economics & Management (AREA)
- Databases & Information Systems (AREA)
- Accounting & Taxation (AREA)
- Development Economics (AREA)
- Finance (AREA)
- Strategic Management (AREA)
- Data Mining & Analysis (AREA)
- Physics & Mathematics (AREA)
- General Physics & Mathematics (AREA)
- Entrepreneurship & Innovation (AREA)
- General Engineering & Computer Science (AREA)
- Game Theory and Decision Science (AREA)
- General Business, Economics & Management (AREA)
- Marketing (AREA)
- Economics (AREA)
- Computational Linguistics (AREA)
- Management, Administration, Business Operations System, And Electronic Commerce (AREA)
Abstract
Description
Claims (14)
Priority Applications (8)
| Application Number | Priority Date | Filing Date | Title |
|---|---|---|---|
| US15/154,697US10740772B2 (en) | 2011-07-25 | 2016-05-13 | Systems and methods for forecasting based upon time series data |
| US15/197,669US20170004521A1 (en) | 2011-07-25 | 2016-06-29 | Systems and methods for generating industry outlook scores |
| CA3006988ACA3006988A1 (en) | 2015-12-19 | 2016-12-15 | Systems and methods for forecasting based upon time series data |
| PCT/US2016/067026WO2017106559A1 (en) | 2015-12-19 | 2016-12-15 | Systems and methods for forecasting based upon time series data |
| EP16876720.0AEP3391252A4 (en) | 2015-12-19 | 2016-12-15 | Systems and methods for forecasting based upon time series data |
| US16/221,416US10896388B2 (en) | 2011-07-25 | 2018-12-14 | Systems and methods for business analytics management and modeling |
| US17/060,068US11995667B2 (en) | 2012-07-25 | 2020-09-30 | Systems and methods for business analytics model scoring and selection |
| US18/642,834US20240346531A1 (en) | 2012-07-25 | 2024-04-23 | Systems and methods for business analytics model scoring and selection |
Applications Claiming Priority (6)
| Application Number | Priority Date | Filing Date | Title |
|---|---|---|---|
| US201161511527P | 2011-07-25 | 2011-07-25 | |
| US201161512405P | 2011-07-28 | 2011-07-28 | |
| US13/558,333US10176533B2 (en) | 2011-07-25 | 2012-07-25 | Interactive chart utilizing shifting control to render shifting of time domains of data series |
| US201562269978P | 2015-12-19 | 2015-12-19 | |
| US201662290441P | 2016-02-02 | 2016-02-02 | |
| US15/154,697US10740772B2 (en) | 2011-07-25 | 2016-05-13 | Systems and methods for forecasting based upon time series data |
Related Parent Applications (2)
| Application Number | Title | Priority Date | Filing Date |
|---|---|---|---|
| US13/558,333Continuation-In-PartUS10176533B2 (en) | 2011-07-25 | 2012-07-25 | Interactive chart utilizing shifting control to render shifting of time domains of data series |
| US16/221,416Continuation-In-PartUS10896388B2 (en) | 2011-07-25 | 2018-12-14 | Systems and methods for business analytics management and modeling |
Related Child Applications (2)
| Application Number | Title | Priority Date | Filing Date |
|---|---|---|---|
| US13/558,333Continuation-In-PartUS10176533B2 (en) | 2011-07-25 | 2012-07-25 | Interactive chart utilizing shifting control to render shifting of time domains of data series |
| US16/221,416Continuation-In-PartUS10896388B2 (en) | 2011-07-25 | 2018-12-14 | Systems and methods for business analytics management and modeling |
Publications (2)
| Publication Number | Publication Date |
|---|---|
| US20160328726A1 US20160328726A1 (en) | 2016-11-10 |
| US10740772B2true US10740772B2 (en) | 2020-08-11 |
Family
ID=57221931
Family Applications (1)
| Application Number | Title | Priority Date | Filing Date |
|---|---|---|---|
| US15/154,697Active2033-07-08US10740772B2 (en) | 2011-07-25 | 2016-05-13 | Systems and methods for forecasting based upon time series data |
Country Status (1)
| Country | Link |
|---|---|
| US (1) | US10740772B2 (en) |
Cited By (3)
| Publication number | Priority date | Publication date | Assignee | Title |
|---|---|---|---|---|
| US11423110B1 (en) | 2021-09-22 | 2022-08-23 | Finvar Corporation | Intelligent timeline and commercialization system with social networking features |
| US11574324B1 (en) | 2021-09-22 | 2023-02-07 | Finvar Corporation | Logic extraction and application subsystem for intelligent timeline and commercialization system |
| US11995667B2 (en) | 2012-07-25 | 2024-05-28 | Prevedere Inc. | Systems and methods for business analytics model scoring and selection |
Families Citing this family (3)
| Publication number | Priority date | Publication date | Assignee | Title |
|---|---|---|---|---|
| JP7131005B2 (en)* | 2018-03-22 | 2022-09-06 | 日本電気株式会社 | Information processing device, information processing method, and information processing program |
| WO2021174015A1 (en)* | 2020-02-27 | 2021-09-02 | Intercontinental Exchange Holdings, Inc. | Integrated weather graphical user interface |
| US20230101451A1 (en)* | 2021-05-27 | 2023-03-30 | Robert E. Dowing | Automatic Refinement of Customizable Forecasts for Strategic Management |
Citations (76)
| Publication number | Priority date | Publication date | Assignee | Title |
|---|---|---|---|---|
| US5432530A (en) | 1991-05-15 | 1995-07-11 | Fujitsu Limited | Pointing device and method of control of same |
| US5454371A (en) | 1993-11-29 | 1995-10-03 | London Health Association | Method and system for constructing and displaying three-dimensional images |
| US5475851A (en) | 1986-04-14 | 1995-12-12 | National Instruments Corporation | Method and apparatus for improved local and global variable capabilities in a graphical data flow program |
| US5727161A (en) | 1994-09-16 | 1998-03-10 | Planscan, Llc | Method and apparatus for graphic analysis of variation of economic plans |
| US5793375A (en) | 1994-11-09 | 1998-08-11 | Kabushiki Kaisha Toshiba | Image processing apparatus for forming a surface display image |
| US6054984A (en) | 1997-05-27 | 2000-04-25 | Hewlett-Packard Company | System and method for graphically manipulating display elements in a signal measurement system |
| US6064984A (en) | 1996-08-29 | 2000-05-16 | Marketknowledge, Inc. | Graphical user interface for a computer-implemented financial planning tool |
| US6133914A (en) | 1998-01-07 | 2000-10-17 | Rogers; David W. | Interactive graphical user interface |
| US6163773A (en)* | 1998-05-05 | 2000-12-19 | International Business Machines Corporation | Data storage system with trained predictive cache management engine |
| US6362842B1 (en) | 1998-01-29 | 2002-03-26 | International Business Machines Corporation | Operation picture displaying apparatus and method therefor |
| US6473084B1 (en) | 1999-09-08 | 2002-10-29 | C4Cast.Com, Inc. | Prediction input |
| US6549864B1 (en) | 2001-08-13 | 2003-04-15 | General Electric Company | Multivariate statistical process analysis systems and methods for the production of melt polycarbonate |
| US20030126054A1 (en) | 2001-12-28 | 2003-07-03 | Purcell, W. Richard | Method and apparatus for optimizing investment portfolio plans for long-term financial plans and goals |
| US6614456B1 (en) | 2000-01-19 | 2003-09-02 | Xerox Corporation | Systems, methods and graphical user interfaces for controlling tone reproduction curves of image capture and forming devices |
| US20030212618A1 (en) | 2002-05-07 | 2003-11-13 | General Electric Capital Corporation | Systems and methods associated with targeted leading indicators |
| US6757217B2 (en) | 2001-08-31 | 2004-06-29 | Exxonmobil Upstream Research Company | Method for time-aligning multiple offset seismic data volumes |
| US20040169638A1 (en) | 2002-12-09 | 2004-09-02 | Kaplan Adam S. | Method and apparatus for user interface |
| US6801199B1 (en) | 2000-03-01 | 2004-10-05 | Foliofn, Inc. | Method and apparatus for interacting with investors to create investment portfolios |
| US6822662B1 (en) | 1999-03-31 | 2004-11-23 | International Business Machines Corporation | User selected display of two-dimensional window in three dimensions on a computer screen |
| US20050021485A1 (en) | 2001-06-28 | 2005-01-27 | Microsoft Corporation | Continuous time bayesian network models for predicting users' presence, activities, and component usage |
| US6901383B1 (en) | 1999-05-20 | 2005-05-31 | Ameritrade Holding Corporation | Stock purchase indices |
| US7134093B2 (en) | 2001-04-18 | 2006-11-07 | International Business Machines Corporation | Graphical user interface for direct control of display of data |
| US20070088648A1 (en) | 2005-10-17 | 2007-04-19 | Cqg,Inc. | System and Method for Determining Data Points for Financial Bar Charts and Their Presentation |
| US20070156565A1 (en) | 2005-12-29 | 2007-07-05 | Trading Technologies International, Inc. | System and method for a trading interface incorporating a chart |
| US20070244741A1 (en)* | 1999-05-06 | 2007-10-18 | Matthias Blume | Predictive Modeling of Consumer Financial Behavior Using Supervised Segmentation and Nearest-Neighbor Matching |
| US7348979B2 (en) | 2002-03-08 | 2008-03-25 | Horace W. Tso | Display and method of providing a visual display of multiple time series data |
| US20080086401A1 (en) | 2006-07-25 | 2008-04-10 | Cqgt, Llc | Charting with depth of market volume flow |
| US7363584B1 (en) | 2001-04-11 | 2008-04-22 | Oracle International Corporation (Oic) | Method and article for interactive data exploration |
| US20080133313A1 (en) | 2006-12-04 | 2008-06-05 | Arash Bateni | Improved methods and systems for forecasting product demand using price elasticity |
| US20080147486A1 (en) | 2006-12-18 | 2008-06-19 | Lehigh University | Prediction method and system |
| US20080195930A1 (en) | 2007-02-08 | 2008-08-14 | Microsoft Corporation | User Interface Pane for an Interactive Chart |
| US7496852B2 (en) | 2006-05-16 | 2009-02-24 | International Business Machines Corporation | Graphically manipulating a database |
| US20090083120A1 (en)* | 2007-09-25 | 2009-03-26 | Strichman Adam J | System, method and computer program product for an interactive business services price determination and/or comparison model |
| US7554521B1 (en) | 2004-04-15 | 2009-06-30 | Apple Inc. | User interface control for changing a parameter |
| US20090187606A1 (en) | 2008-01-21 | 2009-07-23 | Claus Allweil | Optimized modification of a clustered computer system |
| US20090216684A1 (en) | 2000-03-24 | 2009-08-27 | Helweg Mark W | Price charting system and technique |
| US20100076819A1 (en)* | 2008-09-25 | 2010-03-25 | Myshape, Inc. | System and Method for Distilling Data and Feedback From Customers to Identify Fashion Market Information |
| US7698188B2 (en) | 2005-11-03 | 2010-04-13 | Beta-Rubicon Technologies, Llc | Electronic enterprise capital marketplace and monitoring apparatus and method |
| US20100138275A1 (en) | 2008-12-03 | 2010-06-03 | Arash Bateni | Automatic event shifting of demand patterns using multi-variable regression |
| US20100185976A1 (en) | 2009-01-21 | 2010-07-22 | Sairam Sadanandan | Graphic user interface and a method thereof |
| US7800613B2 (en) | 2004-12-02 | 2010-09-21 | Tableau Software, Inc. | Computer systems and methods for visualizing data with generation of marks |
| US7818246B2 (en) | 2005-04-05 | 2010-10-19 | Barclays Capital Inc. | Systems and methods for order analysis, enrichment, and execution |
| US20110007097A1 (en) | 2009-07-10 | 2011-01-13 | Microsoft Corporation | Single axis zoom |
| US7904376B2 (en) | 2006-04-28 | 2011-03-08 | Pipeline Financial Group, Inc. | Rich graphical control interface for algorithmic trading engine |
| US20110087985A1 (en) | 2008-10-16 | 2011-04-14 | Bank Of America Corporation | Graph viewer |
| US20110107265A1 (en) | 2008-10-16 | 2011-05-05 | Bank Of America Corporation | Customizable graphical user interface |
| US7941742B1 (en) | 2007-04-30 | 2011-05-10 | Hewlett-Packard Development Company, L.P. | Visualizing growing time series data in a single view |
| US7991672B2 (en) | 2007-06-29 | 2011-08-02 | William Rory Crowder | System and method of visual illustration of stock market performance |
| US7999809B2 (en) | 2006-04-19 | 2011-08-16 | Tableau Software, Inc. | Computer systems and methods for automatic generation of models for a dataset |
| US20110208701A1 (en) | 2010-02-23 | 2011-08-25 | Wilma Stainback Jackson | Computer-Implemented Systems And Methods For Flexible Definition Of Time Intervals |
| US20110231339A1 (en)* | 2000-06-28 | 2011-09-22 | Buymetrics, Inc. | System and method for managing and evaluating network commodities purchasing |
| US20110246260A1 (en)* | 2009-12-11 | 2011-10-06 | James Gilbert | System and method for routing marketing opportunities to sales agents |
| US8051000B2 (en) | 2007-11-06 | 2011-11-01 | Fmr Llc | Trade strategy monitor platform |
| US20110283188A1 (en) | 2010-05-14 | 2011-11-17 | Sap Ag | Value interval selection on multi-touch devices |
| US20110302112A1 (en) | 2010-06-04 | 2011-12-08 | Shan Jerry Z | Forecasting through time domain analysis |
| US20110313809A1 (en)* | 2003-10-31 | 2011-12-22 | International Business Machines Corporation | System, method and program product for management of life sciences data and related research |
| US20120016269A1 (en)* | 2010-07-13 | 2012-01-19 | Jose Luis Moctezuma De La Barrera | Registration of Anatomical Data Sets |
| US20120101912A1 (en)* | 2010-10-20 | 2012-04-26 | Cisco Technology, Inc. | Providing a Marketplace for Sensor Data |
| US20120159384A1 (en) | 2010-12-21 | 2012-06-21 | Microsoft Corporation | Multi-level image viewing |
| US20120188250A1 (en) | 2005-09-22 | 2012-07-26 | Craig Andrew Kaplan | Graphical forecasting interface |
| US20120245970A1 (en) | 2010-11-29 | 2012-09-27 | International Business Machines Corporation | Fast, dynamic, data-driven report deployment of data mining and predictive insight into business intelligence (bi) tools |
| US8306847B2 (en) | 2008-04-25 | 2012-11-06 | Xerox Corporation | System and method of forecasting print demand |
| US8315938B1 (en) | 2009-10-19 | 2012-11-20 | Optionmonster Holdings, Inc. | Option analysis for a trading system |
| US20120317509A1 (en) | 2011-01-24 | 2012-12-13 | Ludwig Lester F | Interactive wysiwyg control of mathematical and statistical plots and representational graphics for analysis and data visualization |
| US20120317506A1 (en) | 2010-06-04 | 2012-12-13 | International Business Machines Corporation | Method and System for Executing a Graphics Application |
| US8346682B2 (en) | 2009-01-23 | 2013-01-01 | The United States Of America, As Represented By The Secretary Of The Navy | Information assisted visual interface, system, and method for identifying and quantifying multivariate associations |
| US20130024170A1 (en) | 2011-07-21 | 2013-01-24 | Sap Ag | Context-aware parameter estimation for forecast models |
| US20130041792A1 (en) | 2011-08-11 | 2013-02-14 | Justin King | Calculation application and method |
| US8381090B2 (en) | 2010-01-15 | 2013-02-19 | Microsoft Corporation | Dynamic expansion of data calculation scopes |
| US20130055132A1 (en) | 2011-08-30 | 2013-02-28 | Honeywell Internationanl Inc. | Energy dashboard |
| US20130086521A1 (en) | 2011-09-30 | 2013-04-04 | Siemens Akeiengesellschaft | Management System User Interface For Comparative Trend View |
| US20130179739A1 (en) | 2010-10-20 | 2013-07-11 | Nec Corporation | Service management device, display method, and information storage medium |
| US20130179130A1 (en) | 2012-01-06 | 2013-07-11 | Technoimaging, Llc | Method of simultaneous imaging of different physical properties using joint inversion of multiple datasets |
| US20140172654A1 (en) | 2011-07-25 | 2014-06-19 | Prevedere, Inc. | Interactive chart utilizing shifting control to render shifting of time domains of data series |
| US8843427B1 (en)* | 2011-07-01 | 2014-09-23 | Google Inc. | Predictive modeling accuracy |
| WO2015183255A1 (en) | 2014-05-28 | 2015-12-03 | Hewlett Packard Development Company, L.P. | Predicting social, economic, and learning outcomes |
- 2016
- 2016-05-13USUS15/154,697patent/US10740772B2/enactiveActive
Patent Citations (76)
| Publication number | Priority date | Publication date | Assignee | Title |
|---|---|---|---|---|
| US5475851A (en) | 1986-04-14 | 1995-12-12 | National Instruments Corporation | Method and apparatus for improved local and global variable capabilities in a graphical data flow program |
| US5432530A (en) | 1991-05-15 | 1995-07-11 | Fujitsu Limited | Pointing device and method of control of same |
| US5454371A (en) | 1993-11-29 | 1995-10-03 | London Health Association | Method and system for constructing and displaying three-dimensional images |
| US5727161A (en) | 1994-09-16 | 1998-03-10 | Planscan, Llc | Method and apparatus for graphic analysis of variation of economic plans |
| US5793375A (en) | 1994-11-09 | 1998-08-11 | Kabushiki Kaisha Toshiba | Image processing apparatus for forming a surface display image |
| US6064984A (en) | 1996-08-29 | 2000-05-16 | Marketknowledge, Inc. | Graphical user interface for a computer-implemented financial planning tool |
| US6054984A (en) | 1997-05-27 | 2000-04-25 | Hewlett-Packard Company | System and method for graphically manipulating display elements in a signal measurement system |
| US6133914A (en) | 1998-01-07 | 2000-10-17 | Rogers; David W. | Interactive graphical user interface |
| US6362842B1 (en) | 1998-01-29 | 2002-03-26 | International Business Machines Corporation | Operation picture displaying apparatus and method therefor |
| US6163773A (en)* | 1998-05-05 | 2000-12-19 | International Business Machines Corporation | Data storage system with trained predictive cache management engine |
| US6822662B1 (en) | 1999-03-31 | 2004-11-23 | International Business Machines Corporation | User selected display of two-dimensional window in three dimensions on a computer screen |
| US20070244741A1 (en)* | 1999-05-06 | 2007-10-18 | Matthias Blume | Predictive Modeling of Consumer Financial Behavior Using Supervised Segmentation and Nearest-Neighbor Matching |
| US6901383B1 (en) | 1999-05-20 | 2005-05-31 | Ameritrade Holding Corporation | Stock purchase indices |
| US6473084B1 (en) | 1999-09-08 | 2002-10-29 | C4Cast.Com, Inc. | Prediction input |
| US6614456B1 (en) | 2000-01-19 | 2003-09-02 | Xerox Corporation | Systems, methods and graphical user interfaces for controlling tone reproduction curves of image capture and forming devices |
| US6801199B1 (en) | 2000-03-01 | 2004-10-05 | Foliofn, Inc. | Method and apparatus for interacting with investors to create investment portfolios |
| US20090216684A1 (en) | 2000-03-24 | 2009-08-27 | Helweg Mark W | Price charting system and technique |
| US20110231339A1 (en)* | 2000-06-28 | 2011-09-22 | Buymetrics, Inc. | System and method for managing and evaluating network commodities purchasing |
| US7363584B1 (en) | 2001-04-11 | 2008-04-22 | Oracle International Corporation (Oic) | Method and article for interactive data exploration |
| US7134093B2 (en) | 2001-04-18 | 2006-11-07 | International Business Machines Corporation | Graphical user interface for direct control of display of data |
| US20050021485A1 (en) | 2001-06-28 | 2005-01-27 | Microsoft Corporation | Continuous time bayesian network models for predicting users' presence, activities, and component usage |
| US6549864B1 (en) | 2001-08-13 | 2003-04-15 | General Electric Company | Multivariate statistical process analysis systems and methods for the production of melt polycarbonate |
| US6757217B2 (en) | 2001-08-31 | 2004-06-29 | Exxonmobil Upstream Research Company | Method for time-aligning multiple offset seismic data volumes |
| US20030126054A1 (en) | 2001-12-28 | 2003-07-03 | Purcell, W. Richard | Method and apparatus for optimizing investment portfolio plans for long-term financial plans and goals |
| US7348979B2 (en) | 2002-03-08 | 2008-03-25 | Horace W. Tso | Display and method of providing a visual display of multiple time series data |
| US20030212618A1 (en) | 2002-05-07 | 2003-11-13 | General Electric Capital Corporation | Systems and methods associated with targeted leading indicators |
| US20040169638A1 (en) | 2002-12-09 | 2004-09-02 | Kaplan Adam S. | Method and apparatus for user interface |
| US20110313809A1 (en)* | 2003-10-31 | 2011-12-22 | International Business Machines Corporation | System, method and program product for management of life sciences data and related research |
| US7554521B1 (en) | 2004-04-15 | 2009-06-30 | Apple Inc. | User interface control for changing a parameter |
| US7800613B2 (en) | 2004-12-02 | 2010-09-21 | Tableau Software, Inc. | Computer systems and methods for visualizing data with generation of marks |
| US7818246B2 (en) | 2005-04-05 | 2010-10-19 | Barclays Capital Inc. | Systems and methods for order analysis, enrichment, and execution |
| US20120188250A1 (en) | 2005-09-22 | 2012-07-26 | Craig Andrew Kaplan | Graphical forecasting interface |
| US20070088648A1 (en) | 2005-10-17 | 2007-04-19 | Cqg,Inc. | System and Method for Determining Data Points for Financial Bar Charts and Their Presentation |
| US7698188B2 (en) | 2005-11-03 | 2010-04-13 | Beta-Rubicon Technologies, Llc | Electronic enterprise capital marketplace and monitoring apparatus and method |
| US20070156565A1 (en) | 2005-12-29 | 2007-07-05 | Trading Technologies International, Inc. | System and method for a trading interface incorporating a chart |
| US7999809B2 (en) | 2006-04-19 | 2011-08-16 | Tableau Software, Inc. | Computer systems and methods for automatic generation of models for a dataset |
| US7904376B2 (en) | 2006-04-28 | 2011-03-08 | Pipeline Financial Group, Inc. | Rich graphical control interface for algorithmic trading engine |
| US7496852B2 (en) | 2006-05-16 | 2009-02-24 | International Business Machines Corporation | Graphically manipulating a database |
| US20080086401A1 (en) | 2006-07-25 | 2008-04-10 | Cqgt, Llc | Charting with depth of market volume flow |
| US20080133313A1 (en) | 2006-12-04 | 2008-06-05 | Arash Bateni | Improved methods and systems for forecasting product demand using price elasticity |
| US20080147486A1 (en) | 2006-12-18 | 2008-06-19 | Lehigh University | Prediction method and system |
| US20080195930A1 (en) | 2007-02-08 | 2008-08-14 | Microsoft Corporation | User Interface Pane for an Interactive Chart |
| US7941742B1 (en) | 2007-04-30 | 2011-05-10 | Hewlett-Packard Development Company, L.P. | Visualizing growing time series data in a single view |
| US7991672B2 (en) | 2007-06-29 | 2011-08-02 | William Rory Crowder | System and method of visual illustration of stock market performance |
| US20090083120A1 (en)* | 2007-09-25 | 2009-03-26 | Strichman Adam J | System, method and computer program product for an interactive business services price determination and/or comparison model |
| US8051000B2 (en) | 2007-11-06 | 2011-11-01 | Fmr Llc | Trade strategy monitor platform |
| US20090187606A1 (en) | 2008-01-21 | 2009-07-23 | Claus Allweil | Optimized modification of a clustered computer system |
| US8306847B2 (en) | 2008-04-25 | 2012-11-06 | Xerox Corporation | System and method of forecasting print demand |
| US20100076819A1 (en)* | 2008-09-25 | 2010-03-25 | Myshape, Inc. | System and Method for Distilling Data and Feedback From Customers to Identify Fashion Market Information |
| US20110107265A1 (en) | 2008-10-16 | 2011-05-05 | Bank Of America Corporation | Customizable graphical user interface |
| US20110087985A1 (en) | 2008-10-16 | 2011-04-14 | Bank Of America Corporation | Graph viewer |
| US20100138275A1 (en) | 2008-12-03 | 2010-06-03 | Arash Bateni | Automatic event shifting of demand patterns using multi-variable regression |
| US20100185976A1 (en) | 2009-01-21 | 2010-07-22 | Sairam Sadanandan | Graphic user interface and a method thereof |
| US8346682B2 (en) | 2009-01-23 | 2013-01-01 | The United States Of America, As Represented By The Secretary Of The Navy | Information assisted visual interface, system, and method for identifying and quantifying multivariate associations |
| US20110007097A1 (en) | 2009-07-10 | 2011-01-13 | Microsoft Corporation | Single axis zoom |
| US8315938B1 (en) | 2009-10-19 | 2012-11-20 | Optionmonster Holdings, Inc. | Option analysis for a trading system |
| US20110246260A1 (en)* | 2009-12-11 | 2011-10-06 | James Gilbert | System and method for routing marketing opportunities to sales agents |
| US8381090B2 (en) | 2010-01-15 | 2013-02-19 | Microsoft Corporation | Dynamic expansion of data calculation scopes |
| US20110208701A1 (en) | 2010-02-23 | 2011-08-25 | Wilma Stainback Jackson | Computer-Implemented Systems And Methods For Flexible Definition Of Time Intervals |
| US20110283188A1 (en) | 2010-05-14 | 2011-11-17 | Sap Ag | Value interval selection on multi-touch devices |
| US20110302112A1 (en) | 2010-06-04 | 2011-12-08 | Shan Jerry Z | Forecasting through time domain analysis |
| US20120317506A1 (en) | 2010-06-04 | 2012-12-13 | International Business Machines Corporation | Method and System for Executing a Graphics Application |
| US20120016269A1 (en)* | 2010-07-13 | 2012-01-19 | Jose Luis Moctezuma De La Barrera | Registration of Anatomical Data Sets |
| US20120101912A1 (en)* | 2010-10-20 | 2012-04-26 | Cisco Technology, Inc. | Providing a Marketplace for Sensor Data |
| US20130179739A1 (en) | 2010-10-20 | 2013-07-11 | Nec Corporation | Service management device, display method, and information storage medium |
| US20120245970A1 (en) | 2010-11-29 | 2012-09-27 | International Business Machines Corporation | Fast, dynamic, data-driven report deployment of data mining and predictive insight into business intelligence (bi) tools |
| US20120159384A1 (en) | 2010-12-21 | 2012-06-21 | Microsoft Corporation | Multi-level image viewing |
| US20120317509A1 (en) | 2011-01-24 | 2012-12-13 | Ludwig Lester F | Interactive wysiwyg control of mathematical and statistical plots and representational graphics for analysis and data visualization |
| US8843427B1 (en)* | 2011-07-01 | 2014-09-23 | Google Inc. | Predictive modeling accuracy |
| US20130024170A1 (en) | 2011-07-21 | 2013-01-24 | Sap Ag | Context-aware parameter estimation for forecast models |
| US20140172654A1 (en) | 2011-07-25 | 2014-06-19 | Prevedere, Inc. | Interactive chart utilizing shifting control to render shifting of time domains of data series |
| US20130041792A1 (en) | 2011-08-11 | 2013-02-14 | Justin King | Calculation application and method |
| US20130055132A1 (en) | 2011-08-30 | 2013-02-28 | Honeywell Internationanl Inc. | Energy dashboard |
| US20130086521A1 (en) | 2011-09-30 | 2013-04-04 | Siemens Akeiengesellschaft | Management System User Interface For Comparative Trend View |
| US20130179130A1 (en) | 2012-01-06 | 2013-07-11 | Technoimaging, Llc | Method of simultaneous imaging of different physical properties using joint inversion of multiple datasets |
| WO2015183255A1 (en) | 2014-05-28 | 2015-12-03 | Hewlett Packard Development Company, L.P. | Predicting social, economic, and learning outcomes |
Non-Patent Citations (22)
| Title |
|---|
| Basic Usage of AS/ETS Software to Forecast a Time Series NESUG16, Statistics, Data Analysis & Econometrics, 2003. |
| Cognos 8 Business Intelligence-Report Studio User Guide, Cognos Inc., 2006. |
| Cognos 8 Business Intelligence—Report Studio User Guide, Cognos Inc., 2006. |
| Cyclical Analysis and Exponential Forecasting Simetar, Simulation & Econometrics to Analyze Risk, 2004. |
| European Patent Office, EPO Application No. 16876720.0, "Supplementary Extended European Search Report and Opinion", dated May 28, 2019, 7 pages. |
| Jelen, Bill, Rev Up to Excel 2010-Upgraders Guide to Excel 2010 Holy Marco! Books, 2010. |
| Jelen, Bill, Rev Up to Excel 2010—Upgraders Guide to Excel 2010 Holy Marco! Books, 2010. |
| Lahiri, Kajal, Evaluating Probability Forecasts for GDP Declines 2007. |
| MacDonald, MRRHWQ, Excel 2003 for Starters-Chapter 9 Pogue Press, O'Reily, Feb. 9, 2009. |
| MacDonald, MRRHWQ, Excel 2003 for Starters—Chapter 9 Pogue Press, O'Reily, Feb. 9, 2009. |
| Microsoft Excel 2010 Charts and Graphs-Class Workbook Ucsd Biomedical Library Workshop, Unknown Date. |
| Microsoft Excel 2010 Charts and Graphs—Class Workbook Ucsd Biomedical Library Workshop, Unknown Date. |
| Moyle, Michael et al., A Flick in the Right Direction: A Case Stude of Gestural Input in Behavior and Information Technology, 2005. |
| SAS/ETS User's Guide Version 8-vol. 1 SAS, Institute Inc., 1999. |
| SAS/ETS User's Guide Version 8—vol. 1 SAS, Institute Inc., 1999. |
| SAS/Graph 9.2 Reference-Second Edition, SAS, 2010. |
| SAS/Graph 9.2 Reference—Second Edition, SAS, 2010. |
| Stolte, Chris et al., Polaris: A System for Query, Analysis, and Visualization of Multidimensional Relational Databases IEEE Transactions on Visualization and Computer Graphics, vol. 8, No. 1. Jan.-Mar. 2002. |
| Tableau Software Combination Charts, Tableau Software, Inc., 2010. |
| Tableau Software Forecasting, Tableau Software, Inc., 2012. |
| Tableau Visual Guidebook, Tableau Software, Inc., 2010. |
| USPTO, ISA/US, "Notification of Transmittal of the ISR and the Written Opinion of the International Searching Authority, or the Declaration," in PCT Application No. PCT/US2016/067026, dated Mar. 27, 2017, 7 pages. |
Cited By (3)
| Publication number | Priority date | Publication date | Assignee | Title |
|---|---|---|---|---|
| US11995667B2 (en) | 2012-07-25 | 2024-05-28 | Prevedere Inc. | Systems and methods for business analytics model scoring and selection |
| US11423110B1 (en) | 2021-09-22 | 2022-08-23 | Finvar Corporation | Intelligent timeline and commercialization system with social networking features |
| US11574324B1 (en) | 2021-09-22 | 2023-02-07 | Finvar Corporation | Logic extraction and application subsystem for intelligent timeline and commercialization system |
Also Published As
| Publication number | Publication date |
|---|---|
| US20160328726A1 (en) | 2016-11-10 |
Similar Documents
| Publication | Publication Date | Title |
|---|---|---|
| US11436550B2 (en) | Cash forecast system, apparatus, and method | |
| US10740772B2 (en) | Systems and methods for forecasting based upon time series data | |
| Coad et al. | Barriers to innovation and firm productivity | |
| US20220391921A1 (en) | Systems and methods for electronic portfolio management | |
| WO2017106559A1 (en) | Systems and methods for forecasting based upon time series data | |
| US10896388B2 (en) | Systems and methods for business analytics management and modeling | |
| Ranjbar et al. | Energy consumption and economic growth nexus in South Africa: Asymmetric frequency domain approach | |
| US20120095802A1 (en) | System and methods for evaluating political, social, and economic risk associated with a geographic region | |
| Ferrara et al. | Financial variables as leading indicators of GDP growth: Evidence from a MIDAS approach during the Great Recession | |
| US20240346531A1 (en) | Systems and methods for business analytics model scoring and selection | |
| Çatik et al. | The bank lending channel in Turkey: has it changed after the low-inflation regime? | |
| Liu et al. | Navigating the environmental, social, and governance (ESG) landscape: Constructing a robust and reliable scoring engine-insights into data source selection, indicator determination, weighting and aggregation techniques, and validation processes for comprehensive ESG scoring systems | |
| Javid et al. | Sectoral investment analysis for Saudi Arabia | |
| Silva et al. | Portfolio optimization based on the pre-selection of stocks by the Support Vector Machine model | |
| Zhao et al. | Predicting oil prices: an analysis of oil price volatility cycle and financial markets | |
| Sheng et al. | The nonlinear impact of financial flexibility on corporate sustainability: Empirical evidence from the Chinese manufacturing industry | |
| Lehmann et al. | Looking into the black box of boosting: the case of Germany | |
| US20170004521A1 (en) | Systems and methods for generating industry outlook scores | |
| Chiadamrong et al. | Financial performance prediction model based on firms’ internal capability determinants: evidence from listed firms in Thailand during the transition period of going public | |
| US12361220B1 (en) | Customized integrated entity analysis using an artificial intelligence (AI) model | |
| Reissl et al. | A regional input-output model of the COVID-19 crisis in Italy: Decomposing demand and supply factors | |
| Álvarez-Díez et al. | Dividend announcement and the value of sentiment analysis | |
| Dehnokhalaji et al. | Gradual efficiency improvement through a sequence of targets | |
| García-Martos et al. | Electricity price forecasting accounting for renewable energies: optimal combined forecasts | |
| CA3160715A1 (en) | Systems and methods for business analytics model scoring and selection |
Legal Events
| Date | Code | Title | Description |
|---|---|---|---|
| AS | Assignment | Owner name:PREVEDERE, INC., OHIO Free format text:ASSIGNMENT OF ASSIGNORS INTEREST;ASSIGNORS:WAGNER, RICHARD;KERNS, JASON B.;PAUL, JOSE K.;AND OTHERS;REEL/FRAME:042666/0522 Effective date:20170309 | |
| STPP | Information on status: patent application and granting procedure in general | Free format text:FINAL REJECTION MAILED | |
| STPP | Information on status: patent application and granting procedure in general | Free format text:DOCKETED NEW CASE - READY FOR EXAMINATION | |
| STPP | Information on status: patent application and granting procedure in general | Free format text:NON FINAL ACTION MAILED | |
| STPP | Information on status: patent application and granting procedure in general | Free format text:RESPONSE TO NON-FINAL OFFICE ACTION ENTERED AND FORWARDED TO EXAMINER | |
| STPP | Information on status: patent application and granting procedure in general | Free format text:NOTICE OF ALLOWANCE MAILED -- APPLICATION RECEIVED IN OFFICE OF PUBLICATIONS | |
| STPP | Information on status: patent application and granting procedure in general | Free format text:AWAITING TC RESP., ISSUE FEE NOT PAID | |
| STPP | Information on status: patent application and granting procedure in general | Free format text:PUBLICATIONS -- ISSUE FEE PAYMENT VERIFIED | |
| STCF | Information on status: patent grant | Free format text:PATENTED CASE | |
| AS | Assignment | Owner name:JPMORGAN CHASE BANK, N.A., NEW YORK Free format text:SECURITY INTEREST;ASSIGNOR:PREVEDERE, INC.;REEL/FRAME:060184/0924 Effective date:20220610 | |
| MAFP | Maintenance fee payment | Free format text:PAYMENT OF MAINTENANCE FEE, 4TH YR, SMALL ENTITY (ORIGINAL EVENT CODE: M2551); ENTITY STATUS OF PATENT OWNER: SMALL ENTITY Year of fee payment:4 | |
| AS | Assignment | Owner name:BOARD AMERICAS, INC., MASSACHUSETTS Free format text:ASSIGNMENT OF ASSIGNORS INTEREST;ASSIGNOR:PREVEDERE, INC.;REEL/FRAME:069612/0047 Effective date:20241031 Owner name:PREVEDERE, INC., OHIO Free format text:RELEASE BY SECURED PARTY;ASSIGNOR:JPMORGAN CHASE BANK, N.A.;REEL/FRAME:069612/0277 Effective date:20241031 |