US10614094B2 - Visualizing topics with bubbles including pixels - Google Patents
Visualizing topics with bubbles including pixelsDownload PDFInfo
- Publication number
- US10614094B2 US10614094B2US15/114,198US201415114198AUS10614094B2US 10614094 B2US10614094 B2US 10614094B2US 201415114198 AUS201415114198 AUS 201415114198AUS 10614094 B2US10614094 B2US 10614094B2
- Authority
- US
- United States
- Prior art keywords
- records
- bubbles
- candidate terms
- visualization
- topics
- Prior art date
- Legal status (The legal status is an assumption and is not a legal conclusion. Google has not performed a legal analysis and makes no representation as to the accuracy of the status listed.)
- Active, expires
Links
Images


Classifications
- G—PHYSICS
- G06—COMPUTING OR CALCULATING; COUNTING
- G06F—ELECTRIC DIGITAL DATA PROCESSING
- G06F16/00—Information retrieval; Database structures therefor; File system structures therefor
- G06F16/20—Information retrieval; Database structures therefor; File system structures therefor of structured data, e.g. relational data
- G06F16/26—Visual data mining; Browsing structured data
- G—PHYSICS
- G06—COMPUTING OR CALCULATING; COUNTING
- G06F—ELECTRIC DIGITAL DATA PROCESSING
- G06F16/00—Information retrieval; Database structures therefor; File system structures therefor
- G06F16/20—Information retrieval; Database structures therefor; File system structures therefor of structured data, e.g. relational data
- G06F16/22—Indexing; Data structures therefor; Storage structures
- G06F16/2228—Indexing structures
- G06F16/2272—Management thereof
- G—PHYSICS
- G06—COMPUTING OR CALCULATING; COUNTING
- G06F—ELECTRIC DIGITAL DATA PROCESSING
- G06F16/00—Information retrieval; Database structures therefor; File system structures therefor
- G06F16/20—Information retrieval; Database structures therefor; File system structures therefor of structured data, e.g. relational data
- G06F16/24—Querying
- G06F16/245—Query processing
- G06F16/2457—Query processing with adaptation to user needs
- G06F16/24578—Query processing with adaptation to user needs using ranking
- G—PHYSICS
- G06—COMPUTING OR CALCULATING; COUNTING
- G06F—ELECTRIC DIGITAL DATA PROCESSING
- G06F16/00—Information retrieval; Database structures therefor; File system structures therefor
- G06F16/30—Information retrieval; Database structures therefor; File system structures therefor of unstructured textual data
- G06F16/35—Clustering; Classification
- G—PHYSICS
- G06—COMPUTING OR CALCULATING; COUNTING
- G06T—IMAGE DATA PROCESSING OR GENERATION, IN GENERAL
- G06T11/00—2D [Two Dimensional] image generation
- G06T11/60—Editing figures and text; Combining figures or text
Definitions
- An enterprisecan receive various types of user reviews that contain feedback about the enterprise.
- User reviewscan be submitted online at third-party sites (e.g. web survey sites or social networking sites).
- reviewscan be received directly by an enterprise.
- FIG. 1illustrates an example graphical visualization that includes bubbles representing respective topics, in accordance with some implementations.
- FIG. 2is an example schematic diagram of a bubble including pixels assigned to visual indicators corresponding to sentiments expressed in data records, in accordance with some implementations.
- FIG. 3is a flow diagram of an example visualization process at a client device, according to some implementations.
- FIG. 4is a flow diagram of example data record processing at a server device according to some implementations.
- FIG. 5is a flow diagram of an example process at a client device, according to some implementations.
- FIG. 6is a block diagram of an example arrangement including a client device and a server device, according to some implementations.
- An enterprisemay collect feedback from users that can be used to better understand user sentiment regarding the enterprise, such as about an offering of the enterprise or another feature of the enterprise.
- An offeringcan include a product or a service provided by the enterprise.
- a “sentiment”refers to an attitude, opinion, or judgment of a human with respect to the offering.
- An opinion or other sentimentcan be mapped to an attribute (such as an attribute associated with an offering) to indicate a degree of satisfaction or other sentiment with the attribute.
- User feedbackcan be collected from various sources, such as online websites of the enterprise or third-party sites such as travel review websites, product review websites, social networking sites, web survey sites, customer support agents, and so forth.
- the user feedbackcan be received in data records.
- a “data record”can refer to a unit of data that contains collected information.
- the data recordcan include a user review submitted by a particular user, in which the user may have expressed a sentiment with respect to an attribute.
- a data recordcan include one or multiple attributes, where an attribute can refer to an item (e.g. product offering, service offering, sport team, players of a sport team, a movie, a song, etc.) that may be the subject of review or feedback from users.
- Visualizing relatively large volumes of data records containing user feedback for the purpose of sentiment analysiscan be complex and time-consuming.
- an analysis of information contained in data recordscan be performed.
- the analysis of the user feedback contained in the data recordscan attempt to identify time periods of increased negative sentiment, determine root causes of the negative sentiment, and to identify actions to take in response to the determined root causes.
- automated visual analytics techniques or mechanismsare provided for identifying and visualizing issues in user feedback expressed in data records.
- the identification and visualization of issues in user feedbackcan be performed on a “real-time” basis, in which the identification and visualization can be performed as data records are being received.
- real-time visual analyticsin some implementations, it is noted that in alternative implementations, visual analytics can be performed in an offline manner on data records stored in a historical log or other historical data collection.
- the identified issuesare represented as topics, where a topic provides a description or indication of an issue expressed in user feedback.
- topicsare depicted in a visualization (in the form of a graphical representation) that includes bubbles containing pixels.
- Each topicis represented by a set of one or multiple bubbles in the visualization.
- a “bubble”can refer to a discrete region containing pixels in the visualization that is visibly distinct from another region containing pixels in the visualization.
- the pixels of a bubblerepresent respective data records (e.g. user reviews) within a respective time interval for a given topic. Multiple bubbles representing a given topic correspond to respective different time intervals.
- a pixelcan refer to a graphical element that can be displayed in a visualization, where the graphical element can be in the form of a dot, square, circle, or any other shape.
- Each pixelis assigned a visual indicator to indicate a sentiment expressed with respect to an attribute contained in a data record. Pixels are assigned different visual indicators to depict corresponding different sentiments expressed with respect to a respective topic.
- the visual indicatorscan include different colors.
- a first colorcan be assigned to a pixel for a positive user sentiment expressed with respect to the corresponding attribute, while a second, different color can be assigned to represent a negative user sentiment expressed with respect to the attribute.
- a positive sentimentcan be indicated by a green color
- a negative sentimentcan be indicated by a red color.
- Different shades of greencan express different levels of positive user sentiment (e.g. darker green can express a more positive sentiment than a lighter green).
- different shades of redcan express different levels of negative sentiment (e.g. darker red can express a more negative sentiment that lighter red).
- a neutral sentiment(a sentiment that is neither positive nor negative) can be expressed by a different color, such as a gray or white color. In other examples, other colors can be used to express different sentiments.
- the sentiment expressed in a particular data record for a given attributecan be based on scores assigned by a user (e.g., a score between 1 and 5, where 5 is positive while 1 is negative and 3 is neutral, or a score from among ⁇ 2, ⁇ 1, 0, +1, +2, where the positive values reflect positive sentiment, negative values reflect negative sentiment, and 0 reflects a neutral sentiment).
- the sentiment expressed in a particular data record for a given attributecan be based on an analysis of words in the particular data record. For example, the analysis can identify sentiment words associated with nouns (or compound nouns) that are targets of the sentiment words. The sentiment words can be processed to determine the corresponding sentiment (e.g. positive sentiment, negative sentiment, neutral sentiment).
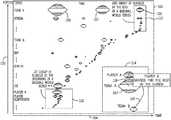
- FIG. 1illustrates an example visualization 100 that has a first axis 102 and a second axis 104 .
- Different points along the first axis 102represents respective topics, while different points along the second axis 104 represents different points in time.
- the example topics depicted in the visualization 100include “TEAM A,” “GAME,” “STREAK,” and so forth.
- Various bubblesare included in the visualization 100 , with bubbles 106 , 107 , and 108 being referenced in FIG. 1 .
- Each bubbleincludes an arrangement of pixels assigned respective different colors corresponding to sentiments expressed with respect to the respective topic. Different cross hatchings within each bubble represent respective different collections of pixels assigned corresponding different colors.
- the bubbles 106 , 107 , and 108represent the “TEAM A” topic, and different colors assigned to the pixels in the bubbles 106 , 107 , and 108 are based on respective sentiments expressed with respect to the “TEAM A” topic for different respective time intervals.
- the topics 106 , 107 , and 108are arranged across a row in the visualization 100 (each row in the visualization 100 is made up of a horizontal line or arrangement of one or multiple bubbles). Each different row in the visualization 100 includes one or multiple bubbles corresponding to a respective different topic. For the sake of clarity, some of the topics are not listed in the visualization of FIG. 1 .
- bubbles arranged along a given line (e.g. row) that is parallel to the time axis of the visualization 100represent a respective topic.
- FIG. 1shows a group 110 of bubbles that represent various topics at the beginning of the world series, and a second group 112 of bubbles that represent topics at the end of the world series.
- the visualization 100can be an interactive visualization, such that a user can interact with elements in the visualization 100 .
- a user input devicee.g. mouse device, touchscreen, keyboard, etc.
- a usercan move a cursor over a pixel included in a bubble in the visualization 100 .
- a dialog boxcan pop up, where the dialog box can include further details regarding the content of the data record (e.g. user review) represented by the pixel.
- a usercan select a bubble, such as by clicking on a button of a mouse device, tapping on the location of the bubble on a touchscreen, and so forth.
- another visualization screencan be displayed, such as visualization screen 114 shown in FIG. 1 , which provides a zoomed view.
- the bubble selected by the usercan be bubble 107 .
- the visualization screen 114displays the selected bubble 107 , along with other bubbles that are associated with the selected bubble 107 .
- a bubble representing a “PLAYER A” topicis linked by a link 116 to the selected bubble 107 .
- the bubble representing the “PLAYER A” topicis linked by a link 116 to a bubble representing a “TEAM B” topic.
- Bubblescan be linked together if they share data records or information in data records, for example, or according to another criterion.
- the bubbles in the visualization screen 114are bubbles containing pixels representing data records that correspond to a specific time interval. In this example, bubbles from different time intervals are not linked together.
- the visualization screen 114thus provides a zoomed view, and also links a selected bubble with other bubbles.
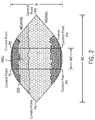
- FIG. 2is a schematic diagram of a bubble 200 , according to some implementations.
- pixelsare depicted as little circles, and these pixels represent corresponding data records.
- Visual indicatorsare assigned to the pixels based on sentiments expressed with respect to a respective topic by the data records represented by the pixels.
- the pixelsare located in regions of the bubbles with different cross hatchings, which represent different colors assigned to the pixels. Pixels in the upper portions of the pixel 200 are assigned color(s) corresponding to a negative sentiment, pixels in the lower portions of the bubble 200 are assigned color(s) corresponding to a positive sentiment, and pixels in a portion between the upper and lower portions are assigned a color corresponding to a neutral sentiment.
- the pixelsare sorted in the bubble 200 according to sentiment scores assigned to the pixels, such that groups of pixels of common color are formed (the groups corresponding to the portions of the bubble 200 of FIG. 2 ).
- the bubble 200has various dimensions, including a height (H), an overall width (W 1 ), and a center width (W 2 ).
- the number of data records represented by the bubble 200determines the size and shape of the bubble.
- the area of the bubble 200is set to allow the bubble 200 to contain the number of pixels representing the data records corresponding to the bubble 200 .
- the overall width W 1 of the bubble 200is based on the time interval represented by the bubble 200 .
- the height (H) of the bubble 200is restricted according to the following condition to avoid a bubble having an irregular shape, and to obtain more space along the axis 102 ( FIG. 1 ) of the visualization 100 to depict topics:
- H and W 1Although a specific relationship between H and W 1 is expressed in Eq. 1, it is noted that in other examples, a different relationship can be specified between H and W 1 .
- a bubblecan be drawn using a B-Spline function.
- a B-Spline functionemploys six control points, P 1 , P 2 , P 3 , P 4 , P 5 , and P 6 shown in FIG. 2 .
- the control points P 1 and P 2are separated by the center width (W 2 ).
- the control points P 4 and P 5are separated by the center width (W 2 ).
- a bubblecan have a different shape, such as a circular shape, an elliptical shape, a polygonal shape, and so forth.
- a client devicecan refer to an electronic device (e.g. desktop computer, notebook computer, tablet computer, smartphone, personal digital assistant, etc.) that includes or is associated with a display device in which a user can view a visualization (e.g. 100 in FIG. 1 ).
- a server devicecan refer to a computer or a collection of computers that a client device can communicate with over a network.
- FIG. 3is a flow diagram of a visualization process at a client device according to some implementations.
- the visualization processreceives (at 302 ) selected topics identified from data records.
- the topicsare identified based on scoring candidate terms in the data records according to specified metrics.
- the selected topicscan be considered critical topics or important topics, from the perspective of a given enterprise (e.g. business concern, educational organization, government agency, individual, etc.).
- a “candidate term”can refer to certain words (e.g. a noun or a combination of nouns) included in a data record, where the noun or combination of nouns can be a candidate topic to be visualized. Scoring of the candidate terms allows scores to be assigned to the candidate terms, such that candidate terms with higher scores can be selected as topics for visualization.
- Candidate terms with lower scorescan be omitted from visualization.
- the specified metrics used for scoring the candidate termscan include some combination of the following: (1) a frequency metric, which represents the frequency of occurrence of data records pertaining to a respective candidate term, (2) a negativity metric, which represents the negativity of sentiment expressed with respect to a candidate term, (3) a context coherence metric, which indicates whether text expressed by multiple data records pertaining to a candidate term relate to a common topic, and (4) a user-specified metric, which can be any metric specified by a user to affect scoring of a candidate term.
- the frequency metric for a candidate termis computed by determining the number of data records containing the candidate term within a given time interval.
- the negativity metric for a candidate termcan be determined by summing (or otherwise aggregating) sentiment scores (e.g. sentiment scores assigned by users, or sentiment scores derived based on opinion words expressed about the candidate term) for the candidate term in data records within a given time interval.
- Other types of aggregating of sentiment scorescan include averaging the sentiment scores, identifying a median of the sentiment scores, identifying a maximum or minimum of the sentiment scores, or any other type of aggregating.
- An example of a user-specified metriccan relate to a threshold specified by a user relating to any attribute that may be contained in a data record.
- the value of the user-specified metriccan be set to a first value if the attribute exceeds the threshold, and to a second value if the attribute does not exceed the threshold.
- a user-specified metriccan be a time-based metric, which can specify that more recent data records are to be weighted higher than less recent data records.
- a score computed for a candidate termcan be adjusted based on relative recency of a data record in which the candidate term is included.
- Other examples of user-specified metricscan be used in other implementations. More generally, a user-specified metric can be provided based on user input to allow a user to control scoring of candidate terms. The user input can be received at an electronic device, or can be included in a file, such as a configuration file.
- Context coherenceis determined by checking whether words besides “USB cable” mentioned in the set of data records are common in at least a majority of the data records in the set. As an example, one such word can be “missing,” which can be in close proximity to the “USB cable” term in some of the data records.
- the presence of the word “missing” in close proximity to the “USB cable” term in a majority of the data recordscan indicate with some likelihood that “USB cable” is used in a common context, in other words, relate to the same issue (e.g. the issue of a missing USB cable). More specifically, the context coherence metric is based on whether co-occurrence of words in data records (e.g. user reviews) relate to the same issue (i.e. a respective topic).
- the score computed for each candidate termis based on a product of the foregoing metrics.
- a different aggregation of the metricscan be performed, where the different aggregation can include a sum, a weighted sum, or some other aggregation function.
- the score in Eq. 2is calculated on an aggregation of four metrics, it is noted that in other examples, a score can be calculated based on a smaller number of metrics, or a larger number of metrics. For example, the score can be calculated based on two or more of the listed metrics, or other metrics.
- the visualization processgenerates (at 304 ) a visualization (e.g. 100 in FIG. 1 ) that includes bubbles representing the respective topics, where the bubbles include pixels representing corresponding data records.
- the visualization processfurther assigns (at 306 ) visual indicators (e.g. different colors) to the pixels in each bubble according to sentiments expressed in the corresponding data records for the topic represented by the respective bubble. In other examples, visual indicators are assigned to the pixels according to values of other types of attributes contained in the data records.
- FIG. 4is a flow diagram of data record processing at a server device according to some implementations. The procedure of FIG. 4 is repeated for each data record that is received.
- the data record processingincludes tokenizing (at 402 ) the data record into candidate terms. Tokenizing a data record refers to breaking up a data record into a collection of tokens, where some of the tokens can include candidate terms.
- Tasks 404 , 406 , 408 , 410 , 412 , 414 , and 416are performed iteratively for each of the candidate terms identified by the tokenizing ( 402 ).
- the data record processingdetermines (at 404 ) if the currently considered candidate term is in a management database.
- a management databaseis a data structure that stores candidate terms that have been previously processed. If the candidate term is not in the management database, then the candidate term is added (at 406 ) to the management database.
- event detection data associated with a candidate termis also stored, such as in the management database or in another data structure.
- event detection datacan include any one or some combination of the following: a timestamp (to indicate the last time that a data record containing the candidate term was received), sentiment stores for the candidate term, descriptive terms that describe data records containing the candidate term, and so forth.
- the event detection datacan include information relating to the various metrics used for scoring the candidate terms, such as according to Eq. 2 above.
- the event detection data associated with the candidate termis updated (at 410 ).
- the candidate termis considered (at 412 ) to correspond to a critical event
- the respective data recordis stored (at 414 ), and the topic is marked (at 416 ) with a flag for visualization.
- This flagindicates to a visualization process (such as the visualization process of FIG. 3 ) that the topic is to be visualized in a visualization (e.g. 100 in FIG. 1 ).
- techniques or mechanisms according to some implementationscan be implemented in an arrangement that includes a client device and a server device (e.g. client device 602 and server device 604 shown in FIG. 6 , discussed further below).
- the data record processing of FIG. 4can be performed at the server device 604
- the visualization process of FIG. 3can be performed at the client device 602 .
- the taskscan be performed on a common computer (or a common set of computers).
- FIG. 5illustrates further processing performed at a client device (e.g. 602 in FIG. 6 ), according to some examples.
- the client devicereceives (at 502 ) topics marked with the flag for visualization (as marked at 416 in FIG. 4 ). Tasks 504 , 506 , 508 , 510 , and 512 are iteratively performed for each topic received.
- the client devicedetermines (at 504 ) if the topic is already visualized. If not, a new topic is created (at 506 ) in the visualization. If the topic is already visualized, then a new topic does not have to be created.
- the client devicecreates (at 508 ) a bubble for data records associated with the topic.
- the bubbleis then arranged (at 510 ) in the visualization.
- the processthen proceeds to the next topic ( 512 ).
- the visualization processcan update the visualization in respective time intervals (e.g. every second, every minute, every hour, etc.). To do so, the timestamp of a first data record is recorded as the beginning of a current time interval.
- the end of the current tune intervalcan be a time equal to the timestamp corresponding to the beginning of the first interval plus the length of the interval, where the length can be a specified length (e.g. set by a user, or preset in a system).
- the systemchecks whether the data record is still in the current time interval. If the newly received data record is in the current time interval, the data record is processed for visualization in a bubble corresponding to the current time interval. However, if the newly received data record is not in the current time interval, then the visualization is updated to create a new time interval, such that the newly received data record is visualized in a bubble in the new time interval.
- Arranging a bubble in the visualizationcan include merging multiple bubbles or splitting a bubble into multiple bubbles. Two bubbles are merged when at least the width of at least one of the bubbles increases such that the two bubbles overlap. In response to detecting overlap of the two bubbles, the two bubbles can be merged into one bubble.
- a given bubbleis split into multiple bubbles if there is a time gap in the given bubble with no pixels (in other words, there are no data records relating to a respective topic in the time gap). If such a time gap is detected, then the given bubble is split into two bubbles separated by the time gaps.
- the size and shape of the bubblecan be updated, by increasing the width (W 1 ) and/or height (H) of the bubble.
- the size and shape of the bubbleis updated in a manner that is consistent with Eq. 1, for example.
- the topics in the visualization 100can be arranged such that topics for which more recent data records have been received are arranged closer to the top of the visualization 100 than topics for which data records have not been recently received.
- the older topics(those topics for which data records have not been received for some time) are moved closer to the bottom of the visualization 100 .
- an older topic that is near the bottom of the visualization 100can be moved closer to the top of the visualization 100 if data records referring to the older topic are recently received.
- the positions of the topicscan continually change.
- the size and shape of certain bubblescan also continually change.
- the visualizatione.g. 100 in FIG. 1 ) is dynamically updated as data records are received.
- FIG. 6is a block diagram of an example arrangement that includes the client device 602 and the server device 604 , which can be coupled over a network 606 .
- the client device 602includes a display device 608 , which can display a visualization 610 (e.g. 100 in FIG. 1 ).
- the client device 602also includes one or multiple processors 612 , which can be coupled to a network interface 614 (for communications over the network 606 ), and a non-transitory machine-readable or computer-readable storage medium (or storage media) 616 .
- a processorcan include a microprocessor, microcontroller, processor module or subsystem, programmable integrated circuit, programmable gate array, or another control or computing device.
- the storage medium(or storage media) 616can store visualization instructions 618 , which are executable on the processor(s) 612 to perform various tasks discussed above including tasks of FIGS. 3 and 5 , as examples. Moreover, note that in some implementations (such as implementations without the server device 604 ), the visualization instructions 618 can also perform tasks of FIG. 4 .
- the server device 604includes one or multiple processors 620 , which can be coupled to a network interface 622 (for communications over the network 606 ), and to a non-transitory machine-readable or computer-readable storage medium (or storage media) 624 .
- the storage medium (or storage media) 624can store data record processing instructions 626 and topic detection instructions 628 .
- the data record processing instructions 626can perform the processing of FIG. 4 , for example.
- the topic detection instructions 628can apply the scoring function according to Eq. 2, to assign scores to candidate terms for the purpose of determining topics for visualization based on the scores.
- the storage medium (or storage media) 624can also store various data records 630 , as well as a management database 632 .
- the management database 632is the management database referred to above for storing candidate terms (and respective event detection data) that have been previously processed.
- the storage media 616 and 624can include different forms of memory including semiconductor memory devices such as dynamic or static random access memories (DRAMs or SRAMs), erasable and programmable read-only memories (EPROMs), electrically erasable and programmable read-only memories (EEPROMs) and flash memories; magnetic disks such as fixed, floppy and removable disks; other magnetic media including tape; optical media such as compact disks (CDs) or digital video disks (DVDs); or other types of storage devices.
- semiconductor memory devicessuch as dynamic or static random access memories (DRAMs or SRAMs), erasable and programmable read-only memories (EPROMs), electrically erasable and programmable read-only memories (EEPROMs) and flash memories
- magnetic diskssuch as fixed, floppy and removable disks
- other magnetic media including tapeoptical media such as compact disks (CDs) or digital video disks (DVDs); or other types of storage devices.
- CDscompact disks
- DVDsdigital video disks
- Such computer-readable or machine-readable storage medium or mediais (are) considered to be part of an article (or article of manufacture).
- An article or article of manufacturecan refer to any manufactured single component or multiple components.
- the storage medium or mediacan be located either in the machine running the machine-readable instructions, or located at a remote site from which machine-readable instructions can be downloaded over a network for execution.
Landscapes
- Engineering & Computer Science (AREA)
- Theoretical Computer Science (AREA)
- Databases & Information Systems (AREA)
- Physics & Mathematics (AREA)
- General Physics & Mathematics (AREA)
- Data Mining & Analysis (AREA)
- General Engineering & Computer Science (AREA)
- Software Systems (AREA)
- Computational Linguistics (AREA)
- Information Retrieval, Db Structures And Fs Structures Therefor (AREA)
Abstract
Description
SCORE=FREQUENCY·SENTIMENT_NEGATIVITY·CONTEXT_COHERENCE·USER_METRIC, (Eq. 2)
where FREQUENCY is the frequency metric, SENTIMENT_NEGATIVITY is the negativity metric, CONTEXT_COHERENCE is the context coherence metric, and USER_METRIC is the user-specified metric. In Eq. 2, the score computed for each candidate term is based on a product of the foregoing metrics. In other examples, a different aggregation of the metrics can be performed, where the different aggregation can include a sum, a weighted sum, or some other aggregation function. Also, although the score in Eq. 2 is calculated on an aggregation of four metrics, it is noted that in other examples, a score can be calculated based on a smaller number of metrics, or a larger number of metrics. For example, the score can be calculated based on two or more of the listed metrics, or other metrics.
Claims (20)
Applications Claiming Priority (1)
| Application Number | Priority Date | Filing Date | Title |
|---|---|---|---|
| PCT/US2014/036056WO2015167497A1 (en) | 2014-04-30 | 2014-04-30 | Visualizing topics with bubbles including pixels |
Publications (2)
| Publication Number | Publication Date |
|---|---|
| US20160371350A1 US20160371350A1 (en) | 2016-12-22 |
| US10614094B2true US10614094B2 (en) | 2020-04-07 |
Family
ID=54359049
Family Applications (1)
| Application Number | Title | Priority Date | Filing Date |
|---|---|---|---|
| US15/114,198Active2035-11-19US10614094B2 (en) | 2014-04-30 | 2014-04-30 | Visualizing topics with bubbles including pixels |
Country Status (2)
| Country | Link |
|---|---|
| US (1) | US10614094B2 (en) |
| WO (1) | WO2015167497A1 (en) |
Families Citing this family (3)
| Publication number | Priority date | Publication date | Assignee | Title |
|---|---|---|---|---|
| US9880723B2 (en) | 2015-03-27 | 2018-01-30 | Spkdrm Llc | Graphical user interface using color spectrum to map sentiments |
| CN108763429B (en)* | 2018-05-24 | 2022-03-29 | 成都睿码科技有限责任公司 | Two-dimensional display method for simulating development trend of cell-breeding news events |
| CN112903865B (en)* | 2021-02-02 | 2022-03-01 | 青岛啤酒股份有限公司 | Establishment method and obtained model of the visualization model of aroma substances in distilled wine |
Citations (26)
| Publication number | Priority date | Publication date | Assignee | Title |
|---|---|---|---|---|
| US6411936B1 (en) | 1999-02-05 | 2002-06-25 | Nval Solutions, Inc. | Enterprise value enhancement system and method |
| US20030122874A1 (en) | 2001-12-28 | 2003-07-03 | International Business Machines Corporation | System and method for visualizing and navigating dynamic content in a graphical user interface |
| US20040083127A1 (en) | 2002-10-29 | 2004-04-29 | Lunsford Joseph R. | Web site and method for search engine optimization by prompting, recording and displaying feedback of a web site user |
| US20040252128A1 (en)* | 2003-06-16 | 2004-12-16 | Hao Ming C. | Information visualization methods, information visualization systems, and articles of manufacture |
| US20060026210A1 (en) | 2004-07-28 | 2006-02-02 | Vaszary Mark K | Managing feedback data |
| US20080256040A1 (en)* | 2007-04-16 | 2008-10-16 | Ebay Inc. | Visualization of reputation ratings |
| US20100106752A1 (en)* | 2004-05-04 | 2010-04-29 | The Boston Consulting Group, Inc. | Method and apparatus for selecting, analyzing, and visualizing related database records as a network |
| US20100231594A1 (en)* | 2009-03-16 | 2010-09-16 | Hao Ming C | Constructing a cell-based cluster of data records of a scatter plot |
| US20100332465A1 (en)* | 2008-12-16 | 2010-12-30 | Frizo Janssens | Method and system for monitoring online media and dynamically charting the results to facilitate human pattern detection |
| US20110055212A1 (en)* | 2009-09-01 | 2011-03-03 | Cheng-Fa Tsai | Density-based data clustering method |
| US20110314007A1 (en) | 2010-06-16 | 2011-12-22 | Guy Dassa | Methods, systems, and media for content ranking using real-time data |
| US20120011158A1 (en) | 2010-03-24 | 2012-01-12 | Taykey Ltd. | System and methods thereof for real-time monitoring of a sentiment trend with respect of a desired phrase |
| US20120011006A1 (en) | 2010-07-09 | 2012-01-12 | Richard Schultz | System And Method For Real-Time Analysis Of Opinion Data |
| US20120023522A1 (en)* | 2005-01-12 | 2012-01-26 | Invidi Technologies Corporation | Targeted impression model for broadcast network asset delivery |
| US20120109843A1 (en) | 2010-10-27 | 2012-05-03 | Hao Ming C | Visual analysis of a time sequence of events using a time density track |
| US20120290950A1 (en)* | 2011-05-12 | 2012-11-15 | Jeffrey A. Rapaport | Social-topical adaptive networking (stan) system allowing for group based contextual transaction offers and acceptances and hot topic watchdogging |
| WO2012167399A1 (en) | 2011-06-08 | 2012-12-13 | Hewlett-Packard Development Company, L.P. | Sentiment trend visualization relating to an event occurring in a particular geographic region |
| US20120317049A1 (en)* | 2011-06-08 | 2012-12-13 | Hao Ming C | Selecting sentiment attributes for visualization |
| US20120323627A1 (en) | 2011-06-14 | 2012-12-20 | Microsoft Corporation | Real-time Monitoring of Public Sentiment |
| US20130073336A1 (en) | 2011-09-15 | 2013-03-21 | Stephan HEATH | System and method for using global location information, 2d and 3d mapping, social media, and user behavior and information for a consumer feedback social media analytics platform for providing analytic measfurements data of online consumer feedback for global brand products or services of past, present, or future customers, users or target markets |
| US20130194272A1 (en)* | 2012-02-01 | 2013-08-01 | Ming C. Hao | Placing pixels according to attribute values in positions in a graphical visualization that correspond to geographic locations |
| US20130232263A1 (en)* | 2009-12-18 | 2013-09-05 | Morningside Analytics | System and method for classifying a contagious phenomenon propagating on a network |
| US8600796B1 (en)* | 2012-01-30 | 2013-12-03 | Bazaarvoice, Inc. | System, method and computer program product for identifying products associated with polarized sentiments |
| US20140019119A1 (en)* | 2012-07-13 | 2014-01-16 | International Business Machines Corporation | Temporal topic segmentation and keyword selection for text visualization |
| US20140040247A1 (en) | 2012-07-31 | 2014-02-06 | Ming C. Hao | Visualizing time-dense episodes |
| US20160140208A1 (en)* | 2013-06-14 | 2016-05-19 | Microsoft Technology Licensing, Llg | Fast Grouping of Time Series |
- 2014
- 2014-04-30WOPCT/US2014/036056patent/WO2015167497A1/enactiveApplication Filing
- 2014-04-30USUS15/114,198patent/US10614094B2/enactiveActive
Patent Citations (26)
| Publication number | Priority date | Publication date | Assignee | Title |
|---|---|---|---|---|
| US6411936B1 (en) | 1999-02-05 | 2002-06-25 | Nval Solutions, Inc. | Enterprise value enhancement system and method |
| US20030122874A1 (en) | 2001-12-28 | 2003-07-03 | International Business Machines Corporation | System and method for visualizing and navigating dynamic content in a graphical user interface |
| US20040083127A1 (en) | 2002-10-29 | 2004-04-29 | Lunsford Joseph R. | Web site and method for search engine optimization by prompting, recording and displaying feedback of a web site user |
| US20040252128A1 (en)* | 2003-06-16 | 2004-12-16 | Hao Ming C. | Information visualization methods, information visualization systems, and articles of manufacture |
| US20100106752A1 (en)* | 2004-05-04 | 2010-04-29 | The Boston Consulting Group, Inc. | Method and apparatus for selecting, analyzing, and visualizing related database records as a network |
| US20060026210A1 (en) | 2004-07-28 | 2006-02-02 | Vaszary Mark K | Managing feedback data |
| US20120023522A1 (en)* | 2005-01-12 | 2012-01-26 | Invidi Technologies Corporation | Targeted impression model for broadcast network asset delivery |
| US20080256040A1 (en)* | 2007-04-16 | 2008-10-16 | Ebay Inc. | Visualization of reputation ratings |
| US20100332465A1 (en)* | 2008-12-16 | 2010-12-30 | Frizo Janssens | Method and system for monitoring online media and dynamically charting the results to facilitate human pattern detection |
| US20100231594A1 (en)* | 2009-03-16 | 2010-09-16 | Hao Ming C | Constructing a cell-based cluster of data records of a scatter plot |
| US20110055212A1 (en)* | 2009-09-01 | 2011-03-03 | Cheng-Fa Tsai | Density-based data clustering method |
| US20130232263A1 (en)* | 2009-12-18 | 2013-09-05 | Morningside Analytics | System and method for classifying a contagious phenomenon propagating on a network |
| US20120011158A1 (en) | 2010-03-24 | 2012-01-12 | Taykey Ltd. | System and methods thereof for real-time monitoring of a sentiment trend with respect of a desired phrase |
| US20110314007A1 (en) | 2010-06-16 | 2011-12-22 | Guy Dassa | Methods, systems, and media for content ranking using real-time data |
| US20120011006A1 (en) | 2010-07-09 | 2012-01-12 | Richard Schultz | System And Method For Real-Time Analysis Of Opinion Data |
| US20120109843A1 (en) | 2010-10-27 | 2012-05-03 | Hao Ming C | Visual analysis of a time sequence of events using a time density track |
| US20120290950A1 (en)* | 2011-05-12 | 2012-11-15 | Jeffrey A. Rapaport | Social-topical adaptive networking (stan) system allowing for group based contextual transaction offers and acceptances and hot topic watchdogging |
| WO2012167399A1 (en) | 2011-06-08 | 2012-12-13 | Hewlett-Packard Development Company, L.P. | Sentiment trend visualization relating to an event occurring in a particular geographic region |
| US20120317049A1 (en)* | 2011-06-08 | 2012-12-13 | Hao Ming C | Selecting sentiment attributes for visualization |
| US20120323627A1 (en) | 2011-06-14 | 2012-12-20 | Microsoft Corporation | Real-time Monitoring of Public Sentiment |
| US20130073336A1 (en) | 2011-09-15 | 2013-03-21 | Stephan HEATH | System and method for using global location information, 2d and 3d mapping, social media, and user behavior and information for a consumer feedback social media analytics platform for providing analytic measfurements data of online consumer feedback for global brand products or services of past, present, or future customers, users or target markets |
| US8600796B1 (en)* | 2012-01-30 | 2013-12-03 | Bazaarvoice, Inc. | System, method and computer program product for identifying products associated with polarized sentiments |
| US20130194272A1 (en)* | 2012-02-01 | 2013-08-01 | Ming C. Hao | Placing pixels according to attribute values in positions in a graphical visualization that correspond to geographic locations |
| US20140019119A1 (en)* | 2012-07-13 | 2014-01-16 | International Business Machines Corporation | Temporal topic segmentation and keyword selection for text visualization |
| US20140040247A1 (en) | 2012-07-31 | 2014-02-06 | Ming C. Hao | Visualizing time-dense episodes |
| US20160140208A1 (en)* | 2013-06-14 | 2016-05-19 | Microsoft Technology Licensing, Llg | Fast Grouping of Time Series |
Non-Patent Citations (11)
| Title |
|---|
| Duan, et al., "VISA: A Visual Sentiment Analysis System" VINCI'12, Sep. 27-28, 2012 (9 pages). |
| Franz Wanner, et al; Visual Sentimental Analysis of RSS News Feeds Featuring the US Presidential Election in 2008, workshop on visual Interfaces to the Social and the Semantic Web (VISSW2009), IUI2009, Feb. 8, 2009. |
| International Search Report and Written Opinion of the International Searching Authority, dated Jan. 29, 2015, issued in related PCT Application No. PCT/US2014/036056. |
| Milos Krstajic et al, "Cloudlines: Compact Display of Event Episodes in Multiple Time-Series", cited in OA; Dec. 2011; 8 pages. |
| Nicholas Diakopoulos, et al., Diamonds in the Rough: Social Media Visual Analysis for Journalistic Inquiry; Rutgers University, School of Communication and Information, Oct. 2010 (8 pgs). |
| Oelke et al, "Visual Opinion Analysis of Customer Feedback Data", IEEE VAST, p. 187-194, Oct. 2009. |
| Rohrdantz, et al., "Feature-based Visual Sentiment Analysis of Text Document Streams" ACM Journal Name, vol. 1, Dec. 2010 (pp. 1-27). |
| Wang, et al., "SentiView; Sentiment Analysis and Visualization for Internet Popular Topics" IEEE Transactions on Human-Machine Systems, 2013 (11 pages). |
| www.clarabridge.com;, Clarabridge Enterprise | License Version or SaaS Subscription dated on or before Jul. 22, 2010. |
| www.sas.com, Social Media Monitoring and Analysis, SAS Social Media Analytic | SAS dated on or before Jul. 22, 2010 ( 4 pages). |
| Zhicheng Liu et al, SellTrend: Inter-Attribute Visual Analysis of Temporal Transaction Data, IEEE, Nov./Dec. 2009 (8 pages). |
Also Published As
| Publication number | Publication date |
|---|---|
| WO2015167497A1 (en) | 2015-11-05 |
| US20160371350A1 (en) | 2016-12-22 |
Similar Documents
| Publication | Publication Date | Title |
|---|---|---|
| US11195050B2 (en) | Machine learning to generate and evaluate visualizations | |
| US11269476B2 (en) | Concurrent display of search results from differing time-based search queries executed across event data | |
| US9437022B2 (en) | Time-based visualization of the number of events having various values for a field | |
| US8595151B2 (en) | Selecting sentiment attributes for visualization | |
| US10628775B2 (en) | Sankey diagram graphical user interface customization | |
| US9134215B1 (en) | Sentiment analysis of content items | |
| US9836551B2 (en) | GUI for viewing and manipulating connected tag clouds | |
| US20110246921A1 (en) | Visualizing sentiment of online content | |
| US10866692B2 (en) | Methods and apparatus for creating overlays according to trending information | |
| US20160117373A1 (en) | Data Segmentation and Visualization | |
| KR101773574B1 (en) | Method for chart visualizing of data table | |
| US20130046756A1 (en) | Visualizing Sentiment Results with Visual Indicators Representing User Sentiment and Level of Uncertainty | |
| US20170206268A1 (en) | Visualization of graphical representations of log files | |
| US11461430B1 (en) | Systems and methods for diagnosing quality issues in websites | |
| US20170351752A1 (en) | Systems and methods for identifying and classifying text | |
| US20130194272A1 (en) | Placing pixels according to attribute values in positions in a graphical visualization that correspond to geographic locations | |
| US20150046862A1 (en) | Modifying binning operations | |
| US10373058B1 (en) | Unstructured database analytics processing | |
| US9792377B2 (en) | Sentiment trent visualization relating to an event occuring in a particular geographic region | |
| US20110199380A1 (en) | Visualizing correlations in multi-dimensional data | |
| CN107866072B (en) | A system for plug-in detection using incremental decision tree | |
| US10614094B2 (en) | Visualizing topics with bubbles including pixels | |
| WO2015106214A2 (en) | Visually approximating parallel coordinates data | |
| US11194873B1 (en) | Grid-based ranking of location data | |
| US20170185696A1 (en) | Aggregating data for visualization |
Legal Events
| Date | Code | Title | Description |
|---|---|---|---|
| AS | Assignment | Owner name:HEWLETT-PACKARD DEVELOPMENT COMPANY, L.P., TEXAS Free format text:ASSIGNMENT OF ASSIGNORS INTEREST;ASSIGNORS:HAO, MING C.;HUND, MICHAEL;ROHRDANTZ, CHRISTIAN;AND OTHERS;SIGNING DATES FROM 20140424 TO 20140512;REEL/FRAME:039260/0370 | |
| AS | Assignment | Owner name:HEWLETT PACKARD ENTERPRISE DEVELOPMENT LP, TEXAS Free format text:ASSIGNMENT OF ASSIGNORS INTEREST;ASSIGNOR:HEWLETT-PACKARD DEVELOPMENT COMPANY, L.P.;REEL/FRAME:039797/0001 Effective date:20151027 | |
| AS | Assignment | Owner name:ENTIT SOFTWARE LLC, CALIFORNIA Free format text:ASSIGNMENT OF ASSIGNORS INTEREST;ASSIGNOR:HEWLETT PACKARD ENTERPRISE DEVELOPMENT LP;REEL/FRAME:042746/0130 Effective date:20170405 | |
| AS | Assignment | Owner name:JPMORGAN CHASE BANK, N.A., DELAWARE Free format text:SECURITY INTEREST;ASSIGNORS:ATTACHMATE CORPORATION;BORLAND SOFTWARE CORPORATION;NETIQ CORPORATION;AND OTHERS;REEL/FRAME:044183/0718 Effective date:20170901 Owner name:JPMORGAN CHASE BANK, N.A., DELAWARE Free format text:SECURITY INTEREST;ASSIGNORS:ENTIT SOFTWARE LLC;ARCSIGHT, LLC;REEL/FRAME:044183/0577 Effective date:20170901 | |
| STPP | Information on status: patent application and granting procedure in general | Free format text:RESPONSE TO NON-FINAL OFFICE ACTION ENTERED AND FORWARDED TO EXAMINER | |
| STPP | Information on status: patent application and granting procedure in general | Free format text:FINAL REJECTION MAILED | |
| AS | Assignment | Owner name:MICRO FOCUS LLC, CALIFORNIA Free format text:CHANGE OF NAME;ASSIGNOR:ENTIT SOFTWARE LLC;REEL/FRAME:050004/0001 Effective date:20190523 | |
| STPP | Information on status: patent application and granting procedure in general | Free format text:DOCKETED NEW CASE - READY FOR EXAMINATION | |
| STPP | Information on status: patent application and granting procedure in general | Free format text:NOTICE OF ALLOWANCE MAILED -- APPLICATION RECEIVED IN OFFICE OF PUBLICATIONS | |
| STPP | Information on status: patent application and granting procedure in general | Free format text:AWAITING TC RESP, ISSUE FEE PAYMENT RECEIVED | |
| STCF | Information on status: patent grant | Free format text:PATENTED CASE | |
| AS | Assignment | Owner name:MICRO FOCUS LLC (F/K/A ENTIT SOFTWARE LLC), CALIFORNIA Free format text:RELEASE OF SECURITY INTEREST REEL/FRAME 044183/0577;ASSIGNOR:JPMORGAN CHASE BANK, N.A.;REEL/FRAME:063560/0001 Effective date:20230131 Owner name:NETIQ CORPORATION, WASHINGTON Free format text:RELEASE OF SECURITY INTEREST REEL/FRAME 044183/0718;ASSIGNOR:JPMORGAN CHASE BANK, N.A.;REEL/FRAME:062746/0399 Effective date:20230131 Owner name:MICRO FOCUS SOFTWARE INC. (F/K/A NOVELL, INC.), WASHINGTON Free format text:RELEASE OF SECURITY INTEREST REEL/FRAME 044183/0718;ASSIGNOR:JPMORGAN CHASE BANK, N.A.;REEL/FRAME:062746/0399 Effective date:20230131 Owner name:ATTACHMATE CORPORATION, WASHINGTON Free format text:RELEASE OF SECURITY INTEREST REEL/FRAME 044183/0718;ASSIGNOR:JPMORGAN CHASE BANK, N.A.;REEL/FRAME:062746/0399 Effective date:20230131 Owner name:SERENA SOFTWARE, INC, CALIFORNIA Free format text:RELEASE OF SECURITY INTEREST REEL/FRAME 044183/0718;ASSIGNOR:JPMORGAN CHASE BANK, N.A.;REEL/FRAME:062746/0399 Effective date:20230131 Owner name:MICRO FOCUS (US), INC., MARYLAND Free format text:RELEASE OF SECURITY INTEREST REEL/FRAME 044183/0718;ASSIGNOR:JPMORGAN CHASE BANK, N.A.;REEL/FRAME:062746/0399 Effective date:20230131 Owner name:BORLAND SOFTWARE CORPORATION, MARYLAND Free format text:RELEASE OF SECURITY INTEREST REEL/FRAME 044183/0718;ASSIGNOR:JPMORGAN CHASE BANK, N.A.;REEL/FRAME:062746/0399 Effective date:20230131 Owner name:MICRO FOCUS LLC (F/K/A ENTIT SOFTWARE LLC), CALIFORNIA Free format text:RELEASE OF SECURITY INTEREST REEL/FRAME 044183/0718;ASSIGNOR:JPMORGAN CHASE BANK, N.A.;REEL/FRAME:062746/0399 Effective date:20230131 | |
| MAFP | Maintenance fee payment | Free format text:PAYMENT OF MAINTENANCE FEE, 4TH YEAR, LARGE ENTITY (ORIGINAL EVENT CODE: M1551); ENTITY STATUS OF PATENT OWNER: LARGE ENTITY Year of fee payment:4 |