US10482595B2 - System and method for calculating focus variation for a digital microscope - Google Patents
System and method for calculating focus variation for a digital microscopeDownload PDFInfo
- Publication number
- US10482595B2 US10482595B2US15/506,997US201515506997AUS10482595B2US 10482595 B2US10482595 B2US 10482595B2US 201515506997 AUS201515506997 AUS 201515506997AUS 10482595 B2US10482595 B2US 10482595B2
- Authority
- US
- United States
- Prior art keywords
- focus
- field
- image
- diagnostic
- indicative
- Prior art date
- Legal status (The legal status is an assumption and is not a legal conclusion. Google has not performed a legal analysis and makes no representation as to the accuracy of the status listed.)
- Active, expires
Links
Images


Classifications
- G—PHYSICS
- G06—COMPUTING OR CALCULATING; COUNTING
- G06T—IMAGE DATA PROCESSING OR GENERATION, IN GENERAL
- G06T7/00—Image analysis
- G06T7/0002—Inspection of images, e.g. flaw detection
- G06T7/0012—Biomedical image inspection
- G—PHYSICS
- G02—OPTICS
- G02B—OPTICAL ELEMENTS, SYSTEMS OR APPARATUS
- G02B21/00—Microscopes
- G02B21/24—Base structure
- G02B21/241—Devices for focusing
- G02B21/244—Devices for focusing using image analysis techniques
- G—PHYSICS
- G06—COMPUTING OR CALCULATING; COUNTING
- G06T—IMAGE DATA PROCESSING OR GENERATION, IN GENERAL
- G06T7/00—Image analysis
- G06T7/0002—Inspection of images, e.g. flaw detection
- G—PHYSICS
- G06—COMPUTING OR CALCULATING; COUNTING
- G06T—IMAGE DATA PROCESSING OR GENERATION, IN GENERAL
- G06T7/00—Image analysis
- G06T7/90—Determination of colour characteristics
- G—PHYSICS
- G06—COMPUTING OR CALCULATING; COUNTING
- G06T—IMAGE DATA PROCESSING OR GENERATION, IN GENERAL
- G06T2207/00—Indexing scheme for image analysis or image enhancement
- G06T2207/10—Image acquisition modality
- G06T2207/10056—Microscopic image
- G—PHYSICS
- G06—COMPUTING OR CALCULATING; COUNTING
- G06T—IMAGE DATA PROCESSING OR GENERATION, IN GENERAL
- G06T2207/00—Indexing scheme for image analysis or image enhancement
- G06T2207/10—Image acquisition modality
- G06T2207/10056—Microscopic image
- G06T2207/10061—Microscopic image from scanning electron microscope
- G—PHYSICS
- G06—COMPUTING OR CALCULATING; COUNTING
- G06T—IMAGE DATA PROCESSING OR GENERATION, IN GENERAL
- G06T2207/00—Indexing scheme for image analysis or image enhancement
- G06T2207/30—Subject of image; Context of image processing
- G06T2207/30004—Biomedical image processing
- G06T2207/30072—Microarray; Biochip, DNA array; Well plate
- G—PHYSICS
- G06—COMPUTING OR CALCULATING; COUNTING
- G06T—IMAGE DATA PROCESSING OR GENERATION, IN GENERAL
- G06T2207/00—Indexing scheme for image analysis or image enhancement
- G06T2207/30—Subject of image; Context of image processing
- G06T2207/30168—Image quality inspection
Definitions
- the presently disclosed subject matterrelates to the field of microscopy and more specifically to calculating focus variation for a digital microscope.
- a digital microscopy methodcomprising: obtaining, in a memory comprised in or operatively coupled to a digital microscope, data representative of at least one image of at least a portion of a cell sample, the at least one image acquired by the digital microscope, wherein the portion encompasses a mapping field, and the mapping field comprises a plurality of focus analysis regions; and calculating, by processing resources operatively connected to the digital microscope, using the obtained data, a focus configuration for each of at least two of the focus analysis regions within the mapping field, giving rise to data indicative of focus variation within the mapping field.
- a digital microscopecomprising: a memory configured to obtain data representative of at least one image of at least a portion of a cell sample, wherein the portion encompasses a mapping field, and the mapping field comprises a plurality of focus analysis regions; and one or more processing resources configured to calculate, using the obtained data, a focus configuration for each of at least two of the focus analysis regions within the mapping field, giving rise to data indicative of focus variations within the mapping field.
- a program storage devicereadable by a machine, tangibly embodying a program of instructions executable by the machine to perform method steps of: obtaining, in a memory comprised in or operatively coupled to a digital microscope, data representative of at least one image of at least a portion of a cell sample, the at least one image acquired by the digital microscope, wherein the portion encompasses a mapping field, and the mapping field comprises a plurality of focus analysis regions; and calculating, using the obtained data, a focus configuration for each of at least two of the focus analysis regions within the mapping field, giving rise to data indicative of focus variation within the mapping field.
- the obtained datacan be representative of a series of images, the images captured by performing a depth scan using the digital microscope, the series of images being associated with a respective series of depth levels of the cell sample.
- the calculatingcan include operating a statistical function on the obtained data.
- the calculatingcan include detecting at least one depth level corresponding to a drop in image contrast, wherein the detected depth level is such that image contrast at the detected depth level is lower than image contrast associated with a depth level immediately preceding the detected depth level in the series of depth levels and lower than image contrast associated with a depth level immediately following the detected depth level in the series of depth levels.
- the image contrastcan be calculated from any of the following contrast functions: variance, standard deviation, sum of absolute-value of derivatives.
- the mapping field and at least one diagnostic field within the samplecan be of substantially or precisely same size and shape. At least one of the diagnostic field and the mapping field can be the largest field that can be captured by the microscope at a magnification selected for analysis of the sample.
- At least one focus fieldcan cover an area of the cell sample that is smaller than the area covered by at least one diagnostic field and the area covered by the mapping field.
- At least one image of at least one diagnostic field within the cell samplecan be analyzed using the data indicative of focus variation.
- a confidence scorecan be calculated for each of the at least two focus analysis regions of the mapping field, the confidence score being indicative of an accuracy of a diagnostic analysis performed on the at least one image at a corresponding region.
- the at least one image of at least one diagnostic fieldcan be acquired at a specific focus configuration, and a plurality of regions within the at least one image can be correlated with at least two of the focus analysis regions of the mapping field, and the confidence scores can be utilized for the analyzing.
- the data indicative of focus variationscan be utilized for defining at least one of a size or a shape of one or more diagnostic fields within the cell sample.
- capturing at least one image of a given diagnostic field at a specific focus configurationanalyzing the at least one image to detect a pathogen candidate; correlating a plurality of regions within the at least one image with at least two of the focus analysis regions of the mapping field; and capturing at least one additional image of the pathogen candidate at an imaging focus configuration calculated using the focus configuration of at least one of the focus analysis region correlated with the position of the pathogen candidate in the diagnostic field.
- the capturing of at least one additional imagecan be performed only if the pathogen candidate is detected in a region of the diagnostic field that is correlated with a given focus analysis region of the mapping field associated with a focus configuration that differs from the specific focus configuration by at least a threshold value.
- the imaging focus configurationcan be the focus configuration of the at least one of the focus analysis region.
- capturing at least one image of a given diagnostic field at a specific focus configurationcorrelating a plurality of regions within the at least one image with at least two of the focus analysis regions of the mapping field; and selecting a portion of the diagnostic field for analysis such that the focus variation between the specific focus configuration and the focus configuration of the focus analysis regions within the portion is below a specific value.
- the present disclosurefurther provides a method of determining a reference depth level within a cell sample.
- the methodcomprises obtaining data representative of a series of images captured by performing a depth scan of the cell sample using a digital microscope, the series of images being associated with a series of depth levels of the cell sample; processing the data for detecting at least one depth level corresponding to a drop in image contrast; and identifying the detected depth level as the reference depth level.
- the detected depth levelis such that image contrast at the detected depth level is lower than image contrast associated with a depth level immediately preceding the detected depth level in the series of depth levels and lower than image contrast associated with a depth level immediately following the detected depth level in the series of depth levels.
- the methodfurther comprises calculating image contrast using a contrast function increasing with the image contrast and wherein detecting at least one depth level corresponding to a drop in image contrast comprises detecting a well in a contrast curve representing image contrast as a function of the depth level.
- the detected depth levelcorresponds to a bottom of the well in the contrast curve.
- the methodfurther comprises calculating image contrast using a contrast function decreasing with the image contrast and wherein detecting at least one depth level corresponding to a drop in image contrast comprises detecting a roof of a contrast curve representing image contrast as a function of the depth level.
- the detected depth levelcorresponds to a top of the roof of the contrast curve.
- a span of the series of depth levelsis of 5 to 1000 micrometers.
- a span of the series of depth levelsis less than 50 micrometers.
- focusing the microscope at an investigation levelfurther comprises shifting a focus plane of the digital microscope from the reference depth level by a specific value.
- the image contrast of an imageis calculated from any of the following contrast functions: variance, standard deviation, sum of absolute-value of derivatives.
- the term “well”is used to refer to a point or region of a curve where the curve passes from decreasing (curving down) to increasing (curving up). It is understood that the term well refers to a drop of contrast.
- contrast functionis such that a drop of contrast between two images generates a drop in the contrast function values (i.e. the contrast function is an increasing function of the image contrast).
- the contrast functionis a function decreasing with the contrast, a drop of contrast would generate an increase in the contrast function thereby turning a “well” into a “roof”. It will be appreciated that a decreasing function can be transformed into an increasing function of the contrast by multiplying the function by ⁇ 1.
- the present disclosurealso applies to decreasing function of the contrast. It will also be appreciated that another way of applying the teaching of the present invention to a decreasing function of the contrast would be to determine a “roof” instead of a well for a decreasing contrast function of the contrast (i.e. contrast functions so that a drop of contrast generates an increase in the contrast function values), wherein the roof refers to a point or region of the curve where the curve passes from increasing (curving up) to decreasing (curving down).
- the present disclosurerefers generally, without any limitation, to a well.
- bottom of the wellshould be understood as the minimum point within a well and that the term “top of a roof” should be understood as a maximum point within a roof.
- seriesrefers to an ordered set of values. In particular, the series of depth levels may be arranged in increasing or decreasing order.
- contrast functioni.e. functions for assessing a contrast and/or sharpness of an image.
- FIG. 1Ais a top view illustration of a sample carrier that may be used in connection with some embodiments of the presently disclosed subject matter;
- FIG. 1Bis an illustration of some cross section lateral views of sample carriers as having a top view as shown in FIG. 1A ;
- FIG. 2Ais a top view illustration of a sample chamber comprising diagnostic fields, focus fields and mapping fields, in accordance with some embodiments of the presently disclosed subject matter;
- FIG. 2Bis an illustration of some alternative shapes and distributions of focus analysis regions within a mapping field, in accordance with some embodiments of the presently disclosed subject matter;
- FIG. 3Ais an illustration of a three-dimensional view of raw data indicative of focus configurations calculated for focus analysis regions of a mapping field, in accordance with some embodiments of the presently disclosed subject matter;
- FIG. 3Bis an illustration of three-dimensional view of a flat plane matched to the raw data shown in FIG. 3A , in accordance with some embodiments of the presently disclosed subject matter;
- FIG. 4is a block diagram schematically illustrating one example of a system for calculating focus configurations for a digital microscope, in accordance with some embodiments of the presently disclosed subject matter;
- FIG. 5is a flowchart illustrating one example of a sequence of operations carried out for imaging and analyzing a biological cell sample, in accordance with some embodiments of the presently disclosed subject matter
- FIG. 6is an illustration of a mapping field including a quality confidence score, in accordance with some embodiments of the presently disclosed subject matter
- FIG. 7is a flowchart illustrating steps of a method of imaging a cell sample, in accordance with some embodiments of the presently disclosed subject matter
- FIG. 8illustrates an image variance calculation, in accordance with some embodiments of the presently disclosed subject matter
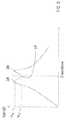
- FIG. 9illustrates an example for a focus curve obtained by depth scanning of a cell sample and computing of a focus function according to some embodiments of the present disclosure
- FIG. 10Ais an illustration of an image having a slant on the X axis, and an example of a division thereof to diagnostic fields;
- FIG. 10Bis an illustration of an image having a slant on both the X and Y axis, and an example of a division thereof to diagnostic fields;
- FIG. 11illustrates a non-limiting example of a mapping field having a plurality of focus analysis regions
- FIG. 12illustrates a non-limiting example of a correlation function
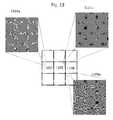
- FIG. 13illustrates a non-limiting example of variation in the appearance of objects in two or more focus analysis regions of a mapping field.
- a biological cell sample being analyzed through a microscopeis larger than the optical field of the microscope at the desired magnification. Therefore, in some cases, a plurality of images are acquired, each having a different position along an XY plane parallel to the focal plane of the microscope. Each of these images presents a so called “diagnostic field” within the biological sample.
- the images or parts thereofcan be analyzed in order to detect the presence of a pathogen suspected to be included in the cell sample and/or for characterizing the composition of a cell sample (for example in a complete blood cell count).
- the microscopeIn order for a captured image to be clear, the microscope needs to be focused on the cell sample.
- the focusingcan be performed by overlaying a focal plane of the microscope with an investigation plane of the sample being imaged. For example, one may focus the microscope by changing a distance between the sample carrier holding the biological cell sample and the microscope's lens and/or by adjusting properties of the lens or any other way known in the art.
- a focus configurationmeans a configuration of the microscope characterized by the relative positions of the microscope focal plane and an investigation plane in the cell sample.
- the focus configurationcan be defined by the distance between these relative positions.
- the focus configuration for any given focus analysis regioncan be a value related to a distance between the investigative plane of the given focus analysis region and the investigative plane of another focus analysis region, such as a prior analyzed focus analysis region.
- a focus configuration of a microscopemay be manipulated for example by changing one or more of (a) a distance between the microscope objective lens and the cell sample; and (b) one or more properties of the microscope lens. It is to be noted that the focus configuration can be manipulated in other ways, including ways that are known in the art, to control the position of a microscope's focal plane relative to a cell sample investigation plane.
- a focus configurationmay be selected by analyzing data representative of a series of overlapping images of a cell sample or a portion thereof, captured by performing a depth scan using a digital microscope, the series of images being associated with a series of depth levels of the cell sample. Analyzing may include by applying a focus function to the data to select a focus configuration, as further detailed herein.
- the selected focus configurationmay be indicative of an imaging focus configuration, namely a focus configuration at which to capture at least one image of the sample for analysis.
- Selecting an imaging focus configurationmay be considered as focusing. Selecting an imaging focus configuration may include selecting a reference focus configuration and calculating an imaging focus configuration therefrom (e.g. by adding or subtracting a fixed value or a percentage), as further detailed herein.
- the investigation plane in the sample carrieris not necessarily perfectly parallel to the microscope's focal plane.
- the focal planeis not necessarily perfectly flat at a given magnification. Accordingly, the focus configuration applicable for one location (e.g. a Cartesian (X,Y) position) in a sample may differ from the focus configuration applicable for another location in the same sample.
- FIG. 1Ashows a top view illustration of a sample carrier, that may be used in connection with some embodiments of the presently disclosed subject matter
- FIG. 1Bshows an illustration of some cross section lateral views of sample carriers having a top view as shown in FIG. 1A .
- the lateral cross sectionsmay be for example taken along a line A-A as shown in FIG. 1A .
- Sample carrier 100can comprise one or more chambers, each configured to accommodate a cell sample.
- chambers 101 - 110ten chambers are depicted, namely chambers 101 - 110 , however this is merely a non-limiting example and any other number and configuration of chambers is also contemplated.
- sample carriercan be any carrier known in the art for holding a biological cell sample. Examples include carrier slides, laboratory receptacles, dishes, plates, multi-well plates, test tubes (e.g. with a flat bottom), microfluidic cells and cartridges and the like, provided that it has at least one transparent side allowing imaging.
- the chambers 201 - 205are all flat, which enable positioning thereof parallel to a surface on which the sample carrier 200 is to be placed and/or parallel to the microscope's focal plane.
- the chambers in the bent sample carriers 220 and 240have different angles (i.e. they are not parallel) with respect to a surface holding the sample holder 220 or 240 and/or with respect to the microscope's focal plane.
- chamber 243may be essentially parallel to such surface and/or to such focal plane
- chamber 244would have an angle with respect to the surface and/or to the focal plane
- chamber 245would have an even sharper angle with respect to the surface and/or to the focal plane.
- the bends in the illustrationare drawn very prominently for illustrative purposes. In reality, the angles of all or part of the chambers with respect to the surface holding the corresponding sample carrier and/or with respect to the microscope's focal plane, can sometimes be difficult or even impossible to detect by the naked eye but might still have a significant effect on focus under microscope magnification.
- the bends shown in the illustrationare on the longitudinal axis, this is of course not limiting, and the bends can additionally or alternatively be on the latitudinal axis.
- the internal bottom surface of the carriermay have a different contour than that of the external bottom surface, such that even if the carrier is positioned in parallel to the surface holding the corresponding sample carrier and/or with respect to the microscope's focal plane, the cell sample within it may lie on a relatively bent surface, thereby having a bent investigation plane.
- any bending of the sample carriertolerance in the microscope's setup and/or fabrication can also result in (or contribute to) the investigation place in the sample carrier not being parallel to the microscope's focal plane.
- the microscope's focal planeitself might not be flat at a given magnification. Any one or any combination of two or more of the scenarios illustrated above, and/or any other reason that results in the investigation plane in the sample carrier not being parallel to the microscope's focal plane, optionally results in a difference between a focus configuration applicable for one location (e.g. a Cartesian (X,Y) position) in a cell sample and a focus configuration applicable for another location in the same cell sample or the same chamber or the same portion of a chamber or for a plurality of chambers, as further detailed herein.
- a focus configuration applicable for one locatione.g. a Cartesian (X,Y) position
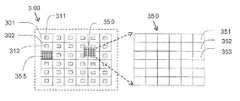
- FIG. 2Ashowing a top view illustration of a sample chamber comprising diagnostic fields, focus fields and mapping fields, in accordance with some embodiments of the presently disclosed subject matter.
- a given imagecovers precisely a given diagnostic field, focus field or mapping field.
- a given diagnostic field, focus fields or mapping fieldis defined as one or more portions of a specific image.
- several images or portions thereofare assembled to define a diagnostic field, focus field or mapping field.
- Sample chamber 300comprises a plurality of diagnostic fields (e.g. diagnostic fields 301 , 302 , etc.).
- a diagnostic fieldis an area covering a portion of the sample chamber 300 that comprises a cell sample to be imaged, and is imaged as a single image under at least one lighting configuration of the microscope, to be analyzed for various purposes, including diagnostics, detection of pathogens, blood count, and the like.
- a plurality of images of a single diagnostic fieldare taken for analysis, each image encompassing the entire diagnostic field.
- the sample chamber 300 shown in the illustrationcomprises a plurality of diagnostic fields (namely thirty six (36) diagnostic fields)
- the sample chambercan comprise a single diagnostic field, or any other number of diagnostic fields, in any configuration.
- the sample chamber, the diagnostic fields, the focus fields and the mapping fields in FIG. 2Aare depicted as rectangular shapes, any other shapes may be used, covering the entire surface of the chamber or only one or more portions thereof.
- a focus fieldis an area covering a portion of the sample chamber 300 used for calculating a focus configuration to be used for acquiring images of at least one diagnostic field, as further detailed herein. It is to be noted that although the focus fields (e.g. focus fields 311 , 312 ) are shown as a portion of the diagnostic fields, in some cases the focus field can be identical to the diagnostic field. In addition, although the focus fields (e.g. focus fields 311 , 312 ) are shown as a portion of the diagnostic fields, in some cases the focus field can be identical to the diagnostic field. In addition, although the focus fields (e.g.
- focus fields 311 , 312are shown as fully overlapping the diagnostic field, in some cases the focus field can overlap the diagnostic field only partially, and in other cases it is possible that no such overlap will exist. Still further, although in the illustrated example each diagnostic field has a corresponding focus field therein (focus field 311 for diagnostic field 301 , focus field 312 for diagnostic field 302 ), in some cases fewer or more focus fields can exist. Moreover, a single focus field can overlap, or partially overlap, more than one diagnostic field. In addition, as indicated herein, a given focus field can be used to calculate a focus configuration to be used for acquiring images of more than one diagnostic field, including for one or more diagnostic fields that do not overlap the given focus field at all.
- mapping fields 350 and 355are examples for mapping fields 350 and 355 .
- a mapping fieldis an area covering a portion of the sample chamber 300 used for obtaining data indicative of focus variation within at least a portion of the sample holder (e.g. within the portion covered by the mapping field), as further detailed herein. Such data can further be used for extrapolating additional data indicative of focus variations in portions external to the mapping field, as further detailed herein.
- mapping field 355is shown as identical or essentially identical to the diagnostic field shown immediately below diagnostic field 302 , whereas mapping field 350 is shown to partially overlap four (4) diagnostic fields. It is to be noted however that the mapping fields are not necessarily of the same shape and/or size of the diagnostic field and that they do not necessarily overlap any given diagnostic field. However, in some cases they can be of the same shape and/or size as of the diagnostic field, or substantially of the same shape and/or size of the diagnostic field.
- at least one diagnostic fieldis used also as a mapping field. It is to be noted that in some cases, at least one diagnostic field and at least one mapping field are the largest fields (i.e. imaged areas) acquired by the microscope at a magnification selected for analysis of the cell sample.
- Each mapping fieldcomprises a plurality of focus analysis regions.
- mapping field 350For illustration purposes, looking at the right hand side of the FIG. 2A , there is shown an enlarged view of mapping field 350 , comprising a plurality of focus analysis regions (e.g. focus analysis region 351 , 352 , 353 , etc.).
- a focus analysis regionis an area covering a portion of the mapping field for which a corresponding focus configuration is calculated, as further detailed herein.
- At least one focus fieldcovers an area of the cell sample that is smaller than the area covered by at least one diagnostic field and at least one mapping field.
- FIG. 2Bshows an illustration of some alternative shapes and distributions of focus analysis regions within a mapping field, in accordance with some embodiments of the presently disclosed subject matter.
- mapping fields 360 , 370 and 380are depicted as rectangles.
- Mapping field 360is split to a three by three (3 ⁇ 3) grid or matrix of rectangle shaped focus analysis regions a-i.
- the focus analysis regionsmay have any shape, and any number of focus analysis regions may be included in any mapping field.
- a mapping fieldcan comprise a single focus analysis region, and in some cases (not limiting) such single focus analysis region can overlap the mapping field.
- the focus analysis regionsneed not cover the entire mapping field (as shown, for example, in mapping fields 370 and 380 ) they may do so (as shown for example in mapping field 360 ).
- some or all of the focus analysis regionsmay partially overlap one or more other focus analysis regions.
- there may also be a direct relation between the number of focus analysis regions and the background noise, and the time needed for analysis of focus variation of a mapping fieldmay increase in proportion to the number of focus analysis regions.
- the number of focus analysis ranges within a given mapping fieldmay range between 2 to 1000 focus analysis regions. In more specific cases, the number of focus analysis ranges within a given mapping field may range between 9 to 120 focus analysis regions.
- FIG. 3Ais an illustration of a three-dimensional view of raw data indicative of focus configurations calculated for focus analysis regions of a mapping field, in accordance with some embodiments of the presently disclosed subject matter.
- mapping fielddata representative of a series of images of a mapping field spanning 500 ⁇ m by 700 ⁇ m of the surface of a sample carrier was analyzed.
- the datarepresented images that were captured by performing a depth scan (as detailed inter alia with respect to FIG. 5 ) of the mapping field using a digital microscope.
- the mapping fieldwas divided into 35 identical rectangular focus analysis regions.
- the XY planeis a plane parallel to the focal plane of the microscope.
- an unbent diagnostic fieldshould have a focus variation map that is perfectly parallel to the XY plane.
- the focus configurationis depicted as a function of the distance between the microscope objective and the investigation plane in the sample.
- the focus configuration at the field having the most extreme focus configurationwas set at 0 and all other fields are shown relative thereto.
- focus configurations calculated for the focus analysis regions in the shown mapping fieldvaried along the z axis by up to 2.5 ⁇ m.
- the three dimensional viewis provided for illustrative purposes only and it is based on the actual raw data that is the focus configuration calculated for each corresponding focus analysis region. It is to be noted that the focus configuration can be actually represented by a single calculated number, e.g. a number indicative of a relative position of the microscope focal plane and an investigation plane in the cell sample.
- FIG. 3Bshows an illustration of a three-dimensional view of a flat plane matched to the raw data shown in FIG. 3A , in accordance with some embodiments of the presently disclosed subject matter.
- the noisemay be reduced, but some information regarding optic distortion can be lost.
- the optic distortion of brightfieldmay be ignored.
- FIG. 4is a block diagram schematically illustrating one example of a system for calculating focus configurations for a digital microscope, in accordance with some embodiments of the presently disclosed subject matter.
- all or parts of the system 400can be comprised within a digital microscope, or be otherwise operatively connected to a digital microscope.
- System 400can comprise one or more processing resources 410 .
- the one or more processing resources 410can be a processing unit, a microprocessor, a microcontroller or any other computing device or module, including multiple and/or parallel and/or distributed processing units, which are adapted to independently or cooperatively process data for controlling relevant system 400 resources and for enabling operations related to system 400 resources.
- system 400can comprise (or be otherwise associated with) a data repository 420 , configured to store data, including inter alia, data relating to focus configurations, images acquired by the microscope, etc.
- Data repository 420can be any volatile and/or non-volatile memory, including, for example, magnetic media such as a hard disk drive (HDD), Solid-State Drives (SSD), FLASH memory or FLASH drives, Electrically Erasable Programmable Read-Only Memory (EEPROM), battery backed DRAM or SRAM, Random-access memory (RAM), etc.
- HDDhard disk drive
- SSDSolid-State Drives
- FLASH memory or FLASH drivesFLASH drives
- EEPROMElectrically Erasable Programmable Read-Only Memory
- RAMRandom-access memory
- the processing resources 410can include (or be otherwise associated with) one or more of the following modules: image acquisition module 430 , focus calculation module 440 and analysis module 450 .
- image acquisition module 430can be configured to control the digital microscope for acquiring images of the cell sample and/or parts thereof, as further detailed herein.
- focus calculation module 440can be configured to calculate focus configurations to be used for acquiring images of the cell sample or parts thereof by the digital microscope, as further detailed herein.
- analysis module 450can be configured to analyze the images acquired by the digital microscope, as further detailed herein.
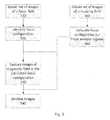
- FIG. 5showing a flowchart illustrating one example of a sequence of operations carried out for imaging and analyzing a biological cell sample, in accordance with some embodiments of the presently disclosed subject matter.
- system 400can be configured to obtain data representative of a series of images (also referred to as a set of images) of a focus field within a sample chamber of a sample holder placed on a digital microscope stage, the images captured by focusing the digital microscope at a corresponding series of depths levels along the optical axis (e.g. the Z axis) of the microscope (block 510 ).
- a focus fieldis an area covering a portion of the sample chamber 300 used for calculating a focus configuration to be used for acquiring images of at least one diagnostic field.
- the process of capturing the images by focusing a digital microscope at a corresponding series of depths levels along the optical axis of the microscopeis also referred to as in-depth scanning.
- the in-depth scanningcan be performed, for example, by varying a distance between a focus plane of the microscope and a sample holder intended to accommodate a cell sample by methods well known in the art.
- obtaining the set of imagescan be carried out using an image sensor unit of the microscope connected with the processing resources 410 of the system 400 .
- in-depth scanningmay be performed with brightfield illumination.
- the term “obtain data representative of a series of images”encompasses one or both of actual capturing of images by imaging of a portion of a cell sample to acquire the set of images (in-depth scanning) and respective data (e.g. utilizing the image acquisition module 430 ), and also loading/downloading from a computer storage media (e.g. data repository 420 ) a set of images of the field preliminarily acquired by a digital microscope and/or the data relating to the set.
- the portion of the cell sample which is imagedis a field within the sample (e.g. a focus field, mapping field, diagnostic field, etc.).
- the imaged fieldcan be captured in whole or in parts.
- one or more images covering one focus analysis region within a mapping fieldmay be captured separately from one or more images covering another focus analysis region within the same mapping field, for example by performing a plurality of depth scans, each for a different portion of the sample.
- the term depth levelmay be understood as a coordinate value along the optical axis of the microscope corresponding to a position that is optionally inside the cell sample or the sample holder/chamber.
- the actual direction of the axis and the origin of the axis to quantify depthmay be arbitrarily chosen.
- the imagesmay be obtained in any order, and may have an equal distance along the axis between pairs of consequent images or at a varying distance i.e. the in-depth scanning may be performed with a fixed step or with a variable step.
- the origin of the axismay be positioned at an outer surface of the cell sample facing an objective of the microscope and the direction of the coordinate axis may be chosen so that the coordinates increase when progressing toward the cell sample.
- the series of depth levelsmay be understood as an ordered set along the axis, it is possible to define endpoint depth levels (hereinafter referred to as endpoints) of the series of depth levels.
- the term scanning depth intervalrefers to a series of depth levels between two endpoints' depth levels.
- One endpoint level of a series of depth levelsfor example a minimum depth level of the set, may be referred to as a first scanning depth level and the other endpoint of the set, for example the maximum depth level, may be referred to as a second scanning depth level.
- the scanning depth intervalrefers to the depth levels comprised between the first and second scanning depth levels.
- an estimated reference depth levelmay be preliminarily provided.
- the cell samplemay comprise a plurality of diagnostic fields to be investigated and reference depth levels determined for one or more previous diagnostic fields may be used to estimate the estimated reference level for a subsequent diagnostic field.
- the scanning depth intervalmay be selected so as to cover the estimated depth reference level i.e. distances between the estimated depth reference level and the first and second scanning depth levels may be above a specific threshold.
- a span of the depth scanning intervalmay be of around 5 micrometers to 1000 micrometers.
- the span of the depth scanning intervalmay be between 150 and 250 micrometers, or less than 50 micrometers or even between 10 and 30 micrometers.
- the estimated depth levelis approximately in the midpoint of the span of the depth scanning interval.
- the series of images and associated depth levelsare utilized for calculating a focus configuration to be used for imaging one or more diagnostic fields (block 520 ).
- the focus configurationcan be calculated by operating any desired focus function on the series of images and their respective associated depth levels, e.g. utilizing the focus calculation module 440 .
- focus functionsare disclosed in: Groen, Frans C A, Ian T. Young, and Guido Ligthart. “A comparison of different focus functions for use in autofocus algorithms.” Cytometry 6.2 (1985): 81-91.
- An additional exampleis provided herein, with reference to FIGS. 7-9 and to US Provisional Application No. U.S. 61/826,718, filed May 23, 2013, which is incorporated herein by reference.
- the focus functioncan be a statistical function.
- the size of the focus fieldcan range between 1 to 50 percent of the size of the diagnostic field. In more specific cases, the size of the focus field can range between 1 to 25 percent of the size of the diagnostic field. In even more specific cases, the size of the focus field can range between 1 to 10 percent of the size of the diagnostic field. In even more specific cases, the size of the focus field can range between 1 to 5 percent of the size of the diagnostic field. In even more specific cases, the size of the focus field can range between 1 to 3 percent of the size of the diagnostic field.
- the focus fieldcan at least partially overlap one or more diagnostic fields that are to be acquired using the configuration calculated using the focus field. It is to be noted that using a focus configuration that is calculated using a focus field that at least partially overlaps a given diagnostic field in order to image the given diagnostic field, can yield better analysis accuracy compared to using a focus configuration that is calculated using a focus field that does not overlap the given diagnostic field.
- a focus configurationis calculated to one or more diagnostic fields using a focus field that is comprised within a corresponding diagnostic field. It is to be noted that in some cases, the focus field can be identical to one of the diagnostic fields (i.e. have the same size and shape and cover the same area of the cell sample).
- system 400can be configured to capture at least one image, of one or more diagnostic fields, at the focus configuration calculated for the corresponding focus fields or at an imaging focus configuration that is calculated therefrom (e.g. by adding or subtracting a fixed value or a percentage from the focus configuration calculated for the corresponding focus fields) (block 530 ), e.g. utilizing the image acquisition module 430 .
- system 400can be further configured to analyze the images of the diagnostic fields (block 540 ), e.g. utilizing the analysis module 450 .
- system 400e.g. utilizing the image acquisition module 430
- system 400can be configured to obtain data representative of a series of images (also referred to as a set of images) of at least a portion of a cell sample, the portion encompassing one or more mapping fields within a sample chamber of a sample holder placed on a digital microscope stage (block 550 ).
- the imagesare captured by focusing the digital microscope at a corresponding series of depths levels along the optical axis (e.g. the Z axis) of the microscope.
- the process of obtaining the data representative of a series of imagesis similar to the process described above with respect to block 510 , with the exception of the imaged portion described with respect to block 510 being a focus field whereas the imaged portion described with respect to block 550 being a mapping field.
- the mapping fieldis not imaged as a whole but rather different portions thereof are imaged separately, each at a plurality of different depth levels (for example one or more focus analysis regions may be imaged separately from one or more other focus analysis regions). This may provide the depth scan spanning a mapping field, even if one scan comprises images taken at different depth levels than another scan.
- a plurality of depth scansmay be performed for different sub-portions of the sample within a single mapping field, for example, each depth scan may relate to one or more focus analysis regions.
- a mapping fieldis an area covering a portion of the sample chamber 300 used for obtaining data indicative of focus variations within at least a portion of the sample chamber (e.g. within the portion covered by the mapping field).
- each mapping fieldcomprises a plurality of focus analysis regions.
- a focus analysis regionis an area covering a portion of the mapping field for which a corresponding focus configuration is calculated.
- the series of images and associated depth levelsare utilized for calculating a focus configuration for at least two focus analysis regions within the mapping fields, giving rise to data indicative of focus variations within the mapping fields (block 560 ). It is to be noted that any distribution of the focus analysis regions within the mapping fields as disclosed with respect to FIG. 2B is contemplated.
- the focus configurationcan be calculated by operating any desired focus function on the series of images and their respective associated depth levels, e.g. utilizing the focus calculation module 440 .
- the non-limiting examples provided with respect to block 520are applicable also for this purpose.
- a single image of a mapping field, or a portion thereof encompassing at least two focus analysis regionscan be used to calculate the focus configuration.
- the systemcan obtain data representative of an image of a portion of the cell sample comprising a mapping field having a plurality of focus analysis regions, and can compare the appearance of objects depicted in at least two focus analysis regions in the mapping field.
- Certain variations in the appearance of objects of a given type in different focus analysis regionscan sometimes be attributed to differences in the respective objects' positions along the z-axis relative to the focal plane of the microscope.
- cellse.g.
- red blood cells depicted in the image which lie at different heights relative to the focal plane of microscopecan exhibit variances in appearance such as width, sharpness of contour lines, color, intensity, etc. These variations in appearance can be analyzed and used to calculate focus configurations for the different focus analysis regions of the mapping field, thereby giving rise to data indicative of focus variation within the mapping field, as will be detailed below with reference to FIG. 11 .
- “obtain data representative of an image”encompasses one or both of actual capturing of the image by imaging of a portion of a cell sample to acquire the image and respective data (e.g. utilizing the image acquisition module 430 ), and also loading/downloading the image from a computer storage media (e.g. data repository 420 ), such as an image preliminarily acquired by a digital microscope, and/or the data relating thereto.
- a computer storage mediae.g. data repository 420
- the systemcan use variations in intensity or in intensity related data between images spanning at different focus analysis regions to calculate, estimate or otherwise obtain information relating to a focus configuration by:
- FIG. 11illustrates a non-limiting example of a mapping field 1100 having focus analysis regions 1101 - 1109 .
- FIG. 12illustrates a non-limiting example of a correlation function, in which each of focus analysis regions 1101 - 1109 is mapped to a scanning depth level Z n indicative of a focus configuration.
- the correlation functionhas a plurality of focus configurations that correspond to one calculated value, one or more of the following may apply:
- the direction of the variationmay be immaterial, and for example two symmetric results may thus be treated the same way. This is especially true when the variation value is high enough to reject the sample carrier, but also when the degree of variation (angle of the carrier internal bottom surface) is of more interest than a direction thereof; or
- data from the imagemay be used in order to define a direction of the variation (e.g. Z 1 v. Z 5 ) and/or select between a plurality of values having the same direction (not shown in the example).
- a direction of the variatione.g. Z 1 v. Z 5
- select between a plurality of values having the same directionnot shown in the example.
- a degree of variationmay be estimated in correlation to a distance from a defined point.
- the shape of the curvemay be followed (and/or extrapolated and/or interpolated) through a plurality of fields.
- FIG. 13shows images 1102 a , 1105 a and 1108 a of red blood cells, the images captured within focus analysis regions 1102 , 1105 and 1108 , respectively.
- the cellsappear to be almost transparent, indicative of the cells being located at a depth of or near Z 3 .
- the cellsappear to be bordered by ring shapes.
- the cells in image 1102 aappear to have a dark circumferential border with a white outer ring
- cells in image 1108 aappear to have a white circumferential border with a dark outer ring.
- the appearance and colors of the ring shapesare indicative of a direction of the variation as well as the degree of variation, and can be used to define the focus configuration more precisely.
- the data indicative of focus variations within at least a portion of the sample chamberpertains to a mapping of the investigation plane of the cell sample with respect to the focal plane of the microscope.
- This datamay be depicted and/or represented in any form that enables determination of differences between the focus configuration applicable to one focus analysis region with respect to the other focus analysis regions.
- mapping fieldsany distribution of the mapping fields as disclosed with respect to FIG. 2A is contemplated. It is to be further noted, when assuming the size of the focus analysis regions is constant, that the larger the area covered by the mapping fields is, the accuracy of the calculated focus configurations may be enhanced (which can have a positive effect inter alia on the accuracy of the diagnostic field analysis and/or on the determination of the diagnostic fields distribution within the cell sample). It can also be appreciated that the larger the area covered by the mapping fields is, the more time is required for calculating the focus configuration for the focus analysis regions. It is to be noted that in some non-limiting cases the mapping fields cover an area of up to fifty (50) percent of the diagnostic fields. Furthermore, in some non-limiting cases the mapping fields cover an area of up to ten (10) percent of the diagnostic fields. Still further, in some non-limiting cases the mapping fields cover an area of up to one (1) percent of the diagnostic fields.
- the data indicative of focus variations within a given mapping fieldcan be utilized in order to extrapolate information of focus variations in areas not covered by the mapping field, using various known methods and/or techniques.
- the data indicative of focus variations within a given mapping fieldcan be stored, e.g. in data repository 420 .
- the datacan be represented by absolute values (e.g. values indicative of a relative position of the microscope and the microscope's investigation plane) or relative values (e.g. a difference between the focus configuration at a given location and a given reference focus configuration).
- the data indicative of focus variations within a given mapping fieldcan be represented by a mathematical formulae or any type of map that can enable determination of a focus configuration at a given location within the sample carrier.
- the data indicative of focus variationscan be used to interpolate and/or extrapolate additional data indicative of focus variations, also in areas not covered by any mapping field.
- the system 400can be configured to provide an error notification upon detection of any calculated focus configuration exceeding a given threshold.
- Exceeding such given thresholdcan indicate, for example, a problem associated with either one (or a combination of more than one) of the following: the microscope, the sample carrier, the positioning of the sample carrier within the microscope stage, or the cell sample.
- the data indicative of focus variations within one or more mapping fieldsmay be used, as further detailed herein, in one or more of: (a) controlling the capturing of the at least one image of one or more diagnostic fields detailed with respect to block 530 ; and (b) analyzing the images of the one or more diagnostic fields.
- system 400can be configured to capture a plurality of images of each diagnostic field for analysis/diagnosis thereof.
- imagescan be captured using the focus configuration calculated using one or more mapping fields, as detailed herein.
- the number of images captured for each diagnostic fieldcan be determined while taking into account the degree of focus variation within the diagnostic field.
- the degree of focus variationcan be determined based on the focus configuration calculated for the focus analysis regions of one or more mapping fields (e.g. one or more mapping fields that cover the area that is closest to, or overlap, the area covered by the diagnostic field). For example, if the degree of focus variation (e.g. the difference between a focus configuration of a first focus analysis region and the focus configuration of a second focus analysis region) does not exceed a given threshold, only a single image of the diagnostic field can be acquired, while in other cases, two or more images of the diagnostic field may be acquired using different focus configurations. It is to be noted that while this may increase the time needed for acquiring the images and analyzing them, it may improve the accuracy of the diagnosis and may thus be preferred for some applications.
- the system 400can be configured to calculate a focus confidence score for at least two focus analysis regions (and in some cases for each focus analysis region) and/or a function that can provide such focus confidence score (e.g. given an indication of a certain focus analysis region).
- the focus confidence scorecan be indicative of a level of confidence in the focus configuration calculated for the corresponding focus analysis region.
- the focus confidence scorecan be represented by any scale (e.g. 0-1, 0-100, 1-10, or any other scale).
- the focus confidence scorecan be used as further detailed herein, in one or more of: (a) controlling the capturing the at least one image of one or more diagnostic fields detailed with respect to block 510 ; and (b) analyzing the images of the one or more diagnostic fields, as further detailed herein.
- the imagescan be analyzed using various computer vision and classification algorithms.
- such algorithmscan calculate a classification confidence score for the classifications calculated therewith.
- such algorithmscan calculate a classification confidence score, indicative of a level of confidence in the correctness of the calculated classification.
- a classification confidence scorecan be multiplied by the focus confidence score of the focus analysis region/s that is correlated with the corresponding areas of the diagnostic field (in some cases for that purpose the focus analysis regions are correlated with the corresponding areas of the diagnostic field using any method and/or technique). It is to be further noted that such multiplication can enable compensating for potential classification bias that may result from poor focus quality.
- a detection confidence mapmay provide for each grid area (or focus analysis region) a confidence score.
- the confidence scoremay be indicative of the quality or sharpness of a portion of a diagnostic image of a diagnostic field.
- a diagnostic imageis captured at an imaging focus configuration that may be selected according to a focusing step using a focus field as described herein.
- some grid areas (or focus analysis regions)may be out of focus to some extent (or have a lower image quality).
- the degree of this focus variationis correlated to the difference between a focus configuration that would have been used for imaging a specific grid area (taken alone) and the actual imaging focus configuration that was selected for imaging the diagnostic area encompassing the grid area.
- a confidence scorecan be a function of a distance between the imaging focus configuration selected for imaging the diagnostic field (based on a focus field for example) and the focus configuration that would have been applied if only the given grid area would have been imaged. Such distance can have an effect on the image quality and subsequently on the accuracy of a diagnostic analysis performed on the diagnostic image at a corresponding grid area (or focus analysis region).
- the confidence scoremay define a potential expected computer vision and classification algorithm (hereon, the algorithm) quality as a function of that area focus quality. This confidence score may be used by/integrated into the algorithm in several ways.
- the focus confidence scorecan be integrated into the algorithms in more complicated ways.
- One exampleis using the focus confidence score as a classifier of feature coordinates in the classification algorithms.
- focus analysis regions having a focus configuration that is too fare.g. according to a given threshold, that in some cases can be defined by the depth of focus (DOF)
- DOFdepth of focus
- focus regions that are at least 1 DOF above or below imaging focus configuration for a given fieldmay be ignored.
- DOFis known as the distance between the nearest and farthest objects in a scene that appear acceptably sharp in an image.
- DOFis mostly a property of the microscope's objective lens and the magnification, the latter being determined by the resolution of interest. For example, for an object being about 1 ⁇ m in dimensions (e.g. schizonts or some platelets), a resolution of at least 0.5 ⁇ m would normally be required; similarly, for an object of about 2 ⁇ m in dimension, a resolution of at least 1 ⁇ m would normally be required. This also determines the magnification, and a magnification of at least 20 ⁇ would be used for a resolution of about 0.5 ⁇ m, while a magnification of at least 10 ⁇ would be used for a resolution of about 1 ⁇ m.
- a lensis chosen to provide a desired magnification.
- a lensis characterized by a numerical aperture (NA).
- NAnumerical aperture
- a lens for 20 ⁇ magnificationmay have a numerical aperture (NA) of about 0.4-0.5
- a lens for 10 ⁇ magnificationmay have a significantly smaller NA of about 0.2-0.25.
- DOFrelates to NA for a given wavelength of light ( ⁇ ) and medium refraction index (Ri):
- NANumerical Aperture
- DOFDepth of Field
- a suspect pathogen candidatewhen identified (e.g. when diagnosing a blood cell sample for the presence of a pathogen or when counting white blood cells in a cell sample) within an area of the diagnostic field that correlates with one or more focus analysis regions (in some cases for that purpose the focus analysis regions are correlated with the corresponding areas of the diagnostic field using any method and/or technique) having a focus confidence score lower than a given threshold or having a corresponding focus configuration that differs from a specific focus configuration used for acquiring the image or images of the diagnostic field by at least a threshold value
- stricter scrutinycan be applied in analyzing the suspect candidate. For example, a new image or a set of images can be acquired at that location, at a calculated focus configuration having an improved focus confidence score (e.g. to confirm or negate the identification).
- the focus configuration datacan be used for selecting a portion of the diagnostic field for analysis, such that the focus variation between the specific focus configuration in which the image or images of the diagnostic field were acquired, and the focus configuration of the focus analysis regions within the portion, is below a specific threshold, e.g. 2-5 ⁇ m (non-limiting) or ⁇ 0.5-1 DOF.
- a specific thresholde.g. 2-5 ⁇ m (non-limiting) or ⁇ 0.5-1 DOF.
- the confidence scorecan be used for determining the size and/or shape of one or more diagnostic fields.
- an optical plane of a microscopeis parallel to the shown XY plane, with the z axis being the optical axis of the microscope.
- the diagnostic fieldscan be narrower strips of the image. If the slant is in the Y axis, the strips will be perpendicular to those of the X axis.
- the diagnostic fieldscan sometimes be defined as L shaped, as shown for diagnostic field 130 in FIG.
- FIG. 6shows an illustration of a mapping field including a quality confidence score, in accordance with some embodiments of the presently disclosed subject matter.
- each focus analysis regionhas a corresponding focus configuration, where in the illustrated example the focus configuration is relative, however, as indicated above, this is by no means limiting.
- each focus analysis regionhas a corresponding focus confidence score, having a value ranging from zero (e.g. for areas having a focus configuration that is less likely to be accurate) to one (e.g. for areas having a focus configuration that is most likely to be accurate). It is to be noted that the depicted illustration is by way of example only and is non-limiting.
- the imaging methodincludes in a first stage, a method of determining a reference depth level within a cell sample and, in a second stage, focusing a digital microscope at an investigation level derived from the depth reference level.
- the method of determining a reference depth levelmay be carried out by system 400 (e.g. utilizing focus calculation module 440 ).
- the system 400or parts thereof, may belong to an autofocus system of the microscope.
- the step of focusing the microscopemay be performed automatically upon command by the autofocus system.
- the cell samplemay comprise red blood cells and may optionally be a cell monolayer comprising red blood cells.
- a series of images(also referred to as a set of images) representative of light captured by focusing a digital microscope at a corresponding series of depths levels within the cell sample is obtained.
- obtaining the series of imagescomprises in-depth scanning of the cell sample with a digital microscope, for example by using an image sensor unit of the microscope connected with a computing module so as to provide the in-depth images (i.e. images captured during in-depth scanning) to the computing module.
- in-depth scanningmay be performed with brightfield illumination.
- the set (series) of imagesmay be understood as a series of slices of the cell sample corresponding to different positions along the Z axis (optical axis of the microscope). Each image may be associated with a depth level. Optionally one or more images are associated with depth levels within the cell sample that are above or below the cells in cell sample. Optionally one or more images are associated with depth levels that are above or below the cell sample.
- the set of imagesmay result from an in-depth scanning of the cell sample. Such in-depth scanning may for example be carried out by varying a distance between a focus plane of the microscope and a sample carrier intended to accommodate the cell sample by methods well known in the art.
- the term depth levelmay be understood as a coordinate value along the optical axis of the microscope corresponding to a position that is optionally inside the cell sample.
- the actual direction of the axis and the origin of the axis to quantify depthmay be arbitrarily chosen.
- the imagesmay be obtained in any order, and may have an equal distance along the axis between pairs of consequent images or at a varying distance i.e. the in-depth scanning may be performed with a fixed step or with a variable step.
- the origin of the axismay be positioned at an outer surface of the cell sample facing an objective of the microscope and the direction of the coordinate axis may be chosen so that the coordinates increase when progressing toward the cell sample.
- the series of depth levelsmay be understood as an ordered set along the axis, it is possible to define endpoint depth levels (hereinafter referred to as endpoints) of the series of depth levels.
- the term scanning depth intervalrefers to a series of depth levels between two endpoints' depth levels.
- One endpoint level of a series of depth levelsfor example a minimum depth level of the set, may be referred to as a first scanning depth levels and the other endpoint of the set, for example the maximum depth level, may be referred to as a second scanning depth level.
- the scanning depth intervalrefers to the depth levels comprised between the first and second scanning depth levels.
- an estimated reference depth levelmay be preliminarily provided.
- the cell samplemay comprise a plurality of fields to be investigated and reference depth levels determined for one or more previous fields may be used to estimate the estimated reference level for a subsequent field.
- the scanning depth intervalmay be selected so as to cover the estimated depth reference level i.e. distances between the estimated depth reference level and the first and second scanning depth levels may be above a specific threshold.
- a span of the depth scanning intervalmay be of around 5 micrometers to 1000 micrometers.
- the span of the depth scanning intervalmay be between 150 and 250 micrometers, or less than 50 micrometers or even between 10 and 30 micrometers.
- the estimated depth levelis approximately in the midpoint of the span of the depth scanning interval.
- the series of images and associated depth levelsare processed for detecting at least one depth level corresponding to a drop in image contrast and the detected depth level is identified to be the reference depth level.
- the detected depth levelmay be such that an image contrast at the detected depth level is lower than the image contrast at the depth level immediately preceding and following the reference depth level (i.e. adjacent depth levels) in the series of depth levels.
- the drop in image contrastmay be understood as a drop of image contrast over depth level (i.e. as a function of depth level). It is noted that when the contrast function used to calculate the image contrast is increasing with the contrast, 710 may be carried out by detecting a well of a contrast curve representing image contrast as a function of depth level.
- Image contrast of an imagemay be provided by applying a contrast function to the image.
- a wellis considered to be formed on the contrast curve when a contrast function value is inferior at least to the previous and subsequent adjacent contrast function values.
- some embodimentsare described in which the image contrast is provided by the calculation of variance. It is understood that other functions can be contemplated to determine the contrast of an image.
- the set of images associated with the series of depth levels within the cell sampleenables to analyze variations of an image parameter as a function of the depth level.
- image variancemay be computed for every image of the set of obtained images.
- FIG. 8illustrates image variance calculation on an example image I comprising n*p pixels (n, p integers) of pixel intensity I i,j wherein 1 ⁇ i ⁇ n and 1 ⁇ j ⁇ p.
- E(I)is the mean value of the pixel intensity I i,j over the example image.
- a variance related valuemay be computed for each image of the set of images. It is understood that the variance related value encompasses transformations of the image variance enabling to derive the image variance i.e. transformations equivalent to image variance calculation, for example standard deviation.
- implementation of the present disclosuredoes not require generation of the actual curve representing the variation of the contrast function over depth level but that a search for a well (or a roof if the contrast function is decreasing with the contrast) can be performed mathematically using the image representative data.
- the cell samplemay comprise predominantly red blood cells.
- the cell samplemay essentially be a monolayer of cells, wherein at least 80% of the cells or even at least 90% of the cells have direct contact with the surface on which the cell sample is held.
- the Applicantfound that the proposed method based on determining a reference depth level corresponding to a minimum of variance (contrast and/or sharpness) over the in-depth scanning, may be particularly advantageous.
- the proposed methodcan be performed using brightfield illumination and can provide appropriate results for further investigation using fluorescent illumination. This may lead to reducing focus time because performing focus on fluorescent images is typically slower than when using brightfield, since obtaining fluorescent images typically requires longer exposure periods. Further, obtaining fluorescent images for focusing purpose may be problematic because fluorescent imaging is known to degrade the fluorescent response of the sample due to photo-bleaching.
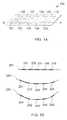
- FIG. 9illustrates a curve representing variations of image variance (image contrast) over scanning depth level.
- the curvenotably comprises a well 37 embraced between two maxima 38 , 39 (in this example a saddle point which is a local minimum, but not an absolute one).
- the depth level corresponding to the well 37provides an efficient reference level providing robust and consistent results across different microscope hardware including different forms of brightfield illumination and different forms of sample preparation (dry thin smears, wet smears and microfluidic preparation). Moreover, a focus position based on the well 37 position provides a baseline for epifluorescent imaging.
- imaging at the reference depth level or in its vicinitymay provide efficient parasite detection.
- the Applicantfurther found that the consistency of the focus generated by the proposed method of determining a minimum of the contrast function may be explained as follows: the maxima 38 , 39 surrounding the well 37 typically fall within 1 micrometer of each other. Consequently, the well 37 is steep thereby causing discernible shifts in the contrast function even for shifts of depth level of about a tenth of a micron. It is appreciated that having a consistent reference level within a cell sample enables to establish reliable automated diagnosis.
- the digital microscopemay be focused at an investigation level based on the determined reference level.
- the investigation levelmay be equal to the reference level.
- the investigation levelmay be shifted by a specific value with respect to the reference level. For example, this value may be in the range of 0.2-3 micrometers, or about 1-2 micrometers or about 1.5 micrometer.
- switching to an investigation level that is different than the reference depth valueenables to increase the contrast and/or sharpness of the image while preserving the consistency provided by the aforementioned method of determining a reference depth level.
- focusing the microscope at the investigation levelmay enable to investigate the cell sample.
- the investigationmay be carried out with fluorescent illumination and/or with brightfield illumination.
- the investigation levelwill provide a sharp image (or even the sharpest and/or highest contrast image).
- systemcan be implemented, at least partly, as a suitably programmed computer.
- the presently disclosed subject mattercontemplates a computer program being readable by a computer for executing the disclosed method.
- the presently disclosed subject matterfurther contemplates a machine-readable memory tangibly embodying a program of instructions executable by the machine for executing the disclosed method.
- non-transitoryis used herein to exclude transitory, propagating signals, but to otherwise include any volatile or non-volatile computer memory technology suitable to the application.
- the phrase “for example,” “such as”, “for instance” and variants thereofdescribe non-limiting embodiments of the presently disclosed subject matter.
- Reference in the specification to “one case”, “some cases”, “other cases” or variants thereofmeans that a particular feature, structure or characteristic described in connection with the embodiment(s) is included in at least one embodiment of the presently disclosed subject matter.
- the appearance of the phrase “one case”, “some cases”, “other cases” or variants thereofdoes not necessarily refer to the same embodiment(s).
- FIG. 4illustrates a general schematic of the system architecture in accordance with an embodiment of the presently disclosed subject matter.
- Each module in FIG. 4can be made up of any combination of software, hardware and/or firmware that performs the functions as defined and explained herein.
- the modules in FIG. 4may be centralized in one location or dispersed over more than one location.
- the systemmay comprise fewer, more, and/or different modules than those shown in FIG. 4 .
Landscapes
- Engineering & Computer Science (AREA)
- Physics & Mathematics (AREA)
- Computer Vision & Pattern Recognition (AREA)
- General Physics & Mathematics (AREA)
- Theoretical Computer Science (AREA)
- Quality & Reliability (AREA)
- Optics & Photonics (AREA)
- Analytical Chemistry (AREA)
- Chemical & Material Sciences (AREA)
- Health & Medical Sciences (AREA)
- General Health & Medical Sciences (AREA)
- Medical Informatics (AREA)
- Nuclear Medicine, Radiotherapy & Molecular Imaging (AREA)
- Radiology & Medical Imaging (AREA)
- Microscoopes, Condenser (AREA)
- Image Processing (AREA)
Abstract
Description
- 1. Obtaining a correlation function which provides known intensity related data, e.g. intensity statistics (e.g. variance) at each of several focus configurations. A correlation function can be obtained in any manner known in the art (e.g. in the form of a graph similar to
FIG. 9 or a mathematical equation representing the same correlation). Optionally, the correlation function can be obtained in advance and stored in a memory,e.g. data repository 420. Optionally, the correlation function can be generated on the fly by capturing or otherwise obtaining a series of depth scanned images of at least a portion of the mapping field, and calculating an intensity statistic for each image in the series of depth scanned images, essentially as detailed below with reference toFIG. 8 . Since certain intensity statistics (e.g. variance) may be affected by the number of cells appearing therein, the obtained correlation function is optionally normalized or otherwise corrected to a number or concentration of cells (for example the number of red blood cells). Optionally, the intensity statistic for each focus analysis region may be adjusted according to number or concentration of cells in that region and according to the cell count or concentration of cells in images based upon which the correlation function was produced. Additionally, certain intensity statistics (e.g. variance) may be affected by the surface area of the sample carrier captured in an image being analyzed. Thus, the obtained correlation function is optionally normalized or otherwise corrected to the surface area. Optionally, the intensity statistic for each focus analysis region may be adjusted according the surface area spanned by the region and according to the surface area of the sample carrier covered in images based upon which the correlation function was produced. - 2. Calculating, for each of the two or more focus analysis regions, intensity related data with respect to a reference intensity related data, e.g. as detailed below with reference to
FIG. 8 . Optionally, this calculation provides a relative value between the different focus analysis regions, without providing an absolute value for some or any of the focus analysis regions; and - 3. Estimating, for each of the two or more focus analysis regions, a focus configuration based on the correlation function and the calculated intensity related data of each respective focus analysis region, as detailed below with reference to
FIG. 8 . These values may be absolute (e.g. with respect to a given position and/or configuration of the imaging module and/or the sample carrier) and/or may be relative values relating to a degree of variation between the different focus analysis regions.
- 1. Obtaining a correlation function which provides known intensity related data, e.g. intensity statistics (e.g. variance) at each of several focus configurations. A correlation function can be obtained in any manner known in the art (e.g. in the form of a graph similar to
| Magnification | Numerical Aperture (NA) | Depth of Field (DOF) |
| 4x | 0.10 | 50 |
| 10x | 0.25 | 7.7 |
| 20x | 0.40 | 2.9 |
| 40x | 0.65 | 0.9 |
| 60x | 0.85 | 0.36 |
| 100x | 0.95 | 0.17 |
Var(I)=E[(Ii,j−E(I))2],
Claims (27)
Priority Applications (1)
| Application Number | Priority Date | Filing Date | Title |
|---|---|---|---|
| US15/506,997US10482595B2 (en) | 2014-08-27 | 2015-08-27 | System and method for calculating focus variation for a digital microscope |
Applications Claiming Priority (3)
| Application Number | Priority Date | Filing Date | Title |
|---|---|---|---|
| US201462042388P | 2014-08-27 | 2014-08-27 | |
| PCT/IL2015/050864WO2016030897A1 (en) | 2014-08-27 | 2015-08-27 | System and method for calculating focus variation for a digital microscope |
| US15/506,997US10482595B2 (en) | 2014-08-27 | 2015-08-27 | System and method for calculating focus variation for a digital microscope |
Related Parent Applications (1)
| Application Number | Title | Priority Date | Filing Date |
|---|---|---|---|
| PCT/IL2015/050864A-371-Of-InternationalWO2016030897A1 (en) | 2014-08-27 | 2015-08-27 | System and method for calculating focus variation for a digital microscope |
Related Child Applications (1)
| Application Number | Title | Priority Date | Filing Date |
|---|---|---|---|
| US16/592,335ContinuationUS11100637B2 (en) | 2014-08-27 | 2019-10-03 | System and method for calculating focus variation for a digital microscope |
Publications (2)
| Publication Number | Publication Date |
|---|---|
| US20190087953A1 US20190087953A1 (en) | 2019-03-21 |
| US10482595B2true US10482595B2 (en) | 2019-11-19 |
Family
ID=54288866
Family Applications (4)
| Application Number | Title | Priority Date | Filing Date |
|---|---|---|---|
| US15/506,997Active2036-03-09US10482595B2 (en) | 2014-08-27 | 2015-08-27 | System and method for calculating focus variation for a digital microscope |
| US16/592,335ActiveUS11100637B2 (en) | 2014-08-27 | 2019-10-03 | System and method for calculating focus variation for a digital microscope |
| US17/362,009Active2035-10-19US11721018B2 (en) | 2014-08-27 | 2021-06-29 | System and method for calculating focus variation for a digital microscope |
| US18/214,568ActiveUS12387328B2 (en) | 2014-08-27 | 2023-06-27 | System and method for calculating focus variation for a digital microscope |
Family Applications After (3)
| Application Number | Title | Priority Date | Filing Date |
|---|---|---|---|
| US16/592,335ActiveUS11100637B2 (en) | 2014-08-27 | 2019-10-03 | System and method for calculating focus variation for a digital microscope |
| US17/362,009Active2035-10-19US11721018B2 (en) | 2014-08-27 | 2021-06-29 | System and method for calculating focus variation for a digital microscope |
| US18/214,568ActiveUS12387328B2 (en) | 2014-08-27 | 2023-06-27 | System and method for calculating focus variation for a digital microscope |
Country Status (4)
| Country | Link |
|---|---|
| US (4) | US10482595B2 (en) |
| EP (1) | EP3186778B1 (en) |
| CN (1) | CN107077732B (en) |
| WO (1) | WO2016030897A1 (en) |
Cited By (17)
| Publication number | Priority date | Publication date | Assignee | Title |
|---|---|---|---|---|
| WO2021116962A1 (en) | 2019-12-12 | 2021-06-17 | S.D. Sight Diagnostics Ltd | Artificial generation of color blood smear image |
| WO2021116955A1 (en) | 2019-12-12 | 2021-06-17 | S.D. Sight Diagnostics Ltd | Detecting platelets in a blood sample |
| WO2021116959A1 (en) | 2019-12-12 | 2021-06-17 | S.D. Sight Diagnostics Ltd | Analyzing an analyte disposed within a medium |
| WO2021116957A1 (en) | 2019-12-12 | 2021-06-17 | S.D. Sight Diagnostics Ltd | Off-focus microscopic images of a sample |
| WO2021116960A1 (en) | 2019-12-12 | 2021-06-17 | S.D. Sight Diagnostics Ltd | Classification models for analyzing a sample |
| US11199690B2 (en) | 2015-09-17 | 2021-12-14 | S.D. Sight Diagnostics Ltd. | Determining a degree of red blood cell deformity within a blood sample |
| WO2022009104A2 (en) | 2020-07-07 | 2022-01-13 | S.D. Sight Diagnostics Ltd | Focusing a microscope using fluorescent images |
| EP3966783A1 (en)* | 2019-05-08 | 2022-03-16 | 77 Elektronika Müszeripari Kft. | Image taking method, image analysis method, method for training an image analysis neural network, and image analysis neural network |
| US11307196B2 (en) | 2016-05-11 | 2022-04-19 | S.D. Sight Diagnostics Ltd. | Sample carrier for optical measurements |
| US20220155556A1 (en)* | 2018-08-09 | 2022-05-19 | Viavi Solutions Inc. | Context-based focus control of a microscope |
| US11609413B2 (en) | 2017-11-14 | 2023-03-21 | S.D. Sight Diagnostics Ltd. | Sample carrier for microscopy and optical density measurements |
| WO2023144713A1 (en) | 2022-01-25 | 2023-08-03 | S.D. Sight Diagnostics Ltd | Sample carrier for use with a bodily sample |
| US11733150B2 (en) | 2016-03-30 | 2023-08-22 | S.D. Sight Diagnostics Ltd. | Distinguishing between blood sample components |
| WO2024127207A1 (en) | 2022-12-12 | 2024-06-20 | S.D. Sight Diagnostics Ltd | System and method for analyzing bodily samples |
| WO2024236537A1 (en) | 2023-05-18 | 2024-11-21 | S.D. Sight Diagnostics Ltd | Apparatus and methods for microscopic analysis of a biological sample |
| US12174175B2 (en) | 2016-05-11 | 2024-12-24 | S.D. Sight Diagnostics Ltd. | Performing measurements on a sample |
| US12393010B2 (en) | 2013-08-26 | 2025-08-19 | S.D. Sight Diagnostics Ltd. | Distinguishing between entities in a blood sample |
Families Citing this family (15)
| Publication number | Priority date | Publication date | Assignee | Title |
|---|---|---|---|---|
| US9522396B2 (en) | 2010-12-29 | 2016-12-20 | S.D. Sight Diagnostics Ltd. | Apparatus and method for automatic detection of pathogens |
| BR112014016072B1 (en) | 2011-12-29 | 2021-01-12 | Sight Diagnostics Ltd. | method and system for detecting a plasmodium infection in a blood sample |
| EP2999988A4 (en) | 2013-05-23 | 2017-01-11 | S.D. Sight Diagnostics Ltd. | Method and system for imaging a cell sample |
| IL227276A0 (en) | 2013-07-01 | 2014-03-06 | Parasight Ltd | A method and system for preparing a monolayer of cells, particularly suitable for diagnosis |
| EP3186778B1 (en) | 2014-08-27 | 2023-01-11 | S.D. Sight Diagnostics Ltd. | System and method for calculating focus variation for a digital microscope |
| US11067526B2 (en) | 2017-08-17 | 2021-07-20 | Abbott Point Of Care Inc. | Devices, systems, and methods for performing optical and electrochemical assays |
| US10706328B2 (en) | 2018-05-07 | 2020-07-07 | Google Llc | Focus-weighted, machine learning disease classifier error prediction for microscope slide images |
| DE102018124401A1 (en)* | 2018-10-02 | 2020-04-02 | Carl Zeiss Smt Gmbh | Method for taking an image with a particle microscope |
| CN109856015B (en)* | 2018-11-26 | 2021-08-17 | 深圳辉煌耀强科技有限公司 | A rapid processing method and system for automatic diagnosis of cancer cells |
| CN109612992B (en)* | 2018-11-26 | 2021-07-23 | 深圳辉煌耀强科技有限公司 | A rapid scanning method and system for cervical exfoliated cell smear |
| BR112022007708A2 (en) | 2019-10-22 | 2022-07-12 | S D Sight Diagnostics Ltd | ACCOUNTING OF ERRORS IN OPTICAL MEASUREMENTS |
| JP7506524B2 (en)* | 2020-05-20 | 2024-06-26 | 株式会社エビデント | Microscope system, control method, and program |
| GB2595873B (en)* | 2020-06-09 | 2023-01-25 | Ffei Ltd | A method for analysing scanning efficacy |
| SE2250140A1 (en)* | 2022-02-11 | 2023-08-12 | Cellink Bioprinting Ab | Imaging apparatus and method for determning a focal point of a well-plate |
| US20250199286A1 (en)* | 2023-12-15 | 2025-06-19 | Idexx Laboratories, Inc. | Process and systems for autofocusing and measuring tilt of sample plane |
Citations (260)
| Publication number | Priority date | Publication date | Assignee | Title |
|---|---|---|---|---|
| US3603156A (en) | 1970-02-04 | 1971-09-07 | Gradko Glass Lab Inc | Disposable dilution system |
| US3676076A (en) | 1970-09-24 | 1972-07-11 | Gradko Glass Lab Inc | Disposable container |
| US3786184A (en)* | 1971-02-05 | 1974-01-15 | Image Analysing Computers Ltd | Focusing |
| US3967056A (en) | 1973-02-26 | 1976-06-29 | Minolta Camera Kabushiki Kaisha | Automatic focusing apparatus |
| US4076419A (en) | 1976-07-12 | 1978-02-28 | Kleker Richard G | Method and apparatus for hematology |
| US4209548A (en) | 1976-11-01 | 1980-06-24 | Rush-Presbyterian-St. Luke's Medical Center | Method for the preparation of blood samples for automated analysis |
| US4350884A (en) | 1979-03-20 | 1982-09-21 | Kernforschungszentrum Karlsruhe Gesellschaft Mit Beschrankter Haftung | Automatic focusing of every image point in an image |
| EP0073551A2 (en) | 1981-08-27 | 1983-03-09 | Becton Dickinson and Company | Sample collection container |
| US4454235A (en) | 1982-06-01 | 1984-06-12 | Miles Laboratories, Inc. | Capillary tube holder for liquid transfer in immunoassay |
| US4494479A (en) | 1982-10-14 | 1985-01-22 | Coulter Electronics, Inc. | Slide preparation apparatus |
| US4580895A (en) | 1983-10-28 | 1986-04-08 | Dynatech Laboratories, Incorporated | Sample-scanning photometer |
| JPS61198204A (en) | 1985-02-28 | 1986-09-02 | Disco Abrasive Sys Ltd | Microscope autofocus method |
| US4700298A (en) | 1984-09-14 | 1987-10-13 | Branko Palcic | Dynamic microscope image processing scanner |
| US4761381A (en) | 1985-09-18 | 1988-08-02 | Miles Inc. | Volume metering capillary gap device for applying a liquid sample onto a reactive surface |
| US4774192A (en) | 1987-01-28 | 1988-09-27 | Technimed Corporation | A dry reagent delivery system with membrane having porosity gradient |
| US4803352A (en) | 1986-05-16 | 1989-02-07 | Fritz Bierleutgeb | Autofocusing system for a microscope and method of using the same |
| US4849340A (en) | 1987-04-03 | 1989-07-18 | Cardiovascular Diagnostics, Inc. | Reaction system element and method for performing prothrombin time assay |
| US4902101A (en) | 1986-10-16 | 1990-02-20 | Olympus Optical Co., Ltd. | Automatic focusing method |
| US5001067A (en) | 1989-09-18 | 1991-03-19 | Nova Biomedical Corporation | Determining the concentration of water soluble species in biological fluid |
| US5064282A (en) | 1989-09-26 | 1991-11-12 | Artel, Inc. | Photometric apparatus and method for measuring hemoglobin |
| EP0479231A1 (en) | 1990-10-01 | 1992-04-08 | Canon Kabushiki Kaisha | Apparatus and method for measuring specimen |
| US5229265A (en) | 1990-03-13 | 1993-07-20 | Litron Laboratories | Process for analyzing clastogenic agents |
| US5300779A (en) | 1985-08-05 | 1994-04-05 | Biotrack, Inc. | Capillary flow device |
| US5331958A (en) | 1992-03-31 | 1994-07-26 | University Of Manitoba | Spectrophotometric blood analysis |
| US5430542A (en) | 1992-04-10 | 1995-07-04 | Avox Systems, Inc. | Disposable optical cuvette |
| WO1996001438A1 (en) | 1994-07-01 | 1996-01-18 | Price Jeffrey H | Autofocus system for scanning microscopy |
| WO1996012981A1 (en) | 1994-10-21 | 1996-05-02 | Kla Instruments Corporation | Autofocusing apparatus and method for high resolution microscope system |
| US5672861A (en) | 1994-01-18 | 1997-09-30 | Ultrapointe Corporation | Method and apparatus for automatic focusing of a confocal laser microscope |
| US5674457A (en) | 1995-04-21 | 1997-10-07 | Hemocue Ab | Capillary microcuvette |
| US5745804A (en) | 1994-05-31 | 1998-04-28 | Nikon Corporation | Automatic focus device |
| US5782770A (en) | 1994-05-12 | 1998-07-21 | Science Applications International Corporation | Hyperspectral imaging methods and apparatus for non-invasive diagnosis of tissue for cancer |
| US5834217A (en) | 1992-10-30 | 1998-11-10 | Becton Dickinson And Co. | Assay of blood or other biologic samples for target analytes |
| JPH1173903A (en) | 1997-08-28 | 1999-03-16 | Jeol Ltd | Autofocus method for scanning electron microscope |
| US5932872A (en) | 1994-07-01 | 1999-08-03 | Jeffrey H. Price | Autofocus system for scanning microscopy having a volume image formation |
| US5948686A (en) | 1998-03-07 | 1999-09-07 | Robert A. Leuine | Method for performing blood cell counts |
| US5985595A (en) | 1995-06-07 | 1999-11-16 | The University Of Connecticut | Early detection of Borrelia infection |
| US6027695A (en) | 1998-04-01 | 2000-02-22 | Dupont Pharmaceuticals Company | Apparatus for holding small volumes of liquids |
| US6064474A (en) | 1998-02-06 | 2000-05-16 | Optical Sensors, Inc. | Optical measurement of blood hematocrit incorporating a self-calibration algorithm |
| US6074879A (en) | 1997-06-23 | 2000-06-13 | Bayer Corporation | Synthetic polymer particles for use as standards and calibrators in flow cytometry |
| JP2000199845A (en) | 1999-01-05 | 2000-07-18 | Ricoh Co Ltd | Automatic focusing device and automatic focusing method |
| US6101404A (en) | 1996-05-23 | 2000-08-08 | Samsung Electronics Co., Ltd. | Optical diagnosis point detector for noninvasive diagnosis of blood constituents and noninvasive diagnostic device |
| WO2000055572A1 (en) | 1999-03-18 | 2000-09-21 | Zetetic Institute | Multiple layer confocal interference microscopy using wavenumber domain reflectometry and background amplitude reduction and compensation |
| US6262798B1 (en) | 1992-09-29 | 2001-07-17 | Board Of Regents, The University Of Texas System | Method and apparatus for direct spectrophotometric measurements in unaltered whole blood |
| US6320979B1 (en) | 1998-10-06 | 2001-11-20 | Canon Kabushiki Kaisha | Depth of field enhancement |
| US20020009711A1 (en) | 2000-01-06 | 2002-01-24 | Wada H. Garrett | Methods and systems for monitoring intracellular binding reactions |
| US6350613B1 (en) | 1998-03-07 | 2002-02-26 | Belton Dickinson & Co. | Determination of white blood cell differential and reticulocyte counts |
| US20020028158A1 (en) | 1998-03-07 | 2002-03-07 | Wardlaw Stephen C. | Apparatus for analyzing biologic fluids |
| US20020028471A1 (en) | 1998-02-20 | 2002-03-07 | Oberhardt Bruce J. | Cell analysis methods and apparatus |
| US6448024B1 (en) | 2000-10-03 | 2002-09-10 | Roche Diagnostics Corporation | Method, reagent, cartridge, and device for determining fibrinogen |
| US20030017085A1 (en) | 1998-08-10 | 2003-01-23 | Caliper Technologies Corp. | High throughput microfluidic systems and methods |
| US6554788B1 (en) | 2000-06-02 | 2003-04-29 | Cobe Cardiovascular, Inc. | Hematocrit sampling system |
| US6582964B1 (en) | 1999-05-12 | 2003-06-24 | Cme Telemetrix Inc. | Method and apparatus for rapid measurement of HbA1c |
| WO2003056327A1 (en) | 2001-12-28 | 2003-07-10 | Hemocue Ab | Method for quantitative hemoglobin determination in undiluted unhemolyzed whole blood |
| US6611777B2 (en) | 1999-11-23 | 2003-08-26 | James Samsoondar | Method for calibrating spectrophotometric apparatus |
| US20030161514A1 (en) | 2002-02-28 | 2003-08-28 | Curry Bo U. | Bi-directional scanner control system |
| WO2003073365A1 (en) | 2002-02-22 | 2003-09-04 | Bacus Research Laboratories, Inc. | Focusable virtual microscopy apparatus and method |
| WO2003081525A1 (en) | 2002-03-21 | 2003-10-02 | Endress + Hauser Wetzer Gmbh + Co. Kg | Device for identifying a sampler container |
| US6632681B1 (en) | 2000-07-24 | 2003-10-14 | Ey Laboratories | Reagent delivery device and method of use |
| US20030197925A1 (en) | 2002-04-18 | 2003-10-23 | Leica Microsystems Wetzlar Gmbh | Autofocus method for a microscope, and system for adjusting the focus for a microscope |
| US6658143B2 (en) | 2002-04-29 | 2003-12-02 | Amersham Biosciences Corp. | Ray-based image analysis for biological specimens |
| US20030224522A1 (en) | 2002-05-01 | 2003-12-04 | De Jong Gary | Methods for delivering nucleic acid molecules into cells and assessment thereof |
| US20030227612A1 (en) | 2002-06-10 | 2003-12-11 | Howard Fein | Imaging system for examining biological material |
| US20030227673A1 (en)* | 2001-03-01 | 2003-12-11 | Olympus Optical Co., Ltd. | System and method for controlling microscope |
| US6664528B1 (en) | 2001-07-06 | 2003-12-16 | Palantyr Research, Llc | Imaging system and methodology employing reciprocal space optical design |
| EP1381229A1 (en) | 2001-03-30 | 2004-01-14 | National Institute of Advanced Industrial Science and Technology | Real-time omnifocus microscope camera |
| US6711516B2 (en) | 1999-11-23 | 2004-03-23 | Spectromedical Inc. | Method for calibrating spectrophotometric apparatus |
| US20040132171A1 (en) | 2003-01-06 | 2004-07-08 | Peter Rule | Wearable device for measuring analyte concentration |
| US20040170312A1 (en) | 2000-05-03 | 2004-09-02 | Soenksen Dirk G. | Fully automatic rapid microscope slide scanner |
| JP2004257768A (en) | 2003-02-24 | 2004-09-16 | Horiba Ltd | Micro blood cell counter |
| US20040185447A1 (en) | 2003-03-20 | 2004-09-23 | Coulter International Corp. | Dye compositions which provide enhanced differential fluorescence and light scatter characteristics |
| US20040218804A1 (en) | 2003-01-31 | 2004-11-04 | Affleck Rhett L. | Image analysis system and method |
| US6819408B1 (en) | 2000-09-27 | 2004-11-16 | Becton, Dickinson And Company | Method for obtaining a monolayer of desired particles in a liquid sample |
| US20040241677A1 (en) | 2003-05-29 | 2004-12-02 | Lin Jeffrey S | Techniques for automated diagnosis of cell-borne anomalies with digital optical microscope |
| US20040240050A1 (en) | 2002-07-30 | 2004-12-02 | Nikon Corporation | Microscope system |
| US6834237B2 (en) | 2000-06-02 | 2004-12-21 | Medicometrics Aps | Method and system for classifying a biological sample |
| WO2004111610A2 (en) | 2003-06-12 | 2004-12-23 | Accupath Diagnostic Laboratories, Inc. | Method and system for the analysis of high density cells samples |
| US6836559B2 (en) | 2000-03-09 | 2004-12-28 | The Regents Of The University Of California | Automated video-microscopic imaging and data acquisition system for colloid deposition measurements |
| US6842233B2 (en) | 2001-07-26 | 2005-01-11 | Sysmex Corporation | Method of classifying particles on two-dimensional frequency distribution map and blood analyzer utilizing the same |
| US6872930B2 (en) | 2003-03-31 | 2005-03-29 | Palantyr Research, Llc | Imaging system and methodology employing reciprocal space optical design |
| US20050089208A1 (en)* | 2003-07-22 | 2005-04-28 | Rui-Tao Dong | System and method for generating digital images of a microscope slide |
| US20050109959A1 (en) | 2003-11-24 | 2005-05-26 | Mitutoyo Corporation | Systems and methods for rapidly automatically focusing a machine vision inspection system |
| US6949384B2 (en) | 2001-12-21 | 2005-09-27 | Spectromedical Inc. | Method for monitoring degradation of Hb-based blood substitutes |
| US6956650B2 (en) | 2001-01-12 | 2005-10-18 | General Hospital Corporation | System and method for enabling simultaneous calibration and imaging of a medium |
| WO2005121863A1 (en) | 2004-06-11 | 2005-12-22 | Nicholas Etienne Ross | Automated diagnosis of malaria and other infections |
| US20050286800A1 (en) | 2004-06-24 | 2005-12-29 | Fujifilm Electronic Imaging Ltd. | Method and apparatus for forming a multiple focus stack image |
| US6989891B2 (en) | 2001-11-08 | 2006-01-24 | Optiscan Biomedical Corporation | Device and method for in vitro determination of analyte concentrations within body fluids |
| US20060045505A1 (en)* | 2004-08-31 | 2006-03-02 | Zeineh Jack A | System and method for creating magnified images of a microscope slide |
| US20060063185A1 (en) | 2004-09-09 | 2006-03-23 | Edouard Vannier | Methods for detection of pathogens in red blood cells |
| US7027628B1 (en)* | 2000-11-14 | 2006-04-11 | The United States Of America As Represented By The Department Of Health And Human Services | Automated microscopic image acquisition, compositing, and display |
| US7034883B1 (en) | 1999-08-10 | 2006-04-25 | Cellavision Ab | Automatic focusing |
| US20060187442A1 (en) | 2003-07-19 | 2006-08-24 | Digital Bio Technology | Device for counting micro particles |
| US7105795B2 (en) | 2001-07-06 | 2006-09-12 | Palantyr Research, Llc | Imaging system, methodology, and applications employing reciprocal space optical design |
| US20060223165A1 (en) | 2003-07-18 | 2006-10-05 | Digital Bio Technology | Device for counting cells and method for manufacturing the same |
| US20060223052A1 (en) | 2005-03-30 | 2006-10-05 | Kimberly-Clark Worldwide, Inc. | Technique for detecting microorganisms |
| JP2006301270A (en) | 2005-04-20 | 2006-11-02 | Hitachi Kokusai Electric Inc | Autofocus device and autofocus method |
| US7133547B2 (en) | 2002-01-24 | 2006-11-07 | Tripath Imaging, Inc. | Method for quantitative video-microscopy and associated system and computer software program product |
| US7132636B1 (en) | 2001-07-06 | 2006-11-07 | Palantyr Research, Llc | Imaging system and methodology employing reciprocal space optical design |
| WO2006121266A1 (en) | 2005-05-06 | 2006-11-16 | Jae Chern Yoo | Digital bio disc(dbd), dbd driver apparatus, and assay method using the same |
| US7151246B2 (en) | 2001-07-06 | 2006-12-19 | Palantyr Research, Llc | Imaging system and methodology |
| US7155049B2 (en)* | 2001-01-11 | 2006-12-26 | Trestle Acquisition Corp. | System for creating microscopic digital montage images |
| JP2007040814A (en) | 2005-08-03 | 2007-02-15 | Matsushita Electric Ind Co Ltd | Absorbance measurement sensor and absorbance measurement method |
| US20070054350A1 (en) | 2003-03-27 | 2007-03-08 | Walker Fitz Jr | System and method for rapidly identifying pathogens, bacteria and abnormal cells |
| US7248716B2 (en) | 2001-07-06 | 2007-07-24 | Palantyr Research, Llc | Imaging system, methodology, and applications employing reciprocal space optical design |
| US7274810B2 (en) | 2000-04-11 | 2007-09-25 | Cornell Research Foundation, Inc. | System and method for three-dimensional image rendering and analysis |
| US7283217B2 (en) | 2004-03-11 | 2007-10-16 | Sysmex Corporation | Sample analyzer and computer product |
| US20070243117A1 (en) | 2004-04-07 | 2007-10-18 | Wardlaw Stephen C | Disposable Chamber for Analyzing Biologic Fluids |
| US7288751B2 (en) | 2001-07-06 | 2007-10-30 | Palantyr Research, Llc | Imaging system, methodology, and applications employing reciprocal space optical design |
| US20070252984A1 (en) | 2004-06-17 | 2007-11-01 | Koninklijke Philips Electronics N.V. | Autofocus Mechanism for Spectroscopic System |
| US20080020128A1 (en)* | 2006-07-24 | 2008-01-24 | Van Ryper William John | Automated microscope for blood cell analysis |
| US7324694B2 (en) | 2003-05-23 | 2008-01-29 | International Remote Imaging Systems, Inc. | Fluid sample analysis using class weights |
| US7329537B2 (en) | 2003-04-17 | 2008-02-12 | Nexcelom Bioscience, Llc | Micro-pattern embedded plastic optical film device for cell-based assays |
| US7338168B2 (en) | 2001-07-06 | 2008-03-04 | Palantyr Research, Llc | Particle analyzing system and methodology |
| US7344890B2 (en) | 2005-11-09 | 2008-03-18 | Beckman Coulter, Inc. | Method for discriminating platelets from red blood cells |
| US7369696B2 (en) | 2003-04-02 | 2008-05-06 | Ge Healthcare Uk Limited | Classification of cells into subpopulations using cell classifying data |
| WO2008063135A1 (en) | 2006-11-24 | 2008-05-29 | Agency For Science, Technology And Research | Apparatus for processing a sample in a liquid droplet and method of using the same |
| US7385168B2 (en) | 2001-07-06 | 2008-06-10 | Palantyr Research, Llc | Imaging system, methodology, and applications employing reciprocal space optical design |
| US20080187466A1 (en) | 1998-03-07 | 2008-08-07 | Wardlaw Stephen C | Container for holding biologic fluid for analysis |
| US7417213B2 (en) | 2005-06-22 | 2008-08-26 | Tripath Imaging, Inc. | Apparatus and method for rapid microscopic image focusing having a movable objective |
| US20080212069A1 (en) | 2007-01-26 | 2008-09-04 | Becton, Dickinson And Company | Method, system, and compositions for cell counting and analysis |
| US7439478B2 (en) | 2001-07-06 | 2008-10-21 | Palantyr Research, Llc | Imaging system, methodology, and applications employing reciprocal space optical design having at least one pixel being scaled to about a size of a diffraction-limited spot defined by a microscopic optical system |
| US7450762B2 (en) | 2003-07-21 | 2008-11-11 | Cellavision Ab | Method and arrangement for determining an object contour |
| US7460222B2 (en) | 2002-11-22 | 2008-12-02 | Roche Diagnostics Operations, Inc. | Measuring device for the optical analysis of a test strip |
| US20080305514A1 (en) | 2007-06-06 | 2008-12-11 | Alcon Research, Ltd. | Method for detecting microbes |
| US7493219B1 (en) | 2007-09-13 | 2009-02-17 | Shenzhen Mindray Bio-Medical Electronics Co. | Method of discriminating particle groups and particle analyzer |
| US20090066934A1 (en) | 2005-07-14 | 2009-03-12 | Johnway Gao | Optical devices for biological and chemical detection |
| US20090075324A1 (en) | 2006-05-05 | 2009-03-19 | Hemocue Ab | Method and System for Quantitative Hemoglobin Determination |
| CN101403650A (en) | 2008-11-21 | 2009-04-08 | 北京理工大学 | Differential confocal combination ultra-long focal length measuring method and apparatus |
| US20090185734A1 (en) | 2008-01-18 | 2009-07-23 | Hemocue Ab | Apparatus and method for analysis of particles in a liquid sample |
| US20090191098A1 (en) | 2003-09-19 | 2009-07-30 | Life Technologies Corporation | High Density Plate Filler |
| US20090195688A1 (en) | 2007-08-23 | 2009-08-06 | General Electric Company | System and Method for Enhanced Predictive Autofocusing |
| US7580120B2 (en) | 2005-04-07 | 2009-08-25 | Sysmex Corporation | Blood analyzer, sample analyzer, and flow cytometer |
| US20090213214A1 (en)* | 2008-01-23 | 2009-08-27 | Tatsuki Yamada | Microscope System, Image Generating Method, and Program for Practising the Same |
| US7599893B2 (en) | 2005-10-13 | 2009-10-06 | Aureon Laboratories, Inc. | Methods and systems for feature selection in machine learning based on feature contribution and model fitness |
| US20090258347A1 (en) | 2004-12-14 | 2009-10-15 | University Of The Witwatersrand | Method for diagnosing and monitoring cellular reservoirs of disease |
| US7609369B2 (en) | 2005-09-24 | 2009-10-27 | Beckman Coulter, Inc. | Methods of detection of iron deficiency and hemochromatosis |
| US20090269799A1 (en) | 2008-04-25 | 2009-10-29 | Constitutional Medical Investors, Inc. | Method of determining a complete blood count and a white blood cell differential count |
| US7630063B2 (en) | 2000-08-02 | 2009-12-08 | Honeywell International Inc. | Miniaturized cytometer for detecting multiple species in a sample |
| EP2145684A2 (en) | 2008-07-14 | 2010-01-20 | Samsung Electronics Co., Ltd. | Microfluidic device, sample analyzing method using the same, and dilution ration measuring method |
| US7663738B2 (en) | 2004-10-11 | 2010-02-16 | Thermo Fisher Scientific Oy | Method for automatically detecting factors that disturb analysis by a photometer |
| US7668362B2 (en)* | 2000-05-03 | 2010-02-23 | Aperio Technologies, Inc. | System and method for assessing virtual slide image quality |
| US7697764B2 (en) | 2003-11-21 | 2010-04-13 | National University Corporation Kochi University | Similar pattern searching apparatus, method of similar pattern searching, program for similar pattern searching, and fractionation apparatus |
| US7706862B2 (en) | 2003-04-17 | 2010-04-27 | Research Foundation Of The City University Of New York | Detecting human cancer through spectral optical imaging using key water absorption wavelengths |
| US20100112631A1 (en) | 2007-01-09 | 2010-05-06 | Digital Bio Technology | Chip Having Microchannel For Counting Specific Micro Particles Among Floating Micro Particle Mixture By Optical Means And A Method For Counting Micro Particles Using The Same |
| US7713474B2 (en) | 2002-01-15 | 2010-05-11 | Siemens Healthcare Diagnostics Inc. | Liquid permeable composition in dry reagent devices |
| US20100120129A1 (en) | 2008-08-27 | 2010-05-13 | Life Technologies Corporation | Apparatus for and method of processing biological samples |
| WO2010056740A1 (en) | 2008-11-13 | 2010-05-20 | Beckman Coulter, Inc. | Method of correction of particle interference to hemoglobin measurement |
| US20100152054A1 (en) | 2005-09-16 | 2010-06-17 | Love J Christopher | Screening assays and methods |
| US20100157086A1 (en) | 2008-12-15 | 2010-06-24 | Illumina, Inc | Dynamic autofocus method and system for assay imager |
| US7747153B2 (en) | 2007-04-19 | 2010-06-29 | Canon Kabushiki Kaisha | Camera having an image blur reducing function and rotation means |
| US20100172020A1 (en)* | 2008-10-14 | 2010-07-08 | Burnham Institute For Medical Research | Automated scanning cytometry using chromatic aberrtation for multiplanar image acquisition |
| US7765069B2 (en) | 2002-10-18 | 2010-07-27 | Abaxis, Inc. | Systems for the detection of short and long samples |
| US7777869B2 (en) | 2005-04-21 | 2010-08-17 | Horiba Abx Sas | Device and method for multiparametric analysis of microscopic elements |
| US7787109B2 (en) | 2004-12-13 | 2010-08-31 | Bayer Healthcare Llc | Transmission spectroscopy system for use in the determination of analytes in body fluid |
| US20100254596A1 (en)* | 2007-09-26 | 2010-10-07 | Wei Xiong | Method and system for generating an entirely well-focused image of a large three-dimensional scene |
| US20100256918A1 (en) | 2009-03-11 | 2010-10-07 | Industrial Technology Research Institute | Apparatus and method for detection and discrimination molecular object |
| US20100265323A1 (en) | 2005-08-02 | 2010-10-21 | Perz Cynthia B | System for and method of focusing in automated microscope systems |
| WO2010126903A1 (en) | 2009-04-27 | 2010-11-04 | Constitution Medical Investors, Inc. | Systems and methods for analyzing body fluids |
| US7863552B2 (en) | 2001-07-06 | 2011-01-04 | Palantyr Research Llc | Digital images and related methodologies |
| US20110009163A1 (en) | 2008-01-02 | 2011-01-13 | The Regents Of The University Of California | High numerical aperture telemicroscopy apparatus |
| US20110030458A1 (en) | 2007-07-23 | 2011-02-10 | Digital Bio Technology Co., Ltd. | Chip for analyzing fluids |
| US7925070B2 (en) | 2004-03-30 | 2011-04-12 | Sysmex Corporation | Method for displaying virtual slide and terminal device for displaying virtual slide |
| US7929121B2 (en) | 2008-03-21 | 2011-04-19 | Abbott Point Of Care, Inc. | Method and apparatus for detecting and counting platelets individually and in aggregate clumps |
| US7933435B2 (en) | 2005-11-21 | 2011-04-26 | Vala Sciences, Inc. | System, method, and kit for processing a magnified image of biological material to identify components of a biological object |
| US7936913B2 (en) | 2007-08-07 | 2011-05-03 | Nextslide Imaging Llc | Network image review in clinical hematology |
| US20110102571A1 (en)* | 2009-10-29 | 2011-05-05 | Olympus Corporation | Microscope Apparatus and Microscope Observation Method |
| US20110123398A1 (en) | 2008-03-27 | 2011-05-26 | President And Fellows Of Harvard College | Three-dimensional microfluidic devices |
| US7951599B2 (en) | 2008-03-21 | 2011-05-31 | Abbott Point Of Care, Inc. | Method and apparatus for determining the hematocrit of a blood sample utilizing the intrinsic pigmentation of hemoglobin contained within the red blood cells |
| US20110149097A1 (en) | 2009-12-23 | 2011-06-23 | Gaudenz Danuser | System and method for dense-stochastic-sampling imaging |
| US20110151502A1 (en) | 2009-12-22 | 2011-06-23 | Abbott Laboratories | Method for performing a blood count and determining the morphology of a blood smear |
| US20110178716A1 (en) | 2010-01-15 | 2011-07-21 | Martin Krockenberger | Method for determining volume and hemoglobin content of individual red blood cells |
| US7995200B2 (en) | 2007-10-26 | 2011-08-09 | Arkray, Inc. | Analyzer |
| US7998435B2 (en) | 2003-09-19 | 2011-08-16 | Life Technologies Corporation | High density plate filler |
| US20110212486A1 (en)* | 2010-02-26 | 2011-09-01 | Olympus Corporation | Microscope System, Specimen Observation Method, and Computer Program Product |
| WO2011123070A1 (en) | 2010-03-31 | 2011-10-06 | Agency For Science, Technology And Research | A method of monitoring parasite development in blood |
| US20110249910A1 (en)* | 2010-04-08 | 2011-10-13 | General Electric Company | Image quality assessment including comparison of overlapped margins |
| US8045782B2 (en) | 2004-12-07 | 2011-10-25 | Ge Healthcare Niagara, Inc. | Method of, and apparatus and computer software for, implementing image analysis protocols |
| US8044974B2 (en) | 2005-04-20 | 2011-10-25 | Sysmex Corporation | Image creating apparatus and image creating method |
| US20110275111A1 (en) | 2009-01-27 | 2011-11-10 | Koninklijke Philips Electronics N.V. | Microfluidic device for full blood count |
| WO2011143075A2 (en) | 2010-05-08 | 2011-11-17 | Veridex, Llc | A simple and affordable method for immuophenotyping using a microfluidic chip sample preparation with image cytometry |
| US8064680B2 (en) | 2005-06-15 | 2011-11-22 | Tissue Gnostics Gmbh | Process for segmenting leukocytes |
| US8081303B2 (en) | 2008-03-21 | 2011-12-20 | Abbott Point Of Care, Inc. | Method and apparatus for analyzing individual cells or particulates using fluorescent quenching and/or bleaching |
| US20120002195A1 (en) | 2010-04-30 | 2012-01-05 | General Electric Company | Arc flash detection method |
| WO2012000102A1 (en) | 2010-06-30 | 2012-01-05 | The Governors Of The University Of Alberta | Apparatus and method for microscope-based label-free microflutdic cytometry |
| US20120021951A1 (en) | 2000-10-10 | 2012-01-26 | Life Technologies Corporation | Apparatus for Assay, Synthesis and Storage, and Methods of Manufacture, Use, and Manipulation Thereof |
| US8105554B2 (en) | 2004-03-12 | 2012-01-31 | Life Technologies Corporation | Nanoliter array loading |
| US20120030618A1 (en) | 2010-07-08 | 2012-02-02 | Life Technologies Corporation | Systems and methods for assigning attributes to a plurality of samples |
| US20120044342A1 (en)* | 2010-08-20 | 2012-02-23 | Sakura Finetek U.S.A., Inc. | Digital microscope |
| US8131035B2 (en) | 2007-02-05 | 2012-03-06 | Siemens Healthcare Diagnostics Inc. | Cell analysis using isoperimetric graph partitioning |
| US8131052B2 (en) | 2005-10-20 | 2012-03-06 | Ge Healthcare Uk Limited | Method of processing an image |
| USD655421S1 (en) | 2010-11-03 | 2012-03-06 | Life Technologies Corporation | Cell counter |
| US20120058504A1 (en) | 2009-10-30 | 2012-03-08 | Simon Fraser University | Methods and apparatus for dielectrophoretic shuttling and measurement of single cells or other particles in microfluidic chips |
| US8150114B2 (en) | 2006-01-25 | 2012-04-03 | Hemocue Ab | Method for ensuring quality of a sample carrier |
| US20120092477A1 (en)* | 2010-10-18 | 2012-04-19 | Olympus America Inc. | Wide field microscopic imaging system and method |
| US8175353B2 (en) | 2006-07-06 | 2012-05-08 | Carl Zeiss Meditec Ag | Method and device for producing an image of a thin layer of an object |
| US20120120221A1 (en) | 2009-10-30 | 2012-05-17 | Siemens Aktiengesellschaft | Body Fluid Analyzing System and an Imaging Processing Device and Method for Analyzing Body Fluids |
| US20120169863A1 (en) | 2010-12-29 | 2012-07-05 | Ido Bachelet | Apparatus and method for automatic detection of pathogens |
| US8216832B2 (en) | 2007-07-31 | 2012-07-10 | Micronics, Inc. | Sanitary swab collection system, microfluidic assay device, and methods for diagnostic assays |
| US8224058B2 (en) | 2006-07-19 | 2012-07-17 | Hemocue Ab | Measurement apparatus, method and computer program |
| US20120225446A1 (en) | 2009-04-09 | 2012-09-06 | Koninklijke Philips Electronics N.V. | Preparation of thin layers of a fluid containing cells for analysis |
| US8280134B2 (en) | 2008-09-22 | 2012-10-02 | Cambridge Research & Instrumentation, Inc. | Multi-spectral imaging including at least one common stain |
| WO2012154333A1 (en) | 2011-04-07 | 2012-11-15 | The Uwm Research Foundation, Inc. | High speed microscope with spectral resolution |
| US8320655B2 (en) | 2009-10-16 | 2012-11-27 | General Electric Company | Process and system for analyzing the expression of biomarkers in cells |
| US8331642B2 (en) | 2008-06-30 | 2012-12-11 | Fraunhofer-Gesellschaft Zur Foerderung Der Angewandten Forschung E.V. | Method and device for determining a contour and a center of an object |
| US20120312957A1 (en) | 2009-10-19 | 2012-12-13 | Loney Gregory L | Imaging system and techniques |
| US20120320045A1 (en) | 2011-06-20 | 2012-12-20 | Mstar Semiconductor, Inc. | Image Processing Method and Apparatus Thereof |
| US8339586B2 (en) | 2011-04-15 | 2012-12-25 | Constitution Medical, Inc. | Measuring volume and constituents of cells |
| US8351676B2 (en) | 2010-10-12 | 2013-01-08 | Sony Corporation | Digital image analysis using multi-step analysis |
| US20130023007A1 (en) | 2011-07-22 | 2013-01-24 | Constitution Medical, Inc. | Identifying and measuring reticulocytes |
| US8363221B2 (en) | 1997-05-05 | 2013-01-29 | Chemometec A/S | Method and a system for determination of particles in a liquid sample |
| US8379944B2 (en) | 2008-04-29 | 2013-02-19 | Siemens Healthcare Diagnostics Inc. | Identification, classification and counting of targets of interest in multispectral image data |
| US8428331B2 (en) | 2006-08-07 | 2013-04-23 | Northeastern University | Phase subtraction cell counting method |
| US8432392B2 (en) | 2010-09-02 | 2013-04-30 | Samsung Electronics Co., Ltd. | Display system with image conversion mechanism and method of operation thereof |
| US20130130262A1 (en) | 2010-01-29 | 2013-05-23 | C. Frederick Battrell | Sample-to-answer microfluidic cartridge |
| WO2013098821A1 (en) | 2011-12-29 | 2013-07-04 | Parasight Ltd. | Methods and systems for detecting a pathogen in a biological sample |
| US8481303B2 (en) | 2009-10-12 | 2013-07-09 | Corning Incorporated | Microfluidic device for cell culture |
| US8491499B2 (en) | 2007-11-12 | 2013-07-23 | Boditechmed Inc | Biological fluid sampling and pretreating system and a method thereof |
| US8526704B2 (en) | 2007-01-11 | 2013-09-03 | Intellectual Property Mvm B.V. | Measurement of functional microcirculatory geometry and velocity distributions using automated image analysis |
| US20130273968A1 (en)* | 2008-08-19 | 2013-10-17 | Digimarc Corporation | Methods and systems for content processing |
| US8570496B2 (en) | 2011-10-20 | 2013-10-29 | Lite-On It Corporation | Optical detection apparatus and optical measurement system |
| US20130290225A1 (en) | 2010-07-23 | 2013-10-31 | General Electric Company | Systems and methods for selecting and analyzing particles in a biological tissue |
| US20130284924A1 (en)* | 2011-01-14 | 2013-10-31 | Hitachi High-Technologies Corporation | Charged particle beam apparatus |
| US8582924B2 (en) | 2004-06-30 | 2013-11-12 | Carl Zeiss Microimaging Gmbh | Data structure of an image storage and retrieval system |
| US8712142B2 (en) | 2011-03-14 | 2014-04-29 | The University Of Warwick | Method and apparatus for analysis of histopathology images and its application to cancer diagnosis and grading |
| US20140139630A1 (en) | 2012-11-19 | 2014-05-22 | Raytheon Company | Methods and apparatus for imaging without retro-reflection |
| US20140139625A1 (en) | 2011-07-19 | 2014-05-22 | Ovizio Imaging Systems NV/SA | Method and system for detecting and/or classifying cancerous cells in a cell sample |
| US8736824B2 (en) | 2011-08-08 | 2014-05-27 | Sony Corporation | Blood analysis apparatus and blood analysis method |
| US8744165B2 (en) | 2012-07-19 | 2014-06-03 | Sony Corporation | Method and apparatus for stain separation in digital pathology images |
| US20140186859A1 (en)* | 2012-05-09 | 2014-07-03 | Advanced Animal Diagnostic, Inc. | Autofocus method for imaging a biological sample and cartridge for use therein |
| US20140205176A1 (en) | 2011-09-22 | 2014-07-24 | Foce Technology International Bv | Optical platelet counter method |
| US8792693B2 (en) | 2011-07-09 | 2014-07-29 | Gauss Surgical | System and method for estimating extracorporeal blood volume in a physical sample |
| US8849024B2 (en) | 2008-09-25 | 2014-09-30 | Nikon Corporation | Image processing device and medium storing image processing program |
| WO2014159620A1 (en) | 2013-03-14 | 2014-10-02 | Samuels Mark A | Encoded calibration device and systems and methods thereof |
| US8873827B2 (en) | 2012-06-29 | 2014-10-28 | General Electric Company | Determination of spatial proximity between features of interest in biological tissue |
| US8877458B2 (en) | 2007-02-02 | 2014-11-04 | Canadian Blood Services | Method of detecting bacterial contamination using dynamic light scattering |
| US8885154B2 (en) | 2008-03-21 | 2014-11-11 | Abbott Point Of Care, Inc. | Method and apparatus for identifying reticulocytes within a blood sample |
| US8885912B2 (en) | 2011-11-03 | 2014-11-11 | General Electric Company | Generate percentage of positive cells for biomarkers by normalizing and autothresholding the image intensity produced by immunohistochemistry technique |
| WO2014188405A1 (en) | 2013-05-23 | 2014-11-27 | Parasight Ltd. | Method and system for imaging a cell sample |
| WO2015001553A1 (en) | 2013-07-01 | 2015-01-08 | Sight Diagnostics Ltd. | A method, kit and system for imaging a blood sample |
| US8942458B2 (en) | 2008-06-27 | 2015-01-27 | Furukawa Electric Co., Ltd. | Method for distinguishing and sorting of cells and device therefor |
| WO2015029032A1 (en) | 2013-08-26 | 2015-03-05 | Parasight Ltd. | Digital microscopy systems, methods and computer program products |
| US9012868B2 (en) | 2009-01-14 | 2015-04-21 | Perkinelmer Singapore Pte Ltd. | Fluorescence microscopy methods and apparatus |
| US9041792B2 (en) | 2008-11-27 | 2015-05-26 | Koninklijke Philips N.V. | Generation of a multicolour image of an unstained biological specimen |
| US9046473B2 (en) | 2011-09-28 | 2015-06-02 | Abbott Point Of Care, Inc. | Method and apparatus for detecting the presence of intraerythrocytic parasites |
| US9050595B2 (en) | 2010-12-03 | 2015-06-09 | Abbott Point Of Care Inc. | Assay devices with integrated sample dilution and dilution verification and methods of using same |
| US20150278575A1 (en) | 2012-11-07 | 2015-10-01 | bioMérieux | Bio-imaging method |
| US20150302237A1 (en) | 2012-11-28 | 2015-10-22 | Japan Science And Technology Agency | Cell monitoring device, cell monitoring method and program thereof |
| US9186843B2 (en) | 2010-01-20 | 2015-11-17 | Nexcelom Bioscience Llc | Cell counting and sample chamber and methods of fabrication |
| US9240043B2 (en) | 2008-09-16 | 2016-01-19 | Novartis Ag | Reproducible quantification of biomarker expression |
| WO2016030897A1 (en) | 2014-08-27 | 2016-03-03 | S.D. Sight Diagnostics Ltd | System and method for calculating focus variation for a digital microscope |
| EP3001174A1 (en) | 2014-09-26 | 2016-03-30 | Sysmex Corporation | Blood analyzer and blood analyzing method |
| US20170052110A1 (en) | 2015-08-17 | 2017-02-23 | Gerresheimer Regensburg Gmbh | Sampling Apparatus Comprising a Reference Marker |
| WO2017046799A1 (en) | 2015-09-17 | 2017-03-23 | S.D. Sight Diagnostics Ltd | Methods and apparatus for detecting an entity in a bodily sample |
| US20170160185A1 (en) | 2015-12-02 | 2017-06-08 | Hitachi-Lg Data Storage, Inc. | Optical measurement method and apparatus |
| WO2017168411A1 (en) | 2016-03-30 | 2017-10-05 | S.D. Sight Diagnostics Ltd | Image processing device for identifying blood parasites |
| WO2017195205A1 (en) | 2016-05-11 | 2017-11-16 | S.D. Sight Diagnostics Ltd | Sample carrier for optical measurements |
| WO2017195208A1 (en) | 2016-05-11 | 2017-11-16 | S.D. Sight Diagnostics Ltd | Performing optical measurements on a sample |
| US9934571B2 (en) | 2012-08-23 | 2018-04-03 | Fuji Xerox Co., Ltd. | Image processing device, program, image processing method, computer-readable medium, and image processing system |
| US10061972B2 (en) | 2015-05-28 | 2018-08-28 | Tokitae Llc | Image analysis systems and related methods |
| US20180296102A1 (en) | 2011-07-09 | 2018-10-18 | Gauss Surgical, Inc. | Method for estimating a quantity of a blood component in a fluid receiver and corresponding error |
| WO2019097387A1 (en) | 2017-11-14 | 2019-05-23 | S.D. Sight Diagnostics Ltd | Sample carrier for optical measurements |
Family Cites Families (99)
| Publication number | Priority date | Publication date | Assignee | Title |
|---|---|---|---|---|
| EP0183717B1 (en) | 1984-05-15 | 1989-11-23 | Cytocolor Inc. | Single dye replacement for romanowsky plural dye variable compositions in human biopsy specimen constituent identifications |
| US4849430A (en) | 1988-03-09 | 1989-07-18 | Monsanto Company | Method of inhibiting virus |
| US5590660A (en) | 1994-03-28 | 1997-01-07 | Xillix Technologies Corp. | Apparatus and method for imaging diseased tissue using integrated autofluorescence |
| US5499097A (en) | 1994-09-19 | 1996-03-12 | Neopath, Inc. | Method and apparatus for checking automated optical system performance repeatability |
| AU4131796A (en) | 1994-10-27 | 1996-05-23 | Entremed, Inc | Identification of infection with flow cytometry |
| EP1300713A3 (en)* | 1995-11-30 | 2004-11-03 | Chromavision Medical Systems, Inc. | Method and apparatus for automated image analysis of biological specimens |
| DE19653413C2 (en) | 1996-12-22 | 2002-02-07 | Stefan Hell | Scanning microscope, in which a sample is simultaneously optically excited in several sample points |
| IT1304854B1 (en) | 1998-07-29 | 2001-04-05 | Paolo Fazii | METHOD OF CHROMATIC DIFFERENTIATION OF FLUORESCENCE MICROORGANISMS |
| US6496260B1 (en) | 1998-12-23 | 2002-12-17 | Molecular Devices Corp. | Vertical-beam photometer for determination of light absorption pathlength |
| US6344340B1 (en) | 1999-03-01 | 2002-02-05 | Novus International, Inc. | Viability assay for sporocyst-forming protozoa |
| US6538249B1 (en)* | 1999-07-09 | 2003-03-25 | Hitachi, Ltd. | Image-formation apparatus using charged particle beams under various focus conditions |
| US7518652B2 (en)* | 2000-05-03 | 2009-04-14 | Aperio Technologies, Inc. | Method and apparatus for pre-focus in a linear array based slide scanner |
| DE10051806A1 (en) | 2000-10-18 | 2002-04-25 | Bayer Ag | Characterization of microbial mixtures, useful e.g. for quality control, comprises comparing spectra and chromatograms with reference data |
| WO2002039059A1 (en) | 2000-11-07 | 2002-05-16 | Cellavision Ab | Autofocusing |
| US6898451B2 (en) | 2001-03-21 | 2005-05-24 | Minformed, L.L.C. | Non-invasive blood analyte measuring system and method utilizing optical absorption |
| US6519355B2 (en) | 2001-03-28 | 2003-02-11 | Alan C. Nelson | Optical projection imaging system and method for automatically detecting cells having nuclear and cytoplasmic densitometric features associated with disease |
| US7272252B2 (en) | 2002-06-12 | 2007-09-18 | Clarient, Inc. | Automated system for combining bright field and fluorescent microscopy |
| WO2003106157A2 (en)* | 2002-06-14 | 2003-12-24 | Chromavision Medical Systems, Inc. | Automated slide staining apparatus |
| GB0216641D0 (en)* | 2002-07-18 | 2002-08-28 | Univ Nottingham | Image analysis method, apparatus and software |
| US7490085B2 (en) | 2002-12-18 | 2009-02-10 | Ge Medical Systems Global Technology Company, Llc | Computer-assisted data processing system and method incorporating automated learning |
| US9176121B2 (en) | 2004-02-13 | 2015-11-03 | Roche Diagnostics Hematology, Inc. | Identification of blood elements using inverted microscopy |
| US7813579B2 (en)* | 2004-05-24 | 2010-10-12 | Hamamatsu Photonics K.K. | Microscope system |
| US7463761B2 (en)* | 2004-05-27 | 2008-12-09 | Aperio Technologies, Inc. | Systems and methods for creating and viewing three dimensional virtual slides |
| US7394943B2 (en)* | 2004-06-30 | 2008-07-01 | Applera Corporation | Methods, software, and apparatus for focusing an optical system using computer image analysis |
| JP4511303B2 (en)* | 2004-10-05 | 2010-07-28 | 株式会社日立ハイテクノロジーズ | Charged particle beam apparatus and dimension measuring method |
| US8691161B2 (en) | 2004-12-13 | 2014-04-08 | Bayer Healthcare Llc | Self-contained test sensor |
| EP3471020B1 (en)* | 2005-01-27 | 2021-03-03 | Leica Biosystems Imaging Inc. | Systems and methods for viewing three dimensional virtual slides |
| US20070103678A1 (en) | 2005-02-14 | 2007-05-10 | Sterling Bernhard B | Analyte detection system with interferent identification and correction |
| JP4445893B2 (en) | 2005-04-06 | 2010-04-07 | 株式会社日立ハイテクノロジーズ | Scanning electron microscope |
| US8164622B2 (en)* | 2005-07-01 | 2012-04-24 | Aperio Technologies, Inc. | System and method for single optical axis multi-detector microscope slide scanner |
| US7796797B2 (en) | 2005-09-28 | 2010-09-14 | Sysmex Corporation | Apparatus for obtaining an image of a blood cell and method for obtaining an image of a blood cell |
| JP4690165B2 (en) | 2005-09-29 | 2011-06-01 | シスメックス株式会社 | Blood imaging apparatus, blood imaging method, processing apparatus, and imaging main body apparatus |
| GB2435925A (en) | 2006-03-09 | 2007-09-12 | Cytokinetics Inc | Cellular predictive models for toxicities |
| JP5040191B2 (en) | 2006-06-29 | 2012-10-03 | 富士通株式会社 | Microinjection apparatus and automatic focus adjustment method |
| AT503862B1 (en) | 2006-07-05 | 2010-11-15 | Arc Austrian Res Centers Gmbh | PATHOGENIC IDENTIFICATION DUE TO A 16S OR 18S RRNA MICROARRAY |
| JP2008020710A (en) | 2006-07-13 | 2008-01-31 | Fujifilm Corp | Imaging apparatus and focus adjustment method |
| US7542137B2 (en) | 2006-07-24 | 2009-06-02 | University Of Ottawa | Pathogen detection using coherent anti-stokes Raman scattering microscopy |
| EP1986046B1 (en)* | 2007-03-08 | 2014-07-16 | Cellavision AB | A method for determining an in-focus position and a vision inspection system |
| EP2191414B1 (en)* | 2007-08-17 | 2019-02-13 | CDx Medical IP, Inc. | Feature dependent extended depth of focusing on semi-transparent biological specimens |
| EP2220840B1 (en) | 2007-10-30 | 2014-01-08 | Telecom Italia S.p.A. | Method of authentication of users in data processing systems |
| US8125512B2 (en) | 2007-11-16 | 2012-02-28 | Samsung Electronics Co., Ltd. | System and method for moving object selection in a handheld image capture device |
| US20110007178A1 (en) | 2008-03-12 | 2011-01-13 | Koninklijke Philips Electronics N.V. | Correction of spot area in measuring brightness of sample in biosensing device |
| JP2009223164A (en)* | 2008-03-18 | 2009-10-01 | Olympus Corp | Microscopic image photographing apparatus |
| US8883491B2 (en) | 2008-04-09 | 2014-11-11 | Nexcelom Bioscience Llc | Systems and methods for counting cells and biomolecules |
| JP5643210B2 (en)* | 2008-10-24 | 2014-12-17 | アペリオ・テクノロジーズ・インコーポレイテッドAperio Technologies, Inc. | Whole slide fluorescent scanner |
| US8842900B2 (en) | 2008-10-28 | 2014-09-23 | Sysmex Corporation | Specimen processing system and blood cell image classifying apparatus |
| JP5426181B2 (en) | 2009-01-21 | 2014-02-26 | シスメックス株式会社 | Specimen processing system, cell image classification apparatus, and specimen processing method |
| US20100300563A1 (en) | 2009-05-27 | 2010-12-02 | John Ramunas | Modular device and method for moving fluids to and from a sample delivery element |
| US8891851B2 (en) | 2009-07-15 | 2014-11-18 | Glenn F. Spaulding | Home healthcare management system and hardware |
| DE102009041183A1 (en) | 2009-09-11 | 2011-03-24 | Carl Zeiss Imaging Solutions Gmbh | Method for automatically focusing a microscope on a predetermined object and microscope for automatic focusing |
| US8314837B2 (en)* | 2009-10-15 | 2012-11-20 | General Electric Company | System and method for imaging with enhanced depth of field |
| CN101702053B (en)* | 2009-11-13 | 2012-01-25 | 长春迪瑞实业有限公司 | Method for automatically focusing microscope system in urinary sediment examination equipment |
| US9119573B2 (en) | 2009-12-10 | 2015-09-01 | Siemens Aktiengesellschaft | Stent marker detection using a learning based classifier in medical imaging |
| US8027582B2 (en)* | 2009-12-21 | 2011-09-27 | Sony Corporation | Autofocus with confidence measure |
| WO2011076413A1 (en) | 2009-12-22 | 2011-06-30 | Universität Heidelberg | Means and methods for detecting plasmodia and for screening or diagnosing drug resistance or altered drug responsiveness of plasmodia |
| WO2011080670A1 (en)* | 2009-12-30 | 2011-07-07 | Koninklijke Philips Electronics N.V. | Sensor for microscopy. |
| US8837803B2 (en) | 2009-12-31 | 2014-09-16 | Abbott Point Of Care, Inc. | Method and apparatus for determining mean cell volume of red blood cells |
| US8791414B2 (en)* | 2010-04-21 | 2014-07-29 | Hermes Microvision, Inc. | Dynamic focus adjustment with optical height detection apparatus in electron beam system |
| WO2011156068A1 (en) | 2010-06-07 | 2011-12-15 | Caridianbct, Inc. | Multi-unit blood processor with volume prediction |
| JP5655557B2 (en)* | 2010-07-12 | 2015-01-21 | ソニー株式会社 | Microscope control device, image display device, image management server, focus position information generation method, image display method, image management method, and microscope image management system |
| JP6148431B2 (en) | 2010-12-28 | 2017-06-14 | キヤノン株式会社 | Imaging apparatus and control method thereof |
| US9041791B2 (en)* | 2011-02-01 | 2015-05-26 | Roche Diagnostics Hematology, Inc. | Fast auto-focus in imaging |
| DE102011003807A1 (en) | 2011-02-08 | 2012-08-09 | Leica Microsystems Cms Gmbh | Microscope with autofocus device and autofocusing method for microscopes |
| US9064301B2 (en) | 2011-04-14 | 2015-06-23 | Abbott Point Of Care, Inc. | Method and apparatus for compressing imaging data of whole blood sample analyses |
| JP2012237693A (en)* | 2011-05-13 | 2012-12-06 | Sony Corp | Image processing device, image processing method and image processing program |
| JP5780865B2 (en)* | 2011-07-14 | 2015-09-16 | キヤノン株式会社 | Image processing apparatus, imaging system, and image processing system |
| KR101860605B1 (en) | 2011-10-19 | 2018-05-23 | 바이오보션 아게 | System for noninvasive optical measurements of physiological properties in tissue |
| US10001622B2 (en)* | 2011-10-25 | 2018-06-19 | Sanford Burnham Medical Research Institute | Multifunction autofocus system and method for automated microscopy |
| JP5705096B2 (en)* | 2011-12-02 | 2015-04-22 | キヤノン株式会社 | Image processing apparatus and image processing method |
| EP3244209B1 (en) | 2011-12-30 | 2018-12-19 | Abbott Point Of Care, Inc. | Method and apparatus for automated platelet identification within a whole blood sample from microscopy images |
| US9551568B2 (en)* | 2012-03-15 | 2017-01-24 | Dmetrix, Inc. | Prediction of a focal plane with progressive through-focus scans |
| JP2013201530A (en)* | 2012-03-23 | 2013-10-03 | Canon Inc | Imaging device and control method of the same |
| US9509977B2 (en)* | 2012-03-28 | 2016-11-29 | Olympus Corporation | Image processing system and microscope system including the same |
| WO2013158506A2 (en) | 2012-04-17 | 2013-10-24 | Ehrenkranz Joel R L | Device for performing a blood, cell, and/or pathogen count and methods for use thereof |
| JP5920464B2 (en)* | 2012-06-07 | 2016-05-18 | ソニー株式会社 | Image processing apparatus, image processing program, and image processing method |
| JP5464244B2 (en)* | 2012-08-24 | 2014-04-09 | 富士ゼロックス株式会社 | Image processing apparatus, program, and image processing system |
| CN105228749B (en) | 2013-03-13 | 2018-03-27 | 塔霍农村卫生研究所有限公司 | Portable blood cell count monitor |
| DE102013103971A1 (en)* | 2013-04-19 | 2014-11-06 | Sensovation Ag | Method for generating an overall picture of an object composed of several partial images |
| US10330910B2 (en)* | 2013-04-26 | 2019-06-25 | Hamamatsu Photonics K.K. | Image acquisition device and method and system for acquiring focusing information for specimen |
| CN103499879A (en)* | 2013-10-16 | 2014-01-08 | 北京航空航天大学 | Method of acquiring microscopic image with super field depth |
| CN103529543A (en)* | 2013-10-16 | 2014-01-22 | 北京航空航天大学 | Automatic microscope focusing method |
| US9453995B2 (en) | 2013-12-03 | 2016-09-27 | Lloyd Douglas Clark | Electronically variable illumination filter for microscopy |
| US9658444B2 (en)* | 2013-12-18 | 2017-05-23 | National Security Technologies, Llc | Autofocus system and autofocus method for focusing on a surface |
| JP6194791B2 (en) | 2013-12-27 | 2017-09-13 | 富士ゼロックス株式会社 | Image processing apparatus and program |
| US10252466B2 (en)* | 2014-07-28 | 2019-04-09 | Massachusetts Institute Of Technology | Systems and methods of machine vision assisted additive fabrication |
| EP3201311A4 (en) | 2014-09-29 | 2018-06-20 | Chipcare Corporation | A device for optical detection of cells comprising a cartridge and fluidic chip and methods thereof |
| US20170328924A1 (en) | 2014-11-26 | 2017-11-16 | Ronald Jones | Automated microscopic cell analysis |
| US11478789B2 (en) | 2014-11-26 | 2022-10-25 | Medica Corporation | Automated microscopic cell analysis |
| US20160202460A1 (en) | 2015-01-13 | 2016-07-14 | University Of Connecticut | 3D Microscopy With Illumination Engineering |
| JP6461739B2 (en) | 2015-07-28 | 2019-01-30 | 富士フイルム株式会社 | Image processing apparatus, endoscope system, and method of operating image processing apparatus |
| US10281386B2 (en) | 2016-05-11 | 2019-05-07 | Bonraybio Co., Ltd. | Automated testing apparatus |
| EP3482189B1 (en) | 2016-07-08 | 2025-02-26 | Medica Corporation | Automated microscopic cell analysis |
| CN107290846B (en) | 2017-08-04 | 2019-06-21 | 南京理工大学 | Quantitative phase microscopy imaging method based on annular programmable LED illumination |
| WO2019035084A1 (en) | 2017-08-17 | 2019-02-21 | Abbott Point Of Care Inc. | A single-use test device for imaging blood cells |
| JP6505792B2 (en) | 2017-08-29 | 2019-04-24 | 富士フイルム株式会社 | LIGHT SOURCE DEVICE FOR ENDOSCOPE AND ENDOSCOPE SYSTEM |
| WO2019102277A1 (en) | 2017-11-23 | 2019-05-31 | Sigtuple Technologies Private Limited | Method and system for determining hematological parameters in a peripheral blood smear |
| WO2019198094A1 (en) | 2018-04-09 | 2019-10-17 | Sigtuple Technologies Private Limited | Method and system for estimating total count of blood cells in a blood smear |
| JP7678424B2 (en) | 2018-05-10 | 2025-05-16 | 学校法人順天堂 | Image analysis method, device, computer program, and method for generating deep learning algorithm |
| BR112022007708A2 (en) | 2019-10-22 | 2022-07-12 | S D Sight Diagnostics Ltd | ACCOUNTING OF ERRORS IN OPTICAL MEASUREMENTS |
- 2015
- 2015-08-27EPEP15778059.4Apatent/EP3186778B1/enactiveActive
- 2015-08-27CNCN201580058510.7Apatent/CN107077732B/enactiveActive
- 2015-08-27WOPCT/IL2015/050864patent/WO2016030897A1/enactiveApplication Filing
- 2015-08-27USUS15/506,997patent/US10482595B2/enactiveActive
- 2019
- 2019-10-03USUS16/592,335patent/US11100637B2/enactiveActive
- 2021
- 2021-06-29USUS17/362,009patent/US11721018B2/enactiveActive
- 2023
- 2023-06-27USUS18/214,568patent/US12387328B2/enactiveActive
Patent Citations (319)
| Publication number | Priority date | Publication date | Assignee | Title |
|---|---|---|---|---|
| US3603156A (en) | 1970-02-04 | 1971-09-07 | Gradko Glass Lab Inc | Disposable dilution system |
| US3676076A (en) | 1970-09-24 | 1972-07-11 | Gradko Glass Lab Inc | Disposable container |
| US3786184A (en)* | 1971-02-05 | 1974-01-15 | Image Analysing Computers Ltd | Focusing |
| US3967056A (en) | 1973-02-26 | 1976-06-29 | Minolta Camera Kabushiki Kaisha | Automatic focusing apparatus |
| US4076419A (en) | 1976-07-12 | 1978-02-28 | Kleker Richard G | Method and apparatus for hematology |
| US4209548A (en) | 1976-11-01 | 1980-06-24 | Rush-Presbyterian-St. Luke's Medical Center | Method for the preparation of blood samples for automated analysis |
| US4350884A (en) | 1979-03-20 | 1982-09-21 | Kernforschungszentrum Karlsruhe Gesellschaft Mit Beschrankter Haftung | Automatic focusing of every image point in an image |
| EP0073551A2 (en) | 1981-08-27 | 1983-03-09 | Becton Dickinson and Company | Sample collection container |
| US4454235A (en) | 1982-06-01 | 1984-06-12 | Miles Laboratories, Inc. | Capillary tube holder for liquid transfer in immunoassay |
| US4494479A (en) | 1982-10-14 | 1985-01-22 | Coulter Electronics, Inc. | Slide preparation apparatus |
| US4580895A (en) | 1983-10-28 | 1986-04-08 | Dynatech Laboratories, Incorporated | Sample-scanning photometer |
| US4700298A (en) | 1984-09-14 | 1987-10-13 | Branko Palcic | Dynamic microscope image processing scanner |
| JPS61198204A (en) | 1985-02-28 | 1986-09-02 | Disco Abrasive Sys Ltd | Microscope autofocus method |
| US5300779A (en) | 1985-08-05 | 1994-04-05 | Biotrack, Inc. | Capillary flow device |
| US4761381A (en) | 1985-09-18 | 1988-08-02 | Miles Inc. | Volume metering capillary gap device for applying a liquid sample onto a reactive surface |
| US4803352A (en) | 1986-05-16 | 1989-02-07 | Fritz Bierleutgeb | Autofocusing system for a microscope and method of using the same |
| US4902101A (en) | 1986-10-16 | 1990-02-20 | Olympus Optical Co., Ltd. | Automatic focusing method |
| US4774192A (en) | 1987-01-28 | 1988-09-27 | Technimed Corporation | A dry reagent delivery system with membrane having porosity gradient |
| US4849340A (en) | 1987-04-03 | 1989-07-18 | Cardiovascular Diagnostics, Inc. | Reaction system element and method for performing prothrombin time assay |
| US5001067A (en) | 1989-09-18 | 1991-03-19 | Nova Biomedical Corporation | Determining the concentration of water soluble species in biological fluid |
| US5064282A (en) | 1989-09-26 | 1991-11-12 | Artel, Inc. | Photometric apparatus and method for measuring hemoglobin |
| US5229265A (en) | 1990-03-13 | 1993-07-20 | Litron Laboratories | Process for analyzing clastogenic agents |
| EP0479231A1 (en) | 1990-10-01 | 1992-04-08 | Canon Kabushiki Kaisha | Apparatus and method for measuring specimen |
| US5331958A (en) | 1992-03-31 | 1994-07-26 | University Of Manitoba | Spectrophotometric blood analysis |
| US5430542A (en) | 1992-04-10 | 1995-07-04 | Avox Systems, Inc. | Disposable optical cuvette |
| US6262798B1 (en) | 1992-09-29 | 2001-07-17 | Board Of Regents, The University Of Texas System | Method and apparatus for direct spectrophotometric measurements in unaltered whole blood |
| US5834217A (en) | 1992-10-30 | 1998-11-10 | Becton Dickinson And Co. | Assay of blood or other biologic samples for target analytes |
| US5672861A (en) | 1994-01-18 | 1997-09-30 | Ultrapointe Corporation | Method and apparatus for automatic focusing of a confocal laser microscope |
| US5782770A (en) | 1994-05-12 | 1998-07-21 | Science Applications International Corporation | Hyperspectral imaging methods and apparatus for non-invasive diagnosis of tissue for cancer |
| US5745804A (en) | 1994-05-31 | 1998-04-28 | Nikon Corporation | Automatic focus device |
| US5932872A (en) | 1994-07-01 | 1999-08-03 | Jeffrey H. Price | Autofocus system for scanning microscopy having a volume image formation |
| WO1996001438A1 (en) | 1994-07-01 | 1996-01-18 | Price Jeffrey H | Autofocus system for scanning microscopy |
| WO1996012981A1 (en) | 1994-10-21 | 1996-05-02 | Kla Instruments Corporation | Autofocusing apparatus and method for high resolution microscope system |
| US5674457A (en) | 1995-04-21 | 1997-10-07 | Hemocue Ab | Capillary microcuvette |
| US5985595A (en) | 1995-06-07 | 1999-11-16 | The University Of Connecticut | Early detection of Borrelia infection |
| US6101404A (en) | 1996-05-23 | 2000-08-08 | Samsung Electronics Co., Ltd. | Optical diagnosis point detector for noninvasive diagnosis of blood constituents and noninvasive diagnostic device |
| US8363221B2 (en) | 1997-05-05 | 2013-01-29 | Chemometec A/S | Method and a system for determination of particles in a liquid sample |
| US6074879A (en) | 1997-06-23 | 2000-06-13 | Bayer Corporation | Synthetic polymer particles for use as standards and calibrators in flow cytometry |
| JPH1173903A (en) | 1997-08-28 | 1999-03-16 | Jeol Ltd | Autofocus method for scanning electron microscope |
| US6064474A (en) | 1998-02-06 | 2000-05-16 | Optical Sensors, Inc. | Optical measurement of blood hematocrit incorporating a self-calibration algorithm |
| US20020028471A1 (en) | 1998-02-20 | 2002-03-07 | Oberhardt Bruce J. | Cell analysis methods and apparatus |
| US20080187466A1 (en) | 1998-03-07 | 2008-08-07 | Wardlaw Stephen C | Container for holding biologic fluid for analysis |
| US5948686A (en) | 1998-03-07 | 1999-09-07 | Robert A. Leuine | Method for performing blood cell counts |
| US6866823B2 (en) | 1998-03-07 | 2005-03-15 | Robert A. Levine | Apparatus for analyzing biologic fluids |
| US6929953B1 (en) | 1998-03-07 | 2005-08-16 | Robert A. Levine | Apparatus for analyzing biologic fluids |
| US6350613B1 (en) | 1998-03-07 | 2002-02-26 | Belton Dickinson & Co. | Determination of white blood cell differential and reticulocyte counts |
| US20020028158A1 (en) | 1998-03-07 | 2002-03-07 | Wardlaw Stephen C. | Apparatus for analyzing biologic fluids |
| US6027695A (en) | 1998-04-01 | 2000-02-22 | Dupont Pharmaceuticals Company | Apparatus for holding small volumes of liquids |
| US20030017085A1 (en) | 1998-08-10 | 2003-01-23 | Caliper Technologies Corp. | High throughput microfluidic systems and methods |
| US6320979B1 (en) | 1998-10-06 | 2001-11-20 | Canon Kabushiki Kaisha | Depth of field enhancement |
| JP2000199845A (en) | 1999-01-05 | 2000-07-18 | Ricoh Co Ltd | Automatic focusing device and automatic focusing method |
| WO2000055572A1 (en) | 1999-03-18 | 2000-09-21 | Zetetic Institute | Multiple layer confocal interference microscopy using wavenumber domain reflectometry and background amplitude reduction and compensation |
| US6582964B1 (en) | 1999-05-12 | 2003-06-24 | Cme Telemetrix Inc. | Method and apparatus for rapid measurement of HbA1c |
| US7034883B1 (en) | 1999-08-10 | 2006-04-25 | Cellavision Ab | Automatic focusing |
| US6711516B2 (en) | 1999-11-23 | 2004-03-23 | Spectromedical Inc. | Method for calibrating spectrophotometric apparatus |
| US6611777B2 (en) | 1999-11-23 | 2003-08-26 | James Samsoondar | Method for calibrating spectrophotometric apparatus |
| US20020009711A1 (en) | 2000-01-06 | 2002-01-24 | Wada H. Garrett | Methods and systems for monitoring intracellular binding reactions |
| US6836559B2 (en) | 2000-03-09 | 2004-12-28 | The Regents Of The University Of California | Automated video-microscopic imaging and data acquisition system for colloid deposition measurements |
| US7274810B2 (en) | 2000-04-11 | 2007-09-25 | Cornell Research Foundation, Inc. | System and method for three-dimensional image rendering and analysis |
| US8165385B2 (en) | 2000-04-11 | 2012-04-24 | Cornell Research Foundation, Inc. | System and method for three-dimensional image rendering and analysis |
| US7668362B2 (en)* | 2000-05-03 | 2010-02-23 | Aperio Technologies, Inc. | System and method for assessing virtual slide image quality |
| US20040170312A1 (en) | 2000-05-03 | 2004-09-02 | Soenksen Dirk G. | Fully automatic rapid microscope slide scanner |
| US6554788B1 (en) | 2000-06-02 | 2003-04-29 | Cobe Cardiovascular, Inc. | Hematocrit sampling system |
| US6834237B2 (en) | 2000-06-02 | 2004-12-21 | Medicometrics Aps | Method and system for classifying a biological sample |
| US6632681B1 (en) | 2000-07-24 | 2003-10-14 | Ey Laboratories | Reagent delivery device and method of use |
| US7911617B2 (en) | 2000-08-02 | 2011-03-22 | Honeywell International Inc. | Miniaturized cytometer for detecting multiple species in a sample |
| US7630063B2 (en) | 2000-08-02 | 2009-12-08 | Honeywell International Inc. | Miniaturized cytometer for detecting multiple species in a sample |
| US6819408B1 (en) | 2000-09-27 | 2004-11-16 | Becton, Dickinson And Company | Method for obtaining a monolayer of desired particles in a liquid sample |
| US6448024B1 (en) | 2000-10-03 | 2002-09-10 | Roche Diagnostics Corporation | Method, reagent, cartridge, and device for determining fibrinogen |
| US20120021951A1 (en) | 2000-10-10 | 2012-01-26 | Life Technologies Corporation | Apparatus for Assay, Synthesis and Storage, and Methods of Manufacture, Use, and Manipulation Thereof |
| US7027628B1 (en)* | 2000-11-14 | 2006-04-11 | The United States Of America As Represented By The Department Of Health And Human Services | Automated microscopic image acquisition, compositing, and display |
| US7305109B1 (en)* | 2000-11-14 | 2007-12-04 | The Government of the United States of America as represented by the Secretary of Health and Human Services, Centers for Disease Control and Prevention | Automated microscopic image acquisition compositing, and display |
| US7155049B2 (en)* | 2001-01-11 | 2006-12-26 | Trestle Acquisition Corp. | System for creating microscopic digital montage images |
| US6956650B2 (en) | 2001-01-12 | 2005-10-18 | General Hospital Corporation | System and method for enabling simultaneous calibration and imaging of a medium |
| US20030227673A1 (en)* | 2001-03-01 | 2003-12-11 | Olympus Optical Co., Ltd. | System and method for controlling microscope |
| EP1381229A1 (en) | 2001-03-30 | 2004-01-14 | National Institute of Advanced Industrial Science and Technology | Real-time omnifocus microscope camera |
| US7105795B2 (en) | 2001-07-06 | 2006-09-12 | Palantyr Research, Llc | Imaging system, methodology, and applications employing reciprocal space optical design |
| US7248716B2 (en) | 2001-07-06 | 2007-07-24 | Palantyr Research, Llc | Imaging system, methodology, and applications employing reciprocal space optical design |
| US7692131B2 (en) | 2001-07-06 | 2010-04-06 | Palantyr Research, Llc | Imaging system and methodology with projected pixels mapped to the diffraction limited spot |
| US7439478B2 (en) | 2001-07-06 | 2008-10-21 | Palantyr Research, Llc | Imaging system, methodology, and applications employing reciprocal space optical design having at least one pixel being scaled to about a size of a diffraction-limited spot defined by a microscopic optical system |
| US7132636B1 (en) | 2001-07-06 | 2006-11-07 | Palantyr Research, Llc | Imaging system and methodology employing reciprocal space optical design |
| US7385168B2 (en) | 2001-07-06 | 2008-06-10 | Palantyr Research, Llc | Imaging system, methodology, and applications employing reciprocal space optical design |
| US7601938B2 (en) | 2001-07-06 | 2009-10-13 | Palantyr Research, Llc | Imaging system, methodology, and applications employing reciprocal space optical design |
| US7288751B2 (en) | 2001-07-06 | 2007-10-30 | Palantyr Research, Llc | Imaging system, methodology, and applications employing reciprocal space optical design |
| US7863552B2 (en) | 2001-07-06 | 2011-01-04 | Palantyr Research Llc | Digital images and related methodologies |
| US7151246B2 (en) | 2001-07-06 | 2006-12-19 | Palantyr Research, Llc | Imaging system and methodology |
| US6664528B1 (en) | 2001-07-06 | 2003-12-16 | Palantyr Research, Llc | Imaging system and methodology employing reciprocal space optical design |
| US7338168B2 (en) | 2001-07-06 | 2008-03-04 | Palantyr Research, Llc | Particle analyzing system and methodology |
| US6903323B2 (en) | 2001-07-06 | 2005-06-07 | Palantyr Research, Llc | Imaging system and methodology employing reciprocal space optical design |
| US6842233B2 (en) | 2001-07-26 | 2005-01-11 | Sysmex Corporation | Method of classifying particles on two-dimensional frequency distribution map and blood analyzer utilizing the same |
| US9404852B2 (en) | 2001-11-08 | 2016-08-02 | Optiscan Biomedical Corporation | Analyte monitoring systems and methods |
| US6989891B2 (en) | 2001-11-08 | 2006-01-24 | Optiscan Biomedical Corporation | Device and method for in vitro determination of analyte concentrations within body fluids |
| US6949384B2 (en) | 2001-12-21 | 2005-09-27 | Spectromedical Inc. | Method for monitoring degradation of Hb-based blood substitutes |
| EP1698883A1 (en) | 2001-12-28 | 2006-09-06 | Hemocue AB | Method of determining hemoglobin concentration in undiluted and unhemolyzed whole blood |
| WO2003056327A1 (en) | 2001-12-28 | 2003-07-10 | Hemocue Ab | Method for quantitative hemoglobin determination in undiluted unhemolyzed whole blood |
| US6831733B2 (en) | 2001-12-28 | 2004-12-14 | Hemocue Ab | Analysis method and system therefor |
| US7713474B2 (en) | 2002-01-15 | 2010-05-11 | Siemens Healthcare Diagnostics Inc. | Liquid permeable composition in dry reagent devices |
| US7602954B2 (en) | 2002-01-24 | 2009-10-13 | Tripath Imaging, Inc. | Method for quantitative video-microscopy and associated system and computer software program product |
| US7133547B2 (en) | 2002-01-24 | 2006-11-07 | Tripath Imaging, Inc. | Method for quantitative video-microscopy and associated system and computer software program product |
| WO2003073365A1 (en) | 2002-02-22 | 2003-09-04 | Bacus Research Laboratories, Inc. | Focusable virtual microscopy apparatus and method |
| US20030161514A1 (en) | 2002-02-28 | 2003-08-28 | Curry Bo U. | Bi-directional scanner control system |
| WO2003081525A1 (en) | 2002-03-21 | 2003-10-02 | Endress + Hauser Wetzer Gmbh + Co. Kg | Device for identifying a sampler container |
| US20030197925A1 (en) | 2002-04-18 | 2003-10-23 | Leica Microsystems Wetzlar Gmbh | Autofocus method for a microscope, and system for adjusting the focus for a microscope |
| US6658143B2 (en) | 2002-04-29 | 2003-12-02 | Amersham Biosciences Corp. | Ray-based image analysis for biological specimens |
| US20030224522A1 (en) | 2002-05-01 | 2003-12-04 | De Jong Gary | Methods for delivering nucleic acid molecules into cells and assessment thereof |
| US20030227612A1 (en) | 2002-06-10 | 2003-12-11 | Howard Fein | Imaging system for examining biological material |
| US20040240050A1 (en) | 2002-07-30 | 2004-12-02 | Nikon Corporation | Microscope system |
| US7765069B2 (en) | 2002-10-18 | 2010-07-27 | Abaxis, Inc. | Systems for the detection of short and long samples |
| US7460222B2 (en) | 2002-11-22 | 2008-12-02 | Roche Diagnostics Operations, Inc. | Measuring device for the optical analysis of a test strip |
| US20040132171A1 (en) | 2003-01-06 | 2004-07-08 | Peter Rule | Wearable device for measuring analyte concentration |
| US20040218804A1 (en) | 2003-01-31 | 2004-11-04 | Affleck Rhett L. | Image analysis system and method |
| JP2004257768A (en) | 2003-02-24 | 2004-09-16 | Horiba Ltd | Micro blood cell counter |
| US20040185447A1 (en) | 2003-03-20 | 2004-09-23 | Coulter International Corp. | Dye compositions which provide enhanced differential fluorescence and light scatter characteristics |
| US7346205B2 (en) | 2003-03-27 | 2008-03-18 | Bartron Medical Imaging, Llc | System and method for rapidly identifying pathogens, bacteria and abnormal cells |
| US20070054350A1 (en) | 2003-03-27 | 2007-03-08 | Walker Fitz Jr | System and method for rapidly identifying pathogens, bacteria and abnormal cells |
| US6872930B2 (en) | 2003-03-31 | 2005-03-29 | Palantyr Research, Llc | Imaging system and methodology employing reciprocal space optical design |
| US7369696B2 (en) | 2003-04-02 | 2008-05-06 | Ge Healthcare Uk Limited | Classification of cells into subpopulations using cell classifying data |
| US7706862B2 (en) | 2003-04-17 | 2010-04-27 | Research Foundation Of The City University Of New York | Detecting human cancer through spectral optical imaging using key water absorption wavelengths |
| US7329537B2 (en) | 2003-04-17 | 2008-02-12 | Nexcelom Bioscience, Llc | Micro-pattern embedded plastic optical film device for cell-based assays |
| US7324694B2 (en) | 2003-05-23 | 2008-01-29 | International Remote Imaging Systems, Inc. | Fluid sample analysis using class weights |
| US20040241677A1 (en) | 2003-05-29 | 2004-12-02 | Lin Jeffrey S | Techniques for automated diagnosis of cell-borne anomalies with digital optical microscope |
| WO2004111610A2 (en) | 2003-06-12 | 2004-12-23 | Accupath Diagnostic Laboratories, Inc. | Method and system for the analysis of high density cells samples |
| US20060223165A1 (en) | 2003-07-18 | 2006-10-05 | Digital Bio Technology | Device for counting cells and method for manufacturing the same |
| US7411680B2 (en) | 2003-07-19 | 2008-08-12 | Digital Bio Technology | Device for counting micro particles |
| US20060187442A1 (en) | 2003-07-19 | 2006-08-24 | Digital Bio Technology | Device for counting micro particles |
| US7450762B2 (en) | 2003-07-21 | 2008-11-11 | Cellavision Ab | Method and arrangement for determining an object contour |
| US20050089208A1 (en)* | 2003-07-22 | 2005-04-28 | Rui-Tao Dong | System and method for generating digital images of a microscope slide |
| US7998435B2 (en) | 2003-09-19 | 2011-08-16 | Life Technologies Corporation | High density plate filler |
| US20090191098A1 (en) | 2003-09-19 | 2009-07-30 | Life Technologies Corporation | High Density Plate Filler |
| US7697764B2 (en) | 2003-11-21 | 2010-04-13 | National University Corporation Kochi University | Similar pattern searching apparatus, method of similar pattern searching, program for similar pattern searching, and fractionation apparatus |
| US20050109959A1 (en) | 2003-11-24 | 2005-05-26 | Mitutoyo Corporation | Systems and methods for rapidly automatically focusing a machine vision inspection system |
| US7030351B2 (en) | 2003-11-24 | 2006-04-18 | Mitutoyo Corporation | Systems and methods for rapidly automatically focusing a machine vision inspection system |
| US7283217B2 (en) | 2004-03-11 | 2007-10-16 | Sysmex Corporation | Sample analyzer and computer product |
| US7633604B2 (en) | 2004-03-11 | 2009-12-15 | Sysmex Corporation | Sample analyzer and computer program product |
| US7450223B2 (en) | 2004-03-11 | 2008-11-11 | Sysmex Corporation | Sample analyzer |
| US8105554B2 (en) | 2004-03-12 | 2012-01-31 | Life Technologies Corporation | Nanoliter array loading |
| US7925070B2 (en) | 2004-03-30 | 2011-04-12 | Sysmex Corporation | Method for displaying virtual slide and terminal device for displaying virtual slide |
| US20070243117A1 (en) | 2004-04-07 | 2007-10-18 | Wardlaw Stephen C | Disposable Chamber for Analyzing Biologic Fluids |
| WO2005121863A1 (en) | 2004-06-11 | 2005-12-22 | Nicholas Etienne Ross | Automated diagnosis of malaria and other infections |
| US20070252984A1 (en) | 2004-06-17 | 2007-11-01 | Koninklijke Philips Electronics N.V. | Autofocus Mechanism for Spectroscopic System |
| US20050286800A1 (en) | 2004-06-24 | 2005-12-29 | Fujifilm Electronic Imaging Ltd. | Method and apparatus for forming a multiple focus stack image |
| US7702181B2 (en) | 2004-06-24 | 2010-04-20 | Ffei Limited | Method and apparatus for forming a multiple focus stack image |
| US8582924B2 (en) | 2004-06-30 | 2013-11-12 | Carl Zeiss Microimaging Gmbh | Data structure of an image storage and retrieval system |
| US20060045505A1 (en)* | 2004-08-31 | 2006-03-02 | Zeineh Jack A | System and method for creating magnified images of a microscope slide |
| US20060063185A1 (en) | 2004-09-09 | 2006-03-23 | Edouard Vannier | Methods for detection of pathogens in red blood cells |
| US7663738B2 (en) | 2004-10-11 | 2010-02-16 | Thermo Fisher Scientific Oy | Method for automatically detecting factors that disturb analysis by a photometer |
| US8045782B2 (en) | 2004-12-07 | 2011-10-25 | Ge Healthcare Niagara, Inc. | Method of, and apparatus and computer software for, implementing image analysis protocols |
| US8184273B2 (en) | 2004-12-13 | 2012-05-22 | Bayer Healthcare Llc | Method of determining glucose concentration of a whole blood sample |
| US7869009B2 (en) | 2004-12-13 | 2011-01-11 | Bayer Healthcare Llc | Method for determining an analyte concentration in a fluid |
| US7787109B2 (en) | 2004-12-13 | 2010-08-31 | Bayer Healthcare Llc | Transmission spectroscopy system for use in the determination of analytes in body fluid |
| US20090258347A1 (en) | 2004-12-14 | 2009-10-15 | University Of The Witwatersrand | Method for diagnosing and monitoring cellular reservoirs of disease |
| US20060223052A1 (en) | 2005-03-30 | 2006-10-05 | Kimberly-Clark Worldwide, Inc. | Technique for detecting microorganisms |
| US7894047B2 (en) | 2005-04-07 | 2011-02-22 | Sysmex Corporation | Blood analyzer, sample analyzer, and flow cytometer |
| US7580120B2 (en) | 2005-04-07 | 2009-08-25 | Sysmex Corporation | Blood analyzer, sample analyzer, and flow cytometer |
| US8044974B2 (en) | 2005-04-20 | 2011-10-25 | Sysmex Corporation | Image creating apparatus and image creating method |
| JP2006301270A (en) | 2005-04-20 | 2006-11-02 | Hitachi Kokusai Electric Inc | Autofocus device and autofocus method |
| US7777869B2 (en) | 2005-04-21 | 2010-08-17 | Horiba Abx Sas | Device and method for multiparametric analysis of microscopic elements |
| WO2006121266A1 (en) | 2005-05-06 | 2006-11-16 | Jae Chern Yoo | Digital bio disc(dbd), dbd driver apparatus, and assay method using the same |
| US8064680B2 (en) | 2005-06-15 | 2011-11-22 | Tissue Gnostics Gmbh | Process for segmenting leukocytes |
| US7417213B2 (en) | 2005-06-22 | 2008-08-26 | Tripath Imaging, Inc. | Apparatus and method for rapid microscopic image focusing having a movable objective |
| US20080273776A1 (en) | 2005-06-22 | 2008-11-06 | Tripath Imaging, Inc. | Apparatus and Method for Rapid Microscopic Image Focusing |
| US7605356B2 (en) | 2005-06-22 | 2009-10-20 | Tripath Imaging, Inc. | Apparatus and method for rapid microscopic image focusing |
| US7638748B2 (en) | 2005-06-22 | 2009-12-29 | TriPath Imaging | Method of capturing a focused image of a movable slide via an objective of a microscopy device |
| US20090066934A1 (en) | 2005-07-14 | 2009-03-12 | Johnway Gao | Optical devices for biological and chemical detection |
| US20100265323A1 (en) | 2005-08-02 | 2010-10-21 | Perz Cynthia B | System for and method of focusing in automated microscope systems |
| US8000511B2 (en) | 2005-08-02 | 2011-08-16 | Carl Zeiss Microimaging Gmbh | System for and method of focusing in automated microscope systems |
| JP2007040814A (en) | 2005-08-03 | 2007-02-15 | Matsushita Electric Ind Co Ltd | Absorbance measurement sensor and absorbance measurement method |
| US20100152054A1 (en) | 2005-09-16 | 2010-06-17 | Love J Christopher | Screening assays and methods |
| US7609369B2 (en) | 2005-09-24 | 2009-10-27 | Beckman Coulter, Inc. | Methods of detection of iron deficiency and hemochromatosis |
| US8154713B2 (en) | 2005-09-24 | 2012-04-10 | Beckman Coulter, Inc. | Methods of determination of iron deficiency and hemochromatosis |
| US7599893B2 (en) | 2005-10-13 | 2009-10-06 | Aureon Laboratories, Inc. | Methods and systems for feature selection in machine learning based on feature contribution and model fitness |
| US8131052B2 (en) | 2005-10-20 | 2012-03-06 | Ge Healthcare Uk Limited | Method of processing an image |
| US7344890B2 (en) | 2005-11-09 | 2008-03-18 | Beckman Coulter, Inc. | Method for discriminating platelets from red blood cells |
| US7933435B2 (en) | 2005-11-21 | 2011-04-26 | Vala Sciences, Inc. | System, method, and kit for processing a magnified image of biological material to identify components of a biological object |
| US8150114B2 (en) | 2006-01-25 | 2012-04-03 | Hemocue Ab | Method for ensuring quality of a sample carrier |
| US20090075324A1 (en) | 2006-05-05 | 2009-03-19 | Hemocue Ab | Method and System for Quantitative Hemoglobin Determination |
| US8175353B2 (en) | 2006-07-06 | 2012-05-08 | Carl Zeiss Meditec Ag | Method and device for producing an image of a thin layer of an object |
| CA2655024C (en) | 2006-07-19 | 2014-11-18 | Hemocue Ab | Measurement apparatus for enumeration of white blood cells and related method |
| US8224058B2 (en) | 2006-07-19 | 2012-07-17 | Hemocue Ab | Measurement apparatus, method and computer program |
| US20080020128A1 (en)* | 2006-07-24 | 2008-01-24 | Van Ryper William John | Automated microscope for blood cell analysis |
| US8428331B2 (en) | 2006-08-07 | 2013-04-23 | Northeastern University | Phase subtraction cell counting method |
| WO2008063135A1 (en) | 2006-11-24 | 2008-05-29 | Agency For Science, Technology And Research | Apparatus for processing a sample in a liquid droplet and method of using the same |
| US20100112631A1 (en) | 2007-01-09 | 2010-05-06 | Digital Bio Technology | Chip Having Microchannel For Counting Specific Micro Particles Among Floating Micro Particle Mixture By Optical Means And A Method For Counting Micro Particles Using The Same |
| US8526704B2 (en) | 2007-01-11 | 2013-09-03 | Intellectual Property Mvm B.V. | Measurement of functional microcirculatory geometry and velocity distributions using automated image analysis |
| US20080212069A1 (en) | 2007-01-26 | 2008-09-04 | Becton, Dickinson And Company | Method, system, and compositions for cell counting and analysis |
| US8877458B2 (en) | 2007-02-02 | 2014-11-04 | Canadian Blood Services | Method of detecting bacterial contamination using dynamic light scattering |
| US8131035B2 (en) | 2007-02-05 | 2012-03-06 | Siemens Healthcare Diagnostics Inc. | Cell analysis using isoperimetric graph partitioning |
| US7747153B2 (en) | 2007-04-19 | 2010-06-29 | Canon Kabushiki Kaisha | Camera having an image blur reducing function and rotation means |
| US20080305514A1 (en) | 2007-06-06 | 2008-12-11 | Alcon Research, Ltd. | Method for detecting microbes |
| US20110030458A1 (en) | 2007-07-23 | 2011-02-10 | Digital Bio Technology Co., Ltd. | Chip for analyzing fluids |
| US8216832B2 (en) | 2007-07-31 | 2012-07-10 | Micronics, Inc. | Sanitary swab collection system, microfluidic assay device, and methods for diagnostic assays |
| US7936913B2 (en) | 2007-08-07 | 2011-05-03 | Nextslide Imaging Llc | Network image review in clinical hematology |
| US8878923B2 (en) | 2007-08-23 | 2014-11-04 | General Electric Company | System and method for enhanced predictive autofocusing |
| US20090195688A1 (en) | 2007-08-23 | 2009-08-06 | General Electric Company | System and Method for Enhanced Predictive Autofocusing |
| US8055471B2 (en) | 2007-09-13 | 2011-11-08 | Shenzhen Mindray Bio-Medical Electronics Co., Ltd. | Method of discriminating particle groups and particle analyzer |
| US7493219B1 (en) | 2007-09-13 | 2009-02-17 | Shenzhen Mindray Bio-Medical Electronics Co. | Method of discriminating particle groups and particle analyzer |
| US20100254596A1 (en)* | 2007-09-26 | 2010-10-07 | Wei Xiong | Method and system for generating an entirely well-focused image of a large three-dimensional scene |
| US7995200B2 (en) | 2007-10-26 | 2011-08-09 | Arkray, Inc. | Analyzer |
| US8491499B2 (en) | 2007-11-12 | 2013-07-23 | Boditechmed Inc | Biological fluid sampling and pretreating system and a method thereof |
| US20110009163A1 (en) | 2008-01-02 | 2011-01-13 | The Regents Of The University Of California | High numerical aperture telemicroscopy apparatus |
| US20090185734A1 (en) | 2008-01-18 | 2009-07-23 | Hemocue Ab | Apparatus and method for analysis of particles in a liquid sample |
| US20090213214A1 (en)* | 2008-01-23 | 2009-08-27 | Tatsuki Yamada | Microscope System, Image Generating Method, and Program for Practising the Same |
| US7951599B2 (en) | 2008-03-21 | 2011-05-31 | Abbott Point Of Care, Inc. | Method and apparatus for determining the hematocrit of a blood sample utilizing the intrinsic pigmentation of hemoglobin contained within the red blood cells |
| US8778687B2 (en) | 2008-03-21 | 2014-07-15 | Abbott Point Of Care, Inc. | Method and apparatus for determining the hematocrit of a blood sample utilizing the intrinsic pigmentation of hemoglobin contained within the red blood cells |
| US8081303B2 (en) | 2008-03-21 | 2011-12-20 | Abbott Point Of Care, Inc. | Method and apparatus for analyzing individual cells or particulates using fluorescent quenching and/or bleaching |
| US8638427B2 (en) | 2008-03-21 | 2014-01-28 | Abbott Point Of Care, Inc. | Method and apparatus for detecting and counting platelets individually and in aggregate clumps |
| US20130176551A1 (en) | 2008-03-21 | 2013-07-11 | Abbott Point Of Care, Inc. | Method and apparatus for detecting and counting platelets individually and in aggregate clumps |
| US8885154B2 (en) | 2008-03-21 | 2014-11-11 | Abbott Point Of Care, Inc. | Method and apparatus for identifying reticulocytes within a blood sample |
| US8269954B2 (en) | 2008-03-21 | 2012-09-18 | Abbott Point Of Care, Inc. | Method and apparatus for analyzing individual cells or particulates using fluorescent quenching and/or bleaching |
| US8077296B2 (en) | 2008-03-21 | 2011-12-13 | Abbott Point Of Care, Inc. | Method and apparatus for detecting and counting platelets individually and in aggregate clumps |
| US8994930B2 (en) | 2008-03-21 | 2015-03-31 | Abbott Point Of Care, Inc. | Method and apparatus for analyzing individual cells or particulates using fluorescent quenching and/or bleaching |
| US8310659B2 (en) | 2008-03-21 | 2012-11-13 | Abbott Point Of Care, Inc. | Method and apparatus for detecting and counting platelets individually and in aggregate clumps |
| US7929121B2 (en) | 2008-03-21 | 2011-04-19 | Abbott Point Of Care, Inc. | Method and apparatus for detecting and counting platelets individually and in aggregate clumps |
| US20110123398A1 (en) | 2008-03-27 | 2011-05-26 | President And Fellows Of Harvard College | Three-dimensional microfluidic devices |
| WO2012030313A1 (en) | 2008-04-25 | 2012-03-08 | James Winkelman | Method of determining a complete blood count and a white blood cell differential count |
| US20090269799A1 (en) | 2008-04-25 | 2009-10-29 | Constitutional Medical Investors, Inc. | Method of determining a complete blood count and a white blood cell differential count |
| US8379944B2 (en) | 2008-04-29 | 2013-02-19 | Siemens Healthcare Diagnostics Inc. | Identification, classification and counting of targets of interest in multispectral image data |
| US8942458B2 (en) | 2008-06-27 | 2015-01-27 | Furukawa Electric Co., Ltd. | Method for distinguishing and sorting of cells and device therefor |
| US8331642B2 (en) | 2008-06-30 | 2012-12-11 | Fraunhofer-Gesellschaft Zur Foerderung Der Angewandten Forschung E.V. | Method and device for determining a contour and a center of an object |
| EP2145684A2 (en) | 2008-07-14 | 2010-01-20 | Samsung Electronics Co., Ltd. | Microfluidic device, sample analyzing method using the same, and dilution ration measuring method |
| US20130273968A1 (en)* | 2008-08-19 | 2013-10-17 | Digimarc Corporation | Methods and systems for content processing |
| US20100120129A1 (en) | 2008-08-27 | 2010-05-13 | Life Technologies Corporation | Apparatus for and method of processing biological samples |
| US9240043B2 (en) | 2008-09-16 | 2016-01-19 | Novartis Ag | Reproducible quantification of biomarker expression |
| US8280134B2 (en) | 2008-09-22 | 2012-10-02 | Cambridge Research & Instrumentation, Inc. | Multi-spectral imaging including at least one common stain |
| US8849024B2 (en) | 2008-09-25 | 2014-09-30 | Nikon Corporation | Image processing device and medium storing image processing program |
| US20100172020A1 (en)* | 2008-10-14 | 2010-07-08 | Burnham Institute For Medical Research | Automated scanning cytometry using chromatic aberrtation for multiplanar image acquisition |
| WO2010056740A1 (en) | 2008-11-13 | 2010-05-20 | Beckman Coulter, Inc. | Method of correction of particle interference to hemoglobin measurement |
| CN101403650A (en) | 2008-11-21 | 2009-04-08 | 北京理工大学 | Differential confocal combination ultra-long focal length measuring method and apparatus |
| US9041792B2 (en) | 2008-11-27 | 2015-05-26 | Koninklijke Philips N.V. | Generation of a multicolour image of an unstained biological specimen |
| US20100157086A1 (en) | 2008-12-15 | 2010-06-24 | Illumina, Inc | Dynamic autofocus method and system for assay imager |
| US9012868B2 (en) | 2009-01-14 | 2015-04-21 | Perkinelmer Singapore Pte Ltd. | Fluorescence microscopy methods and apparatus |
| US20110275111A1 (en) | 2009-01-27 | 2011-11-10 | Koninklijke Philips Electronics N.V. | Microfluidic device for full blood count |
| US20100256918A1 (en) | 2009-03-11 | 2010-10-07 | Industrial Technology Research Institute | Apparatus and method for detection and discrimination molecular object |
| US20120225446A1 (en) | 2009-04-09 | 2012-09-06 | Koninklijke Philips Electronics N.V. | Preparation of thin layers of a fluid containing cells for analysis |
| US9470609B2 (en) | 2009-04-09 | 2016-10-18 | Koninklijke Philips N. V. | Preparation of thin layers of a fluid containing cells for analysis |
| WO2010126903A1 (en) | 2009-04-27 | 2010-11-04 | Constitution Medical Investors, Inc. | Systems and methods for analyzing body fluids |
| US8481303B2 (en) | 2009-10-12 | 2013-07-09 | Corning Incorporated | Microfluidic device for cell culture |
| US8320655B2 (en) | 2009-10-16 | 2012-11-27 | General Electric Company | Process and system for analyzing the expression of biomarkers in cells |
| US20120312957A1 (en) | 2009-10-19 | 2012-12-13 | Loney Gregory L | Imaging system and techniques |
| US20110102571A1 (en)* | 2009-10-29 | 2011-05-05 | Olympus Corporation | Microscope Apparatus and Microscope Observation Method |
| US20120058504A1 (en) | 2009-10-30 | 2012-03-08 | Simon Fraser University | Methods and apparatus for dielectrophoretic shuttling and measurement of single cells or other particles in microfluidic chips |
| US20120120221A1 (en) | 2009-10-30 | 2012-05-17 | Siemens Aktiengesellschaft | Body Fluid Analyzing System and an Imaging Processing Device and Method for Analyzing Body Fluids |
| US20110151502A1 (en) | 2009-12-22 | 2011-06-23 | Abbott Laboratories | Method for performing a blood count and determining the morphology of a blood smear |
| US20110149097A1 (en) | 2009-12-23 | 2011-06-23 | Gaudenz Danuser | System and method for dense-stochastic-sampling imaging |
| US20110178716A1 (en) | 2010-01-15 | 2011-07-21 | Martin Krockenberger | Method for determining volume and hemoglobin content of individual red blood cells |
| US9186843B2 (en) | 2010-01-20 | 2015-11-17 | Nexcelom Bioscience Llc | Cell counting and sample chamber and methods of fabrication |
| US20130130262A1 (en) | 2010-01-29 | 2013-05-23 | C. Frederick Battrell | Sample-to-answer microfluidic cartridge |
| US20110212486A1 (en)* | 2010-02-26 | 2011-09-01 | Olympus Corporation | Microscope System, Specimen Observation Method, and Computer Program Product |
| WO2011123070A1 (en) | 2010-03-31 | 2011-10-06 | Agency For Science, Technology And Research | A method of monitoring parasite development in blood |
| US20110249910A1 (en)* | 2010-04-08 | 2011-10-13 | General Electric Company | Image quality assessment including comparison of overlapped margins |
| US20120002195A1 (en) | 2010-04-30 | 2012-01-05 | General Electric Company | Arc flash detection method |
| WO2011143075A2 (en) | 2010-05-08 | 2011-11-17 | Veridex, Llc | A simple and affordable method for immuophenotyping using a microfluidic chip sample preparation with image cytometry |
| WO2012000102A1 (en) | 2010-06-30 | 2012-01-05 | The Governors Of The University Of Alberta | Apparatus and method for microscope-based label-free microflutdic cytometry |
| US20120030618A1 (en) | 2010-07-08 | 2012-02-02 | Life Technologies Corporation | Systems and methods for assigning attributes to a plurality of samples |
| US20130290225A1 (en) | 2010-07-23 | 2013-10-31 | General Electric Company | Systems and methods for selecting and analyzing particles in a biological tissue |
| US20120044342A1 (en)* | 2010-08-20 | 2012-02-23 | Sakura Finetek U.S.A., Inc. | Digital microscope |
| US8432392B2 (en) | 2010-09-02 | 2013-04-30 | Samsung Electronics Co., Ltd. | Display system with image conversion mechanism and method of operation thereof |
| US8351676B2 (en) | 2010-10-12 | 2013-01-08 | Sony Corporation | Digital image analysis using multi-step analysis |
| US20120092477A1 (en)* | 2010-10-18 | 2012-04-19 | Olympus America Inc. | Wide field microscopic imaging system and method |
| USD655421S1 (en) | 2010-11-03 | 2012-03-06 | Life Technologies Corporation | Cell counter |
| US9050595B2 (en) | 2010-12-03 | 2015-06-09 | Abbott Point Of Care Inc. | Assay devices with integrated sample dilution and dilution verification and methods of using same |
| US20160279633A1 (en) | 2010-12-29 | 2016-09-29 | S.D. Sight Diagnostics Ltd | Apparatus and Method for Analyzing a Bodily Sample |
| US20120169863A1 (en) | 2010-12-29 | 2012-07-05 | Ido Bachelet | Apparatus and method for automatic detection of pathogens |
| WO2012090198A2 (en) | 2010-12-29 | 2012-07-05 | Parasight Ltd | An apparatus and method for automatic detection of pathogens |
| US9522396B2 (en) | 2010-12-29 | 2016-12-20 | S.D. Sight Diagnostics Ltd. | Apparatus and method for automatic detection of pathogens |
| US20130284924A1 (en)* | 2011-01-14 | 2013-10-31 | Hitachi High-Technologies Corporation | Charged particle beam apparatus |
| US8712142B2 (en) | 2011-03-14 | 2014-04-29 | The University Of Warwick | Method and apparatus for analysis of histopathology images and its application to cancer diagnosis and grading |
| WO2012154333A1 (en) | 2011-04-07 | 2012-11-15 | The Uwm Research Foundation, Inc. | High speed microscope with spectral resolution |
| US8345227B2 (en) | 2011-04-15 | 2013-01-01 | Constitution Medical, Inc. | Measuring volume and constituents of cells |
| US8339586B2 (en) | 2011-04-15 | 2012-12-25 | Constitution Medical, Inc. | Measuring volume and constituents of cells |
| US8488111B2 (en) | 2011-04-15 | 2013-07-16 | Constitution Medical, Inc. | Measuring volume and constituents of cells |
| US8477294B2 (en) | 2011-04-15 | 2013-07-02 | Constitution Medical, Inc. | Measuring volume and constituents of cells |
| US20170307496A1 (en) | 2011-04-15 | 2017-10-26 | Roche Diagnostics Hematology, Inc. | Measuring Volume and Constituents of Cells |
| US8922761B2 (en) | 2011-04-15 | 2014-12-30 | Roche Diagnostics Hematology, Inc. | Measuring volume and constituents of cells |
| US9588033B2 (en) | 2011-04-15 | 2017-03-07 | Roche Diagnostics Hematology, Inc. | Measuring volume and constituents of cells |
| US20120320045A1 (en) | 2011-06-20 | 2012-12-20 | Mstar Semiconductor, Inc. | Image Processing Method and Apparatus Thereof |
| US8792693B2 (en) | 2011-07-09 | 2014-07-29 | Gauss Surgical | System and method for estimating extracorporeal blood volume in a physical sample |
| US20180296102A1 (en) | 2011-07-09 | 2018-10-18 | Gauss Surgical, Inc. | Method for estimating a quantity of a blood component in a fluid receiver and corresponding error |
| US20140139625A1 (en) | 2011-07-19 | 2014-05-22 | Ovizio Imaging Systems NV/SA | Method and system for detecting and/or classifying cancerous cells in a cell sample |
| US8964171B2 (en) | 2011-07-22 | 2015-02-24 | Roche Diagnostics Hematology, Inc. | Identifying and measuring reticulocytes |
| US20130023007A1 (en) | 2011-07-22 | 2013-01-24 | Constitution Medical, Inc. | Identifying and measuring reticulocytes |
| US8736824B2 (en) | 2011-08-08 | 2014-05-27 | Sony Corporation | Blood analysis apparatus and blood analysis method |
| US20140205176A1 (en) | 2011-09-22 | 2014-07-24 | Foce Technology International Bv | Optical platelet counter method |
| US9046473B2 (en) | 2011-09-28 | 2015-06-02 | Abbott Point Of Care, Inc. | Method and apparatus for detecting the presence of intraerythrocytic parasites |
| US8570496B2 (en) | 2011-10-20 | 2013-10-29 | Lite-On It Corporation | Optical detection apparatus and optical measurement system |
| US8885912B2 (en) | 2011-11-03 | 2014-11-11 | General Electric Company | Generate percentage of positive cells for biomarkers by normalizing and autothresholding the image intensity produced by immunohistochemistry technique |
| WO2013098821A1 (en) | 2011-12-29 | 2013-07-04 | Parasight Ltd. | Methods and systems for detecting a pathogen in a biological sample |
| US20150037806A1 (en) | 2011-12-29 | 2015-02-05 | Sight Diagnostics Ltd. | Methods and systems for detecting a pathogen in a biological sample |
| US20140186859A1 (en)* | 2012-05-09 | 2014-07-03 | Advanced Animal Diagnostic, Inc. | Autofocus method for imaging a biological sample and cartridge for use therein |
| US8873827B2 (en) | 2012-06-29 | 2014-10-28 | General Electric Company | Determination of spatial proximity between features of interest in biological tissue |
| US8744165B2 (en) | 2012-07-19 | 2014-06-03 | Sony Corporation | Method and apparatus for stain separation in digital pathology images |
| US9934571B2 (en) | 2012-08-23 | 2018-04-03 | Fuji Xerox Co., Ltd. | Image processing device, program, image processing method, computer-readable medium, and image processing system |
| US20150278575A1 (en) | 2012-11-07 | 2015-10-01 | bioMérieux | Bio-imaging method |
| US20140139630A1 (en) | 2012-11-19 | 2014-05-22 | Raytheon Company | Methods and apparatus for imaging without retro-reflection |
| US20150302237A1 (en) | 2012-11-28 | 2015-10-22 | Japan Science And Technology Agency | Cell monitoring device, cell monitoring method and program thereof |
| US9477875B2 (en) | 2012-11-28 | 2016-10-25 | Japan Science And Technology Agency | Cell monitoring device, cell monitoring method and program thereof |
| WO2014159620A1 (en) | 2013-03-14 | 2014-10-02 | Samuels Mark A | Encoded calibration device and systems and methods thereof |
| WO2014188405A1 (en) | 2013-05-23 | 2014-11-27 | Parasight Ltd. | Method and system for imaging a cell sample |
| US10176565B2 (en) | 2013-05-23 | 2019-01-08 | S.D. Sight Diagnostics Ltd. | Method and system for imaging a cell sample |
| US20140347459A1 (en) | 2013-05-23 | 2014-11-27 | Parasight Ltd. | Method and System for Imaging a Cell Sample |
| WO2015001553A1 (en) | 2013-07-01 | 2015-01-08 | Sight Diagnostics Ltd. | A method, kit and system for imaging a blood sample |
| US20150316477A1 (en) | 2013-07-01 | 2015-11-05 | S.D. Sight Diagnostics Ltd. | Method, kit and system for imaging a blood sample |
| US10093957B2 (en) | 2013-07-01 | 2018-10-09 | S.D. Sight Diagnostics Ltd. | Method, kit and system for imaging a blood sample |
| US9329129B2 (en) | 2013-07-01 | 2016-05-03 | S.D. Sight Diagnostics Ltd. | Method, kit and system for imaging a blood sample |
| US20190002950A1 (en) | 2013-07-01 | 2019-01-03 | S.D. Sight Diagnostics Ltd. | Method and system for imaging a blood sample |
| US20160208306A1 (en) | 2013-07-01 | 2016-07-21 | S.D. Sight Diagnostics Ltd. | Method, kit and system for imaging a blood sample |
| WO2015029032A1 (en) | 2013-08-26 | 2015-03-05 | Parasight Ltd. | Digital microscopy systems, methods and computer program products |
| US20160246046A1 (en) | 2013-08-26 | 2016-08-25 | S.D. Sight Diagnostics Ltd. | Digital microscopy systems, methods and computer program products |
| WO2016030897A1 (en) | 2014-08-27 | 2016-03-03 | S.D. Sight Diagnostics Ltd | System and method for calculating focus variation for a digital microscope |
| EP3001174A1 (en) | 2014-09-26 | 2016-03-30 | Sysmex Corporation | Blood analyzer and blood analyzing method |
| US10061972B2 (en) | 2015-05-28 | 2018-08-28 | Tokitae Llc | Image analysis systems and related methods |
| US20170052110A1 (en) | 2015-08-17 | 2017-02-23 | Gerresheimer Regensburg Gmbh | Sampling Apparatus Comprising a Reference Marker |
| US20180246313A1 (en) | 2015-09-17 | 2018-08-30 | S.D. Sight Diagnostics Ltd | Methods and apparatus for detecting an entity in a bodily sample |
| WO2017046799A1 (en) | 2015-09-17 | 2017-03-23 | S.D. Sight Diagnostics Ltd | Methods and apparatus for detecting an entity in a bodily sample |
| US20170160185A1 (en) | 2015-12-02 | 2017-06-08 | Hitachi-Lg Data Storage, Inc. | Optical measurement method and apparatus |
| WO2017168411A1 (en) | 2016-03-30 | 2017-10-05 | S.D. Sight Diagnostics Ltd | Image processing device for identifying blood parasites |
| WO2017195208A1 (en) | 2016-05-11 | 2017-11-16 | S.D. Sight Diagnostics Ltd | Performing optical measurements on a sample |
| WO2017195205A1 (en) | 2016-05-11 | 2017-11-16 | S.D. Sight Diagnostics Ltd | Sample carrier for optical measurements |
| WO2019097387A1 (en) | 2017-11-14 | 2019-05-23 | S.D. Sight Diagnostics Ltd | Sample carrier for optical measurements |
Non-Patent Citations (80)
| Title |
|---|
| A Final Office Action dated Apr. 4, 2019 in U.S. Appl. No. 14/914,329. |
| Agero, U., Mesquita, L.G., Neves, B.R.A., Gazzinelli, R.T. and Mesquita, O.N., 2004. Defocusing microscopy. Microscopy research and technique, 65(3), pp. 159-165. |
| Ahirwar, Neetu, Sapnojit Pattnaik, and Bibhudendra Acharya. "Advanced image analysis based system for automatic detection and classification of malarial parasite in blood images." International Journal of Information Technology and Knowledge Management 5.1 (2012): 59-64. |
| An Automated Microscope for Cytologic Research a Preliminary Evaluation, Brenner et al. [The Journal of Histochemistry and Cytochemistry, vol. 24, No. 1, pp. 100-111, 1976. |
| An International Preliminary Report on Patentability dated Feb. 28, 2017, which issued during the prosecution of Applicant's PCT/IL2015/050864. |
| An International Search Report and a Written Opinion both dated Apr. 18, 2013, which issued during the prosecution of Applicant's PCT/IL2012/050556. |
| An International Search Report and a Written Opinion both dated Feb. 12, 2015, which issued during the prosecution of Applicant's PCT/IL2014/050770. |
| An International Search Report and a Written Opinion both dated Jan. 15, 2016, which issued during the prosecution of Applicant's PCT/IL2015/050864. |
| An International Search Report and a Written Opinion both dated Jan. 23, 2017, which issued during the prosecution of Applicant's PCT/IL2016/051025. |
| An International Search Report and a Written Opinion both dated Oct. 30, 2014, which issued during the prosecution of Applicant's PCT/IL2014/050585. |
| An International Search Report and a Written Opinion both dated Sep. 24, 2014, which issued during the prosecution of Applicant's PCT/IL2014/050423. |
| An International Search Report and Written Opinion dated Apr. 4, 2019 in PCT/IB2018/058861. |
| An Office Action dated Aug. 4, 2017, which issued during the prosecution of U.S. Appl. No. 14/369,251. |
| An Office Action dated Jan. 10, 2018, which issued during the prosecution of U.S. Appl. No. 15/083,610. |
| An Office Action dated Jul. 11, 2017, which issued during the prosecution of U.S. Appl. No. 15/174,672. |
| An Office Action dated Jun. 13, 2017, which issued during the prosecution of U.S. Appl. No. 14/285,672. |
| An Office Action dated Mar. 2, 2017, which issued during the prosecution of U.S. Appl. No. 14/369,251. |
| An Office Action dated Oct. 5, 2016, which issued during the prosecution of U.S. Appl. No. 14/285,672. |
| Anand, A., et al. "Automatic identification of malaria-infected RBC with digital holographic microscopy using correlation algorithms." Photonics Journal, IEEE 4.5 (2012): 1456-1464. |
| Andrew Gordon et al: "Single-cell quantification of molecules and rates using open-source microscope-based cytometry", HHS Public Access Author Manuscript, vol. 4, No. 2, Jan. 21, 2007, pp. 175-181. |
| Andrew Gordon et al: "Supplementary Note to Gordon et al: "Single-cell quantification of molecules . . . "", Nature Methods, Jan. 21, 2007, pp. 1-35. |
| Automated Image Detection and Segmentation in Blood Smears, Poon et al. [Cytometry 13:766-774]. |
| Bacus, J.W., 1985. Cytometric approaches to red blood cells. Pure and Applied Chemistry, 57(4), pp. 593-598. |
| Bovik, Alan C., ed. "The essential guide to image processing", chapter 27, "Computer assisted Microscopy", pp. 777-831, Academic Press, 2009. |
| Bravo-Zanoguera, M.E., Laris, C.A., Nguyen, L.K., Oliva, M. and Price, J.H., 2007. Dynamic autofocus for continuous-scanning time-delay-and-integration image acquisition in automated microscopy. Journal of biomedical optics, 12(3), pp. 034011-034011. |
| C. Briggs, et al., "Continuing developments with the automated platelet count", Blackwell Publishing Ltd, International Journal of Laboratory Hematology, Jan. 18, 2007, pp. 77-91, vol. 29 (15 pages total). |
| Centers for Disease Control and Prevention. "DPDx—Laboratory Identification of Parasitic Diseases of Public Health Concern", <http://www.cdc.gov/dpdx/diagnosticProcedures/blood/microexam.html>, Nov. 29, 2013. |
| Chong, Shau Poh, Shilpa Pant, and Nanguang Chen. "Line-scan focal modulation microscopy for rapid imaging of thick biological specimens." SPIE/OSA/IEEE Asia Communications and Photonics. International Society for Optics and Photonics, 2011. |
| Communication dated Dec. 21, 2018, in U.S. Appl. No. 14/369,251. |
| Communication dated Dec. 24, 2018, from Intellectual Property of India in counterpart application No. 3592/MUMNP/2015. |
| Communication dated Feb. 22, 2018, in the prosecution of U.S. Appl. No. 14/369,251. |
| Communication dated Jan. 28, 2019, in U.S. Appl. No. 15/174,490. |
| Communication dated Jan. 31, 2019, from Intellectual Property of India in counterpart application No. 5069/DELNP/2012. |
| Communication dated Mar. 23, 2018, issued by the Intellectual Property Office of India in co-pending Indian Application No. 4263/DELNP/2014. |
| Communication dated Nov. 16, 2018, in U.S. Appl. No. 14/914,329. |
| Emma Eriksson et al: "Automated focusing of nuclei for time lapse experiments on single cells using holographic optical tweezers", Optics Express, vol. 17, No. 7 , Mar. 24, 2009, pp. 5585-5594,. |
| European Search Report dated Dec. 14, 2016, which issued during the prosecution of Applicant's European App No. 14800352.8. |
| European Search Report dated Mar. 23, 2017, which issued during the prosecution of Applicant's European App No. 14839661.7. |
| Feasibility study of the spectroscopic measurement of oxyhemoglobin using whole blood without pre-treatment, Wu et al. [Analyst, Mar. 1998, vol. 123 (477-481)]. |
| Frean, John. "Microscopic determination of malaria parasite load: role of image analysis." Microscopy: Science, technology, Applications, and Education (2010): 862-866. |
| Groen F C A et al: "A Comparison of Different Focus Functions for Use in Autofocus Algorithms", Cytometry, Alan Liss, New York, US, vol. 6, No. 2, Mar. 1, 1985 (Mar. 1, 1985), pp. 81-91. |
| High-content live cell imaging with RNA probes: advancements in high-throughput antimalarial drug discovery BMC Cell Biology 2009, 10:45 www.biomedcentral.com/1471-2121/10/45 Serena Cervantes, Jacques Prudhomme, David Carter, Krishna G Gopi, Qian Li, Young-Tae Chang and Karine G Le Roch (Jun. 10, 2009). |
| Houri-Yafin, A., et al. "An enhanced computer vision platform for clinical diagnosis of malaria." Malar Control Elimin 5.138.10 (2016): 4172. |
| Kawamoto, F. and P. F. Billingsley. "Rapid diagnosis of malaria by fluorescence microscopy." Parasitology today 8.2 (1992): 69-71. |
| Kawamoto, Fumihiko, "Rapid diagnosis of malaria by fluorescence microscopy with light microscope and interference filter". The Lancet, vol. 337, pp. 200-202, Jan. 26, 1991. |
| Keiser, J., et al. "Acridine Orange for malaria diagnosis: its diagnostic performance, its promotion and implementation in Tanzania, and the implications for malaria control." Annals of tropical medicine and parasitology, 96.7 (2002): 643-654. |
| Knesel, "Roche Image Analysis Systems, Inc.", Acta Cytologica, vol. 40, pp. 60-66, (1996). |
| Laboratory Identification of Cryoglobulinemia From Automated Blood Cell Counts, Fresh Blood Samples, and Blood Films, Fohlen-Walker et al. [Am J Clin Pathol 2002;117:606-614]. |
| Le et al., "A novel semi-automatic image processing approach to determine Plasmodium falciparum parasitemia in Giemsa-stained thin blood smears", BMC Cell Biology, Mar. 28, 2008 (pp. 1-12), 12 pages total. |
| Leif, "Methods for Preparing Sorted Cells as Monolayer Specimens", Springer Lab Manuals, Section 7-Chapter 5, pp. 592-619, (2000). |
| Life Technologies Corporation, "Counting blood cells with Countess Automated Cell Counter".pdf, four pages, (2009). |
| Matcher, S. J., M. Cope, and D. T. Delpy. "Use of the water absorption spectrum to quantify tissue chromophore concentration changes in near-infrared spectroscopy." Physics in medicine and biology 39.1 (1994): 177. |
| Moody, "Rapid Diagnostic Tests for Malaria Parasites", Clinical Microbiology Reviews, vol. 15, No. 1, pp. 66-78, (2002). |
| Notice of Allowance dated Dec. 30, 2015, which issued during the prosecution of U.S. Appl. No. 14/440,864. |
| Notice of Allowance dated Jan. 11, 2016, which issued during the prosecution of U.S. Appl. No. 14/440,864. |
| Ortyn, William E., et al. "Extended depth of field imaging for high speed cell analysis." Cytometry Part A 71.4 (2007): 215-231. |
| Osibote, O. A., et al. "Automated focusing in bright-field microscopy for tuberculosis detection." Journal of microscopy 240.2 (2010): 155-163. |
| Piruska et al., "The autofluorescence of plastic materials and chips measured under laser irradiation", The Royal Society of Chemistry, Lap Chip, vol. 5, 2005 (pp. 1348-1354), 7 pages total. |
| Plasmodium yoelii: A differential fluorescent technique using Acridine Orange to identify infected erythrocytes and reticulocytes in Duffy knockout mouse. Experimental Parasitology vol. 110, Issue 1, May 2005, pp. 80-87. http://www.sciencedirect.com/science/article/ pii/S001448940500038X : Lili Xu, Asok Chaudhuri (May 31, 2005). |
| Price, Jeffrey H., and David A. Gough. "Comparison of phase—contrast and fluorescence digital autofocus for scanning microscopy." Cytometry 16.4 (1994): 283-297. |
| Purwar, Yashasvi, et al. "Automated and unsupervised detection of malarial parasites in microscopic images." Malaria journal 10.1 (2011): 364. |
| Rappaz, Benjamin, et al. "Comparative study of human erythrocytes by digital holographic microscopy, confocal microscopy, and impedance volume analyzer." Cytometry Part A 73.10 (2008): 895-903. |
| Roma, P. M. S., et al. "Total three-dimensional imaging of phase objects using defocusing microscopy: Application to red blood cells." Applied Physics Letters 104.25 (2014): 251107. |
| Ross, Nicholas E., et al. "Automated image processing method for the diagnosis and classification of malaria on thin blood smears." Medical and Biological Engineering and Computing 44.5 (2006): 427-436. |
| Sheikh et al., "Blood Cell Identification Using Neural Networks", IEEE, 1996 (p. 119-120), 2 pages total. |
| Shen, Feimo, Louis Hodgson, and Klaus Hahn. "Digital autofocus methods for automated microscopy." Methods in enzymology 414 (2006): 620-632. |
| Shute, G. T., and T. M. Sodeman. "Identification of malaria parasites by fluorescence microscopy and acridine orange staining." Bulletin of the World Health Organization, 48.5 (1973): 591. |
| Simple technique for fluorescence staining of blood cells with acridine orange, Jahanmeher et al., [Journal of clinical pathology, Aug. 1, 1987]. |
| Sun, Yu, Stefan Duthaler, and Bradley J. Nelson. "Autofocusing algorithm selection in computer microscopy." Intelligent Robots and Systems, 2005,(IROS 2005). 2005 IEEE/RSJ International Conference on. IEEE, 2005. |
| Tek, F. Boray, Andrew G. Dempster, and Izzet Kale. "Computer vision for microscopy diagnosis of malaria." Malaria Journal 8.1 (2009): 153. |
| The use of fluorescence enhancement to improve the microscopic diagnosis of falciparum malaria Malaria Journal 2007, 6:89 http://www.malariajournal.eom/content/6/1/89 Rebecca Guy, Paul Liu, Peter Pennefather and Ian Crandall (Jul. 6, 2007). |
| Thung, Ferdian, and Iping Supriana Suwardi. "Blood parasite identification using feature based recognition." Electrical Engineering and Informatics (ICEEI), 2011 International Conference on. IEEE, 2011. |
| U.S. Appl. No. 61/870,106, filed Aug. 26, 2013. |
| U.S. Appl. No. 62/042,388, filed Aug. 27, 2014. |
| Vink, J. P.,etal. "An automatic vision based malaria diagnosis system."Journal of microscopy 250.3(2013): 166-178. |
| Wissing et al., "Illumination of the Malaria Parasite Plasmodium falciparum Alters Intracellular pH", The Journal of Biological Chemistry, vol. 277, No. 40, Oct. 4, 2002 (pp. 37747-37755), 10 pages total. |
| Wu, Qiang, Fatima Merchant, and Kenneth Castleman. Microscope image processing. Chapter 16, "Autofocusing", pp. 441-467, Academic press, 2010. |
| Yang, Ming, and Li Luo. "A rapid auto-focus method in automatic microscope." Signal Processing, 2008, ICSP 2008. 9th International Conference on. IEEE, 2008. |
| Yazdanfar, S., Kenny, K.B., Tasimi, K., Corwin, A.D., Dixon, E.L. and Filkins, R.J., 2008. Simple and robust image-based autofocusing for digital microscopy. Optics express, 16(12), pp. 8670-8677. |
| Zahniser et al., Automated Slide Preparation System for the Clinical Laboratory, Cytometry, vol. 26, No. 10, pp. 30-64, (1996). |
Cited By (30)
| Publication number | Priority date | Publication date | Assignee | Title |
|---|---|---|---|---|
| US12393010B2 (en) | 2013-08-26 | 2025-08-19 | S.D. Sight Diagnostics Ltd. | Distinguishing between entities in a blood sample |
| US11199690B2 (en) | 2015-09-17 | 2021-12-14 | S.D. Sight Diagnostics Ltd. | Determining a degree of red blood cell deformity within a blood sample |
| US11914133B2 (en) | 2015-09-17 | 2024-02-27 | S.D. Sight Diagnostics Ltd. | Methods and apparatus for analyzing a bodily sample |
| US11796788B2 (en) | 2015-09-17 | 2023-10-24 | S.D. Sight Diagnostics Ltd. | Detecting a defect within a bodily sample |
| US11262571B2 (en) | 2015-09-17 | 2022-03-01 | S.D. Sight Diagnostics Ltd. | Determining a staining-quality parameter of a blood sample |
| US11733150B2 (en) | 2016-03-30 | 2023-08-22 | S.D. Sight Diagnostics Ltd. | Distinguishing between blood sample components |
| US12196664B2 (en) | 2016-03-30 | 2025-01-14 | S.D. Sight Diagnostics Ltd. | Distinguishing between blood sample components |
| US11808758B2 (en) | 2016-05-11 | 2023-11-07 | S.D. Sight Diagnostics Ltd. | Sample carrier for optical measurements |
| US12181463B2 (en) | 2016-05-11 | 2024-12-31 | S.D. Sight Diagnostics Ltd. | Performing optical measurements on a sample |
| US11307196B2 (en) | 2016-05-11 | 2022-04-19 | S.D. Sight Diagnostics Ltd. | Sample carrier for optical measurements |
| US12174175B2 (en) | 2016-05-11 | 2024-12-24 | S.D. Sight Diagnostics Ltd. | Performing measurements on a sample |
| US11921272B2 (en) | 2017-11-14 | 2024-03-05 | S.D. Sight Diagnostics Ltd. | Sample carrier for optical measurements |
| US11609413B2 (en) | 2017-11-14 | 2023-03-21 | S.D. Sight Diagnostics Ltd. | Sample carrier for microscopy and optical density measurements |
| US12196940B2 (en) | 2017-11-14 | 2025-01-14 | S.D. Sight Diagnostics Ltd. | Sample carrier for microscopy and optical density measurements |
| US11614609B2 (en) | 2017-11-14 | 2023-03-28 | S.D. Sight Diagnostics Ltd. | Sample carrier for microscopy measurements |
| US12072551B2 (en)* | 2018-08-09 | 2024-08-27 | Viavi Solutions Inc. | Context-based focus control of a microscope |
| US20220155556A1 (en)* | 2018-08-09 | 2022-05-19 | Viavi Solutions Inc. | Context-based focus control of a microscope |
| EP3966783B1 (en)* | 2019-05-08 | 2025-05-07 | 77 Elektronika Müszeripari Kft. | Image taking method, image analysis method, method for training an image analysis neural network, and image analysis neural network |
| EP3966783A1 (en)* | 2019-05-08 | 2022-03-16 | 77 Elektronika Müszeripari Kft. | Image taking method, image analysis method, method for training an image analysis neural network, and image analysis neural network |
| WO2021116959A1 (en) | 2019-12-12 | 2021-06-17 | S.D. Sight Diagnostics Ltd | Analyzing an analyte disposed within a medium |
| US12436101B2 (en) | 2019-12-12 | 2025-10-07 | S.D. Sight Diagnostics Ltd. | Microscopy unit |
| WO2021116962A1 (en) | 2019-12-12 | 2021-06-17 | S.D. Sight Diagnostics Ltd | Artificial generation of color blood smear image |
| WO2021116955A1 (en) | 2019-12-12 | 2021-06-17 | S.D. Sight Diagnostics Ltd | Detecting platelets in a blood sample |
| US12189112B2 (en) | 2019-12-12 | 2025-01-07 | S.D. Sight Diagnostics Ltd. | Artificial generation of color blood smear image |
| WO2021116957A1 (en) | 2019-12-12 | 2021-06-17 | S.D. Sight Diagnostics Ltd | Off-focus microscopic images of a sample |
| WO2021116960A1 (en) | 2019-12-12 | 2021-06-17 | S.D. Sight Diagnostics Ltd | Classification models for analyzing a sample |
| WO2022009104A2 (en) | 2020-07-07 | 2022-01-13 | S.D. Sight Diagnostics Ltd | Focusing a microscope using fluorescent images |
| WO2023144713A1 (en) | 2022-01-25 | 2023-08-03 | S.D. Sight Diagnostics Ltd | Sample carrier for use with a bodily sample |
| WO2024127207A1 (en) | 2022-12-12 | 2024-06-20 | S.D. Sight Diagnostics Ltd | System and method for analyzing bodily samples |
| WO2024236537A1 (en) | 2023-05-18 | 2024-11-21 | S.D. Sight Diagnostics Ltd | Apparatus and methods for microscopic analysis of a biological sample |
Also Published As
| Publication number | Publication date |
|---|---|
| EP3186778B1 (en) | 2023-01-11 |
| US20210327064A1 (en) | 2021-10-21 |
| US11721018B2 (en) | 2023-08-08 |
| US20190087953A1 (en) | 2019-03-21 |
| CN107077732A (en) | 2017-08-18 |
| US20230342925A1 (en) | 2023-10-26 |
| WO2016030897A1 (en) | 2016-03-03 |
| EP3186778A1 (en) | 2017-07-05 |
| US11100637B2 (en) | 2021-08-24 |
| US20200034967A1 (en) | 2020-01-30 |
| CN107077732B (en) | 2020-11-24 |
| US12387328B2 (en) | 2025-08-12 |
Similar Documents
| Publication | Publication Date | Title |
|---|---|---|
| US11721018B2 (en) | System and method for calculating focus variation for a digital microscope | |
| US12430765B2 (en) | Method and system for imaging a cell sample | |
| AU2014236057B2 (en) | Image quality assessment of microscopy images | |
| JP7622203B2 (en) | COMPUTER IMPLEMENTED METHOD FOR QUALITY CONTROL OF DIGITAL IMAGES OF SAMPLES - Patent application | |
| JP2013526717A5 (en) | ||
| CN118115496B (en) | Wafer defect detection method and device | |
| CN115836241B (en) | Methods for analyzing scan efficacy | |
| Redondo et al. | Evaluation of autofocus measures for microscopy images of biopsy and cytology | |
| WO2025198613A1 (en) | Automated focus labeling of histological images for training machine-learning models | |
| Qiu | Comprehensive performance evaluation and optimization of high throughput scanning microscopy for metaphase chromosome imaging |
Legal Events
| Date | Code | Title | Description |
|---|---|---|---|
| AS | Assignment | Owner name:S.D. SIGHT DIAGNOSTICS LTD., ISRAEL Free format text:ASSIGNMENT OF ASSIGNORS INTEREST;ASSIGNORS:YORAV-RAPHAEL, NOAM;WOLFOVITZ, URI;POLLACK, JOSEPH JOEL;SIGNING DATES FROM 20170406 TO 20170407;REEL/FRAME:041979/0167 | |
| FEPP | Fee payment procedure | Free format text:ENTITY STATUS SET TO SMALL (ORIGINAL EVENT CODE: SMAL); ENTITY STATUS OF PATENT OWNER: LARGE ENTITY Free format text:ENTITY STATUS SET TO SMALL (ORIGINAL EVENT CODE: SMAL); ENTITY STATUS OF PATENT OWNER: SMALL ENTITY | |
| STPP | Information on status: patent application and granting procedure in general | Free format text:NOTICE OF ALLOWANCE MAILED -- APPLICATION RECEIVED IN OFFICE OF PUBLICATIONS | |
| STPP | Information on status: patent application and granting procedure in general | Free format text:NOTICE OF ALLOWANCE MAILED -- APPLICATION RECEIVED IN OFFICE OF PUBLICATIONS | |
| STCF | Information on status: patent grant | Free format text:PATENTED CASE | |
| FEPP | Fee payment procedure | Free format text:ENTITY STATUS SET TO UNDISCOUNTED (ORIGINAL EVENT CODE: BIG.); ENTITY STATUS OF PATENT OWNER: LARGE ENTITY | |
| AS | Assignment | Owner name:BANK LEUMI LE-ISRAEL B.M., ISRAEL Free format text:SECURITY INTEREST;ASSIGNOR:S.D. SIGHT DIAGNOSTICS LTD.;REEL/FRAME:060393/0580 Effective date:20220628 | |
| MAFP | Maintenance fee payment | Free format text:PAYMENT OF MAINTENANCE FEE, 4TH YEAR, LARGE ENTITY (ORIGINAL EVENT CODE: M1551); ENTITY STATUS OF PATENT OWNER: LARGE ENTITY Year of fee payment:4 | |
| AS | Assignment | Owner name:S.D. SIGHT DIAGNOSTICS LTD., ISRAEL Free format text:RELEASE BY SECURED PARTY;ASSIGNOR:BANK LEUMI LE-ISRAEL B.M.;REEL/FRAME:065673/0880 Effective date:20231127 | |
| AS | Assignment | Owner name:KREOS CAPITAL VII AGGREGATOR SCSP, LUXEMBOURG Free format text:SECURITY INTEREST;ASSIGNOR:S.D. SIGHT DIAGNOSTICS LTD;REEL/FRAME:065788/0001 Effective date:20231204 | |
| AS | Assignment | Owner name:S.D. SIGHT DIAGNOSTICS LTD., ISRAEL Free format text:RELEASE OF INTELLECTUAL PROPERTY SECURITY AGREEMENT;ASSIGNOR:KREOS CAPITAL VII AGGREGATOR SCSP;REEL/FRAME:069993/0260 Effective date:20241201 |