US10317256B2 - Monitoring transportation systems - Google Patents
Monitoring transportation systemsDownload PDFInfo
- Publication number
- US10317256B2 US10317256B2US15/488,021US201715488021AUS10317256B2US 10317256 B2US10317256 B2US 10317256B2US 201715488021 AUS201715488021 AUS 201715488021AUS 10317256 B2US10317256 B2US 10317256B2
- Authority
- US
- United States
- Prior art keywords
- conveyance
- optical
- sensors
- transportation structure
- wavelength
- Prior art date
- Legal status (The legal status is an assumption and is not a legal conclusion. Google has not performed a legal analysis and makes no representation as to the accuracy of the status listed.)
- Active, expires
Links
Images


Classifications
- G—PHYSICS
- G01—MEASURING; TESTING
- G01D—MEASURING NOT SPECIALLY ADAPTED FOR A SPECIFIC VARIABLE; ARRANGEMENTS FOR MEASURING TWO OR MORE VARIABLES NOT COVERED IN A SINGLE OTHER SUBCLASS; TARIFF METERING APPARATUS; MEASURING OR TESTING NOT OTHERWISE PROVIDED FOR
- G01D5/00—Mechanical means for transferring the output of a sensing member; Means for converting the output of a sensing member to another variable where the form or nature of the sensing member does not constrain the means for converting; Transducers not specially adapted for a specific variable
- G01D5/26—Mechanical means for transferring the output of a sensing member; Means for converting the output of a sensing member to another variable where the form or nature of the sensing member does not constrain the means for converting; Transducers not specially adapted for a specific variable characterised by optical transfer means, i.e. using infrared, visible, or ultraviolet light
- G01D5/32—Mechanical means for transferring the output of a sensing member; Means for converting the output of a sensing member to another variable where the form or nature of the sensing member does not constrain the means for converting; Transducers not specially adapted for a specific variable characterised by optical transfer means, i.e. using infrared, visible, or ultraviolet light with attenuation or whole or partial obturation of beams of light
- G01D5/34—Mechanical means for transferring the output of a sensing member; Means for converting the output of a sensing member to another variable where the form or nature of the sensing member does not constrain the means for converting; Transducers not specially adapted for a specific variable characterised by optical transfer means, i.e. using infrared, visible, or ultraviolet light with attenuation or whole or partial obturation of beams of light the beams of light being detected by photocells
- G01D5/353—Mechanical means for transferring the output of a sensing member; Means for converting the output of a sensing member to another variable where the form or nature of the sensing member does not constrain the means for converting; Transducers not specially adapted for a specific variable characterised by optical transfer means, i.e. using infrared, visible, or ultraviolet light with attenuation or whole or partial obturation of beams of light the beams of light being detected by photocells influencing the transmission properties of an optical fibre
- G01D5/35383—Mechanical means for transferring the output of a sensing member; Means for converting the output of a sensing member to another variable where the form or nature of the sensing member does not constrain the means for converting; Transducers not specially adapted for a specific variable characterised by optical transfer means, i.e. using infrared, visible, or ultraviolet light with attenuation or whole or partial obturation of beams of light the beams of light being detected by photocells influencing the transmission properties of an optical fibre using multiple sensor devices using multiplexing techniques
- G01D5/35387—Mechanical means for transferring the output of a sensing member; Means for converting the output of a sensing member to another variable where the form or nature of the sensing member does not constrain the means for converting; Transducers not specially adapted for a specific variable characterised by optical transfer means, i.e. using infrared, visible, or ultraviolet light with attenuation or whole or partial obturation of beams of light the beams of light being detected by photocells influencing the transmission properties of an optical fibre using multiple sensor devices using multiplexing techniques using wavelength division multiplexing
- B—PERFORMING OPERATIONS; TRANSPORTING
- B61—RAILWAYS
- B61L—GUIDING RAILWAY TRAFFIC; ENSURING THE SAFETY OF RAILWAY TRAFFIC
- B61L23/00—Control, warning or like safety means along the route or between vehicles or trains
- B61L23/04—Control, warning or like safety means along the route or between vehicles or trains for monitoring the mechanical state of the route
- B61L23/042—Track changes detection
- B61L23/044—Broken rails
- B—PERFORMING OPERATIONS; TRANSPORTING
- B61—RAILWAYS
- B61L—GUIDING RAILWAY TRAFFIC; ENSURING THE SAFETY OF RAILWAY TRAFFIC
- B61L23/00—Control, warning or like safety means along the route or between vehicles or trains
- B61L23/04—Control, warning or like safety means along the route or between vehicles or trains for monitoring the mechanical state of the route
- B61L23/042—Track changes detection
- B61L23/045—Rail wear
- B61L27/0088—
- B—PERFORMING OPERATIONS; TRANSPORTING
- B61—RAILWAYS
- B61L—GUIDING RAILWAY TRAFFIC; ENSURING THE SAFETY OF RAILWAY TRAFFIC
- B61L27/00—Central railway traffic control systems; Trackside control; Communication systems specially adapted therefor
- B61L27/50—Trackside diagnosis or maintenance, e.g. software upgrades
- B61L27/53—Trackside diagnosis or maintenance, e.g. software upgrades for trackside elements or systems, e.g. trackside supervision of trackside control system conditions
- G—PHYSICS
- G01—MEASURING; TESTING
- G01B—MEASURING LENGTH, THICKNESS OR SIMILAR LINEAR DIMENSIONS; MEASURING ANGLES; MEASURING AREAS; MEASURING IRREGULARITIES OF SURFACES OR CONTOURS
- G01B11/00—Measuring arrangements characterised by the use of optical techniques
- G01B11/16—Measuring arrangements characterised by the use of optical techniques for measuring the deformation in a solid, e.g. optical strain gauge
- G01B11/18—Measuring arrangements characterised by the use of optical techniques for measuring the deformation in a solid, e.g. optical strain gauge using photoelastic elements
- G—PHYSICS
- G01—MEASURING; TESTING
- G01D—MEASURING NOT SPECIALLY ADAPTED FOR A SPECIFIC VARIABLE; ARRANGEMENTS FOR MEASURING TWO OR MORE VARIABLES NOT COVERED IN A SINGLE OTHER SUBCLASS; TARIFF METERING APPARATUS; MEASURING OR TESTING NOT OTHERWISE PROVIDED FOR
- G01D5/00—Mechanical means for transferring the output of a sensing member; Means for converting the output of a sensing member to another variable where the form or nature of the sensing member does not constrain the means for converting; Transducers not specially adapted for a specific variable
- G01D5/26—Mechanical means for transferring the output of a sensing member; Means for converting the output of a sensing member to another variable where the form or nature of the sensing member does not constrain the means for converting; Transducers not specially adapted for a specific variable characterised by optical transfer means, i.e. using infrared, visible, or ultraviolet light
- G01D5/32—Mechanical means for transferring the output of a sensing member; Means for converting the output of a sensing member to another variable where the form or nature of the sensing member does not constrain the means for converting; Transducers not specially adapted for a specific variable characterised by optical transfer means, i.e. using infrared, visible, or ultraviolet light with attenuation or whole or partial obturation of beams of light
- G01D5/34—Mechanical means for transferring the output of a sensing member; Means for converting the output of a sensing member to another variable where the form or nature of the sensing member does not constrain the means for converting; Transducers not specially adapted for a specific variable characterised by optical transfer means, i.e. using infrared, visible, or ultraviolet light with attenuation or whole or partial obturation of beams of light the beams of light being detected by photocells
- G01D5/353—Mechanical means for transferring the output of a sensing member; Means for converting the output of a sensing member to another variable where the form or nature of the sensing member does not constrain the means for converting; Transducers not specially adapted for a specific variable characterised by optical transfer means, i.e. using infrared, visible, or ultraviolet light with attenuation or whole or partial obturation of beams of light the beams of light being detected by photocells influencing the transmission properties of an optical fibre
- G01D5/35338—Mechanical means for transferring the output of a sensing member; Means for converting the output of a sensing member to another variable where the form or nature of the sensing member does not constrain the means for converting; Transducers not specially adapted for a specific variable characterised by optical transfer means, i.e. using infrared, visible, or ultraviolet light with attenuation or whole or partial obturation of beams of light the beams of light being detected by photocells influencing the transmission properties of an optical fibre using other arrangements than interferometer arrangements
- G01D5/35341—Sensor working in transmission
- G01D5/35351—Sensor working in transmission using other means to detect the measured quantity
- G—PHYSICS
- G01—MEASURING; TESTING
- G01D—MEASURING NOT SPECIALLY ADAPTED FOR A SPECIFIC VARIABLE; ARRANGEMENTS FOR MEASURING TWO OR MORE VARIABLES NOT COVERED IN A SINGLE OTHER SUBCLASS; TARIFF METERING APPARATUS; MEASURING OR TESTING NOT OTHERWISE PROVIDED FOR
- G01D5/00—Mechanical means for transferring the output of a sensing member; Means for converting the output of a sensing member to another variable where the form or nature of the sensing member does not constrain the means for converting; Transducers not specially adapted for a specific variable
- G01D5/26—Mechanical means for transferring the output of a sensing member; Means for converting the output of a sensing member to another variable where the form or nature of the sensing member does not constrain the means for converting; Transducers not specially adapted for a specific variable characterised by optical transfer means, i.e. using infrared, visible, or ultraviolet light
- G01D5/32—Mechanical means for transferring the output of a sensing member; Means for converting the output of a sensing member to another variable where the form or nature of the sensing member does not constrain the means for converting; Transducers not specially adapted for a specific variable characterised by optical transfer means, i.e. using infrared, visible, or ultraviolet light with attenuation or whole or partial obturation of beams of light
- G01D5/34—Mechanical means for transferring the output of a sensing member; Means for converting the output of a sensing member to another variable where the form or nature of the sensing member does not constrain the means for converting; Transducers not specially adapted for a specific variable characterised by optical transfer means, i.e. using infrared, visible, or ultraviolet light with attenuation or whole or partial obturation of beams of light the beams of light being detected by photocells
- G01D5/353—Mechanical means for transferring the output of a sensing member; Means for converting the output of a sensing member to another variable where the form or nature of the sensing member does not constrain the means for converting; Transducers not specially adapted for a specific variable characterised by optical transfer means, i.e. using infrared, visible, or ultraviolet light with attenuation or whole or partial obturation of beams of light the beams of light being detected by photocells influencing the transmission properties of an optical fibre
- G01D5/35383—Mechanical means for transferring the output of a sensing member; Means for converting the output of a sensing member to another variable where the form or nature of the sensing member does not constrain the means for converting; Transducers not specially adapted for a specific variable characterised by optical transfer means, i.e. using infrared, visible, or ultraviolet light with attenuation or whole or partial obturation of beams of light the beams of light being detected by photocells influencing the transmission properties of an optical fibre using multiple sensor devices using multiplexing techniques
- G01D5/3539—Mechanical means for transferring the output of a sensing member; Means for converting the output of a sensing member to another variable where the form or nature of the sensing member does not constrain the means for converting; Transducers not specially adapted for a specific variable characterised by optical transfer means, i.e. using infrared, visible, or ultraviolet light with attenuation or whole or partial obturation of beams of light the beams of light being detected by photocells influencing the transmission properties of an optical fibre using multiple sensor devices using multiplexing techniques using time division multiplexing
- G—PHYSICS
- G01—MEASURING; TESTING
- G01L—MEASURING FORCE, STRESS, TORQUE, WORK, MECHANICAL POWER, MECHANICAL EFFICIENCY, OR FLUID PRESSURE
- G01L1/00—Measuring force or stress, in general
- G01L1/24—Measuring force or stress, in general by measuring variations of optical properties of material when it is stressed, e.g. by photoelastic stress analysis using infrared, visible light, ultraviolet
- G01L1/242—Measuring force or stress, in general by measuring variations of optical properties of material when it is stressed, e.g. by photoelastic stress analysis using infrared, visible light, ultraviolet the material being an optical fibre
- G01L1/246—Measuring force or stress, in general by measuring variations of optical properties of material when it is stressed, e.g. by photoelastic stress analysis using infrared, visible light, ultraviolet the material being an optical fibre using integrated gratings, e.g. Bragg gratings
- G—PHYSICS
- G01—MEASURING; TESTING
- G01L—MEASURING FORCE, STRESS, TORQUE, WORK, MECHANICAL POWER, MECHANICAL EFFICIENCY, OR FLUID PRESSURE
- G01L1/00—Measuring force or stress, in general
- G01L1/24—Measuring force or stress, in general by measuring variations of optical properties of material when it is stressed, e.g. by photoelastic stress analysis using infrared, visible light, ultraviolet
- G01L1/247—Measuring force or stress, in general by measuring variations of optical properties of material when it is stressed, e.g. by photoelastic stress analysis using infrared, visible light, ultraviolet using distributed sensing elements, e.g. microcapsules
- G—PHYSICS
- G01—MEASURING; TESTING
- G01M—TESTING STATIC OR DYNAMIC BALANCE OF MACHINES OR STRUCTURES; TESTING OF STRUCTURES OR APPARATUS, NOT OTHERWISE PROVIDED FOR
- G01M11/00—Testing of optical apparatus; Testing structures by optical methods not otherwise provided for
- G01M11/08—Testing mechanical properties
- G01M11/083—Testing mechanical properties by using an optical fiber in contact with the device under test [DUT]
- G01M11/085—Testing mechanical properties by using an optical fiber in contact with the device under test [DUT] the optical fiber being on or near the surface of the DUT
- G—PHYSICS
- G01—MEASURING; TESTING
- G01M—TESTING STATIC OR DYNAMIC BALANCE OF MACHINES OR STRUCTURES; TESTING OF STRUCTURES OR APPARATUS, NOT OTHERWISE PROVIDED FOR
- G01M5/00—Investigating the elasticity of structures, e.g. deflection of bridges or air-craft wings
- G01M5/0008—Investigating the elasticity of structures, e.g. deflection of bridges or air-craft wings of bridges
- G—PHYSICS
- G01—MEASURING; TESTING
- G01M—TESTING STATIC OR DYNAMIC BALANCE OF MACHINES OR STRUCTURES; TESTING OF STRUCTURES OR APPARATUS, NOT OTHERWISE PROVIDED FOR
- G01M5/00—Investigating the elasticity of structures, e.g. deflection of bridges or air-craft wings
- G01M5/0025—Investigating the elasticity of structures, e.g. deflection of bridges or air-craft wings of elongated objects, e.g. pipes, masts, towers or railways
- G—PHYSICS
- G01—MEASURING; TESTING
- G01M—TESTING STATIC OR DYNAMIC BALANCE OF MACHINES OR STRUCTURES; TESTING OF STRUCTURES OR APPARATUS, NOT OTHERWISE PROVIDED FOR
- G01M5/00—Investigating the elasticity of structures, e.g. deflection of bridges or air-craft wings
- G01M5/0033—Investigating the elasticity of structures, e.g. deflection of bridges or air-craft wings by determining damage, crack or wear
- G—PHYSICS
- G01—MEASURING; TESTING
- G01M—TESTING STATIC OR DYNAMIC BALANCE OF MACHINES OR STRUCTURES; TESTING OF STRUCTURES OR APPARATUS, NOT OTHERWISE PROVIDED FOR
- G01M5/00—Investigating the elasticity of structures, e.g. deflection of bridges or air-craft wings
- G01M5/0041—Investigating the elasticity of structures, e.g. deflection of bridges or air-craft wings by determining deflection or stress
- G—PHYSICS
- G01—MEASURING; TESTING
- G01M—TESTING STATIC OR DYNAMIC BALANCE OF MACHINES OR STRUCTURES; TESTING OF STRUCTURES OR APPARATUS, NOT OTHERWISE PROVIDED FOR
- G01M5/00—Investigating the elasticity of structures, e.g. deflection of bridges or air-craft wings
- G01M5/0066—Investigating the elasticity of structures, e.g. deflection of bridges or air-craft wings by exciting or detecting vibration or acceleration
- G—PHYSICS
- G01—MEASURING; TESTING
- G01M—TESTING STATIC OR DYNAMIC BALANCE OF MACHINES OR STRUCTURES; TESTING OF STRUCTURES OR APPARATUS, NOT OTHERWISE PROVIDED FOR
- G01M5/00—Investigating the elasticity of structures, e.g. deflection of bridges or air-craft wings
- G01M5/0091—Investigating the elasticity of structures, e.g. deflection of bridges or air-craft wings by using electromagnetic excitation or detection
- G—PHYSICS
- G01—MEASURING; TESTING
- G01P—MEASURING LINEAR OR ANGULAR SPEED, ACCELERATION, DECELERATION, OR SHOCK; INDICATING PRESENCE, ABSENCE, OR DIRECTION, OF MOVEMENT
- G01P3/00—Measuring linear or angular speed; Measuring differences of linear or angular speeds
- G01P3/36—Devices characterised by the use of optical means, e.g. using infrared, visible, or ultraviolet light
Definitions
- This applicationrelates generally to techniques for monitoring transportation systems for detection, quantification, and/or classification of the state of the system.
- the applicationalso relates to components, devices, systems, and methods pertaining to such techniques.
- Degradation in transportation systemscan develop due to insufficient maintenance, manufacturing defects, the environment, and operating conditions such as load, speed, environmental stresses, etc. Degradation of transportation systems can lead structural failures, derailments and accidents.
- a monitoring systemincludes a plurality of optical sensors disposed on one or more fiber optic waveguides. Each optical sensor is spaced apart from other optical sensors of the plurality of optical sensors and is disposed at a location along a route defined by a transportation structure that supports a moveable conveyance as the conveyance moves along the transportation structure.
- the plurality of optical sensorsare mechanically coupled to one or both of the transportation structure and the moveable conveyance. Each optical sensor provides an optical output signal responsive to vibrational emissions of one or both of the transportation structure and the conveyance.
- the monitoring systemincludes a detector unit configured to convert optical output signals from the optical sensors to electrical signals.
- a data acquisition controllersynchronizes recordation of the electrical signals with movement of the conveyance.
- the monitoring systemmay further include a processor configured to detect a condition of at least one of the transportation structure and the conveyance based on data acquired from the electrical signals.
- Some embodimentsare directed to a method of monitoring a transportation system.
- the methodincludes receiving optical output signals from one or more optical sensors.
- Each optical sensoris disposed at a location along a route defined by a transportation structure that supports a moveable conveyance as the conveyance moves along the transportation structure.
- the optical sensorsare mechanically coupled to one or both of the transportation structure and the moveable conveyance.
- Each optical output signalis responsive to vibrational emissions of one or both of the transportation structure and the conveyance.
- the optical output signalsare converted to electrical signals. Data acquisition of the electrical signals is synchronized with movement of the conveyance along the transportation structure.
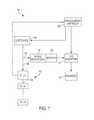
- FIG. 1shows a general block diagram of an optical system that can be used to monitor a transportation system according to embodiments described herein;
- FIG. 2Ais a diagram illustrating synchronization of movement of the conveyance with sensors from which electrical signals are collected in accordance with some embodiments
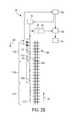
- FIG. 2Bis a diagram illustrating a monitoring system that includes multiple sensor modules in accordance with some embodiments
- FIG. 2Cillustrates synchronizing data acquisition with time of flight of sensor signals in accordance with some embodiments
- FIG. 3Ais a flow diagram that describes synchronizing data collection from sensor modules with movement of a conveyance in accordance with some embodiments
- FIG. 3Bis a flow diagram describing synchronizing data collection from sensors using time of flight information of the sensor signals in accordance with some embodiments
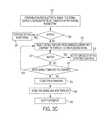
- FIG. 3Cis a flow diagram describing processes used to detect the state of the transportation system in accordance with some embodiments.
- FIG. 4illustrates wavelength domain multiplexing for multiple sensors using an arrayed waveguide grating (AWG) designed for sensing applications;
- AWGarrayed waveguide grating
- FIG. 5Aillustrates reflected spectra for fiber Bragg grating (FBG) sensors
- FIG. 5Bshows sensors FBG 1 , FBG 2 , . . . FBGN disposed on a fiber optic cable;
- FIG. 5Cis a timing diagram that shows the timing of excitation light pulses and the detection periods for the sensors of FIG. 5B in accordance with some embodiments;
- FIG. 6shows an idealized shift in the wavelength spectrum for a FBG sensor deployed on a single mode fiber cable
- FIGS. 7, 8 and 9illustrate in more detail the output waveguides of an AWG used as a wavelength domain optical demultiplexer and a detection unit according to some embodiments;
- FIGS. 10A and 10Bshow portions of AWGs and illustrate techniques for deliberately introducing crosstalk into the output waveguide signals in accordance with some embodiments
- FIG. 11is a graph showing that a decreasing the number of sources broadens the angular distribution of the light emanating from an array of coherent sources
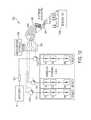
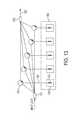
- FIG. 12shows a block diagram of a monitoring system that implements a bank of M optical switches for time division multiplexing and an AWG for wavelength division multiplexing in accordance with some embodiments;
- FIG. 13illustrates a configuration for multiplexing sensor output light at the module level
- FIG. 14depicts a monitoring system that uses time division multiplexing and wavelength division multiplexing in accordance with some embodiments
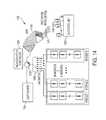
- FIG. 15is a block diagram illustrating a hierarchical switch arrangement that may be used for time division multiplexing
- FIG. 16Ashows a photograph of the G-scale train going over tracks with a ballast layer
- FIG. 16Bis a photograph showing the location of the fiber Bragg grating sensor at standoff distance of 2 inches from tracks;
- FIG. 16Cis a photograph showing wear damage in the lower track introduced using a file for controlled damage detection tests
- FIGS. 17A through 17Fshow electrical signals representing vibrational emissions obtained from the monitoring system.
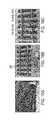
- FIGS. 18A through 18Fshow spectrograms of the vibrational emissions as the train passes over the track which correspond to the electrical signals of FIGS. 17A through 17F .
- Embodiments described in this disclosureinvolve optically-based monitoring for transportation systems.
- Approaches discussed hereincan be applied to transportation systems that include moveable conveyance that is supported by a transportation structure as the conveyance moves along the transportation structure.
- transportation structurescan include railroads, automotive bridges and roadways, tramways, and/or conveyors.
- conveyancescan include railroad cars, automobiles, trams, and/or containers or packages that can be moved by a conveyor.
- Optical-based monitoringcan be used to detect various conditions of the transportation system, such as degradation, failures, and/or loading of the transportation structure and/or conveyance.
- the approaches disclosed hereinenable comprehensive real-time performance monitoring of transportation systems using high resolution data gathered by optical sensors to detect and quantify the extent of specific degradations and failures of a transportation system.
- the approachesalso provide for gathering other information about the transportation system, such as speed, weight and/or load distribution of conveyances.
- characteristics of one or both of the transportation structure and the conveyance supported by the transportation structurecan be identified and/or quantified.
- the monitoring systems of the present disclosurecomprise fiber optic sensors which are mechanically coupled to the transportation system.
- the fiber optic sensorsare configured to sense vibrational emissions of the transportation structure and/or conveyance as the conveyance moves over the transportation structure.
- the vibrational emissionscan include acoustic emissions, longitudinal/transverse stress, and/or other types of vibration signals.
- the high resolution vibrational data collected by the sensorscan be used by pattern matching algorithms to identify specific degradations, failures, load levels, load conditions, and/or other information about the transportation structures and/or conveyances.
- the patterns of the vibrational emission data collected by the monitoring systemmay indicate a fractured or degraded rail of a railroad, railcar faults, such as wheel flats, hot bearings, truck warp, and/or hunting oscillation of the railcar.
- the pattern of vibrational emission datamay indicate the distribution of automobiles on a bridge or the weight of a package carried by conveyor.
- the pattern of vibrational emission datamay be used to verify waybill information such as load, velocity, and axles of the conveyance.
- waybill informationsuch as load, velocity, and axles of the conveyance.
- the examples provided aboveare exemplary and not comprehensive as the vibrational data may include additional information about the transportation system.
- the monitoring approaches described hereinenable remote monitoring of various types of transportation systems which can reduce the cost and downtime associated with conventional on-site inspection.
- the monitoring approachescan enhance predictive maintenance of transportation systems. Identifying failures and/or degradation of transportation structures can reduce derailments, bridge failure, accidents, downtime, and other catastrophic events.
- Embodiments discussed hereininclude a number of optical sensors located in proximity to and spaced apart along a transportation structure.
- the optical sensorsare mechanically coupled to the transportation structure and/or to a conveyance that is moving along the transportation structure.
- the optical sensorsare sensitive to the vibrational emissions of the transportation structure and/or the conveyance as the conveyance moves along the structure in the vicinity of the sensors.
- the optical sensorsmay comprise any type (or multiple types) of optical sensor, including fiber Bragg grating (FBG) sensors and/or etalon or Fabry-Perot (FP) sensors. Both the FBG and etalon/FP sensors are collectively referred to herein as optical sensors.
- FBGfiber Bragg grating
- FPFabry-Perot
- the monitoring systemcan include a high resolution wavelength shift detector to monitor the output of the optical sensors and to convert the optical signals of the sensors to electrical signals.
- the electrical signals that represent the vibrational emissions emitted by the transportation structure and/or conveyancecan be recorded, e.g., acquired and stored, with high resolution using the wavelength shift detector as discussed in more detail below.
- embodiments described hereinmay include a data acquisition (DA) controller configured to control the sensors from which data are acquired.
- the DA controllercan limit the number of sensors from which data is collected to a number of sensors that are within a predetermined distance from the conveyance as the conveyance moves along the transportation structure. Selection of the sensors from which data are acquired relies on detection of the presence of a passing conveyance and the speed of the passing conveyance.
- FIG. 1is a block diagram of a monitoring system 100 in accordance with some embodiments.
- the system 100includes a plurality of optical sensors 110 , e.g., S 1 , S 2 , . . . , SN disposed on and spaced apart from one another on one or more optical waveguides 102 , e.g., fiber optic cables.
- Each optical sensor 110is disposed at a location along a route defined by a transportation structure that supports a moveable conveyance as the conveyance moves along the transportation structure. (The transportation structure and conveyance are not shown in FIG. 1 .)
- Each optical sensor 110is mechanically coupled to one or both of the transportation structure and the moveable conveyance as the conveyance moves in the vicinity of an optical sensor 110 .
- An excitation light source 120provides excitation light to the optical sensors 110 .
- the optical sensors S 1 , S 2 , . . . SNare respectively configured to reflect light at a characteristic wavelength (or wavelength band) ⁇ 1 , ⁇ 2 . . . ⁇ N .
- the excitation light sourceprovides excitation light that includes the wavelength bands of the sensors. As the conveyance passes near the sensors 110 , vibrational emissions caused by the conveyance moving over the transportation structure causes the wavelength of the light reflected from the sensors 110 to shift from the characteristic wavelength.
- the reflected output light from the optical sensors 110 in the different wavelength rangesis separated (demultiplexed) by an optical demultiplexer 130 .
- the optical demultiplexer 130spatially disperses light from the sensors S 1 , S 2 , . . . SN carried on optical waveguide 102 according to the wavelength of the light.
- the optical demultiplexer 130may comprise a linear variable transmission structure and/or an arrayed waveguide grating, for example.
- the demultiplexed light from the optical sensors 110falls on a detector unit 140 which converts the demultiplexed output light from the sensors to electrical signals.
- the electrical signalsinclude information about the characteristics of the transportation system.
- the transportation system characteristicscan be extracted by processor 170 which matches the patterns of the signals to known patterns associated with certain characteristics.
- the processor 170may be programmed to identify a fracture in the transportation structure by comparing the pattern of the electrical signals obtained from the sensors 110 to a known pattern of the signals that indicate a fracture.
- the wavelength bands ⁇ 1 , ⁇ 2 . . . ⁇ N of the sensors S 1 , S 2 , . . . SNmay be selected so that the wavelength band of one sensor does not substantially overlap with the wavelength bands of the other sensors.
- the optical sensors S 1 , S 2 , . . . SNare optically coupled to a broadband light source 120 that supplies excitation light across a broad wavelength band that spans the operating wavelength bands of the optical sensors S 1 , S 2 , . . . SN.
- Output light from optical sensors S 1 , S 2 , . . . SNis carried on sensor waveguide fiber optic cable 102 to the input waveguide 131 of the optical demultiplexer 130 .
- the optical demultiplexer 130spatially disperses light from the sensors S 1 , S 2 , . . . SN carried on input waveguide 131 .
- the optical demultiplexer 130may comprise a linear variable transmission structure and/or an arrayed waveguide grating, for example.
- the output of the optical demultiplexer 130is optically coupled to the detector unit 140 which includes multiple photodetectors.
- Each photodetectoris configured to generate an electrical signal in response to the demultiplexed light that falls on a light sensitive surface of the photodetector.
- the electrical signals generated by the photodetectors of the detector unit 140represent the vibrational emissions from the transportation structure.
- the detector unit 140includes at least N photodetectors. In some implementations, the detector unit 140 includes at least N pairs of photodetectors. Each of these implementations is discussed in more detail below.
- An additional photodetectormay be used to monitor intensity of the input light, e.g., by tapping off the input waveguide 131 .
- excitation light from the light source 110travels through the 102 to the sensors S 1 , S 2 , . . . SN.
- the input lightinteracts with the FBG sensors S 1 , S 2 , . . . SN that are spaced apart along the waveguide 102 .
- Each optical sensorreflects a portion of the input light, and the reflected light is referred to as output light emanating from the optical sensor.
- the output light from all sensorstravels through the waveguide 102 to the input waveguide 131 of the optical demultiplexer 130 .
- Fiber Bragg grating sensorscan be formed by a periodic modulation of the refractive index along a finite length (typically a few mm) of the core of a fiber optic cable. This pattern reflects a wavelength, called the Bragg wavelength, that is determined by the periodicity of the refractive index profile of the FBG sensor. In practice, the sensor typically reflects a narrow band of wavelengths centered at the Bragg wavelength.
- the Bragg wavelength at a characteristic or base value of the external stimulusis denoted ⁇ , and light having a peak, center, or centroid wavelength ⁇ (and a narrow band of wavelengths near ⁇ ) is reflected from a sensor when it is in a predetermined base condition corresponding to low or no vibrational emissions from the transportation structure.
- the vibrational emissionschange the periodicity of the grating and the index of refraction of the FBG sensor, and thereby alter the reflected light so that the reflected light has a peak, center, or centroid wavelength, ⁇ s , different from the base wavelength, ⁇ .
- FBG-based sensingallows for incorporating multiple sensors, e.g., about 64 sensors, on a single waveguide 102 .
- each of the sensors S 1 , S 2 , . . . SNcan be individually interrogated through wavelength domain multiplexing and demultiplexing.
- sensors disposed in multiple sensor modulescan be individually interrogated through a combination of time domain multiplexing and wavelength domain multiplexing and demultiplexing.
- the transportation monitoring system 100includes a data acquisition controller 160 configured to control the vibrational emission data that is collected by the data acquisition unit 150 .
- the data acquisition controller 160may control the excitation light source 120 so that only a preselected set of sensors receive excitation light during a particular time window when the conveyance is moving near the selected sensors.
- the excitation light sourceemits light that excites many or all sensors, but the data acquisition controller 160 selectively records electrical signals only from the sensors that are near the moving conveyance while ignoring electrical signals from other sensors that are farther from the moving conveyance.
- the data acquisition controller 160can limit the collection of vibrational emission data associated with a particular optical sensor to a time window during which the conveyance is within a predetermined distance from the location of the optical sensor. In this way, the data acquisition controller synchronizes the collection of vibrational emission data with the movement of the conveyance along the transportation structure. Limiting the amount of data collected to only relevant sensors near the moving conveyance while not collecting irrelevant data from sensors farther away from the conveyance allows for better allocation of resources to facilitate the collection of high resolution, high frequency sensor data.
- FIG. 2Ashows a transportation system 280 including a transportation structure 281 and a conveyance 282 that moves along the structure 281 and is shown at three different locations. Sensors 261 - 278 are disposed at spaced apart locations along the transportation structure 281 .
- FIG. 2Ashows the conveyance 282 at a first, second, and third of locations Location 1, Location 2, Location 3 as the conveyance moves along the transportation structure 281 .
- sensors 263 , 264 , 265are within a predetermined distance, d, of the conveyance 282 and the monitoring system collects data from sensors 263 , 264 , 265 and does not collect data from sensors 261 , 262 , 266 - 278 .
- sensors 269 , 270are within the predetermined distance, d, of the conveyance 282 and the monitoring system collects data from sensors 269 , 270 and does not collect data from sensors 261 - 267 , 271 - 278 .
- the systemmay or may not collect data from sensor 268 which is on the boundary line.
- sensors 274 , 275are within the predetermined distance, d, of the conveyance 282 and the monitoring system collects data from sensors 274 , 275 and does not collect data from sensors 261 - 273 , 276 - 278 .
- FIG. 2Bis a conceptual diagram showing a monitoring system 200 in accordance with some embodiments.
- the sensors 110are arranged in three sensor modules 210 a , 210 b , 210 c .
- the sensor modules 210 a , 210 b , 210 care coupled in parallel to the excitation light source 120 and to the optical demultiplexer 130 .
- Each sensor module 210 a , 210 b , 210 cincludes multiple optical sensors 110 arranged in a series configuration along an optical waveguide 202 a , 202 b , 202 c .
- the sensors 110are spaced apart along the transportation structure 299 . As the conveyance (not shown in FIG. 2A ) moves along the transportation structure 299 , data acquisition controller 160 shifts collection of data from one sensor array to another sensor array and/or between one group of sensors within a sensor array to another group of sensors within the same sensor array.
- the data acquisition controller 160shifts collection of data from sensor module 210 a to sensor module 210 b to sensor module 210 c in synchrony with the movement of the conveyance. If the conveyance is moving in the direction indicated by arrow 297 , the data acquisition controller 160 shifts collection of data from sensor module 210 c to sensor module 210 b to sensor module 210 a.
- the data acquisition controller 160determines the position and speed of the conveyance based on a first set of sensors in the sensor module, e.g., at least two sensors, such as sensors 110 a and 110 b . As a train or other conveyance passes over FBG sensor 110 a , the vibrational emissions picked up by the sensor 110 a cause the reflected wavelength of sensor 110 a to shift by a threshold value. When the threshold value is met for two physically separated FBGs, 110 a , 110 b , the speed and direction of the conveyance can be determined. Based on the speed and direction of the conveyance, the data acquisition controller 160 determines a second set of FBGs of the plurality of FBGs which will be actively monitored.
- a first set of sensors in the sensor modulee.g., at least two sensors, such as sensors 110 a and 110 b .
- the vibrational emissions picked up by the sensor 110 acause the reflected wavelength of sensor 110 a to shift by a threshold value.
- the threshold valueis met for two physically separated
- the electrical signals of the set of actively monitored FBGsare recorded by the data acquisition unit 150 .
- the data acquisition controller 160may make adjustments in the speed and/or position of the conveyance based on information from additional sensors.
- the same sensorscan be used to detect the speed and position of the conveyance and to monitor the operational state of the transportation structure, e.g., monitoring for a normal or abnormal operational state.
- An abnormal operational state of the transportation structuremay include fractures, degradation, anomalous loading, etc.
- a normal operational state of the transportation structuremay include normal load level, normal load distribution, gap levels near joints, track/tram restraint torque levels, humidity/temperature levels, etc.
- An abnormal operational state of the transportation structuremay include cracks, breaks, anomalous or over load level, anomalous load distribution, rolling fatigue, corrosion, abrasion, wear, structural buckling, and other faults.
- a normal operational state of the moveable conveyance structuremay include normal load level, normal load distribution, speed, load levels to inform tolls due to operators, axle/railcar counts, train length, etc.
- An abnormal operational state of the conveyancemay include cracks, breaks, anomalous load level, anomalous load distribution, rolling fatigue, corrosion, abrasion, wear, structural buckling, and other faults.
- a sensor moduleincludes a first set of sensors dedicated for determining speed and position and a second set of sensors dedicated to monitor the operational state of the transportation system.
- the time of flight of the light reflected by the sensorsmay be used to control the data acquisition from the optical sensors so as to synchronize the data collection with the movement of the conveyance.
- FIG. 2Cshows sensor array 210 a that includes sensors 211 a - 225 a wherein sensors 211 a - 215 a are grouped in a first group, sensors 216 a - 220 a are in a second group, and sensors 221 a - 225 a are in a third group.
- the distance between the first group of sensors and the detector unitis less than the distances between the second and third groups of sensors and the detector unit, so it takes less time for the light reflected from the first sensors to reach the detector unit when compared to the time it takes for reflected light from the second and third groups of sensors to reach the detector unit.
- Reflected light from the first group of sensors 211 a - 215 aarrives at the optical demultiplexer 130 during time period t 1
- reflected light from the second group of sensors 216 a - 220 aarrives at the optical demultiplexer 130 during time period t 2 >t 1
- reflected light from the third group of sensors 221 a - 225 aarrives at the optical demultiplexer 130 during time period t 3 >t 2 >t 1 .
- Each sensor in a group of sensorsmay have a different characteristic wavelength from other sensors in the same group.
- sensors 211 a , 216 a , and 221 aall have characteristic wavelength ⁇ 1
- the sensors 212 a , 217 a , and 222 aall have a characteristic wavelength ⁇ 2 ⁇ 1
- sensors 213 a , 218 a , and 223 aall have characteristic wavelength ⁇ 3 ⁇ 2 ⁇ 1
- sensors 214 a , 219 a , and 224 aall have characteristic wavelength ⁇ 4 ⁇ 3 ⁇ 2 ⁇ 1
- sensors 215 a , 220 a , and 225 aall reflect light in wavelength band ⁇ 5 ⁇ 4 ⁇ 3 ⁇ 2 ⁇ 1 .
- the data acquisition controller 160can synchronize data collection with movement of the conveyance using both wavelength demultiplexing according to the wavelength band of the light reflected by the optical sensors and time demultiplexing according to the time of flight of optical sensors signals.
- the monitoring system processor 170determines the state of the transportation structure by matching the pattern of the electrical signals collected by the data acquisition unit to a known pattern.
- FIG. 3Ais a flow diagram illustrating a method of collecting sensor data in accordance with embodiments that involve a multi-module sensor array as shown in FIG. 2B , for example.
- Detection 305 , 315 by the DA controller of signals from two spatially separated sensors having magnitudes of at least a threshold valuetriggers data collection.
- the data acquisition controllerdetermines 325 the speed and direction of the conveyance. Based on the speed and direction of motion of the conveyance, the data acquisition controller determines the next sensor module that the conveyance will pass over.
- the data acquisition controllersends a signal to the excitation light source causing the light source to emit 335 an excitation light pulse to the sensor module that the data acquisition controller has selected.
- the optical signals reflected by the optical sensors of the module in response to the excitation lightare optically demultiplexed 345 .
- the electrical signal data from sensors of the selected moduleare acquired 355 in synchrony with the movement of the conveyance.
- the electrical signal of each sensoris acquired during the time period in which the conveyance is within a predetermined distance of the sensor.
- FIG. 3Bis a flow diagram illustrating a method of collecting sensor data in accordance with embodiments that use time of flight information to select the electrical signals that are collected as illustrated by the monitoring system of FIG. 2C .
- Detection 310 , 320by the data acquisition controller of signals from two spatially separated sensors having magnitudes of at least a threshold value triggers data collection.
- the data acquisition controllerdetermines 330 the speed and direction of the conveyance.
- a broadband excitation light pulseis provided 340 to the sensors in the array and the sensors reflect light in response to the excitation light pulse.
- the reflected lightis optically demultiplexed 350 and the demultiplexed optical signals are converted 360 to electrical signals by the detector unit.
- the data acquisition controllerprocesses the electrical signals to determine 370 the time of flight of the optical signals from the sensors.
- the time of flight of the optical signalsis used to determine 380 the location of the sensors, allowing the data acquisition controller to synchronize collection of the electrical signals from the sensors with the movement of the conveyance.
- the data acquisition controllercollects data from sensors in a moving time window such that the sensors from which data is collected are within a predetermined distance of the moving conveyance.
- the flow diagram of FIG. 3Cillustrates operation of the processor (see 170 in FIG. 1 ), to analyze the acquired electrical signals collected from the sensors to determine the state of the transportation system.
- the processormay compare 301 the acquired electrical signal and/or features of acquired electrical signal to a signal/feature template comprising one or more representative signal segments and/or one or more signal features, e.g., frequency content, number or peaks, signal amplitude, etc. that characterize a condition that is within normal parameters, e.g., no degradation or failure, expected velocity, load, and load distribution.
- the systemmay compare the acquired electrical signal to multiple normal signal/feature templates, each normal signal/feature template characterizing a different normal state of the transportation system. If the acquired electrical signal matches 303 any of the normal signal/feature templates, the monitoring system continues to monitor 311 the transportation system by acquiring additional electrical signals from the optical sensors.
- the processorimplements additional steps to determine the condition of the transportation system.
- the processorincludes a library of stored signal/feature templates comprising one or more representative signal segments and/or one or more signal features, e.g., frequency content, number or peaks, signal amplitude, etc.
- At least some of the feature/signal templatesmay characterize an abnormal condition of the transportation system, e.g., fracture of transportation structure, one or more types of degradation of the transportation structure and/or the conveyance.
- At least some of the feature/signal templatesmay characterize other conditions of the transportation system, e.g., loading and/or loading distribution of the conveyance, etc.
- the signal/feature templatesmay be experimentally obtained, may be derived from some system model or representation, or may be acquired by the monitoring system as described herein.
- the processorselects 321 a first signal/feature template from the template library and compares the selected template to the acquired electrical signal. If the selected signal template matches 321 the acquired electrical signal, the processor takes an action 323 that notifies the operator of the transportation system. If the selected template does not match 321 the acquired electrical signal, then the processor checks 331 to determine if there are more templates to compare. The processor continues to compare the templates of the library until 331 there are no more templates to compare. If the acquired electrical signal does not match any of the templates of the library, the processor may store 341 the acquired template as a new template that represents an unknown state of the transportation system. The processor may be programmed to notify 343 the operator that a new template has been acquired so that the operator can inspect the transportation system to identify the transportation system state. The operator may input a label that the processor associates with the new template. The label and the new template are stored in the template library and can subsequently be used to detect the state identified by the label assigned by the operator.
- Embodiments disclosed hereincan involve wavelength domain multiplexing and demultiplexing for multiple sensors as illustrated in FIG. 4 .
- multiple multiplexed optical signalsare carried on waveguide 402 .
- These multiplexed signalsare optically demultiplexed by the optical demultiplexer 430 , which in this example is an arrayed waveguide grating (AWG) designed for sensing applications.
- AWGarrayed waveguide grating
- FIG. 4shows operation of the optical components of a monitoring system for transportation in accordance with some embodiments. (Note that for simplicity, the data acquisition controller and processor are not shown).
- FIG. 4illustrates a number of FBG sensors, FBG 1 , FBG 2 , . . .
- FBGNwhich may be disposed along and spaced apart from one another along a transportation structure as previously discussed.
- FBG 1operates in a wavelength band having peak, center, or centroid wavelength ⁇ 1
- FBG 2operates in a wavelength band having peak, center, or centroid wavelength ⁇ 2
- FBGNoperates in a wavelength band having center wavelength ⁇ N .
- Vibrational emissions from the transportation structure and/or conveyance that are generated as the conveyance travels along the transportation structurecause shifts in the wavelength of the light reflected from the sensors FBG 1 , FBG 2 , . . . FBGN.
- the wavelength shifts responsive to the vibrational emissionsare small compared to the spacing between the characteristic base wavelengths of the individual FBGs.
- an optical time domain multiplexing schemecan optionally be implemented and can be used in conjunction with wavelength domain demultiplexing in some embodiments.
- Light source 420is configured to provide excitation light to the FBGs through optical circulator 415 .
- the light source 420has a bandwidth broad enough to provide excitation light for each of the FBG sensors over the range of expected reflected wavelengths of all the sensors.
- the AWG 430may include N pairs of output waveguides 445 , wherein each pair of output waveguides 445 is centered at wavelength around the reflection output of a particular FBG. Excitation light from the light source 420 travels through the circulator 415 and reflects off the FBGs as output light. The output light emanating from the FBGs is carried on sensor optical waveguide 402 through circulator 415 to the input waveguide 441 of the AWG 430 .
- the AWG 430is used as an optical wavelength domain demultiplexer in this embodiment
- light from the AWG input waveguide 441is dispersed via diffraction to output waveguides 445 depending on the wavelength of the light.
- an AWGmight have a center wavelength of 1550 nm, and 16 output channels with a channel spacing of 100 GHz (0.8 nm at that wavelength). In this scenario, light input at 1549.6 nm will go to channel 8, and light input at 1550.4 nm will go to channel 9, etc.
- the AWGincludes an input waveguide 441 , a first slab waveguide 442 , array waveguides 443 , a second slab waveguide 444 , and output waveguides 445 .
- Each of the array waveguides 443is incrementally longer than the next.
- the light from the input waveguide 441is broken up in the first slab waveguide 442 among the array waveguides 443 .
- the lighthas accrued a wavelength-dependent phase shift, which also is incrementally more from one waveguide to the next.
- the outputs of the array waveguides 443resemble an array of coherent sources. Therefore, the propagation direction of the light emitted from the array waveguides 443 into the second slab waveguide 444 depends on the incremental phase shift between the sources and hence the wavelength, as in a diffraction grating.
- the AWG (or other optical demultiplexer) and the detector unit 440may be arranged as a planar lightwave circuit, i.e., integrated optical device.
- these system componentsmay be made from silicon-on-insulator (SOI) wafers using optical and/or electron beam lithography techniques.
- SOIsilicon-on-insulator
- the planar lightwave circuitcan be coupled to the fiber optic, aligned using V-grooves anisotropically etched into the silicon.
- Hybrid integration with other semiconductors, for example germanium,is possible to provide photodetection at energies below the bandgap of silicon.
- the outputs of the array waveguides 443may be arranged along an arc with a given radius of curvature such that the light emanating from them travels in the second slab waveguide 444 and comes to a focus a finite distance away.
- the inputs of the output waveguides 445are nominally disposed at the focal points corresponding to specific wavelengths, although they may be set either in front of or behind the foci to deliberately introduce “crosstalk” between the output waveguides as will be described later. Therefore, light at the input 441 of the AWG 430 is passively routed to a given one of the output waveguides 445 depending on wavelength of the light.
- the output light from the sensors FBG 1 , FBG 2 , FBGNis routed to output waveguides 445 depending on the wavelength of the reflected output light.
- the output waveguides 445are optically coupled to detector unit 440 that includes photodetectors, e.g., 2N photodetectors. Due to the wavelength-based spatial dispersion in the AWG, the output light from the sensors FBG 1 , FBG 2 , . . . FBGN is spatially distributed across the surface of the detector unit 440 .
- the photodetectorssense the light from the output waveguides and generate electrical signals that include information about vibrational emission of the transportation system.
- Multiple optical signals carried, for example, on waveguide 401are multiplexed signals. These multiplexed signals are optically demultiplexed by the optical demultiplexer 430 .
- FIG. 5Aillustrates operation of a monitoring system with optically multiplexed sensor outputs.
- broadband lightis emitted by the light source 520 , which may comprise or be a light emitting diode (LED) or superluminescent laser diode (SLD), for example.
- the spectral characteristic (intensity vs. wavelength) of the broadband lightis shown by inset graph 591 .
- the lightis transmitted via the fiber optic cable 511 to the first FBG sensor 521 .
- the first FBG sensor 521reflects a portion of the light in a first wavelength band having a peak, center, or centroid wavelength, ⁇ 1 .
- Light having wavelengths other than within the first wavelength bandis transmitted through the first FBG sensor 521 to the second FBG sensor 522 .
- the spectral characteristic of the light transmitted to the second FBG sensor 522is shown in inset graph 592 and exhibits a notch at the first wavelength band centered at ⁇ 1 indicating that light in this wavelength band is reflected by the first sensor 521 .
- the second FBG sensor 522reflects a portion of the light in a second wavelength band having a central or peak wavelength, ⁇ 2 .
- Light that is not reflected by the second FBG sensor 522is transmitted through the second FBG sensor 522 to the third FBG sensor 523 .
- the spectral characteristic of the light transmitted to the third FBG sensor 523is shown in inset graph 593 and includes notches centered at ⁇ 1 and ⁇ 2 .
- the third FBG sensor 523reflects a portion of the light in a third wavelength band having a central or peak wavelength, ⁇ 3 .
- Light that is not reflected by the third FBG sensor 523is transmitted through the third FBG sensor 523 .
- the spectral characteristic of the light transmitted through the third FBG sensor 523is shown in inset graph 594 and includes notches centered at ⁇ 1 , ⁇ 2 , and ⁇ 3 .
- Light in wavelength bands 581 , 582 , 583 , having central wavelengths ⁇ 1 , ⁇ 2 and ⁇ 3is reflected by the first, second, or third FBG sensors 521 , 522 , 523 , respectively, along the fiber optic cables 511 and 511 ′ to an the optical wavelength demultiplexer. From the wavelength demultiplexer, the sensor light may be routed to a detection unit that converts the optical signals to electrical signals as previously discussed.
- the reflected light from the sensorsmay be time multiplexed. Time multiplexing may be used in lieu of, or in addition to wavelength multiplexing.
- the light sourceinstead of emitting broadband excitation light, the light source may be controlled by the data acquisition controller to scan through a wavelength range, emitting pulses of light in a number of narrow wavelength bands, each narrow wavelength band corresponding to the operating wavelength band of one of the sensors. The reflected light from the sensors is sensed during a number of sensing periods that are timed relative to the emission of the narrowband light pulses.
- FIG. 5Bshows sensors FBG 1 , FBG 2 , . . . FBGN disposed on a fiber optic cable.
- FBG 1operates in a wavelength band with central wavelength ⁇ 1
- FBG 2operates in a wavelength band with central wavelength ⁇ 2
- FBGNoperates in a wavelength band with central wavelength ⁇ N .
- the timing diagram of FIG. 5Cshows the timing of excitation light pulses and the detection periods for the sensors.
- the light sourcemay be controlled by the data acquisition controller to emit an excitation light pulse having wavelength ⁇ 1 during time period T 1 .
- the data acquisition controllercontrols the detector unit to detect the reflected light during time period T 1 a that overlaps time period T 1 .
- the light sourceemits an excitation light having wavelength ⁇ 2 during time period T 2 and senses reflected light during time period T 2 a that overlaps time period T 2 .
- the light sourceemits light having wavelength ⁇ N during time period TN and senses reflected light during time period TNa that overlaps time period TN.
- each of the sensors FBG 1 , FBG 2 , . . . , FBGNmay be interrogated during discrete time periods.
- the fiber optic cable used for transportation system monitoringmay comprise a single mode (SM) FO cable or may comprise a multi-mode (MM) FO cable. While single mode fiber optic cables offer signals that are easier to interpret, to achieve broader applicability and lower costs of fabrication, multi-mode fibers may be used.
- SMsingle mode
- MMmulti-mode
- MM fibersmay be made of plastic rather than silica, which is typically used for SM fibers. MM fibers can work with less expensive light sources (e.g., LEDs) as opposed to SM fibers that may need more precise alignment with superluminescent diodes (SLDs). Therefore, sensing systems based on optical sensors in MM fibers may yield lower cost systems.
- LEDslight sources
- SLDssuperluminescent diodes
- FIG. 6is an idealized representation of light reflected from a FBG sensor deployed on a single mode fiber optic cable.
- the FBG sensorreflects light in a relatively narrow wavelength band 610 having a centroid wavelength, ⁇ .
- the FBG sensorexperiences a change in strain indicative of vibrational emissions from the transportation system, the light reflected by the sensor shifts to a different wavelength band 620 having a centroid wavelength ⁇ s .
- Wavelength band 620may be similar in width, amplitude and/or other morphological characteristics when compared to wavelength band 610 , but the centroid wavelength, ⁇ s , of wavelength band 620 is shifted 630 from the centroid wavelength, ⁇ , of wavelength band 610 by an amount that is related to the change in the strain caused by the vibrational emissions.
- Wavelength bands of similar widthscan be identified as wavelength bands having similar full width half maximum (FWHM) values, for example.
- FIGS. 7, 8 and 9illustrate various configurations of wavelength shift detector units that may be used to detect the vibrational emissions of the transportation structure and/or conveyance. These configurations provide for acquisition of high resolution signals that can be pattern matched to known signal/feature templates to determine the operational state of the transportation system.
- Use of the wavelength shift detector units as disclosed hereinallows a signal to be acquired that represents a mechanical displacement having a resolution of between about 100 fm and 20 fm, or between about 70 fm and 30 fm, e.g., 50 fm or less, which allows for a wide range of normal and abnormal operational conditions to be discriminated.
- FIG. 7illustrates in more detail the output waveguides of an AWG used as a wavelength domain optical demultiplexer and a detector unit according to some embodiments.
- 2N photodetectorsare respectively coupled to receive light from N sensors.
- the AWGspatially disperses sensor output light having centroid wavelengths ⁇ 1 , ⁇ 2 , . . . ⁇ N to the output waveguide pairs 845 a,b , 846 a,b , . . . 847 a,b .
- Sensor output light having centroid wavelength ⁇ 1is dispersed to waveguide pairs 845 a , 845 b ; sensor output light having centroid wavelength ⁇ 2 is dispersed to waveguide pairs 846 a , 846 b ; sensor output light having centroid wavelength ⁇ N is dispersed to waveguide pairs 847 a , 847 b , etc.
- Light from output waveguide 845 ais optically coupled to photodetector 855 a which generates signal I 11 in response to the detected light; light from output waveguide 845 b is optically coupled to photodetector 855 b which generates signal I 12 in response to the detected light; light from output waveguide 846 a is optically coupled to photodetector 856 a which generates signal I 21 in response to the detected light; light from output waveguide 846 b is optically coupled to photodetector 856 b which generates signal I 22 in response to the detected light; light from output waveguide 847 a is optically coupled to photodetector 857 a which generates signal I N1 in response to the detected light; light from output waveguide 847 b is optically coupled to photodetector 857 b which generates signal I N2 in response to the detected light.
- the AWGcauses the spatial position of the sensor's output light to also shift. For example, if sensor output light that initially has a centroid at ⁇ 1 shifts to a centroid at ⁇ 1 + ⁇ 1 , as shown in FIG. 7 , the amount of light carried by output waveguide 845 a decreases and the amount of light carried by output waveguide 845 b increases. Thus, the amount of light detected by photodetector 855 a decreases and the amount of light detected by photodetector 855 b increases with corresponding changes in the photocurrents I 1 and I 2 . Thus, a change in the strain experienced by the sensor causes a shift in the sensor output light centroid from ⁇ 1 to ⁇ 1 + ⁇ 1 which in turn causes a change in the ratio of I 11 to I 12 .
- the photocurrent of each photodiodemay be converted into a voltage with a resistor or transimpedance amplifier, and sensed and digitized.
- the wavelength shiftmay be calculated for the i th FBG with the following formula:
- ⁇ iis the estimated wavelength of the i th FBG
- ⁇ i0is the center wavelength of an output waveguide pair
- ⁇is the wavelength spacing between the peak transmission wavelengths of an output waveguide pair
- photocurrent I 2i and I 2i ⁇ 1represent the light intensities recorded by the photodetectors at the output of each waveguide in the pair.
- the FBGshave a FWHM roughly equal to ⁇ /2, such that as the reflected peak from the FBG shifts from one photodetector in the pair to the other, there is a continuous and monotonic change in the differential signal of the pair (numerator in the formula above).
- the voltage signals V 11 , V 12 , V 21 , V 22 , V N1 , V N2can be recorded and compared to known signal/feature templates to identify the state of the transportation system.
- FIG. 8illustrates in more detail another configuration of the output waveguides of an AWG used as a wavelength domain optical demultiplexer and detector unit according to some embodiments.
- N photodetectorsare respectively coupled to receive light from N sensors.
- the AWGspatially disperses sensor output light having centroid wavelengths ⁇ 1 , ⁇ 2 , . . . ⁇ N to the output waveguides 845 , 846 , . . . 847 .
- Sensor output light having centroid wavelength ⁇ 1is dispersed to waveguide 845 ; sensor output light having centroid wavelength ⁇ 2 is dispersed to waveguide 846 ; sensor output light having centroid wavelength ⁇ N is dispersed to waveguide 847 , etc.
- Light from output waveguide 845is optically coupled to photodetector 855 which generates signal I 1 in response to the detected light; light from output waveguide 846 is optically coupled to photodetector 856 which generates signal I 2 in response to the detected light; light from output waveguide 847 is optically coupled to photodetector 857 which generates signal I N in response to the detected light.
- the AWGcauses the spatial position of the sensor's output light to also shift. For example, if sensor output light that initially has a centroid at ⁇ 1 shifts to a centroid at ⁇ 1 + ⁇ 1 as shown in FIG. 8 , the amount of light carried by output waveguide 645 increases. Thus, the amount of light detected by photodetector 855 increases with a corresponding change in the photocurrent I 1 . Thus, vibrational emission from the transportation structure causes a shift in the sensor output light centroid from ⁇ 1 to ⁇ 1 + ⁇ 1 , which in turn causes a change in the current I 1 .
- the photocurrents I 1 , I 2 , I Ncan be converted to a voltage signals V 1 , V 2 , V N .
- the voltage signals, V 1 , V 2 , V Ncan be recorded and compared to known signal/feature templates to identify the state of the transportation system.
- Changes in the photodetector current that are caused by fluctuations of excitation light source intensitycan be differentiated from changes in photodetector current caused by wavelength shifts in sensor output light by measuring the light source intensity with an additional photodetector 899 that generates current I N+1 . Then, a wavelength shift can be calculated from the ratio I 1 /I N+1 for sensor 1, I 2 /I N+1 for sensor 2, etc.
- FIG. 9illustrates in more detail the output waveguides of an AWG used as a wavelength domain optical demultiplexer, an additional dispersive element, and a detector unit according to some embodiments.
- the output light from sensors 1, 2 . . . N having initial centroid wavelengths ⁇ 1 , ⁇ 2 , . . . ⁇ Nis respectively spatially dispersed to output waveguides 945 , 946 , . . . 947 of the AWG.
- the light from output waveguides 945 , 946 , . . . 947is incident on a linearly variable transmission structure (LVTS) 965 , 966 , . . . 967 or other spatially dispersive optical element.
- LVTSlinearly variable transmission structure
- the LVTSincludes spreading components 955 , 956 . . . 957 configured to collimate and/or spread the light from the output waveguide 945 , 946 . . . 947 across an input surface of LVTS 965 , 966 , . . . 967 .
- the spreading componentsmay not be used.
- the LVTS 965 , 966 , . . . 967comprises a dispersive element, such as a prism or a linear variable filter.
- the wavelength of the lightvaries with distance along the output surface.
- the LVTS 965 , 966 , . . . 967can serve to further demultiplex the optical signal incident at the input surface 965 a , 966 a , . . . 967 a of the LVTS 965 , 966 , . . . 967 according to the wavelength of the light.
- FIG. 9shows two wavelength bands emitted from the LVTS 965 , an initial emission band has a centroid wavelength of ⁇ 1 emitted at distance d 1 from a reference position (REF) along the output surface 965 b .
- the initial wavelength bandshifts to a wavelength band having centroid wavelength ⁇ 1 + ⁇ 1 .
- the shifted wavelength bandis emitted at distance d ⁇ 1 from the reference position.
- a photodetector pair 975is positioned relative to the LVTS 965 so that light transmitted through the LVTS 965 falls on the photodetector pair 975 .
- light having wavelength ⁇ 1may fall predominantly on photodetector 975 a and light having wavelength ⁇ 1 + ⁇ 1 may fall predominantly on photodetector 975 b .
- the photodetector 975 agenerates signal I 11 in response to light falling on its light sensitive surface and photodetector 975 b generates signal I 12 in response to light falling on its light sensitive surface.
- Photocurrents I 11 , I 12can be converted to voltage signals as previously discussed. The voltage signals can be recorded and compared to known signal/feature templates to determine the state of the transportation system.
- AWGshave been used in high speed communication systems and are designed to minimize crosstalk between adjacent channels. This is important for digital communications because the bit error rate must be made very low (on the order of 10 ⁇ 12 ) so it is suboptimal for light from one channel to leak into the next.
- Embodiments described hereininvolve AWGs specifically designed for sensing applications. These AWGs deliberately introduce crosstalk between adjacent channels.
- AWGs with crosstalkare configured so that the center-to-center spacing between adjacent output waveguides in a pair of output waveguides is less than the optical spot size at the output waveguides, where the optical spot size is the full width half maximum (FWHM) of the intensity of the spot.
- the output coupler of an AWGis shown with the spacing of the output waveguides decreased from “normal” telecom operation to introduce crosstalk between adjacent channels.
- the spacing of the array waveguidesis d, and the change in position of the optical spot at the input of the output waveguides for a change in wavelength ⁇ is given as: ⁇ x ⁇ mf ⁇ /d, where f is the distance from the array waveguides to the output waveguides (note the radius of curvature of both the input and output side of the slab waveguide is also f, so that the optical spot comes to a focus at the output waveguides).
- the spacing of a pair of output waveguidesshould represent a translation of the spot from mostly on one waveguide to mostly on the other waveguide as the FBG's reflected wavelength translates over its range. That is, for a change in reflected center wavelength ⁇ , the spacing of the pair should be chosen according to the formula above. However, the center wavelength of different pairs of output waveguides should be tailored so as to not cause interference between the different pairs (for example, if 8 channels are equally spaced in an AWG, using channels 1 and 2 for the first sensor, 4 and 5 for the second sensor, and 7 and 8 for the third sensor would provide adequate isolation between the sensor readouts in some circumstances).
- the optical spot size at a pair of output waveguidesis on the order of the lateral translation of the spot expected over the range of operation of the sensor, which should in turn be on the order of the pair spacing. If the spot is too broad compared to the spacing, the differential signal between the two output waveguides within the pair will be small, and if it is too narrow, the dynamic range of the sensor will be limited.
- the spot sizecan be estimated from diffraction considerations to be roughly 2f ⁇ /Kd, where K is the number of array waveguides and ⁇ is the operating wavelength.
- the channel spacing/spot size ratiois adjusted by keeping the spot size fixed (assuming it is already the proper size for operation, e.g., to provide optimal operation), but decreasing the output waveguide spacing.
- the channel spacingis assumed to be sufficient, e.g., optimal, according to the above considerations, but the spot size is increased to be within its optimal range by decreasing the number of array waveguides K.
- Kwe can find a good value of K by combining the equations above if we set
- adjusting the spot size relative to the channel spacingmay be implemented by moving the output waveguides away from the focal length f 0 of the array waveguides to a new distance f, such that the spot size becomes roughly Kd
- decreasing the number of sourcesbroadens the angular distribution of the light emanating from an array of coherent sources.
- This phenomenoncan be understood in analogy to a smaller lens having poorer diffraction-limited performance compared to a bigger lens. Therefore, even a relatively narrow spectral peak can be distributed across two channels so that an intensity-independent wavelength shift can be detected.
- optical time domain multiplexingis used in conjunction with optical wavelength division multiplexing and demultiplexing.
- time division multiplexing and wavelength division demultiplexingcan be combined to address a far greater number of sensors than could be addressed with either method alone.
- the use of time domain multiplexingalso facilitates recording the electrical signals of the sensors in a moving window that is synchronized in the movement of the conveyance.
- the optical switchescould be integrated onto the same substrate as the AWG allowing fabrication of modules having an identical structure.
- FIG. 12shows a configuration of a system 1200 that uses both time domain multiplexing and wavelength domain multiplexing to address multiple modules having multiple FBG sensors.
- the system 1200monitors a transportation system using M sensor modules, each module having N FBG sensors S 1 , S 2 , . . . SN disposed on a single optical fiber.
- the N FBGsare distributed in wavelength according to the output channels of an AWG 1240 used as an optical wavelength domain demultiplexer.
- the modules and the optical fibers/FBGsmay be all identically constructed.
- Lightis passed from the light source 120 to the sensor modules by way of a 1 ⁇ M optical power splitter 1201 and M circulators 1270 .
- the time domain multiplexer 1250comprises a bank of M optical switches controlled by data acquisition controller 1280 .
- the output waveguides 1231 , 1232 , . . . 1233 of the modules 1 to Mare selected one at a time and are optically coupled to the respective input waveguide of the AWG 1240 .
- the AWG 1240spatially disperses the light from the sensor modules to the AWG output waveguides 1241 and then the output light is routed to detection unit 1260 as previously discussed.
- FIG. 12depicts sensors S 1 , S 2 , . . . SN arranged so that the output light of each sensor is multiplexed onto the single output waveguide 1231 , 1232 , . . . 1233 for the module.
- FIG. 13shows an alternative configuration for multiplexing sensor output light having different wavelength bands at the module level.
- One or more FBGs 1302are disposed on a sensor optical waveguide 1303 .
- Input lightis optically coupled through a 1 ⁇ N power splitter 1371 to circulators 1370 .
- the circulators 1370connect the sensor output waveguides 1303 in parallel to through an N ⁇ 1 power splitter 1372 to the output waveguide 1320 for the module 1305 .
- the output waveguidecarries the combined (wavelength multiplexed) output light from all FBGs 1302 in the sensor module 1305 .
- the module arrangement shown in FIG. 13can be used to replace each of the modules shown in FIG. 12 , for example.
- FIG. 14depicts another monitoring system 1400 that uses time domain multiplexing and wavelength domain multiplexing in accordance with some implementations.
- the monitoring system 1400 of FIG. 14is similar in some respects to the monitoring system of 1200 of FIG. 12 and like reference numbers are used to refer to similar elements.
- System 1400replaces the M optical switches 1250 and M optical circulators 1270 with a 1 ⁇ M optical switch 1450 and an optical circulator 1470 disposed between the switch 1450 and light source 120 .
- FIG. 15illustrates a monitoring system 1500 that includes a hierarchical switching arrangement to implement optical time domain multiplexing.
- the switching arrangement 1550 in the illustrated monitoring system 1500includes a first level of four 1 ⁇ 2 optical switches 1551 (the bottom-most level of switches in FIG. 15A ) coupled to 8 sensor modules, a second level of two 1 ⁇ 2 optical switches 1552 (the next to bottom-most level of switches in FIG. 15A ) optically coupled between the first level switches 1551 and a single 1 ⁇ 2 third level optical switch 1553 .
- the switching arrangement 1550is connected to the light source 120 and the wavelength division demultiplexer (AWG) 1540 through an optical circulator 1570 .
- ATGwavelength division demultiplexer
- the switches 1551 , 1552 , 1553are controlled by data acquisition controller 1580 such that the output light from each sensor module is time multiplexed into the input waveguide 1541 of the AWG.
- the AWG 1540demultiplexes the time multiplexed sensor output light, spatially dispersing the output light according to wavelength to the output waveguides and to the detection unit 1560 .
- optical switchescan be used for the time division multiplexers discussed herein.
- Suitable optical switch technologiesinclude micro-electro-mechanical systems (MEMS) optical switches, liquid crystal switches, bubble switches, thermo-optic switches, phased-array switches, and electro-holographic switches, for example.
- MEMSmicro-electro-mechanical systems
- the data acquisition controlleris configured to synchronize the acquisition of the electrical signals with movement of the conveyance.
- the monitoring systems proposed hereinmay include one or more components that are integrated onto the same substrate.
- the photodetectorse.g., photodiodes
- the photodetectorscould be integrated directly into the output waveguides of the AWG. Integrating one or more of the monitoring system components onto the same substrate can yield substantial cost, size, and complexity savings. Note that it may be possible to integrate all components onto the same substrate, including the light source, circulator, optical switches, AWG, photodiodes, and digitizer, using electronic/photonic circuit hybrid integration methods.
- the approaches discussed hereincan provide a high degree of sensor multiplexing with a single detector portion as well as the potential for high levels of integration.
- Such an integrated devicecould potentially yield significant cost/size/performance enhancements when manufactured in high volumes as compared to non-integrated approaches.
- Fiber Bragg grating (FBG) sensorswere placed in the ballast layer at a distance of 2′′ away from the tracks as shown in FIG. 16A through 16C .
- the experimental distance of 2′′ for the experimental modelwould correspond to a distance of 3.5′ in a full-scale train system.
- FIG. 16Ashows a photograph of the G-scale train going over tracks with a ballast layer.
- FIG. 16Bis a photograph showing the location of the fiber Bragg grating sensor at standoff distance of 2′′ from tracks.
- FIG. 16Cis a photograph showing wear damage in the lower track introduced using a file for controlled damage detection tests.
- the FBGswere monitored using high-frequency data acquisition as previously discussed and shown in FIG. 13 .
- FIGS. 17A through 17Fshow electrical signals representing vibrational emission obtained from the monitoring system and FIGS. 18A through 18F show corresponding spectrograms of the vibrational emissions as the train passes over the track.
- FIGS. 17A and 18Arespectively show the high-frequency vibrational emission signal acquired by the monitoring system and the vibrational emission spectrogram for a healthy condition with no load in the carrier wagon.
- FIGS. 17B and 18Brespectively show the high-frequency vibrational emission signal acquired by the monitoring system and the vibrational emission spectrogram for a healthy condition with a load in the carrier wagon.
- FIGS. 17A and 18Arespectively show the high-frequency vibrational emission signal acquired by the monitoring system and the vibrational emission spectrogram for a healthy condition with a load in the carrier wagon.
- FIGS. 17C and 18Crespectively show a zoomed in graph of the high-frequency vibrational emission signal acquired by the monitoring system and the vibrational emission spectrogram for a healthy condition with the no load in the carrier wagon.
- FIGS. 17D and 18Drespectively show the high-frequency vibrational emission signal acquired by the monitoring system and the vibrational emission spectrogram for a rail break simulated by a gap of 2-3 mm between track sections.
- FIGS. 17E and 18Erespectively show the high-frequency vibrational emission signal acquired by the monitoring system and the vibrational emission spectrogram for with wear damage over a section of the lower rack adjacent to the FBG sensor and no load in the carrier wagon.
- FIGS. 17F and 18Frespectively show the high-frequency vibrational emission signal acquired by the monitoring system and the vibrational emission spectrogram for with wear damage over a section of the lower rack adjacent to the FBG sensor and a load in the carrier wagon.
- the frequency content of the vibrational emission signalis more clustered between 5-50 Hz and 200-500 Hz for this scaled-down train system.
- the distribution of the frequency contentdoes not change significantly with loading, as shown in FIGS. 17B and 18B or without loading as shown in FIGS. 17C and 18C .
- the signalis zoomed in for reference with the simulated break signal in time domain.
- FIGS. 17C and 18Csubtle changes in time and frequency domains can be observed for the simulated rail break. A greater number of peaks in the time domain are observed from the wheels as they pass over the rail fracture. For the wear damage mode, the vibrational emission signal is even stronger and the frequency content much broader than in the healthy case (see FIGS. 17E and 18E ). Similar results hold when the train is loaded (e.g., FIGS. 17F and 18F ) and for the wheel flat damage mode. Pattern matching algorithms applied to this data show about 85% to about 95% accuracy in identifying the load and/or defect conditions with less than about 5% false alarm rates.
- Systems, devices, or methods disclosed hereinmay include one or more of the features, structures, methods, or combinations thereof described herein.
- a device or methodmay be implemented to include one or more of the features and/or processes described herein. It is intended that such device or method need not include all of the features and/or processes described herein, but may be implemented to include selected features and/or processes that provide useful structures and/or functionality.
Landscapes
- Physics & Mathematics (AREA)
- General Physics & Mathematics (AREA)
- Engineering & Computer Science (AREA)
- Aviation & Aerospace Engineering (AREA)
- Mechanical Engineering (AREA)
- Electromagnetism (AREA)
- Analytical Chemistry (AREA)
- Chemical & Material Sciences (AREA)
- Health & Medical Sciences (AREA)
- Biomedical Technology (AREA)
- General Health & Medical Sciences (AREA)
- Power Engineering (AREA)
- Length Measuring Devices By Optical Means (AREA)
- Arrangements For Transmission Of Measured Signals (AREA)
- Investigating, Analyzing Materials By Fluorescence Or Luminescence (AREA)
Abstract
Description
Here, λiis the estimated wavelength of the ithFBG, λi0is the center wavelength of an output waveguide pair, Δλ is the wavelength spacing between the peak transmission wavelengths of an output waveguide pair, and photocurrent I2iand I2i−1represent the light intensities recorded by the photodetectors at the output of each waveguide in the pair. In some embodiments, the FBGs have a FWHM roughly equal to Δλ/2, such that as the reflected peak from the FBG shifts from one photodetector in the pair to the other, there is a continuous and monotonic change in the differential signal of the pair (numerator in the formula above). According to some embodiments, the voltage signals V11, V12, V21, V22, VN1, VN2can be recorded and compared to known signal/feature templates to identify the state of the transportation system.
Δx≈mfΔλ/d,
where f is the distance from the array waveguides to the output waveguides (note the radius of curvature of both the input and output side of the slab waveguide is also f, so that the optical spot comes to a focus at the output waveguides).
so K≈2λ/mΔλ. In addition, adjusting the spot size relative to the channel spacing may be implemented by moving the output waveguides away from the focal length f0of the array waveguides to a new distance f, such that the spot size becomes roughly Kd|f−f0|/f0.
Claims (18)
Priority Applications (4)
| Application Number | Priority Date | Filing Date | Title |
|---|---|---|---|
| US15/488,021US10317256B2 (en) | 2017-04-14 | 2017-04-14 | Monitoring transportation systems |
| JP2018058118AJP7045235B2 (en) | 2017-04-14 | 2018-03-26 | Transport monitoring system |
| AU2018202193AAU2018202193B2 (en) | 2017-04-14 | 2018-03-27 | Monitoring transportation systems |
| EP18165276.9AEP3388812B1 (en) | 2017-04-14 | 2018-03-29 | Monitoring transportation systems |
Applications Claiming Priority (1)
| Application Number | Priority Date | Filing Date | Title |
|---|---|---|---|
| US15/488,021US10317256B2 (en) | 2017-04-14 | 2017-04-14 | Monitoring transportation systems |
Publications (2)
| Publication Number | Publication Date |
|---|---|
| US20180299301A1 US20180299301A1 (en) | 2018-10-18 |
| US10317256B2true US10317256B2 (en) | 2019-06-11 |
Family
ID=61868368
Family Applications (1)
| Application Number | Title | Priority Date | Filing Date |
|---|---|---|---|
| US15/488,021Active2037-08-15US10317256B2 (en) | 2017-04-14 | 2017-04-14 | Monitoring transportation systems |
Country Status (4)
| Country | Link |
|---|---|
| US (1) | US10317256B2 (en) |
| EP (1) | EP3388812B1 (en) |
| JP (1) | JP7045235B2 (en) |
| AU (1) | AU2018202193B2 (en) |
Cited By (6)
| Publication number | Priority date | Publication date | Assignee | Title |
|---|---|---|---|---|
| US20200103223A1 (en)* | 2017-09-07 | 2020-04-02 | Frank J. Smith | Rail Break and Train Location Detection Method using Fiber Optics |
| US10900844B2 (en)* | 2016-02-15 | 2021-01-26 | Panasonic Intellectual Property Management Co., Ltd. | Stress distribution measurement method and stress distribution measurement system |
| US20220020231A1 (en)* | 2020-07-20 | 2022-01-20 | Seiko Epson Corporation | Physical quantity measurement method, measurement system, host system, and sensing apparatus |
| WO2022011487A1 (en)* | 2020-07-14 | 2022-01-20 | Rendic Munoz Mario Francisco | A continuous condition monitoring (ccm) system for conveyor belts based on a distributed optical fibre sensor |
| US20220291078A1 (en)* | 2021-02-26 | 2022-09-15 | Seiko Epson Corporation | Measurement Method, Measurement Device, Measurement System, And Measurement Program |
| US11486831B2 (en) | 2019-08-01 | 2022-11-01 | Canon Medical Systems Corporation | Specimen measurement device and control method of specimen measurement device |
Families Citing this family (14)
| Publication number | Priority date | Publication date | Assignee | Title |
|---|---|---|---|---|
| US10513279B2 (en)* | 2017-03-24 | 2019-12-24 | Canadian Pacific Railway Company | Condition based maintenance of railcar roller bearings using predictive wayside alerts based on acoustic bearing detector measurements |
| US10495610B2 (en)* | 2017-08-14 | 2019-12-03 | Geoffrey A. Cranch | Fiber optic acoustic emission sensor and apparatus |
| US10914646B2 (en)* | 2017-09-11 | 2021-02-09 | Optilab, Llc | System and method for monitoring the health of structures and machines using fiber Bragg Grating (FBG) |
| CN109951803A (en)* | 2019-04-19 | 2019-06-28 | 广东聚源管业实业有限公司 | A kind of underground piping condition display method and device based on the big data network platform |
| CN110553770B (en)* | 2019-07-17 | 2021-03-26 | 哈尔滨工程大学 | Fault diagnosis method for large drift abnormal value of sensor of ship structure stress monitoring system |
| IT201900018578A1 (en)* | 2019-10-11 | 2021-04-11 | Ace Systems Srl | MONITORING EQUIPMENT FOR MECHANICAL JOINTS OF RAILWAY RAILS |
| JP7177027B2 (en)* | 2019-11-01 | 2022-11-22 | 公益財団法人鉄道総合技術研究所 | Rail wavy wear progress detection method and progress detection system |
| EP3819619B1 (en)* | 2019-11-11 | 2024-06-26 | Bayerische Motoren Werke Aktiengesellschaft | Apparatus and method for monitoring a load or an integrity of a mechanical object |
| CN110849472B (en)* | 2019-11-28 | 2021-07-13 | 昆山龙腾光电股份有限公司 | Light sense detection device and display terminal |
| CN113954927A (en)* | 2021-10-15 | 2022-01-21 | 浙江众合科技股份有限公司 | Degradation management method for train-vehicle communication train control system |
| CN114440784B (en)* | 2022-01-11 | 2023-07-04 | 中铁第四勘察设计院集团有限公司 | Self-adaptive high-speed magnetic levitation turnout with space linear reconstruction function |
| KR20230123268A (en)* | 2022-02-16 | 2023-08-23 | 한국철도기술연구원 | Method for detecting rail fracture using image transformation of vibration data measured by distributed acoustic sensing technology |
| NL2034038B1 (en)* | 2023-01-27 | 2024-08-16 | Photonfirst Tech B V | Detecting light reflected from DBRs using TDM and WDM |
| CN119245885B (en)* | 2024-12-05 | 2025-03-28 | 山东高速工程检测有限公司 | A bridge fiber grating demodulator stress wave analysis system and method |
Citations (71)
| Publication number | Priority date | Publication date | Assignee | Title |
|---|---|---|---|---|
| US4240747A (en) | 1979-10-03 | 1980-12-23 | Battelle Memorial Institute | Refractive-index responsive light-signal system |
| JPS63301470A (en) | 1987-05-30 | 1988-12-08 | Tomoo Matsuo | Battery charging system |
| US5660944A (en) | 1994-03-31 | 1997-08-26 | Varta Batterie Aktiengesellschaft | Multicell storage battery |
| US5949219A (en) | 1998-07-24 | 1999-09-07 | The United States Of America As Represented By The United States Department Of Energy | Optical state-of-charge monitor for batteries |
| US5995686A (en) | 1997-12-16 | 1999-11-30 | Hamburger; Robert N. | Fiber-optic sensor device and method |
| US6051437A (en) | 1998-05-04 | 2000-04-18 | American Research Corporation Of Virginia | Optical chemical sensor based on multilayer self-assembled thin film sensors for aquaculture process control |
| US6265100B1 (en) | 1998-02-23 | 2001-07-24 | Research International, Inc. | Rechargeable battery |
| US6285807B1 (en) | 1998-11-16 | 2001-09-04 | Trustees Of Tufts College | Fiber optic sensor for long-term analyte measurements in fluids |
| US6379969B1 (en) | 2000-03-02 | 2002-04-30 | Agilent Technologies, Inc. | Optical sensor for sensing multiple analytes |
| US20040033004A1 (en) | 2001-10-09 | 2004-02-19 | Welch David F. | Optical signal receiver photonic integrated circuit (RxPIC), an associated optical signal transmitter photonic integrated circuit (TxPIC) and an optical network transmission system utilizing these circuits |
| US6828055B2 (en) | 2001-07-27 | 2004-12-07 | Hewlett-Packard Development Company, L.P. | Bipolar plates and end plates for fuel cells and methods for making the same |
| US20050026134A1 (en) | 2002-04-10 | 2005-02-03 | Bioprocessors Corp. | Systems and methods for control of pH and other reactor environment conditions |
| EP1324516B1 (en) | 2001-12-21 | 2005-12-14 | Agilent Technologies, Inc. (a Delaware corporation) | Apparatus for detecting cross-talk and method therefor |
| US20060045412A1 (en) | 2004-09-02 | 2006-03-02 | National Research Council Of Canada | Simultaneous interrogation of multi wavelength-modulated fiber optical sensors by modulating an arrayed waveguide grating based demultiplexer |
| US7135342B2 (en) | 2001-05-04 | 2006-11-14 | Sensors For Medicine And Science, Inc. | Electro-optical sensing device with reference channel |
| US7155075B2 (en) | 2004-03-29 | 2006-12-26 | General Electric Company | Optical battery temperature monitoring system and method |
| US7263246B1 (en) | 2006-02-21 | 2007-08-28 | United States Of America Department Of Energy | Oxygen detection using evanescent fields |
| US7306951B1 (en) | 1999-06-08 | 2007-12-11 | Midwest Research Institute | Method and apparatus for determining diffusible hydrogen concentrations |
| US7310153B2 (en) | 2004-08-23 | 2007-12-18 | Palo Alto Research Center, Incorporated | Using position-sensitive detectors for wavelength determination |
| US7315667B2 (en) | 2005-12-22 | 2008-01-01 | Palo Alto Research Center Incorporated | Propagating light to be sensed |
| US20080019701A1 (en)* | 2004-03-29 | 2008-01-24 | Hwa Yaw Tam | Railway Monitoring System |
| US20080089705A1 (en) | 2004-12-14 | 2008-04-17 | Palo Alto Research Center Incorporated | Xerographic micro-assembler |
| US7427782B2 (en) | 2004-03-29 | 2008-09-23 | Articulated Technologies, Llc | Roll-to-roll fabricated light sheet and encapsulated semiconductor circuit devices |
| US20080231836A1 (en) | 2005-08-02 | 2008-09-25 | Societe Bic | Fuel Cell with Fuel Monitoring System and Method of Use |
| US7433552B2 (en) | 2005-12-22 | 2008-10-07 | Palo Alto Research Center Incorporated | Obtaining analyte information |
| US20090027009A1 (en) | 2007-07-23 | 2009-01-29 | Ac Propulsion, Inc., A California Corporation | System and method for battery management |
| US7511823B2 (en) | 2004-12-21 | 2009-03-31 | Halliburton Energy Services, Inc. | Fiber optic sensor |
| US20090091759A1 (en) | 2007-10-05 | 2009-04-09 | Lightwaves 2020, Inc. | Multiple Wavelength Optical Analyzer Device |
| US7522786B2 (en) | 2005-12-22 | 2009-04-21 | Palo Alto Research Center Incorporated | Transmitting light with photon energy information |
| US20090220189A1 (en) | 2005-12-22 | 2009-09-03 | Palo Alto Research Center Incorporated | Transmitting Light with Lateral Variation |
| US7589312B2 (en) | 2006-12-15 | 2009-09-15 | Hitachi Cable, Ltd. | Physical quantity measuring system with fiber Bragg grating sensor and arrayed waveguide grating |
| US20090274849A1 (en) | 2008-04-30 | 2009-11-05 | Medtronic, Inc. | Formation process for lithium-ion batteries |
| US20100032009A1 (en) | 2003-11-03 | 2010-02-11 | Sustainable Technologies International Pty Ltd. | Multilayered photovoltaic device on envelope surface |
| US7695970B2 (en) | 2005-03-04 | 2010-04-13 | University Of Connecticut | Optical fiber based fluorescence sensor for in-situ measurement and control of fuel cells |
| US7718948B2 (en) | 2006-12-04 | 2010-05-18 | Palo Alto Research Center Incorporated | Monitoring light pulses |
| US7766544B2 (en) | 2005-04-28 | 2010-08-03 | Honda Motor Co., Ltd. | Temperature sensor mounting structure and battery module structure |
| US20100192365A1 (en) | 2008-03-03 | 2010-08-05 | Palo Alto Research Center, Incorporated | Micro-assembler |
| US20100247027A1 (en) | 2009-03-30 | 2010-09-30 | General Electric Company | Optical sensors, systems, and methods of making |
| US20110081493A1 (en) | 2008-06-04 | 2011-04-07 | Takehiro Matsushita | Method for production of ink-jet head |
| US8097352B2 (en) | 2010-04-27 | 2012-01-17 | Empire Technology Development Llc | Battery system and battery safety alarm system |
| US8143070B2 (en) | 2007-06-05 | 2012-03-27 | Ecolab Usa Inc. | Optical cell |
| US8148165B2 (en) | 2008-01-25 | 2012-04-03 | Japan Agency For Marine-Earth Science And Technology | Apparatus and method for measuring concentration of carbon dioxide in water |
| US8241911B2 (en) | 2008-11-07 | 2012-08-14 | Mocon, Inc. | Calibration card for photoluminescent oxygen sensors with zero point maintained with a metal-air battery |
| US20120232354A1 (en) | 2011-03-09 | 2012-09-13 | Medtronic, Inc. | Optical sensor system and measurement method |
| US8268493B2 (en) | 2006-05-30 | 2012-09-18 | University Of Connecticut | Fiber optic based in-situ diagnostics for PEM fuel cells |
| US20120321242A1 (en) | 2010-01-25 | 2012-12-20 | Wolfgang Schade | Sensor element and method for the production thereof and use thereof |
| US20130071739A1 (en) | 2011-09-21 | 2013-03-21 | Semiconductor Energy Laboratory Co., Ltd. | Negative electrode for power storage device and power storage device |
| WO2013111698A1 (en) | 2012-01-23 | 2013-08-01 | 株式会社豊田自動織機 | Optical fiber for temperature sensor and power device monitoring system |
| US20130222811A1 (en)* | 2010-11-11 | 2013-08-29 | Fotech Solutions Limited | Distributed Optical Fibre Sensor |
| EP2492989B1 (en) | 2011-02-24 | 2013-10-16 | Samsung SDI Co., Ltd. | Pouch type battery and method of manufacturing the same |
| US20130316198A1 (en) | 2012-05-22 | 2013-11-28 | Lawrence Livermore National Security, Llc | Battery management systems with thermally integrated fire suppression |
| US20130312947A1 (en) | 2012-05-22 | 2013-11-28 | Lawerence Livermore National Security, Llc | Li-ion battery thermal runaway suppression system using microchannel coolers and refrigerant injections |
| US20130314094A1 (en) | 2012-05-23 | 2013-11-28 | Lawrence Livermore National Security, Llc | Battery management system with distributed wireless sensors |
| WO2014026093A1 (en) | 2012-08-10 | 2014-02-13 | Battelle Memorial Institute | Optical monitoring of battery health |
| US20140072836A1 (en) | 2011-04-05 | 2014-03-13 | Blacklight Power, Inc. | H2o-based electrochemical hydrogen-catalyst power system |
| US20140092375A1 (en) | 2012-09-28 | 2014-04-03 | Palo Alto Research Center Incorporated | Monitoring and management for energy storage devices |
| US8729862B2 (en) | 2010-12-17 | 2014-05-20 | Lenovo (Singapore) Pte. Ltd. | Controlled regeneration of solid electrolyte interface for prolonged cycling of lithium batteries |
| US20140203783A1 (en) | 2012-09-28 | 2014-07-24 | Palo Alto Research Center Incorporated | Monitoring/Managing Electrochemical Energy Device Using Detected Intercalation Stage Changes |
| US8808890B2 (en) | 2010-03-29 | 2014-08-19 | Empire Technology Development Llc | Battery system and battery safety alarm system |
| US20140272493A1 (en) | 2013-03-12 | 2014-09-18 | Energy Storage Systems, Inc. | Methods to prepare stable electrolytes for all iron redox flow batteries |
| WO2014152592A1 (en) | 2013-03-15 | 2014-09-25 | Sandia Corporation | Printed crystalline microelectronic devices |
| US20140312828A1 (en) | 2013-03-15 | 2014-10-23 | Design Flux Technologies, Llc | Method and apparatus for creating a dynamically reconfigurable energy storage device |
| US20140363747A1 (en) | 2013-06-07 | 2014-12-11 | Energy Storage Systems, Inc. | Method and system for rebalancing electrolytes in a redox flow battery system |
| US9000718B2 (en) | 2011-02-21 | 2015-04-07 | Samsung Sdi Co., Ltd. | Battery management system including switch |
| US20150214757A1 (en) | 2014-01-07 | 2015-07-30 | Regan Zane | Battery control |
| US20150255824A1 (en) | 2014-03-06 | 2015-09-10 | Energy Storage Systems, Inc. | Method and system to maintain electrolyte stability for all-iron redox flow batteries |
| US20150321682A1 (en)* | 2012-12-06 | 2015-11-12 | Siemens Aktiengesellschaft | Locating of vehicles |
| US20160018319A1 (en) | 2014-07-15 | 2016-01-21 | Palo Alto Research Center Incorporated | Energy system monitoring |
| US20160334543A1 (en)* | 2014-09-30 | 2016-11-17 | Alstom Transport Technologies | Vibration monitoring system and method |
| US9553465B2 (en) | 2014-04-21 | 2017-01-24 | Palo Alto Research Center Incorporated | Battery management based on internal optical sensing |
| US9583796B2 (en) | 2014-04-01 | 2017-02-28 | Palo Alto Research Center Incorporated | Method for monitoring/managing electrochemical energy device by detecting intercalation stage changes |
Family Cites Families (11)
| Publication number | Priority date | Publication date | Assignee | Title |
|---|---|---|---|---|
| CA2240664A1 (en)* | 1995-12-15 | 1997-07-03 | Structural Integrity Monitoring Systems | Structural monitoring sensor system |
| US8106917B2 (en)* | 2006-06-29 | 2012-01-31 | Broadcom Corporation | Method and system for mosaic mode display of video |
| ITBN20060004A1 (en)* | 2006-09-20 | 2006-12-20 | Antonello Cutolo | FIBER OPTIC TRANSMISSION SYSTEM FOR THE PARAMETER MONITORING AND THE IMPROVEMENT OF THE SAFETY OF A RAILWAY LINE |
| US7668411B2 (en)* | 2008-06-06 | 2010-02-23 | Schlumberger Technology Corporation | Distributed vibration sensing system using multimode fiber |
| JP5464435B2 (en)* | 2010-04-09 | 2014-04-09 | ソニー株式会社 | Image decoding apparatus and method |
| RU2011118415A (en)* | 2011-05-06 | 2012-11-20 | Сименс Акциенгезелльшафт (DE) | METHOD FOR MONITORING RAILWAYS BASED ON FIBER OPTICS |
| WO2013123366A1 (en)* | 2012-02-16 | 2013-08-22 | Paragon 28, Inc. | Charco-resis implant, alignment instrument, system and method of use |
| GB201203273D0 (en)* | 2012-02-24 | 2012-04-11 | Qinetiq Ltd | Monitoring transport network infrastructure |
| TR201405723A2 (en)* | 2014-05-22 | 2015-09-21 | Sabri Haluk Goekmen | System which senses rail fractures and cracks through the method of reflection |
| JP2016033970A (en)* | 2014-07-31 | 2016-03-10 | セイコーエプソン株式会社 | Ultrasonic device and method for manufacturing the same, and probe and electronic equipment |
| GB201414616D0 (en)* | 2014-08-18 | 2014-10-01 | Optasense Holdings Ltd | Detection of anomalies in rail wheelsets |
- 2017
- 2017-04-14USUS15/488,021patent/US10317256B2/enactiveActive
- 2018
- 2018-03-26JPJP2018058118Apatent/JP7045235B2/enactiveActive
- 2018-03-27AUAU2018202193Apatent/AU2018202193B2/ennot_activeCeased
- 2018-03-29EPEP18165276.9Apatent/EP3388812B1/enactiveActive
Patent Citations (75)
| Publication number | Priority date | Publication date | Assignee | Title |
|---|---|---|---|---|
| US4240747A (en) | 1979-10-03 | 1980-12-23 | Battelle Memorial Institute | Refractive-index responsive light-signal system |
| JPS63301470A (en) | 1987-05-30 | 1988-12-08 | Tomoo Matsuo | Battery charging system |
| US5660944A (en) | 1994-03-31 | 1997-08-26 | Varta Batterie Aktiengesellschaft | Multicell storage battery |
| US5995686A (en) | 1997-12-16 | 1999-11-30 | Hamburger; Robert N. | Fiber-optic sensor device and method |
| US6265100B1 (en) | 1998-02-23 | 2001-07-24 | Research International, Inc. | Rechargeable battery |
| US6051437A (en) | 1998-05-04 | 2000-04-18 | American Research Corporation Of Virginia | Optical chemical sensor based on multilayer self-assembled thin film sensors for aquaculture process control |
| US5949219A (en) | 1998-07-24 | 1999-09-07 | The United States Of America As Represented By The United States Department Of Energy | Optical state-of-charge monitor for batteries |
| US6285807B1 (en) | 1998-11-16 | 2001-09-04 | Trustees Of Tufts College | Fiber optic sensor for long-term analyte measurements in fluids |
| US7306951B1 (en) | 1999-06-08 | 2007-12-11 | Midwest Research Institute | Method and apparatus for determining diffusible hydrogen concentrations |
| US6379969B1 (en) | 2000-03-02 | 2002-04-30 | Agilent Technologies, Inc. | Optical sensor for sensing multiple analytes |
| US7135342B2 (en) | 2001-05-04 | 2006-11-14 | Sensors For Medicine And Science, Inc. | Electro-optical sensing device with reference channel |
| US6828055B2 (en) | 2001-07-27 | 2004-12-07 | Hewlett-Packard Development Company, L.P. | Bipolar plates and end plates for fuel cells and methods for making the same |
| US20040033004A1 (en) | 2001-10-09 | 2004-02-19 | Welch David F. | Optical signal receiver photonic integrated circuit (RxPIC), an associated optical signal transmitter photonic integrated circuit (TxPIC) and an optical network transmission system utilizing these circuits |
| EP1324516B1 (en) | 2001-12-21 | 2005-12-14 | Agilent Technologies, Inc. (a Delaware corporation) | Apparatus for detecting cross-talk and method therefor |
| US20050026134A1 (en) | 2002-04-10 | 2005-02-03 | Bioprocessors Corp. | Systems and methods for control of pH and other reactor environment conditions |
| US20100032009A1 (en) | 2003-11-03 | 2010-02-11 | Sustainable Technologies International Pty Ltd. | Multilayered photovoltaic device on envelope surface |
| US7155075B2 (en) | 2004-03-29 | 2006-12-26 | General Electric Company | Optical battery temperature monitoring system and method |
| US20080019701A1 (en)* | 2004-03-29 | 2008-01-24 | Hwa Yaw Tam | Railway Monitoring System |
| US7427782B2 (en) | 2004-03-29 | 2008-09-23 | Articulated Technologies, Llc | Roll-to-roll fabricated light sheet and encapsulated semiconductor circuit devices |
| US7701590B2 (en) | 2004-08-23 | 2010-04-20 | Palo Alto Research Center Incorporated | Apparatus, methods, devices, and systems in which differences and/or changes in photosensed positions and/or quantities relate to shifts and/or differences in photon energies |
| US7310153B2 (en) | 2004-08-23 | 2007-12-18 | Palo Alto Research Center, Incorporated | Using position-sensitive detectors for wavelength determination |
| US20060045412A1 (en) | 2004-09-02 | 2006-03-02 | National Research Council Of Canada | Simultaneous interrogation of multi wavelength-modulated fiber optical sensors by modulating an arrayed waveguide grating based demultiplexer |
| US20080089705A1 (en) | 2004-12-14 | 2008-04-17 | Palo Alto Research Center Incorporated | Xerographic micro-assembler |
| US7511823B2 (en) | 2004-12-21 | 2009-03-31 | Halliburton Energy Services, Inc. | Fiber optic sensor |
| US7695970B2 (en) | 2005-03-04 | 2010-04-13 | University Of Connecticut | Optical fiber based fluorescence sensor for in-situ measurement and control of fuel cells |
| US7766544B2 (en) | 2005-04-28 | 2010-08-03 | Honda Motor Co., Ltd. | Temperature sensor mounting structure and battery module structure |
| US20080231836A1 (en) | 2005-08-02 | 2008-09-25 | Societe Bic | Fuel Cell with Fuel Monitoring System and Method of Use |
| US7433552B2 (en) | 2005-12-22 | 2008-10-07 | Palo Alto Research Center Incorporated | Obtaining analyte information |
| US7522786B2 (en) | 2005-12-22 | 2009-04-21 | Palo Alto Research Center Incorporated | Transmitting light with photon energy information |
| US20090220189A1 (en) | 2005-12-22 | 2009-09-03 | Palo Alto Research Center Incorporated | Transmitting Light with Lateral Variation |
| US8437582B2 (en) | 2005-12-22 | 2013-05-07 | Palo Alto Research Center Incorporated | Transmitting light with lateral variation |
| US8594470B2 (en) | 2005-12-22 | 2013-11-26 | Palo Alto Research Center Incorporated | Transmittting light with lateral variation |
| US7315667B2 (en) | 2005-12-22 | 2008-01-01 | Palo Alto Research Center Incorporated | Propagating light to be sensed |
| US7263246B1 (en) | 2006-02-21 | 2007-08-28 | United States Of America Department Of Energy | Oxygen detection using evanescent fields |
| US8268493B2 (en) | 2006-05-30 | 2012-09-18 | University Of Connecticut | Fiber optic based in-situ diagnostics for PEM fuel cells |
| US7718948B2 (en) | 2006-12-04 | 2010-05-18 | Palo Alto Research Center Incorporated | Monitoring light pulses |
| US7589312B2 (en) | 2006-12-15 | 2009-09-15 | Hitachi Cable, Ltd. | Physical quantity measuring system with fiber Bragg grating sensor and arrayed waveguide grating |
| US8143070B2 (en) | 2007-06-05 | 2012-03-27 | Ecolab Usa Inc. | Optical cell |
| US20090027009A1 (en) | 2007-07-23 | 2009-01-29 | Ac Propulsion, Inc., A California Corporation | System and method for battery management |
| US20090091759A1 (en) | 2007-10-05 | 2009-04-09 | Lightwaves 2020, Inc. | Multiple Wavelength Optical Analyzer Device |
| US8148165B2 (en) | 2008-01-25 | 2012-04-03 | Japan Agency For Marine-Earth Science And Technology | Apparatus and method for measuring concentration of carbon dioxide in water |
| US20100192365A1 (en) | 2008-03-03 | 2010-08-05 | Palo Alto Research Center, Incorporated | Micro-assembler |
| US20090274849A1 (en) | 2008-04-30 | 2009-11-05 | Medtronic, Inc. | Formation process for lithium-ion batteries |
| US20110081493A1 (en) | 2008-06-04 | 2011-04-07 | Takehiro Matsushita | Method for production of ink-jet head |
| US8241911B2 (en) | 2008-11-07 | 2012-08-14 | Mocon, Inc. | Calibration card for photoluminescent oxygen sensors with zero point maintained with a metal-air battery |
| US20100247027A1 (en) | 2009-03-30 | 2010-09-30 | General Electric Company | Optical sensors, systems, and methods of making |
| US20120321242A1 (en) | 2010-01-25 | 2012-12-20 | Wolfgang Schade | Sensor element and method for the production thereof and use thereof |
| US8808890B2 (en) | 2010-03-29 | 2014-08-19 | Empire Technology Development Llc | Battery system and battery safety alarm system |
| US8097352B2 (en) | 2010-04-27 | 2012-01-17 | Empire Technology Development Llc | Battery system and battery safety alarm system |
| US20130222811A1 (en)* | 2010-11-11 | 2013-08-29 | Fotech Solutions Limited | Distributed Optical Fibre Sensor |
| US8729862B2 (en) | 2010-12-17 | 2014-05-20 | Lenovo (Singapore) Pte. Ltd. | Controlled regeneration of solid electrolyte interface for prolonged cycling of lithium batteries |
| US9000718B2 (en) | 2011-02-21 | 2015-04-07 | Samsung Sdi Co., Ltd. | Battery management system including switch |
| EP2492989B1 (en) | 2011-02-24 | 2013-10-16 | Samsung SDI Co., Ltd. | Pouch type battery and method of manufacturing the same |
| US20120232354A1 (en) | 2011-03-09 | 2012-09-13 | Medtronic, Inc. | Optical sensor system and measurement method |
| US20140072836A1 (en) | 2011-04-05 | 2014-03-13 | Blacklight Power, Inc. | H2o-based electrochemical hydrogen-catalyst power system |
| US20130071739A1 (en) | 2011-09-21 | 2013-03-21 | Semiconductor Energy Laboratory Co., Ltd. | Negative electrode for power storage device and power storage device |
| WO2013111698A1 (en) | 2012-01-23 | 2013-08-01 | 株式会社豊田自動織機 | Optical fiber for temperature sensor and power device monitoring system |
| US20130312947A1 (en) | 2012-05-22 | 2013-11-28 | Lawerence Livermore National Security, Llc | Li-ion battery thermal runaway suppression system using microchannel coolers and refrigerant injections |
| US20130316198A1 (en) | 2012-05-22 | 2013-11-28 | Lawrence Livermore National Security, Llc | Battery management systems with thermally integrated fire suppression |
| US20130314094A1 (en) | 2012-05-23 | 2013-11-28 | Lawrence Livermore National Security, Llc | Battery management system with distributed wireless sensors |
| WO2014026093A1 (en) | 2012-08-10 | 2014-02-13 | Battelle Memorial Institute | Optical monitoring of battery health |
| US9203122B2 (en) | 2012-09-28 | 2015-12-01 | Palo Alto Research Center Incorporated | Monitoring and management for energy storage devices |
| US20140092375A1 (en) | 2012-09-28 | 2014-04-03 | Palo Alto Research Center Incorporated | Monitoring and management for energy storage devices |
| US20140203783A1 (en) | 2012-09-28 | 2014-07-24 | Palo Alto Research Center Incorporated | Monitoring/Managing Electrochemical Energy Device Using Detected Intercalation Stage Changes |
| US20150321682A1 (en)* | 2012-12-06 | 2015-11-12 | Siemens Aktiengesellschaft | Locating of vehicles |
| US20140272493A1 (en) | 2013-03-12 | 2014-09-18 | Energy Storage Systems, Inc. | Methods to prepare stable electrolytes for all iron redox flow batteries |
| WO2014152592A1 (en) | 2013-03-15 | 2014-09-25 | Sandia Corporation | Printed crystalline microelectronic devices |
| US20140312828A1 (en) | 2013-03-15 | 2014-10-23 | Design Flux Technologies, Llc | Method and apparatus for creating a dynamically reconfigurable energy storage device |
| US20140363747A1 (en) | 2013-06-07 | 2014-12-11 | Energy Storage Systems, Inc. | Method and system for rebalancing electrolytes in a redox flow battery system |
| US20150214757A1 (en) | 2014-01-07 | 2015-07-30 | Regan Zane | Battery control |
| US20150255824A1 (en) | 2014-03-06 | 2015-09-10 | Energy Storage Systems, Inc. | Method and system to maintain electrolyte stability for all-iron redox flow batteries |
| US9583796B2 (en) | 2014-04-01 | 2017-02-28 | Palo Alto Research Center Incorporated | Method for monitoring/managing electrochemical energy device by detecting intercalation stage changes |
| US9553465B2 (en) | 2014-04-21 | 2017-01-24 | Palo Alto Research Center Incorporated | Battery management based on internal optical sensing |
| US20160018319A1 (en) | 2014-07-15 | 2016-01-21 | Palo Alto Research Center Incorporated | Energy system monitoring |
| US20160334543A1 (en)* | 2014-09-30 | 2016-11-17 | Alstom Transport Technologies | Vibration monitoring system and method |
Non-Patent Citations (54)
| Title |
|---|
| Bellmann et al., "Compact and fast read-out for wavelength-encoded biosensors", Feb. 1, 2010, 7 pages. |
| Cao-Paz et al., "A Multi-Point Sensor Based on Optical Fiber for the Measurement of Electrolyte Density in Lead-Acid Batteries", Sensors 2010, 10, pp. 2587-2608. |
| Chehura et al. "Temperature and strain discrimination using a single tilted fibre Bragg grating", Opt. Commun., vol. 275, No. 2, Jul. 2007, pp. 344-347. |
| Chuang et al., "Fiber Optical Sensors for High-Speed Rail Applications", Transportation Research Board of the National Academies, Aug. 2003, 40 pages. |
| Corbellini et al., "Modified POF Sensor for Gaseous Hydrogen Fluoride Monitoring in the Presence of Ionizing Radiations", IEEE Transactions on Instrumentation and Measurement, vol. 61, No. 5, May 2012, pp. 1201-1208. |
| EP Search Report from EP App. No. 18168635.3 dated Sep. 10, 2018, 6 pages. |
| Grobnic et al., "Sapphire Fiber Bragg Grating Sensor Made Using Femtosecond Laser Radiation for Ultrahigh Temperature Applications", IEEE Photonics Technology Letters, vol. 16, No. 11, Nov. 2004, p. 2505-2507. |
| Guan et al. "Simultaneous strain and temperature measurement using a single fibre Bragg grating", Electron. Lett.,vol. 36, No. 12, 2000, pp. 1018-1019. |
| Haase, "Strain Sensors Based on Bragg Gratings", IMEKO 20th TC3, 3rd TC16 and 1st TC22 International Conference Cultivating Metrological Knowledge, Nov. 27, 2007, 8 pages. |
| Holcomb et al., "Feasibility Study of Fiber-Optic Technology for Broken Rail Detection", U.S. Department of Transportation, Oct. 2013, 26 pages. |
| Jansen et al., "Low-Cost Flexible Packaging for High-Power Li-Ion HEV Batteries", FreedomCar & Vehicle Technologies Office, Jun. 2004, 56 pages. |
| Jin et al. "Geometric representation of errors in measurements of strain and temperature", Opt. Eng., vol. 36, No. 8, 1997, pp. 2272-2278. |
| Jin et al. "Simultaneous measurement of strain and temperature: error analysis". Opt. Eng . ⋅ vol. 36, No. 2, 1997. pp. 598-609. |
| Juergens et al., "Performance Evaluation of Fiber Bragg Gratings at Elevated Temperatures", NASA, Jan. 2004, 14 pages. |
| Kersey et al., "Fiber Grating Sensors", Journal of Lightwave Technology, vol. 15, No. 8, Aug. 1997, pp. 1442-1463. |
| Klein et al., "Optimal Charging Strategies in Lithium-Ion Battery", 2011 American Control Conference, Jun. 29-Jul. 1, 2011, pp. 382-387. |
| Koch et al., "Arrayed waveguide grating interrogator for fiber Bragg grating sensors: measurement and simulation", Applied Optics, vol. 51, No. 31, Nov. 1, 2012, pp. 7718-7723. |
| Kumai et al., "Gas Generation Mechanism Due to Electrolyte Decomposition in Commercial Lithium-Ion Cell", Journal of Power Sources 81-82, 1999, pp. 715-719. |
| Lee et al., "In Situ Monitoring of Temperature Inside Lithium-Ion Batteries by Flexible Micro Temperature Sensors", Sensors 2011, 11, pp. 9942-9950. |
| Li et al., "Preliminary Investigation of an SOI-based Arrayed Waveguide Grating Demodulation Integration Microsystem" Scientific Reports, May 6, 2014, 6 pages. |
| Liang et al., "Highly Sensitive Fiber Bragg Grating Refractive Index Sensors", Applied Physics Letters, vol. 86, 2005, pp. 151122-1-151122-3. |
| Liu et al., "Analysis of Causes of Major Train Derailment and Their Effect on Accident Rates", Journal of the Transportation Research Board, No. 2289, 2012, pp. 154-163. |
| Magel, "Rolling Contact Fatigue: A Comprehensive Review", Transportation Research Board of the National Academies, Nov. 2011, 132 pages. |
| Merzbacher et al., "Fiber Optic Sensors in Concrete Structures: A Review", Smart Mater. Struct., 5, 1996, pp. 196-280. |
| Micron Optics, "Optical Fiber Sensors Guide", 21 pages. |
| Mouawad, "Railroad Agency Details New Rail-Track Standards", The New York Times, Oct. 9, 2015, 3 pages. |
| Niewczas et al. "Performance Analysis of the Fiber Bragg Grating Interrogation System Based on an Arrayed Waveguide Grating", IEEE Transactions on Instrumentation and Measurement, vol. 53, No. 4, Aug. 2004, pp. 1192-1195. |
| Patrick et al. "Hybrid fiber Bragg grating/long period fiber grating sensor for strain/temperature discrimination", IEEE Photonics Technol. Lett., vol. 8, No. 9, 1996, pp. 1223-1225. |
| Pinson et al., Theory of SEI Formation in Rechargeable Batteries: Capacity Fade, Accelerated Aging and Lifetime Prediction, 223rd ECS Meeting, May 12-17, 2013, 29 pages. |
| Qi et al., "In Situ Observation of Strains During Lithiation of a Graphite Electrode", Journal of the Electrochemical Society, vol. 157 (6), 2010, pp. A741-A747. |
| Qin et al., "Specific Fluorescence Determination of Lithium Ion Based on 2-(2-hydroxyphenyl)benzoxazole", The Royal Society of Chemistry, 2001, pp. 1499-1501. |
| Rao: "In-fibre Bragg grating sensors", Meas. Sci. Technol., vol. 8, No. 4, Apr. 1997, pp. 355-375. |
| Reimers et al. "Electrochemical and In Situ X-Ray Diffraction Studies of Lithium Intercalation in Li x Co02", Journal of the Electrochemical Society, 139 (8),1992. |
| Rodrigues et al., "A Review of State-of-Charge Indication of Batteries by Means of A.C. Impedance Measurements", Journal of Power Sources, vol. 87, 2000, pp. 12-20. |
| Roth et al., "Thermal Abuse Performance of 18650 Li-Ion Cells", Sandia Report, Mar. 2004, pp. 1-139. |
| Saha et al. "Battery Data Set", NASA Ames Prognostics Data Repository, 2007, Available online: http://tLarc.nasa.gov/tech/dash/pcoe/prognostic-data-repository/. |
| Saha et al., "Model-Based Approach for Optimal Maintenance Strategy", European Conference of the Prognostics and Health Management Society, 2014, pp. 1-5. |
| Sang et al., "Temperature-Insensitive Chemical Sensor Based on a Fiber Bragg Grating", Sensors and Actuators B 120, 2007, pp. 754-757. |
| Schuh et al., "High-resolution, high-frequency wavelength shift detection of optical signals with low-cost compact readouts", Fiber Optic Sensors and Applications XII, Proc. of SPIE, vol. 9480, 2015, 7 pages. |
| Scruby, "An introduction to acoustic emission", Journal of Physics E: Scientific Instruments, vol. 20, 946, 1987. |
| Sethurman et al. "Surface structural disordering in graphite upon lithium intercalation/deintercalation", Journal of Power Sources 195 (2010) 3655-3660. |
| Siegel et al., "Neutron Imaging of Lithium Concentration in FLP Pouch Cell Battery", Journal of the Electrochemical Society, 158 (6), 2011, 8 pages. |
| Smith et al., "Power and Thermal Characterization of a Lithium-Ion Battery Pack for Hybrid-Electric Vehicles", Journal of Power Sources 160, 2006, pp. 662-673. |
| Tang et al., "Measurement of Chloride-Ion Concentration with Long-Period Grating Technology", Smart Mater. Struct. vol. 16, 2007, pp. 665-672. |
| Triollet et al. "Discriminated measures of strain and temperature in metallic specimen with embedded superimposed long and short fibre Bragg gratings", Meas. Sci. Technol., vol. 22, No. 1, Jan. 2011, pp. 015202. |
| Udd et al., "Fiber Optic Distributed Sensing Systems for harsh Aerospace Environments", 12 pages. |
| Van Steenkiste et al., "Strain and Temperature Measurement with Fiber Optic Sensors", 1997, 9 pages. |
| Walker et al., "Acoustic Bearing Detectors and Bearing Failures", Technology Digest, TD-07-024, Sep. 2007, 4 pages. |
| Wang et al. "Simultaneous measurement of strain and temperature using dual-period fiber grating", Proc. SP!E, vol. 4579, 2001, pp. 265-268. |
| Wang et al. "Understanding Volume Change in Lithium-Ion Cells during Charging and Discharging Using In Situ Measurements", Journal of The Electrochemical Society, 154 (1), 2007. |
| Wang et al., "Aging Effects to Solid Electrolyte Interface (SEI) Membrane Formation and the Performance Analysis of Lithium Ion Batteries", Int. J. Electrochem, Sci., 6, 2011, pp. 1014-1026. |
| Xu et al. "Discrimination between strain and temperature effects using dual-wavelength fibre grating sensors", Electron. Lett., vol. 30, No. 13, pp. 1085-1087, 1994. |
| Zhao et al. "Discrimination methods and demodulation techniques for fiber Bragg grating sensors", Opt. Lasers Eng., vol. 41, No. 1, pp. 1-18, Jan. 2004. |
| Zhou et al. "Simultaneous measurement for strain and temperature using fiber Bragg gratings and multimode fibers", Appl. Opt., vol. 47, No. 10, Apr. 2008, pp. 1668-1672. |
Cited By (8)
| Publication number | Priority date | Publication date | Assignee | Title |
|---|---|---|---|---|
| US10900844B2 (en)* | 2016-02-15 | 2021-01-26 | Panasonic Intellectual Property Management Co., Ltd. | Stress distribution measurement method and stress distribution measurement system |
| US11906370B2 (en) | 2016-02-15 | 2024-02-20 | Panasonic Intellectual Property Management Co., Ltd. | Stress distribution measurement method and stress distribution measurement system |
| US20200103223A1 (en)* | 2017-09-07 | 2020-04-02 | Frank J. Smith | Rail Break and Train Location Detection Method using Fiber Optics |
| US10907958B2 (en)* | 2017-09-07 | 2021-02-02 | Frank J Smith | Railroad track defect detection apparatus and method |
| US11486831B2 (en) | 2019-08-01 | 2022-11-01 | Canon Medical Systems Corporation | Specimen measurement device and control method of specimen measurement device |
| WO2022011487A1 (en)* | 2020-07-14 | 2022-01-20 | Rendic Munoz Mario Francisco | A continuous condition monitoring (ccm) system for conveyor belts based on a distributed optical fibre sensor |
| US20220020231A1 (en)* | 2020-07-20 | 2022-01-20 | Seiko Epson Corporation | Physical quantity measurement method, measurement system, host system, and sensing apparatus |
| US20220291078A1 (en)* | 2021-02-26 | 2022-09-15 | Seiko Epson Corporation | Measurement Method, Measurement Device, Measurement System, And Measurement Program |
Also Published As
| Publication number | Publication date |
|---|---|
| EP3388812B1 (en) | 2020-07-01 |
| US20180299301A1 (en) | 2018-10-18 |
| AU2018202193A1 (en) | 2018-11-01 |
| AU2018202193B2 (en) | 2023-02-23 |
| EP3388812A1 (en) | 2018-10-17 |
| JP7045235B2 (en) | 2022-03-31 |
| JP2018177527A (en) | 2018-11-15 |
Similar Documents
| Publication | Publication Date | Title |
|---|---|---|
| US10317256B2 (en) | Monitoring transportation systems | |
| KR102029784B1 (en) | Axle-counting method and axle-counting device | |
| Chan et al. | Fiber Bragg grating sensors for structural health monitoring of Tsing Ma bridge: Background and experimental observation | |
| Bocciolone et al. | Pantograph–catenary monitoring by means of fibre Bragg grating sensors: Results from tests in an underground line | |
| KR102001291B1 (en) | Rail measuring system | |
| Tam et al. | Fiber Bragg grating sensors for structural and railway applications | |
| JP2008532841A (en) | Safety system at highway-railway intersection | |
| US10907958B2 (en) | Railroad track defect detection apparatus and method | |
| WO2008034225A1 (en) | Optical sensor and method for making same | |
| CN113661385A (en) | Optical fiber sensor unit, optical measurement system, axle counting device and axle counting method | |
| EP3568312B1 (en) | Optical monitoring system | |
| RU2722061C2 (en) | Weight measuring device and method for measuring weight | |
| Schröder et al. | Fibre optic sensing system for monitoring of current collectors and overhead contact lines of railways | |
| Mennella et al. | Railway monitoring and train tracking by fiber Bragg grating sensors | |
| Pimentel et al. | Hybrid fiber-optic/electrical measurement system for characterization of railway traffic and its effects on a short span bridge | |
| JP2006138757A (en) | Optical fiber type multiple sensor system | |
| Ecke et al. | On-line characterization of impacts on electrical train current collectors using integrated optical fiber grating sensor network | |
| Maurin et al. | High speed real-time contact measurements between a smart train pantograph with embedded fibre bragg grating sensors and its overhead contact line | |
| Lehmann et al. | Fibre optic measurement systems for building monitoring | |
| Krichen et al. | An optical wireless network for railways condition monitoring | |
| AgosMustarama et al. | Monitoring For Strain-Based Railway Structure Assessment Approach Using Optical Fibre Sensor | |
| CZ2018105A3 (en) | Rail vehicles’ fibre optic sensor | |
| Arakaki et al. | High-Resolution Health Monitoring of Track and Rail Systems with Fiber Optic Sensors and High-Frequency Multiplexed Readouts | |
| Fajkus et al. | Advanced under-rails fiber-optic sensor for detection of rolling stock and axles in tram transport | |
| Schroeder et al. | Fiber optical sensor network embedded in a current collector for defect monitoring on railway catenary |
Legal Events
| Date | Code | Title | Description |
|---|---|---|---|
| AS | Assignment | Owner name:PALO ALTO RESEARCH CENTER INCORPORATED, CALIFORNIA Free format text:ASSIGNMENT OF ASSIGNORS INTEREST;ASSIGNORS:RAGHAVAN, AJAY;ARAKAKI, KYLE;SCHUH, ANDREAS;AND OTHERS;REEL/FRAME:042013/0898 Effective date:20170412 | |
| STPP | Information on status: patent application and granting procedure in general | Free format text:NOTICE OF ALLOWANCE MAILED -- APPLICATION RECEIVED IN OFFICE OF PUBLICATIONS | |
| STPP | Information on status: patent application and granting procedure in general | Free format text:PUBLICATIONS -- ISSUE FEE PAYMENT VERIFIED | |
| STCF | Information on status: patent grant | Free format text:PATENTED CASE | |
| MAFP | Maintenance fee payment | Free format text:PAYMENT OF MAINTENANCE FEE, 4TH YEAR, LARGE ENTITY (ORIGINAL EVENT CODE: M1551); ENTITY STATUS OF PATENT OWNER: LARGE ENTITY Year of fee payment:4 | |
| AS | Assignment | Owner name:XEROX CORPORATION, CONNECTICUT Free format text:ASSIGNMENT OF ASSIGNORS INTEREST;ASSIGNOR:PALO ALTO RESEARCH CENTER INCORPORATED;REEL/FRAME:064038/0001 Effective date:20230416 | |
| AS | Assignment | Owner name:CITIBANK, N.A., AS COLLATERAL AGENT, NEW YORK Free format text:SECURITY INTEREST;ASSIGNOR:XEROX CORPORATION;REEL/FRAME:064760/0389 Effective date:20230621 | |
| AS | Assignment | Owner name:XEROX CORPORATION, CONNECTICUT Free format text:CORRECTIVE ASSIGNMENT TO CORRECT THE REMOVAL OF US PATENTS 9356603, 10026651, 10626048 AND INCLUSION OF US PATENT 7167871 PREVIOUSLY RECORDED ON REEL 064038 FRAME 0001. ASSIGNOR(S) HEREBY CONFIRMS THE ASSIGNMENT;ASSIGNOR:PALO ALTO RESEARCH CENTER INCORPORATED;REEL/FRAME:064161/0001 Effective date:20230416 | |
| AS | Assignment | Owner name:JEFFERIES FINANCE LLC, AS COLLATERAL AGENT, NEW YORK Free format text:SECURITY INTEREST;ASSIGNOR:XEROX CORPORATION;REEL/FRAME:065628/0019 Effective date:20231117 | |
| AS | Assignment | Owner name:XEROX CORPORATION, CONNECTICUT Free format text:TERMINATION AND RELEASE OF SECURITY INTEREST IN PATENTS RECORDED AT RF 064760/0389;ASSIGNOR:CITIBANK, N.A., AS COLLATERAL AGENT;REEL/FRAME:068261/0001 Effective date:20240206 Owner name:CITIBANK, N.A., AS COLLATERAL AGENT, NEW YORK Free format text:SECURITY INTEREST;ASSIGNOR:XEROX CORPORATION;REEL/FRAME:066741/0001 Effective date:20240206 | |
| AS | Assignment | Owner name:U.S. BANK TRUST COMPANY, NATIONAL ASSOCIATION, AS COLLATERAL AGENT, CONNECTICUT Free format text:FIRST LIEN NOTES PATENT SECURITY AGREEMENT;ASSIGNOR:XEROX CORPORATION;REEL/FRAME:070824/0001 Effective date:20250411 | |
| AS | Assignment | Owner name:U.S. BANK TRUST COMPANY, NATIONAL ASSOCIATION, AS COLLATERAL AGENT, CONNECTICUT Free format text:SECOND LIEN NOTES PATENT SECURITY AGREEMENT;ASSIGNOR:XEROX CORPORATION;REEL/FRAME:071785/0550 Effective date:20250701 |