TWI793412B - Consumption prediction system and consumption prediction method - Google Patents
Consumption prediction system and consumption prediction methodDownload PDFInfo
- Publication number
- TWI793412B TWI793412BTW109110919ATW109110919ATWI793412BTW I793412 BTWI793412 BTW I793412BTW 109110919 ATW109110919 ATW 109110919ATW 109110919 ATW109110919 ATW 109110919ATW I793412 BTWI793412 BTW I793412B
- Authority
- TW
- Taiwan
- Prior art keywords
- turnover
- data
- processor
- consumption
- weight
- Prior art date
Links
Images

Classifications
- G—PHYSICS
- G06—COMPUTING OR CALCULATING; COUNTING
- G06Q—INFORMATION AND COMMUNICATION TECHNOLOGY [ICT] SPECIALLY ADAPTED FOR ADMINISTRATIVE, COMMERCIAL, FINANCIAL, MANAGERIAL OR SUPERVISORY PURPOSES; SYSTEMS OR METHODS SPECIALLY ADAPTED FOR ADMINISTRATIVE, COMMERCIAL, FINANCIAL, MANAGERIAL OR SUPERVISORY PURPOSES, NOT OTHERWISE PROVIDED FOR
- G06Q30/00—Commerce
- G06Q30/02—Marketing; Price estimation or determination; Fundraising
- G06Q30/0201—Market modelling; Market analysis; Collecting market data
- G06Q30/0202—Market predictions or forecasting for commercial activities
- G—PHYSICS
- G06—COMPUTING OR CALCULATING; COUNTING
- G06V—IMAGE OR VIDEO RECOGNITION OR UNDERSTANDING
- G06V10/00—Arrangements for image or video recognition or understanding
- G06V10/40—Extraction of image or video features
- G06V10/44—Local feature extraction by analysis of parts of the pattern, e.g. by detecting edges, contours, loops, corners, strokes or intersections; Connectivity analysis, e.g. of connected components
- G06V10/443—Local feature extraction by analysis of parts of the pattern, e.g. by detecting edges, contours, loops, corners, strokes or intersections; Connectivity analysis, e.g. of connected components by matching or filtering
- G06V10/449—Biologically inspired filters, e.g. difference of Gaussians [DoG] or Gabor filters
- G06V10/451—Biologically inspired filters, e.g. difference of Gaussians [DoG] or Gabor filters with interaction between the filter responses, e.g. cortical complex cells
- G06V10/454—Integrating the filters into a hierarchical structure, e.g. convolutional neural networks [CNN]
- G—PHYSICS
- G06—COMPUTING OR CALCULATING; COUNTING
- G06F—ELECTRIC DIGITAL DATA PROCESSING
- G06F18/00—Pattern recognition
- G06F18/20—Analysing
- G06F18/24—Classification techniques
- G06F18/241—Classification techniques relating to the classification model, e.g. parametric or non-parametric approaches
- G06F18/2413—Classification techniques relating to the classification model, e.g. parametric or non-parametric approaches based on distances to training or reference patterns
- G—PHYSICS
- G06—COMPUTING OR CALCULATING; COUNTING
- G06N—COMPUTING ARRANGEMENTS BASED ON SPECIFIC COMPUTATIONAL MODELS
- G06N3/00—Computing arrangements based on biological models
- G06N3/02—Neural networks
- G06N3/04—Architecture, e.g. interconnection topology
- G06N3/045—Combinations of networks
- G—PHYSICS
- G06—COMPUTING OR CALCULATING; COUNTING
- G06N—COMPUTING ARRANGEMENTS BASED ON SPECIFIC COMPUTATIONAL MODELS
- G06N3/00—Computing arrangements based on biological models
- G06N3/02—Neural networks
- G06N3/04—Architecture, e.g. interconnection topology
- G06N3/0464—Convolutional networks [CNN, ConvNet]
- G—PHYSICS
- G06—COMPUTING OR CALCULATING; COUNTING
- G06N—COMPUTING ARRANGEMENTS BASED ON SPECIFIC COMPUTATIONAL MODELS
- G06N3/00—Computing arrangements based on biological models
- G06N3/02—Neural networks
- G06N3/08—Learning methods
- G—PHYSICS
- G06—COMPUTING OR CALCULATING; COUNTING
- G06N—COMPUTING ARRANGEMENTS BASED ON SPECIFIC COMPUTATIONAL MODELS
- G06N3/00—Computing arrangements based on biological models
- G06N3/02—Neural networks
- G06N3/08—Learning methods
- G06N3/09—Supervised learning
- G—PHYSICS
- G06—COMPUTING OR CALCULATING; COUNTING
- G06Q—INFORMATION AND COMMUNICATION TECHNOLOGY [ICT] SPECIALLY ADAPTED FOR ADMINISTRATIVE, COMMERCIAL, FINANCIAL, MANAGERIAL OR SUPERVISORY PURPOSES; SYSTEMS OR METHODS SPECIALLY ADAPTED FOR ADMINISTRATIVE, COMMERCIAL, FINANCIAL, MANAGERIAL OR SUPERVISORY PURPOSES, NOT OTHERWISE PROVIDED FOR
- G06Q30/00—Commerce
- G06Q30/02—Marketing; Price estimation or determination; Fundraising
- G06Q30/0201—Market modelling; Market analysis; Collecting market data
- G—PHYSICS
- G06—COMPUTING OR CALCULATING; COUNTING
- G06V—IMAGE OR VIDEO RECOGNITION OR UNDERSTANDING
- G06V10/00—Arrangements for image or video recognition or understanding
- G06V10/70—Arrangements for image or video recognition or understanding using pattern recognition or machine learning
- G06V10/764—Arrangements for image or video recognition or understanding using pattern recognition or machine learning using classification, e.g. of video objects
- G—PHYSICS
- G06—COMPUTING OR CALCULATING; COUNTING
- G06V—IMAGE OR VIDEO RECOGNITION OR UNDERSTANDING
- G06V10/00—Arrangements for image or video recognition or understanding
- G06V10/70—Arrangements for image or video recognition or understanding using pattern recognition or machine learning
- G06V10/82—Arrangements for image or video recognition or understanding using pattern recognition or machine learning using neural networks
- G—PHYSICS
- G06—COMPUTING OR CALCULATING; COUNTING
- G06Q—INFORMATION AND COMMUNICATION TECHNOLOGY [ICT] SPECIALLY ADAPTED FOR ADMINISTRATIVE, COMMERCIAL, FINANCIAL, MANAGERIAL OR SUPERVISORY PURPOSES; SYSTEMS OR METHODS SPECIALLY ADAPTED FOR ADMINISTRATIVE, COMMERCIAL, FINANCIAL, MANAGERIAL OR SUPERVISORY PURPOSES, NOT OTHERWISE PROVIDED FOR
- G06Q50/00—Information and communication technology [ICT] specially adapted for implementation of business processes of specific business sectors, e.g. utilities or tourism
- G06Q50/10—Services
- G06Q50/12—Hotels or restaurants
Landscapes
- Engineering & Computer Science (AREA)
- Theoretical Computer Science (AREA)
- Physics & Mathematics (AREA)
- General Physics & Mathematics (AREA)
- Evolutionary Computation (AREA)
- Business, Economics & Management (AREA)
- Artificial Intelligence (AREA)
- Health & Medical Sciences (AREA)
- General Health & Medical Sciences (AREA)
- Strategic Management (AREA)
- Finance (AREA)
- Accounting & Taxation (AREA)
- Development Economics (AREA)
- Data Mining & Analysis (AREA)
- Software Systems (AREA)
- Computing Systems (AREA)
- Computer Vision & Pattern Recognition (AREA)
- Life Sciences & Earth Sciences (AREA)
- Multimedia (AREA)
- Entrepreneurship & Innovation (AREA)
- Molecular Biology (AREA)
- Biomedical Technology (AREA)
- General Engineering & Computer Science (AREA)
- Medical Informatics (AREA)
- Databases & Information Systems (AREA)
- Mathematical Physics (AREA)
- Computational Linguistics (AREA)
- Biophysics (AREA)
- General Business, Economics & Management (AREA)
- Marketing (AREA)
- Economics (AREA)
- Game Theory and Decision Science (AREA)
- Biodiversity & Conservation Biology (AREA)
- Evolutionary Biology (AREA)
- Bioinformatics & Computational Biology (AREA)
- Bioinformatics & Cheminformatics (AREA)
- Management, Administration, Business Operations System, And Electronic Commerce (AREA)
Abstract
Description
Translated fromChinese本發明是關於一種預測系統,特別是關於一種消費預測系統及消費預測方法。The invention relates to a forecasting system, in particular to a consumption forecasting system and a consumption forecasting method.
一般而言,銷售報表分析都只能呈現過去消費的記錄,因為來店人數與每日消費偏好是很難精準預測的,現行的來店人數預估,可能是利用傳統的數學分析或是經驗法則,此些方法的預測準確率都偏低,導致店家在每日備料上,無法精準的掌握,容易物料準備不足,或準備過量而造成物料的浪費。此外,即使取得多種歷史資料,若應用人力進行統計或使用傳統的數學分析,需要大量的計算,也難以快速地提供預測資料。Generally speaking, sales report analysis can only present past consumption records, because it is difficult to accurately predict the number of visitors and daily consumption preferences. The current estimate of the number of visitors may be based on traditional mathematical analysis or experience According to the law, the prediction accuracy of these methods is low, which leads to the inability of the store to accurately grasp the daily material preparation, and it is easy to have insufficient material preparation or excessive preparation, resulting in waste of materials. In addition, even if a variety of historical data are obtained, it will be difficult to quickly provide forecast data if manpower is used for statistics or traditional mathematical analysis requires a large amount of calculations.
因此,如何有效率的考量多種影響消費因素,以快速且準確地預測來店人數與產品銷售量,已成為本領域需解決的問題之一。Therefore, how to efficiently consider various factors affecting consumption to quickly and accurately predict the number of shop visitors and product sales has become one of the problems to be solved in this field.
為了解決上述的問題,本揭露內容之一態樣提供了一種消費預測系統,包含一儲存裝置以及一處理器。儲存裝置用以儲存一歷史環境資料及一歷史消費紀錄。處理器用以計算一個人偏好相關係數,並將歷史環境資料、歷史消費紀錄及個人偏好相關係數輸入一第一類神經網路模型,第一類神經網路模型用以產生一訓練模型,當訓練模型的一準確率高於一訓練門檻值時,將訓練模型視為一預測模型,將一預測環境資料輸入預測模型,預測模型依據預測環境資料輸出一預測結果,並擷取出預測結果中的一預測來客數及一預測營業額,將預測來客數與一實際來客數比對,以產生一來客數修正權重,並將預測營業額與一實際營業額比對,以產生一營業額修正權重,判斷來客數修正權重是否高於一來客數權重門檻值或是營業額修正權重是否高於一營業額權重門檻值,當來客數修正權重高於來客數權重門檻值或是營業額修正權重高於營業額權重門檻值,則依據來客數修正權重與營業額修正權重調整訓練模型,以更新訓練模型。In order to solve the above problems, an aspect of the present disclosure provides a consumption forecasting system, which includes a storage device and a processor. storage device for storing a historical environmentdata and a historical consumption record. The processor is used to calculate a personal preference correlation coefficient, and input historical environmental data, historical consumption records and personal preference correlation coefficient into a first-type neural network model, and the first-type neural network model is used to generate a training model. When the training model When the accuracy rate is higher than a training threshold, the training model is regarded as a prediction model, and a prediction environment data is input into the prediction model, and the prediction model outputs a prediction result according to the prediction environment data, and a prediction among the prediction results is extracted Number of visitors and a forecasted turnover, compare the predicted number of visitors with an actual number of visitors to generate a revised weight for the number of visitors, and compare the predicted turnover with an actual turnover to generate a revised weight for turnover, and determine Whether the visitor number correction weight is higher than a visitor number weight threshold or whether the turnover correction weight is higher than a turnover weight threshold value, when the visitor number correction weight is higher than the visitor number weight threshold or the turnover correction weight is higher than the business If the weight threshold is set, the training model is adjusted according to the number of visitors correction weight and turnover correction weight to update the training model.
為了解決上述的問題,本揭露內容之另一態樣提供了一種消費預測方法,包含以下步驟:計算一個人偏好相關係數;將一歷史環境資料、一歷史消費紀錄及個人偏好相關係數輸入一第一類神經網路模型,第一類神經網路模型用以產生一訓練模型;判斷訓練模型的一準確率是否高於一訓練門檻值,當訓練模型的準確率高於訓練門檻值時,將訓練模型視為一預測模型;將一預測環境資料輸入預測模型,預測模型依據一預測環境資料輸出一預測結果;擷取出預測結果中的一預測來客數及一預測營業額,將預測來客數與一實際來客數比對,以產生一來客數修正權重,並將預測營業額與一實際營業額比對,以產生一營業額修正權重;以及判斷來客數修正權重是否高於一來客數權重門檻值或是營業額修正權重是否高於一營業額權重門檻值;當來客數修正權重高於來客數權重門檻值或是營業額修正權重高於營業額權重門檻值,則依據來客數修正權重與營業額修正權重調整訓練模型,以更新訓練模型。In order to solve the above problems, another aspect of the present disclosure provides a consumption prediction method, including the following steps: calculating a personal preference correlation coefficient; inputting a historical environmental data, a historical consumption record and a personal preference correlation coefficient into a first A neural network model, the first type of neural network model is used to generate a training model; it is judged whether the accuracy of the training model is higher than a training threshold, and when the accuracy of the training model is higher than the training threshold, the training The model is regarded as a forecasting model; a forecasted environment data is input into the forecasting model, and the forecasting model outputs a forecasted result according to the forecasted environmental data; a forecasted number of visitors and a forecasted turnover are extracted from the forecasted results, and the forecasted number of visitors is combined with a Comparing the actual number of visitors to generate a visitor number correction weight, and comparing the predicted turnover with an actual turnover to generate a turnover correction weight; and judging whether the visitor number correction weight is higher than a visitor number weight threshold Or whether the turnover correction weight is highAt a turnover weight threshold; when the number of visitors correction weight is higher than the visitor number weight threshold or the turnover correction weight is higher than the turnover weight threshold, the training model is adjusted according to the number of visitors correction weight and the turnover correction weight to Update the trained model.
由上述可知,在人工智能時代,資料量巨大且繁雜,若要能準確且有效率的預測資料,則要考慮的因素及資料量龐雜,因此,資料收集不能再依懶人工的維護。本發明所示之消費預測系統及消費預測方法透過類神經網路模型分析大量且繁雜的資料,進而生成預測模型,並可以透過預測模型輸出未來一段時間內的預測來客人數及預測營業額,亦可以比對預測來客人數與實際來客數,以得到來客數修正權重,比對預測營業額與實際營業額比對,以得到營業額修正權重,透過來客數修正權重及營業額修正權重可以調整預測模型,使預測模型更加準確。It can be seen from the above that in the era of artificial intelligence, the amount of data is huge and complicated. To accurately and efficiently predict the data, the factors and the amount of data must be considered. Therefore, data collection can no longer rely on lazy manual maintenance. The consumption prediction system and consumption prediction method shown in the present invention analyze a large amount of complicated data through a neural network model, and then generate a prediction model, and can output the predicted number of visitors and predicted turnover in a period of time in the future through the prediction model, and also It is possible to compare the predicted number of visitors with the actual number of visitors to obtain the corrected weight of the number of visitors, and compare the forecasted turnover with the actual turnover to obtain the revised weight of the turnover. The forecast can be adjusted through the corrected weight of the number of visitors and the revised weight of the turnover model to make predictive models more accurate.
100,150:消費預測系統100,150: consumption forecasting system
10:儲存裝置10: storage device
20:處理器20: Processor
12:環境資料收集模組12: Environmental data collection module
14:消費紀錄模組14: Consumption record module
16:消費群組分類模組16: Consumer group classification module
18:模型訓練模組18:Model training module
200:消費預測方法200: Consumption Forecasting Methods
210~270:步驟210~270: steps
31:外顯資料31: Explicit data
Q1:第一佇列Q1: First Queue
32:商店類型32: Store type
33:外在因素33: External factors
34:數位文字資料34: digital text data
Q2:第二佇列Q2: Second Queue
35:商店討論熱度35: Store discussion heat
36:圖片資料36:Picture information
Q3:第三佇列Q3: The third queue
37:產品類型37: Product type
39:外顯指標39: Explicit indicators
41:商店排名與銷售額41: Store ranking and sales
42:產品偏好排名與銷售42: Product Preference Ranking and Sales
43:工作類型43: Type of work
44:消費指標44: Consumption indicators
Q4:第四佇列Q4: Fourth Queue
45:群組相關係數45:Group correlation coefficient
46:個人偏好相關係數46: Correlation coefficient of personal preference
第1A~1B圖係依照本發明一實施例繪示一種消費預測系統之方塊圖。1A-1B are block diagrams illustrating a consumption forecasting system according to an embodiment of the present invention.
第2圖係根據本發明之一實施例繪示一種消費預測方法之流程圖。FIG. 2 is a flowchart illustrating a consumption forecasting method according to an embodiment of the present invention.
第3A~3C圖係根據本發明之一實施例繪示一種環境資料收集方法之示意圖。3A-3C are schematic diagrams illustrating a method for collecting environmental data according to an embodiment of the present invention.
第4圖係根據本發明之一實施例繪示一種消費群組分類方法之流程圖。FIG. 4 is a flowchart illustrating a method for classifying consumer groups according to an embodiment of the present invention.
以下說明係為完成發明的較佳實現方式,其目的在於描述本發明的基本精神,但並不用以限定本發明。實際的發明內容必須參考之後的權利要求範圍。The following description is a preferred implementation of the invention, and its purpose is to describe the basic spirit of the invention, but not to limit the invention. For the actual content of the invention, reference must be made to the scope of the claims that follow.
必須了解的是,使用於本說明書中的”包含”、”包括”等詞,係用以表示存在特定的技術特徵、數值、方法步驟、作業處理、元件以及/或組件,但並不排除可加上更多的技術特徵、數值、方法步驟、作業處理、元件、組件,或以上的任意組合。It must be understood that words such as "comprising" and "comprising" used in this specification are used to indicate the existence of specific technical features, values, method steps, operations, components and/or components, but do not exclude possible Add more technical characteristics, values, method steps, operation processes, components, components, or any combination of the above.
於權利要求中使用如”第一”、"第二"、"第三"等詞係用來修飾權利要求中的元件,並非用來表示之間具有優先權順序,先行關係,或者是一個元件先於另一個元件,或者是執行方法步驟時的時間先後順序,僅用來區別具有相同名字的元件。Words such as "first", "second", and "third" used in the claims are used to modify the elements in the claims, and are not used to indicate that there is an order of priority, an antecedent relationship, or an element An element preceding another element, or a chronological order in performing method steps, is only used to distinguish elements with the same name.
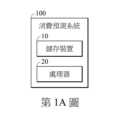
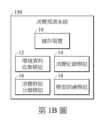
請參照第1A、1B及2圖,第1A圖係依照本發明一實施例繪示一種消費預測系統100之方塊圖。第1B圖係根據本發明之一實施例繪示一種消費預測系統150之方塊圖。第2圖係根據本發明之一實施例繪示一種消費預測方法200之流程圖。Please refer to FIGS. 1A, 1B and 2. FIG. 1A is a block diagram of a
如第1A圖所示,消費預測系統100適用於一電子裝置上,電子裝置例如為電腦、手機、平板或其它具有運算功能的裝置。消費預測系統100包含一儲存裝置10及一處理器20。於一實施例中,儲存裝置10可被實作為唯讀記憶體、快閃記憶體、軟碟、硬碟、光碟、隨身碟、磁帶、可由網路存取之資料庫或熟悉此技藝者可輕易思及具有相同功能之儲存媒體。於一實施例中,處理器20可由體積電路如微控制單元(micro controller)、微處理器(microprocessor)、數位訊號處理器(digital signal processor)、特殊應用積體電路(application specific integrated circuit,ASIC)或一邏輯電路來實施。As shown in FIG. 1A , the
如第1B圖所示,消費預測系統150適用於一電子裝置上,電子裝置例如為電腦、手機、平板或其它具有運算功能的裝置。消費預測系統150包含一儲存裝置10、一環境資料收集模組12、一消費紀錄模組14、一消費群組分類模組16及一模型訓練模組18。於一實施例中,環境資料收集模組12、消費紀錄模組14、消費群組分類模組16及模型訓練模組18各自以硬體電路實現,各自耦接於處理器20。於一實施例中,環境資料收集模組12、消費紀錄模組14、消費群組分類模組16及模型訓練模組18位於於處理器20。於一實施例中,環境資料收集模組12、消費紀錄模組14、消費群組分類模組16及模型訓練模組18可以各自以軟體實現,由處理器20執行之。於一實施例中,環境資料收集模組12、消費紀錄模組14、消費群組分類模組16及模型訓練模組18可一併或分別由體積電路如微控制單元(micro controller)、微處理器(microprocessor)、數位訊號處理器(digital signal processor)、特殊應用積體電路(application specific integrated circuit,ASIC)或一邏輯電路來實施。As shown in FIG. 1B , the
以下敘述消費預測方法200,消費預測方法200可以透過消費預測系統100或150實現之。The
於步驟210中,處理器20計算一個人偏好相關係數。In
於一實施例中,處理器20加總一時間區間內之一使用者於一特定商店的消費次數,以得到一特定商店消費總次數,並將特定商店消費總次數除以時間區間內之此使用者於所有商店的消費次數,以計算個人偏好相關係數。於一實施例中,個人偏好相關係數計算公式如下,
於步驟220中,處理器20將歷史環境資料、歷史消費紀錄及個人偏好相關係數輸入一第一類神經網路模型,第一類神經網路模型用以產生一訓練模型。In
於一實施例中,第一類神經網路模型可以由已知的一卷積神經網路(Convolutional Neural Network,CNN)模型實現。然而,本領域具通常知識者應能理解,本發明不限於採用CNN模型,只要是可以達到自動分類的其它神經網路模型亦可應用之。In one embodiment, the first type of neural network model can be implemented by a known convolutional neural network (CNN) model. However, those skilled in the art should understand that the present invention is not limited to the use of the CNN model, and other neural network models that can achieve automatic classification can also be applied.
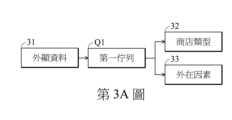
於一實施例中,歷史環境資料可以由環境資料收集模組12或處理器20收集。於一實施例中,環境資料收集模組12或處理器20收集到的環境資料可視為歷史環境資料。於一實施例中,處理器20可以環境資料收集模組12取得由環境資料。請參閱第3A~3C圖,第3A~3C圖係根據本發明之一實施例繪示一種環境資料收集方法300之示意圖。環境資料收集方法300可以由環境資料收集模組12或處理器20執行之。第3A~3C圖所示的環境資料收集方法30不限定執行順序,亦可以同時執行之。In one embodiment, the historical environmental data can be collected by the environmental
於一實施例中,如第3A圖所示,處理器20接收一外顯資料30(例如天氣、商店評價、商店名稱),將外顯資料30儲存到一第一佇列Q1,處理器20由第一佇列Q1讀取出外顯資料31,並擷取外顯資料31中的一文字訊息,文字訊息相關於一商店類型32及一外在因素33。商店類型32包含商店評價、商店位置、交通資訊、滿意度、每天的產品資訊及/或活動訊息等等。外在因素33包含天氣、季節及/或溫度等資訊。於一實施例中,使用者可以手動輸入外顯資料30到消費預測系統100(或150)。於一實施例中,處理器20可以從網路取得外顯資料30。In one embodiment, as shown in FIG. 3A, the
於一實施例中,如第3B圖所示,處理器20接收一數位文字資料34,將數位文字資料34儲存到一第二佇列Q2,處理器20由第二佇列Q2讀取出數位文字資料34,藉由一第二類神經網路模型分類數位文字資料34,以取得對應於數位文字資料34的一商店討論熱度35。於一實施例中,處理器20可以從網路上取得數位文字資料34。數位文字資料34例如為臉書、谷歌、推特或電子郵件中的文字資料。例如,處理器20可以藉由谷歌的搜尋引擎,搜尋到某間商店的討論串及評比分數,此些評比分數的累計可以視為商店討論熱度35。In one embodiment, as shown in FIG. 3B, the
於一實施例中,第二類神經網路模型可以由已知的CNN模型實現。然而,本領域具通常知識者應能理解,本發明不限於採用CNN模型,只要是可以達到自動分類的其它神經網路模型亦可應用之。更具體而言,處理器20由第二佇列Q2讀取出數位文字資料34後,可利用第二類神經網路模型判斷數位文字資料34的正確性(例如排除廣告連結中的文字,只留下用戶評價連結中的文字),再利用第二類神經網路模型將文字訊息進行擷取,進而利用第二類神經網路模型將擷取出來的文字訊息給予正負評價分數,亦可以利用第二類神經網路模型將數位文字資料34中的討論商店主題進行分類,以分類出商店類型(如小吃店、便利商店、餐廳...等等),每個商店類型對應的文章數視為商店討論熱度35,亦可以判斷商店類型主題與產品類型37的相關性(例如自助餐店(商店類型)的主題中,有一千筆文章,其中沒有任何文章提及牛排(產品類型37),因此自助餐店類型與牛排的相關性較低)。In one embodiment, the second type of neural network model can be implemented by a known CNN model. However, those skilled in the art should understand that the present invention is not limited to the use of CNN modelsType, as long as it is other neural network models that can achieve automatic classification, it can also be applied. More specifically, after the
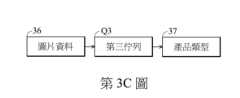
於一實施例中,如第3C圖所示,處理器20接收一圖片資料36,將圖片資料36儲存到一第三佇列Q3。處理器20由第三佇列Q3讀取出圖片資料36,藉由一第三類神經網路模型分類圖片資料36,以取得對應圖片資料36的一產品類型37。於一實施例中,使用者可以手動輸入圖片資料36到消費預測系統100(或150)。於一實施例中,處理器20可以從網路取得圖片資料36。於一實施例中,產品類型37例如為素食、豬肉主餐、咖啡、水果...等等。In one embodiment, as shown in FIG. 3C , the
於一實施例中,第三類神經網路模型可以由已知的CNN模型實現。然而,本領域具通常知識者應能理解,本發明不限於採用CNN模型,只要是可以達到自動分類的其它神經網路模型亦可應用之。In an embodiment, the third type of neural network model can be realized by a known CNN model. However, those skilled in the art should understand that the present invention is not limited to the use of the CNN model, and other neural network models that can achieve automatic classification can also be applied.
於一實施例中,第一佇列Q1、第二佇列Q2及第三佇列Q3可以合併為一佇列。In one embodiment, the first queue Q1 , the second queue Q2 and the third queue Q3 can be combined into one queue.
於一實施例中,環境資料收集模組12或處理器20會收集外顯資料31與社群網站的文字內容(如數位文字資料34)。在收集外顯資料31方面,環境資料收集模組12或處理器20可定時呼叫外部系統或政府機構的應用程序編程接口(Application Programming Interface,API),取得外在因素33,如:天氣好與壞的程度、季節、工作日與否,依這些資訊,有利於讓處理器20預測消費者會每天選擇商家消費的動機,對一般上班族而言,除了有特別的活動外,偏好去消費的商家可能會是滿固定的,尤其在私有雲的環境裡,員工及商家通常都變化不大。外顯資料31包含表一的內容:


此外,環境資料收集模組12或處理器20也會針對數位文字資料34(如社群網站的文字留言及回覆訊息內容),進行正負評價的判斷,這與外顯資料31不同的是,這些文字沒有一定的規則,無法透過文字截取取得正確內容,這些文字有可能包含一些假消息,且數位文字資料34的資料量巨大,難以由人工一筆筆或一句句的判斷,此些文字故透過人工智慧演算法(例如第二類神經網路模型)進行判斷資料的正確性,再對文字訊息進行分類,算出商店的正負評價,及那一商店類型的討論熱度較高,並計算商店類型與產品類型37的相關性(例如將包含特定產品的文章數除以特定主題的總文章數)。In addition, the environmental
另外,圖片資料36可輔助定義受歡迎的產品類型37(如咖啡)及商店類型(如便利商店)等等。In addition, the
在人工智能時代,由於外部環境因素複雜,資料量巨大且雜亂,資料收集不能再依懶人工的維護,因此透過上述的環境資料收集方法300,應用透過人工智慧演算法(例如第二類神經網路模型)分析資料,可以達到有效率的收集資料。In the era of artificial intelligence, due to the complex external environmental factors and the huge and messy amount of data, data collection can no longer rely on lazy manual maintenance. Therefore, through the above-mentioned environmental data collection method300. The application analyzes data through an artificial intelligence algorithm (such as the second type of neural network model), so as to collect data efficiently.
於一實施例中,歷史消費紀錄可以由消費紀錄模組14或處理器20取得。於一實施例中,消費紀錄模組14或處理器20收集到的消費紀錄可視為歷史消費紀錄。消費紀錄模組14或處理器20依消費記錄統計,依年月日統計消費者的消費額、消費次數、平均客單價,並作年月日的排名,消費記錄是預測來店人數很好的工具,平均客單價低,有會增加來客人數,當平均客單價高時,會減少來客人數,但總營業額可能會維持一定的水平。於一實施例中,歷史消費紀錄包含表四的內容:


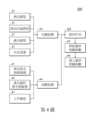
請參閱第4圖,第4圖係根據本發明之一實施例繪示一種消費群組分類方法400之流程圖。Please refer to FIG. 4 . FIG. 4 is a flowchart illustrating a
於一實施例中,商店類型32、外在因素33、商店討論熱度35及產品類型37包含於一外顯指標39。In one embodiment,
於一實施例中,處理器20可以透過表四取得商店排名與銷售額41(如,日銷售額),透過表五的月排名取得產品偏好排名與銷售額42(如,月銷售額),透過表六的職稱得知工作類型43。In one embodiment, the
於一實施例中,商店排名與銷售額41、產品偏好排名與銷售42及工作類型43包含於一消費指標44。In one embodiment, store ranking and
於一實施例中,消費群組分類模組16或處理器20可以將外顯指標39及消費指標44記錄在第四佇列Q4中。In one embodiment, the consumption
於一實施例中,訓練模型儲存於儲存裝置10中。於一實施例中,第一佇列Q1、第二佇列Q2、第三佇列Q3及第四柱列Q4儲存於儲存裝置10中。In one embodiment, the training model is stored in the
於一實施例中,消費群組分類模組16或處理器20依據外顯指標39或消費指標44計算一群組相關係數45,依據群組相關係數45及個人偏好相關係數46以分類消費客群。In one embodiment, the consumer
於一實施例中,消費群組分類模組16或處理器20可以從第四佇列Q4讀取外顯指標39及消費指標44,並計算群組偏好相關係數45,群組偏好相關係數45計算方式如下:
群組偏好相關係數可分為店家消費偏好、產品類型購買偏好、天氣好壞與討論熱度高低的偏好指標等等,將相關的數值代入群組偏好相關係數公式,可計算出消費指標的相關係數及外顯指標的相關係數。群組偏好相關係數45的另一個用途是用來修正對群組成員的定義,如:容易受到外到天氣群組因素影響的,才能歸在天氣群組,若計算出來,發現參考群組(事先定義好的群組)與天氣相關的群組偏好係數不存在高度相關,例如不管天氣好壞,商店販售的便當數量都在一定數量區間內,則應該要依個人偏好相關係數去修正群組成員。關於個人偏好相關係數已在步驟210中敘述,故此處不重覆敘述之。The group preference correlation coefficient can be divided into store consumption preference, product type purchase preference, weather and discussion preference indicators, etc. Substituting the relevant values into the group preference correlation coefficient formula can calculate the correlation coefficient of consumption indicators and the correlation coefficient of explicit indicators. Another use of the group
消費群組分類模組16或處理器20計算個人與參考群組的相關係數(個人偏好相關係數)後,可決定個人與參考群組的相關係數高低,如個人偏好相關係數高時(例如個人偏好素食,當素食的月消費金額當為參數代入個人偏好相關係數公式後,則個人偏好相關係數會高於將羊肉主餐的月消費金額代入個人偏好相關係數公式後的值),代表個人與參考群組(例如素食群組)存在高度的相關性,若與其它參考群組存在高度相關,代表應改歸類到另一個群組。個人與參考群組間的相關係數指標可以由以下公式取得:
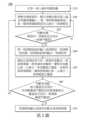
於步驟230中,處理器20判斷訓練模型的一準確率是否高於一訓練門檻值。In
當訓練模型的準確率高於訓練門檻值時,處理器20將訓練模型視為一預測模型。When the accuracy rate of the training model is higher than the training threshold, the
當訓練模型的準確率不高於訓練門檻值時,處理器20執行步驟220,將個人偏好相關係數、更多的歷史環境資料及歷史消費紀錄輸入第一類神經網路模型。When the accuracy of the training model is not higher than the training threshold, the
模型訓練的結果是為了可以精準的預測商家客人的來店數,結合歷史環境資料、歷史消費紀錄與消費記錄及個人偏好相關係數,資料上一定會有遺漏與缺值,故會透過個人的背景資料與所屬的群組屬性的平均值,對缺失值進行填補的工作。於一實施例中,處理器20更用判斷個人偏好相關係數、環境資料或歷史消費紀錄是否包含一缺漏值,當處理器20判斷個人偏好相關係數、歷史環境資料或歷史消費紀錄包含缺漏值(例如沒有收集到某一天的天氣資料),則處理器自動填補缺漏值(例如由相鄰兩天的天氣資料作平均值計算)。The result of model training is to accurately predict the number of customers who come to the store. Combining historical environmental data, historical consumption records, consumption records and personal preference correlation coefficients, there must be omissions and missing values in the data, so it will be through personal background The average value of the data and the attributes of the group to which it belongs, fills in the missing values. In one embodiment, the
於一實施例中,可能每個人在店家消費的記錄次數不平均,處理器20會對資料量作平衡與增加或減少資料量,以確保模型預測的精準度。In one embodiment, each person may have an uneven consumption record at the store, and the
於一實施例中,處理器20將一訓練資料輸入訓練模型,以得到一訓練結果,將訓練結果與一已知結果(例如歷史環境資料或歷史消費紀錄)進行相似度比對,以計算訓練模型的準確率。In one embodiment, the
於步驟240中,處理器20將一預測環境資料輸入預測模型,預測模型依據一預測環境資料輸出一預測結果。In
例如,處理器20輸入天氣為陰天、特賣會活動、溫度為26溫度、產品類型為豬肉主餐、職稱為工程師等預測環境資料到預測模型中,預測模型輸出的預測結果為來客數50人(預測來客數)、營業額為8000元(預測營業額)及其他預測項目(例如預測消費次數、預測當月排名...等等)。For example, the
於一實施例中,預測環境資料可以是外顯指標39及/或消費指標44中包含的部分資料。In one embodiment, the predicted environmental data can be
於一實施例中,預測環境資料可以視為據以預測未來一時間區間(例如一週)的資料或條件限制,預測環境資料例如包含日期、天氣、活動、溫度、商店、評價、現今收款、是否員工卡消費、經營時段、位置、方便性、滿意度、員工編號或商店位置...等等用以預測的條件。In one embodiment, the forecasted environmental data can be regarded as data or conditional constraints for predicting a future time interval (for example, one week). For example, the forecasted environmental data includes date, weather, activity, temperature, store, evaluation, current payment, Whether it is employee card consumption, business hours, location, convenience, satisfaction, employee number or store location... etc. are used for forecasting conditions.
於步驟250中,處理器20擷取出預測結果中的一預測來客數及一預測營業額,將預測來客數與一實際來客數比對,以產生一來客數修正權重,並將預測營業額與一實際營業額比對,以產生一營業額修正權重。In step 250, the
例如,預測結果為來客數50人(例如預測下周三來客數),營業額為8000元(例如預測下周三營業額),則處理器20將預測來客數50人與實際來客數75人(例如下週三當日實際結算後的來客數)進行比對(由於75為50的1.5倍,來客數修正權重為1.5),並將預測營業額8000元與實際營業額9600元(例如下週三當日實際結算後的營業額)進行比對(由於9600為8000的1.2倍,營業額修正權重為1.2)。For example, if the prediction result is 50 visitors (such as predicting the number of visitors next Wednesday), and the turnover is 8,000 yuan (such as predicting the turnover next Wednesday), then
於步驟260中,處理器20判斷來客數修正權重(例如1.5)是否高於一來客數權重門檻值(例如1.2)或是營業額修正權重(例如1.3)是否高於一營業額權重門檻值(例如1.3)。In
於一實施例中,當來客數修正權重高於來客數權重門檻值或是營業額修正權重高於營業額權重門檻值,則進入步驟220,將歷史環境資料、歷史消費紀錄及個人偏好相關係數輸入第一類神經網路模型,並依據來客數修正權重與營業額修正權重調整訓練模型,以更新訓練模型。In one embodiment, when the modified weight of the number of visitors is higher than the weight threshold of the number of visitors or the modified weight of the turnover is higher than the threshold of the weight of the turnover, then enter
於一實施例中,當來客數修正權重不高於來客數權重門檻值且營業額修正權重不高於營業額權重門檻值,則進入步驟270。In one embodiment, when the modified weight of the number of visitors is not higher than the weighted threshold of the number of visitors and the modified weight of the turnover is not higher than the threshold of the weighted turnover, then go to step 270 .
於此例中,處理器20判斷來客數修正權重(例如1.5)高於來客數權重門檻值(例如1.2),因此,會將客數權重門檻值回傳到步驟220,於一些例子中,處理器20會一併傳送客數權重門檻值及營業額修正權重到步驟220。In this example, the
於一實施例中,處理器20可以將當日相同客群的消費傾向的資料或/及當日收集的環境資料傳送到步驟220,步驟220中的第一類神經網路模型可以取得更多的資訊以調整訓練模型。In one embodiment, the
於步驟270中,預測模型輸出預測來客數及預測營業額。In step 270, the prediction model outputs the predicted number of visitors and the predicted turnover.
於一實施例中,處理器20或預測模型可以在當次預測或下一次的預測時,將預測來客數(例如50人)乘以來客數修正權重(例如1.5),以得到一來客數修正結果(例如75人),並將預測營業額(例如8000元)乘以營業額修正權重(例如1.2),以得到一營業額修正結果(例如9600元)。In one embodiment, the
於一實施例中,在產生模型預測的過程中,並非一次就能找出最佳模型,會經由消費預測系統100的重複步驟210~230,找出前幾名精準度較高,錯誤率最低者作為預測模型,並以預測模型為基礎,對個人的來店機率作預測。預測模型最後會得出推薦給個人的店家與產品排名,並依這排名資料,進行預測一時間區間(例如一週)內的店家來客數量,並依每日的營業情況與個人的選擇,進行權重的修正,讓一週內的來客數量與營業額可以趨進正確範圍內。這樣的修正結果,可以回饋到人工智慧模型(即回到步驟220)裡,一起加入模型訓練的輸入資料。此外,預測模型的輸出結果可以乘以權重,以修正來店客數的預測值。In one embodiment, in the process of generating model predictions, the best model cannot be found at one time, and the
由上述可知,在人工智能時代,資料量巨大且繁雜,若要能準確且有效率的預測資料,則要考慮的因素及資料量龐雜,因此,資料收集不能再依懶人工的維護。本發明所示之消費預測系統及消費預測方法透過類神經網路模型分析大量且繁雜的資料,進而生成預測模型,並可以透過預測模型輸出未來一段時間內的預測來客人數及預測營業額,亦可以比對預測來客人數與實際來客數,以得到來客數修正權重,比對預測營業額與實際營業額比對,以得到營業額修正權重,透過來客數修正權重及營業額修正權重可以調整預測模型,使預測模型更加準確。It can be seen from the above that in the era of artificial intelligence, the amount of data is huge and complicated. To accurately and efficiently predict the data, the factors and the amount of data must be considered. Therefore, data collection can no longer rely on lazy manual maintenance. The consumption prediction system and consumption prediction method shown in the present invention analyze a large amount of complicated data through a neural network model, and then generate a prediction model, and can output the predicted number of visitors and predicted turnover in a period of time in the future through the prediction model, and also It is possible to compare the predicted number of visitors with the actual number of visitors to obtain the corrected weight of the number of visitors, and compare the forecasted turnover with the actual turnover to obtain the revised weight of the turnover. The forecast can be adjusted through the corrected weight of the number of visitors and the revised weight of the turnover model to make predictive models more accurate.
200:消費預測方法200: Consumption Forecasting Methods
210~270:步驟210~270: steps
Claims (8)
Translated fromChinesePriority Applications (3)
| Application Number | Priority Date | Filing Date | Title |
|---|---|---|---|
| TW109110919ATWI793412B (en) | 2020-03-31 | 2020-03-31 | Consumption prediction system and consumption prediction method |
| CN202010315991.8ACN113469722B (en) | 2020-03-31 | 2020-04-21 | Consumption forecasting system and consumption forecasting method |
| US17/000,681US11983726B2 (en) | 2020-03-31 | 2020-08-24 | Consumption prediction system and consumption prediction method |
Applications Claiming Priority (1)
| Application Number | Priority Date | Filing Date | Title |
|---|---|---|---|
| TW109110919ATWI793412B (en) | 2020-03-31 | 2020-03-31 | Consumption prediction system and consumption prediction method |
Publications (2)
| Publication Number | Publication Date |
|---|---|
| TW202139098A TW202139098A (en) | 2021-10-16 |
| TWI793412Btrue TWI793412B (en) | 2023-02-21 |
Family
ID=77857246
Family Applications (1)
| Application Number | Title | Priority Date | Filing Date |
|---|---|---|---|
| TW109110919ATWI793412B (en) | 2020-03-31 | 2020-03-31 | Consumption prediction system and consumption prediction method |
Country Status (3)
| Country | Link |
|---|---|
| US (1) | US11983726B2 (en) |
| CN (1) | CN113469722B (en) |
| TW (1) | TWI793412B (en) |
Families Citing this family (9)
| Publication number | Priority date | Publication date | Assignee | Title |
|---|---|---|---|---|
| US11605100B1 (en) | 2017-12-22 | 2023-03-14 | Salesloft, Inc. | Methods and systems for determining cadences |
| CN114139920B (en)* | 2021-11-26 | 2025-06-24 | 华中师范大学 | A KPI allocation method and application for automobile enterprise activity operation based on sliding sales funnel |
| US11586878B1 (en)* | 2021-12-10 | 2023-02-21 | Salesloft, Inc. | Methods and systems for cascading model architecture for providing information on reply emails |
| TWI828426B (en)* | 2022-11-16 | 2024-01-01 | 精誠資訊股份有限公司 | An e-commerce auxiliary system that uses multi-oriented product search information to conduct sales forecasts |
| CN116051173B (en)* | 2023-03-30 | 2023-06-30 | 安徽交欣科技股份有限公司 | Passenger flow prediction method, passenger flow prediction system and bus dispatching method |
| CN117494907A (en)* | 2023-12-29 | 2024-02-02 | 青岛巨商汇网络科技有限公司 | Factory production plan scheduling optimization method and system based on sales data analysis |
| CN117575475B (en)* | 2024-01-16 | 2024-04-12 | 中铁四局集团有限公司 | Quick construction and display method for large-screen report based on data warehouse |
| CN117745338B (en)* | 2024-02-20 | 2024-05-03 | 山东浪潮数字商业科技有限公司 | Wine consumption prediction method based on curvelet transformation, electronic equipment and storage medium |
| CN118071395A (en)* | 2024-02-23 | 2024-05-24 | 重庆嗨客网络科技有限公司 | Digital marketing operation and management system and method for intelligent business complex |
Citations (8)
| Publication number | Priority date | Publication date | Assignee | Title |
|---|---|---|---|---|
| US20140067484A1 (en)* | 2006-12-28 | 2014-03-06 | Oracle Otc Subsidiary Llc | Predictive and profile learning sales automation analytics system and method |
| CN106504029A (en)* | 2016-11-08 | 2017-03-15 | 山东大学 | A kind of gas station's Method for Sales Forecast method based on customer group's behavior analysiss |
| TW201837814A (en)* | 2017-03-22 | 2018-10-16 | 國立臺灣師範大學 | Product sales forecasting method and system based on model-free speculation |
| CN108764646A (en)* | 2018-04-27 | 2018-11-06 | 车智互联(北京)科技有限公司 | A kind of Method for Sales Forecast method and computing device |
| CN109509030A (en)* | 2018-11-15 | 2019-03-22 | 北京旷视科技有限公司 | Method for Sales Forecast method and its training method of model, device and electronic system |
| CN110415002A (en)* | 2019-07-31 | 2019-11-05 | 中国工商银行股份有限公司 | Customer behavior prediction method and system |
| CN110443314A (en)* | 2019-08-08 | 2019-11-12 | 中国工商银行股份有限公司 | Scenic spot passenger flow forecast method and device based on machine learning |
| CN110580639A (en)* | 2019-08-08 | 2019-12-17 | 江苏荣泽信息科技股份有限公司 | Store operation prediction method based on chain business state |
Family Cites Families (8)
| Publication number | Priority date | Publication date | Assignee | Title |
|---|---|---|---|---|
| WO2008067543A2 (en)* | 2006-11-30 | 2008-06-05 | Mastercard International Incorporated | Techniques for targeted offers |
| US11593817B2 (en)* | 2015-06-30 | 2023-02-28 | Panasonic Intellectual Property Corporation Of America | Demand prediction method, demand prediction apparatus, and non-transitory computer-readable recording medium |
| US10740773B2 (en)* | 2015-12-09 | 2020-08-11 | Walmart Apollo, Llc | Systems and methods of utilizing multiple forecast models in forecasting customer demands for products at retail facilities |
| US20180053255A1 (en)* | 2016-08-19 | 2018-02-22 | Noonum | System and Method for end to end investment and portfolio management using machine driven analysis of the market against qualifying factors |
| CN107067283B (en)* | 2017-04-21 | 2021-05-18 | 重庆邮电大学 | E-commerce consumption customer flow prediction method based on historical merchant records and user behaviors |
| US20190102693A1 (en)* | 2017-09-29 | 2019-04-04 | Facebook, Inc. | Optimizing parameters for machine learning models |
| CN108846692B (en)* | 2018-06-05 | 2021-03-30 | 浙江大学城市学院 | A prediction method of consumer consumption behavior based on multi-factor recurrent neural network |
| US11373199B2 (en)* | 2018-10-26 | 2022-06-28 | Target Brands, Inc. | Method and system for generating ensemble demand forecasts |
- 2020
- 2020-03-31TWTW109110919Apatent/TWI793412B/enactive
- 2020-04-21CNCN202010315991.8Apatent/CN113469722B/enactiveActive
- 2020-08-24USUS17/000,681patent/US11983726B2/enactiveActive
Patent Citations (8)
| Publication number | Priority date | Publication date | Assignee | Title |
|---|---|---|---|---|
| US20140067484A1 (en)* | 2006-12-28 | 2014-03-06 | Oracle Otc Subsidiary Llc | Predictive and profile learning sales automation analytics system and method |
| CN106504029A (en)* | 2016-11-08 | 2017-03-15 | 山东大学 | A kind of gas station's Method for Sales Forecast method based on customer group's behavior analysiss |
| TW201837814A (en)* | 2017-03-22 | 2018-10-16 | 國立臺灣師範大學 | Product sales forecasting method and system based on model-free speculation |
| CN108764646A (en)* | 2018-04-27 | 2018-11-06 | 车智互联(北京)科技有限公司 | A kind of Method for Sales Forecast method and computing device |
| CN109509030A (en)* | 2018-11-15 | 2019-03-22 | 北京旷视科技有限公司 | Method for Sales Forecast method and its training method of model, device and electronic system |
| CN110415002A (en)* | 2019-07-31 | 2019-11-05 | 中国工商银行股份有限公司 | Customer behavior prediction method and system |
| CN110443314A (en)* | 2019-08-08 | 2019-11-12 | 中国工商银行股份有限公司 | Scenic spot passenger flow forecast method and device based on machine learning |
| CN110580639A (en)* | 2019-08-08 | 2019-12-17 | 江苏荣泽信息科技股份有限公司 | Store operation prediction method based on chain business state |
Also Published As
| Publication number | Publication date |
|---|---|
| US20210303996A1 (en) | 2021-09-30 |
| TW202139098A (en) | 2021-10-16 |
| CN113469722B (en) | 2025-01-14 |
| CN113469722A (en) | 2021-10-01 |
| US11983726B2 (en) | 2024-05-14 |
Similar Documents
| Publication | Publication Date | Title |
|---|---|---|
| TWI793412B (en) | Consumption prediction system and consumption prediction method | |
| Li et al. | Economical user-generated content (UGC) marketing for online stores based on a fine-grained joint model of the consumer purchase decision process. | |
| US20180047071A1 (en) | System and methods for aggregating past and predicting future product ratings | |
| KR102227552B1 (en) | System for providing context awareness algorithm based restaurant sorting personalized service using review category | |
| US10878520B2 (en) | Waste analysis system and method | |
| KR100961783B1 (en) | Apparatus and method for presenting personalized goods and vendors based on artificial intelligence, and recording medium thereof | |
| JP5960887B1 (en) | Calculation device, calculation method, and calculation program | |
| CN110880127B (en) | Consumption level prediction method and device, electronic equipment and storage medium | |
| CN113254775A (en) | Credit card product recommendation method based on client browsing behavior sequence | |
| CN118917883B (en) | A blockchain-based enterprise marketing planning system | |
| KR102405503B1 (en) | Method for creating predictive market growth index using transaction data and social data, system for creating predictive market growth index using the same and computer program for the same | |
| Hong et al. | Measuring product type with dynamics of online product review variances: A theoretical model and the empirical applications | |
| CN105809465A (en) | Information processing method and device | |
| CN114528416B (en) | Enterprise public opinion environment monitoring method and system based on big data | |
| Ehsani et al. | Customer purchase prediction in electronic markets from clickstream data using the Oracle meta-classifier | |
| Haque | E-commerce product recommendation system based on ml algorithms | |
| CN115760347A (en) | Bank product management system | |
| JP2017054554A (en) | Calculation device, calculation method, and calculation program | |
| CN119515563B (en) | Method, device and readable storage medium for generating insurance proposal | |
| CN112182165A (en) | New product quality planning method based on online comments | |
| CN119782847B (en) | One-article multi-code scene supporting method | |
| CN119250487B (en) | A method for automatically pushing orders based on system connection based on big data | |
| Wang et al. | Identifying Popular Products at an Early Stage of Sales Season for Apparel Industry | |
| US20240312234A1 (en) | Information processing device and method for processing information | |
| KR102551779B1 (en) | Persona-based review data analysis method and system |