TWI786520B - Detection of genetic or molecular aberrations associated with cancer - Google Patents
Detection of genetic or molecular aberrations associated with cancerDownload PDFInfo
- Publication number
- TWI786520B TWI786520BTW110101988ATW110101988ATWI786520BTW I786520 BTWI786520 BTW I786520BTW 110101988 ATW110101988 ATW 110101988ATW 110101988 ATW110101988 ATW 110101988ATW I786520 BTWI786520 BTW I786520B
- Authority
- TW
- Taiwan
- Prior art keywords
- cancer
- value
- chromosomal
- regions
- nucleic acid
- Prior art date
Links
- 206010028980NeoplasmDiseases0.000titleclaimsabstractdescription422
- 201000011510cancerDiseases0.000titleclaimsabstractdescription201
- 230000004075alterationEffects0.000titleabstractdescription10
- 230000002068genetic effectEffects0.000titleabstractdescription3
- 238000001514detection methodMethods0.000titledescription22
- 230000002759chromosomal effectEffects0.000claimsabstractdescription254
- 238000000034methodMethods0.000claimsabstractdescription150
- 238000012217deletionMethods0.000claimsabstractdescription86
- 230000037430deletionEffects0.000claimsabstractdescription85
- 230000003321amplificationEffects0.000claimsabstractdescription76
- 238000003199nucleic acid amplification methodMethods0.000claimsabstractdescription76
- 239000012472biological sampleSubstances0.000claimsabstractdescription40
- 230000001747exhibiting effectEffects0.000claimsabstractdescription28
- 208000006994Precancerous ConditionsDiseases0.000claimsabstractdescription8
- 150000007523nucleic acidsChemical class0.000claimsdescription92
- 210000000349chromosomeAnatomy0.000claimsdescription90
- 102000039446nucleic acidsHuman genes0.000claimsdescription82
- 108020004707nucleic acidsProteins0.000claimsdescription82
- 210000001519tissueAnatomy0.000claimsdescription79
- 238000009826distributionMethods0.000claimsdescription74
- 210000004027cellAnatomy0.000claimsdescription64
- 206010061306Nasopharyngeal cancerDiseases0.000claimsdescription9
- 238000004590computer programMethods0.000claimsdescription5
- 230000003902lesionEffects0.000claimsdescription5
- 201000010536head and neck cancerDiseases0.000claimsdescription3
- 208000014829head and neck neoplasmDiseases0.000claimsdescription3
- 238000003860storageMethods0.000claimsdescription3
- 206010009944Colon cancerDiseases0.000claimsdescription2
- 208000001333Colorectal NeoplasmsDiseases0.000claimsdescription2
- 206010005003Bladder cancerDiseases0.000claims1
- 206010025323LymphomasDiseases0.000claims1
- 208000001894Nasopharyngeal NeoplasmsDiseases0.000claims1
- 206010060862Prostate cancerDiseases0.000claims1
- 208000000236Prostatic NeoplasmsDiseases0.000claims1
- 206010041067Small cell lung cancerDiseases0.000claims1
- 208000005718Stomach NeoplasmsDiseases0.000claims1
- 208000024770Thyroid neoplasmDiseases0.000claims1
- 208000007097Urinary Bladder NeoplasmsDiseases0.000claims1
- 230000003190augmentative effectEffects0.000claims1
- 230000001413cellular effectEffects0.000claims1
- 206010017758gastric cancerDiseases0.000claims1
- 201000001441melanomaDiseases0.000claims1
- 208000002154non-small cell lung carcinomaDiseases0.000claims1
- 208000000587small cell lung carcinomaDiseases0.000claims1
- 201000011549stomach cancerDiseases0.000claims1
- 201000002510thyroid cancerDiseases0.000claims1
- 208000029729tumor suppressor gene on chromosome 11Diseases0.000claims1
- 201000005112urinary bladder cancerDiseases0.000claims1
- 239000012634fragmentSubstances0.000abstractdescription172
- 238000004458analytical methodMethods0.000abstractdescription87
- 239000000523sampleSubstances0.000abstractdescription54
- 238000012544monitoring processMethods0.000abstractdescription20
- 238000012216screeningMethods0.000abstractdescription13
- 230000009897systematic effectEffects0.000abstractdescription4
- 108020004414DNAProteins0.000description245
- 102000053602DNAHuman genes0.000description245
- 102000054766genetic haplotypesHuman genes0.000description223
- 210000002381plasmaAnatomy0.000description132
- 108700028369AllelesProteins0.000description109
- 206010073071hepatocellular carcinomaDiseases0.000description48
- 231100000844hepatocellular carcinomaToxicity0.000description48
- 238000012163sequencing techniqueMethods0.000description36
- 230000001186cumulative effectEffects0.000description32
- 230000035772mutationEffects0.000description18
- 230000000875corresponding effectEffects0.000description17
- 208000031404Chromosome AberrationsDiseases0.000description14
- 231100000005chromosome aberrationToxicity0.000description14
- 238000005259measurementMethods0.000description13
- 238000012360testing methodMethods0.000description13
- 238000002271resectionMethods0.000description12
- 230000008859changeEffects0.000description11
- 230000035945sensitivityEffects0.000description11
- 201000010099diseaseDiseases0.000description10
- 208000037265diseases, disorders, signs and symptomsDiseases0.000description10
- 238000005516engineering processMethods0.000description10
- 108090000623proteins and genesProteins0.000description10
- 238000007847digital PCRMethods0.000description9
- 239000002773nucleotideSubstances0.000description9
- 125000003729nucleotide groupChemical group0.000description9
- 208000002454Nasopharyngeal CarcinomaDiseases0.000description8
- 238000013459approachMethods0.000description8
- 238000003745diagnosisMethods0.000description8
- 201000011216nasopharynx carcinomaDiseases0.000description8
- 210000004881tumor cellAnatomy0.000description8
- 108091028043Nucleic acid sequenceProteins0.000description7
- 230000035508accumulationEffects0.000description7
- 238000009825accumulationMethods0.000description7
- 230000002829reductive effectEffects0.000description7
- 206010061818Disease progressionDiseases0.000description6
- 230000005750disease progressionEffects0.000description6
- 210000002966serumAnatomy0.000description6
- 210000004369bloodAnatomy0.000description5
- 239000008280bloodSubstances0.000description5
- 230000006870functionEffects0.000description5
- 238000003205genotyping methodMethods0.000description5
- 238000010208microarray analysisMethods0.000description5
- 239000000203mixtureSubstances0.000description5
- 238000003752polymerase chain reactionMethods0.000description5
- 102000054765polymorphisms of proteinsHuman genes0.000description5
- 238000004393prognosisMethods0.000description5
- 206010027476MetastasesDiseases0.000description4
- 210000001165lymph nodeAnatomy0.000description4
- 230000009401metastasisEffects0.000description4
- 238000010606normalizationMethods0.000description4
- 239000013074reference sampleSubstances0.000description4
- 108020004705CodonProteins0.000description3
- 206010061309Neoplasm progressionDiseases0.000description3
- 241000700605VirusesSpecies0.000description3
- 230000005540biological transmissionEffects0.000description3
- 238000002512chemotherapyMethods0.000description3
- 230000002596correlated effectEffects0.000description3
- 230000000694effectsEffects0.000description3
- 238000003384imaging methodMethods0.000description3
- 230000009545invasionEffects0.000description3
- 238000005304joiningMethods0.000description3
- 238000002493microarrayMethods0.000description3
- 230000003287optical effectEffects0.000description3
- 238000003753real-time PCRMethods0.000description3
- 230000009467reductionEffects0.000description3
- 230000004044responseEffects0.000description3
- 229920002477rna polymerPolymers0.000description3
- 238000004904shorteningMethods0.000description3
- 238000001356surgical procedureMethods0.000description3
- 230000004614tumor growthEffects0.000description3
- 230000005751tumor progressionEffects0.000description3
- 208000000419Chronic Hepatitis BDiseases0.000description2
- 241000700721Hepatitis B virusSpecies0.000description2
- 108091092195IntronProteins0.000description2
- 108700011259MicroRNAsProteins0.000description2
- 108091034117OligonucleotideProteins0.000description2
- 108091027967Small hairpin RNAProteins0.000description2
- 108700025716Tumor Suppressor GenesProteins0.000description2
- 102000044209Tumor Suppressor GenesHuman genes0.000description2
- JLCPHMBAVCMARE-UHFFFAOYSA-N[3-[[3-[[3-[[3-[[3-[[3-[[3-[[3-[[3-[[3-[[3-[[5-(2-amino-6-oxo-1H-purin-9-yl)-3-[[3-[[3-[[3-[[3-[[3-[[5-(2-amino-6-oxo-1H-purin-9-yl)-3-[[5-(2-amino-6-oxo-1H-purin-9-yl)-3-hydroxyoxolan-2-yl]methoxy-hydroxyphosphoryl]oxyoxolan-2-yl]methoxy-hydroxyphosphoryl]oxy-5-(5-methyl-2,4-dioxopyrimidin-1-yl)oxolan-2-yl]methoxy-hydroxyphosphoryl]oxy-5-(6-aminopurin-9-yl)oxolan-2-yl]methoxy-hydroxyphosphoryl]oxy-5-(6-aminopurin-9-yl)oxolan-2-yl]methoxy-hydroxyphosphoryl]oxy-5-(6-aminopurin-9-yl)oxolan-2-yl]methoxy-hydroxyphosphoryl]oxy-5-(6-aminopurin-9-yl)oxolan-2-yl]methoxy-hydroxyphosphoryl]oxyoxolan-2-yl]methoxy-hydroxyphosphoryl]oxy-5-(5-methyl-2,4-dioxopyrimidin-1-yl)oxolan-2-yl]methoxy-hydroxyphosphoryl]oxy-5-(4-amino-2-oxopyrimidin-1-yl)oxolan-2-yl]methoxy-hydroxyphosphoryl]oxy-5-(5-methyl-2,4-dioxopyrimidin-1-yl)oxolan-2-yl]methoxy-hydroxyphosphoryl]oxy-5-(5-methyl-2,4-dioxopyrimidin-1-yl)oxolan-2-yl]methoxy-hydroxyphosphoryl]oxy-5-(6-aminopurin-9-yl)oxolan-2-yl]methoxy-hydroxyphosphoryl]oxy-5-(6-aminopurin-9-yl)oxolan-2-yl]methoxy-hydroxyphosphoryl]oxy-5-(4-amino-2-oxopyrimidin-1-yl)oxolan-2-yl]methoxy-hydroxyphosphoryl]oxy-5-(4-amino-2-oxopyrimidin-1-yl)oxolan-2-yl]methoxy-hydroxyphosphoryl]oxy-5-(4-amino-2-oxopyrimidin-1-yl)oxolan-2-yl]methoxy-hydroxyphosphoryl]oxy-5-(6-aminopurin-9-yl)oxolan-2-yl]methoxy-hydroxyphosphoryl]oxy-5-(4-amino-2-oxopyrimidin-1-yl)oxolan-2-yl]methyl [5-(6-aminopurin-9-yl)-2-(hydroxymethyl)oxolan-3-yl] hydrogen phosphatePolymersCc1cn(C2CC(OP(O)(=O)OCC3OC(CC3OP(O)(=O)OCC3OC(CC3O)n3cnc4c3nc(N)[nH]c4=O)n3cnc4c3nc(N)[nH]c4=O)C(COP(O)(=O)OC3CC(OC3COP(O)(=O)OC3CC(OC3COP(O)(=O)OC3CC(OC3COP(O)(=O)OC3CC(OC3COP(O)(=O)OC3CC(OC3COP(O)(=O)OC3CC(OC3COP(O)(=O)OC3CC(OC3COP(O)(=O)OC3CC(OC3COP(O)(=O)OC3CC(OC3COP(O)(=O)OC3CC(OC3COP(O)(=O)OC3CC(OC3COP(O)(=O)OC3CC(OC3COP(O)(=O)OC3CC(OC3COP(O)(=O)OC3CC(OC3COP(O)(=O)OC3CC(OC3COP(O)(=O)OC3CC(OC3COP(O)(=O)OC3CC(OC3CO)n3cnc4c(N)ncnc34)n3ccc(N)nc3=O)n3cnc4c(N)ncnc34)n3ccc(N)nc3=O)n3ccc(N)nc3=O)n3ccc(N)nc3=O)n3cnc4c(N)ncnc34)n3cnc4c(N)ncnc34)n3cc(C)c(=O)[nH]c3=O)n3cc(C)c(=O)[nH]c3=O)n3ccc(N)nc3=O)n3cc(C)c(=O)[nH]c3=O)n3cnc4c3nc(N)[nH]c4=O)n3cnc4c(N)ncnc34)n3cnc4c(N)ncnc34)n3cnc4c(N)ncnc34)n3cnc4c(N)ncnc34)O2)c(=O)[nH]c1=OJLCPHMBAVCMARE-UHFFFAOYSA-N0.000description2
- 230000002159abnormal effectEffects0.000description2
- 210000003484anatomyAnatomy0.000description2
- 238000002869basic local alignment search toolMethods0.000description2
- 239000011324beadSubstances0.000description2
- 230000008901benefitEffects0.000description2
- 210000000601blood cellAnatomy0.000description2
- 238000004422calculation algorithmMethods0.000description2
- 239000000969carrierSubstances0.000description2
- 238000000546chi-square testMethods0.000description2
- 238000012937correctionMethods0.000description2
- 230000002559cytogenic effectEffects0.000description2
- 230000003247decreasing effectEffects0.000description2
- 238000002405diagnostic procedureMethods0.000description2
- 239000000839emulsionSubstances0.000description2
- 230000001605fetal effectEffects0.000description2
- 239000012530fluidSubstances0.000description2
- 230000004077genetic alterationEffects0.000description2
- 230000037442genomic alterationEffects0.000description2
- 238000011331genomic analysisMethods0.000description2
- 208000002672hepatitis BDiseases0.000description2
- 238000009169immunotherapyMethods0.000description2
- 210000004072lungAnatomy0.000description2
- 208000020816lung neoplasmDiseases0.000description2
- 230000036210malignancyEffects0.000description2
- 238000013507mappingMethods0.000description2
- 238000004949mass spectrometryMethods0.000description2
- 230000008774maternal effectEffects0.000description2
- 230000004048modificationEffects0.000description2
- 238000012986modificationMethods0.000description2
- 238000007838multiplex ligation-dependent probe amplificationMethods0.000description2
- 230000001613neoplastic effectEffects0.000description2
- 210000004882non-tumor cellAnatomy0.000description2
- 210000000056organAnatomy0.000description2
- 102000040430polynucleotideHuman genes0.000description2
- 108091033319polynucleotideProteins0.000description2
- 239000002157polynucleotideSubstances0.000description2
- 238000011002quantificationMethods0.000description2
- 230000005855radiationEffects0.000description2
- 239000007787solidSubstances0.000description2
- 238000001228spectrumMethods0.000description2
- 238000007619statistical methodMethods0.000description2
- 238000006467substitution reactionMethods0.000description2
- 230000004083survival effectEffects0.000description2
- 238000002626targeted therapyMethods0.000description2
- VGONTNSXDCQUGY-RRKCRQDMSA-N2'-deoxyinosineChemical groupC1[C@H](O)[C@@H](CO)O[C@H]1N1C(N=CNC2=O)=C2N=C1VGONTNSXDCQUGY-RRKCRQDMSA-N0.000description1
- 108091093088AmpliconProteins0.000description1
- 206010003445AscitesDiseases0.000description1
- 206010008263Cervical dysplasiaDiseases0.000description1
- 206010008342Cervix carcinomaDiseases0.000description1
- 206010061764Chromosomal deletionDiseases0.000description1
- 108091026890Coding regionProteins0.000description1
- 238000013382DNA quantificationMethods0.000description1
- 102000001301EGF receptorHuman genes0.000description1
- 108060006698EGF receptorProteins0.000description1
- 108700024394ExonProteins0.000description1
- 206010064571Gene mutationDiseases0.000description1
- 241000701044Human gammaherpesvirus 4Species0.000description1
- 108091007412Piwi-interacting RNAProteins0.000description1
- 208000020584PolyploidyDiseases0.000description1
- 240000003705Senecio vulgarisSpecies0.000description1
- 208000006105Uterine Cervical NeoplasmsDiseases0.000description1
- 239000002253acidSubstances0.000description1
- 230000002411adverseEffects0.000description1
- 238000007844allele-specific PCRMethods0.000description1
- 150000001408amidesChemical class0.000description1
- 208000036878aneuploidyDiseases0.000description1
- 231100001075aneuploidyToxicity0.000description1
- 238000003556assayMethods0.000description1
- 210000000941bileAnatomy0.000description1
- 230000015572biosynthetic processEffects0.000description1
- 238000004364calculation methodMethods0.000description1
- 230000015556catabolic processEffects0.000description1
- 108091092356cellular DNAProteins0.000description1
- 238000005119centrifugationMethods0.000description1
- 210000002230centromereAnatomy0.000description1
- 201000010881cervical cancerDiseases0.000description1
- 208000007951cervical intraepithelial neoplasiaDiseases0.000description1
- 230000001684chronic effectEffects0.000description1
- 108091092240circulating cell-free DNAProteins0.000description1
- 208000019425cirrhosis of liverDiseases0.000description1
- 230000000295complement effectEffects0.000description1
- 239000002299complementary DNASubstances0.000description1
- 230000007423decreaseEffects0.000description1
- 238000006731degradation reactionMethods0.000description1
- 238000010586diagramMethods0.000description1
- 238000011304droplet digital PCRMethods0.000description1
- 230000006862enzymatic digestionEffects0.000description1
- 210000003608feceAnatomy0.000description1
- 238000007672fourth generation sequencingMethods0.000description1
- 238000007429general methodMethods0.000description1
- 231100000118genetic alterationToxicity0.000description1
- 230000007614genetic variationEffects0.000description1
- 238000009499grossingMethods0.000description1
- 230000036541healthEffects0.000description1
- 230000003862health statusEffects0.000description1
- 208000006454hepatitisDiseases0.000description1
- 231100000283hepatitisToxicity0.000description1
- 210000003917human chromosomeAnatomy0.000description1
- 230000002998immunogenetic effectEffects0.000description1
- 230000006872improvementEffects0.000description1
- 238000003780insertionMethods0.000description1
- 230000037431insertionEffects0.000description1
- 229940043355kinase inhibitorDrugs0.000description1
- 230000000670limiting effectEffects0.000description1
- 230000005389magnetismEffects0.000description1
- 230000014759maintenance of locationEffects0.000description1
- 238000004519manufacturing processMethods0.000description1
- 239000003550markerSubstances0.000description1
- 108020004999messenger RNAProteins0.000description1
- 230000011987methylationEffects0.000description1
- 238000007069methylation reactionMethods0.000description1
- 238000001531micro-dissectionMethods0.000description1
- 230000017074necrotic cell deathEffects0.000description1
- 230000009826neoplastic cell growthEffects0.000description1
- 108091027963non-coding RNAProteins0.000description1
- 102000042567non-coding RNAHuman genes0.000description1
- 210000001819pancreatic juiceAnatomy0.000description1
- 238000009595pap smearMethods0.000description1
- 230000001717pathogenic effectEffects0.000description1
- 239000013610patient sampleSubstances0.000description1
- 230000002093peripheral effectEffects0.000description1
- 230000002085persistent effectEffects0.000description1
- 239000012071phaseSubstances0.000description1
- 239000003757phosphotransferase inhibitorSubstances0.000description1
- 210000004910pleural fluidAnatomy0.000description1
- 229920000642polymerPolymers0.000description1
- 229920001184polypeptidePolymers0.000description1
- 238000010837poor prognosisMethods0.000description1
- 230000002980postoperative effectEffects0.000description1
- 239000002243precursorSubstances0.000description1
- 238000002203pretreatmentMethods0.000description1
- 230000008569processEffects0.000description1
- 102000004196processed proteins & peptidesHuman genes0.000description1
- 108090000765processed proteins & peptidesProteins0.000description1
- 238000012545processingMethods0.000description1
- 208000037821progressive diseaseDiseases0.000description1
- 230000008707rearrangementEffects0.000description1
- 238000011084recoveryMethods0.000description1
- 230000000717retained effectEffects0.000description1
- 210000003296salivaAnatomy0.000description1
- 230000011218segmentationEffects0.000description1
- 238000005204segregationMethods0.000description1
- 238000011896sensitive detectionMethods0.000description1
- 238000007841sequencing by ligationMethods0.000description1
- 210000003765sex chromosomeAnatomy0.000description1
- 230000011664signalingEffects0.000description1
- 239000000344soapSubstances0.000description1
- 239000007790solid phaseSubstances0.000description1
- 238000011895specific detectionMethods0.000description1
- 230000007480spreadingEffects0.000description1
- 238000003892spreadingMethods0.000description1
- 238000010972statistical evaluationMethods0.000description1
- 238000000528statistical testMethods0.000description1
- 208000024891symptomDiseases0.000description1
- 238000003786synthesis reactionMethods0.000description1
- 238000012353t testMethods0.000description1
- 210000001138tearAnatomy0.000description1
- 238000013518transcriptionMethods0.000description1
- 230000035897transcriptionEffects0.000description1
- 210000002700urineAnatomy0.000description1
- 230000004584weight gainEffects0.000description1
- 235000019786weight gainNutrition0.000description1
Images


Classifications
- G—PHYSICS
- G16—INFORMATION AND COMMUNICATION TECHNOLOGY [ICT] SPECIALLY ADAPTED FOR SPECIFIC APPLICATION FIELDS
- G16B—BIOINFORMATICS, i.e. INFORMATION AND COMMUNICATION TECHNOLOGY [ICT] SPECIALLY ADAPTED FOR GENETIC OR PROTEIN-RELATED DATA PROCESSING IN COMPUTATIONAL MOLECULAR BIOLOGY
- G16B20/00—ICT specially adapted for functional genomics or proteomics, e.g. genotype-phenotype associations
- G16B20/20—Allele or variant detection, e.g. single nucleotide polymorphism [SNP] detection
- C—CHEMISTRY; METALLURGY
- C12—BIOCHEMISTRY; BEER; SPIRITS; WINE; VINEGAR; MICROBIOLOGY; ENZYMOLOGY; MUTATION OR GENETIC ENGINEERING
- C12Q—MEASURING OR TESTING PROCESSES INVOLVING ENZYMES, NUCLEIC ACIDS OR MICROORGANISMS; COMPOSITIONS OR TEST PAPERS THEREFOR; PROCESSES OF PREPARING SUCH COMPOSITIONS; CONDITION-RESPONSIVE CONTROL IN MICROBIOLOGICAL OR ENZYMOLOGICAL PROCESSES
- C12Q1/00—Measuring or testing processes involving enzymes, nucleic acids or microorganisms; Compositions therefor; Processes of preparing such compositions
- C12Q1/68—Measuring or testing processes involving enzymes, nucleic acids or microorganisms; Compositions therefor; Processes of preparing such compositions involving nucleic acids
- C12Q1/6809—Methods for determination or identification of nucleic acids involving differential detection
- C—CHEMISTRY; METALLURGY
- C12—BIOCHEMISTRY; BEER; SPIRITS; WINE; VINEGAR; MICROBIOLOGY; ENZYMOLOGY; MUTATION OR GENETIC ENGINEERING
- C12Q—MEASURING OR TESTING PROCESSES INVOLVING ENZYMES, NUCLEIC ACIDS OR MICROORGANISMS; COMPOSITIONS OR TEST PAPERS THEREFOR; PROCESSES OF PREPARING SUCH COMPOSITIONS; CONDITION-RESPONSIVE CONTROL IN MICROBIOLOGICAL OR ENZYMOLOGICAL PROCESSES
- C12Q1/00—Measuring or testing processes involving enzymes, nucleic acids or microorganisms; Compositions therefor; Processes of preparing such compositions
- C12Q1/68—Measuring or testing processes involving enzymes, nucleic acids or microorganisms; Compositions therefor; Processes of preparing such compositions involving nucleic acids
- C12Q1/6869—Methods for sequencing
- C—CHEMISTRY; METALLURGY
- C12—BIOCHEMISTRY; BEER; SPIRITS; WINE; VINEGAR; MICROBIOLOGY; ENZYMOLOGY; MUTATION OR GENETIC ENGINEERING
- C12Q—MEASURING OR TESTING PROCESSES INVOLVING ENZYMES, NUCLEIC ACIDS OR MICROORGANISMS; COMPOSITIONS OR TEST PAPERS THEREFOR; PROCESSES OF PREPARING SUCH COMPOSITIONS; CONDITION-RESPONSIVE CONTROL IN MICROBIOLOGICAL OR ENZYMOLOGICAL PROCESSES
- C12Q1/00—Measuring or testing processes involving enzymes, nucleic acids or microorganisms; Compositions therefor; Processes of preparing such compositions
- C12Q1/68—Measuring or testing processes involving enzymes, nucleic acids or microorganisms; Compositions therefor; Processes of preparing such compositions involving nucleic acids
- C12Q1/6876—Nucleic acid products used in the analysis of nucleic acids, e.g. primers or probes
- C12Q1/6883—Nucleic acid products used in the analysis of nucleic acids, e.g. primers or probes for diseases caused by alterations of genetic material
- C12Q1/6886—Nucleic acid products used in the analysis of nucleic acids, e.g. primers or probes for diseases caused by alterations of genetic material for cancer
- G—PHYSICS
- G16—INFORMATION AND COMMUNICATION TECHNOLOGY [ICT] SPECIALLY ADAPTED FOR SPECIFIC APPLICATION FIELDS
- G16B—BIOINFORMATICS, i.e. INFORMATION AND COMMUNICATION TECHNOLOGY [ICT] SPECIALLY ADAPTED FOR GENETIC OR PROTEIN-RELATED DATA PROCESSING IN COMPUTATIONAL MOLECULAR BIOLOGY
- G16B20/00—ICT specially adapted for functional genomics or proteomics, e.g. genotype-phenotype associations
- G16B20/10—Ploidy or copy number detection
- G—PHYSICS
- G16—INFORMATION AND COMMUNICATION TECHNOLOGY [ICT] SPECIALLY ADAPTED FOR SPECIFIC APPLICATION FIELDS
- G16B—BIOINFORMATICS, i.e. INFORMATION AND COMMUNICATION TECHNOLOGY [ICT] SPECIALLY ADAPTED FOR GENETIC OR PROTEIN-RELATED DATA PROCESSING IN COMPUTATIONAL MOLECULAR BIOLOGY
- G16B30/00—ICT specially adapted for sequence analysis involving nucleotides or amino acids
- G16B30/10—Sequence alignment; Homology search
- C—CHEMISTRY; METALLURGY
- C12—BIOCHEMISTRY; BEER; SPIRITS; WINE; VINEGAR; MICROBIOLOGY; ENZYMOLOGY; MUTATION OR GENETIC ENGINEERING
- C12Q—MEASURING OR TESTING PROCESSES INVOLVING ENZYMES, NUCLEIC ACIDS OR MICROORGANISMS; COMPOSITIONS OR TEST PAPERS THEREFOR; PROCESSES OF PREPARING SUCH COMPOSITIONS; CONDITION-RESPONSIVE CONTROL IN MICROBIOLOGICAL OR ENZYMOLOGICAL PROCESSES
- C12Q2535/00—Reactions characterised by the assay type for determining the identity of a nucleotide base or a sequence of oligonucleotides
- C12Q2535/122—Massive parallel sequencing
- C—CHEMISTRY; METALLURGY
- C12—BIOCHEMISTRY; BEER; SPIRITS; WINE; VINEGAR; MICROBIOLOGY; ENZYMOLOGY; MUTATION OR GENETIC ENGINEERING
- C12Q—MEASURING OR TESTING PROCESSES INVOLVING ENZYMES, NUCLEIC ACIDS OR MICROORGANISMS; COMPOSITIONS OR TEST PAPERS THEREFOR; PROCESSES OF PREPARING SUCH COMPOSITIONS; CONDITION-RESPONSIVE CONTROL IN MICROBIOLOGICAL OR ENZYMOLOGICAL PROCESSES
- C12Q2537/00—Reactions characterised by the reaction format or use of a specific feature
- C12Q2537/10—Reactions characterised by the reaction format or use of a specific feature the purpose or use of
- C12Q2537/165—Mathematical modelling, e.g. logarithm, ratio
- C—CHEMISTRY; METALLURGY
- C12—BIOCHEMISTRY; BEER; SPIRITS; WINE; VINEGAR; MICROBIOLOGY; ENZYMOLOGY; MUTATION OR GENETIC ENGINEERING
- C12Q—MEASURING OR TESTING PROCESSES INVOLVING ENZYMES, NUCLEIC ACIDS OR MICROORGANISMS; COMPOSITIONS OR TEST PAPERS THEREFOR; PROCESSES OF PREPARING SUCH COMPOSITIONS; CONDITION-RESPONSIVE CONTROL IN MICROBIOLOGICAL OR ENZYMOLOGICAL PROCESSES
- C12Q2545/00—Reactions characterised by their quantitative nature
- C12Q2545/10—Reactions characterised by their quantitative nature the purpose being quantitative analysis
- C12Q2545/114—Reactions characterised by their quantitative nature the purpose being quantitative analysis involving a quantitation step
- C—CHEMISTRY; METALLURGY
- C12—BIOCHEMISTRY; BEER; SPIRITS; WINE; VINEGAR; MICROBIOLOGY; ENZYMOLOGY; MUTATION OR GENETIC ENGINEERING
- C12Q—MEASURING OR TESTING PROCESSES INVOLVING ENZYMES, NUCLEIC ACIDS OR MICROORGANISMS; COMPOSITIONS OR TEST PAPERS THEREFOR; PROCESSES OF PREPARING SUCH COMPOSITIONS; CONDITION-RESPONSIVE CONTROL IN MICROBIOLOGICAL OR ENZYMOLOGICAL PROCESSES
- C12Q2600/00—Oligonucleotides characterized by their use
- C12Q2600/156—Polymorphic or mutational markers
- C—CHEMISTRY; METALLURGY
- C12—BIOCHEMISTRY; BEER; SPIRITS; WINE; VINEGAR; MICROBIOLOGY; ENZYMOLOGY; MUTATION OR GENETIC ENGINEERING
- C12Q—MEASURING OR TESTING PROCESSES INVOLVING ENZYMES, NUCLEIC ACIDS OR MICROORGANISMS; COMPOSITIONS OR TEST PAPERS THEREFOR; PROCESSES OF PREPARING SUCH COMPOSITIONS; CONDITION-RESPONSIVE CONTROL IN MICROBIOLOGICAL OR ENZYMOLOGICAL PROCESSES
- C12Q2600/00—Oligonucleotides characterized by their use
- C12Q2600/172—Haplotypes
Landscapes
- Life Sciences & Earth Sciences (AREA)
- Chemical & Material Sciences (AREA)
- Health & Medical Sciences (AREA)
- Engineering & Computer Science (AREA)
- Physics & Mathematics (AREA)
- Proteomics, Peptides & Aminoacids (AREA)
- Bioinformatics & Cheminformatics (AREA)
- Analytical Chemistry (AREA)
- Organic Chemistry (AREA)
- General Health & Medical Sciences (AREA)
- Biotechnology (AREA)
- Biophysics (AREA)
- Genetics & Genomics (AREA)
- Molecular Biology (AREA)
- Zoology (AREA)
- Wood Science & Technology (AREA)
- Bioinformatics & Computational Biology (AREA)
- Theoretical Computer Science (AREA)
- Spectroscopy & Molecular Physics (AREA)
- Medical Informatics (AREA)
- Evolutionary Biology (AREA)
- Immunology (AREA)
- General Engineering & Computer Science (AREA)
- Microbiology (AREA)
- Biochemistry (AREA)
- Pathology (AREA)
- Hospice & Palliative Care (AREA)
- Oncology (AREA)
- Measuring Or Testing Involving Enzymes Or Micro-Organisms (AREA)
- Investigating Or Analysing Biological Materials (AREA)
- Chemical Kinetics & Catalysis (AREA)
- Algebra (AREA)
- General Physics & Mathematics (AREA)
- Mathematical Analysis (AREA)
- Mathematical Optimization (AREA)
- Mathematical Physics (AREA)
- Pure & Applied Mathematics (AREA)
- Apparatus Associated With Microorganisms And Enzymes (AREA)
- Polysaccharides And Polysaccharide Derivatives (AREA)
Abstract
Description
Translated fromChinese本發明係關於測定個體之癌症等級之方法、系統及裝置。The present invention relates to methods, systems and devices for determining the grade of cancer in an individual.
癌症係影響許多人之常見疾病。經常直到表現嚴重症狀時才鑑別出癌症。對於常見癌症類型而言,存在鑑別可能患有癌症之患者之篩選技術。但此等技術經常不可靠或使患者經受輻射。對於許多其他癌症類型而言,尚無有效篩選技術。Cancer is a common disease that affects many people. Cancer is often not identified until severe symptoms develop. For common cancer types, screening techniques exist to identify patients who may have cancer. But such techniques are often unreliable or subject patients to radiation. For many other cancer types, there are no effective screening techniques.
已在罹患肺癌及頭頸癌患者之循環DNA中之特定基因座檢測出異型接合性喪失(LOH)(Chen XQ等人,Nat Med 1996;2:1033-5;Nawroz H等人Nat Med 1996;2:1035-7)。然而,可藉助檢查特定基因座檢測之LOH相對少量已阻礙此等技術。甚至在使用數位PCR時,該等方法仍會遭遇到不能檢測少量LOH。此外,此等技術仍受限於對已知出現於具體癌症類型中之特定基因座之研究。因此,通常尚不可能或有效地對癌症進行篩選。Loss of heterozygosity (LOH) has been detected at specific loci in circulating DNA of patients with lung and head and neck cancers (Chen XQ et al., Nat Med 1996; 2:1033-5; Nawroz H et al. Nat Med 1996; 2 : 1035-7). However, the relatively small number of LOHs that can be detected by examining specific loci has hampered these techniques. Even when using digital PCR, these methods suffer from inability to detect small amounts of LOH. Furthermore, these techniques are still limited to the study of specific loci known to be present in specific cancer types. Therefore, screening for cancer is often not yet possible or effective.
除對癌症之存在進行篩選外,現有技術亦缺乏提供對癌症患者之預後及監測治療效應(例如手術或化學療法或免疫療法或靶向療法後之恢復)。此等技術經常花費多(例如成像技術)、不精確、效率低、不靈敏或可能使患者經受用於成像技術之輻射。In addition to screening for the presence of cancer, prior art also lacks prognostication of cancer patients and monitoring of treatment effects (eg recovery after surgery or chemotherapy or immunotherapy or targeted therapy). These techniques are often expensive (eg, imaging techniques), inaccurate, inefficient, insensitive, or may subject the patient to the radiation used for the imaging techniques.
因此,人們期望提供針對癌症篩選、預測及監測患者之新穎技術。Accordingly, it is desirable to provide novel techniques for screening, predicting and monitoring patients with cancer.
實施例提供確定與癌症有關之基因變異之系統、裝置及方法。分析包括無細胞DNA片段之生物學試樣以鑑別腫瘤中之染色體區域中因(例如)缺失及/或擴增所致之不均衡。使用具有多個基因座之染色體區域可達成較大效率及/或精度。然後可使用此等不均衡來針對癌症診斷或篩選患者以及預測癌症患者。可使用不均衡之嚴重程度以及展現不均衡之區域之數目。另外,可隨時間測試患者以追蹤一或多個染色體區域中之每一者之嚴重程度及染色體區域之數目以使得能夠篩選及預測以及監測進展(例如在治療後)。The embodiments provide systems, devices, and methods for determining genetic variations associated with cancer. Biological samples comprising cell-free DNA fragments are analyzed to identify imbalances in chromosomal regions in tumors due to, for example, deletions and/or amplifications. Greater efficiency and/or precision can be achieved using chromosomal regions with multiple loci. These imbalances can then be used to diagnose or screen patients for cancer and to predict cancer patients. The severity of the imbalance and the number of regions exhibiting the imbalance can be used. In addition, patients can be tested over time to track the severity of each of the one or more chromosomal regions and the number of chromosomal regions to enable screening and prediction and monitoring of progression (eg, after treatment).
根據一個實施例中,提供分析有機體之生物學試樣之與癌症有關之染色體缺失或擴增的方法。生物學試樣包括源自正常細胞及可能源自與癌症有關之細胞之核酸分子。至少一些核酸分子在試樣中係無細胞的。確定有機體之正常細胞於第一染色體區域之第一及第二單倍型。第一染色體區域包括第一複數個異型接合基因座。試樣中複數個核酸分子中每一者在所鑑別有機體之參照基因組中具有位置且具有所確定各別對偶基因。使用位置及所確定對偶基因自第一單倍型確定第一組核酸分子且自第二單倍型確定第二組核酸分子。電腦系統計算第一組之第一值及第二組之第二值。每一值界定各別組核酸分子之性質(例如該組中分子之平均大小或數目)。比較第一值與第二值以確定第一染色體區域在與癌症有關之任何細胞中是否展現缺失或擴增之分類。According to one embodiment, a method of analyzing a biological sample of an organism for cancer-associated chromosomal deletion or amplification is provided. Biological samples include nucleic acid molecules derived from normal cells and possibly from cells associated with cancer. At least some of the nucleic acid molecules are cell-free in the sample. Determining the first and second haplotypes of normal cells of the organism at the first chromosomal region. The first chromosomal region includes a first plurality of heterozygous loci. Each of the plurality of nucleic acid molecules in the sample has a position in the reference genome of the identified organism and has a respective allele identified. A first set of nucleic acid molecules is determined from the first haplotype and a second set of nucleic acid molecules is determined from the second haplotype using the positions and the determined alleles. The computer system calculates the first value of the first set and the second value of the second set. Each value defines a property of a respective set of nucleic acid molecules (eg, the average size or number of molecules in the set). The first value is compared to the second value to determine whether the first chromosomal region exhibits a classification of deletion or amplification in any cell associated with cancer.
根據另一實施例,提供分析有機體之生物學試樣之方法。生物學試樣包括源自正常細胞及可能源自與癌症有關之細胞之核酸分子。至少一些核酸分子在試樣中係無細胞的。鑑別有機體之複數個非重疊染色體區域。每一染色體區域包括複數個基因座。試樣中複數個核酸分子中每一者在所鑑別有機體之參照基因組中具有位置。對於每一染色體區域而言,基於所鑑別位置將各別組核酸分子鑑別為來自染色體區域。每一各別組包括至少一個位於染色體區域之複數個基因座中每一者處之核酸分子。電腦系統計算各別組之各別值,其中各別值界定各別組核酸分子之性質。比較各別值與參照值以確定染色體區域是否展現缺失或擴增之分類。然後確定分類為展現缺失或擴增之染色體區域之量。According to another embodiment, a method of analyzing a biological sample of an organism is provided. Biological samples include nucleic acid molecules derived from normal cells and possibly from cells associated with cancer. at least someThe nucleic acid molecules are cell-free in the sample. Identifying multiple non-overlapping chromosomal regions of an organism. Each chromosomal region includes a plurality of loci. Each of the plurality of nucleic acid molecules in the sample has a location in the reference genome of the identified organism. For each chromosomal region, a separate set of nucleic acid molecules is identified as being from the chromosomal region based on the identified positions. Each respective group includes at least one nucleic acid molecule located at each of the plurality of loci of the chromosomal region. The computer system calculates individual values for the individual sets, wherein the individual values define the properties of the individual sets of nucleic acid molecules. Individual values are compared to a reference value to determine whether a chromosomal region exhibits a classification of deletion or amplification. The amount of chromosomal regions classified as exhibiting deletions or amplifications is then determined.
根據另一實施例,提供使用包括源自正常細胞及可能源自與癌症有關之細胞之核酸分子的生物學試樣來確定有機體中染色體變異之進展的方法。核酸分子中之至少一些在生物學試樣中係無細胞的。鑑別有機體之參照基因組之一或多個非重疊染色體區域。每一染色體區域包括複數個基因座。分析於不同時間取自有機體之試樣以確定進展。對於試樣而言,試樣中複數個核酸分子中之每一者在所鑑別有機體之參照基因組中具有位置。對於每一染色體區域而言,基於所鑑別位置將各別組核酸分子鑑別為來自染色體區域。各別組包括至少一個位於染色體區域之複數個基因座中每一者處之核酸分子。電腦系統計算各別組核酸分子之各別值。各別值界定各別組核酸分子之性質。比較各別值與參照值以確定第一染色體區域是否展現缺失或擴增之分類。然後,使用於複數個時刻對每一染色體區域之分類來確定有機體中染色體變異之進展。According to another embodiment, there is provided a method for determining the progression of chromosomal aberrations in an organism using a biological sample comprising nucleic acid molecules derived from normal cells and possibly from cells associated with cancer. At least some of the nucleic acid molecules are cell-free in the biological sample. One or more non-overlapping chromosomal regions of a reference genome are identified for an organism. Each chromosomal region includes a plurality of loci. Samples taken from the organisms at different times were analyzed to determine progression. For a sample, each of the plurality of nucleic acid molecules in the sample has a location in the reference genome of the identified organism. For each chromosomal region, a separate set of nucleic acid molecules is identified as being from the chromosomal region based on the identified positions. Respective groups include at least one nucleic acid molecule located at each of the plurality of loci of the chromosomal region. The computer system calculates individual values for each group of nucleic acid molecules. The respective values define the properties of the respective sets of nucleic acid molecules. The individual values are compared to the reference value to determine whether the first chromosomal region exhibits a classification of deletion or amplification. Classification of each chromosomal region over multiple times is then used to determine the progression of chromosomal variation in an organism.
本發明之其他實施例係關於與本文所述方法有關之系統、便攜式消費型器件及電腦可讀取媒體。Other embodiments of the invention relate to systems, portable consumer devices, and computer-readable media related to the methods described herein.
可參照以下實施方式及附圖獲得對本發明之性質及優點之較佳理解。A better understanding of the nature and advantages of the present invention can be obtained with reference to the following embodiments and accompanying drawingsuntie.
2971:輸入/輸出控制器2971: Input/Output Controller
2972:系統記憶體2972: System Memory
2973:中央處理器2973: CPU
2974:列印機2974:Print
2975:系統匯流排2975: System Bus
2976:監視器2976:Monitor
2977:串聯埠2977: serial port
2978:鍵盤2978:keyboard
2979:固定磁碟2979: Fixed Disk
2981:外部介面2981:External interface
2982:顯示適配器2982:Display Adapter
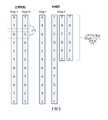
圖1繪示癌細胞中展現缺失變異之染色體區域。Figure 1 depicts chromosomal regions exhibiting deletion mutations in cancer cells.
圖2繪示癌細胞中展現擴增變異之染色體區域。Figure 2 depicts chromosomal regions exhibiting amplified variation in cancer cells.
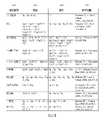
圖3顯示表300,其繪示不同類型之癌症及有關區域及其對應變異。Figure 3 shows a table 300 depicting different types of cancer and associated regions and their corresponding variations.
圖4繪示根據本發明之實施例,癌細胞內不展現變異之染色體區域以及在血漿中進行之量測。FIG. 4 depicts chromosomal regions in cancer cells that do not exhibit mutations and measurements performed in plasma according to an embodiment of the present invention.
圖5繪示根據本發明之實施例,癌細胞內染色體區域510之缺失以及在血漿中進行之確定缺失區域之量測。FIG. 5 depicts the deletion of a
圖6繪示根據本發明之實施例,癌細胞內染色體區域610之擴增以及在血漿中進行之確定擴增區域之量測。FIG. 6 shows the amplification of a
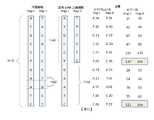
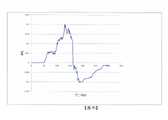
圖7顯示根據本發明之實施例,在肝細胞癌(HCC)患者之血漿DNA中對腫瘤組織中位於染色體1p處且顯示單對偶基因擴增之區段的RHDO分析。FIG. 7 shows the RHDO analysis of a segment located at chromosome 1p in tumor tissue and showing single allele amplification in plasma DNA of a hepatocellular carcinoma (HCC) patient according to an embodiment of the present invention.
圖8顯示根據本發明之實施例,在存在含有缺失之腫瘤時染色體區域之兩種單倍型之片段的大小分佈變化。Figure 8 shows the change in size distribution of fragments of two haplotypes of chromosomal regions in the presence of tumors containing deletions according to an embodiment of the present invention.
圖9顯示根據本發明之實施例,在存在含有擴增之腫瘤時染色體區域之兩種單倍型之片段的大小分佈變化。Figure 9 shows the change in size distribution of fragments of two haplotypes of chromosomal regions in the presence of tumors containing amplifications according to an embodiment of the present invention.
圖10係繪示根據本發明之實施例,分析有機體之生物學試樣之單倍型,以確定染色體區域是否展現缺失或擴增之方法的流程圖。10 is a flowchart illustrating a method for analyzing haplotypes of biological samples of an organism to determine whether a chromosomal region exhibits deletion or amplification according to an embodiment of the present invention.
圖11顯示根據本發明之實施例,癌細胞中缺失亞區1130之區域1110以及在血漿中進行之確定缺失區域之量測。Figure 11 shows the
圖12顯示根據本發明之實施例,可如何使用RHDO分析定位變異之位置。Figure 12 shows how RHDO can be used to analyze the location of variants according to an embodiment of the present inventionLocation.
圖13顯示根據本發明之實施例,始於另一方向之RHDO分類。Figure 13 shows RHDO classification starting from the other direction, according to an embodiment of the present invention.
圖14係根據本發明之實施例,使用複數個染色體區域分析有機體之生物學試樣之方法1400的流程圖。14 is a flowchart of a
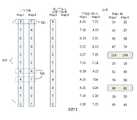
圖15顯示表1500,其繪示根據本發明之實施例,不同區段數所需之深度及腫瘤源片段之分數濃度。圖15提供對欲分析癌症源DNA在試樣中之分數濃度之不同百分比之分子數目的估計。Figure 15 shows a table 1500 depicting the required depth and fractional concentration of tumor-derived fragments for different numbers of segments, according to an embodiment of the present invention. Figure 15 provides an estimate of the number of molecules to be analyzed for different percentages of the fractional concentration of cancer-derived DNA in a sample.
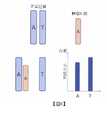
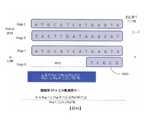
圖16顯示根據本發明之實施例,藉由相對單倍型劑量(RHDO)分析量測腫瘤源DNA在血漿中之分數濃度之原理。Hap I及Hap II代表根據本發明之實施例非腫瘤組織中之兩種單倍型。FIG. 16 shows the principle of measuring the fractional concentration of tumor-derived DNA in plasma by relative haplotype dose (RHDO) analysis according to an embodiment of the present invention. Hap I and Hap II represent two haplotypes in non-tumor tissues according to embodiments of the present invention.
圖17係繪示根據本發明之實施例,使用包括核酸分子之生物學試樣確定有機體中染色體變異之進展之方法的流程圖。17 is a flowchart illustrating a method for determining the progression of chromosomal variation in an organism using a biological sample including nucleic acid molecules according to an embodiment of the present invention.
圖18A顯示對癌症患者之染色體4之q臂上之區段實施RHDO分析的SPRT曲線。各點代表在各別異型接合基因座後之累積計數比率。圖18B顯示對治療後患者之染色體4之q臂上之區段實施RHDO分析的SPRT曲線。Figure 18A shows the SPRT curves of RHDO analysis performed on the segment on the q arm of
圖19顯示HCC中發現之常見染色體變異。Figure 19 shows common chromosomal variations found in HCC.
圖20A顯示使用靶向分析獲得之HCC患者與健康患者之正規化標籤計數比率之結果。圖20B顯示在靶富集及大規模平行測序後,3名HCC患者及4名健康對照個體之大小分析之結果。Figure 20A shows the results of normalized signature count ratios for HCC patients versus healthy patients using targeted analysis. Figure 20B shows the results of size analysis of 3 HCC patients and 4 healthy control individuals after target enrichment and massively parallel sequencing.
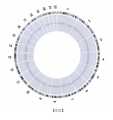
圖21顯示HCC患者之Circos圖,其繪示根據本發明之實施例,來自血漿DNA之經測序標籤計數之數據。Figure 21 shows a Circos plot of HCC patients depicting data of sequenced tag counts from plasma DNA according to an embodiment of the present invention.
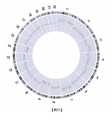
圖22顯示根據本發明之實施例,對無HCC之慢性肝炎B病毒(HBV)攜帶者之血漿試樣之經測序標籤計數分析。Figure 22 shows that according to the embodiment of the present invention, the chronic hepatitis B virus (HBV) carrier without HCCSequenced tag count analysis of plasma samples from carriers.
圖23顯示根據本發明之實施例,對患有階段3鼻咽癌(NPC)之患者之血漿試樣的經測序標籤計數分析。Figure 23 shows the analysis of sequenced tag counts on plasma samples of patients with
圖24顯示根據本發明之實施例,對患有階段4 NPC之患者之血漿試樣的經測序標籤計數分析。Figure 24 shows the analysis of sequenced tag counts on plasma samples of patients with
圖25顯示根據本發明之實施例,血漿DNA之累積頻率對腫瘤組織中展現異型接合性喪失(LOH)之區域之大小之曲線。Figure 25 shows a plot of the accumulation frequency of plasma DNA versus the size of the region exhibiting loss of heterozygosity (LOH) in tumor tissue according to an embodiment of the present invention.
圖26顯示對於LOH區域,△Q對經測序血漿DNA之大小。根據本發明之實施例,在130bp之大小下,△Q達到0.2。Figure 26 shows ΔQ versus the size of sequenced plasma DNA for the LOH region. According to the embodiment of the present invention, at a size of 130 bp, ΔQ reaches 0.2.
圖27顯示根據本發明之實施例,血漿DNA之累積頻率對腫瘤組織中具有染色體倍增之區域之大小之曲線。Figure 27 shows a plot of the accumulation frequency of plasma DNA versus the size of regions with chromosome doubling in tumor tissues according to an embodiment of the present invention.
圖28顯示根據本發明之實施例,對於擴增區域,△Q對經測序血漿DNA之大小。Figure 28 shows ΔQ versus the size of sequenced plasma DNA for the amplified region according to an embodiment of the present invention.
圖29顯示可與本發明之實施例之系統及方法一起使用之實例性電腦系統900之方塊圖。FIG. 29 shows a block diagram of an exemplary computer system 900 that may be used with the systems and methods of embodiments of the present invention.
本申請案主張優先於2010年11月30日申請之標題為「DETECTION OF GENETIC ABERRATIONS ASSOCIATED WITH CANCER」之美國臨時申請案第61/418,391號及2011年8月31日申請之標題為「DETECTION OF GENETIC OR MOLECULAR ABERRATIONS ASSOCIATED WITH CANCER」之美國臨時申請案第61/529,877號,且本申請案係該等臨時申請案之非臨時申請案,該等案件之全部內容出於所有目的以引用方式併入本文中。This application claims priority over U.S. Provisional Application No. 61/418,391, filed November 30, 2010, entitled "DETECTION OF GENETIC ABERRATIONS ASSOCIATED WITH CANCER," and the August 31, 2011 application, entitled "DETECTION OF GENETIC OR MOLECULAR ABERRATIONS ASSOCIATED WITH CANCER, U.S. Provisional Application No. 61/529,877, and this application is a non-provisional application of such provisional applications, the entire contents of which are incorporated herein by reference for all purposes middle.
本申請案係關於共同擁有之頒予Lo等人之標題為「Size-Based Genomic Analysis」之美國專利申請案第12/940,992號(美國公開案2011/0276277)(代理人案號80015-794101/006610US,2010年11月5日申請)及頒予Lo等人之標題為「Fetal Genomic Analysis From A Maternal Biological Sample」之美國專利公開案第12/940,993號(美國公開案2011/0105353)(代理人案號80015-794103/006710US,2010年11月5日申請),該等案件之揭示內容之全文以引用方式併入本文中。This application is related to commonly owned U.S. Patent Application No. 12/940,992 to Lo et al., entitled "Size-Based Genomic Analysis" (U.S. Publication 2011/0276277) (Attorney Docket No. 80015-794101/ 006610US, filed November 5, 2010) and US Patent Publication No. 12/940,993 (US Publication 2011/0105353) entitled "Fetal Genomic Analysis From A Maternal Biological Sample" to Lo et al. (Attorney Case No. 80015-794103/006710US, filed November 5, 2010), the entire disclosures of these cases are incorporated herein by reference.
本文所用術語「生物學試樣」係指取自個體(例如,人類,患有癌症者、疑似患有癌症者,或其他有機體)且含有一或多個所關注核酸分子之任何試樣。The term "biological sample " as used herein refers to any sample taken from an individual (eg, a human, a person with cancer, a person suspected of having cancer, or other organism) that contains one or more nucleic acid molecules of interest.
術語「核酸」或「多核苷酸」係指去氧核糖核酸(DNA)或核糖核酸(RNA)及其呈單鏈或雙鏈形式之聚合物。除非明確限制,否則該術語涵蓋含有天然核苷酸之已知類似物的核酸,該等類似物與參照核酸具有類似結合特性且以類似於天然核苷酸之方式代謝。除非另有說明,否則特定核酸序列亦隱含地涵蓋其保守修飾變體(例如,簡並密碼子取代)、對偶基因、直向同源物、單核苷酸多態性(SNP)、拷貝數變體及互補序列以及明確指出之序列。具體而言,可藉由產生一或多個所選(或全部)密碼子之第三位經混合鹼基及/或去氧次黃嘌呤核苷殘基取代的序列達成簡並密碼子取代(Batzer等人,Nucleic Acid Res.19:5081(1991);Ohtsuka等人,J.Biol.Chem.260:2605-2608(1985);及Rossolini等人,Mol.Cell.Probes 8:91-98(1994))。術語核酸涵蓋(但不限於):基因、cDNA、mRNA、非編碼小RNA、微型RNA(miRNA)、Piwi-相互作用RNA及由基因或基因座編碼之短髮夾RNA(shRNA)。The term "nucleic acid " or "polynucleotide " refers to deoxyribonucleic acid (DNA) or ribonucleic acid (RNA) and polymers thereof in single- or double-stranded form. Unless expressly limited, the term encompasses nucleic acids that contain known analogs of natural nucleotides that have similar binding properties to a reference nucleic acid and are metabolized in a manner similar to natural nucleotides. Unless otherwise stated, a particular nucleic acid sequence also implicitly encompasses conservatively modified variants (e.g., degenerate codon substitutions), alleles, orthologs, single nucleotide polymorphisms (SNPs), copies thereof, Numerous variants and complementary sequences as well as sequences explicitly indicated. In particular, degenerate codon substitutions can be achieved by generating sequences in which one or more selected (or all) codons are substituted at the third position with mixed bases and/or deoxyinosine residues (Batzer et al.,Nucleic Acid Res. 19:5081 (1991); Ohtsuka et al.,J. Biol. Chem. 260:2605-2608 (1985); and Rossolini et al.,Mol. Cell. Probes 8:91-98 (1994 )). The term nucleic acid encompasses, but is not limited to: genes, cDNA, mRNA, small noncoding RNAs, microRNAs (miRNAs), Piwi-interacting RNAs, and short hairpin RNAs (shRNAs) encoded by genes or loci.
術語「基因」意指參與產生多肽鏈或轉錄RNA產物之DNA區段。其可包括在編碼區域之前及之後之區域(前導區域及尾隨區域)以及在個別編碼區段(外顯子)之間之間插序列(內含子)。The term "gene " means a segment of DNA involved in the production of a polypeptide chain or transcription of an RNA product. It may include regions preceding and following the coding region (leader and trailer regions) as well as intervening sequences (introns) between individual coding segments (exons).
本文所用術語「臨床相關核酸序列」或「臨床相關染色體區域」(或所測試之區域/區段)可指多核苷酸序列,其對應於較大基因組序列中正測試可能的不均衡之區段或該較大基因組序列本身。實例包括經缺失或擴增(包括簡單倍增)或可能經缺失或擴增之基因組區段、或包括該區段之亞區之較大區域。在一些實施例中,可使用多個臨床相關核酸序列或臨床相關核酸序列之多個等效標記物來提供檢測區域中不均衡之數據。舉例而言,來自染色體上5個非連續序列之數據可以相加方式用來確定可能的不均衡,從而將所需試樣容積有效地減至1/5。The term "clinically relevant nucleic acid sequence " or "clinically relevant chromosomal region " (or the region/segment tested) as used herein may refer to a polynucleotide sequence corresponding to a segment of a larger genomic sequence being tested for a possible imbalance or The larger genome sequence itself. Examples include a segment of the genome that is deleted or amplified (including simple doublings), or possibly deleted or amplified, or a larger region that includes a subregion of the segment. In some embodiments, multiple clinically relevant nucleic acid sequences or multiple equivalent markers of clinically relevant nucleic acid sequences can be used to provide data on disequilibrium in the detection region. For example, data from 5 non-contiguous sequences on a chromosome can be used additively to identify possible imbalances, effectively reducing the required sample volume by 1/5.
本文所用術語「參照核酸序列」或「參照染色體區域」係指定量特徵或大小分佈用於與測試區域進行比較之核酸序列。參照核酸序列之實例包括不包括缺失或擴增之染色體區域、整個基因組(例如經由總經測序標籤計數正規化)、來自一或多個已知正常之試樣之區域(其可為所測試試樣之相同區域)或特定單倍型之染色體區域。此等參照核酸序列可以內源性方式存在於試樣中,或在試樣處理或分析期間以外源性方式添加。在一些實施例中,參照染色體區域顯示代表無病健康狀態之大小特徵。在再一實施例中,參照染色體區域顯示代表無病健康狀態之定量特徵。As used herein, the term "reference nucleic acid sequence " or "reference chromosomal region " refers to a nucleic acid sequence that specifies a quantitative characteristic or size distribution for comparison with a test region. Examples of reference nucleic acid sequences include chromosomal regions excluding deletions or amplifications, entire genomes (eg, normalized by total sequenced tag counts), regions from one or more samples known to be normal (which can be the same region of the same haplotype) or a chromosomal region of a specific haplotype. Such reference nucleic acid sequences may be present in the sample endogenously, or added exogenously during sample processing or analysis. In some embodiments, the reference chromosomal region exhibits a size characteristic representative of a disease-free healthy state. In yet another embodiment, the reference chromosomal region exhibits a quantitative characteristic representative of disease-free health status.
本文所用術語「基於」意指「至少部分地基於」且係指一個用於確定另一值(或結果)之值,例如在方法之輸入與該方法之輸出之關係中出現。本文所用術語「導出」亦係指方法之輸入與該方法之輸出之關係,例如在導出係計算公式時出現。The term "based on " as used herein means "basedat least in part on " and refers to a value that is used to determine another value (or result), eg, occurs in a relationship between an input to a method and an output from that method. The term "derived" as used herein also refers to a relationship between an input to a method and an output from that method, such as occurs when the derived is a computational formula.
本文所用術語「參數」意指表徵定量數據集及/或定量數據集間之數值關係之數值。舉例而言,第一核酸序列之第一量與第二核酸序列之第二量間之比率(或比率之函數)係一參數。The term "parameter " as used herein means a numerical value characterizing a quantitative data set and/or a numerical relationship between quantitative data sets. For example, the ratio (or function of the ratio) between the first amount of the first nucleic acid sequence and the second amount of the second nucleic acid sequence is a parameter.
本文所用術語「基因座(locus)」或其複數形式「基因座(loci)」係可在基因組間具有差異之任一長度之核苷酸(或鹼基對)之位置或地址。The term "locus " or its plural form "loci " as used hereinis a position or address of any length of nucleotides (or basepairs ) that may vary among genomes.
本文所用術語「序列不均衡」或「變異」意指臨床相關染色體區域之量與參照量間如藉由至少一個截止值界定之任一顯著偏差。序列不均衡可包括染色體劑量不均衡、對偶基因不均衡、突變劑量不均衡、拷貝數不均衡、單倍型劑量不均衡及其他類似不均衡。作為一實例,對偶基因不均衡可出現於腫瘤在其基因組內缺失基因之一個對偶基因或擴增基因之一個對偶基因或差式擴增兩個對偶基因,由此在試樣中特定基因座處產生不均衡時。作為另一實例,患者可在腫瘤抑制基因內具有遺傳突變。然後患者可繼續發生腫瘤,其中缺失腫瘤抑制基因之非突變對偶基因。因此,腫瘤內存在突變劑量不均衡。當腫瘤將其DNA釋放至患者血漿中時,腫瘤DNA將在血漿中與患者之組成型DNA(來自正常細胞)混合。藉助使用本文所述方法,可在血漿中檢測出此DNA混合物之突變劑量不均衡。The term "sequence disequilibrium " or "variation " as used herein means any significant deviation between the amount of a clinically relevant chromosomal region and a reference amount, as defined by at least one cutoff value. Sequence imbalances can include chromosome dosage imbalances, allele imbalances, mutation dosage imbalances, copy number imbalances, haplotype dosage imbalances, and other similar imbalances. As an example, allele disequilibrium can arise when a tumor deletes one allele of a gene within its genome, or one allele of an amplified gene, or differentially amplifies two alleles of a gene, thereby disproportionately present at a particular locus in the sample. When an imbalance occurs. As another example, a patient may have an inherited mutation in a tumor suppressor gene. Patients can then go on to develop tumors in which the non-mutated allele of the tumor suppressor gene is deleted. Thus, there is an imbalance in mutation dosage within the tumor. When a tumor releases its DNA into the patient's plasma, the tumor DNA will mix with the patient's constitutive DNA (from normal cells) in the plasma. By using the methods described herein, this DNA mixture can be detected in blood plasma for mutation dose imbalance.
本文所用術語「單倍型」係指在相同染色體或染色體區域上共同傳遞之多個基因座上之對偶基因的組合。單倍型可指少至一對基因座或指染色體區域或指整個染色體。術語「對偶基因」係指相同物理基因組基因座上可產生或可不產生不同表型性狀之替代性DNA序列。在各染色體具有兩個拷貝(雄性人類個體中性染色體除外)之任一特定二倍體有機體中,各基因之基因型皆包含存在於該基因座上在同型合子中相同且在異型合子中不同之對偶基因對。在不同個體間,一組或一種有機體通常在各基因座上包括複對偶基因。將在群中發現一個以上對偶基因之基因組基因座稱為多態位點。基因座上之對偶基因差異可以群中存在之對偶基因數目(即,多態性程度)或異型合子之比例(即,異型接合性比率)來量測。本文所用術語「多態性」係指人類基因組內與其頻率無關之任一個體間差異。此等差異之實例包括(但不限於)單核苷酸多態性、簡單串聯重複多態性、插入-缺失多態性、突變(其可為致病性)及拷貝數差異。The term "haplotype " as used herein refers to the combination of alleles at multiple loci that are co-inherited on the same chromosome or chromosomal region. A haplotype can refer to as few as a pair of loci or to a region of a chromosome or to an entire chromosome. The term "allele" refers to an alternative DNA sequence at the same physical genomic locus that may or may not produce a different phenotypic trait. In any given diploid organism having two copies of each chromosome (except the sex chromosomes in male human individuals), the genotype of each gene comprising the loci present is the same in homozygotes and differs in heterozygotes allele pair. A group or an organism usually includes multiple alleles at each locus among different individuals. A genomic locus where more than one allele is found in a population is called a polymorphic site. Allele differences at a locus can be measured by the number of alleles present in a population (ie, degree of polymorphism) or the proportion of heterozygotes (ie, heterozygosity ratio). The term "polymorphism" as used herein refers to any inter-individual variation within the human genome independent of its frequency. Examples of such differences include, but are not limited to, single nucleotide polymorphisms, simple tandem repeat polymorphisms, insertion-deletion polymorphisms, mutations (which can be pathogenic), and copy number differences.
術語「經測序標籤」係指自全部或一部分核酸分子(例如,DNA片段)確定之序列。經常,僅對片段一端實施測序,例如,約30bp。然後可將經測序標籤與參照基因組比對。另一選擇為,可對片段兩端實施測序以產生兩個經測序標籤,該等標籤可提供較大比對精度且亦提供一定長度之片段。The term "sequenced tag " refers to a sequence determined from all or a portion of a nucleic acid molecule (eg, a DNA fragment). Often, only one end of a fragment is sequenced, eg, about 30 bp. The sequenced tags can then be aligned to a reference genome. Alternatively, both ends of the fragments can be sequenced to generate two sequenced tags that provide greater alignment accuracy and also provide fragments of a certain length.
術語「通用測序」係指將銜接體添加至片段末端,且將測序用引物附接至銜接體之測序。因此,可利用相同引物對任何片段測序,且因此該測序可係隨機的。The term "universal sequencing " refers to sequencing in which adapters are added to the ends of fragments, and sequencing primers are attached to the adapters. Thus, any fragment can be sequenced using the same primers, and thus the sequencing can be random.
術語「大小分佈」係指代表對應於特定組(例如特定單倍型或特定染色體區域之片段)之分子之長度、質量、重量或其他大小量度的任一值或值集。各實施例可使用多種大小分佈。在一些實施例中,大小分佈係指一個染色體之片段相對於其他染色體之片段之大小的分級(例如,平均值(average)、中值(median)或均值(mean))。在其他實施例中,大小分佈可指染色體片段之實際大小的統計值。在一實作中,統計值可包括染色體片段之任一平均值、均值或中值大小。在另一實作中,統計值可包括低於截止值之片段之總長度(可將其除以全部片段之總長度)或至少低於較大截止值之片段之總長度。The term "size distribution " refers to any value or set of values representing the length, mass, weight, or other measure of size of molecules corresponding to a particular group, such as a particular haplotype or a fragment of a particular chromosomal region. Embodiments may use a variety of size distributions. In some embodiments, size distribution refers to a grading (eg, average, median, or mean) of the size of segments of one chromosome relative to segments of other chromosomes. In other embodiments, the size distribution may refer to a statistical value of the actual size of the chromosome segment. In one implementation, the statistical value may include any average, mean or median size of the chromosome segment. In another implementation, the statistics can include the total length of fragments below a cutoff value (which can be divided by the total length of all fragments) or at least the total length of fragments below a larger cutoff value.
本文所用術語「分類」係指與試樣之特定性質有關之任何數值或其他符號。舉例而言,「+」符號(或詞語「正」)可表示將試樣分類為具有缺失或擴增。分類可為二元(例如,正或負)或具有較多分類級別(例如,1至10或0至1之量表)。術語「截止值」及「閾值」係指操作中所用之預定數值。舉例而言,截止大小可指在高於時排除片段之大小。閾值可為在高於或低於時特定分類適用之值。任一該等術語中皆可用於任一該等情形下。As used herein, the term "classification " refers to any numerical value or other notation associated with a particular property of a sample. For example, a "+" sign (or the word "positive") can indicate classification of a sample as having a deletion or an amplification. Classification can be binary (eg, positive or negative) or have more categorical levels (eg, a scale of 1 to 10 or 0 to 1). The terms "cutoff " and "threshold " refer to predetermined values used in the procedure. For example, a cutoff size can refer to a size above which fragments are excluded. A threshold may be a value above or below which a particular classification applies. Any of these terms can be used in any of these situations.
術語「癌症等級」可指是否存在癌症、癌症之階段、腫瘤大小、所涉及染色體區域缺失或擴增之數目(例如倍增或增至三倍)及/或癌症嚴重程度之其他量度。癌症等級可為數值或其他符號。該等級可為0。癌症等級亦包括與缺失或擴增有關之癌變前或癌前病況。The term "cancer grade " can refer to the presence or absence of cancer, the stage of the cancer, the size of the tumor, the number of deletions or amplifications (eg, doubling or tripling) of the chromosomal regions involved, and/or other measures of the severity of the cancer. Cancer grades can be numeric or other symbols. This level can be 0. Cancer grade also includes precancerous or precancerous conditions associated with deletions or amplifications.
癌性組織(腫瘤)可具有染色體區域之變異,例如缺失或擴增。腫瘤可將DNA片段釋放至機體中之流體中。實施例可藉由分析DNA片段以鑑別染色體區域中DNA相對於正常(預期)值之變異來鑑別腫瘤。Cancerous tissue (tumor) can have a variation of a chromosomal region, such as a deletion or amplification. Tumors can release fragments of DNA into fluids in the body. Embodiments can identify tumors by analyzing DNA fragments to identify variations in DNA in chromosomal regions from normal (expected) values.
缺失或擴增之確切大小以及位置可有所有不同。有時可能已知特定區域一般在癌症中或在特定類型之癌症中顯示變異(由此可診斷特定癌症)。當特定區域未知時,可採用分析整個基因組或該基因組之大部分之系統方法來檢測變異區域,該等變異區域可分散遍佈基因組且其大小(例如缺失或擴增之鹼基數目)有所不同。可隨時間追蹤染色體區域以鑑別變異之嚴重程度或顯示變異之區域數目之變化。此追蹤可為篩選、預測及監測腫瘤(例如在治療後或用於檢測復發或腫瘤進展)提供重要資訊。The exact size and location of the deletion or amplification can vary. It may sometimes be known that a particular region exhibits variation in cancer generally or in particular types of cancer (and thus a particular cancer can be diagnosed). When specific regions are not known, systematic approaches that analyze the entire genome or large portions of the genome can be used to detect regions of variation that can be scattered throughout the genome and vary in size (such as the number of bases deleted or amplified) . Chromosomal regions can be tracked over time to identify the severity of the variation or changes in the number of regions exhibiting the variation. This tracking can provide important information for screening, prediction and monitoring of tumors, eg after treatment or for detecting recurrence or tumor progression.
此說明首先始於癌症中染色體變異之實例。然後,討論藉由檢測及分析生物學試樣中之無細胞DNA來檢測染色體變異之方式之實例。在建立檢測一個染色體區域中之變異之方法後,闡述以系統方式使用檢測多個染色體區域中之變異之方法來篩選(診斷)並預測患者。此說明亦闡述隨時間追蹤自對一或多個區域中染色體變異之測試獲得之數值指標以提供篩選、預測及監測患者的方法。然後討論實例。This illustration begins with the example of chromosomal variation in cancer. Then, discuss by detecting andAn example of a method of analyzing cell-free DNA in a biological sample to detect chromosomal variations. After establishing a method for detecting variation in one chromosomal region, the systematic use of the method for detecting variation in multiple chromosomal regions to screen (diagnose) and predict patients is described. This description also sets forth methods for tracking numerical indicators obtained from testing for chromosomal variation in one or more regions over time to provide screening, prediction, and monitoring of patients. Then discuss examples.
通常在癌細胞中檢測到染色體變異。此外,可在所選類型之癌症中發現染色體變異之特徵性模式。舉例而言,通常在肝細胞癌(HCC)中檢測到染色體臂1p、1q、7q、15q、16p、17q及20q中DNA之增加以及3p、4q、9p及11q上DNA之喪失。先前研究已證實亦可在癌症患者之循環DNA中檢測到此等基因變異。舉例而言,已在罹患肺癌及頭頸癌患者之循環DNA分子中之特定基因座檢測到異型接合性喪失(LOH)(Chen XQ等人,Nat Med 1996;2:1033-5;Nawroz H等人,Nat Med 1996;2:1035-7)。血漿或血清中檢測到之基因改變與彼等發現於腫瘤組織中者相同。然而,由於腫瘤源DNA僅佔總循環無細胞DNA之一小部分,因此藉由腫瘤細胞之LOH引起之對偶基因不均衡通常較小。許多研究人員已研發數位聚合酶鏈反應(PCR)技術(Vogelstein B,Kinzler KW.Proc Natl Acad Sci U S A.1999;96:9236-41;Zhou W等人,Nat Biotechnol 2001;19:78-81;Zhou W等人,Lancet.2002;359:219-25)來精確量化循環DNA分子中基因座之不同對偶基因(Chang HW等人,J Natl Cancer Inst.2002;94:1697-703)。數位PCR在檢測藉由腫瘤DNA中特定基因座之LOH引起之小對偶基因不均衡方面比即時PCR或其他DNA量化方法更為靈敏。然而,數位PCR可能仍難以鑑別特定基因座之極小對偶基因不均衡,且因此本文所述實施例以共同方式分析染色體區域。Chromosomal changes are often detected in cancer cells. In addition, characteristic patterns of chromosomal variations can be found in selected types of cancer. For example, gains of DNA in chromosome arms 1p, 1q, 7q, 15q, 16p, 17q and 20q and losses of DNA on 3p, 4q, 9p and 11q are commonly detected in hepatocellular carcinoma (HCC). Previous studies have demonstrated that these gene variations can also be detected in the circulating DNA of cancer patients. For example, loss of heterozygosity (LOH) has been detected at specific loci in circulating DNA molecules of patients with lung and head and neck cancers (Chen XQ et al.,
本文所述技術亦可用於檢測癌變前或癌前病況。此等病況之實例包括肝硬化及宮頸上皮內瘤。前一病況係肝細胞癌之癌變前病況,而後一病況係宮頸癌之癌變前病況。已報導,此等癌變前病況業已具有若干可發展成為惡性腫瘤之分子改變。舉例而言,染色體臂1p、4q、13q、18q上存在LOH及同時喪失3個以上基因座與肝硬化患者發生HCC之風險增加有關(Roncalli M等人Hepatology 2000;31:846-50)。此等癌變前病變亦會將DNA釋放至循環中,但可能濃度較低。該技術可允許藉由分析血漿中之DNA片段並量測血漿中循環癌變前DNA之濃度(包括分數濃度)來檢測缺失或擴增。檢測此等變異之容易性(例如測序深度或檢測到之此等變化之數目)及濃度將預測進展成完全成熟癌性病況之可能性或速度。The techniques described herein can also be used to detect precancerous or precancerous conditions. Examples of such conditions include liver cirrhosis and cervical intraepithelial neoplasia. The former condition is a precancerous condition of hepatocellular carcinoma and the latter condition is a precancerous condition of cervical cancer. It has been reported that these premalignant conditions have several molecular alterations that can develop into malignancies. For example, the presence of LOH on
A.染色體區域之缺失A. Deletion of a chromosomal region
圖1繪示癌細胞中展現缺失變異之染色體區域。正常細胞顯示具有兩種單倍型,即Hap I及Hap II。如所顯示,Hap I與Hap II二者皆在複數個異型接合基因座110中之每一者處具有序列(亦稱作單核苷酸多態性SNP)。在與癌症有關之細胞中,Hap II缺失染色體區域120。作為實例,與癌症有關之細胞可來自腫瘤(例如,惡性腫瘤)、腫瘤之轉移灶(例如局部淋巴結中或遠端器官中)或癌前或癌變前病變,例如,如上文所提及。Figure 1 depicts chromosomal regions exhibiting deletion mutations in cancer cells. Normal cells show two haplotypes, Hap I and Hap II. As shown, both Hap I and Hap II have sequences at each of the plurality of heterozygous loci 110 (also referred to as single nucleotide polymorphisms (SNPs). Hap II deletes chromosome region 120 in cells associated with cancer. By way of example, cancer-associated cells may be from a tumor (eg, a malignant tumor), a metastasis of a tumor (eg, in a regional lymph node or in a distant organ), or a precancerous or precancerous lesion, eg, as mentioned above.
在癌細胞中缺失兩種同源單倍型中之一者之染色體區域120中,全部異型接合SNP 110皆因在對應缺失同源染色體上喪失另一對偶基因而表現為同型接合。因此,此類染色體變異稱為異型接合性喪失(LOH)。在區域120中,該等SNP之非缺失對偶基因將代表可在正常組織中發現之兩種單倍型中之一者。在圖1所示之實例中,LOH區域120上之單倍型I(Hap I)可藉由對腫瘤組織實施基因分型來確定。另一單倍型(Hap II)可藉由比較正常組織與癌症組織之表觀基因型來確定。Hap II可藉由接合全部缺失對偶基因來構築。亦即,確定正常細胞之區域120中在癌細胞之區域120中不會出現的全部對偶基因皆位於相同單倍型(即Hap I)上。藉助此分析,可對腫瘤組織中展現LOH之全部染色體區域確定患者(例如,肝細胞癌HCC患者)之單倍型。此一方法僅用於患有具有癌細胞時,且僅用於確定區域120中之單倍型,但提供對缺失染色體區域之良好闡釋。In a chromosomal region 120 where one of the two homologous haplotypes is deleted in cancer cells, all
B.染色體區域之擴增B. Amplification of Chromosomal Regions
圖2繪示癌細胞中展現擴增變異之染色體區域。正常細胞顯示具有兩種單倍型,即Hap I及Hap II。如所顯示,Hap I與Hap II二者皆在複數個異型接合基因座210之每一者處具有序列。在腫瘤細胞中,Hap II之染色體區域220擴增兩次(倍增)。Figure 2 depicts chromosomal regions exhibiting amplified variation in cancer cells. Normal cells show two haplotypes, Hap I and Hap II. As shown, both Hap I and Hap II have sequences at each of the plurality of
類似地,對於在腫瘤組織中具有單對偶基因擴增之區域而言,SNP 210處之擴增對偶基因可藉由諸如微陣列分析等方法檢測。兩種單倍型中之一者(圖2所示實例中之Hap II)可藉由將染色體區域220中之全部擴增對偶基因接合在一起來確定。特定基因座處之擴增對偶基因可藉由比較基因座處之每一對偶基因之數目確定。然後,另一單倍型(Hap I)可藉由將非擴增對偶基因接合在一起來確定。此一方法僅用於患有具有癌細胞時,且僅用於確定區域220中之單倍型,但提供對擴增染色體區域之良好闡釋。Similarly, for regions with single allele amplification in tumor tissue, the amplified allele at
擴增可源自具有2個以上染色體,或一個染色體中一個基因重複出現。一個區域可串聯倍增,或區域可為含有該區域之一或多個拷貝之微小染色體。擴增亦可源自一個染色體之一基因拷貝並插入不同染色體或相同染色體中不同區域中。此等插入係一種擴增類型。Amplification can result from having more than 2 chromosomes, or from duplication of a gene in one chromosome. A region can be multiplied in tandem, or a region can be a minichromosome containing one or more copies of the region. Amplification can also originate from one copy of a gene on one chromosome and insert into a different chromosome or into a different region of the same chromosome. These insertions are a type of amplification.
由於癌症組織將提供該等無細胞DNA(及可能細胞DNA)中之至少一些,因此可在諸如血漿及血清等試樣中檢測到癌症組織之基因組變異。檢測變異之問題在於,腫瘤或癌症可能相當小,因此提供之癌細胞DNA相對較少。因此,具有變異之循環DNA之量相當少,因此使檢測極為困難。在基因組中單一基因座處之DNA可能不足以檢測變異。本文所述方法可藉由以下方式來克服此困難:分析包括複數個基因座(單倍型)之染色體區域處之DNA,由此在對單倍型進行合計時將一個基因座處之微小變化改變為可察覺之差異。因此,分析區域之複數個基因座可提供較大精度,且可減少假正性及假負性。Since cancer tissue will provide at least some of this cell-free DNA (and possibly cellular DNA), genomic alterations in cancer tissue can be detected in samples such as plasma and serum. The problem with detecting mutations is that tumors or cancers can be quite small, thus providing relatively little cancer cell DNA. Therefore, the amount of circulating DNA with mutations is rather small, thus making detection extremely difficult. DNA at a single locus in the genome may not be sufficient to detect variation. The methods described herein overcome this difficulty by analyzing the DNA at regions of the chromosome that include multiple loci (haplotypes), whereby small changes at one locus are factored in when the haplotypes are aggregated. change into a noticeable difference. Therefore, analyzing multiple loci in a region can provide greater precision and can reduce false positives and false negatives.
同樣,變異區域可相當小,由此使得難以鑑別變異。若僅使用一個基因座或特定基因座,則將漏掉不在該等基因座處之變異。本文所述之一些方法可研究整個區域以在區域子集內發現變異。當分析區域跨越基因組時,可因此分析全基因組以發現不同長度及位置之變異,如下文所更詳細闡述。Also, regions of variation can be quite small, thereby making it difficult to identify variations. If only one locus or specific loci are used, variants not at those loci will be missed. Some of the methods described herein study entire regions to find variation within subsets of regions. When the analyzed region spans the genome, the whole genome can thus be analyzed to find variations of different lengths and positions, as described in more detail below.
為闡釋該等要點,如上文所示,區域可具有變異。但區域必須經選擇用於分析。區域之長度及位置可改變結果,且因此影響分析。舉例而言,若分析圖1中之第一區域,則不會檢測到變異。若分析第二區域,則可使用(例如)本文所述方法檢測到變異。若分析包括第一區域與第二區域二者之較大區域,則會遇到僅較大區域之部分具有變異從而可使得更難以鑑別任何變異之困難,以及鑑別變異之確切位置及長度之問題。各實施例可解決該等困難中之一些及/或全部。對選擇區域之說明同樣適用於使用相同染色體區域之單倍型或使用兩個不同染色體區域之方法。To illustrate these points, regions can have variation as indicated above. But regions must be selected for analysis. The length and location of the regions can change the results and thus affect the analysis. For example, if the first region in Figure 1 is analyzed, no variation will be detected. If the second region is analyzed, variations can be detected using, for example, the methods described herein. If a larger region including both the first region and the second region is analyzed, one encounters the difficulty that only part of the larger region has variation which can make it more difficult to identify any variation, as well as the problem of identifying the exact location and length of the variation . Embodiments may address some and/or all of these difficulties. The same remarks for selecting regions apply to methods using haplotypes of the same chromosomal region or methods using two different chromosomal regions.
A.選擇特定染色體區域A. Selection of specific chromosomal regions
在一個實施例中,可基於對癌症或患者之瞭解來選擇特定區域。舉例而言,已知該區域通常可在許多癌症或特定癌症中展現變異。可藉由參照關於對癌症類型或具有特定風險因子之患者熟知者之文獻來確定該區域之確切長度及位置。另外,可獲得患者之腫瘤組織並分析以鑑別變異區域,如上文所述。當前,儘管此一技術需要獲得癌細胞(此對於僅診斷之患者可能不現實),但可使用此一技術來鑑別用於在相同患者中隨時間監測之區域(例如,在手術以移除癌性組織後,或在化學療法或免疫療法或靶向療法後,或用於檢測腫瘤復發或進展)。In one embodiment, specific regions may be selected based on knowledge about the cancer or patient. For example, this region is known to exhibit variation in many cancers in general or in specific cancers. The exact length and location of this region can be determined by reference to the literature for persons familiar with the type of cancer or patient with a particular risk factor. Additionally, tumor tissue from a patient can be obtained and analyzed to identify regions of variation, as described above. Currently, this technique can be used to identify areas for monitoring over time in the same patient (e.g., after surgery to remove cancer cells), although this technique requires obtaining cancer cells (which may not be practical for patients diagnosed only). or after chemotherapy or immunotherapy or targeted therapy, or to detect tumor recurrence or progression).
可鑑別一個以上特定區域。可獨立地使用對此等區域中每一者之分析,或可共同分析不同區域。另外,可將區域細分以在定位變異時提供較大精度。More than one specific region may be identified. Analysis of each of these regions can be used independently, or the different regions can be analyzed together. Additionally, regions can be subdivided to provide greater precision in locating variation.
圖3顯示表300,其繪示不同類型之癌症及有關區域及其對應變異。310欄列示不同癌症類型。本文所述實施例可用於任一類型之涉及變異之癌症,且因此此列表僅係實例。320欄顯示增加(擴增)與相同列之特定癌症有關之區域(例如,大區域,例如7p或17q25之更特定區域)。330欄顯示可發現喪失(缺失)之區域。340欄列示討論該等區域與特定癌症之關聯之參考文獻。Figure 3 shows a table 300 depicting different types of cancer and associated regions and their corresponding variations.
該等具有可能染色體變異之區域可用作根據本文所述方法分析之染色體區域。癌症中改變之其他基因組區域之實例可參見the Cancer Genome Anatomy Project(cgap.nci.nih.gov/Chromosomes/RecurrentAberrataions)及the Atlas of Genetics and Cytogenetics in Oncology and Haematology(atlasgeneticsoncology.org Tumors/Tumorliste.html)之數據庫。These regions with possible chromosomal variation can be used as chromosomal regions analyzed according to the methods described herein. Examples of other genomic regions altered in cancer can be found in the Cancer Genome Anatomy Project (cgap.nci.nih.gov/Chromosomes/RecurrentAberrataions) and the Atlas of Genetics and Cytogenetics in Oncology and Haematology (atlasgeneticsoncology.orgTumors/Tumorliste.html) database.
如可發現,鑑別區域可相當大,而其他區域可能較具體。變異可能不包括表中所鑑別之整個區域。因此,此等關於變異類型之線索無法確切定位特定患者中變異實際存在於何處,但可另外用於大致指出大區域以供分析。此等大區域可包括在較大區域(其詳細內容闡述於本文中)中個別地以及共同地分析之許多亞區(其可具有相等大小)。因此,實施例可基於欲測試癌症之特定情形組合選擇大區域之態樣,但亦可採用更多一般技術(例如,測試亞區),如下文所述。As can be seen, the identified regions may be quite large, while other regions may be more specific. Variants may not encompass the entire region identified in the table. Thus, such clues as to the type of variant cannot pinpoint exactly where the variant actually resides in a particular patient, but can additionally be used to roughly pinpoint large regions for analysis. Such large regions may include many subregions (which may be of equal size) analyzed individually and collectively within a larger region (details of which are set forth herein). Thus, embodiments may combine aspects of selecting large regions based on the specific circumstances in which cancer is to be tested, but more general techniques (eg, testing subregions) may also be employed, as described below.
B.選擇任意染色體區域B. Select an arbitrary chromosomal region
在另一實施例中,任意地選擇所分析染色體區域。舉例而言,可將基因組分成長度為一百萬鹼基(Mb)或其他預定區段長度(例如500Kb或2Mb)之區域。若區域為1Mb,則在人類基因組中存在約3,000個區域,此乃因在單倍體人類基因組中存在約30億個鹼基。然後可對該等區域各自分析,如下文所更詳細討論。In another embodiment, the chromosomal region analyzed is chosen arbitrarily. For example, the genome can be divided into regions of one million bases (Mb) in length or other predetermined segment lengths such as 500Kb or 2Mb. If the region is 1 Mb, there are about 3,000 regions in the human genome because there are about 3 billion bases in the haploid human genome. These regions can then be analyzed individually, as discussed in more detail below.
此等區域可不基於對癌症或患者之任一瞭解,而是基於將基因組系統分割為欲分析區域來確定。在一實作中,當染色體之長度不為預定區段之倍數(例如,不可被1百萬鹼基整除)時,染色體之最後區域可小於預定長度(例如小於1MB)。在另一實作中,可基於染色體之總長度及欲產生區段之數目(其通常會在染色體間有所不同)將各染色體分成相等長度(或近似相等-在捨入誤差內)之區域。在此一實作中,各染色體區段之長度可有所不同。These regions can be determined not based on any knowledge of the cancer or the patient, but based on a systematic segmentation of the genome into regions to be analyzed. In one implementation, when the length of the chromosome is not a multiple of the predetermined segment (eg, not divisible by 1 million bases), the last region of the chromosome may be less than the predetermined length (eg, less than 1 MB). In another implementation, each chromosome can be divided into regions of equal length (or approximately equal - within rounding error) based on the total length of the chromosome and the number of segments to be generated (which will often vary between chromosomes) . In this implementation, the length of each chromosome segment can vary.
如上文所提及,可基於所測試特定癌症鑑別特定區域,但然後可將特定區域細分成較小區域(例如跨越特定較大區域之相等大小之亞區)。以此方式,可指出變異。在下文討論中,任何一般提及之染色體區域可為明確鑑別之區域、任意選擇之區域或二者之組合。As mentioned above, a particular region can be identified based on the particular cancer being tested, but can then be subdivided into smaller regions (eg, equally sized subregions spanning a particular larger region). byIn this way, variations can be indicated. In the discussion below, any generic reference to a chromosomal region may be a specifically identified region, an arbitrarily selected region, or a combination of both.
此部分闡述藉由分析包括無細胞DNA之生物學試樣來檢測單一染色體區域中之變異之方法。在此部分之實施例中,單一染色體區域在該區域中複數個基因座處係異型接合(不同對偶基因),由此提供可藉由瞭解給定基因座處之特定對偶基因來區別之兩種單倍型。因此,可將給定核酸分子(例如,無細胞DNA片段)鑑別為來自兩種單倍型中之特定一者。舉例而言,可對片段測序以獲得與染色體區域比對之序列標籤,且隨後可鑑別對偶基因所屬異型接合基因座處之單倍型。兩種一般技術類型闡述於下文中,用於確定特定單倍型(Hap)之變異,具體而言用於標籤計數及大小分析。This section describes methods for detecting variations in single chromosomal regions by analysis of biological samples comprising cell-free DNA. In the examples in this section, a single chromosomal region is heterozygous (different alleles) at multiple loci in that region, thereby providing two alleles that can be distinguished by knowing the particular allele at a given locus. haplotype. Thus, a given nucleic acid molecule (eg, a segment of cell-free DNA) can be identified as being from a specific one of the two haplotypes. For example, fragments can be sequenced to obtain sequence tags that align to chromosomal regions, and the haplotype at the heterozygous locus to which the allele belongs can then be identified. Two general types of techniques are described below for determining variation of a specific haplotype (Hap), specifically for tag count and size analysis.
A.確定單倍型A. Determining Haplotypes
為區分兩種單倍型,首先確定染色體區域之兩種單倍型。舉例而言,可確定圖1之正常細胞中所示之兩種單倍型Hap I及Hap II。在圖1中,單倍型包括異型接合之第一複數個基因座110,且允許兩種單倍型之間有差異。此第一複數個基因座跨越所分析染色體區域。可首先確定不同異型接合基因座(het)上之對偶基因且隨後定相以確定患者之單倍型。To distinguish between the two haplotypes, the two haplotypes for the chromosomal regions are first determined. For example, the two haplotypes Hap I and Hap II shown in the normal cells of Figure 1 can be determined. In FIG. 1 , the haplotype comprises a heterozygous first plurality of
可藉由單分子分析法來確定SNP對偶基因之單倍型。此等方法之實例已由Fan等人(Nat Biotechnol.2011;29:51-7)、Yang等人(Proc Natl Acad Sci U S A.2011;108:12-7)及Kitzman等人(Nat Biotechnol.2011 Jan;29:59-63)闡述。另一選擇為,可藉由分析家族成員(例如父母、同胞及子女)之基因型來確定個體之單倍型。實例包括由Roach等人(Am J Hum Genet.2011;89(3):382-97)及Lo等人(Sci Transl Med.2010;2:61ra91)闡述之方法。在又一實施例中,可藉由比較腫瘤組織及基因組DNA之基因分型結果來確定個體之單倍型。可藉由微陣列分析(例如使用t)來實施該等個體之基因型分析。Haplotypes of SNP alleles can be determined by single molecule analysis. Examples of such methods have been described by Fan et al. (Nat Biotechnol. 2011 Jan;29:59-63). Alternatively, the haplotype of an individual can be determined by analyzing the genotypes of family members (eg, parents, sibs, and children). Examples include Roach et al. (Am J HumGenet.2011;89(3):382-97) and the method described by Lo et al. (Sci Transl Med.2010;2:61ra91). In yet another embodiment, the haplotype of an individual can be determined by comparing the genotyping results of tumor tissue and genomic DNA. Genotyping of such individuals can be performed by microarray analysis (eg, using t).
亦可藉由彼等熟習此項技術者所熟知之其他方法來構築單倍型。此等方法之實例包括彼等基於以下者:單分子分析(例如數位PCR(Ding C及Cantor CR.Proc Natl Acad Sci USA 2003;100:7449-7453;Ruano G等人Proc Natl Acad Sci USA 1990;87:6296-6300))、染色體分選或分離(Yang H等人Proc Natl Acad Sci U S A 2011;108:12-17;Fan HC等人Nat Biotechnol 2011;29:51-57)、精子單倍型分析(Lien S等人Curr Protoc Hum Genet 2002;第1章:第1.6單元)及成像技術(Xiao M等人Hum Mutat 2007;28:913-921)。其他方法包括彼等基於以下者:對偶基因特異性PCR(Michalatos-Beloin S等人Nucleic Acids Res 1996;24:4841-4843;Lo YMD等人Nucleic Acids Res 19:3561-3567)、選殖及限制酶消化(Smirnova AS等人Immunogenetics 2007;59:93-8)等。又一些方法係基於群中單倍型區塊之分佈及連鎖不平衡結構,此允許自統計評估推斷個體之單倍型(Clark AG.Mol Biol Evol 1990;7:111-22;10:13-9;Salem RM等人Hum Genomics 2005;2:39-66)。Haplotypes can also be constructed by other methods known to those skilled in the art. Examples of such methods include those based on: single molecule analysis (e.g. digital PCR (Ding C and Cantor CR. Proc Natl Acad Sci USA 2003; 100:7449-7453; Ruano G et al. Proc Natl Acad Sci USA 1990; 87:6296-6300)), chromosome sorting or segregation (Yang H et al. Proc Natl Acad Sci USA 2011;108:12-17; Fan HC et al. Nat Biotechnol 2011;29:51-57), sperm haplotype Analysis (Lien S et al. Curr
若可獲得腫瘤組織,則確定LOH之區域之單倍型的另一方法係藉由對個體之正常組織及腫瘤組織實施基因分型。在LOH存在下,對於顯示LOH之區域內之全部SNP基因座而言,具有極高分數濃度之腫瘤細胞之腫瘤組織會顯示表觀同型接合性。該等SNP基因座之基因型會包含一種單倍型(圖1中LOH區域之Hap I)。另一方面,正常組織會指示,對於LOH之區域內之SNP基因座而言,個體係異型接合。存在於正常組織而非腫瘤組織中之對偶基因會包含另一單倍型(圖1中LOH區域之Hap II)。Another method of determining the haplotype of the region of LOH, if tumor tissue is available, is by genotyping the normal and tumor tissue of the individual. In the presence of LOH, tumor tissue with a very high fractional concentration of tumor cells will display apparent homozygosity for all SNP loci in regions exhibiting LOH. The genotypes at these SNP loci will contain one haplotype (Hap I in the LOH region in Figure 1). On the other hand, normal tissue would indicate that for the LOH areaIndividual lines are heterozygous for the SNP loci within the domain. Alleles present in normal but not tumor tissues would contain another haplotype (Hap II in the LOH region in Figure 1).
B.相對單倍型劑量(RHDO)分析B. Relative Haplotype Dosage (RHDO) Analysis
如上文所提及,具有染色體區域之單倍型之一者之擴增或缺失的染色體變異會導致兩種單倍型在腫瘤組織之染色體區域中之劑量不均衡。在具有腫瘤生長者之血漿中,一部分循環DNA係源自腫瘤細胞。由於在癌症患者之血漿中存在腫瘤源DNA,因此其血漿中亦會存在此等不均衡。可藉助對來自各單倍型之分子之數目計數來檢測兩種單倍型之劑量不均衡。As mentioned above, a chromosomal variation with an amplification or deletion of one of the haplotypes of a chromosomal region results in an unbalanced dosage of the two haplotypes in the chromosomal region of the tumor tissue. In the plasma of persons with tumor growth, a portion of circulating DNA is derived from tumor cells. These imbalances also exist in the plasma of cancer patients due to the presence of tumor-derived DNA in the plasma. Dosage imbalances between two haplotypes can be detected by counting the number of molecules from each haplotype.
對於在腫瘤組織(例如圖1之區域120)中觀察到LOH之染色體區域而言,由於缺乏來自腫瘤組織之Hap II之貢獻,因此在與Hap II比較時,Hap I會在循環DNA分子(片段)內過度呈現。對於在腫瘤組織中觀察到拷貝數擴增之染色體區域而言,由於釋放額外劑量之來自腫瘤組織之Hap II,因此在與Hap I比較時,Hap II會在受Hap II之單對偶基因擴增影響之區域過度呈現。為確定過度呈現或呈現不足,確定試樣中之某些DNA片段來自Hap I或Hap II,此可藉由多種方法進行,例如藉由實施通用測序及比對或使用數位PCR及序列特異性探針。For chromosomal regions where LOH is observed in tumor tissue (e.g., region 120 of FIG. 1 ), Hap I will appear in circulating DNA molecules (fragment ) is over-rendered. For chromosomal regions where copy number amplification was observed in tumor tissue, Hap II was amplified at the single allele affected by Hap II when compared to Hap I due to the release of an additional dose of Hap II from the tumor tissue Areas of influence are overrepresented. To determine overrepresentation or underrepresentation, certain DNA fragments in the sample are determined to be from Hap I or Hap II, which can be done by various methods, for example by performing universal sequencing and alignment or using digital PCR and sequence-specific detection. Needle.
在對來自癌症患者之血漿(或其他生物學試樣)之複數個DNA片段測序以生成經測序標籤後,可鑑別對應於兩種單倍型上之對偶基因的經測序標籤並計數。然後可比較對應於兩種單倍型中每一者之經測序標籤之數目以確定兩種單倍型是否相等地呈現於血漿中。在一個實施例中,可使用逐次機率比測試(SPRT)來確定兩種單倍型在血漿中之呈現是否顯著不同。統計學顯著差異表明在所分析染色體區域存在染色體變異。另外,可使用兩種單倍型在血漿中之定量差異來估計腫瘤源DNA在血漿中之分數濃度,如下文所述。After sequencing a plurality of DNA fragments from the plasma (or other biological sample) of a cancer patient to generate sequenced tags, the sequenced tags corresponding to the alleles on the two haplotypes can be identified and counted. The number of sequenced tags corresponding to each of the two haplotypes can then be compared to determine whether the two haplotypes are equally represented in plasma. In one example, a successive probability ratio test (SPRT) can be used to determine whether the presentation of two haplotypes in plasma is significantly different. Statistically significant differences indicate the presence of chromosomal variation in the chromosomal region analyzed. Additionally, you can useThe quantitative difference between the two haplotypes in plasma was used to estimate the fractional concentration of tumor-derived DNA in plasma, as described below.
測定本案中所述DNA片段之身份(例如其在人類基因組中之位置)的診斷方法不限於使用大規模平行測序作為檢測平臺。該等診斷方法亦可應用於(例如(但不限於)微流體數位PCR系統(例如Fluidigm數位陣列系統、微滴數位PCR系統(例如來自RainDance及QuantaLife者)、BEAM-ing系統((即珠粒、乳液PCR、擴增及磁力)(Diehl等人ProcNatlAcadSci USA 2005;102:16368-16373)、即時PCR、基於質譜之系統(例如SequenomMassArray系統)及多重連接依賴性探針擴增(MLPA)分析。Diagnostic methods for determining the identity of the DNA fragments described in this case, such as their location in the human genome, are not limited to the use of massively parallel sequencing as a detection platform. These diagnostic methods can also be applied to (for example, but not limited to) microfluidic digital PCR systems (such as Fluidigm digital array systems, droplet digital PCR systems (such as those from RainDance and QuantaLife), BEAM-ing systems (such as bead , emulsion PCR, amplification and magnetism) (Diehl et al. ProcNatlAcadSci USA 2005; 102: 16368-16373), real-time PCR, mass spectrometry-based systems (eg SequenomMassArray system) and multiplex ligation-dependent probe amplification (MLPA) analysis.
正常區域normal area
圖4繪示根據本發明之實施例,癌細胞內不展現變異之染色體區域以及在血漿中進行之測量。可藉由任一方法來選擇染色體區域410,例如,基於欲測試之特定癌症,或基於使用跨越大部分基因組之預定區段的一般篩選。為區分兩種單倍型,首先測定兩種單倍型。圖4顯示正常細胞之染色體區域410之兩種單倍型(Hap I及Hap II)。該等單倍型包括第一複數基因座420。此第一複數基因座420跨越所分析之染色體區域410。如所示,該等基因座在正常細胞中係異型接合。亦顯示癌細胞之兩種單倍型。在該癌細胞中,無區域缺失或擴增。Figure 4 depicts chromosomal regions in cancer cells that do not exhibit variation and measurements performed in plasma according to an embodiment of the present invention.
圖4亦顯示各單倍型上之各該基因座420之對偶基因計數之數目。亦提供染色體區域410之某些亞區之累積總數。對偶基因計數數目對應於DNA片段數目,該等DNA片段對應於各特定基因座之特定單倍型。舉例而言,針對Hap I對包括第一基因座421且具有對偶基因A之DNA片段計數。而且針對Hap II對具有對偶基因T之DNA片段計數。對片段比對處(即其是否包括特定基因座)及其所含對偶基因之測定可以如本文所提及之各種方式測定。可使用兩種單倍型之計數比率來測定是否存在統計學顯著差異。此比率在本文中稱為優勢比。亦可使用兩個值間之差;該差可藉由片段總數正規化。該比率及差(及其函數)係與閾值比較以決定是否存在變異之分類之參數實例。Figure 4 also shows the number of allele counts for each
RHDO分析可利用相同單倍型上之全部對偶基因(例如累積計數)來確定在血漿中是否存在兩種單倍型之任何不均衡,例如,如可在母體血漿中進行,如上文所提及Lo專利公開案12/940,992及12/940,993中所述。此方法可顯著增加用於確定是否存在任何不均衡之DNA分子之數目,且因此獲得更佳的統計檢力,以用於區分因癌症存在所致之不均衡與在癌症或癌變前病況不存在下對偶基因計數之隨機分佈。與單獨地分析多重SNP基因座不同,RHDO方法可利用對偶基因在兩條染色體上之相對位置(單倍型資訊),使得可一起分析位於相同染色體上之對偶基因。在單倍型資訊不存在下,不能將不同SNP基因座之對偶基因計數相加在一起以在統計學上確定單倍型在血漿中過度呈現抑或低度呈遞。對偶基因計數之量化可藉由(但不限於)以下來實施:大規模平行測序(例如使用藉由合成系統之Illumina測序、藉由連接技術(SOLiD)之測序(Life Technologies)、Ion Torrent測序系統(Ion Torrent and Life Technologies)、奈米孔測序(nanoporetech.com)及454測序技術(Roche))、數位PCR(例如藉由微流體數位PCR(例如Fluidigm(fluidigm.com))或BEAMing(珠粒、乳液PCR、擴增、磁力學(inostics.com))或液滴PCR(例如藉由QuantaLife(quantalife.com)及RainDance(raindancetechnologies.com))及即時PCR。在該技術之另一實作中,可利用使用溶液內捕獲(in-solution capture)(例如使用Agilent SureSelect系統、Illumina TruSeq Custom Enrichment套組(illumina.com/applications/sequencing/targeted_resequencing.ilmn)或藉由MyGenostics GenCap Custom Enrichment系統(mygenostics.com/))或基於陣列之捕獲(例如使用Roche NimbleGen系統)之富集目標測序。RHDO analysis can utilize all alleles on the same haplotype (e.g., cumulative counts) to determine whether there is any disequilibrium of the two haplotypes in plasma, e.g., as can be done in maternal plasma, as mentioned above described in
在圖4中所示之實例中,前兩個SNP基因座(對於第一SNP,24對26;及對於第二SNP,18對20)觀察到輕微對偶基因不均衡。然而,對偶基因計數之數目在統計學上不足以確定是否存在真正對偶基因不均衡。因此,將對相同單倍型上之對偶基因之計數相加在一起直至兩種單倍型之累積對偶基因計數足以在統計學上得出以下結論,染色體區域410(對於此實例,第五SNP)之兩種單倍型之間不存在對偶基因不均衡。在達成統計學顯著分類後,將累積計數復位(對於此實例,於第六SNP)。然後確定累積計數直至兩種單倍型之累積對偶基因計數再次足以在統計學上得出以下結論,區域410之該特定亞區之兩種單倍型之間無對偶基因不均衡。總累積計數亦可用於整個區域,但與整個區域410相反,先前方法可測試不同亞區,此可在確定變異之位置上提供較大精度(即亞區)。用於確定是否存在真正對偶基因不均衡之統計測試之實例包括(但不限於)逐次機率比測試(Zhou W等人Nat Biotechnol 2001;19:78-81;Zhou W等人Lancet.2002;359:219-25)、t測試及卡方測試(chi-square test)。In the example shown in Figure 4, a slight allele disequilibrium was observed for the first two SNP loci (24 vs 26 for the first SNP; and 18
檢測缺失Missing detection
圖5繪示根據本發明之實施例,癌細胞內染色體區域510之缺失以及在血漿中進行之確定缺失區域之量測。圖5顯示正常細胞之染色體區域510之兩種單倍型(Hap I及Hap II)。該等單倍型包括跨越所分析染色體區域510之第一複數個異型接合基因座520。亦顯示癌細胞之兩種單倍型。在癌細胞中,Hap II缺失區域510。與圖4一樣,圖5亦顯示每一基因座520之對偶基因計數之數目。染色體區域510內某些亞區亦保持累積總數。FIG. 5 depicts the deletion of a
由於腫瘤組織通常含有腫瘤細胞與非腫瘤細胞之混合物,因此可藉由偏移區域510內基因座處兩個對偶基因之量之比率來表現LOH。在此一情形下,可藉由組合基因座520來確定區域510中之缺失單倍型Hap II,在與正常組織上之對應基因座比較時,基因座520顯示DNA片段量之相對降低。具有更經常出現之片段之單倍型係保留於腫瘤細胞中之Hap I。在某些實施例中,可能期望實施會富集腫瘤細胞在腫瘤試樣中之比例,以使得更容易地確定缺失及保留單倍型之程序。此一程序之一個實例係顯微解剖(手動或藉由雷射捕獲技術)。Since tumor tissue typically contains a mixture of tumor cells and non-tumor cells, LOH can be represented by the ratio of the amounts of the two alleles at the loci within the offset
理論上,在腫瘤組織中,對於展現LOH之染色體區域而言,Hap I上之每一對偶基因會在循環DNA中過度呈現且對偶基因不均衡程度會取決於腫瘤DNA在血漿中之分數濃度。然而,同時,兩個對偶基因在任一循環DNA試樣中之相對豐度亦會由蔔瓦松分佈(Poisson distribution)決定。可實施統計分析以確定所觀察到之對偶基因不均衡係歸因於癌症組織中存在LOH抑或歸因於偶然性。檢測癌症中與LOH有關之真正對偶基因不均衡之能力取決於所分析循環DNA分子數目及腫瘤DNA之分數濃度。腫瘤DNA之較高分數濃度及較大分析分子數目會產生檢測真正對偶基因不均衡之較高靈敏度及特異性。Theoretically, in tumor tissue, for chromosomal regions exhibiting LOH, each allele on Hap I would be overrepresented in circulating DNA and the degree of allele imbalance would depend on the fractional concentration of tumor DNA in plasma. However, at the same time, the relative abundance of the two alleles in any circulating DNA sample will also be determined by the Poisson distribution. Statistical analysis can be performed to determine whether the observed allele imbalance is due to the presence of LOH in the cancer tissue or to chance. The ability to detect true allele imbalances associated with LOH in cancer depends on the number of circulating DNA molecules analyzed and the fractional concentration of tumor DNA. Higher fractional concentrations of tumor DNA and greater numbers of molecules analyzed yielded higher sensitivity and specificity for detecting true allele disequilibrium.
在圖5中所示之實例中,前兩個SNP基因座(對於第一SNP,24對22;及對於第二SNP,18對15)觀察到輕微對偶基因不均衡。然而,對偶基因計數之數目在統計學上不足以確定是否存在真正對偶基因不均衡。因此,將對相同單倍型上之對偶基因之計數相加在一起直至兩種單倍型之累積對偶基因計數足以在統計學上得出以下結論,在區域510(對於此實例,第五SNP)中存在兩種單倍型之間之對偶基因不均衡。在一些實施例中,僅已知不均衡,不確定具體類型(缺失或擴增)。然後確定累積計數直至兩種單倍型之累積對偶基因計數再次足以在統計學上得出以下結論,區域510之該特定亞區之兩種單倍型之間存在對偶基因不均衡。總累積計數亦可用於整個區域,且可以本文所述任一方法實施。In the example shown in Figure 5, slight allele disequilibrium was observed for the first two SNP loci (24 vs 22 for the first SNP; and 18
檢測染色體區域之擴增Detection of amplification of chromosomal regions
圖6繪示根據本發明之實施例,癌細胞內染色體區域610之擴增以及在血漿中進行之確定擴增區域之量測。除LOH外,亦經常在癌症組織中觀察到染色體區域之擴增。在圖6所示之實例中,將癌細胞中染色體區域610中之Hap II擴增至3個拷貝。如所顯示,區域610僅包括6個異型接合基因座,此與先前圖中所示較長區域相反。第六基因座中之擴增經檢測為統計學顯著,其中確定過度呈現為統計學顯著。在一些實施例中,僅已知不均衡,且不確定具體類型(缺失或擴增)。在其他實施例中,可獲得癌細胞並分析。此分析可提供關於不均衡歸因於缺失(對於缺失區域而言,癌細胞為同型接合)抑或擴增(對於擴增區域而言,癌細胞係異型接合)之資訊。在其他實作中,可使用第IV部分之方法分析整個區域(即並非個別地單倍型)來確定存在缺失抑或擴增。若區域過度呈現,則變異係擴增;且若區域係呈現不足,則變異係缺失。亦分析區域620且累積計數證實不存在不均衡。FIG. 6 shows the amplification of a
用於血漿RHDO分析之SPRT分析SPRT analysis for plasma RHDO analysis
對於具有異型接合基因座之任何染色體區域而言,可使用RHDO分析來確定血漿中是否存在兩種單倍型之任何劑量不均衡。在該等區域中,血漿中存在單倍型劑量不均衡表明血漿試樣中存在腫瘤源DNA。在一個實施例中,可使用SPRT分析來確定Hap I及Hap II之經測序讀取物(read)數目之差是否在統計學上顯著。在SPRT分析之此實例中,首先確定來自兩種單倍型中每一者之經測序讀取物數目。然後可確定代表可能過度呈現之單倍型所貢獻經測序讀取物之比例量之參數(例如分數)(例如一種單倍型之讀取物數目除以另一單倍型之讀取物數目之分數)。可能過度呈現之單倍型在LOH之情形下為非缺失單倍型,且在染色體區域之單對偶基因擴增之情形下為擴增單倍型。然後,比較此分數與基於虛無假設(即不存在單倍型劑量不均衡)及備擇假設(即存在單倍型劑量不均衡)構築之兩個閾值(上限及下限)。若分數大於上限,則其指示血漿中存在兩種單倍型之統計學顯著不均衡。若分數低於下限,則其指示不存在兩種單倍型之統計學顯著不均衡。若分數介於上限與下限之間,則其指示無足夠統計檢力來得出結論。可逐次增加所分析區域之異型接合基因座之數目直至可進行成功的SPRT分類。For any chromosomal region with heterozygous loci, the RHDO classification can be usedAnalysis was performed to determine if there was any dose imbalance between the two haplotypes in the plasma. In these regions, the presence of haplotype dose imbalances in the plasma indicates the presence of tumor-derived DNA in the plasma samples. In one embodiment, SPRT analysis can be used to determine whether the difference in the number of sequenced reads for Hap I and Hap II is statistically significant. In this example of SPRT analysis, the number of sequenced reads from each of the two haplotypes was first determined. A parameter (e.g., a score) representing the proportional amount of sequenced reads contributed by potentially overrepresented haplotypes can then be determined (e.g., the number of reads for one haplotype divided by the number of reads for another haplotype score). Potentially overrepresented haplotypes are non-deletion haplotypes in the case of LOH and amplification haplotypes in the case of single allele amplification of a chromosomal region. This score was then compared to two thresholds (upper and lower) constructed based on the null hypothesis (ie no haplotype dose imbalance) and the alternative hypothesis (ie presence of haplotype dose imbalance). If the score is greater than the upper limit, it indicates that there is a statistically significant imbalance of the two haplotypes in the plasma. If the score is below the lower limit, it indicates that there is no statistically significant imbalance of the two haplotypes. If the score is between the upper and lower limits, it indicates insufficient statistical power to draw a conclusion. The number of heterozygous loci for the region analyzed can be increased incrementally until successful SPRT classification can be made.
用於計算SPRT之上限及下限之方程式係:上限=[(ln 8)/N-ln δ]/ln γ;下限=[(ln 1/8)/N-ln δ]/ln γ,其中δ=(1-θ1)/(1-θ2)且
在LOH之情形下,θ1=1/(2-F)。在單對偶基因擴增之情形下,θ1=(1+zF)/(2+zF),其中z代表腫瘤中染色體區域經擴增之額外拷貝數。舉例而言,若一個染色體倍增,則會有特定染色體之一個額外拷貝。則z等於1。In the case of LOH, θ1 =1/(2-F). In the case of single allele amplification, θ1 =(1+zF)/(2+zF), where z represents the number of extra copies of the amplified chromosomal region in the tumor. For example, if a chromosome is multiplied, there will be an extra copy of a particular chromosome. Then z is equal to 1.
圖7顯示根據本發明之實施例,在HCC患者之血漿DNA中對腫瘤組織中位於染色體1p處且顯示單對偶基因擴增之區段的RHDO分析。綠色三角形代表患者之數據。經測序讀取物總數隨所分析SNP之數目增加而增加。來自腫瘤中擴增單倍型之經測序讀取物之總分數隨所分析經測序讀取物之總數的增加而變化且最終達到高於上限之值。此指示顯著單倍型劑量不均衡且因此支持血漿中存在此與癌症有關之染色體變異。FIG. 7 shows the RHDO analysis of a segment located at chromosome 1p in tumor tissue and showing single allele amplification in plasma DNA of HCC patients according to an embodiment of the present invention. Green triangles represent patient data. The total number of sequenced reads increased with the number of SNPs analyzed. The total fraction of sequenced reads from amplified haplotypes in the tumors varied with increasing total number of sequenced reads analyzed and eventually reached values above the upper limit. This indicates a significant haplotype dosage imbalance and thus supports the existence of this cancer-associated chromosomal variation in plasma.
對HCC患者在腫瘤組織中顯示擴增及缺失之全部染色體區域實施使用SPRT之RHDO分析。結果如下,已知922個區段具有LOH且已知105個區段具有擴增。對於LOH而言,利用SPRT對922個區段分類,且將該等區段中之921個正確地鑑別為在血漿中具有單倍型劑量不均衡,以提供99.99%之精度。對於單對偶基因擴增而言,利用SPRT對105個區段分類,且將該等區段中之105個正確地鑑別為在血漿中具有單倍型劑量不均衡,以提供100%之精度。RHDO analysis using SPRT was performed on all chromosomal regions showing amplifications and deletions in tumor tissues of HCC patients. The results are as follows, 922 segments are known to have LOH and 105 segments are known to have amplification. For LOH, 922 segments were classified using SPRT, and 921 of these segments were correctly identified as having haplotype dosage imbalance in plasma, giving an accuracy of 99.99%. For single allele amplification, 105 segments were classified using SPRT, and 105 of these segments were correctly identified as having haplotype dosage imbalance in plasma to provide 100% accuracy.
C.相對單倍型大小分析C. Relative Haplotype Size Analysis
作為對與兩種單倍型比對之片段之劑量計數的替代,可使用各別單倍型之片段大小。舉例而言,對於特定染色體區域而言,可比較一種單倍型之DNA片段大小與另一單倍型之DNA片段大小。可分析對應於該區域之第一單倍型之異型接合基因座處任一對偶基因之DNA片段的大小分佈,且比較其與對應於第二單倍型之異型接合基因座處任一對偶基因之DNA片段的大小分佈。可使用大小分佈之統計學顯著差異以與計數數目可達成類似之方式來鑑別變異。Instead of counting doses of fragments aligned to the two haplotypes, fragment sizes for the respective haplotypes can be used. For example, for a particular chromosomal region, the DNA fragment size of one haplotype can be compared to the DNA fragment size of another haplotype. The size distribution of DNA fragments at the heterozygous locus corresponding to the first haplotype of the region can be analyzed for the size distribution of any allele at the heterozygous locus and compared to any allele at the heterozygous locus corresponding to the second haplotype OfSize distribution of DNA fragments. Statistically significant differences in size distributions can be used to identify variants in a similar manner as count numbers can be achieved.
已報導,癌症患者之總(即腫瘤與非腫瘤)血漿DNA之大小分佈有所增加(Wang BG等人Cancer Res.2003;63:3966-8)。然而,若明確地研究腫瘤源DNA(而非DNA之總(即腫瘤與非腫瘤)量),則觀察到腫瘤源DNA分子之大小分佈比源自非腫瘤細胞之分子之大小分佈更短(Diehl等人Proc Natl Acad Sci U S A.2005;102:16368-73)。因此,可使用循環DNA之大小分佈來確定是否存在與癌症有關之染色體變異。大小分析原理顯示於圖8中。It has been reported that the size distribution of total (ie tumor and non-tumor) plasma DNA is increased in cancer patients (Wang BG et al. Cancer Res. 2003; 63:3966-8). However, when tumor-derived DNA (rather than the total (i.e., tumor and non-tumor) amount of DNA) is studied explicitly, the size distribution of tumor-derived DNA molecules is observed to be shorter than that of molecules derived from non-tumor cells (Diehl et al. Proc Natl Acad Sci US A. 2005; 102: 16368-73). Therefore, the size distribution of circulating DNA can be used to determine the presence of cancer-associated chromosomal aberrations. The principle of size analysis is shown in FIG. 8 .
圖8顯示根據本發明之實施例,在存在含有缺失之腫瘤時染色體區域之兩種單倍型之片段的大小分佈變化。如圖8中所繪示,腫瘤組織中缺失T對偶基因。因此,腫瘤組織僅會將A對偶基因之短分子釋放至血漿中。腫瘤源短DNA分子會導致血漿中A對偶基因之大小分佈總體縮短,從而導致A對偶基因在血漿中之大小分佈與T對偶基因相比更短。如先前部分中所討論,可一起分析位於相同單倍型上之全部對偶基因。換言之,可比較載有位於一種單倍型上之對偶基因之DNA分子的大小分佈與載有另一單倍型上之對偶基因之DNA分子的大小分佈。腫瘤組織中之缺失單倍型會在血漿中顯示較長大小分佈。Figure 8 shows the change in size distribution of fragments of two haplotypes of chromosomal regions in the presence of tumors containing deletions according to an embodiment of the present invention. As depicted in Figure 8, the T allele was deleted in tumor tissue. Thus, tumor tissue releases only short molecules of the A allele into plasma. Tumor-derived short DNA molecules lead to an overall shortened size distribution of the A allele in plasma, resulting in a shorter size distribution of the A allele in plasma compared to the T allele. As discussed in the previous section, all alleles on the same haplotype can be analyzed together. In other words, the size distribution of DNA molecules carrying alleles on one haplotype can be compared to the size distribution of DNA molecules carrying alleles on another haplotype. Deleted haplotypes in tumor tissue show longer size distributions in plasma.
大小分析亦可應用於檢測與癌症有關之染色體區域之擴增。圖9顯示根據本發明之實施例,在存在含有擴增之腫瘤時,染色體區域之兩種單倍型之片段的大小分佈變化。在圖9中所示實例中,腫瘤中載有對偶基因T之染色體區域倍增。因此,血漿中會釋放增加量之載有T對偶基因之短DNA分子,從而導致T對偶基因之大小分佈與A對偶基因之大小分佈相比總體縮短。大小分析可共同地應用於位於相同單倍型上之全部對偶基因。換言之,單倍型擴增在腫瘤組織中之大小分佈會比未擴增單倍型在腫瘤中之大小分佈更短。Size analysis can also be applied to detect amplification of chromosomal regions associated with cancer. Figure 9 shows the change in size distribution of fragments of two haplotypes of chromosomal regions in the presence of tumors containing amplifications according to an embodiment of the present invention. In the example shown in Figure 9, the chromosomal region carrying the allele T was multiplied in the tumor. Consequently, increased amounts of short DNA molecules carrying the T allele are released in the plasma, resulting in a size distribution of the T allele compared to that of the A alleleOverall shortening. Size analysis can be applied collectively to all alleles on the same haplotype. In other words, the size distribution of the expanded haplotype in the tumor tissue will be shorter than the size distribution of the non-amplified haplotype in the tumor.
檢測循環DNA之大小分佈之縮短Detection of shortening of size distribution of circulating DNA
可藉由(但不限於)末端配對大規模平行測序來確定源自兩種單倍型(即Hap I及Hap II)之DNA片段的大小。在對DNA片段之末端測序後,可將經測序讀取物(標籤)與參照人類基因組比對。可自各末端最外核苷酸之坐標推斷測序DNA分子之大小。可使用分子之經測序標籤來確定測序DNA片段源自Hap I抑或Hap II。舉例而言,一種經測序標籤可包括所分析染色體區域中之異型接合基因座。The size of DNA fragments derived from the two haplotypes (ie, Hap I and Hap II) can be determined by, but not limited to, paired-end massively parallel sequencing. After the ends of the DNA fragments are sequenced, the sequenced reads (tags) can be aligned to a reference human genome. The size of the sequenced DNA molecule can be inferred from the coordinates of the outermost nucleotides at each terminal. The sequenced tags of the molecules can be used to determine whether the sequenced DNA fragments are derived from Hap I or Hap II. For example, one sequenced signature can include heterozygous loci in the chromosomal region analyzed.
因此,對於各測序分子而言,可確定大小與其源自Hap I抑或Hap II二者。基於與每一單倍型比對之片段之大小,電腦系統可計算Hap I與Hap II二者之大小分佈特徵(例如平均片段大小)。可使用適當統計分析比較來自Hap I及Hap II之DNA片段之大小分佈以確定大小分佈之差異何時足以鑑別變異。除末端配對大規模平行測序外,可使用其他方法來確定DNA片段之大小,包括(但不限於)對全DNA片段測序、質譜及光學方法,其用於觀察及比較所觀察DNA分子與標準物之長度。Thus, for each sequenced molecule, both the size and whether it originates from Hap I or Hap II can be determined. Based on the size of the fragments aligned to each haplotype, the computer system can calculate size distribution characteristics (eg, average fragment size) for both Hap I and Hap II. The size distributions of DNA fragments from Hap I and Hap II can be compared using appropriate statistical analysis to determine when differences in size distributions are sufficient to identify variants. In addition to paired-end massively parallel sequencing, other methods can be used to determine the size of DNA fragments, including (but not limited to) sequencing of whole DNA fragments, mass spectrometry, and optical methods, which are used to visualize and compare observed DNA molecules with standards length.
接下來,引入兩種實例方法用於檢測與腫瘤之基因變異有關之循環DNA之縮短。該兩種方法旨在提供對兩群DNA片段之大小分佈之差異的定量量測。兩群DNA片段係指對應於Hap I及Hap II之DNA分子。Next, two example methods for detecting the shortening of circulating DNA associated with gene mutations in tumors are introduced. Both methods aim to provide a quantitative measure of the difference in the size distribution of two populations of DNA fragments. The two groups of DNA fragments refer to the DNA molecules corresponding to Hap I and Hap II.
短DNA片段之分數差fractional difference of short DNA fragments
在一實作中,使用短DNA片段之分數。設定截止大小(w)以界定短DNA分子。截止大小可有所不同且經選擇以適合不同診斷目的。電腦系統可確定等於或適於大小截止之分子數目。然後可藉由用短DNA數除以總數DNA片段來計算DNA片段分數(Q)。DNA分子群之大小分佈會影響Q值。較短總體大小分佈表示較高比例之DNA分子為短片段,因此,獲得較高Q值。In one implementation, fractions of short DNA fragments are used. A cutoff size (w) was set to define short DNA molecules. Cutoff sizes can vary and are chosen to suit different diagnostic purposes. Department of ComputerThe system can determine the number of molecules equal to or suitable for the size cutoff. The DNA fragment fraction (Q) can then be calculated by dividing the number of short DNA by the total number of DNA fragments. The size distribution of the population of DNA molecules affects the Q value. A shorter overall size distribution means that a higher proportion of the DNA molecules are short fragments and, therefore, a higher Q value is obtained.
然後可使用Hap I與Hap II間之短DNA片段之分數差。Hap I及Hap II之短片段之分數差(△Q)可反映來自Hap I及Hap II之DNA片段之大小分佈之差異。△Q=QHapI-QHapII,其中QHapI係Hap I DNA片段之短片段之分數;且QHapII係Hap II DNA片段之短片段之分數。QHapI及QHapII係兩組來自各單倍型之片段之大小分佈之統計值的實例。The fractional difference of short DNA fragments between Hap I and Hap II can then be used. The fractional difference (ΔQ) of the short fragments of Hap I and Hap II can reflect the difference in the size distribution of DNA fragments from Hap I and Hap II. ΔQ=QHapI −QHapII , where QHapI is the fraction of short fragments of Hap I DNA fragments; and QHapII is the fraction of short fragments of Hap II DNA fragments. QHapl and QHapl are examples of two sets of statistics from the size distribution of fragments of each haplotype.
如先前部分中所闡釋,當腫瘤組織中缺失Hap II時,Hap I DNA片段之大小分佈會比Hap II DNA片段之大小分佈更短。因此,會觀察到正△Q值。可比較正△Q值與閾值以確定△Q是否大至足以認為存在缺失。Hap I 之擴增亦會顯示正△Q值。當腫瘤組織中之Hap II倍增時,Hap II DNA片段之大小分佈會比Hap I DNA片段之大小分佈更短。因此,△Q值會變為負。在不存在染色體變異時,Hap I及Hap II DNA片段在血漿/血清中之大小分佈係類似的。因此,△Q值約為0。As explained in the previous section, when Hap II is deleted in tumor tissue, the size distribution of Hap I DNA fragments is shorter than that of Hap II DNA fragments. Therefore, positive ΔQ values are observed. Positive ΔQ values can be compared to a threshold to determine whether ΔQ is large enough to consider a deletion to be present. Amplification of Hap I will also show a positive ΔQ value. When Hap II multiplies in tumor tissue, the size distribution of Hap II DNA fragments is shorter than that of Hap I DNA fragments. Therefore, the ΔQ value becomes negative. In the absence of chromosomal aberrations, the size distribution of Hap I and Hap II DNA fragments in plasma/serum is similar. Therefore, the ΔQ value is about 0.
可比較患者之△Q與正常個體以確定該值是否正常。另外或另一選擇為,可比較患者之△Q值與自患有類似癌症之患者獲得之值以確定該值是否異常。此比較可涉及與本文所述閾值之比較。在疾病監測之情形下,可隨時間連續監測△Q值。△Q值之變化可指示腫瘤DNA在血漿/血清中之增加分數濃度。在此技術之所選實作中,可將腫瘤DNA之分數濃度與疾病之腫瘤階段、預測及進展相關聯。使用不同時刻之量測進行之此等實作更詳細地討論於下文中。The ΔQ of a patient can be compared to a normal individual to determine whether the value is normal. Additionally or alternatively, a patient's ΔQ value can be compared to values obtained from patients with similar cancers to determine if the value is abnormal. This comparison may involve comparisons to thresholds described herein. In the case of disease monitoring, the ΔQ value can be monitored continuously over time. Changes in ΔQ values can indicate increasing fractional concentrations of tumor DNA in plasma/serum. In selected implementations of this technique, the fractional concentration of tumor DNA can be correlated with the tumor stage, prognosis and progression of the disease. These implementations using measurements at different time instants are discussed in more detail below.
由短DNA片段所貢獻總長度之分數差Fractional difference in total length contributed by short DNA fragments
在此實作中,使用由短DNA片段所貢獻總長度之分數。電腦系統可確定一組DNA片段(例如來自給定區域之特定單倍型之片段或僅來自給定區域之片段)在試樣中之總長度。可選擇低於時將DNA片段定義為「短片段」之截止大小(w)。截止大小可有所不同且經選擇以適合不同診斷目的。然後,電腦系統可藉由將所隨機選擇等於或短於截止大小之DNA片段之長度相加確定短DNA片段之總長度。然後可將由短DNA片段所貢獻總長度之分數計算如下:F=Σw長度/ΣN長度,其中Σw長度代表長度等於或小於w(bp)之DNA片段之長度的總和;且ΣN長度代表長度等於或小於預定長度N之DNA片段的總和。在一個實施例中,N係600個鹼基。然而,可使用其他大小限制(例如150個鹼基、180個鹼基、200個鹼基、250個鹼基、300個鹼基、400個鹼基、500個鹼基及700個鹼基)來計算「總長度」。In this implementation, the fraction of the total length contributed by short DNA fragments is used. The computer system can determine the total length of a set of DNA fragments (eg, fragments from a given region of a particular haplotype or fragments from only a given region) in a sample. A cut-off size (w) below which DNA fragments are defined as "short fragments" can be selected. Cutoff sizes can vary and are chosen to suit different diagnostic purposes. The computer system can then determine the total length of the short DNA fragments by summing the lengths of randomly selected DNA fragments equal to or shorter than the cutoff size. The fraction of the total length contributed by short DNA fragments can then be calculated as follows: F = Σw length / ΣN length, where Σw length represents the sum of the lengths of DNA fragments of length equal to or less than w (bp); and ΣN length Represents the sum of DNA fragments whose length is equal to or less than a predetermined length N. In one embodiment, N is 600 bases. However, other size limits (e.g., 150 bases, 180 bases, 200 bases, 250 bases, 300 bases, 400 bases, 500 bases, and 700 bases) can be used to Calculate the "total length".
可選擇600個鹼基或以下之值,此乃因Illumina基因組分析儀系統不能對長於600個鹼基之DNA片段有效地擴增及測序。另外,將分析限制於短於600個鹼基之DNA片段亦可避免源自基因組之結構差異之偏誤。在結構差異(例如重排)(Kidd JM等人,Nature 2008;453:56-64)存在下,當藉由將DNA片段末端定位至參照基因組以生物資訊方式估計大小時,可能高估DNA片段之大小。另外,>99.9%全部成功地測序且定位至參照基因組之DNA片段小於600個鹼基且因此(包括等於及短於600個鹼基之全部片段)會提供DNA片段在試樣中之大小分佈的代表性估計。A value of 600 bases or less can be selected because the Illumina Genome Analyzer system cannot efficiently amplify and sequence DNA fragments longer than 600 bases. In addition, limiting the analysis to DNA fragments shorter than 600 bases also avoids bias arising from structural differences in the genome. In the presence of structural differences such as rearrangements (Kidd JM et al., Nature 2008;453:56-64), DNA fragments may be overestimated when bioinformatically estimating their size by mapping their ends to a reference genome size. Additionally, >99.9% of DNA fragments that were all successfully sequenced and mapped to the reference genome were smaller than 600 bases and thus (including all fragments equal to and shorter than 600 bases) would provide an indication of the size distribution of DNA fragments in the sample Representative estimates.
因此,可使用Hap I與Hap II間由短DNA片段所貢獻總長度之分數差。Hap I與Hap II DNA片段之F值之差可反映其間之大小分佈之干擾程度。此處,將FHap I及FHap II定義為分別由Hap I及Hap II之短DNA片段所貢獻總長度之分數。可將Hap I與Hap II間由短DNA片段所貢獻總長度之分數差(△F)計算為:△F=FHap I-FHap II。FHapI及FHapII係兩組來自各單倍型之片段之大小分佈之統計值的實例。Therefore, the fractional difference between Hap I and Hap II in the total length contributed by short DNA fragments can be used. The difference between the F values of Hap I and Hap II DNA fragments can reflect the degree of interference in the size distribution between them. Here, FHap I and FHap II are defined as the fraction of the total length contributed by the short DNA fragments of Hap I and Hap II, respectively. The fractional difference (ΔF) of the total length contributed by short DNA fragments between Hap I and Hap II can be calculated as: ΔF=FHap I -FHap II . FHapl and FHapl are examples of two sets of statistics from the size distribution of fragments of each haplotype.
與先前部分中所闡釋實施例類似,腫瘤組織中缺失Hap II會導致Hap I DNA片段之大小分佈在與Hap II DNA片段比較時明顯縮短。此會產生正△F值。當Hap II倍增時,會觀察到負△F值。在不存在染色體變異時,△F值約為0。Similar to the examples illustrated in the previous section, deletion of Hap II in tumor tissue resulted in a significantly shortened size distribution of Hap I DNA fragments when compared to Hap II DNA fragments. This produces a positive ΔF value. Negative ΔF values are observed when Hap II is multiplied. In the absence of chromosomal variation, the ΔF value is about 0.
可比較患者之△F與正常個體以確定該值是否正常。可比較患者之△F與自患有類似癌症之患者獲得之值以確定該值是否異常。此比較可涉及與本文所述閾值之比較。在疾病監測之情形下,可連續監測△Q值。△F值之變化可指示腫瘤DNA在血漿/血清中之增加分數濃度。A patient's ΔF can be compared to a normal individual to determine if the value is normal. A patient's ΔF can be compared to values obtained from patients with similar cancers to determine if the value is abnormal. This comparison may involve comparisons to thresholds described herein. In the case of disease monitoring, the ΔQ value can be monitored continuously. Changes in ΔF values can indicate increasing fractional concentrations of tumor DNA in plasma/serum.
D.一般方法D. General method
圖10係繪示根據本發明之實施例,分析有機體之生物學試樣之單倍型,以確定染色體區域是否展現缺失或擴增之方法的流程圖。生物學試樣包括源自正常細胞及可能源自與癌症有關之細胞之核酸分子(亦稱為片段)。該等分子在試樣中可為無細胞的。有機體可屬於具有一個以上染色體拷貝之任何類型,即,至少二倍體有機體,但可包括較高多倍體有機體。10 is a flowchart illustrating a method for analyzing haplotypes of biological samples of an organism to determine whether a chromosomal region exhibits deletion or amplification according to an embodiment of the present invention. Biological samples include nucleic acid molecules (also known as fragments) derived from normal cells and possibly from cells associated with cancer. The molecules can be acellular in the sample. Organisms may be of any type having more than one copy of a chromosome, ie, at least diploid organisms, but may include higher polyploid organisms.
在本文所述此方法及任何其他方法之一個實施例中,生物學試樣包括無細胞DNA片段。儘管已使用對血漿DNA之分析來闡釋本申請案中所述之不同方法,但該等方法亦可應用於在含有正常DNA與腫瘤源DNA之混合物之試樣中檢測與腫瘤有關之染色體變異。其他試樣類型包括唾液、眼淚、胸膜液、腹水液、膽汁、尿液、血清、胰液、糞便及宮頸塗片試樣。In one embodiment of this and any other method described herein, the biological sample comprises cell-free DNA fragments. Although the analysis of plasma DNA has been used to illustrate the various methods described in this application, the methods can also be applied to detect tumor-associated chromosomal aberrations in samples containing a mixture of normal and tumor-derived DNA. Other sample types include saliva,Tears, pleural fluid, ascites fluid, bile, urine, serum, pancreatic juice, feces and cervical smear samples.
在步驟1010中,確定有機體之正常細胞於第一染色體區域之第一及第二單倍型。可藉由任一適宜方法(例如彼等本文所提及者)確定單倍型。可經由任一方法(例如,本文所述方法)選擇染色體區域。第一染色體區域包括異型接合之第一複數個基因座(例如,區域410之基因座420)。異型接合基因座(het)可彼此相距較遠,例如,基因座可與第一複數個基因座之另一基因座彼此相距500個或1000個鹼基(或更多)。其他het可存在於第一染色體區域中,但不使用。In
在步驟1020中,在各分子之位置及對偶基因方面對生物學試樣中之複數個核酸分子實施表徵。舉例而言,可鑑別核酸分子在有機體之參照基因組中之位置。此定位可以各種方式實施,包括對分子實施測序(例如經由通用測序),以獲得該分子之一或多個(末端配對)經測序標籤且隨後將經測序標籤與參照基因組比對。此比對可使用諸如基本局部比對搜尋工具(BLAST)等工具實施。可將位置鑑別為染色體臂中之編號。可使用一個異型接合基因座(het)處之對偶基因來確定片段所屬單倍型。In
在步驟1030中,基於所鑑別位置及確定對偶基因將第一組核酸分子鑑別為來自第一單倍型。舉例而言,可將包括圖4之具有對偶基因A之基因座421之片段鑑別為來自Hap I。第一組可因包括至少一個位於第一複數個基因座中每一者處之核酸分子來跨越第一染色體區域。In
在步驟1040中,基於所鑑別位置及確定對偶基因將第二組核酸分子鑑別為來自第二單倍型。舉例而言,可將包括圖4之具有對偶基因T之基因座421之片段鑑別為來自Hap II。第二組包括至少一個位於第一複數個基因座中每一者處之核酸分子。In
在步驟1050中,電腦系統計算第一組核酸分子之第一值。第一值界定第一組核酸分子之性質。第一值之實例包括第一組中分子之數目之標籤計數及第一組中分子之大小分佈。In
在步驟1060中,電腦系統計算第二組核酸分子之第二值。第二值界定第二組核酸分子之性質。In
在步驟1070中,比較第一值與第二值以確定第一染色體區域是否展現缺失或擴增之分類。存在缺失或擴增之分類可提供關於具有與癌症有關之細胞之有機體之資訊。比較之實例包括獲得兩個值之差或比率及比較結果與一或多個閾值,如本文所述。舉例而言,可在SPRT分析中比較比率與閾值。實例分類可包括正(即檢測到擴增或缺失)、負及未分類、以及不同程度之正及負(例如,使用介於1與10之間整數或介於0與1之間之實數)。擴增可包括簡單倍增。此一方法可檢測與癌症有關之核酸之存在,該等核酸包括腫瘤DNA及來自癌前病變(即癌症前體)之DNA。In
E.深度E. Depth
分析深度係指在指定精度內提供分類或另一確定所需分析之分子之量。在一個實施例中,可基於已知變異計算深度,且隨後可實施具有該深度之量測及分析。在另一實施例中,分析可持續至作出分類為止,且可使用作出分類時之深度來確定癌症等級(例如,癌症之階段或腫瘤大小)。以下提供一些涉及深度之計算之實例。Depth of analysis refers to the amount of molecules required to provide classification or another determination within a specified accuracy. In one embodiment, depth can be calculated based on known variation, and measurements and analysis with that depth can then be performed. In another embodiment, the analysis continues until a classification is made, and the depth at which the classification is made can be used to determine the cancer grade (eg, stage of cancer or tumor size). Some examples of calculations involving depth are provided below.
偏差可指本文所述任一差或比率。作為實例,偏差可為第一值與第二值之間之偏差或為參數與閾值或腫瘤濃度之偏差,如本文所述。若偏差增加一倍,則需要量測之片段數減少到¼。更通常而言,若偏差增加到N倍,則需要量測之片段數係1/N2。作為推論,若偏差減少到1/N,則欲測試之片段數增加到N2。N可為實數或整數。Deviation may refer to any difference or ratio described herein. As an example, the deviation may be a deviation between a first value and a second value or a deviation of a parameter from a threshold or tumor concentration, as described herein. If the deviation is doubled, the number of fragments to be measured is reduced to ¼. More generally, if the deviation increases by N times, the number of fragments to be measured is 1/N2 . As a corollary, if the deviation is reduced to 1/N, the number of segments to be tested increases toN2 . N can be a real number or an integer.
假定試樣(例如血漿)的10%為腫瘤DNA之情形,且假定自對1000萬個片段測序發現統計學顯著差異。則假如舉例而言,實施富集程序而使得試樣中現在存在20%腫瘤DNA,則所需片段數為2,500,000個片段。以此方式,可將深度與腫瘤DNA在試樣中之百分比相關聯。Assume that 10% of the sample (eg, plasma) is tumor DNA, and assume that a statistically significant difference is found from sequencing 10 million fragments. Then if, for example, an enrichment procedure is performed such that 20% tumor DNA is now present in the sample, the number of fragments required is 2,500,000 fragments. In this way, depth can be correlated with the percentage of tumor DNA in the sample.
擴增量亦會影響深度。對於拷貝量為該區域中拷貝量之兩倍(例如為4,與之相比,正常為2)之區域而言,假定需要分析數目X之片段。若區域之拷貝量為正常拷貝量之4倍,則此區域將需要X/4量之片段。The amount of amplification will also affect the depth. For a region with twice the number of copies in that region (
F.閾值F. Threshold
可使用參數(例如每一單倍型之值之差或比率)與正常值之偏差量來提供診斷,如上文所述。舉例而言,偏差可為來自區域之一種單倍型之片段之平均大小與來自另一單倍型之片段之平均大小的差。若偏差高於某一量(例如,如自正常試樣及/或區域確定之閾值),則鑑別為缺失或擴增。但高於閾值之程度可提供資訊,其可導致使用多個閾值,每一者對應於不同癌症等級。舉例而言,與正常之較高偏差可提供癌症所處階段(例如階段4之不均衡程度會高於階段3)。較高偏差亦可歸因於腫瘤較大且因此釋放許多片段及/或區域擴增多倍。The amount of deviation of a parameter (eg, the difference or ratio of values for each haplotype) from normal values can be used to provide a diagnosis, as described above. For example, the bias can be the difference in the average size of fragments from one haplotype of a region to the average size of fragments from another haplotype. Deletions or amplifications are identified if the deviation is above a certain amount (eg, a threshold as determined from normal samples and/or regions). But the degree above the threshold is informative, which can lead to the use of multiple thresholds, each corresponding to a different cancer grade. For example, a higher deviation from normal can provide the stage of the cancer (eg
除提供不同癌症等級外,不同閾值亦可允許有效檢測具有變異之區域或特定區域。舉例而言,可設定高閾值以主要尋找3倍及更高之擴增,此會產生較一種單倍型之缺失更大之不均衡。亦可檢測區域之兩拷貝之缺失。同樣,可使用較低閾值來鑑別可能具有變異之區域,且然後可進一步分析該等區域以證實變異是否確實存在及其位置。舉例而言,可利用階層中之較低等級並使用較高閾值來實施二元搜尋(或更高階搜尋,例如八叉樹)。In addition to providing different cancer grades, different thresholds may also allow efficient detection of regions with mutations or specific regions. For example, a high threshold could be set to look primarily for amplifications of 3-fold and higher, which would create a greater disequilibrium than the deletion of one haplotype. Deletions of both copies of a region can also be detected. Likewise, lower thresholds can be used to identify regions likely to have variations, and these regions can then be further analyzed to confirm whether variations do exist and where. For example, the available classA binary search (or a higher order search such as an octree) is performed at a lower level and uses a higher threshold.
圖11顯示根據本發明之實施例,癌細胞中缺失亞區1130之區域1110以及在血漿中進行之確定缺失區域之量測。可藉由本文所提及任一方法(例如藉由將基因組分裂成相等大小之區段)來選擇染色體區域1110。圖11亦顯示每一基因座1120之對偶基因計數之數目。區域1140(正常區域)及區域1130(缺失區域)亦分別保持累積總數。Figure 11 shows the
若選擇區域1110進行分析,則在11個基因座內累積計數之數目係258(對於Hap I)及240(對於Hap II),差為18。此一差作為計數總數之百分比小於僅分析缺失亞區1130時。此係合理之原因在於區域1110之約一半為正常,而癌細胞中缺失全部亞區1130。因此,端視所用閾值而可能漏掉區域1110中之變異。If
為允許檢測亞區之缺失,實施例可使用相對較大區域之下限(對於此實例而言,假定區域1110與欲鑑別之缺失區域之大小相比相對較大)。儘管下限會鑑別更多區域,此可包括一些假正性,但其會減少假負性。現在,可藉助進一步分析來去除假正性,此亦可指出變異。To allow detection of deletions in sub-regions, embodiments may use relatively large region thresholds (for this example,
在已將區域標明用於進一步分析後,可將該區域劃分成亞區以供進一步分析。在圖11中,可將11個基因座分裂成兩半(例如使用二元樹)以提供6個基因座之亞區1140及具有5個基因座之亞區1130。可利用相同閾值或更嚴格之閾值來分析該等區域。在此實例中,然後可將亞區1140鑑別為正常且將亞區1130鑑別為包括缺失或擴增。以此方式,可排除不具有變異之較大區域,且可將時間用於進一步分析疑似區域(高於下限之區域)以鑑別顯示具有高置信度(例如使用上限)之變異之亞區。儘管此處使用RHDO,但大小技術同樣適用。After an area has been labeled for further analysis, the area can be divided into sub-areas for further analysis. In Figure 11, the 11 loci can be split in half (eg, using a binary tree) to provide a
可基於欲檢測變異之大小選擇第一搜尋級之區域之大小(及樹中之較低級之亞區之大小)。已發現癌症顯示10個具有10MB長度之變異之區域。患者亦已具有100MB展現變異之區域。稍後階段之癌症可具有較長變異部分。The size of the regions of the first search level (and the sizes of subregions at lower levels in the tree) can be chosen based on the size of the variation to be detected. The cancer was found to show 10 regions of variation with a length of 10 MB. The patient also had 100MB of regions exhibiting mutations. Cancers at later stages may have longer variant segments.
G.變異在區域內之位置的精確定位(Refinement)G. Precise location of variation in the region (Refinement)
在最後一部分中,討論基於樹搜尋將區域分成亞區。此處,討論其他用於分析亞區及指出區域內變異之方法。In the last section, the division of regions into subregions based on tree search is discussed. Here, other methods for analyzing subregions and indicating variation within regions are discussed.
圖12顯示根據本發明之實施例,可如何使用RHDO分析定位變異之位置。水平顯示染色體區域,其中將非癌細胞之單倍型標記為Hap I及Hap II。將Hap II在癌細胞中之缺失區域標記為LOH。Figure 12 shows how RHDO analysis can be used to map the position of a variant, according to an embodiment of the present invention. Chromosomal regions are shown horizontally where non-cancerous cell haplotypes are labeled Hap I and Hap II. The region of Hap II deletion in cancer cells was labeled LOH.
如所顯示,RHDO分析自假想染色體區域1202之左側開始至右側。各箭頭代表RHDO分類區段。每一區段可視為其自身區域,具體而言具有較大區域之het之子集之亞區。在可確定分類之前,RHDO分類區段之大小取決於基因座數(及基因座之位置)。各RHDO區段中所包括基因座數取決於分析用於每一區段之分子數目、期望精度(例如SPRT分析中之優勢比)及腫瘤源DNA在試樣中之分數濃度。當分子數目足以確定在兩種單倍型之間存在統計學顯著差異時,將作出分類,如圖4及圖5中闡釋之實例中所述。As shown, the RHDO analysis starts from the left to the right of the hypothetical
各實心水平箭頭代表顯示DNA試樣中不存在單倍型劑量不均衡之RHDO分類區段。在腫瘤中不具有LOH之區域內,作出6個RHDO分類且各指示單倍型劑量不均衡之不存在。下一RHDO分類區段1210橫跨具有LOH之區域與不具有LOH之區域之間之接合部1205。在圖12之下部中,顯示RHDO區段1210之SPRT曲線。黑色豎直箭頭指示具有LOH之區域與不具有LOH之區域之間之接合部。隨著來自具有LOH之區域之漸增數據的累積,此區段之RHDO分類指示存在單倍型劑量不均衡。Each solid horizontal arrow represents a RHDO classification segment showing the absence of haplotype dosage imbalance in the DNA samples. In regions of the tumor without LOH, 6 RHDO classifications were made and each indicated the absence of haplotype dose imbalance. The next
各白色水平箭頭代表指示單倍型劑量不均衡之存在的RHDO分類區段。右側上隨後4個RHDO亦指示DNA試樣中存在單倍型劑量不均衡。可推斷具有LOH之區域與不具有LOH之區域間之接合部的位置在顯示RHDO分類變化(即自存在單倍型劑量不均衡至不存在單倍型劑量不均衡或反之亦然)之第一RHDO區段內。Each white horizontal arrow represents a RHDO classification segment indicating the presence of haplotype dosage imbalance. The subsequent 4 RHDOs on the right side also indicate the presence of haplotype dosage imbalances in the DNA samples. It can be inferred that the position of the junction between regions with LOH and regions without LOH is the first to show a change in RHDO classification (i.e., from the presence of haplotype dosage imbalance to the absence of haplotype dosage imbalance or vice versa). In the RHDO section.
圖13顯示根據本發明之實施例,始於另一方向之RHDO分類。在圖13中,顯示自二個方向之RHDO分類。自始於左側之RHDO分析,可推斷具有LOH之區域與不具有LOH之區域間之接合部在顯示存在單倍型劑量不均衡之第一RHDO區段1310內。自始於右側之RHDO分析,可推斷接合部在指示不存在單倍型劑量不均衡之第一RHDO區段1320內。組合以兩個方向實施之RHDO分析之資訊,可推斷具有LOH之區域與不具有LOH之區域間之接合部的位置1330。Figure 13 shows RHDO classification starting from the other direction, according to an embodiment of the present invention. In Figure 13, RHDO classification from two directions is shown. From the RHDO analysis starting from the left, it can be deduced that the junction between regions with LOH and regions without LOH is within the
RHDO方法依賴於使用異型接合基因座。現在,二倍體有機體之染色體將具有一些差異,從而導致兩種單倍型,但異型接合基因座之數目可有所不同。一些個體可具有相對較少之異型接合基因座。本部分所述實施例亦可用於同型接合基因座,其中比較兩個區域且並非比較相同區域之兩種單倍型。因此,可獲得更多數據點,但根據與兩個不同染色體區域之比較可能存在一些缺陷。The RHDO approach relies on the use of heterozygous loci. Now, the chromosomes of a diploid organism will have some differences resulting in two haplotypes, but the number of heterozygous loci may differ. Some individuals may have relatively few heterozygous loci. The embodiments described in this section can also be applied to homozygous loci where two regions are compared and two haplotypes of the same region are not compared. Thus, more data points are available, but there may be some drawbacks based on the comparison with two different chromosomal regions.
在相對染色體區域劑量方法中,比較來自一個染色體區域之片段數(例如,如藉由對與該區域比對之經測序標籤計數所確定)與預期值(其可來自參照染色體區域或來自另一已知健康試樣中之相同區域)。以此方式,可對染色體區域之片段計數,無論經測序標籤來自哪種單倍型。因此,仍可使用不含有het之經測序標籤。為實施比較,實施例可將標籤計數正規化,然後進行比較。藉由至少兩個基因座(其彼此分開)來界定各區域,且該等基因座處之片段可用於獲得關於該區域之集合值。In the Relative Chromosomal Region Dose method, compares the number of fragments from a chromosome region(eg, as determined by counting the sequenced tags aligned to the region) and the expected value (which may be from a reference chromosomal region or from the same region in another known healthy sample). In this way, fragments of chromosomal regions can be counted regardless of which haplotype the sequenced tags come from. Therefore, sequenced tags that do not contain hets can still be used. To perform the comparison, an embodiment may normalize the label counts and then compare them. Each region is defined by at least two loci, which are separated from each other, and segments at these loci can be used to obtain an aggregate value for that region.
用於特定區域之經測序讀取物(標籤)的正規化值可藉由用與該區域比對之經測序讀取物數目除以可與全基因組比對之經測序讀取物總數來計算。此正規化標籤計數允許比較一個試樣之結果與另一試樣之結果。舉例而言,正規化值可為預期來自特定區域之經測序讀取物之比例(例如,百分比或分數),如上文所述。但可進行許多其他正規化,如熟習此項技術者會明瞭。舉例而言,可藉由用一個區域之計數數目除以參照區域(在上述情形下,參照區域即為全基因組)之計數數目來正規化。然後可比較此正規化標籤計數與閾值,該閾值可自一或多個不展現癌症之參照試樣確定。A normalized value for sequenced reads (tags) for a particular region can be calculated by dividing the number of sequenced reads that align to that region by the total number of sequenced reads that can align to the whole genome . This normalized tag count allows comparison of the results of one sample with the results of another sample. For example, a normalization value can be the proportion (eg, percentage or fraction) of sequenced reads expected to be from a particular region, as described above. But many other normalizations are possible, as will be apparent to those skilled in the art. For example, normalization can be done by dividing the number of counts in a region by the number of counts in a reference region (in the above case, the reference region is the whole genome). This normalized label count can then be compared to a threshold, which can be determined from one or more reference samples that do not exhibit cancer.
隨後比較該測試例之正規化標籤計數與一或多個參照個體(例如無癌症者)之正規化標籤計數。在一個實施例中,藉由計算該例之特定染色體區域之z-計分來進行比較。使用以下方程式計算z-計分:z-計分=(該例之正規化標籤計數-均值)/S.D.,其中「均值」係與參照試樣之特定染色體區域比對之均值正規化標籤計數;及S.D.係與參照試樣之特定區域比對之正規化標籤計數之數目的標準偏差。因此,z-計分係測試例之染色體區域之正規化標籤計數偏離一或多個參照個體之相同染色體區域之均值正規化標籤計數的標準偏差數。The normalized label count of the test case is then compared to the normalized label count of one or more reference individuals (eg, cancer free). In one embodiment, the comparison is performed by calculating a z-score for that particular chromosomal region. The z-score was calculated using the following equation: z-score = (normalized label count for this example - mean)/S.D., where "mean" is the mean normalized label count aligned to a specific chromosomal region of the reference sample; and S.D. is the standard deviation of the number of normalized label counts compared to a specific region of the reference sample. Thus, a z-score is the number of standard deviations by which the normalized label count for a chromosomal region of a test case deviates from the mean normalized label count for the same chromosomal region of one or more reference individuals.
在所測試有機體患有癌症之情況下,腫瘤組織中擴增之染色體區域會在血漿DNA中過度呈現。此會導致正z計分值。另一方面,腫瘤組織中缺失之染色體區域會在血漿DNA中呈現不足。此會導致負z計分值。z計分數值係由幾個因素決定。In the case of cancer in the tested organism, amplified chromosomal regions in tumor tissue are overrepresented in plasma DNA. This results in a positive z-score value. On the other hand, chromosomal regions deleted in tumor tissue are underrepresented in plasma DNA. This results in negative z-score values. The z-score value is determined by several factors.
一個因素係腫瘤源DNA在生物學試樣(例如血漿)中之分數濃度。腫瘤源DNA在試樣(例如血漿)中之分數濃度愈高,則測試例與參照例之正規化標籤計數間之差愈大。因此,會獲得較大z計分數值。One factor is the fractional concentration of tumor-derived DNA in a biological sample (eg, plasma). The higher the fractional concentration of tumor-derived DNA in the sample (such as plasma), the larger the difference between the normalized label counts of the test case and the reference case. Therefore, larger z-score values are obtained.
另一因素係在一或多個參照例中正規化標籤計數之差異。在測試例之生物學試樣(例如血漿)中染色體區域之過度呈現程度相同時,在參照組中正規化標籤計數之較小差異(即較小標準偏差)會導致較高z計分。類似地,在測試例之生物學試樣(例如血漿)中染色體區域之呈現不足程度相同時,在參照組中正規化標籤計數之較小標準偏差會導致較高之負z計分。Another factor is the difference in normalized label counts among one or more reference cases. Smaller differences (ie smaller standard deviations) in normalized label counts in the reference group result in higher z-scores at the same degree of overrepresentation of chromosomal regions in the biological sample (eg plasma) of the test case. Similarly, a smaller standard deviation of normalized label counts in the reference group will result in a higher negative z-score when the chromosomal region is underrepresented to the same degree in the biological sample (eg plasma) of the test case.
另一因素係腫瘤組織中之染色體變異數值。染色體變異數值係指特定染色體區域之拷貝數變化(增加或損失)。腫瘤組織中之拷貝數變化愈高,則特定染色體區域在血漿DNA中之過度呈現或呈現不足程度將愈高。舉例而言,喪失染色體之兩個拷貝會導致染色體區域在血漿DNA中之呈現不足大於喪失染色體之兩個拷貝中之一者之情形,且因此導致負性較高之z計分。通常,癌症中存在多種染色體變異。各癌症中之染色體變異可進一步在以下改變:其性質(即擴增或缺失)、其程度(單或多個拷貝增加或喪失)及其程度(在染色體長度上之變異大小)。Another factor is the number of chromosomal variations in tumor tissue. Chromosomal variation values refer to copy number changes (gains or losses) of specific chromosomal regions. The higher the copy number variation in tumor tissue, the higher will be the over- or under-representation of specific chromosomal regions in plasma DNA. For example, loss of both copies of a chromosome results in a region of the chromosome that is underrepresented in plasma DNA more than loss of one of the two copies of the chromosome, and thus results in a more negative z-score. Often, multiple chromosomal variations are present in cancer. Chromosomal variations in each cancer can further vary in their nature (ie, amplification or deletion), their extent (single or multiple copy gains or losses), and their extent (size of variation over chromosome length).
所分析分子之數目影響量測正規化標籤計數之精度。預期在分數濃度分別為約12.5%、6.3%及3.2%時,將需要分析15,000個、60,000個及240,000個分子來檢測具有一個拷貝變化(增加或喪失)之染色體變異。用於檢測癌症之不同染色體區域之標籤計數的其他細節闡述於頒予Lo等人之標題為「Diagnosing Fetal Chromosomal Aneuploidy Using Massively Parallel Genomic Sequencing」之美國專利公開案第2009/0029377號中,該案件之全部內容出於所有目的以引用方式併入本文中。The number of molecules analyzed affects the precision of measuring normalized label counts. It is expected that 15,000, 60,000, and 240,000 molecules will need to be analyzed to detect a chromosomal variation with one copy change (gain or loss) at fractional concentrations of about 12.5%, 6.3%, and 3.2%, respectively. useAdditional details of tag enumeration in detecting different chromosomal regions of cancer are described in U.S. Patent Publication No. 2009/0029377, entitled "Diagnosing Fetal Chromosomal Aneuploidy Using Massively Parallel Genomic Sequencing," to Lo et al., the entirety of which The contents are incorporated herein by reference for all purposes.
實施例亦可使用大小分析代替標籤計數方法。亦可使用大小分析代替正規化標籤計數。大小分析可使用如本文及美國專利申請案第12/940,992號中所提及之各種參數。舉例而言,可使用來自上文之Q或F值。此等大小值無需藉由來自其他區域之計數之正規化,此乃因該等值不會隨讀取物數目而縮放。單倍型特異性方法之技術亦可用於非特異性方法。舉例而言,可使用涉及區域之深度及精確定位之技術。在一些實施例中,可在比較兩個區域時考慮特定區域之GC偏誤。由於RHDO方法使用相同區域,因此無需此一校正。Embodiments may also use size analysis instead of tag counting methods. Size analysis can also be used instead of normalized label counts. Size analysis can use various parameters as mentioned herein and in US Patent Application Serial No. 12/940,992. For example, the Q or F values from above can be used. These size values do not need to be normalized by counts from other regions because the values do not scale with the number of reads. Techniques for haplotype-specific methods can also be used for non-specific methods. For example, techniques involving depth and precise positioning of regions may be used. In some embodiments, GC bias for a particular region may be considered when comparing two regions. Since the RHDO method uses the same region, this correction is not needed.
儘管某些癌症通常可以在特定染色體區域中具有變異之形式存在,但此等癌症不會總是僅存在於相同區域中。舉例而言,其他染色體區域可顯示變異,且此等其他區域之位置可能未知。此外,在篩選患者以鑑別癌症之早期階段時,可能期望鑑別寬範圍之癌症,其可顯示存在於整個基因組內之變異。為應對該等情況,實施例可以系統方式分析複數個區域以確定顯示變異之區域。可使用變異數及變異位置(例如其是否鄰接)基於展現變異之各區域之數目及位置來(例如)證實變異,確定癌症之階段,提供對癌症之診斷(例如若數目大於閾值)及提供預後。Although some cancers can often exist in the form of mutations in specific chromosomal regions, these cancers will not always be present only in the same regions. For example, other chromosomal regions may show variation, and the location of these other regions may not be known. Furthermore, when screening patients to identify early stages of cancer, it may be desirable to identify a wide range of cancers that may exhibit variations that exist throughout the genome. To address these situations, embodiments can systematically analyze multiple regions to identify regions that show variation. The number of variants and the position of the variant (eg, whether they are contiguous) can be used to, for example, confirm the variant, determine the stage of the cancer, provide a diagnosis of the cancer (eg, if the number is greater than a threshold), and provide a prognosis based on the number and position of each region exhibiting the variant .
因此,實施例可基於顯示變異之區域之數目來鑑別有機體是否患有癌症。因此,可測試複數個區域(例如,3000個)以鑑別展現變異之區域之數目。該等區域可涵蓋整個基因組或僅部分基因組,例如,非重複區域。Thus, embodiments can identify whether an organism has cancer based on the number of regions exhibiting variation. Therefore, a plurality of regions (e.g., 3000) can be tested to identify one of the regions exhibiting variationnumber. These regions may encompass the entire genome or only parts of the genome, eg, non-repeated regions.
圖14係根據本發明之實施例,使用複數個染色體區域分析有機體之生物學試樣之方法1400的流程圖。生物學試樣包括核酸分子(亦稱為片段)。14 is a flowchart of a
在步驟1410中,鑑別有機體之複數個非重疊染色體區域。每一染色體區域包括複數個基因座。如上文所提及,區域之大小可為1Mb,或某另一相等大小。然後整個基因組可包括約3,000個各具有預定大小及位置之區域。同樣,如上文所提及,可改變此等預定區域以適應特定染色體之長度或指定數目之欲用區域、及本文所提及任一其他標準。若區域具有不同長度,則此等長度可用於將結果正規化,例如,如本文所述。In
在步驟1420中,對於複數個核酸分子中之每一者而言,鑑別核酸分子在有機體之參照基因組中之位置。可以本文所提及任一方式確定位置,例如,藉由對片段測序以獲得經測序標籤及將經測序標籤與參照基因組比對。對於單倍型特異性方法而言,亦可確定分子之特定單倍型。In
對每一染色體區域實施步驟1430-1450。在步驟1430中,基於所鑑別位置將各別組核酸分子鑑別為來自染色體區域。各別組包括至少一個位於染色體區域之複數個基因座中每一者處之核酸分子。在一個實施例中,該組可為與染色體區域之特定單倍型比對之片段,例如,如上文RHDO方法中所述。在另一實施例中,該組可為與染色體區域比對之任一片段,如第IV部分中所述方法中所述。Steps 1430-1450 are performed for each chromosomal region. In
在步驟1440中,電腦系統計算各別組核酸分子之各別值。各別值界定各別組核酸分子之性質。各別值可為本文所提及任一值。舉例而言,該值可為組中之片段數或組中片段之大小分佈之統計值。各別值亦可為正規化值,例如,用區域之標籤計數除以試樣之標籤計數總數或參照區域之標籤計數之數目。各別值亦可為與另一值之差或比率(例如,在RHDO中),由此提供區域之差異之性質。In
在步驟1450中,比較各別值與參照值以確定第一染色體區域是否展現缺失或擴增之分類。此參照值可為本文所述任一閾值或參照值。舉例而言,參照值可為針對正常試樣確定之閾值。對於RHDO而言,各別值可為兩種單倍型之標籤計數之差或比率,且參照值可為用於確定存在統計學顯著偏差之閾值。作為另一實例,參照值可為另一單倍型或區域之標籤計數或大小值,且比較可包括獲得差或比率(或其函數)及隨後確定差或比率是否大於閾值。In
參照值可基於其他區域之結果而變化。舉例而言,若相鄰區域亦顯示偏差(儘管與一個閾值相比較小,例如,z計分為3),則可使用下限。舉例而言,若3個連續區域皆高於第一閾值,則較有可能為癌症。因此,此第一閾值可低於自非連續區域鑑別癌症所需之另一閾值。有3個(或3個以上)區域甚至具有小偏差可具有足夠低之偶然性效應之機率,該偶然性效應可維持靈敏度及特異性。Reference values may vary based on results from other regions. For example, if neighboring regions also show deviations (albeit small compared to a threshold, eg, a z-score of 3), a lower bound may be used. For example, if 3 consecutive regions are all higher than the first threshold, it is more likely to be cancer. Therefore, this first threshold may be lower than another threshold required to identify cancer from discontinuous regions. Having 3 (or more) regions with even a small bias can have a sufficiently low chance of a chance effect that sensitivity and specificity can be maintained.
在步驟1460中,確定分類為展現缺失或擴增之染色體區域之量。所計數染色體區域可具有限制。舉例而言,僅可對與至少一個另一區域鄰接之區域計數(或可能需要鄰接區域具有某一大小,例如,4個或更多個區域)。對於區域不相等之實施例而言,數目亦可為各別長度(例如,數目可為變異區域之總長度)。In
在步驟1470中,比較該量與閾值量以確定對試樣之分類。作為實例,分類可為有機體是否患有癌症、癌症之階段及癌症之預後。在一個實施例中,對全部變異區域計數且使用單一閾值,無論該等區域出現在何處。在另一實施例中,閾值可基於所計數區域之位置及大小而變化。舉例而言,可比較特定染色體或染色體臂上區域之量與該特定染色體(或臂)之閾值。可使用多個閾值。舉例而言,特定染色體(或臂)上變異區域之量必須大於第一閾值,且基因組中變異區域之總量必須大於第二閾值。In
區域量之此閾值亦可取決於所計數區域之不均衡強度。舉例而言,用作確定癌症分類之閾值之區域量可取決於用於檢測各區域中之變異之特異性及靈敏度(變異閾值)。舉例而言,若變異閾值為低(例如z計分為2),則可將閾值之量選擇為高(例如,150)。但若變異閾值為高(例如,z計分為3),則閾值之量可為較低(例如,50)。顯示變異之區域之量亦可為加權值,例如,一個顯示高不均衡之區域可經加權高於僅顯示微小不均衡之區域(即對於變異存在多於僅正及負之分類)。This threshold for the area quantity may also depend on the disproportionate strength of the area being counted. For example, the amount of regions used to determine a threshold for cancer classification can depend on the specificity and sensitivity used to detect variations in each region (variation threshold). For example, if the variation threshold is low (eg, a z-score of 2), then the threshold amount can be chosen to be high (eg, 150). But if the variation threshold is high (eg, a z-score of 3), then the threshold amount can be lower (eg, 50). The amount of regions showing variation can also be weighted, for example, a region showing high disequilibrium can be weighted higher than a region showing only slight disequilibrium (ie there are more classes than just positive and negative for variation).
因此,可使用顯示正規化標籤計數(或組之性質之另一各別值)之顯著過度呈現或呈現不足之染色體區域的量(其可包括數目及/或大小)來反映疾病之嚴重程度。具有變異正規化標籤計數之染色體區域之量可藉由兩個因素確定,即染色體變異在腫瘤組織中之數目(或大小)及腫瘤源DNA在生物學試樣(例如血漿)中之分數濃度。較晚期之癌症傾向於展現較多(及較大)染色體變異。因此,會在試樣(例如血漿)中可能檢測到較多與癌症有關之染色體變異。在患有較晚期之癌症之患者中,較高腫瘤負載會導致腫瘤源DNA在血漿中之較高分數濃度。因此,會較容易在血漿試樣中檢測到與腫瘤有關之染色體變異。Thus, the amount (which may include number and/or size) of significantly over- or under-represented chromosomal regions showing normalized tag counts (or another respective value of the nature of the group) can be used to reflect the severity of the disease. The amount of chromosomal regions with variant normalized label counts can be determined by two factors, the number (or size) of chromosomal variants in tumor tissue and the fractional concentration of tumor-derived DNA in a biological sample (eg, plasma). Cancers that are more advanced tend to exhibit more (and larger) chromosomal aberrations. Therefore, more chromosomal aberrations related to cancer may be detected in the sample (such as plasma). In patients with more advanced cancer, higher tumor burden results in a higher fractional concentration of tumor-derived DNA in plasma. Therefore, it will be easier to detect tumor-related chromosomal aberrations in plasma samples.
在癌症篩選或檢測之情況下,可使用展現正規化標籤計數(或另一值)過度呈現或呈現不足之染色體區域之量來確定測試個體患上癌症之可能性。使用±2(即z計分>2或<-2)之截止值時,預期約5%測試區域會僅因偶然性而產生顯著偏離對照個體之均值之z計分。當將全基因組劃分成1Mb區段時,全基因組會有約3,000個區段。因此,預期約150個區段會具有>2或<-2之z計分。In the case of cancer screening or detection, the amount of chromosomal regions exhibiting normalized signature count (or another value) over- or under-representation can be used to determine the likelihood that a test individual will develop cancersex. Using a cutoff of ±2 (ie, z-scores >2 or <-2), approximately 5% of the tested areas are expected to have z-scores that deviate significantly from the mean of control individuals solely by chance. When the whole genome is divided into 1 Mb segments, the whole genome will have approximately 3,000 segments. Therefore, approximately 150 segments are expected to have z-scores >2 or <-2.
因此,可使用用於z計分為>2或<-2之區段之數目之150的截止(閾值)值來確定是否存在癌症。用於具有變異z計分之區段之數目的其他截止值(例如,100、125、175、200、250及300)可經選擇以適合診斷目的。較低截止值(例如100)會達成較靈敏之測試,但特異性較低,且較高截止值會具有較高特異性,但靈敏度較低。可藉由增加z計分之截止值來減少假正性分類數。舉例而言,若將截止值增加至3,則僅0.3%區段會為假正性。在此情況下,可使用3個以上具有變異z計分之區段來指示癌症之存在。亦可選擇其他截止值,例如1、2、4、5、10、20及30,以適合不同診斷目的。然而,檢測與癌症有關之染色體變異之靈敏度會隨進行診斷所需變異區段數之增加而降低。Therefore, a cutoff (threshold) value of 150 for the number of segments with z-scores >2 or <-2 can be used to determine the presence or absence of cancer. Other cutoff values for the number of segments with variation z-scores (eg, 100, 125, 175, 200, 250, and 300) can be chosen as appropriate for diagnostic purposes. A lower cut-off value (eg, 100) will result in a more sensitive test but less specificity, and a higher cut-off value will have higher specificity but lower sensitivity. The number of false positive classifications can be reduced by increasing the z-score cutoff. For example, if the cutoff value is increased to 3, only 0.3% of the segments will be false positives. In this case, more than 3 bins with variable z-scores can be used to indicate the presence of cancer. Other cut-off values such as 1, 2, 4, 5, 10, 20 and 30 can also be chosen to suit different diagnostic purposes. However, the sensitivity of detecting chromosomal variations associated with cancer decreases as the number of mutated segments required for diagnosis increases.
一種可能改良靈敏度而不犧牲特異性之方法係考慮毗鄰染色體區段之結果。在一個實施例中,用於z計分之截止值仍為>2且<-2。然而,僅在兩個連續區段顯示相同類型之變異,例如兩個區段皆具有>2之z計分時,會將染色體區域分類為可能變異。若正規化標籤計數之偏差係隨機誤差,則具有兩個在相同方向上為假正性之連續區段之機率係0.125%(5%×5%/2)。另一方面,若染色體變異涵蓋兩個連續區段,較低截止值會使對該等區段在血漿試樣中之過度呈現或呈現不足之檢測較靈敏。由於正規化標籤計數(或另一值)與對照個體之均值之偏差並非歸因於隨機誤差,因此連續分類需要不會對靈敏度具有顯著不良效應。在其他實施例中,可使用較高截止值將相鄰區段之z計分相加在一起。舉例而言,可對3個連續區段之z計分求和且可使用5之截止值。此概念可延伸至3個以上連續區段。One way to potentially improve sensitivity without sacrificing specificity is to consider the results of adjacent chromosomal segments. In one embodiment, the cutoffs for z-scores are still >2 and <-2. However, a chromosomal region is classified as likely variant only when two consecutive segments show the same type of variation, eg, both segments have a z-score >2. If the bias in normalized label counts is random error, then the probability of having two consecutive segments that are false positives in the same direction is 0.125% (5% x 5%/2). On the other hand, if the chromosomal variation covers two consecutive segments, a lower cut-off value would result in a more sensitive detection of over- or under-representation of these segments in plasma samples. Since the deviation of normalized label counts (or another value) from the mean of control individuals is not due to random error, continuous classification need not have a significant adverse effect on sensitivity. in other realIn an embodiment, the z-scores of adjacent segments may be summed together using a higher cutoff value. For example, the z-scores for 3 consecutive segments can be summed and a cutoff of 5 can be used. This concept can be extended to more than 3 consecutive segments.
量與變異閾值之組合亦可取決於分析目的及對有機體之任何預先瞭解(或其缺乏)。舉例而言,若針對癌症篩選正常健康群體,則通常可能會在區域量(即區域數目之高閾值)及變異閾值(對於在將區域鑑別為具有變異時而言)二者上使用高特異性。但在具有較高風險之患者(例如受腫塊或家族病史、吸煙者、HPV病毒、肝炎病毒或其他病毒困擾之患者)中,閾值可能較低以具有較高靈敏度(較低假負性)。The combination of amount and threshold of variation can also depend on the purpose of the analysis and any prior knowledge (or lack thereof) of the organism. For example, if a normal healthy population is screened for cancer, it is often possible to use high specificity in both the region amount (i.e. a high threshold for the number of regions) and the variation threshold (for identifying a region as having a variation) . But in patients with higher risk (for example, patients with lumps or family history, smokers, HPV virus, hepatitis virus or other viruses), the threshold may be lower to have higher sensitivity (lower false negative).
在一個實施例中,若使用1-Mb解析度及6.3%腫瘤源DNA之較低檢測限來檢測染色體變異,則每一1-Mb區段中之所需分子數目將為60,000。對於全基因組而言,此可理解為約1億8千萬個(60,000個讀取物/Mb×3,000Mb)可比對讀取物。In one example, using 1-Mb resolution and a lower detection limit of 6.3% tumor-derived DNA to detect chromosomal aberrations, the number of molecules required in each 1-Mb segment would be 60,000. For a whole genome, this translates to approximately 180 million (60,000 reads/Mb x 3,000Mb) alignable reads.
圖15顯示表1500,其繪示根據本發明之實施例,不同區段數所需之深度及腫瘤源片段之分數濃度。1510欄提供來自試樣之腫瘤細胞之片段的濃度。濃度愈高,檢測變異愈容易,因此需要分析之分子數目愈少。1520欄提供每區段所需之估計分子數目,其可經由上文關於深度之部分中所述之方法來計算。Figure 15 shows a table 1500 depicting the required depth and fractional concentration of tumor-derived fragments for different numbers of segments, according to an embodiment of the present invention.
較小區段大小會使檢測較小染色體變異具有較高解析度。然而,此會增加對欲分析之分子總數之需要。較大區段大小會以降低解析度為代價減少分析所需分子數目。因此,僅可檢測到較大變異。在一實作中,可使用較大區域,可將顯示變異之區段細分且分析該等亞區以獲得較佳解析度(例如,如上文所述)。1530欄提供每一區段之大小。該值愈小,所用區域愈多。1540欄顯示全基因組中欲分析之分子數目。因此,若已作出估計(或欲檢測之最低濃度),則可確定欲分析之分子數目。Smaller segment sizes allow for higher resolution detection of small chromosomal variants. However, this increases the need for the total number of molecules to be analyzed. Larger segment sizes reduce the number of molecules required for analysis at the expense of resolution. Therefore, only large variants can be detected. In one implementation, larger regions can be used, segments showing variation can be subdivided and those subregions analyzed for better resolution (eg, as described above).
隨著腫瘤進展,腫瘤片段量將有所增加,此乃因腫瘤將釋放較多DNA片段(例如,因腫瘤生長、較多壞死或較高血管供應)。來自腫瘤組織之較多DNA片段進入血漿將增加血漿中之不均衡程度(例如,RHDO中兩種單倍型之間之標籤計數差將有所以增加)。另外,由於腫瘤片段數增加,因此可較容易地檢測存在變異之區域之數目。舉例而言,區域之腫瘤DNA之量可能過小而使得不能檢測變異,此乃因當腫瘤較小且釋放少量癌症DNA片段時,由於未分析足量片段而不能建立統計學顯著差異。較多片段甚至可在腫瘤較小時進行分析,但此可能需要大試樣(例如大量血漿)。As the tumor progresses, the amount of tumor fragments will increase because the tumor will release more DNA fragments (eg, due to tumor growth, more necrosis, or higher vascularity). More DNA fragments from tumor tissue entering the plasma will increase the degree of disequilibrium in the plasma (eg, the difference in tag counts between two haplotypes in RHDO will be increased). In addition, due to the increased number of tumor fragments, the number of regions where mutations exist can be detected more easily. For example, the amount of tumor DNA in a region may be too small to detect a variation because when tumors are small and shed few fragments of cancer DNA, not enough fragments were analyzed to establish a statistically significant difference. More fragments can be analyzed even when tumors are small, but this may require large samples (eg large amounts of plasma).
對癌症進展之追蹤可使用在一或多個區域中之變異量(例如,藉由不均衡或所需深度)或展現變異之染色體區域之量(數目及/或大小)。在一個實例中,若一個區域(或若干區域)之變異量之增加速度比其他區域之變異更快,則該(等)區域可用作較佳標記物來監測癌症。此增加可歸因於腫瘤較大且因此釋放許多片段及/或區域擴增多倍。亦可監測手術後之變異值(例如變異量或顯示變異之區域之數目或其組合)以證實已適當地移除腫瘤。Tracking of cancer progression can use the amount of variation in one or more regions (eg, by imbalance or desired depth) or the amount (number and/or size) of chromosomal regions exhibiting variation. In one example, a region (or regions) may be used as a better marker to monitor cancer if the amount of variation in the region (or regions) is increasing faster than in other regions. This increase can be attributed to tumors being larger and thus releasing many fragments and/or regions to be multifold expanded. Post-operative variation values (eg, amount of variation or number of regions exhibiting variation, or a combination thereof) can also be monitored to confirm that the tumor has been properly removed.
在該技術之各實作中,使用腫瘤DNA之分數濃度之確定值對癌症之進展進行分期、預測或監測。量測進展可提供關於癌症之當前階段及癌症生長或擴散之速度之資訊。癌症之「階段」係指以下中之全部或一些:腫瘤大小、組織學外觀、存在/不存在淋巴結侵犯及存在/不存在遠端轉移。對癌症之「預測」涉及估計疾病進展之幾率及/或自癌症存活之幾率。其亦可涉及對患者無臨床進展之時間或存活持續時間之估計。對癌症之「監測」會涉及檢查以觀察癌症是否已進展(例如大小已增加,淋巴結之侵犯已增加,或已擴散至遠端器官,即轉移)。監測亦可涉及檢查腫瘤是否已受治療控制。舉例而言,若治療有效,則可觀察到腫瘤大小之減小、轉移或淋巴結侵犯之消退、患者之一般健康狀況之改良(例如體重增加)。In various implementations of the technology, the determined value of the fractional concentration of tumor DNA is used to stage, predict or monitor the progression of cancer. Measuring progress can provide information about the current stage of the cancer and the rate at which the cancer is growing or spreading. "Stage" of cancer refers to all or some of the following: tumor size, histological appearance, presence/absence of lymph node invasion, and presence/absence of distant metastasis."Prediction" of cancer involves estimating the chance of disease progression and/or the chance of surviving cancer. It may also involve estimation of time to clinical progression free or duration of survival of a patient. "Surveillance" for cancer involves examinations to see if the cancer has progressed (such as increased in size, increased invasion of lymph nodes, or spread to distant organs, ie, metastasis). Monitoring can also involve checking to see whether the tumor is controlled by treatment. For example, if the treatment is effective, a reduction in tumor size, regression of metastasis or lymph node invasion, improvement in the general health of the patient (eg, weight gain) may be observed.
A.確定癌症DNA之分數濃度A. Determining the Fractional Concentration of Cancer DNA
一種追蹤一或多個區域之變異增加量之方式係確定(該)等區域之癌症DNA之分數濃度。然後可使用癌症DNA之分數濃度變化來隨時間追蹤腫瘤。可使用此追蹤來診斷,例如,第一量測可提供背景量(其可對應於一般變異程度)且稍後量測可觀察到將表明腫瘤生長(因此癌症)之變化。亦可使用癌症DNA之分數濃度變化來預測治療實施情況。在該技術之其他實作中,腫瘤DNA在血漿中之分數濃度之增加會指示患者之差預後或腫瘤負載之增加。One way to track the increased variation in one or more regions is to determine the fractional concentration of cancer DNA in (the) regions. Changes in the fractional concentration of cancer DNA can then be used to track tumors over time. This tracking can be used for diagnosis, for example, a first measurement can provide a background amount (which can correspond to a general degree of variation) and a later measurement can observe changes that would indicate tumor growth (and thus cancer). Changes in the fractional concentration of cancer DNA can also be used to predict treatment delivery. In other implementations of this technology, an increase in the fractional concentration of tumor DNA in plasma is indicative of a poor patient prognosis or an increase in tumor burden.
可以各種方式確定癌症DNA之分數濃度。舉例而言,一種單倍型與另一單倍型相比(或一個區域與另一區域相比)之標籤計數差。另一方法係觀察到統計學顯著差異前之深度(即分析片段數)。對於較早期實例,可使用單倍型劑量差藉由分析喪失異型接合性之染色體區域來確定腫瘤源DNA在生物學試樣(例如血漿)中之分數濃度。The fractional concentration of cancer DNA can be determined in various ways. For example, the difference in label counts of one haplotype compared to another (or one region compared to another). Another approach is the depth before a statistically significant difference is observed (ie, the number of fragments analyzed). For an earlier example, haplotype dose differences can be used to determine the fractional concentration of tumor-derived DNA in a biological sample (eg, plasma) by analyzing chromosomal regions that have lost heterozygosity.
已顯示,腫瘤源DNA之量與癌症患者之腫瘤負載正相關(Lo等人Cancer Res.1999;59:5452-5及Chan等人Clin Chem.2005;51:2192-5)。因此,可使用藉由RHDO分析連續監測腫瘤源DNA在生物學試樣(例如血漿試樣)中之分數濃度來監測患者之疾病進展。舉例而言,可使用監測治療後腫瘤源DNA在連續採集之試樣(例如血漿)中之分數濃度來確定治療之成功。The amount of tumor-derived DNA has been shown to positively correlate with tumor burden in cancer patients (Lo et al. Cancer Res. 1999;59:5452-5 and Chan et al. Clin Chem. 2005;51:2192-5). Therefore, continuous monitoring of the fractional concentration of tumor-derived DNA in biological samples (eg, plasma samples) by RHDO analysis can be used to monitor disease progression in patients. For example, monitoring and governance can be used toThe success of treatment is determined by the fractional concentration of tumor-derived DNA in serially collected samples (eg plasma) after treatment.
圖16顯示根據本發明之實施例,藉由RHDO分析量測腫瘤源DNA在血漿中之分數濃度之原理。確定兩種單倍型間之不均衡且可使用不均衡程度來確定腫瘤DNA在試樣中之分數濃度。FIG. 16 shows the principle of measuring the fractional concentration of tumor-derived DNA in plasma by RHDO analysis according to an embodiment of the present invention. The disequilibrium between the two haplotypes is determined and the degree of disequilibrium can be used to determine the fractional concentration of tumor DNA in the sample.
Hap I及Hap II代表非腫瘤組織中之兩種單倍型。腫瘤組織中之Hap II部分地缺失亞區1610。因此,血漿中檢測到之對應於缺失區域1610的與Hap II有關之片段係由非腫瘤組織貢獻。另一方面,腫瘤組織與非腫瘤組織二者中皆存在Hap I中之區域1610。因此,Hap I及Hap II之讀取物計數間之差將代表腫瘤源DNA在血漿中之量。Hap I and Hap II represent two haplotypes in non-neoplastic tissues.
腫瘤源DNA之分數濃度(F)可自受LOH影響之染色體區域之缺失及非缺失染色體的經測序讀取物(標籤)數使用以下方程式計算:F=(NHapI-NHapII)/NHapI×100%,其中NHapI係對應於位於LOH所影響染色體區域中之異型接合SNP之Hap I上之對偶基因的經測序讀取物數目;且NHapII係對應於位於LOH所影響染色體區域1610中之異型接合SNP之Hap II上之對偶基因的經測序讀取物數目。The fractional concentration (F) of tumor-derived DNA can be calculated from the number of sequenced reads (tags) of deleted and non-deleted chromosomes in chromosomal regions affected by LOH using the following equation: F=(NHapI- NHapII )/NHapI × 100%, where NHapI corresponds to the number of sequenced reads of the allele on Hap I of the heterozygous SNP located in the LOH-affected chromosomal region; and NHapII corresponds to the number of sequenced reads located in the LOH-affected
上式等效於將p定義為位於不包括缺失之染色體區域(Hap I)上之異型接合基因座的累積標籤計數且將q定義為包括缺失之染色體區域(Hap II)1610之累積標籤計數,其中將腫瘤DNA在試樣中之分數濃度(F)計算為F=1-q/p。對於圖11中繪示之實例而言,腫瘤DNA之分數濃度係14%(1-104/121)。The above formula is equivalent to defining p as the cumulative label count of heterozygous loci located on the chromosomal region not including the deletion (Hap I) and defining q as the cumulative label count of the chromosomal region including the deletion (Hap II) 1610, Wherein, the fractional concentration (F) of tumor DNA in the sample is calculated as F=1-q/p. For the example depicted in Figure 11, the fractional concentration of tumor DNA was 14% (1-104/121).
在腫瘤切除之前及之後採集腫瘤源DNA在HCC患者之血漿試樣中之分數濃度。在腫瘤切除之前,給定染色體區域之第一單倍型之NHapI係30,443,且染色體區域之第二單倍型之NHapII係16,221,其使得F為46.7%。在腫瘤切除之後,NHapI係31,534,NHapII係31,089,其使得F為1.4%。此監測顯示腫瘤切除係成功的。The fractional concentrations of tumor-derived DNA in plasma samples of HCC patients were collected before and after tumor resection. Before tumor resection, the N HapI line for the first haplotype of a given chromosomal region was 30,443, and the NHapII line for the second haplotype of the chromosomal region was16,221 , which resulted in an F of 46.7%. After tumor resection, NHapI lined 31,534 and NHapII lined 31,089, which resulted in an F of 1.4%. This monitoring showed that tumor resection was successful.
亦可使用循環DNA大小特徵之變化程度來確定分數濃度。在一實作中,可確定源自腫瘤組織與非腫瘤組織二者之血漿DNA之確切大小分佈,且隨後介於兩個已知分佈之間之量測大小分佈可提供分數濃度(例如使用腫瘤組織與非腫瘤組織之大小分佈之兩個統計值之間的線性模型)。另一選擇為,可使用對大小變化之連續監測。在一個態樣中,將大小分佈變化確定為與腫瘤DNA在血漿中之分數濃度成比例。Fractional concentrations can also be determined using the degree of change in circulating DNA size characteristics. In one implementation, the exact size distribution of plasma DNA originating from both tumor and non-tumor tissue can be determined, and then a measured size distribution between the two known distributions can provide fractional concentrations (e.g. using tumor Linear model between two statistics of the size distribution of tissue and non-neoplastic tissue). Alternatively, continuous monitoring of size changes can be used. In one aspect, the change in size distribution is determined to be proportional to the fractional concentration of tumor DNA in plasma.
亦可以類似方式使用不同區域間之差,即,上述非特異性單倍型檢測方法。在標籤計數方法中,可使用若干參數來監測疾病進展。舉例而言,可使用展現染色體變異之區域之z計分量值來反映腫瘤源DNA在生物學試樣(例如血漿)中之分數濃度。特定區域之過度呈現或呈現不足程度與腫瘤源DNA在試樣中之分數濃度及腫瘤組織中拷貝數變化之程度或數目成比例。Z計分量值係與對照個體相比特定染色體區域在試樣中之過度呈現或呈現不足程度之量度。因此,z計分量值可反映腫瘤DNA在試樣中之分數濃度及因此患者之腫瘤負載。Differences between different regions can also be used in a similar manner, ie, the non-specific haplotype detection method described above. In the tag count approach, several parameters can be used to monitor disease progression. For example, z-score values for regions exhibiting chromosomal variations can be used to reflect the fractional concentration of tumor-derived DNA in a biological sample such as plasma. The degree of over- or under-representation of a specific region is proportional to the fractional concentration of tumor-derived DNA in the sample and the degree or number of copy number changes in the tumor tissue. The Z-score value is a measure of the degree to which a particular chromosomal region is over- or under-represented in a sample compared to a control individual. Thus, the z-score value can reflect the fractional concentration of tumor DNA in the sample and thus the patient's tumor burden.
B.追蹤區域之數目B. Number of Tracking Areas
如上文所提及,可使用展現染色體變異之區域之數目來篩選癌症,且亦可使用其來進行監測及預測。作為實例,可使用監測來確定癌症之當前階段、是否已出現癌症及治療是否已起作用。隨著腫瘤進展,腫瘤之基因組組成會降格較多。為鑑別此持續降格,可使用追蹤區域(例如,1Mb之預先界定區域)之數目之方法來鑑別腫瘤之進展。處於癌症較晚期階段之腫瘤則會具有較多展現變異之區域。As mentioned above, the number of regions exhibiting chromosomal variations can be used to screen for cancer, and can also be used for monitoring and prediction. As an example, monitoring can be used to determine the current stage of cancer, whether cancer has developed, and whether treatment has worked. As the tumor progresses, the genome composition of the tumor will degrade more. To identify this persistent degradation, methods of tracking the number of regions (eg, a predefined region of 1 Mb) can be used to identify tumor progression. have a more advanced stage of cancerTumors with smaller tumors will have more regions exhibiting mutations.
C.方法c. method
圖17係繪示根據本發明之實施例,使用包括核酸分子之生物學試樣確定有機體中染色體變異之進展之方法的流程圖。在一個實施例中,至少一些核酸分子係無細胞的。作為實例,染色體變異可來自惡性腫瘤或癌變前病變。同樣,變異之增加可歸因於有機體隨時間而具有愈來愈多含有染色體變異之細胞,或歸因於有機體具有一定比例之每細胞含有增加量之變異之細胞。作為減少之實例,治療(例如手術或化學療法)可移除或減少與癌症有關之細胞。17 is a flowchart illustrating a method for determining the progression of chromosomal variation in an organism using a biological sample including nucleic acid molecules according to an embodiment of the present invention. In one embodiment, at least some of the nucleic acid molecules are cell-free. As an example, a chromosomal variation may be from a malignancy or a precancerous lesion. Likewise, an increase in variation may be due to an organism having, over time, more and more cells that contain a chromosomal variation, or to an organism having a proportion of cells that contain an increasing amount of variation per cell. As an example of reduction, treatment such as surgery or chemotherapy can remove or reduce cells associated with cancer.
在步驟1710中,鑑別有機體之一或多個非重疊染色體區域。每一染色體區域包括複數個基因座。可藉由任一適宜方法(例如,彼等本文所述者)來鑑別區域。In
針對複數個時刻中之每一者實施步驟1720-1750。每一時刻對應於自有機體獲得試樣之不同時刻。當前試樣係針對給定時段分析之試樣。舉例而言,可在6個月內每月獲得試樣,且可在獲得試樣後立即進行分析。另一選擇為,可在若干時段內進行若干次量測後進行分析。Steps 1720-1750 are performed for each of the plurality of time instants. Each time instant corresponds to a different time when the sample was obtained from the organism. The current sample is the sample analyzed for a given time period. For example, samples can be obtained monthly for 6 months and can be analyzed immediately after the samples are obtained. Alternatively, the analysis can be performed after taking several measurements over several time periods.
在步驟1720中,分析有機體之當前生物學試樣以鑑別核酸分子在有機體之參照基因組中之位置。可以本文所提及任一方式確定位置,例如,藉由對片段測序以獲得經測序標籤及將經測序標籤與參照基因組比對。對於單倍型特異性方法而言,亦可確定分子之特定單倍型。In
對一或多個染色體區域中之每一者實施步驟1730-1750。當使用複數個區域時,可使用第V部分之實施例。在步驟1730中,基於所鑑別位置將各別組核酸分子鑑別為來自染色體區域。各別組包括至少一個位於染色體區域之複數個基因座中每一者處之核酸分子。在一個實施例中,該組可為與染色體區域之特定單倍型比對之片段,例如,如上文RHDO方法中所述。在另一實施例中,該組可為與染色體區域比對之任一片段,如第IV部分中所述方法中所述。Steps 1730-1750 are performed for each of the one or more chromosomal regions. The embodiments of Section V can be used when multiple regions are used. In
在步驟1740中,電腦系統計算各別組核酸分子之各別值。各別值界定各別組核酸分子之性質。各別值可為本文所提及任一值。舉例而言,該值可為組中之片段數或組中片段之大小分佈之統計值。各別值亦可為正規化值,例如,將區域之標籤計數除以試樣之標籤計數總數或參照區域之標籤計數之數目。各別值亦可為與另一值(例如,RHDO中)之差或比率,由此提供區域之差之性質。In
在步驟1750中,比較各別值與參照值以確定第一染色體區域是否展現缺失或擴增之分類。此參照值可為本文所述任一閾值或參照值。舉例而言,參照值可為針對正常試樣確定之閾值。對於RHDO而言,各別值可為兩種單倍型之標籤計數之差或比率,且參照值可為用於確定存在統計學顯著偏差之閾值。作為另一實例,參照值可為另一單倍型或區域之標籤計數或大小值,且比較可包括獲得差或比率(或其函數)及隨後確定差或比率是否大於閾值。可根據任一適宜方法及標準確定參照值,例如,如本文所述。In
在步驟1760中,使用於複數個時刻對每一染色體區域之分類來確定有機體中染色體變異之進展。可使用進展來確定有機體是否患有癌症、癌症之階段及癌症之預後。該等確定中之每一者可涉及癌症分類,如本文所述。In
可以各種方式實施此癌症分類。舉例而言,可對變異區域之量計數且與閾值比較。對區域之分類可為數值(例如,腫瘤濃度,其中各別值及參照值為不同單倍型或不同區域之值)且可確定濃度變化。可比較濃度變化與閾值以確定已發生顯著增加,由此發出存在腫瘤之信號。This cancer classification can be implemented in various ways. For example, the amount of variable regions can be countedAnd compared with the threshold. Classification of regions can be numerical (eg, tumor concentration, where individual and reference values are different haplotypes or values of different regions) and concentration changes can be determined. The change in concentration can be compared to a threshold to determine that a significant increase has occurred, thereby signaling the presence of a tumor.
A.使用SPRT之RHDOA. RHDO using SPRT
在此部分中,顯示對肝細胞癌(HCC)患者使用相對單倍型劑量(RHDO)分析且使用SPRT之實例。在此患者之腫瘤組織中,觀察到兩個染色體4中一者之缺失。此導致染色體4上SNP之異型接合性之喪失。在對此患者進行單倍型分析時,分析該患者、其妻子及其兒子之基因組DNA且確定3名個體之基因型。然後自患者之基因型導出其組成型單倍型。實施大規模平行測序且鑑別對應於染色體4之兩種單倍型SNP之對偶基因的經測序讀取物並計數。In this section, an example using relative haplotype dose (RHDO) analysis on hepatocellular carcinoma (HCC) patients and using SPRT is shown. In the tumor tissue of this patient, a deletion of one of two
RHDO及SPRT之方程式及原理已闡述於上文中。在一個實施例中,當兩種單倍型中之一者擴增或缺失時,RHDO分析經程式化以檢測(例如)DNA試樣中單倍型劑量之10%之差,其對應於存在10%腫瘤源DNA。在其他實施例中,RHDO分析之靈敏度可經設定以檢測DNA試樣中之2%、5%、15%、20%、25%、30%、40%及50%等之腫瘤源DNA。可在用於計算SPRT分類曲線之上限及下限之參數中調節RHDO分析之靈敏度。可調節參數可為期望檢測限值(例如應可檢測之腫瘤濃度百分比,其影響所分析分子數目)及分類用閾值,例如,使用優勢比(一種單倍型之標籤計數相對於另一單倍型之標籤計數之比率)。The equations and principles of RHDO and SPRT have been described above. In one embodiment, RHDO analysis is programmed to detect, for example, a 10% difference in haplotype dosage in a DNA sample when one of the two haplotypes is amplified or deleted, which corresponds to the presence of 10% tumor-derived DNA. In other embodiments, the sensitivity of the RHDO assay can be set to detect 2%, 5%, 15%, 20%, 25%, 30%, 40%, and 50%, etc., of tumor-derived DNA in a DNA sample. The sensitivity of the RHDO analysis can be adjusted in the parameters used to calculate the upper and lower limits of the SPRT classification curve. Tunable parameters may be desired detection limits (e.g. percentage of tumor concentration that should be detectable, which affects the number of molecules analyzed) and thresholds for classification, e.g. using odds ratios (signature counts for one haplotype over another haplotype) ratio of label counts of the type).
在此RHDO分析中,虛無假設係,染色體4之兩種單倍型以相同劑量存在。備擇假設係,生物學試樣(例如血漿)中兩種單倍型之劑量相差10%以上。根據兩種假設以統計學方式比較具有對應於兩種單倍型之SNP對偶基因之經測序讀取物數目,作為來自不同SNP累積之數據。當累積數據足以確定兩種單倍型劑量以相等量存在或在統計學上相差至少10%時,作出SPRT分類。染色體4之q臂上之典型SPRT分類區塊顯示於圖18A中。此處僅出於闡釋目的使用10%之閾值。亦可檢測其他差異程度(例如0.1%、1%、2%、5%、15%或20%)。一般而言,期望檢測之差異程度愈低,需要分析之DNA分子愈多。相反地,期望檢測之差異程度愈大,需要分析且仍達成統計學顯著結果之DNA分子數目愈少。在進行此分析時,將優勢比用於SPRT,但可使用其他參數,例如z計分或p-值。In this RHDO analysis, the null hypothesis was that both haplotypes of
在HCC患者於診斷時獲得之此血漿試樣中,染色體4之p臂及q臂分別存在76個及148個成功RHDO分類。全部RHDO分類指示於診斷時獲得之血漿試樣中存在單倍型劑量不均衡。作為比較,亦分析患者於手術切除腫瘤後獲得之血漿試樣,如圖18B中所顯示。對於治療後試樣而言,染色體4之p臂及q臂分別存在4個及9個成功RHDO分類。全部4個RHDO分類皆指示血漿試樣中沒有>10%之可觀察單倍型劑量不均衡。在染色體4q之9個RHDO分類中,7指示不存在單倍型劑量不均衡且2指示存在不均衡。在腫瘤切除後,顯示>10%之劑量不均衡之RHDO區塊數已顯著降低,從而指示治療後試樣與治療前試樣相比,顯示>10%之劑量不均衡之染色體區域的大小顯著更小。該等結果表明在手術切除腫瘤後腫瘤DNA在血漿中之分數濃度已有所降低。In this plasma sample obtained from HCC patients at diagnosis, there were 76 and 148 successful RHDO classifications for the p-arm and q-arm of
當與非單倍型特異性方法比較時,RHDO分析可提供腫瘤DNA之分數濃度之較精確估計且尤其可用於監測疾病進展。因此,預期具有疾病進展之情形會展現腫瘤DNA在血漿中之分數濃度之增加;而具有穩定疾病之情形或彼等腫瘤大小已消退或減小者之腫瘤DNA在血漿中之分數濃度會有所降低。When compared to non-haplotype-specific methods, RHDO analysis can provide a more precise estimate of the fractional concentration of tumor DNA and is especially useful for monitoring disease progression. Thus, cases with progressive disease are expected to exhibit an increase in the fractional concentration of tumor DNA in plasma; whereas cases with stable diseaseThe fractional concentration of tumor DNA in plasma will be reduced in the case of patients with tumors or those whose tumor size has regressed or decreased.
B.靶向分析B. Targeted Analysis
在所選實施例中,DNA片段之通用測序可依照靶富集方法實施。此一方法在本文中亦稱作富集靶測序。此一方法之一個實施例係使用溶液內捕獲系統(例如Agilent SureSelect系統、Illumina TruSeq Custom富集套組(illumina.com/applications/sequencing/targeted_resequencing.ilmn)或藉由MyGenostics GenCap Custom富集系統(mygenostics.com/))或基於微陣列之捕獲系統(例如Roche NimbleGene系統)預先選擇片段。儘管可捕獲一些其他區域,但優先捕獲某些區域。此等方法可允許以較多深度(例如,可利用數位PCR對較多片段進行測序或分析)及/或以較低成本分析此等區域。較大深度可增加區域中之靈敏度。可基於片段大小及甲基化模式實施其他富集方法。In selected embodiments, universal sequencing of DNA fragments can be performed following target enrichment methods. This approach is also referred to herein as enriched target sequencing. One example of such a method is to use an in-solution capture system such as the Agilent SureSelect system, the Illumina TruSeq Custom enrichment kit (illumina.com/applications/sequencing/targeted_resequencing.ilmn) or via the MyGenostics GenCap Custom enrichment system (mygenostics .com/)) or microarray-based capture systems (such as the Roche NimbleGene system) to pre-select fragments. Certain areas are preferentially captured, although some other areas can be captured. Such methods can allow analysis of these regions at greater depth (eg, more fragments can be sequenced or analyzed using digital PCR) and/or at lower cost. Greater depths can increase sensitivity in the region. Other enrichment methods can be implemented based on fragment size and methylation pattern.
因此,以全基因組方式分析DNA試樣之替代方式係靶向所關注檢測常見染色體變異之區域。靶向方法可潛在地改良此方法之成本有效性,此乃因分析過程將主要集中於可能存在染色體變異之區域或具有將尤其為特定腫瘤類型之特性之變化的區域、或彼等具有將在臨床上尤其重要之變化之區域。後一者之實例包括會於特定癌症類型之腫瘤形成中早期發生之變化(例如存在1q及8q之擴增及8q之缺失係HCC之早期染色體變化-van Malenstein等人Eur J Cancer 2011;47:1789-97);或與好或差預後有關之變化(例如,在腫瘤進展期間觀察到6q及17q處之增加、及6p及9p處之喪失,且18q、8p及17p處存在LOH與結腸直腸癌患者之較差存活有關-Westra等人Clin Colorectal Cancer 2004;4:252-9);或可預測治療反應之變化(例如7p處存在增加可預測具有表皮生長因子受體突變之患者之對酷胺酸激酶抑制劑之反應-Yuan等人J ClinOncol 2011;29:3435-42)。癌症中改變之基因組區域之其他實例可參見許多在線數據庫(例如the Cancer Genome Anatomy Project database(cgap.nci.nih.gov/Chromosomes/RecurrentAberrataions)及the Atlas of Genetics and Cytogenetics in Oncology and Haematology(atlasgeneticsoncology.org//Tumors/Tumorliste.html))。相反,在非靶向全基因組方法中,將以與具有可能變異之區域相同之程度分析不可能發生染色體變異之區域。Therefore, an alternative way to analyze DNA samples in a genome-wide fashion is to target regions of interest to detect common chromosomal variations. A targeted approach can potentially improve the cost-effectiveness of this approach, since the analysis process will focus primarily on regions where chromosomal aberrations are likely to be present or have changes that will be particularly characteristic of a particular tumor type, or which will be in Areas of especially clinically important changes. Examples of the latter include changes that occur early in neoplasia in certain cancer types (eg presence of amplifications of 1q and 8q and loss of 8q are early chromosomal changes in HCC - van Malenstein et al Eur J Cancer 2011; 47: 1789-97); or changes associated with good or poor prognosis (for example, gains at 6q and 17q, and losses at 6p and 9p were observed during tumor progression, and LOH and colorectal Poor survival of cancer patients -Westra et al. Clin Colorectal Cancer 2004;4:252-9); or may predict response to treatmentChanges (eg, the presence of an increase at 7p predicts response to amide acid kinase inhibitors in patients with epidermal growth factor receptor mutations - Yuan et al. J Clin Oncol 2011; 29:3435-42). Additional examples of genomic regions altered in cancer can be found in the many online databases such as the Cancer Genome Anatomy Project database (cgap.nci.nih.gov/Chromosomes/RecurrentAberrataions) and the Atlas of Genetics and Cytogenetics in Oncology and Haematology (atlasgeneticsoncology.org //Tumors/Tumorliste.html)). In contrast, in an untargeted genome-wide approach, regions unlikely to undergo chromosomal variation will be analyzed to the same extent as regions with likely variation.
已應用靶富集策略來分析3名HCC患者及4名健康對照個體之血漿試樣。使用來自Agilent之SureSelect捕獲系統實施靶富集(Gnirke等人Nat.Biotechnol 2009.27:182-9)。選擇SureSelect系統作為可能之靶富集技術之實例。亦可使用其他溶液相(IlluminaTruSeq Custom富集系統)或固相(例如Roche-Nimblegen系統)靶捕獲系統及基於擴增子之靶富集系統(例如QuantaLife系統及RainDance系統)。捕獲探針經設計位於在HCC中通常及很少顯示變異之染色體區域上。在靶捕獲後,然後在IlluminaGAIIx分析儀上藉由流動池之一個泳道對每一DNA試樣測序。使用很少出現擴增及缺失之區域作為參照來與較常出現擴增及缺失之區域比較。The target enrichment strategy has been applied to analyze plasma samples of 3 HCC patients and 4 healthy control individuals. Target enrichment was performed using the SureSelect capture system from Agilent (Gnirke et al. Nat. Biotechnol 2009. 27: 182-9). The SureSelect system was chosen as an example of a possible target enrichment technique. Other solution phase (Illumina TruSeq Custom Enrichment System) or solid phase (eg Roche-Nimblegen system) target capture systems and amplicon based target enrichment systems (eg QuantaLife system and RainDance system) can also be used. Capture probes were designed to be located on chromosomal regions that commonly and rarely show variation in HCC. After target capture, each DNA sample was then sequenced by one lane of the flow cell on the Illumina GAIIx analyzer. Regions with rare amplifications and deletions were used as references for comparison to regions with more frequent amplifications and deletions.
在圖19中,顯示HCC中發現之常見染色體變異(圖改編自Wong等人(Am J Pathol 1999;154:37-43))。染色體表意圖(chromosome ideogram)之右側線代表染色體增加且左側線代表個別患者試樣之染色體喪失。粗線代表高度增加。長方形代表靶捕獲探針之位置。In Figure 19, common chromosomal variations found in HCC are shown (figure adapted from Wong et al. (
靶向標籤計數分析Targeted tag count analysis
在檢測染色體變異時,首先計算具有可能變異之區域及參照區域之正規化標籤計數。然後針對該等區域之GC含量校正正規化標籤計數,如先前由Chen等人(PLoS One 2011;6:e21791)所述。在當前實例中,選擇染色體8之p臂作為可能變異區域且選擇染色體9之q臂作為參照區域。使用Affymetrix SNP6.0陣列來分析3名HCC患者之腫瘤組織之染色體變異。對於3名患者而言,8p及9q在腫瘤組織中之染色體劑量變化顯示於下文中。HCC 013患者之8p有所喪失且9q無變化。HCC 027患者之8p有所增加且9q無變化。HCC 023患者之8p有所喪失且9q無變化。When detecting chromosomal variation, the normalized label counts of the region with possible variation and the reference region are first calculated. Normalized label counts were then corrected for the GC content of these regions as previously described by Chen et al. (PLoS One 2011; 6:e21791). In the current example, the p arm of
然後使用靶向分析計算3名HCC患者及4名健康對照個體之chr 8p與9q間之正規化標籤計數的比率。圖20A顯示HCC患者及健康患者之正規化標籤計數比率之結果。對於HCC 013情形及HCC 023情形而言,觀察到減小之8p與9q間之正規化標籤計數比率。此與腫瘤組織中染色體8p之喪失的發現一致。對於HCC 027情形而言,觀察到增加之比率且與此情形之腫瘤組織中染色體8p之增加一致。虛線代表具有4個正常情形之均值之兩個標準偏差之區域。Targeted analysis was then used to calculate the ratio of normalized tag counts between chr 8p and 9q for 3 HCC patients and 4 healthy control individuals. Figure 20A shows the results of normalized tag count ratios for HCC patients and healthy patients. For the
靶向大小分析Target size analysis
在先前部分中,闡述藉由確定血漿DNA片段在癌症患者中之大小特徵來檢測與癌症有關之改變的原理。亦可利用靶富集方法來檢測大小改變。對於3個HCC情形(HCC 013、HCC 027及HCC 023)而言,在將經測序讀取物與參照人類基因組比對後確定各測序DNA片段之大小。自兩個末端之最外核苷酸之坐標推斷測序DNA片段之大小。在其他實施例中,將對全DNA片段測序且然後可自測序長度直接確定片段大小。比較與染色體8p比對之DNA片段之大小分佈與與染色體9q比對之DNA片段之大小分佈。在檢測兩群DNA之大小分佈之差異時,首先確定當前實例中各群之短於150bp之DNA片段之比例。在其他實施例中,可使用其他大小截止值,例如80bp、110bp、100bp、110bp、120bp、130bp、140bp、160bp及170bp。然後將△Q值確定為兩個比例之差。△Q=Q8p-Q9q,其中Q8p係與染色體8p比對之短於150bp之DNA片段的比例;且Q9q係與染色體9q比對之短於150bp之DNA片段的比例。In the previous section, the rationale for detecting cancer-associated alterations by characterizing the size of plasma DNA fragments in cancer patients was described. Size changes can also be detected using target enrichment methods. For 3 HCC cases (
由於DNA片段之較短大小分佈會使短於截止值(即在當前實例中為150bp)之DNA之比例值較高,因此較高(正性較高)△F值將代表相對於彼等與染色體9q比對者與染色體8p比對之DNA片段之較短分佈。相反,較小(或負性較高)結果將指示相對於彼等與染色體9q比對者與染色體8p比對之DNA片段之較長大小分佈。Since a shorter size distribution of DNA fragments would result in a higher value for the proportion of DNA shorter than the cutoff (i.e. 150bp in the current example), higher (more positive) ΔF values would represent relative Shorter distribution of DNA fragments aligned to chromosome 9q versus chromosome 8p. Conversely, smaller (or more negative) results would indicate a longer size distribution of DNA fragments that align to chromosome 8p relative to those that align to chromosome 9q.
圖20B顯示在靶富集及大規模平行測序後,3名HCC患者及4名健康對照個體之大小分析之結果。4名健康對照個體之△Q之正值指示,與染色體8p比對之DNA片段之大小分佈略短於彼等與染色體9q比對者。虛線代表在兩個相對於4名對照個體之均值之標準偏差內之△Q區間。HCC 013情形及HCC 023情形之△Q值比對照個體之均值低超過兩個標準偏差。該兩種情形在腫瘤組織中缺失染色體8p。對於此染色體區域而言,腫瘤中缺失8p會導致腫瘤源DNA對血漿之貢獻減少。由於循環中之腫瘤源DNA短於源自非腫瘤組織之DNA,因此此會導致與染色體8p比對之血漿DNA片段明顯較長之大小分佈。此與該兩種情形中較低(負性較高)之△Q值一致。相反,8p在HCC 027情形中之擴增會導致與此區域比對之DNA片段明顯較少短之分佈。因此,將認為較高比例之與8p比對之血漿DNA片段較短。此與以下觀察一致:HCC 027之△Q值比健康對照個體之正性更高。Figure 20B shows the results of size analysis of 3 HCC patients and 4 healthy control individuals after target enrichment and massively parallel sequencing. Positive values for ΔQ in the 4 healthy control individuals indicated that the size distribution of DNA fragments aligned to chromosome 8p was slightly shorter than those aligned to chromosome 9q. Dashed lines represent ΔQ intervals within two standard deviations from the mean of 4 control individuals. The ΔQ values for the
C.多個用於檢測腫瘤源染色體變異之區域C. Multiple regions for detection of tumor-derived chromosomal variations
通常在腫瘤組織中檢測到染色體變異,包括某些染色體區域之缺失及擴增。在不同類型之癌症中觀察到染色體變異之特徵性模式。此處,使用若干實例來闡釋用於檢測癌症患者之血漿中該等與癌症有關之染色體變異的不同方法。吾人之方法亦可用於篩選癌症及監測疾病進展及對治療之反應。分析來自一名HCC患者及兩名鼻咽癌(NPC)患者之試樣。對於HCC患者而言,在手術切除腫瘤之前及之後採集靜脈血樣。對於兩名NPC患者而言,在診斷時採集靜脈血樣。另外,分析一名慢性肝炎B攜帶者及一名在血漿中具有可檢測艾伯斯坦-巴爾(Epstein-Barr)病毒DNA之個體之血漿試樣。該兩名個體未患有任何癌症。Chromosomal alterations, including deletions and amplifications of certain chromosomal regions, are often detected in tumor tissue. Characteristic patterns of chromosomal alterations are observed in different types of cancer. Here, several examples are used to illustrate different methods for detecting such cancer-associated chromosomal variations in the plasma of cancer patients. Our method can also be used to screen for cancer and monitor disease progression and response to treatment. Samples from one HCC patient and two nasopharyngeal carcinoma (NPC) patients were analyzed. For HCC patients, venous blood samples were collected before and after surgical resection of the tumor. For two NPC patients, venous blood samples were collected at diagnosis. In addition, plasma samples from a chronic hepatitis B carrier and an individual with detectable Epstein-Barr virus DNA in the plasma were analyzed. These two individuals did not suffer from any cancer.
利用微陣列分析來實施對腫瘤源染色體變異之檢測。具體而言,使用Affymetrix SNP6.0微陣列系統來分析自HCC患者之血細胞及腫瘤試樣提取之DNA。使用Affymetrix Genotyping Console v4.0來確定血細胞及腫瘤組織之基因型。使用Birdseed v2算法來確定包括增加及缺失在內之染色體變異,該算法基於SNP之不同對偶基因之強度及微陣列上之拷貝數差異(CNV)探針。The detection of tumor-derived chromosomal variation is implemented using microarray analysis. Specifically, the Affymetrix SNP6.0 microarray system was used to analyze DNA extracted from blood cells and tumor samples of HCC patients. Affymetrix Genotyping Console v4.0 was used to determine the genotype of blood cells and tumor tissues. Chromosomal variations, including gains and deletions, were determined using the Birdseed v2 algorithm, which is based on the strength of the different alleles of the SNPs and copy number difference (CNV) probes on the microarray.
基於計數之分析count-based analysis
為在血漿中實施經測序標籤計數分析,自各個體採集10毫升靜脈血。對於各血樣而言,在離心試樣後分離血漿。使用QIAmp血液微型套組(blood mini Kit)(Qiagen)自4-6mL血漿提取DNA。如先前所述(Lo YMD.Sci Transl Med 2010,2:61ra91)構築血漿DNA文庫,且隨後使用Illumina基因組分析儀平臺實施大規模平行測序。實施對血漿DNA分子之末端配對測序。對各分子之兩個末端中每一者之50bp測序,因此每分子總共為100bp。使用SOAP2程式(soap.genomics.org.cn/)將各序列之兩個末端與非重複遮蔽人類基因組(自UCSCgenome.ucsc.edu下載之Hg18 NCBI.36)比對(Li R等人Bioinformatics 2009,25:1966-7)。To perform sequenced tag count analysis in plasma, 10 ml of venous blood was collected from each individual. For each blood sample, plasma was separated after centrifugation of the sample. DNA was extracted from 4-6 mL plasma using the QIAmp blood mini Kit (Qiagen). Plasma DNA libraries were constructed as previously described (Lo YMD. Sci Transl Med 2010, 2:61ra91) and subsequently massively parallel sequenced using the Illumina Genome Analyzer platform. Paired-end sequencing of plasma DNA molecules was performed. 50 bp of each of the two ends of each molecule were sequenced, so each moleculeA total of 100bp. Use the SOAP2 program (soap.genomics.org.cn/) to align the two ends of each sequence with the non-repeated masked human genome (Hg18 NCBI.36 downloaded from UCSCgenome.ucsc.edu) (Li R et al. Bioinformatics 2009, 25:1966-7).
然後將基因組劃分成多個1百萬鹼基(1-Mb)區段且確定與各1-Mb區段比對之經測序讀取物數目。然後根據各庫(bin)之GC含量利用基於局部加權散點平滑(LOESS)回歸之算法來校正各庫之標籤計數(Chen E等人PLoS One 2011,6:e21791)。此校正旨在將因不同基因組區段間之GC含量差所產生與測序有關之定量偏誤最小化。上文所提及成1-Mb區段之劃分用於闡釋目的。亦可使用其他區段大小,例如2Mb、10Mb、25Mb或50Mb等。一般而言,亦可基於特定患者中特定腫瘤之基因組特性及特定類型之腫瘤來選擇區段大小。此外,若對於(例如)單分子測序技術(例如Helicos系統(www.helicosbio.com)或Pacific Biosciences單分子即時系統(www.pacificbiosciences.com))而言,測序方法可顯示具有低GC偏誤,則可略去GC校正步驟。The genome is then partitioned into 1 million base (1-Mb) segments and the number of sequenced reads aligned to each 1-Mb segment is determined. The tag counts of each bin were then corrected according to the GC content of each bin using an algorithm based on locally weighted scatter smoothing (LOESS) regression (Chen E et al. PLoS One 2011, 6: e21791). This correction is intended to minimize sequencing-related quantification errors due to differences in GC content between different genomic segments. The division into 1-Mb segments mentioned above is for illustration purposes. Other segment sizes may also be used, such as 2Mb, 10Mb, 25Mb, or 50Mb, etc. In general, segment sizes can also be selected based on the genomic properties of a particular tumor in a particular patient and the particular type of tumor. Furthermore, if the sequencing method can be shown to have low GC bias for, for example, single-molecule sequencing technologies such as the Helicos system (www.helicosbio.com) or the Pacific Biosciences single-molecule real-time system (www.pacificbiosciences.com), Then the GC calibration step can be omitted.
在先前研究中,已對來自未患有癌症之個體之57個血漿試樣測序。該等血漿測序結果用於確定各1-Mb區段之標籤計數之參照範圍。對於各1-Mb區段而言,確定57名個體之標籤計數之均值及標準偏差。然後,將研究個體之結果表示為z計分,如使用以下方程式所計算:z計分=(該情形之經測序標籤數-均值)/S.D,其中「均值」係與參照試樣之特定1-Mb區段比對之經測序標籤之均值數;且S.D.係與參照試樣之特定1-Mb區段比對之經測序標籤數之標準偏差。In a previous study, 57 plasma samples from individuals without cancer were sequenced. These plasma sequencing results were used to determine a reference range for tag counts for each 1-Mb segment. For each 1-Mb segment, the mean and standard deviation of tag counts for 57 individuals were determined. The results for the individual study individuals were then expressed as z-scores, as calculated using the following equation: z-score = (number of sequenced tags for that case - mean)/S.D, where "mean" is the specific 1 for the reference sample - the mean number of sequenced tags aligned to a Mb segment; and S.D. is the standard deviation of the number of sequenced tags aligned to a particular 1-Mb segment of a reference sample.
圖21-24顯示4名研究個體之經測序標籤計數分析結果。1-MB區段顯示於曲線邊緣。人類染色體數及表意圖(最外環)係呈順時針方向之定向pter-qter(著絲粒係以黃色顯示)。在圖21中,內環2101顯示變異(缺失或擴增)區域,如自分析腫瘤所確定。內環2101顯示具有5個量表。量表係-2(最內線)至+2(最外線)。-2之值代表對應區域喪失兩個染色體拷貝。-1之值代表喪失兩個染色體拷貝中之一者。0之值代表無染色體增加或喪失。+1之值代表增加一個染色體拷貝且+2代表增加兩個染色體拷貝。Figures 21-24 show the results of the sequenced tag count analysis for the 4 study individuals. 1-MB segments are shown at the edge of the curve. The number of human chromosomes and the map (the outermost ring) are oriented in a clockwise directionpter-qter (centromere lines are shown in yellow). In Figure 21, the
中環2102顯示血漿分析結果。如可發現,結果反映內環。中環2102係較多量表線,但進展相同。外環2103顯示來自分析治療後血漿之數據點,且該等數據點係灰色(證實無過度/呈現不足-無變異)。The
經測序標籤在血漿中過度呈現之染色體區域(z計分>3)係由綠色點2110代表。經測序標籤在血漿中呈現不足之區域(z計分<-3)由紅色點2120代表。血漿中未檢測到顯著染色體變異之區域(z計分介於-3與3之間)係由灰色點代表。藉由計數總數將過度/呈現不足正規化。對於在測序前進行擴增而言,正規化可考慮GC偏誤。Chromosomal regions (z-score >3) with sequenced tags overrepresented in plasma are represented by
圖21顯示HCC患者之Circos圖,其繪示根據本發明之實施例,來自血漿DNA之經測序標籤計數之數據。自內至外之跡線:藉由微陣列分析檢測到之腫瘤組織之染色體變異(紅色及綠色分別代表缺失及擴增);在手術切除腫瘤前及切除後1個月獲得之血漿試樣之z計分分析。在腫瘤切除前,血漿中檢測到之染色體變異與彼等藉由微陣列分析在腫瘤組織中所鑑別者密切相關。在腫瘤切除後,血漿中大多數與癌症有關之染色體變異消失。該等數據反映此一方法對於監測疾病進展及治療效果之價值。Figure 21 shows a Circos plot of HCC patients depicting data of sequenced tag counts from plasma DNA according to an embodiment of the present invention. Traces from inside to outside: chromosomal aberrations in tumor tissue detected by microarray analysis (red and green represent deletion and amplification, respectively); plasma samples obtained before surgical resection and 1 month after resection z-score analysis. Before tumor resection, chromosomal alterations detected in plasma correlated closely with those identified in tumor tissue by microarray analysis. After tumor resection, most cancer-associated chromosomal alterations disappear in plasma. These data reflect the value of this method for monitoring disease progression and treatment efficacy.
圖22顯示根據本發明之實施例,無HCC之慢性HBV攜帶者之血漿試樣之經測序標籤計數分析。與HCC患者(圖21)相反,在此患者之血漿中未檢測到與癌症有關之染色體變異。該等數據反映該方法用於癌症篩選、診斷及監測之價值。Figure 22 shows the sequenced tag count analysis of plasma samples of chronic HBV carriers without HCC according to an embodiment of the present invention. In contrast to HCC patients (Figure 21), no cancer-associated chromosomal aberrations were detected in the plasma of this patient. These data reflect that the method is useful for cancer screening, diagnosisThe value of judgment and monitoring.
圖23顯示根據本發明之實施例,對患有階段3 NPC之患者之血漿試樣的經測序標籤計數分析。在治療前獲得之血漿試樣中檢測到染色體變異。具體而言,在染色體1、3、7、9及14中鑑別出顯著變異。Figure 23 shows the sequenced tag count analysis of plasma samples from patients with
圖24顯示根據本發明之實施例,對患有階段4 NPC之患者之血漿試樣的經測序標籤計數分析。在治療前獲得之血漿試樣中檢測到染色體變異。當與患有階段3疾病之患者(圖23)比較時,檢測到較多染色體變異。經測序標籤計數亦偏離對照之均值較多,即z計分偏離0較多(正或負)。與對照相比增加之染色體變異數及更高之經測序標籤計數偏差度反映在較晚期階段之疾病中更顯著程度之基因組改變,且因此反映此一方法用於對癌症進行分期、預測及監測之價值。Figure 24 shows the analysis of sequenced tag counts on plasma samples of patients with
基於大小之分析size-based analysis
在先前研究中,已顯示,源自腫瘤組織之DNA之大小分佈短於彼等源自非腫瘤組織者之大小分佈(Diehl F等人Proc Natl Acad Sci USA 2005,102(45):16368-73)。在先前部分中,已概述藉由對血漿DNA之大小分析檢測血漿單倍型不均衡之方法。此處,使用HCC患者之測序數據來進一步闡釋此方法。In previous studies, it has been shown that the size distribution of DNA derived from tumor tissue is shorter than that of those derived from non-tumor tissue (Diehl F et al. Proc Natl Acad Sci USA 2005, 102(45): 16368-73 ). In the previous section, a method for detecting plasma haplotype imbalances by size analysis of plasma DNA was outlined. Here, the method is further illustrated using sequencing data from HCC patients.
出於闡釋目的,鑑別兩個區域進行大小分析。在一個區域(染色體1(chr1);座標:159、935、347至167、219、158)中,在腫瘤組織中檢測到兩條同源染色體中之一者倍增。在另一區域(染色體10(chr10);座標:100、137、050至101、907、356)中,在腫瘤組織中檢測到兩條同源染色體中一者之缺失(即LOH)。除確定測序片段所來自之單倍型外,亦使用參照基因組中測序片段之最外核苷酸之坐標以生物資訊方式確定測序片段之大小。然後,確定來自兩種單倍型中每一者之片段之大小分佈。For illustrative purposes, two regions were identified for size analysis. In one region (chromosome 1 (chrl); coordinates: 159, 935, 347 to 167, 219, 158), a doubling of one of two homologous chromosomes was detected in tumor tissue. In another region (chromosome 10 (chrlO); coordinates: 100, 137, 050 to 101, 907, 356), a deletion of one of the two homologous chromosomes (ie LOH) was detected in tumor tissue. In addition to determining the haplotype from which the sequenced fragments are derived, the coordinates of the outermost nucleotides of the sequenced fragments in the reference genome are also used to bioinformatically determine the identity of the sequenced fragments.size. Then, the size distribution of fragments from each of the two haplotypes was determined.
對於Chr10之LOH區域而言,腫瘤組織中缺失一種單倍型(缺失單倍型)。因此,與此缺失單倍型比對之全部血漿DNA片段皆源自非癌症組織。另一方面,與腫瘤組織中不缺失之單倍型(非缺失單倍型)比對之片段可源自腫瘤組織或非腫瘤組織。由於腫瘤源DNA之大小分佈較短,因此會預期來自非缺失單倍型之片段與彼等來自缺失單倍型者相比大小分佈更短。可藉由繪製片段之累積頻率對DNA片段之大小之曲線來確定兩種大小分佈之差異。具有更短大小分佈之DNA群會具有更豐富之短DNA且因此在大小譜之短末端處累積頻率增加更快。For the LOH region of Chr10, one haplotype is missing in tumor tissue (deletion haplotype). Therefore, all plasma DNA fragments aligned to this deletion haplotype were derived from non-cancerous tissues. On the other hand, fragments aligned to haplotypes that are not deleted in tumor tissue (non-deletion haplotypes) can be derived from tumor tissue or non-tumor tissue. Due to the shorter size distribution of tumor-derived DNA, fragments from non-deletion haplotypes would be expected to have a shorter size distribution than those from deletion haplotypes. The difference between the two size distributions can be determined by plotting the cumulative frequency of fragments versus the size of the DNA fragments. DNA populations with a shorter size distribution will have more abundant short DNA and thus a faster increase in cumulative frequency at the short end of the size spectrum.
圖25顯示根據本發明之實施例,血漿DNA之累積頻率對腫瘤組織中展現LOH之區域之大小之曲線。X軸係片段以鹼基對表示之大小。Y軸係大小低於X軸上之值之片段之百分比。與來自缺失單倍型之序列相比,來自非缺失單倍型之序列在低於170bp之大小下具有更快增加及更高累積頻率。此指示來自非缺失單倍型之短DNA片段更豐富。此因來自非缺失單倍型之短腫瘤源DNA之貢獻而與上文預測一致。FIG. 25 shows a plot of the accumulation frequency of plasma DNA versus the size of the region exhibiting LOH in tumor tissue according to an embodiment of the present invention. Size of fragments in base pairs on the X-axis. The percentage of fragments whose size on the Y axis is lower than the value on the X axis. Sequences from non-deletion haplotypes had a faster increase and higher cumulative frequency at sizes below 170 bp than sequences from deletion haplotypes. This indicates that short DNA fragments from non-deletion haplotypes are more abundant. This is consistent with the prediction above due to the contribution of short tumor-derived DNA from the non-deletion haplotype.
在一個實施例中,大小分佈之差異可量化為兩群DNA分子之累積頻率之差。將△Q定義為該兩群之累積頻率之差。△Q=Q非缺失-Q缺失,其中Q非缺失代表來自非缺失單倍型之測序DNA片段之累積頻率;且Q缺失代表來自缺失單倍型之測序DNA片段之累積頻率。In one embodiment, the difference in size distribution can be quantified as the difference in cumulative frequency of two populations of DNA molecules. Define ΔQ as the difference between the cumulative frequencies of the two groups. ΔQ=Qnondeletion−Qdeletion , whereQnondeletion represents the cumulative frequency of sequenced DNA fragments from non-deletion haplotypes; andQdeletion represents the cumulative frequency of sequenced DNA fragments from deletion haplotypes.
圖26顯示對於LOH區域,△Q對經測序血漿DNA之大小。根據本發明之實施例,在130bp之大小下,△Q達到0.2。此指示使用130bp作為截止值用於上文方程式中來界定短DNA係最佳的。使用此截止值時,與來自缺失單倍型之群相比,來自非缺失單倍型之群之短DNA分子之豐度高20%。然後可比較此百分比差(或以類似方式導出之值)與得自未患有癌症之個體之閾值。Figure 26 shows ΔQ versus the size of sequenced plasma DNA for the LOH region. According to the embodiment of the present invention, at a size of 130 bp, ΔQ reaches 0.2. This indicates that short DNA lines are best defined using 130bp as the cutoff value used in the above equation. When using this cutoff, the abundance of short DNA molecules is high from the population of the non-deleted haplotype compared to the population from the deleted
對於具有染色體擴增之區域而言,在腫瘤組織中一種單倍型倍增(擴增單倍型)。由於額外量之來自此擴增單倍型之短腫瘤源DNA分子會釋放至血漿中,因此來自擴增單倍型之片段之大小分佈會短於來自非擴增單倍型之片段之大小分佈。與LOH情形類似,可藉由繪製片段之累積頻率對DNA片段之大小之曲線來確定大小分佈之差異。具有更短大小分佈之DNA群會具有更豐富之短DNA且因此在大小譜之短末端處累積頻率增加更快。For regions with chromosomal amplification, one haplotype multiplies in tumor tissue (amplified haplotype). Due to the additional amount of short tumor-derived DNA molecules from this amplified haplotype released into plasma, the size distribution of fragments from the amplified haplotype will be shorter than the size distribution of fragments from the non-amplified haplotype . Similar to the LOH case, differences in size distribution can be determined by plotting the cumulative frequency of fragments versus the size of DNA fragments. DNA populations with a shorter size distribution will have more abundant short DNA and thus a faster increase in cumulative frequency at the short end of the size spectrum.
圖27顯示根據本發明之實施例,血漿DNA之累積頻率對腫瘤組織中具有染色體倍增之區域之大小之曲線。與來自非擴增單倍型之序列相比,來自擴增單倍型之序列在低於170bp之大小下具有更快增加及更高累積頻率。此指示來自擴增單倍型之短DNA片段更豐富。此與下文所示之預測一致,此乃因較大量之短腫瘤源DNA源自擴增單倍型。Figure 27 shows a plot of the accumulation frequency of plasma DNA versus the size of regions with chromosome doubling in tumor tissues according to an embodiment of the present invention. Sequences from amplified haplotypes had a faster increase and higher cumulative frequency at sizes below 170 bp than sequences from non-amplified haplotypes. This indicates that short DNA fragments from amplified haplotypes are more abundant. This is consistent with the prediction shown below, since a larger amount of short tumor-derived DNA is derived from the amplified haplotype.
與LOH情形類似,大小分佈之差異可量化為兩群DNA分子之累積頻率之差。將△Q定義為該兩群之累積頻率之差。Similar to the LOH case, the difference in size distribution can be quantified as the difference in the cumulative frequency of two populations of DNA molecules. Define ΔQ as the difference between the cumulative frequencies of the two groups.
△Q=Q擴增-Q非擴增,其中Q擴增代表來自擴增單倍型之測序DNA片段之累積頻率;且Q非擴增代表來自非擴增單倍型之測序DNA片段之累積頻率。△Q=Qamplified -Qunamplified , where Qamplified represents the cumulative frequency of sequenced DNA fragments from amplified haplotypes; and Qunamplified represents the accumulation of sequenced DNA fragments from non-amplified haplotypes frequency.
圖28顯示根據本發明之實施例,對於擴增區域,△Q對經測序血漿DNA之大小。根據本發明之實施例,在126bp之大小下,△Q達到0.08。此指示使用126bp作為截止值來界定短DNA時,與來自非擴增單倍型之群相比,來自擴增單倍型之群之短DNA分子之豐度高8%。Figure 28 shows ΔQ versus the size of sequenced plasma DNA for the amplified region according to an embodiment of the present invention. According to the embodiment of the present invention, at a size of 126 bp, ΔQ reaches 0.08. This indicates that short DNA molecules are 8% more abundant from the population of amplified haplotypes compared to the population from non-amplified haplotypes when using 126 bp as a cutoff value to define short DNA.
D.其他技術D. Other technologies
在其他實施例中,可使用序列特異性技術。舉例而言,寡核苷酸可經設計以與特定區域之片段雜交。然後可以與經測序標籤計數類似之方式對寡核苷酸計數。此方法可用於展現特定變異之癌症。In other embodiments, sequence-specific techniques may be used. For example, oligonucleotides can be designed to hybridize to specific regions of fragments. Oligonucleotides can then be counted in a similar manner to counting by sequenced tags. This method can be used for cancers exhibiting specific mutations.
本文所提及任一電腦系統皆可利用任一適宜數目之子系統。此等子系統之實例顯示於圖29中之電腦裝置900中。在一些實施例中,電腦系統包括單一電腦裝置,其中子系統可為電腦裝置之組件。在其他實施例中,電腦系統可包括多個具有內部組件之電腦裝置,各裝置為子系統。Any suitable number of subsystems may be utilized by any computer system mentioned herein. An example of these subsystems is shown in computer device 900 in FIG. 29 . In some embodiments, a computer system includes a single computer device, where a subsystem may be a component of a computer device. In other embodiments, a computer system may include multiple computer devices with internal components, each device being a subsystem.
顯示於圖29中之子系統經由系統匯流排2975互連。顯示其他子系統,例如列印機2974、鍵盤2978、固定磁碟2979、監視器2976(其耦聯至顯示適配器2982)及其他。可藉由任一數目之業內已知構件(例如串聯埠2977)將耦聯至I/O控制器2971之周邊設備及輸入/輸出(I/O)器件連接至電腦系統。舉例而言,可使用串聯埠2977或外部介面2981(例如乙太網路、Wi-Fi等)將電腦系統2900連接至廣域網路(例如網際網路)、鼠標輸入器件或掃描儀。經由系統匯流排2975之互連使中央處理器2973與各子系統通信並控制來自系統記憶體2972或固定磁碟2979之指令之執行、以及子系統間之資訊交換。系統記憶體2972及/或固定磁碟2979可體現電腦可讀取媒體。本文所提及任一值皆可自一個組件輸出至另一組件且可輸出至使用者。The subsystems shown in FIG. 29 are interconnected via
電腦系統可包括例如藉由外部介面2981或藉由內部介面連接在一起之複數個相同組件或子系統。在一些實施例中,電腦系統、子系統或裝置可經由網路通信。在此等情形下,可將一台電腦視為用戶端且將另一電腦視為伺服器,其中每一者可為相同電腦系統之一部分。用戶端及伺服器各自可包括多個系統、子系統或組件。A computer system may include a plurality of identical components or subsystems connected together, eg, by
應理解,可使用硬體及/或使用電腦軟體以控制邏輯形式以模組或整合方式來實作本發明之任一實施例。基於本文所提供之揭示及教示內容,熟習此項技術者應認識並瞭解使用硬體及硬體與軟體之組合實作本發明實施例之其他方式及/或方法。It should be understood that any embodiment of the present invention may be implemented in a modular or integrated manner by using hardware and/or using computer software in the form of control logic. Based on the disclosures and teachings provided herein, those skilled in the art should recognize and understand other ways and/or methods of implementing the embodiments of the present invention using hardware and combinations of hardware and software.
本申請案中所述之任一軟體組件或功能皆可以欲藉由處理器執行之軟體程式碼形式實作,其中使用任一適宜電腦語言(例如,Java、C++或Perl)且使用(例如)習用或物件導向技術。軟體程式碼可以一系列指令或命令之形式儲存於用於儲存及/或傳輸之電腦可讀取媒體上,適宜媒體包括隨機存取記憶體(RAM)、唯讀記憶體(ROM)、磁性媒體(例如硬碟或軟碟)或光學媒體(例如光碟(CD)或DVD(數位多功能碟))、快閃記憶體及諸如此類。電腦可讀取媒體可為此等儲存或傳輸器件之任一組合。Any software component or function described in this application can be implemented in the form of software code to be executed by a processor, using any suitable computer language (e.g., Java, C++, or Perl) and using, for example, Conventional or object-oriented techniques. Software code can be stored in the form of a series of instructions or commands on a computer-readable medium for storage and/or transmission. Suitable media include random access memory (RAM), read-only memory (ROM), magnetic media (such as hard disk or floppy disk) or optical media (such as compact disk (CD) or DVD (digital versatile disk)), flash memory and the like. The computer readable medium can be any combination of these storage or transmission devices.
此等程式亦可經編碼並使用適於經由遵循多種協議之有線網路、光纖網路及/或無線網路(包括網際網路)傳輸之載波信號傳輸。因此,本發明之實施例之電腦可讀取媒體可使用經此等程式編碼之數據信號產生。經程式碼編碼之電腦可讀取媒體可與相容器件封裝在一起或與其他器件分開提供(例如,經由網際網路下載)。任一此類電腦可讀取媒體皆可駐留於單一電腦程式產品(例如硬蝶、CD或整個電腦系統)之上或之內,且可存在於系統或網路內不同電腦程式產品之上或之內。電腦系統可包括監視器、列印機或用於將本文所提及任一結果提供給使用者之另一適宜顯示器。The programs may also be coded and transmitted using carrier signals suitable for transmission over wired, optical and/or wireless networks (including the Internet) following various protocols. Therefore, the computer-readable medium of the embodiments of the present invention can be generated using such program-encoded data signals. The computer-readable medium encoded with the program code can be packaged with a compatible device or provided separately from other devices (eg, via Internet download). Any such computer-readable medium may reside on or within a single computer program product (such as a hard drive, CD, or entire computer system), and may reside on or within different computer program products within a system or network. within. A computer system may include a monitor, printer or another suitable display for providing any of the results mentioned herein to a user.
本文所述任一方法皆可利用可經組態以實施該等步驟之電腦系統(包括處理器)來完全地或部分地實施。因此,實施例可係關於經組態以實施本文所述任一方法之步驟之電腦系統,可能其中不同組件實施各別步驟或各別組之步驟。儘管以編號步驟提供,但本文方法之步驟可同時或以不同順序實施。另外,該等步驟之部分可與來自其他方法之其他步驟之部分一起使用。同樣,步驟之全部或部分可係可選的。另外,任一方法之任一步驟皆可利用模組、電路或用於實施該等步驟之其他構件來實施。Any of the methods described herein can be implemented in whole or in part using a computer system (including a processor) that can be configured to perform the steps. Thus, embodiments may relate to computer systems configured to perform the steps of any of the methods described herein, possibly in which different components perform the respective steps orSteps for each group. Although presented as numbered steps, the steps of the methods herein may be performed simultaneously or in a different order. Additionally, portions of these steps may be used with portions of other steps from other methods. Also, all or some of the steps may be optional. In addition, any step of any method may be implemented by using a module, a circuit, or other means for implementing the steps.
特定實施例之具體細節可以任一適宜方式組合,此並不背離本發明實施例之精神及範圍。然而,本發明之其他實施例可係關於與各個別態樣或該等個別態樣之具體組合有關之具體實施例。Specific details of particular embodiments may be combined in any suitable manner without departing from the spirit and scope of embodiments of the invention. However, other embodiments of the invention may relate to specific embodiments relating to individual aspects or specific combinations of such individual aspects.
已出於闡釋及說明目的提供上文對本發明實例性實施例之說明。並不意欲進行窮盡列舉或將本發明限於所述確切形式,且可根據上文教示內容進行許多修改及改變。該等實施例經選擇及闡述以最佳地解釋本發明之原理及其實際應用,藉以使其他熟習此項技術者能夠以適合於所構想特定應用之各種實施例形式及各種修改來最佳地利用本發明。The foregoing description of example embodiments of the present invention has been presented for purposes of illustration and description. It is not intended to be exhaustive or to limit the invention to the precise form described, and many modifications and changes are possible in light of the above teaching. The embodiments were chosen and described in order to best explain the principles of the invention and its practical application, thereby to enable others skilled in the art to best utilize it in various embodiment forms and with various modifications as are suited to the particular use contemplated. Take advantage of the present invention.
除非明確指明相反情況,否則所列舉「一(a,an)」或「該」意欲指「一或多者」。上文所提及之所有專利、專利申請案、出版物及說明皆出於所有目的以全文引用方式併入本文中。不承認任一者為先前技術。The recitation of "a, an" or "the" is intended to mean "one or more" unless expressly stated to the contrary. All patents, patent applications, publications, and descriptions mentioned above are hereby incorporated by reference in their entirety for all purposes. Neither is admitted as prior art.
Claims (24)
Translated fromChineseApplications Claiming Priority (4)
| Application Number | Priority Date | Filing Date | Title |
|---|---|---|---|
| US41839110P | 2010-11-30 | 2010-11-30 | |
| US61/418,391 | 2010-11-30 | ||
| US201161529877P | 2011-08-31 | 2011-08-31 | |
| US61/529,877 | 2011-08-31 |
Publications (2)
| Publication Number | Publication Date |
|---|---|
| TW202132572A TW202132572A (en) | 2021-09-01 |
| TWI786520Btrue TWI786520B (en) | 2022-12-11 |
Family
ID=46171096
Family Applications (5)
| Application Number | Title | Priority Date | Filing Date |
|---|---|---|---|
| TW100144098ATWI532843B (en) | 2010-11-30 | 2011-11-30 | Detection of genetic or molecular variants associated with cancer |
| TW110101988ATWI786520B (en) | 2010-11-30 | 2011-11-30 | Detection of genetic or molecular aberrations associated with cancer |
| TW111126139ATW202242133A (en) | 2010-11-30 | 2011-11-30 | Detection of genetic or molecular aberrations associated with cancer |
| TW105102252ATWI642786B (en) | 2010-11-30 | 2011-11-30 | Detection of genetic or molecular variants associated with cancer |
| TW107129009ATWI719339B (en) | 2010-11-30 | 2011-11-30 | Detection of genetic or molecular aberrations associated with cancer |
Family Applications Before (1)
| Application Number | Title | Priority Date | Filing Date |
|---|---|---|---|
| TW100144098ATWI532843B (en) | 2010-11-30 | 2011-11-30 | Detection of genetic or molecular variants associated with cancer |
Family Applications After (3)
| Application Number | Title | Priority Date | Filing Date |
|---|---|---|---|
| TW111126139ATW202242133A (en) | 2010-11-30 | 2011-11-30 | Detection of genetic or molecular aberrations associated with cancer |
| TW105102252ATWI642786B (en) | 2010-11-30 | 2011-11-30 | Detection of genetic or molecular variants associated with cancer |
| TW107129009ATWI719339B (en) | 2010-11-30 | 2011-11-30 | Detection of genetic or molecular aberrations associated with cancer |
Country Status (18)
| Country | Link |
|---|---|
| US (4) | US8741811B2 (en) |
| EP (4) | EP4269623A3 (en) |
| JP (5) | JP6196157B2 (en) |
| KR (6) | KR101891847B1 (en) |
| CN (4) | CN108899091B (en) |
| AU (1) | AU2011335891B2 (en) |
| BR (1) | BR112013013421A2 (en) |
| CA (1) | CA2817370C (en) |
| DK (2) | DK2646579T3 (en) |
| EA (1) | EA038374B1 (en) |
| IL (3) | IL226272A (en) |
| MX (3) | MX349568B (en) |
| MY (1) | MY169852A (en) |
| NZ (1) | NZ611599A (en) |
| SG (3) | SG190344A1 (en) |
| TW (5) | TWI532843B (en) |
| WO (1) | WO2012071621A1 (en) |
| ZA (1) | ZA201304625B (en) |
Families Citing this family (150)
| Publication number | Priority date | Publication date | Assignee | Title |
|---|---|---|---|---|
| US9424392B2 (en) | 2005-11-26 | 2016-08-23 | Natera, Inc. | System and method for cleaning noisy genetic data from target individuals using genetic data from genetically related individuals |
| US11111544B2 (en) | 2005-07-29 | 2021-09-07 | Natera, Inc. | System and method for cleaning noisy genetic data and determining chromosome copy number |
| US10083273B2 (en) | 2005-07-29 | 2018-09-25 | Natera, Inc. | System and method for cleaning noisy genetic data and determining chromosome copy number |
| US10081839B2 (en) | 2005-07-29 | 2018-09-25 | Natera, Inc | System and method for cleaning noisy genetic data and determining chromosome copy number |
| US11111543B2 (en) | 2005-07-29 | 2021-09-07 | Natera, Inc. | System and method for cleaning noisy genetic data and determining chromosome copy number |
| SI2514842T1 (en) | 2007-07-23 | 2016-06-30 | The Chinese University Of Hong Kong Office of Research and Knowledge Transfer Services | Diagnosing fetal chromosomal aneuploidy using genomic sequencing |
| ES2620431T3 (en) | 2008-08-04 | 2017-06-28 | Natera, Inc. | Methods for the determination of alleles and ploidy |
| US20120185176A1 (en) | 2009-09-30 | 2012-07-19 | Natera, Inc. | Methods for Non-Invasive Prenatal Ploidy Calling |
| US9260745B2 (en) | 2010-01-19 | 2016-02-16 | Verinata Health, Inc. | Detecting and classifying copy number variation |
| WO2011091063A1 (en) | 2010-01-19 | 2011-07-28 | Verinata Health, Inc. | Partition defined detection methods |
| US20120100548A1 (en) | 2010-10-26 | 2012-04-26 | Verinata Health, Inc. | Method for determining copy number variations |
| US20120010085A1 (en) | 2010-01-19 | 2012-01-12 | Rava Richard P | Methods for determining fraction of fetal nucleic acids in maternal samples |
| PL3492601T3 (en) | 2010-01-19 | 2022-05-23 | Verinata Health, Inc. | Novel protocol for preparing sequencing libraries |
| US10388403B2 (en) | 2010-01-19 | 2019-08-20 | Verinata Health, Inc. | Analyzing copy number variation in the detection of cancer |
| US9323888B2 (en) | 2010-01-19 | 2016-04-26 | Verinata Health, Inc. | Detecting and classifying copy number variation |
| CA2786564A1 (en) | 2010-01-19 | 2011-07-28 | Verinata Health, Inc. | Identification of polymorphic sequences in mixtures of genomic dna by whole genome sequencing |
| US11339429B2 (en) | 2010-05-18 | 2022-05-24 | Natera, Inc. | Methods for non-invasive prenatal ploidy calling |
| US9677118B2 (en) | 2014-04-21 | 2017-06-13 | Natera, Inc. | Methods for simultaneous amplification of target loci |
| US11322224B2 (en) | 2010-05-18 | 2022-05-03 | Natera, Inc. | Methods for non-invasive prenatal ploidy calling |
| US12152275B2 (en) | 2010-05-18 | 2024-11-26 | Natera, Inc. | Methods for non-invasive prenatal ploidy calling |
| US11326208B2 (en) | 2010-05-18 | 2022-05-10 | Natera, Inc. | Methods for nested PCR amplification of cell-free DNA |
| US10017812B2 (en) | 2010-05-18 | 2018-07-10 | Natera, Inc. | Methods for non-invasive prenatal ploidy calling |
| US20190010543A1 (en) | 2010-05-18 | 2019-01-10 | Natera, Inc. | Methods for simultaneous amplification of target loci |
| US11332785B2 (en) | 2010-05-18 | 2022-05-17 | Natera, Inc. | Methods for non-invasive prenatal ploidy calling |
| US12221653B2 (en) | 2010-05-18 | 2025-02-11 | Natera, Inc. | Methods for simultaneous amplification of target loci |
| US10316362B2 (en) | 2010-05-18 | 2019-06-11 | Natera, Inc. | Methods for simultaneous amplification of target loci |
| EP2854057B1 (en) | 2010-05-18 | 2018-03-07 | Natera, Inc. | Methods for non-invasive pre-natal ploidy calling |
| US11408031B2 (en) | 2010-05-18 | 2022-08-09 | Natera, Inc. | Methods for non-invasive prenatal paternity testing |
| US11332793B2 (en) | 2010-05-18 | 2022-05-17 | Natera, Inc. | Methods for simultaneous amplification of target loci |
| US11939634B2 (en) | 2010-05-18 | 2024-03-26 | Natera, Inc. | Methods for simultaneous amplification of target loci |
| KR101891847B1 (en) | 2010-11-30 | 2018-08-24 | 더 차이니즈 유니버시티 오브 홍콩 | Detection of genetic or molecular aberrations associated with cancer |
| AU2011348100B2 (en) | 2010-12-22 | 2016-08-25 | Natera, Inc. | Methods for non-invasive prenatal paternity testing |
| WO2012109500A2 (en) | 2011-02-09 | 2012-08-16 | Bio-Rad Laboratories, Inc. | Analysis of nucleic acids |
| ES2692333T3 (en) | 2011-04-12 | 2018-12-03 | Verinata Health, Inc | Resolution of genome fractions using polymorphism count |
| CN110016499B (en) | 2011-04-15 | 2023-11-14 | 约翰·霍普金斯大学 | Safe sequencing system |
| US9411937B2 (en) | 2011-04-15 | 2016-08-09 | Verinata Health, Inc. | Detecting and classifying copy number variation |
| WO2013131021A1 (en) | 2012-03-02 | 2013-09-06 | Sequenom Inc. | Methods and processes for non-invasive assessment of genetic variations |
| US9892230B2 (en) | 2012-03-08 | 2018-02-13 | The Chinese University Of Hong Kong | Size-based analysis of fetal or tumor DNA fraction in plasma |
| WO2013138510A1 (en) | 2012-03-13 | 2013-09-19 | Patel Abhijit Ajit | Measurement of nucleic acid variants using highly-multiplexed error-suppressed deep sequencing |
| US11261494B2 (en)* | 2012-06-21 | 2022-03-01 | The Chinese University Of Hong Kong | Method of measuring a fractional concentration of tumor DNA |
| EP2875149B1 (en)* | 2012-07-20 | 2019-12-04 | Verinata Health, Inc. | Detecting and classifying copy number variation in a cancer genome |
| US20140100126A1 (en) | 2012-08-17 | 2014-04-10 | Natera, Inc. | Method for Non-Invasive Prenatal Testing Using Parental Mosaicism Data |
| ES2906714T3 (en) | 2012-09-04 | 2022-04-20 | Guardant Health Inc | Methods to detect rare mutations and copy number variation |
| US10876152B2 (en) | 2012-09-04 | 2020-12-29 | Guardant Health, Inc. | Systems and methods to detect rare mutations and copy number variation |
| US11913065B2 (en) | 2012-09-04 | 2024-02-27 | Guardent Health, Inc. | Systems and methods to detect rare mutations and copy number variation |
| US20160040229A1 (en) | 2013-08-16 | 2016-02-11 | Guardant Health, Inc. | Systems and methods to detect rare mutations and copy number variation |
| US9732390B2 (en) | 2012-09-20 | 2017-08-15 | The Chinese University Of Hong Kong | Non-invasive determination of methylome of fetus or tumor from plasma |
| LT3354747T (en) | 2012-09-20 | 2021-04-12 | The Chinese University Of Hong Kong | NON - INVASIVE DETERMINATION OF TUMOR METHYLOMA IN PLASMA |
| US10706957B2 (en) | 2012-09-20 | 2020-07-07 | The Chinese University Of Hong Kong | Non-invasive determination of methylome of tumor from plasma |
| US10482994B2 (en) | 2012-10-04 | 2019-11-19 | Sequenom, Inc. | Methods and processes for non-invasive assessment of genetic variations |
| CA2889937C (en) | 2012-10-29 | 2020-12-29 | The Johns Hopkins University | Papanicolaou test for ovarian and endometrial cancers |
| WO2014093330A1 (en) | 2012-12-10 | 2014-06-19 | Clearfork Bioscience, Inc. | Methods for targeted genomic analysis |
| US10643738B2 (en)* | 2013-01-10 | 2020-05-05 | The Chinese University Of Hong Kong | Noninvasive prenatal molecular karyotyping from maternal plasma |
| EP3597774A1 (en) | 2013-03-13 | 2020-01-22 | Sequenom, Inc. | Primers for dna methylation analysis |
| WO2014151117A1 (en)* | 2013-03-15 | 2014-09-25 | The Board Of Trustees Of The Leland Stanford Junior University | Identification and use of circulating nucleic acid tumor markers |
| US10699800B2 (en) | 2013-05-24 | 2020-06-30 | Sequenom, Inc. | Methods and processes for non-invasive assessment of genetic variations |
| EP3024948B1 (en) | 2013-07-25 | 2020-01-15 | Bio-rad Laboratories, Inc. | Genetic assays for detecting viral recombination rate |
| US9499870B2 (en) | 2013-09-27 | 2016-11-22 | Natera, Inc. | Cell free DNA diagnostic testing standards |
| US10262755B2 (en) | 2014-04-21 | 2019-04-16 | Natera, Inc. | Detecting cancer mutations and aneuploidy in chromosomal segments |
| US10577655B2 (en) | 2013-09-27 | 2020-03-03 | Natera, Inc. | Cell free DNA diagnostic testing standards |
| US10851414B2 (en)* | 2013-10-18 | 2020-12-01 | Good Start Genetics, Inc. | Methods for determining carrier status |
| KR102373647B1 (en)* | 2013-10-21 | 2022-03-11 | 베리나타 헬스, 인코포레이티드 | Method for improving the sensitivity of detection in determining copy number variations |
| ES2784450T3 (en) | 2013-12-28 | 2020-09-25 | Guardant Health Inc | Methods and systems to detect genetic variants |
| WO2015138774A1 (en) | 2014-03-13 | 2015-09-17 | Sequenom, Inc. | Methods and processes for non-invasive assessment of genetic variations |
| JP6659575B2 (en) | 2014-04-21 | 2020-03-04 | ナテラ, インコーポレイテッド | Mutation detection and chromosomal segment ploidy |
| WO2015164432A1 (en)* | 2014-04-21 | 2015-10-29 | Natera, Inc. | Detecting mutations and ploidy in chromosomal segments |
| IL249095B2 (en) | 2014-05-30 | 2023-10-01 | Verinata Health Inc | Detection of subchromosomal aneuploidy in the fetus and variations in the number of copies |
| US20180173845A1 (en) | 2014-06-05 | 2018-06-21 | Natera, Inc. | Systems and Methods for Detection of Aneuploidy |
| PT3543356T (en) | 2014-07-18 | 2021-10-04 | Univ Hong Kong Chinese | Methylation pattern analysis of tissues in dna mixture |
| US20170211143A1 (en) | 2014-07-25 | 2017-07-27 | University Of Washington | Methods of determining tissues and/or cell types giving rise to cell-free dna, and methods of identifying a disease or disorder using same |
| US11783911B2 (en) | 2014-07-30 | 2023-10-10 | Sequenom, Inc | Methods and processes for non-invasive assessment of genetic variations |
| US20160048608A1 (en) | 2014-08-15 | 2016-02-18 | Good Start Genetics, Inc. | Systems and methods for genetic analysis |
| US20160053301A1 (en) | 2014-08-22 | 2016-02-25 | Clearfork Bioscience, Inc. | Methods for quantitative genetic analysis of cell free dna |
| EP3502273B1 (en) | 2014-12-12 | 2020-07-08 | Verinata Health, Inc. | Cell-free dna fragment |
| US11242559B2 (en) | 2015-01-13 | 2022-02-08 | The Chinese University Of Hong Kong | Method of nuclear DNA and mitochondrial DNA analysis |
| US10364467B2 (en)* | 2015-01-13 | 2019-07-30 | The Chinese University Of Hong Kong | Using size and number aberrations in plasma DNA for detecting cancer |
| US10319463B2 (en)* | 2015-01-23 | 2019-06-11 | The Chinese University Of Hong Kong | Combined size- and count-based analysis of maternal plasma for detection of fetal subchromosomal aberrations |
| CN107771221B (en) | 2015-02-10 | 2021-11-02 | 香港中文大学 | Mutation Detection for Cancer Screening and Fetal Analysis |
| US10424396B2 (en)* | 2015-03-27 | 2019-09-24 | Sentieon Inc. | Computation pipeline of location-dependent variant calls |
| SG11201708301TA (en)* | 2015-04-10 | 2017-11-29 | Social Welfare Organization Saiseikai Imp Gift Foundation Inc | Method for discriminating symptom of hepatic disease |
| DK3294906T3 (en) | 2015-05-11 | 2024-08-05 | Natera Inc | Methods for determining ploidy |
| HUE059407T2 (en) | 2015-07-20 | 2022-11-28 | Univ Hong Kong Chinese | Methylation pattern analysis of haplotypes in tissues in dna mixture |
| EP3325664B1 (en) | 2015-07-23 | 2021-12-29 | The Chinese University Of Hong Kong | Analysis of fragmentation patterns of cell-free dna |
| JP6675164B2 (en)* | 2015-07-28 | 2020-04-01 | 株式会社理研ジェネシス | Mutation judgment method, mutation judgment program and recording medium |
| WO2017027653A1 (en) | 2015-08-11 | 2017-02-16 | The Johns Hopkins University | Assaying ovarian cyst fluid |
| WO2017025059A1 (en) | 2015-08-12 | 2017-02-16 | The Chinese University Of Hong Kong | Single-molecule sequencing of plasma dna |
| EP3889257A1 (en) | 2015-11-11 | 2021-10-06 | Resolution Bioscience, Inc. | High efficiency construction of dna libraries |
| CA3008651A1 (en) | 2015-12-17 | 2017-06-22 | Guardant Health, Inc. | Methods to determine tumor gene copy number by analysis of cell-free dna |
| US10095831B2 (en) | 2016-02-03 | 2018-10-09 | Verinata Health, Inc. | Using cell-free DNA fragment size to determine copy number variations |
| JP2019518223A (en) | 2016-03-24 | 2019-06-27 | バイオロジカル ダイナミクス,インク. | Disposable fluid cartridges and components |
| EP3443119B8 (en) | 2016-04-15 | 2022-04-06 | Natera, Inc. | Methods for lung cancer detection |
| KR20230164209A (en) | 2016-05-30 | 2023-12-01 | 더 차이니즈 유니버시티 오브 홍콩 | Detecting hematological disorders using cell-free dna in blood |
| CA3030890A1 (en) | 2016-07-27 | 2018-02-01 | Sequenom, Inc. | Genetic copy number alteration classifications |
| MX2019002093A (en) | 2016-08-25 | 2019-06-20 | Resolution Bioscience Inc | Methods for the detection of genomic copy changes in dna samples. |
| EP3518974A4 (en)* | 2016-09-29 | 2020-05-27 | Myriad Women's Health, Inc. | Noninvasive prenatal screening using dynamic iterative depth optimization |
| WO2018067517A1 (en) | 2016-10-04 | 2018-04-12 | Natera, Inc. | Methods for characterizing copy number variation using proximity-litigation sequencing |
| TWI874916B (en) | 2016-10-24 | 2025-03-01 | 美商格瑞爾有限責任公司 | Methods and systems for tumor detection |
| JP2020503003A (en) | 2016-11-30 | 2020-01-30 | ザ チャイニーズ ユニバーシティ オブ ホンコン | Analysis of cell-free DNA in urine and other samples |
| US10011870B2 (en) | 2016-12-07 | 2018-07-03 | Natera, Inc. | Compositions and methods for identifying nucleic acid molecules |
| IL267913B2 (en) | 2017-01-24 | 2025-08-01 | Sequenom Inc | Methods and processes for assessment of genetic variations |
| DK3574108T3 (en) | 2017-01-25 | 2024-09-16 | Univ Hong Kong Chinese | DIAGNOSTIC USE USING NUCLEIC ACID FRAGMENTS |
| AU2018225348A1 (en) | 2017-02-21 | 2019-07-18 | Natera, Inc. | Compositions, methods, and kits for isolating nucleic acids |
| US12421550B2 (en) | 2017-03-17 | 2025-09-23 | Sequenom, Inc. | Methods and processes for assessment of genetic mosaicism |
| US11342047B2 (en) | 2017-04-21 | 2022-05-24 | Illumina, Inc. | Using cell-free DNA fragment size to detect tumor-associated variant |
| EP3622084A4 (en) | 2017-05-08 | 2021-02-17 | Biological Dynamics, Inc. | METHODS AND SYSTEMS FOR PROCESSING ANALYTICAL INFORMATION |
| KR102145417B1 (en)* | 2017-05-24 | 2020-08-19 | 지니너스 주식회사 | Method for generating distribution of background allele frequency for sequencing data obtained from cell-free nucleic acid and method for detecting mutation from cell-free nucleic acid using the same |
| JP2020523009A (en)* | 2017-06-08 | 2020-08-06 | ナントミクス,エルエルシー | An integrated panoramic approach to pharmacogenomic screening |
| ES2959360T3 (en) | 2017-07-26 | 2024-02-23 | Univ Hong Kong Chinese | Improving cancer screening using acellular viral nucleic acids |
| WO2019067092A1 (en) | 2017-08-07 | 2019-04-04 | The Johns Hopkins University | Methods and materials for assessing and treating cancer |
| CN110021355B (en)* | 2017-09-22 | 2021-05-04 | 深圳华大生命科学研究院 | Method and device for haplotype typing and variant detection of diploid genome sequencing fragments |
| US11168356B2 (en) | 2017-11-02 | 2021-11-09 | The Chinese University Of Hong Kong | Using nucleic acid size range for noninvasive cancer detection |
| TWI669618B (en)* | 2017-11-24 | 2019-08-21 | 南韓商韓國美迪基因科技有限公司 | A method and an apparatus forpredicting disease, and a method for calculating the weighted score of risk of occurrence of eachdisease |
| CA3085933A1 (en) | 2017-12-14 | 2019-06-20 | Tai Diagnostics, Inc. | Assessing graft suitability for transplantation |
| JP2021509266A (en)* | 2017-12-19 | 2021-03-25 | バイオロジカル ダイナミクス,インク. | Methods and Devices for Detecting and Quantifying Cell-Free DNA Fragments |
| EP3727693A4 (en) | 2017-12-19 | 2021-08-25 | Biological Dynamics, Inc. | METHOD AND DEVICE FOR DETECTION OF MULTIPLE ANALYTES FROM A BIOLOGICAL SAMPLE |
| US12398389B2 (en) | 2018-02-15 | 2025-08-26 | Natera, Inc. | Methods for isolating nucleic acids with size selection |
| TW202434742A (en) | 2018-03-13 | 2024-09-01 | 美商格瑞爾有限責任公司 | Anomalous fragment detection and classification |
| CN119955906A (en) | 2018-03-15 | 2025-05-09 | 格瑞尔公司 | Tissue-specific methylation markers |
| US12154661B2 (en)* | 2018-03-22 | 2024-11-26 | The Regents Of The University Of Michigan | Method and apparatus for analysis of chromatin interaction data |
| WO2019195196A1 (en) | 2018-04-02 | 2019-10-10 | Biological Dynamics, Inc. | Dielectric materials |
| CN112204666A (en) | 2018-04-13 | 2021-01-08 | 格里尔公司 | Multiplex Assay Prediction Models for Cancer Detection |
| WO2019200228A1 (en) | 2018-04-14 | 2019-10-17 | Natera, Inc. | Methods for cancer detection and monitoring by means of personalized detection of circulating tumor dna |
| WO2019210873A1 (en) | 2018-05-03 | 2019-11-07 | The Chinese University Of Hong Kong | Size-tagged preferred ends and orientation-aware analysis for measuring properties of cell-free mixtures |
| TW202410055A (en) | 2018-06-01 | 2024-03-01 | 美商格瑞爾有限責任公司 | Convolutional neural network systems and methods for data classification |
| TW202013385A (en) | 2018-06-07 | 2020-04-01 | 美商河谷控股Ip有限責任公司 | Difference-based genomic identity scores |
| WO2019237230A1 (en)* | 2018-06-11 | 2019-12-19 | 深圳华大生命科学研究院 | Method and system for determining type of sample to be tested |
| US12234509B2 (en) | 2018-07-03 | 2025-02-25 | Natera, Inc. | Methods for detection of donor-derived cell-free DNA |
| KR20210073526A (en)* | 2018-10-08 | 2021-06-18 | 프리놈 홀딩스, 인크. | Transcription factor profiling |
| US11581062B2 (en) | 2018-12-10 | 2023-02-14 | Grail, Llc | Systems and methods for classifying patients with respect to multiple cancer classes |
| CN113366122B (en) | 2018-12-19 | 2024-01-12 | 香港中文大学 | Free DNA end characterization |
| EP3899953A1 (en) | 2018-12-21 | 2021-10-27 | Grail, Inc. | Source of origin deconvolution based on methylation fragments in cell-free-dna samples |
| CN113195741A (en)* | 2018-12-21 | 2021-07-30 | 豪夫迈·罗氏有限公司 | Identification of global sequence features in whole genome sequence data from circulating nucleic acids |
| WO2020186024A1 (en) | 2019-03-13 | 2020-09-17 | Grail, Inc. | Systems and methods for enriching for cancer-derived fragments using fragment size |
| US12098429B2 (en) | 2019-03-25 | 2024-09-24 | The Chinese University Of Hong Kong | Determining linear and circular forms of circulating nucleic acids |
| JP2022527316A (en)* | 2019-04-02 | 2022-06-01 | グレイル, インコーポレイテッド | Stratification of virus-related cancer risk |
| JP7518097B2 (en)* | 2019-05-10 | 2024-07-17 | バイエル・コシューマー・ケア・アクチェンゲゼルシャフト | Identification of candidate signatures of NTRK oncogenic fusions |
| US12305235B2 (en) | 2019-06-06 | 2025-05-20 | Natera, Inc. | Methods for detecting immune cell DNA and monitoring immune system |
| CN110825819A (en)* | 2019-09-24 | 2020-02-21 | 昆明理工大学 | Two-classification method for processing non-small cell lung cancer data with missing values and unbalance |
| EP4066245A1 (en) | 2019-11-27 | 2022-10-05 | Grail, LLC | Systems and methods for evaluating longitudinal biological feature data |
| US11475981B2 (en) | 2020-02-18 | 2022-10-18 | Tempus Labs, Inc. | Methods and systems for dynamic variant thresholding in a liquid biopsy assay |
| US11211144B2 (en) | 2020-02-18 | 2021-12-28 | Tempus Labs, Inc. | Methods and systems for refining copy number variation in a liquid biopsy assay |
| US11211147B2 (en) | 2020-02-18 | 2021-12-28 | Tempus Labs, Inc. | Estimation of circulating tumor fraction using off-target reads of targeted-panel sequencing |
| CN114093417B (en)* | 2021-11-23 | 2022-10-04 | 深圳吉因加信息科技有限公司 | Method and device for identifying chromosomal arm heterozygosity loss |
| CN115220623B (en)* | 2021-12-17 | 2023-12-05 | 深圳市瑞图生物技术有限公司 | Chromosome image analysis method, apparatus and storage medium |
| GB2636509A (en) | 2022-02-07 | 2025-06-18 | Centre For Novostics | Fragmentation for measuring methylation and disease |
| CN114525341A (en)* | 2022-02-24 | 2022-05-24 | 苏州宏元生物科技有限公司 | Kit for simultaneously detecting lung cancer and lung infection |
| EP4547869A1 (en) | 2022-06-29 | 2025-05-07 | Raman Govindarajan | Method for detecting cancer susceptibility, early detection and predicting cancer behaviour |
| CN114898802B (en)* | 2022-07-14 | 2022-09-30 | 臻和(北京)生物科技有限公司 | Terminal sequence frequency distribution characteristic determination method, evaluation method and device based on plasma free DNA methylation sequencing data |
| WO2024129712A1 (en)* | 2022-12-12 | 2024-06-20 | Flagship Pioneering Innovations, Vi, Llc | Phased sequencing information from circulating tumor dna |
| WO2024203348A1 (en)* | 2023-03-31 | 2024-10-03 | ソニーグループ株式会社 | Tumor analysis method, tumor analysis system, and tumor analysis data generation method |
Citations (2)
| Publication number | Priority date | Publication date | Assignee | Title |
|---|---|---|---|---|
| WO2008016374A2 (en)* | 2005-12-14 | 2008-02-07 | Cold Spring Harbor Laboratory | Methods for assessing probabilistic measures of clinical outcome using genomic profiling |
| CN101849236A (en)* | 2007-07-23 | 2010-09-29 | 香港中文大学 | Diagnosis of fetal chromosomal aneuploidy using genomic sequencing |
Family Cites Families (31)
| Publication number | Priority date | Publication date | Assignee | Title |
|---|---|---|---|---|
| JPH08503367A (en)* | 1992-11-13 | 1996-04-16 | カリフォルニア インスティテュート オブ バイオロジカル リサーチ | Identification of neoplasms by detection of gene insertions and deletions |
| CH686982A5 (en) | 1993-12-16 | 1996-08-15 | Maurice Stroun | Method for diagnosis of cancers. |
| AU726045B2 (en)* | 1996-08-28 | 2000-10-26 | Johns Hopkins University School Of Medicine, The | Method for detecting cell proliferative disorders |
| EP1158055A1 (en) | 2000-05-26 | 2001-11-28 | Xu Qi University of Teaxs Laboratoire de Leucémie Chen | Method for diagnosing cancers |
| US20030219802A1 (en)* | 2002-03-08 | 2003-11-27 | The Regents Of The University Of Michigan | Diagnosis and treatment of osteosarcoma |
| JP2006519977A (en)* | 2002-11-11 | 2006-08-31 | アフィメトリックス インコーポレイテッド | Method for identifying DNA copy number changes |
| US7704687B2 (en) | 2002-11-15 | 2010-04-27 | The Johns Hopkins University | Digital karyotyping |
| AU2004286845A1 (en) | 2003-10-30 | 2005-05-19 | Tufts-New England Medical Center | Prenatal diagnosis using cell-free fetal DNA in amniotic fluid |
| EP1531183A1 (en) | 2003-11-14 | 2005-05-18 | bioMérieux BV | Method for amplification of RNA sequences |
| JP2006094760A (en)* | 2004-09-29 | 2006-04-13 | Canon Inc | Cell screening method and oral cancer cell detection method |
| PL1712639T3 (en) | 2005-04-06 | 2009-02-27 | Maurice Stroun | Method for the diagnosis of cancer by detecting circulating DNA and RNA |
| EP1974056A2 (en)* | 2005-12-14 | 2008-10-01 | Michael H. Wigler | Use of roma for characterizing genomic rearrangements |
| FI20061136A0 (en)* | 2006-12-19 | 2006-12-19 | Sakari Knuutila | screening method |
| CN100533120C (en)* | 2007-03-24 | 2009-08-26 | 辽宁师范大学 | Multicolor Fluorescence Multiplex Amplification Kit of 11 SNP Loci Related to Susceptibility to Lung Cancer |
| WO2008156827A2 (en)* | 2007-06-20 | 2008-12-24 | Government Of The United States Of America, As Represented By The Secretary, Department Of Health And Human Services | Molecular grading methods for ductal carcinoma in situ |
| US12180549B2 (en)* | 2007-07-23 | 2024-12-31 | The Chinese University Of Hong Kong | Diagnosing fetal chromosomal aneuploidy using genomic sequencing |
| US8093063B2 (en) | 2007-11-29 | 2012-01-10 | Quest Diagnostics Investments Incorporated | Assay for detecting genetic abnormalities in genomic nucleic acids |
| US20100041048A1 (en)* | 2008-07-31 | 2010-02-18 | The Johns Hopkins University | Circulating Mutant DNA to Assess Tumor Dynamics |
| GB2467704B (en)* | 2008-11-07 | 2011-08-24 | Mlc Dx Inc | A method for determining a profile of recombined DNA sequences in T-cells and/or B-cells |
| US20100136560A1 (en) | 2008-12-02 | 2010-06-03 | The Johns Hopkins University | Integrated Analyses of Breast and Colorectal Cancers |
| WO2010070366A1 (en)* | 2008-12-15 | 2010-06-24 | Debreceni Egyetem | Cytometric method for the comparative analysis of the length of pcr products and uses of this method |
| CA2748030A1 (en) | 2008-12-22 | 2010-07-01 | Arnold R. Oliphant | Methods and genotyping panels for detecting alleles, genomes, and transcriptomes |
| HUE034854T2 (en) | 2009-11-05 | 2018-03-28 | Univ Hong Kong Chinese | Fetal genomic analysis from maternal biological samples |
| CN107312844B (en) | 2009-11-06 | 2021-01-22 | 香港中文大学 | Size-based genomic analysis |
| PL3492601T3 (en) | 2010-01-19 | 2022-05-23 | Verinata Health, Inc. | Novel protocol for preparing sequencing libraries |
| CA2786564A1 (en) | 2010-01-19 | 2011-07-28 | Verinata Health, Inc. | Identification of polymorphic sequences in mixtures of genomic dna by whole genome sequencing |
| EP2536854B1 (en) | 2010-02-18 | 2017-07-19 | The Johns Hopkins University | Personalized tumor biomarkers |
| WO2011130751A1 (en)* | 2010-04-16 | 2011-10-20 | Chronix Biomedical | Breast cancer associated circulating nucleic acid biomarkers |
| KR102042253B1 (en)* | 2010-05-25 | 2019-11-07 | 더 리젠츠 오브 더 유니버시티 오브 캘리포니아 | Bambam: parallel comparative analysis of high-throughput sequencing data |
| US20120034603A1 (en)* | 2010-08-06 | 2012-02-09 | Tandem Diagnostics, Inc. | Ligation-based detection of genetic variants |
| KR101891847B1 (en) | 2010-11-30 | 2018-08-24 | 더 차이니즈 유니버시티 오브 홍콩 | Detection of genetic or molecular aberrations associated with cancer |
- 2011
- 2011-11-30KRKR1020137016780Apatent/KR101891847B1/enactiveActive
- 2011-11-30TWTW100144098Apatent/TWI532843B/enactive
- 2011-11-30SGSG2013038773Apatent/SG190344A1/enunknown
- 2011-11-30DKDK11845367.9Tpatent/DK2646579T3/enactive
- 2011-11-30EPEP23190213.1Apatent/EP4269623A3/enactivePending
- 2011-11-30CNCN201810817319.1Apatent/CN108899091B/enactiveActive
- 2011-11-30EAEA201300649Apatent/EA038374B1/enunknown
- 2011-11-30DKDK17168020.0Tpatent/DK3243910T3/enactive
- 2011-11-30CACA2817370Apatent/CA2817370C/enactiveActive
- 2011-11-30TWTW110101988Apatent/TWI786520B/enactive
- 2011-11-30MXMX2013006075Apatent/MX349568B/enactiveIP Right Grant
- 2011-11-30TWTW111126139Apatent/TW202242133A/enunknown
- 2011-11-30EPEP17168020.0Apatent/EP3243910B1/ennot_activeRevoked
- 2011-11-30TWTW105102252Apatent/TWI642786B/enactive
- 2011-11-30TWTW107129009Apatent/TWI719339B/enactive
- 2011-11-30CNCN202210291074.XApatent/CN114678128A/enactivePending
- 2011-11-30NZNZ611599Apatent/NZ611599A/enunknown
- 2011-11-30BRBR112013013421Apatent/BR112013013421A2/ennot_activeApplication Discontinuation
- 2011-11-30AUAU2011335891Apatent/AU2011335891B2/enactiveActive
- 2011-11-30SGSG10202008532PApatent/SG10202008532PA/enunknown
- 2011-11-30CNCN201510615900.1Apatent/CN105243295B/enactiveActive
- 2011-11-30EPEP19206273.5Apatent/EP3640346A1/enactivePending
- 2011-11-30JPJP2013541152Apatent/JP6196157B2/enactiveActive
- 2011-11-30KRKR1020207033400Apatent/KR102333664B1/enactiveActive
- 2011-11-30CNCN201180066175.7Apatent/CN103403182B/enactiveActive
- 2011-11-30KRKR1020237001326Apatent/KR102723107B1/enactiveActive
- 2011-11-30EPEP11845367.9Apatent/EP2646579B1/enactiveActive
- 2011-11-30MXMX2017009968Apatent/MX370249B/enunknown
- 2011-11-30MYMYPI2013001960Apatent/MY169852A/enunknown
- 2011-11-30SGSG10201509766YApatent/SG10201509766YA/enunknown
- 2011-11-30KRKR1020197032092Apatent/KR102185244B1/enactiveActive
- 2011-11-30KRKR1020187023415Apatent/KR102040307B1/enactiveActive
- 2011-11-30WOPCT/AU2011/001562patent/WO2012071621A1/enactiveApplication Filing
- 2011-11-30USUS13/308,473patent/US8741811B2/enactiveActive
- 2011-11-30KRKR1020217038741Apatent/KR102489749B1/enactiveActive
- 2013
- 2013-05-09ILIL226272Apatent/IL226272A/enactiveIP Right Grant
- 2013-05-30MXMX2019014657Apatent/MX2019014657A/enunknown
- 2013-06-21ZAZA2013/04625Apatent/ZA201304625B/enunknown
- 2014
- 2014-04-17USUS14/255,415patent/US9965585B2/enactiveActive
- 2016
- 2016-01-28ILIL243823Apatent/IL243823A/enactiveIP Right Grant
- 2017
- 2017-03-05ILIL250931Apatent/IL250931A0/enunknown
- 2017-04-19USUS15/491,507patent/US12002544B2/enactiveActive
- 2017-08-08JPJP2017153310Apatent/JP6487504B2/enactiveActive
- 2019
- 2019-02-20JPJP2019028674Apatent/JP6931013B2/enactiveActive
- 2021
- 2021-08-12JPJP2021131762Apatent/JP7351537B2/enactiveActive
- 2023
- 2023-09-07JPJP2023145456Apatent/JP2023179458A/enactivePending
- 2024
- 2024-05-24USUS18/674,702patent/US20250006299A1/enactivePending
Patent Citations (2)
| Publication number | Priority date | Publication date | Assignee | Title |
|---|---|---|---|---|
| WO2008016374A2 (en)* | 2005-12-14 | 2008-02-07 | Cold Spring Harbor Laboratory | Methods for assessing probabilistic measures of clinical outcome using genomic profiling |
| CN101849236A (en)* | 2007-07-23 | 2010-09-29 | 香港中文大学 | Diagnosis of fetal chromosomal aneuploidy using genomic sequencing |
Also Published As
Similar Documents
| Publication | Publication Date | Title |
|---|---|---|
| JP7351537B2 (en) | Detection of cancer-related genetic or molecular abnormalities | |
| AU2022202130A1 (en) | Detection of genetic or molecular aberrations associated with cancer | |
| HK40028054A (en) | Analysis of a biological sample of an organism for chromosomal deletions or amplifications associated with cancer | |
| HK1240278A1 (en) | Determination of progress of chromosomal aberrations in an organism | |
| HK1240278B (en) | Determination of progress of chromosomal aberrations in an organism | |
| HK1190435A (en) | Detection of genetic or molecular aberrations associated with cancer | |
| HK1190435B (en) | Detection of genetic or molecular aberrations associated with cancer |