RU2632625C1 - Method for determination of pressure in tumour - Google Patents
Method for determination of pressure in tumourDownload PDFInfo
- Publication number
- RU2632625C1 RU2632625C1RU2016152532ARU2016152532ARU2632625C1RU 2632625 C1RU2632625 C1RU 2632625C1RU 2016152532 ARU2016152532 ARU 2016152532ARU 2016152532 ARU2016152532 ARU 2016152532ARU 2632625 C1RU2632625 C1RU 2632625C1
- Authority
- RU
- Russia
- Prior art keywords
- tumor
- lectin
- nanoparticles
- tumour
- time
- Prior art date
Links
- 206010028980NeoplasmDiseases0.000titleclaimsabstractdescription155
- 238000000034methodMethods0.000titleclaimsabstractdescription44
- 239000003814drugSubstances0.000claimsabstractdescription71
- 239000002105nanoparticleSubstances0.000claimsabstractdescription69
- 229940079593drugDrugs0.000claimsabstractdescription67
- 108090001090LectinsProteins0.000claimsabstractdescription39
- 102000004856LectinsHuman genes0.000claimsabstractdescription39
- 239000002523lectinSubstances0.000claimsabstractdescription38
- 230000008859changeEffects0.000claimsabstractdescription8
- 239000000126substanceSubstances0.000claimsabstractdescription6
- 238000001514detection methodMethods0.000claimsabstractdescription3
- 238000005259measurementMethods0.000claimsdescription25
- 230000005294ferromagnetic effectEffects0.000claimsdescription19
- 238000002360preparation methodMethods0.000claimsdescription15
- 239000002245particleSubstances0.000claimsdescription12
- 210000004881tumor cellAnatomy0.000claimsdescription8
- 230000008030eliminationEffects0.000claimsdescription7
- 238000003379elimination reactionMethods0.000claimsdescription7
- 238000010494dissociation reactionMethods0.000claimsdescription5
- 230000005593dissociationsEffects0.000claimsdescription5
- 108010022050mistletoe lectin IProteins0.000claimsdescription5
- 230000008569processEffects0.000claimsdescription5
- 235000014066European mistletoeNutrition0.000claimsdescription4
- 235000012300Rhipsalis cassuthaNutrition0.000claimsdescription4
- 241000221012ViscumSpecies0.000claimsdescription4
- 230000036760body temperatureEffects0.000claimsdescription3
- 102000018656Mitogen ReceptorsHuman genes0.000claims1
- 108010052006Mitogen ReceptorsProteins0.000claims1
- 102000004169proteins and genesHuman genes0.000abstractdescription7
- 108090000623proteins and genesProteins0.000abstractdescription7
- 238000009530blood pressure measurementMethods0.000abstractdescription3
- 238000002512chemotherapyMethods0.000abstractdescription3
- 230000000694effectsEffects0.000abstractdescription2
- 229940124597therapeutic agentDrugs0.000abstractdescription2
- 238000011282treatmentMethods0.000abstractdescription2
- 238000002595magnetic resonance imagingMethods0.000description23
- 108020003175receptorsProteins0.000description18
- 102000005962receptorsHuman genes0.000description18
- 210000001519tissueAnatomy0.000description11
- 239000003446ligandSubstances0.000description10
- 210000004027cellAnatomy0.000description9
- XEEYBQQBJWHFJM-UHFFFAOYSA-NIronChemical compound[Fe]XEEYBQQBJWHFJM-UHFFFAOYSA-N0.000description8
- 241001465754MetazoaSpecies0.000description8
- 230000027455bindingEffects0.000description8
- 238000009739bindingMethods0.000description8
- 210000003205muscleAnatomy0.000description7
- 210000003722extracellular fluidAnatomy0.000description6
- 238000011275oncology therapyMethods0.000description6
- 238000002560therapeutic procedureMethods0.000description6
- 241000699670Mus sp.Species0.000description5
- 201000011510cancerDiseases0.000description5
- 230000029142excretionEffects0.000description5
- 230000002601intratumoral effectEffects0.000description5
- 108010066676AbrinProteins0.000description4
- 108091023037AptamerProteins0.000description4
- 241000699666Mus <mouse, genus>Species0.000description4
- 230000035508accumulationEffects0.000description4
- 238000009825accumulationMethods0.000description4
- 238000003384imaging methodMethods0.000description4
- 229910052742ironInorganic materials0.000description4
- 241000282412HomoSpecies0.000description3
- 108010039491RicinProteins0.000description3
- 238000010171animal modelMethods0.000description3
- 239000012530fluidSubstances0.000description3
- 208000005017glioblastomaDiseases0.000description3
- 210000005260human cellAnatomy0.000description3
- 238000001990intravenous administrationMethods0.000description3
- 238000001208nuclear magnetic resonance pulse sequenceMethods0.000description3
- 238000011160researchMethods0.000description3
- 238000007920subcutaneous administrationMethods0.000description3
- 231100000331toxicToxicity0.000description3
- 230000002588toxic effectEffects0.000description3
- 206010002091AnaesthesiaDiseases0.000description2
- PIWKPBJCKXDKJR-UHFFFAOYSA-NIsofluraneChemical compoundFC(F)OC(Cl)C(F)(F)FPIWKPBJCKXDKJR-UHFFFAOYSA-N0.000description2
- 230000037005anaesthesiaEffects0.000description2
- QVGXLLKOCUKJST-UHFFFAOYSA-Natomic oxygenChemical compound[O]QVGXLLKOCUKJST-UHFFFAOYSA-N0.000description2
- 239000011324beadSubstances0.000description2
- 239000002872contrast mediaSubstances0.000description2
- 238000009792diffusion processMethods0.000description2
- 210000003038endotheliumAnatomy0.000description2
- 238000002474experimental methodMethods0.000description2
- 229960002725isofluraneDrugs0.000description2
- 230000005291magnetic effectEffects0.000description2
- 229910052760oxygenInorganic materials0.000description2
- 239000001301oxygenSubstances0.000description2
- 230000035515penetrationEffects0.000description2
- 230000036387respiratory rateEffects0.000description2
- 230000000472traumatic effectEffects0.000description2
- 230000004614tumor growthEffects0.000description2
- 210000000689upper legAnatomy0.000description2
- 206010006187Breast cancerDiseases0.000description1
- 208000026310Breast neoplasmDiseases0.000description1
- 229920000742CottonPolymers0.000description1
- 102000015689E-SelectinHuman genes0.000description1
- 108010024212E-SelectinProteins0.000description1
- 241000196324EmbryophytaSpecies0.000description1
- 102000010834Extracellular Matrix ProteinsHuman genes0.000description1
- 108010037362Extracellular Matrix ProteinsProteins0.000description1
- 206010016654FibrosisDiseases0.000description1
- 239000004677NylonSubstances0.000description1
- 108010089814Plant LectinsProteins0.000description1
- 229910000831SteelInorganic materials0.000description1
- 239000002246antineoplastic agentSubstances0.000description1
- 238000013459approachMethods0.000description1
- 230000008901benefitEffects0.000description1
- 210000004204blood vesselAnatomy0.000description1
- 125000000837carbohydrate groupChemical group0.000description1
- 229940044683chemotherapy drugDrugs0.000description1
- 238000009104chemotherapy regimenMethods0.000description1
- 238000006073displacement reactionMethods0.000description1
- 210000002889endothelial cellAnatomy0.000description1
- 210000002744extracellular matrixAnatomy0.000description1
- 230000004761fibrosisEffects0.000description1
- 239000007789gasSubstances0.000description1
- 239000011521glassSubstances0.000description1
- 102000035122glycosylated proteinsHuman genes0.000description1
- 108091005608glycosylated proteinsProteins0.000description1
- 238000010438heat treatmentMethods0.000description1
- 210000004293human mammary glandAnatomy0.000description1
- 208000014674injuryDiseases0.000description1
- 230000003993interactionEffects0.000description1
- 238000011835investigationMethods0.000description1
- 239000000644isotonic solutionSubstances0.000description1
- 210000001365lymphatic vesselAnatomy0.000description1
- 230000003211malignant effectEffects0.000description1
- 239000000463materialSubstances0.000description1
- 239000011159matrix materialSubstances0.000description1
- 230000001404mediated effectEffects0.000description1
- 239000000203mixtureSubstances0.000description1
- 231100000252nontoxicToxicity0.000description1
- 230000003000nontoxic effectEffects0.000description1
- 235000015097nutrientsNutrition0.000description1
- 229920001778nylonPolymers0.000description1
- 238000005457optimizationMethods0.000description1
- 230000035699permeabilityEffects0.000description1
- 230000035790physiological processes and functionsEffects0.000description1
- 230000009467reductionEffects0.000description1
- 230000002441reversible effectEffects0.000description1
- 210000004872soft tissueAnatomy0.000description1
- 239000010959steelSubstances0.000description1
- 238000011477surgical interventionMethods0.000description1
- 238000001356surgical procedureMethods0.000description1
- 238000003325tomographyMethods0.000description1
- 238000002054transplantationMethods0.000description1
- 230000008733traumaEffects0.000description1
Images
Classifications
- A—HUMAN NECESSITIES
- A61—MEDICAL OR VETERINARY SCIENCE; HYGIENE
- A61B—DIAGNOSIS; SURGERY; IDENTIFICATION
- A61B5/00—Measuring for diagnostic purposes; Identification of persons
- A61B5/05—Detecting, measuring or recording for diagnosis by means of electric currents or magnetic fields; Measuring using microwaves or radio waves
- A61B5/055—Detecting, measuring or recording for diagnosis by means of electric currents or magnetic fields; Measuring using microwaves or radio waves involving electronic [EMR] or nuclear [NMR] magnetic resonance, e.g. magnetic resonance imaging
- A—HUMAN NECESSITIES
- A61—MEDICAL OR VETERINARY SCIENCE; HYGIENE
- A61K—PREPARATIONS FOR MEDICAL, DENTAL OR TOILETRY PURPOSES
- A61K49/00—Preparations for testing in vivo
- A61K49/06—Nuclear magnetic resonance [NMR] contrast preparations; Magnetic resonance imaging [MRI] contrast preparations
- A61K49/18—Nuclear magnetic resonance [NMR] contrast preparations; Magnetic resonance imaging [MRI] contrast preparations characterised by a special physical form, e.g. emulsions, microcapsules, liposomes
- B—PERFORMING OPERATIONS; TRANSPORTING
- B82—NANOTECHNOLOGY
- B82Y—SPECIFIC USES OR APPLICATIONS OF NANOSTRUCTURES; MEASUREMENT OR ANALYSIS OF NANOSTRUCTURES; MANUFACTURE OR TREATMENT OF NANOSTRUCTURES
- B82Y35/00—Methods or apparatus for measurement or analysis of nanostructures
- B—PERFORMING OPERATIONS; TRANSPORTING
- B82—NANOTECHNOLOGY
- B82Y—SPECIFIC USES OR APPLICATIONS OF NANOSTRUCTURES; MEASUREMENT OR ANALYSIS OF NANOSTRUCTURES; MANUFACTURE OR TREATMENT OF NANOSTRUCTURES
- B82Y5/00—Nanobiotechnology or nanomedicine, e.g. protein engineering or drug delivery
Landscapes
- Magnetic Resonance Imaging Apparatus (AREA)
- Medicines Containing Antibodies Or Antigens For Use As Internal Diagnostic Agents (AREA)
Abstract
Description
Translated fromRussianОбласть техники, к которой относится изобретениеFIELD OF THE INVENTION
Изобретение относится к медицине, а именно к области онкологии и химиотерапии, предназначено для определения давления в различных опухолях, локализованных в мягких тканях - доброкачественных или злокачественных, различных гистологических типов, результаты которого могут быть использованы для оптимизации режимов проведения химиотерапии с целью повышения эффективности лечения, а именно выбора терапевтического агента или их комбинации, корректировки доз назначаемых препаратов, оптимизации времени введения в течение суток.The invention relates to medicine, namely to the field of oncology and chemotherapy, is intended to determine the pressure in various tumors localized in soft tissues - benign or malignant, of various histological types, the results of which can be used to optimize chemotherapy regimens in order to increase the effectiveness of treatment, namely, the choice of a therapeutic agent or a combination thereof, dose adjustment of prescribed drugs, optimization of the time of administration during the day.
Уровень техникиState of the art
По сравнению с окружающими нормальными тканями большинство солидных опухолей характеризуются повышенным внутритканевым давлением (intratumoural pressure, IP) [Heldin, С.H., Rubin, K., Pietras, K. & Ostman, A. High interstitial fluid pressure - an obstacle in cancer therapy. Nat. Rev. Cancer 4, 806-13 (2004); Jain, R.K., Martin, J.D. & Stylianopoulos, T. The role of mechanical forces in tumor growth and therapy. Annu. Rev. Biomed. Eng. 16, 321-46 (2014)]. Повышенное значение IP вызвано несколькими факторами, в том числе негерметичностью кровеносных сосудов, их извилистой формой, фиброзом стромы опухоли и малым количеством или даже отсутствием лимфатических сосудов в опухоли. В некоторых опухолях давление может достигать 60 мм рт.ст. (или 8 кПа). Повышенное IP существенно ограничивает диффузию кислорода, питательных веществ внутрь опухоли и является существенным препятствием проникновению лекарственных препаратов.Compared to surrounding normal tissues, most solid tumors are characterized by increased interstitial pressure (IP) [Heldin, C.H., Rubin, K., Pietras, K. & Ostman, A. High interstitial fluid pressure - an obstacle in cancer therapy. Nat. Rev. Cancer 4, 806-13 (2004); Jain, R.K., Martin, J.D. & Stylianopoulos, T. The role of mechanical forces in tumor growth and therapy. Annu. Rev. Biomed. Eng. 16, 321-46 (2014)]. The increased IP value is caused by several factors, including leaks in blood vessels, their tortuous form, tumor stromal fibrosis, and a small number or even absence of lymphatic vessels in the tumor. In some tumors, pressure can reach 60 mmHg. (or 8 kPa). Increased IP significantly limits the diffusion of oxygen and nutrients into the tumor and is a significant obstacle to the penetration of drugs.
Впервые про повышенное внутритканевое давление в опухоли заговорили еще в 1950 году [Heldin, С.Н., Rubin, K., Pietras, K. & Ostman, A. High interstitial fluid pressure - an obstacle in cancer therapy. Nat. Rev. Cancer 4, 806-13 (2004)]. Первые упоминания о том, что повышенное IP существенно затрудняет доставку лекарственных препаратов в опухоль и, соответственно, снижает эффективность терапии относятся к 1987 году [Heldin, С.Н., Rubin, K., Pietras, K. & Ostman, A. High interstitial fluid pressure - an obstacle in cancer therapy. Nat. Rev. Cancer 4, 806-13 (2004)]. Исследование давления в опухоли особенно актуально при терапии препаратами на основе моноклональных антител, т.к. их диффузия в тело опухоли наблюдается не более чем на 100 мкм в солидных опухолях [Heine, М. et al. High interstitial fluid pressure is associated with low tumor penetration of diagnostic monoclonal antibodies applied for molecular imaging purposes. PLoS One 7, e36258 (2012); Heine, M. et al. Investigations on the usefulness of CEACAMs as potential imaging targets for molecular imaging purposes. PLoS One 6, e28030 (2011)].For the first time, increased interstitial pressure in the tumor began to be discussed back in 1950 [Heldin, S. N., Rubin, K., Pietras, K. & Ostman, A. High interstitial fluid pressure - an obstacle in cancer therapy. Nat. Rev. Cancer 4, 806-13 (2004)]. The first mention that increased IP significantly complicates the delivery of drugs to the tumor and, consequently, reduces the effectiveness of therapy dates back to 1987 [Heldin, S. N., Rubin, K., Pietras, K. & Ostman, A. High interstitial fluid pressure - an obstacle in cancer therapy. Nat. Rev. Cancer 4, 806-13 (2004)]. The study of pressure in the tumor is especially important during therapy with drugs based on monoclonal antibodies, because their diffusion into the tumor body is observed no more than 100 microns in solid tumors [Heine, M. et al. High interstitial fluid pressure is associated with low tumor penetration of diagnostic monoclonal antibodies applied for molecular imaging purposes. PLoS One 7, e36258 (2012); Heine, M. et al. Investigations on the usefulness of CEACAMs as potential imaging targets for molecular imaging purposes. PLoS One 6, e28030 (2011)].
Показано, что давление в опухоли увеличивается с увеличением размера опухоли. Однако для разных типов опухолей ввиду особенностей строения опухолевой ткани и внеклеточного матрикса эта зависимость может отличаться. [Jain, R.K., Martin, J.D. & Stylianopoulos, Т. The role of mechanical forces in tumor growth and therapy. Annu. Rev. Biomed. Eng. 16, 321 - 46 (2014)]It has been shown that the pressure in the tumor increases with increasing tumor size. However, for different types of tumors, due to structural features of the tumor tissue and extracellular matrix, this dependence may differ. [Jain, R.K., Martin, J.D. & Stylianopoulos, T. The role of mechanical forces in tumor growth and therapy. Annu. Rev. Biomed. Eng. 16, 321 - 46 (2014)]
Таким образом, вопрос влияния давления опухоли на эффективность химиотерапии является очень актуальным. Исследуются причины повышенного давления в опухоли, способы его уменьшения для увеличения проницаемости химиотерапевтических препаратов. Все это обуславливает важность разработки новых не- и малоинвазивных способов оценки давления в опухоли с возможностью применения у человека.Thus, the question of the effect of tumor pressure on the effectiveness of chemotherapy is very relevant. The causes of increased pressure in the tumor, methods of its reduction to increase the permeability of chemotherapeutic drugs are investigated. All this determines the importance of developing new non- and minimally invasive methods for assessing pressure in the tumor with the possibility of application in humans.
На сегодняшний день известно два способа измерения давления внутри опухоли. Первый способ - «Тампон-в-игле» (Wick-in-needle technique), характеризуется тем, что для измерения используют тонкую стальную иглу, конец которой заполнен тампоном (обычно из нейлоновой нити, раньше использовали хлопковый тампон). Остальной объем иглы заполнен изотоническим раствором. Игла подключена к датчику измерения давления. Если толщина используемой иглы позволяет, данным способом возможно измерять давление в глубоких тканях [Heldin, С.Н., Rubin, K., Pietras, K. & Ostman, A. High interstitial fluid pressure - an obstacle in cancer therapy. Nat. Rev. Cancer 4, 806-13 (2004)]. Аппаратная реализация одного из вариантов метода «Тампон-в-игле» представлена прибором DSI ТА11РА-C10 (Data Sciences International, New Brighton, MN, USA). Данный прибор может быть полностью имплантирован под кожу животного и позволяет проводить непрерывные измерения в течение длительного времени (до 1,5 месяца).To date, two methods are known for measuring pressure within a tumor. The first method is the “Wick-in-needle technique”, characterized in that a thin steel needle is used for measurement, the end of which is filled with a tampon (usually from a nylon thread, previously used a cotton swab). The remaining volume of the needle is filled with isotonic solution. The needle is connected to a pressure sensor. If the thickness of the needle used allows, it is possible to measure pressure in deep tissues using this method [Heldin, S. N., Rubin, K., Pietras, K. & Ostman, A. High interstitial fluid pressure - an obstacle in cancer therapy. Nat. Rev. Cancer 4, 806-13 (2004)]. The hardware implementation of one of the variants of the Tampon-in-needle method is presented by the DSI TA11RA-C10 device (Data Sciences International, New Brighton, MN, USA). This device can be completely implanted under the skin of an animal and allows continuous measurements for a long time (up to 1.5 months).
Второй способ - «Микропунктура» (Micropuncture technique), характеризуется тем, что для измерения давления жидкости в тканях используется заостренный стеклянный капилляр, как правило, 3-10 мкм в диаметре. Капилляр подключают к системе измерения давления. Данный метод позволяет получать более надежные данные оценки давления жидкости в ткани, чем техника «Тампон-в-игле», в связи с тем, что измерения проводятся в меньшем объеме и являются менее травматичными. Однако метод не позволяет проводить измерения в глубоких тканях. Как правило, измерения проводятся не глубже, чем 1 мм от поверхности. [Boucher Y., Baxter L.Т., Jain R.K. Interstitial pressure gradients in tissue-isolated and subcutaneous tumors: implications for therapy // Cancer research. - 1990. - T. 50. - №. 15. - С. 4478-4484; Heldin, С.Н., Rubin, K., Pietras, K. & Ostman, A. High interstitial fluid pressure - an obstacle in cancer therapy. Nat. Rev. Cancer 4, 806-13 (2004)]The second method, the Micropuncture technique, is characterized by the use of a pointed glass capillary, usually 3-10 microns in diameter, to measure fluid pressure in tissues. The capillary is connected to a pressure measuring system. This method allows you to obtain more reliable data on the assessment of fluid pressure in the tissue than the Tampon-in-needle technique, due to the fact that the measurements are carried out in a smaller volume and are less traumatic. However, the method does not allow measurements in deep tissues. As a rule, measurements are taken no deeper than 1 mm from the surface. [Boucher Y., Baxter L.T., Jain R.K. Interstitial pressure gradients in tissue-isolated and subcutaneous tumors: implications for therapy // Cancer research. - 1990. - T. 50. - No. 15. - S. 4478-4484; Heldin, S.N., Rubin, K., Pietras, K. & Ostman, A. High interstitial fluid pressure - an obstacle in cancer therapy. Nat. Rev. Cancer 4, 806-13 (2004)]
Главным недостатком перечисленных методов оценки давления в опухоли является их инвазивность, травматичность, при этом в некоторых случаях для измерения давления в опухоли может потребоваться проведение хирургической операции.The main disadvantage of these methods for assessing the pressure in the tumor is their invasiveness, trauma, and in some cases, surgery may be necessary to measure the pressure in the tumor.
Раскрытие изобретенияDisclosure of invention
Задачей настоящего изобретения является разработка неинвазивного способа измерения давления в опухоли.An object of the present invention is to provide a non-invasive method for measuring pressure in a tumor.
Поставленная задача решается заявляемым способом, который включает следующие этапы:The problem is solved by the claimed method, which includes the following steps:
- измерение среднего радиуса опухоли (ΔL), например, с помощью магнитно-резонансной томографии (МРТ);- measurement of the average radius of the tumor (ΔL), for example, using magnetic resonance imaging (MRI);
- ведение в опухоль, например, путем внутривенного или внутриопухолевого введения, контрольного препарата, в качестве которого используют магнитоконтрастные наночастицы, например ферромагнитные наночастицы, в концентрации, достаточной для детекции с использованием МРТ;- administration into the tumor, for example, by intravenous or intratumoral administration, of a control drug, which is used as magneto-contrast nanoparticles, for example ferromagnetic nanoparticles, in a concentration sufficient for detection using MRI;
- проведение МРТ исследований (измерение MP-сигнала) до введения контрольного препарата в опухоль, а также не менее трех раз после его введения, при этом одно из МРТ исследований осуществляют в промежуток времени, характеризующийся достаточным накоплением контрастного вещества в опухоли (с максимальной концентрацией), второе и третье - в промежуток времени, характеризующий процесс выведения контрастного вещества из опухоли;- MRI studies (measurement of the MP signal) before the introduction of the control drug into the tumor, and also at least three times after its introduction, while one of the MRI studies is carried out in a period of time characterized by sufficient accumulation of contrast medium in the tumor (with a maximum concentration) , the second and third - in the period of time characterizing the process of removing the contrast agent from the tumor;
- измерение MP-сигнала в наиболее стабильной магнитоконтрастной ткани, например, мышцах, которое осуществляют одновременно с измерением MP-сигнала в опухоли и затем используют для нормирования MP-сигналов опухоли с последующим расчетом средней интенсивности MP-сигнала в опухоли;- measurement of the MP signal in the most stable magnetocontrast tissue, for example, muscle, which is carried out simultaneously with the measurement of the MP signal in the tumor and then used to normalize the MP signals of the tumor, followed by calculation of the average intensity of the MP signal in the tumor;
- после выведения из опухоли контрольного препарата осуществляют введение (не ранее, чем через 24 часа после введения контрольного препарата) в опухоль аналогичным способом целевого (таргетного) препарата, представляющего собой наночастицы, используемые в контрольном препарате, ковалентно сшитые с белком, обладающим лектиновыми свойствами, например лектином омелы белой - вискумином (mistletoe lectin, MLI), при этом количество таргетного препарата по содержанию магнитоконтрастного вещества должно быть аналогично контрольному препарату;- after removing the control drug from the tumor, the target (targeted) drug, which is a nanoparticle used in the control drug, covalently crosslinked with a protein having lectin properties, is introduced into the tumor in a similar way for example, mistletoe lectin white - viscumin (mistletoe lectin, MLI), while the amount of the target drug according to the content of the magnet-contrast substance should be similar to the control drug;
- проведение МРТ исследований (измерение MP-сигнала) до введения целевого препарата в опухоль, а также не менее трех раз после его введения, при этом одно из МРТ исследований осуществляют в промежуток времени, характеризующийся достаточным накоплением целевого препарата в опухоли (с максимальной концентрацией), второе и третье - в промежуток времени, характеризующий процесс выведения целевого препарата из опухоли,- MRI studies (measurement of the MP signal) before the target drug is introduced into the tumor, and also at least three times after its introduction, while one of the MRI studies is carried out in a period of time characterized by sufficient accumulation of the target drug in the tumor (with maximum concentration) , the second and third - in the period of time characterizing the process of removing the target drug from the tumor,
- одновременно с измерением MP сигнала в опухоли при введении целевого препарата измеряют MP-сигнал в наиболее стабильной магнитоконтрастной ткани, например мышцах, которое также затем используют для нормирования полученных МР-сигналов опухоли с последующим расчетом средней интенсивности MP-сигнала в опухоли,- simultaneously with the measurement of the MP signal in the tumor with the introduction of the target drug, the MP signal is measured in the most stable magnetocontrast tissue, for example muscles, which is also then used to normalize the obtained MR signals of the tumor, followed by calculation of the average intensity of the MP signal in the tumor,
- по итогам полученных данных строят зависимость изменения интенсивности МР-сигнала в опухоли от времени в процессе накопления и выведения контрольного и целевого препаратов из опухоли;- based on the results of the data build the dependence of changes in the intensity of the MR signal in the tumor from time to time during the accumulation and removal of control and target drugs from the tumor;
- на основании полученных зависимостей определяют время задержки Δt выведения целевого препарата (наночастиц, ковалентно сшитых с лектином) из опухоли по сравнению с контрольным препаратом, которое в частном варианте выполнения может быть определено как разница между временем, характеризующим начало снижения максимально накопленной концентрации в опухоли целевого препарата относительно контрольного (по увеличению интенсивности MP-сигнала, которая пропорциональна концентрации препарата в опухоли). Для этого, используя построенные зависимости интенсивности MP-сигнала от времени фиксируют время, соответствующее точке перегиба от минимального значения сигнала МРТ к максимальному для контрольного препарата (tk) и для таргетного препарата (tt), и время задержки Δt выведения целевого препарата по сравнению с контрольным препаратом, определяют по разнице полученных значений: Δt=tt-tk.- on the basis of the obtained dependencies, the delay time Δt for the removal of the target drug (nanoparticles covalently crosslinked with lectin) from the tumor is determined compared to the control drug, which in a particular embodiment can be defined as the difference between the time characterizing the beginning of the decrease in the maximum accumulated concentration in the tumor of the target the drug relative to the control (by increasing the intensity of the MP signal, which is proportional to the concentration of the drug in the tumor). To do this, using the constructed dependences of the MP signal intensity on time, we fix the time corresponding to the inflection point from the minimum value of the MRI signal to the maximum for the control drug (tk ) and for the target drug (tt ), and the delay time Δt of the elimination of the target drug compared with the control drug, determined by the difference in the obtained values: Δt = tt -tk .
- расчет значения давления в опухоли производят по формуле:- the calculation of the pressure in the tumor is performed according to the formula:

где kb - постоянная Больцмана;where kb is the Boltzmann constant;
Т - абсолютная температура (тела) пациента;T is the absolute temperature (body) of the patient;
R - радиус наночастицы (характеристика используемых наночастиц в контрольном и целевом препаратах);R is the nanoparticle radius (characteristic of the used nanoparticles in the control and target preparations);
h - высота рецептора, находящегося на поверхности опухолевой клетки, которая может быть определена в соответствии с работой [Jeong О. Lee, Hye Mi So, Eun Kyoung Jeon, Hyunju Chang, Keehoon Won, and Yong Hwan Kim. Aptamers as molecular recognition elements for electrical nanobiosensors. Anal. Bioanal. Chem., 390(4): 1023-1032, 2008], в контексте заявляемого изобретения может составлять постоянную величину, равную 5 нм;h is the height of the receptor located on the surface of the tumor cell, which can be determined in accordance with the work of [Jeong O. Lee, Hye Mi So, Eun Kyoung Jeon, Hyunju Chang, Keehoon Won, and Yong Hwan Kim. Aptamers as molecular recognition elements for electrical nanobiosensors. Anal. Bioanal. Chem., 390 (4): 1023-1032, 2008], in the context of the claimed invention can be a constant value equal to 5 nm;
Rr0 и Rr1 - внешний и внутренний радиусы кольца, в пределах которого может взаимодействовать рецептор, которые также могут быть определены в соответствии с работой [Jeong О. Lee, Hye Mi So, Eun Kyoung Jeon, Hyunju Chang, Keehoon Won, and Yong Hwan Kim. Aptamers as molecular recognition elements for electrical nanobiosensors. Anal. Bioanal. Chem., 390(4): 1023-1032, 2008], в контексте заявляемого изобретения могут составлять постоянную величину 7 нм и 3,5 нм, соответственно;Rr0 and Rr1 are the outer and inner radii of the ring within which the receptor can interact, which can also be determined in accordance with the work [Jeong O. Lee, Hye Mi So, Eun Kyoung Jeon, Hyunju Chang, Keehoon Won, and Yong Hwan Kim. Aptamers as molecular recognition elements for electrical nanobiosensors. Anal. Bioanal. Chem., 390 (4): 1023-1032, 2008], in the context of the claimed invention can be a constant value of 7 nm and 3.5 nm, respectively;
kr0 - константа скорости диссоциации комплекса лектин (или лиганд)-рецептор при нулевой нагрузке (зависит от лектина, конъюгированного с наночастицами);kr0 is the dissociation rate constant of the lectin (or ligand) receptor complex at zero load (depends on the lectin conjugated to nanoparticles);


nr - плотность рецепторов для данного лектина на поверхности опухолевой клетки (зависит от специфичности лектина, конъюгированного с наночастицами и типа клеток), рассчитывается по формуле nr=Nr/600, где Nr - количество рецепторов для данного лектина на поверхности опухолевой клетки.nr is the density of receptors for a given lectin on the surface of the tumor cell (depends on the specificity of the lectin conjugated with nanoparticles and the type of cells), is calculated by the formula nr = Nr / 600, where Nr is the number of receptors for this lectin on the surface of the tumor cell .
В случае, если в качестве магнитоконтрастных частиц в контрольном препарате использованы ферромагнитные наночастицы, а в целевом препарате ферромагнитные наночастицы, конъюгированные с лектином вискумин [Хуторненко А.А., Герасимов В.М., Сахаров Д.А. Получение и изучение интернализации конъюгата вискумин-ферромагнитных наночастиц с клетками глиобластомы человека A172 // Бюллетень экспериментальной биологии и медицины. 2015. Vol. 160. №12. Р. 797-801], значение kr0 составляет 18⋅10-3 с-1 [K. Sandvig, S. Olsnes, and A. Pihl. Kinetics of Binding of the Toxic Lectins Abrin and Ricin to Surface Receptors of Human Cells. 251(13): 3977-3984, 1976], поверхностная плотность лигандов n1 составляет 130 мкм-2, поверхностная плотность рецепторов nr может быть принята равной 105 мкм-2, значение температуры тела Т принимается равным 37°C (или 310,15 K), соответственно, давление в опухоли может быть рассчитано по формуле:In the case where ferromagnetic nanoparticles are used as magnetocontrast particles in the control preparation, and ferromagnetic nanoparticles conjugated with viscumin lectin in the target preparation [Khutornenko A.A., Gerasimov V.M., Sakharov D.A. Obtaining and studying the internalization of a conjugate of viscumin-ferromagnetic nanoparticles with human glioblastoma cells A172 // Bulletin of Experimental Biology and Medicine. 2015. Vol. 160. No. 12. R. 797-801], the value of kr0 is 18⋅10-3 s-1 [K. Sandvig, S. Olsnes, and A. Pihl. Kinetics of Binding of the Toxic Lectins Abrin and Ricin to Surface Receptors of Human Cells. 251 (13): 3977-3984, 1976], the surface density of ligands n1 is 130 μm-2 , the surface density of receptors nr can be taken equal to 105 μm-2 , the temperature of the body T is taken to be 37 ° C (or 310 , 15 K), respectively, the pressure in the tumor can be calculated by the formula:

где ΔL - средний радиус опухоли, Δt - время задержки выведения ферромагнитных наночастиц, ковалентно сшитых с лектином MLI, по сравнению с контрольным препаратом ферромагнитных наночастиц.where ΔL is the average radius of the tumor, Δt is the delay time of excretion of ferromagnetic nanoparticles covalently crosslinked with MLI lectin, compared with the control preparation of ferromagnetic nanoparticles.
При этом средний радиус опухоли (ΔL) может быть определен по следующей методике: получают изображения (томограммы) опухоли в разных плоскостях с помощью известных средств, например МРТ, по которым определяют максимальные параметры опухоли по трем осям (x-y-z), затем рассчитывают условный объем опухоли, из которого находят средней радиус опухоли.In this case, the average radius of the tumor (ΔL) can be determined by the following method: obtain images (tomograms) of the tumor in different planes using known means, for example, MRI, which determine the maximum parameters of the tumor in three axes (xyz), then calculate the conditional volume of the tumor from which the average radius of the tumor is found.
Техническим результатом, на достижение которого направлено заявленное изобретение, является возможность получения объективных данных о давлении в опухоли неинвазивным методом.The technical result, to which the claimed invention is directed, is the possibility of obtaining objective data on the pressure in the tumor by a non-invasive method.
Кроме того, преимуществом заявляемого способами перед существующими на сегодняшний день способами является то, что измерение давления в опухоли можно проводить параллельно с МРТ исследованием, для измерения не требуется хирургических вмешательств.In addition, the advantage of the claimed methods over the existing methods today is that the measurement of pressure in the tumor can be carried out in parallel with MRI research, for the measurement does not require surgical intervention.
Кроме того, известно, что величина давления изменяется от центра опухоли к периферии [Soltani М., Chen P. Numerical modeling of fluid flow in solid tumors // PloS one. - 2011. - T. 6. - №. 6. - С. e20344]. С помощью MPT оценивают интегральную интенсивность по всей опухоли, что помогает избежать ошибок, которые могут возникать при использовании методов прямого измерения давления, связанных со смещением иглы от центра опухоли.In addition, it is known that the pressure varies from the center of the tumor to the periphery [Soltani M., Chen P. Numerical modeling of fluid flow in solid tumors // PloS one. - 2011. - T. 6. - No. 6. - S. e20344]. Using MPT, the integral intensity over the entire tumor is estimated, which helps to avoid errors that may occur when using direct pressure measurement methods associated with the displacement of the needle from the center of the tumor.
Кроме того, при наличии нескольких опухолевых очагов, заявляемый способ позволяет проводить оценку давления одновременно во всех очагах.In addition, in the presence of several tumor foci, the inventive method allows the assessment of pressure simultaneously in all foci.
Т.к. существующие способы определения давления в опухоли являются достаточно травматичными, а в некоторых случаях требуют серьезных хирургических операций, по этой причине они рекомендованы к применению преимущественно на животных моделях при проведении доклинических исследований. Предлагаемый новый подход позволит проводить измерения давления внутри опухоли также у человека.Because existing methods for determining the pressure in the tumor are quite traumatic, and in some cases require serious surgical operations, for this reason they are recommended for use mainly in animal models when conducting preclinical studies. The proposed new approach will allow for pressure measurements within the tumor also in humans.
Краткое описание чертежейBrief Description of the Drawings
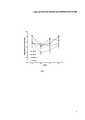
Изобретение поясняется графическими материалами, где на фиг. 1 представлена динамика изменения интенсивности МРТ сигнала в опухоли большого (опухоли типа В, объем опухоли (V)>500 мм3) и малого (опухоли типа S, V<500 мм3) размера к сигналу в мышце при внутриопухолевом введении препаратов ФНЧ (контрольный препарат ферромагнитных наночастиц) и ФНЧ-MLI (ферромагнитные наночастицы, конъюгированные с MLI).The invention is illustrated by graphic materials, where in FIG. Figure 1 shows the dynamics of changes in the intensity of an MRI signal in a tumor of a large (type B tumor, tumor volume (V)> 500 mm3 ) and small (type S tumor, V <500 mm3 ) size to the signal in the muscle during intratumoral administration of low-pass drugs (control preparation of ferromagnetic nanoparticles) and low-pass filter MLI (ferromagnetic nanoparticles conjugated with MLI).
Осуществление изобретенияThe implementation of the invention
Определение давления в опухоли основано на измерении радиуса опухоли (ΔL), которое может быть реализовано в частном варианте выполнения изобретения с помощью магнитно-резонансной томографии (МРТ), а также на расчете времени задержки (Δt) выведения из опухоли целевого препарата по сравнению с контрольным, где в качестве контрольного препарата используют магнитоконтрастные наночастицы, в качестве целевого - наночастицы, используемые в контрольном препарате, ковалентно сшитые с белком, обладающим лектиновыми свойствами.The determination of the pressure in the tumor is based on the measurement of the radius of the tumor (ΔL), which can be implemented in a particular embodiment of the invention using magnetic resonance imaging (MRI), as well as on the calculation of the delay time (Δt) of the removal of the target drug from the tumor compared to the control where magnetocontrast nanoparticles are used as a control preparation, nanoparticles used in the control preparation covalently crosslinked with a protein having lectin properties are used as a target preparation.
Средний радиус опухоли (значение ΔL) может быть измерен в ходе проведения магнитно-резонансной томографии (МРТ). В одном из вариантов осуществления изобретения средний радиус может быть определен посредством измерения линейных размеров опухоли и расчета среднего радиуса опухоли ΔL. Данные измерения могут проводится в любой момент, в том числе непосредственно перед введением контрольного препарата наночастиц. Для определения ΔL берут изображения МРТ-исследования (срезы), соответствующие максимальному размеру опухоли, измеряют максимальные значения длины


В качестве магнитоконтрастных наночастиц контрольного препарата могут быть использованы ферромагнитные наночастицы, наночастицы, содержащие гадалиний, и др. В качестве белков, обладающих лектиновыми свойствами, могут быть использованы белки, узнающие углеводный остаток, специфически или повышено экспрессируемый опухолевой тканью, например MLI, Е-селектин, другие растительные и животные лектины в нетоксичных дозах. Ферромагнитные наночастицы и наночастицы с ковалентно связанным лектином MLI (ФНЧ-MLI) могут быть получены способом, подробно описанным в работе [Хуторненко А.А., Герасимов В.М., Сахаров Д.А. Получение и изучение интернализации конъюгата вискумин-ферромагнитных наночастиц с клетками глиобластомы человека A172 // Бюллетень экспериментальной биологии и медицины. 2015. Vol. 160. №12. Р. 797-801].As magnetocontrast nanoparticles of the control preparation, ferromagnetic nanoparticles, nanoparticles containing gadalinium, etc. can be used. As proteins possessing lectin properties, proteins recognizing a carbohydrate residue that is specifically or enhanced by tumor tissue, for example, MLI, E-selectin, can be used. , other plant and animal lectins in non-toxic doses. Ferromagnetic nanoparticles and nanoparticles with covalently bound MLI lectin (LPF-MLI) can be obtained by the method described in detail in [Khutornenko A.A., Gerasimov V.M., Sakharov D.A. Obtaining and studying the internalization of a conjugate of viscumin-ferromagnetic nanoparticles with human glioblastoma cells A172 // Bulletin of Experimental Biology and Medicine. 2015. Vol. 160. No. 12. R. 797-801].
Контрольный и целевой препараты вводят в опухоль пациента (путем внутривенного или внутриопухолевого введения) последовательно в равных объемах в количестве, достаточном для детекции сигнала с помощью МРТ для соответствующего способа введения в организм. При этом введение целевого препарата в опухоль осуществляют после выведения из нее контрольного препарата (рекомендуется не ранее, чем через 24 часа после введения контрольного препарата), а количество контрольного и таргетного препаратов должно быть одинаковым по содержанию магнитоконтрастного вещества. Например, в случае ферромагнитных наночастиц, по содержанию железа не менее 5 мкг при внутриопухолевом введении и 200 мкг при внутривенном введении (в организм мыши). Например, в случае ксенографтной модели опухоли с использованием иммунодефицитых мышей при внутриопухолевом введении ферромагнитных наночастиц необходимое количество наночастиц составляет 5 мкг по содержанию железа.The control and target drugs are injected into the patient’s tumor (by intravenous or intratumoral administration) sequentially in equal volumes in an amount sufficient to detect the signal using MRI for the corresponding method of administration to the body. In this case, the introduction of the target drug into the tumor is carried out after the removal of the control drug from it (it is recommended not earlier than 24 hours after the administration of the control drug), and the number of control and target drugs should be the same in the content of the magneto-contrast substance. For example, in the case of ferromagnetic nanoparticles, the iron content is not less than 5 μg for intratumoral administration and 200 μg for intravenous administration (to the mouse). For example, in the case of a xenograft model of a tumor using immunodeficient mice with intratumoral administration of ferromagnetic nanoparticles, the required number of nanoparticles is 5 μg in iron content.
За изменением содержания ФНЧ-MLI и контрольного препарата в опухоли следят с помощью магнитно-резонансной томографии (МРТ). Для этого проводят измерения интенсивности сигнала магниторезонасного вещества (ФНЧ) в опухоли до начала введения препарата и после введения, например через 15 мин (время, в течение которого происходит накопление препарата в опухоли, т.е. характеризуется максимальной концентрацией), 2 часа (время, характеризующееся начальной стадией процесса выведения препарата из опухоли) и 24 часа (время, характеризующееся конечной стадией процесса выведения препарата из опухоли) (указано минимальное количество временных точек). Предпочтительно использование одинаковых временных точек при проведении МРТ исследований с контрольным и целевым препаратами. Увеличение количества проводимых измерений MP-сигнала повышает достоверность получаемого результата.The change in the content of the low-pass filter-MLI and the control drug in the tumor is monitored using magnetic resonance imaging (MRI). To do this, measure the signal intensity of a magnetoresonant substance (LPF) in the tumor before administration of the drug and after administration, for example, after 15 minutes (the time during which the drug accumulates in the tumor, i.e., is characterized by the maximum concentration), 2 hours (time , characterized by the initial stage of the process of removing the drug from the tumor) and 24 hours (time, characterized by the final stage of the process of removing the drug from the tumor) (the minimum number of time points is indicated). It is preferable to use the same time points when conducting MRI studies with control and target drugs. An increase in the number of measurements of the MP signal increases the reliability of the result.
Одновременно с измерением интенсивности MP сигнала в опухоли измеряют МР-сигнал в мышцах бедра, как наиболее стабильной магнитоконтрастной ткани. Данное значение далее используют для нормировки сигнала в опухоли. На основании полученных данных, для обоих препаратов строят зависимость изменения МРТ сигнала в опухоли по отношению к сигналу в мышце от времени (фиг. 1).Simultaneously with measuring the intensity of the MP signal in the tumor, the MR signal in the thigh muscles is measured, as the most stable magnetocontrast tissue. This value is further used to normalize the signal in the tumor. Based on the data obtained, for both drugs, the time dependence of the change in the MRI signal in the tumor relative to the signal in the muscle is constructed (Fig. 1).
После чего производят расчет времени задержки выведения наночастиц, ковалентно сшитых с лектином, из опухоли по разнице длительности содержания наночастиц в максимальной концентрации. Для этого, используя построенные зависимости интенсивности MP-сигнала от времени, фиксируют время, соответствующее точке перегиба от минимального значения сигнала МРТ к максимальному для контрольного препарата (tt) и для таргетного препарата (tt), и время задержки Δt выведения целевого препарата по сравнению с контрольным препаратом определяют по разнице полученных значений: Δt=tt-tk. В частном эксперименте, представленном на фиг. 1, в качестве точки перегиба допускается использовать временную точку со значением интенсивности MP-сигнала, наиболее близким в минимальному перед фазой достоверного увеличения сигнала.After that, the delay time for the excretion of nanoparticles covalently crosslinked with lectin from the tumor is calculated by the difference in the duration of the content of nanoparticles in the maximum concentration. To do this, using the constructed time dependence of the MP signal intensity, fix the time corresponding to the inflection point from the minimum value of the MRI signal to the maximum for the control drug (tt ) and for the target drug (tt ), and the delay time Δt of the target drug compared with the control drug is determined by the difference in the obtained values: Δt = tt -tk . In the private experiment shown in FIG. 1, it is allowed to use a time point with the MP signal intensity value closest to the minimum before the phase of a reliable signal increase as an inflection point.
Расчет значения давления в опухоли производят по формуле (1) или в случае использования в качестве магнитоконтрастных наночастиц ферромагнитных наночастиц, а в качестве белка, обладающего лектиновыми свойствами, - лектина MLI, по формуле (2).The calculation of the pressure in the tumor is carried out according to the formula (1) or in the case of using ferromagnetic nanoparticles as magnetocontrast nanoparticles, and MLI lectin as a protein having lectin properties, according to formula (2).
Формула определения давления в опухоли была получена исходя из следующих предположений: время задержки ферромагнитной наночастицы с ковалентно связанным лектином MLI (ФНЧ-MLI) при единичном связывании с рецептором на поверхности клеток эндотелия обратно пропорционально константе скорости диссоциации kr, которая согласно [G.I. Bell. Models for the specific adhesion of cells to cells. A theoretical framework for adhesion mediated by reversible bonds between cell surface molecules. Science (80-.)., 200 (4342): 618-627, 1978] зависит от внешней приложенной силы F, какThe formula for determining the pressure in the tumor was obtained on the basis of the following assumptions: the delay time of a ferromagnetic nanoparticle with covalently bound MLI lectin (LPF-MLI) upon single binding to the receptor on the surface of endothelial cells is inversely proportional to the dissociation rate constant kr , which according to [GI Bell. Models for the specific adhesion of cells to cells. A theoretical framework for adhesion mediated by reversible bonds between cell surface molecules. Science (80-.)., 200 (4342): 618-627, 1978] depends on the external applied force F, as

где r0≈1,0 нм - расстояние, на котором лиганд (гликозилированный белок на поверхности клетки) и рецептор (лектин MLI) могут вступить в контакт, kB - постоянная Больцмана, Т - абсолютная температура тела пациента или животного, kr0 - константа скорости диссоциации комплекса лиганд-рецептор при нулевой нагрузке, значение которой по данным [K. Sandvig, S. Olsnes, and A. Pihl. Kinetics of Binding of the Toxic Lectins Abrin and Ricin to Surface Receptors of Human Cells. 251(13): 3977-3984, 1976] составляет 18⋅10-3 с-1.where r0 ≈1.0 nm is the distance at which the ligand (glycosylated protein on the cell surface) and the receptor (MLI lectin) can come into contact, kB is the Boltzmann constant, T is the absolute body temperature of the patient or animal, kr0 is the dissociation rate constant of the ligand-receptor complex at zero load, the value of which according to [K. Sandvig, S. Olsnes, and A. Pihl. Kinetics of Binding of the Toxic Lectins Abrin and Ricin to Surface Receptors of Human Cells. 251 (13): 3977-3984, 1976] is 18⋅10-3 s-1 .
Для оценки полного времени задержки ФНЧ-MLI по сравнению с контрольными наночастицами ФНЧ (без MLI) необходимо оценить число связываний за то время, пока частица находится в опухоли.To estimate the total delay time of the low-pass filter, MLI compared with control nanoparticles of the low-pass filter (without MLI), it is necessary to estimate the number of bindings while the particle is in the tumor.
В качестве приближения предполагаем, что наночастица катится по поверхности эндотелия. При этом площадь частицы Ac, на которой может происходить взаимодействие, определяется высотой рецептора h:As an approximation, we assume that the nanoparticle rolls along the surface of the endothelium. In this case, the particle area Ac , on which the interaction can occur, is determined by the height of the receptor h:

где R - радиус наночастицы, Sbead - площадь ее поверхности (Sbead=4πR2).where R is the radius of the nanoparticle, Sbead is its surface area (Sbead = 4πR2 ).
Если поверхностная плотность лигандов на наночастице


Соответствующая ей площадь поверхности эндотелия Splate за один оборот составляет:The corresponding surface area of the endothelium Splate per revolution is:

При поверхностной плотности рецепторов nr на эту площадь приходится NR рецепторов:With a surface density of receptors nr , NR receptors fall on this area:

Считаем, что площадь, на которой может взамодействовать один рецептор, определяется его геометрией [Jeong О. Lee, Hye Mi So, Eun Kyoung Jeon, Hyunju Chang, Keehoon Won, and Yong Hwan Kim. Aptamers as molecular recognition elements for electrical nanobiosensors. Anal. Bioanal. Chem., 390(4): 1023-1032, 2008] и представляет собой кольцо с внешним и внутренним радиусами: Rr0 и Rr1, соответственно. Отсюда эффективная площадь, на которой может происходить связывание, составляет:We believe that the area over which one receptor can interact is determined by its geometry [Jeong O. Lee, Hye Mi So, Eun Kyoung Jeon, Hyunju Chang, Keehoon Won, and Yong Hwan Kim. Aptamers as molecular recognition elements for electrical nanobiosensors. Anal. Bioanal. Chem., 390 (4): 1023-1032, 2008] and is a ring with outer and inner radii: Rr0 and Rr1 , respectively. Hence, the effective area on which binding can occur is:

Предполагаем, что если лиганд попал в эту эффективную площадь, произойдет связывание, тогда вероятность соединения составляет:We assume that if the ligand is in this effective area, binding will occur, then the probability of the connection is:

Отсюда среднее количество связей за один оборот составит:Hence, the average number of connections per revolution is:

Прокатившись на расстояние ΔL, наночастица сделает

Отсюда полное время запаздывания наночастицы ФНЧ-MLI, покрытой вискумином, по сравнению с непокрытой ФНЧ составляет:Hence, the total delay time of the nanoparticle of the low-pass filter-MLI coated with viscumin, compared with the uncovered low-pass filter is:

Соответственно, если известно время запаздывания, силу F, приходящуюся на одну связь, можно оценить по следующей формуле:Accordingly, if the delay time is known, the force F per one bond can be estimated by the following formula:

Или, приближенно оценивая давление в опухоли Р, какOr, roughly estimating the pressure in the tumor P, as

получаем:we get:

Или в общем виде:Or in general:

Для численной оценки давления поверхностную плотность рецепторов оценивали как nr~105 мкм-2. Как описано в работе [Хуторненко А.А., Герасимов В.М., Сахаров Д.А. Получение и изучение интернализации конъюгата вискумин-ферромагнитных наночастиц с клетками глиобластомы человека A172 // Бюллетень экспериментальной биологии и медицины. 2015. Vol. 160. №12 / Р. 797-801], для ферромагнитных наночастиц, конъюгированных с MLI, радиус одной наночастицы составляет 50 нм, при этом на одну такую частицу приходится в среднем 4 молекулы лектина. В этом случае поверхностная плотность молекул лектина составляет n1~130 мкм-2. Характеристики молекулы рецептора брали из работы [Jeong О. Lee, Hye Mi So, Eun Kyoung Jeon, Hyunju Chang, Keehoon Won, and Yong Hwan Kim. Aptamers as molecular recognition elements for electrical nanobiosensors. Anal. Bioanal. Chem., 390(4): 1023-1032, 2008]: h~5 нм, Rr0~7 нм, Rr1~3,5 нм.For a numerical assessment of pressure, the surface density of the receptors was estimated as nr ~ 105 μm-2 . As described in [Khutornenko A.A., Gerasimov V.M., Sakharov D.A. Obtaining and studying the internalization of a conjugate of viscumin-ferromagnetic nanoparticles with human glioblastoma cells A172 // Bulletin of Experimental Biology and Medicine. 2015. Vol. 160. No. 12 / P. 797-801], for ferromagnetic nanoparticles conjugated with MLI, the radius of one nanoparticle is 50 nm, while on average 4 lectin molecules per one particle. In this case, the surface density of lectin molecules is n1 ~ 130 μm-2 . The characteristics of the receptor molecule were taken from [Jeong O. Lee, Hye Mi So, Eun Kyoung Jeon, Hyunju Chang, Keehoon Won, and Yong Hwan Kim. Aptamers as molecular recognition elements for electrical nanobiosensors. Anal. Bioanal. Chem., 390 (4): 1023-1032, 2008]: h ~ 5 nm, Rr0 ~ 7 nm, Rr1 ~ 3.5 nm.
Подставляя эти значения в формулу (1), получаем итоговую формулу для расчета давления в опухоли для случая использования ферромагнитных наночастиц и MLI:Substituting these values into formula (1), we obtain the final formula for calculating the pressure in the tumor for the case of using ferromagnetic nanoparticles and MLI:

В случае использования в контрольном и целевом препаратах других магнитоконтрастных частиц и иных белков значения характеризующих их коэффициентов (R - радиус наночастицы,


Ниже представлены примеры реализации изобретения на лабораторных животных.Below are examples of the implementation of the invention in laboratory animals.
Пример 1Example 1
Самкам иммунодефицитных мышей линии SCID с ортотопически привитой подкожной опухолью (типа S (объем опухоли V<500 мм3)) молочной железы человека (клеточная линия MDA-MB231) однократно вводилось в тело опухоли 10 мкл контрольного препарата ферромагнитных наночастиц (ФНЧ), не содержащих вектор-лиганд MLI, и препарата ФНЧ-MLI, содержащего эквивалентное количество железа (5 мкг по содержанию железа). За изменением содержания ФНЧ-MLI и контрольного препарата в опухоли следили с помощью магнитно-резонансной томографии (МРТ).Female SCID immunodeficient mice with orthotopically inoculated with a subcutaneous tumor (type S (tumor volume V <500 mm3)) of the human mammary gland (cell line MDA-MB231) was injected once into the tumor body 10 μl of a control preparation of ferromagnetic nanoparticles (LPF) that did not contain a vector -ligand MLI, and a low-pass filter-MLI preparation containing an equivalent amount of iron (5 μg by iron content). The change in the content of the low-pass filter-MLI and the control drug in the tumor was monitored using magnetic resonance imaging (MRI).
Все МРТ измерения были выполнены на горизонтальном магнитно-резонансном томографе для лабораторных животных с напряженностью магнитного поля 11,7 Тесла (BioSpec 117/16 USR, Bruker, Германия). Измерения были выполнены с использованием радиочастотной объемной катушки 1Н, работающей на частоте 500,3 МГц, томограммы получены с помощью импульсной последовательности FISP (Fast Imaging with Steady State Precession). В импульсной последовательности градиентные эхо-сигналы генерируются срезами-селективных радиочастотных импульсов с ТЕ=TR/2 и полной переориентацией всех каналов градиента (режим TRUE_FISP). Параметры импульсной последовательности: время повторения / время эхо (TR/ТЕ)=3,6/1,8 мсек, матрицей - 256×256×128, полем зрения (FOV)=60×60 мм2, толщиной среза - 0,31 мм, количеством срезов в случае исследования на мышах - 128, количеством накоплений - 4, общим временем сканирования - 4 мин 18 сек.All MRI measurements were performed on a horizontal magnetic resonance imager for laboratory animals with a magnetic field strength of 11.7 Tesla (BioSpec 117/16 USR, Bruker, Germany). The measurements were performed using a 1H radio frequency bulk coil operating at a frequency of 500.3 MHz; tomograms were obtained using the FISP (Fast Imaging with Steady State Precession) pulse sequence. In the pulse sequence, gradient echo signals are generated by slices of selective radio frequency pulses with TE = TR / 2 and a complete reorientation of all the gradient channels (TRUE_FISP mode). Pulse sequence parameters: repetition time / echo time (TR / TE) = 3.6 / 1.8 ms, matrix - 256 × 256 × 128, field of view (FOV) = 60 × 60 mm2 , slice thickness - 0.31 mm, the number of slices in the case of studies on mice - 128, the number of accumulations - 4, the total scan time - 4 min 18 sec.
Перед проведением процедуры сканирования и во время нее каждая мышь была наркотизирована при помощи газового наркоза изофлюрана. Животное помещали в положении лежа в специально предназначенную для томографии горизонтальную «кроватку», которую затем задвигали внутрь прибора. Кроватка снабжена температурным обогревом для предотвращения снижения температуры тела животного при его нахождении в наркотизированном состоянии. На протяжении всего сканирования при помощи специализированного устройства (SA Instruments, Stony Брук, штат Нью-Йорк, США), совместимого и поставляемого с МРТ системой, производился мониторинг физиологического состояния животного, в частности частоты дыхания. Информация о частоте дыхания использовалась для контроля глубины наркоза.Before and during the scanning procedure, each mouse was anesthetized with isoflurane gas anesthesia. The animal was placed in a prone position in a horizontal “crib” specially designed for tomography, which was then pushed inside the device. The crib is equipped with temperature heating to prevent a decrease in the body temperature of the animal when it is in an anesthetized state. Throughout the scan, using a specialized device (SA Instruments, Stony Brook, New York, USA), compatible and supplied with an MRI system, the physiological state of the animal was monitored, in particular the respiratory rate. Respiratory rate information was used to control the depth of anesthesia.
Измерения сигнала магниторезонасного вещества (ФНЧ) проводили через 0, 15 мин, 2 часа и 24 часа после введения. В эти же временные точки проводили измерения МРТ сигнала в мышцах бедра мыши, как наиболее стабильной магнитоконтрастной ткани. Данное значение далее использовали для нормировки сигнала в опухоли. На основании полученных данных, используя программу Microsoft Excel, строили зависимость изменения МРТ сигнала в опухоли по отношению к сигналу в мышце от времени (фиг. 1) для обоих препаратов.Measurements of the magnetoresonant substance (LPF) signal were performed at 0, 15 minutes, 2 hours, and 24 hours after administration. At the same time points, the MRI signal was measured in the thigh muscles of the mouse, as the most stable magnetocontrast tissue. This value was further used to normalize the signal in the tumor. Based on the data obtained, using the Microsoft Excel program, the dependence of the change in the MRI signal in the tumor with respect to the signal in the muscle versus time was constructed (Fig. 1) for both drugs.
В проведенном нами эксперименте с использованием ксенографтной модели опухоли молочной железы человека у иммунодефицитных мышей SCID, было показано достоверное различие в скорости выведения контрольных наночастиц и наночастиц, содержащих MLI, для опухолей типа S (объем опухоли V<500 мм3). Расстояние, пройденное наночастицей, оценивали как средний радиус опухоли, который для опухоли типа S составил ΔL=2,2 мм. Считали, что время задержки составило 1,75 ч (см. фиг 1). На основании этих данных оценка значения давления в опухоли составила порядка 2,5 кПа (или 19,4 мм рт.ст.).In our experiment using an xenograft model of a human breast tumor in SCID immunodeficient mice, a significant difference was shown in the excretion rate of control nanoparticles and nanoparticles containing MLI for type S tumors (tumor volume V <500 mm3 ). The distance traveled by the nanoparticle was estimated as the average radius of the tumor, which for the type S tumor was ΔL = 2.2 mm. The delay time was considered to be 1.75 hours (see FIG. 1). Based on these data, the estimate of the pressure in the tumor was about 2.5 kPa (or 19.4 mmHg).
Измерение давления в опухоли также было проведено стандартным на сегодняшний день методом «Тампон-в-игле» в соответствии с работой [Boucher Y., Baxter L.Т., Jain R.K. Interstitial pressure gradients in tissue-isolated and subcutaneous tumors: implications for therapy // Cancer research. - 1990. - T. 50. - №. 15. - C. 4478-4484]. Для измерения использовали прибор DSI ТА11РА-C10 (Data Sciences International, New Brighton, MN, USA). Перед проведением измерений игла прибора имплантировалась в организм животного. Конец иглы устанавливался непосредственно в центре опухоли. Перед трансплантацией прибор был откалиброван для стандартных условий эксперимента. Мышей подвергали анестезии смесью изофлурана и кислорода. Проведенные измерения показали значение давления в центре опухоли, сравнимое с рассчитанным на основании представленных экспериментальных данных по времени задержки выведения наночастиц, конъюгированных с MLI, по сравнению с контрольными наночастицами, и составило 2,65 кПа.Measurement of pressure in the tumor was also carried out by the standard “Tampon-in-needle” method in accordance with [Boucher Y., Baxter L.T., Jain R.K. Interstitial pressure gradients in tissue-isolated and subcutaneous tumors: implications for therapy // Cancer research. - 1990. - T. 50. - No. 15. - C. 4478-4484]. A DSI TA11RA-C10 instrument (Data Sciences International, New Brighton, MN, USA) was used for measurement. Before the measurements, the needle of the device was implanted into the body of the animal. The end of the needle was placed directly in the center of the tumor. Before transplantation, the instrument was calibrated for standard experimental conditions. The mice were anesthetized with a mixture of isoflurane and oxygen. The measurements showed a pressure in the center of the tumor, comparable to the control nanoparticles, calculated on the basis of the experimental data on the delay time for the elimination of nanoparticles conjugated with MLI, and amounted to 2.65 kPa.
Пример 2Example 2
Для опухоли типа В (объем опухоли V>500 мм3) достоверного различия времени выведения контрольных наночастиц и наночастиц, конъюгированных с MLI, не наблюдалось (см. фиг. 1), что свидетельствует о существенно большем давлении внутри опухолей такого размера. Расстояние, пройденное наночастицей оценивали, как средний радиус опухоли, который для опухоли типа В составил ΔL=4,8 мм. Расчетное время задержки выведения наночастиц с MLI составило 10 мин, значение давления в опухоли составило 4,2 кПа.For a type B tumor (tumor volume V> 500 mm3 ), there was no significant difference in the excretion time of control nanoparticles and nanoparticles conjugated with MLI (see Fig. 1), which indicates a significantly higher pressure inside tumors of this size. The distance traveled by the nanoparticle was estimated as the average radius of the tumor, which for the type B tumor was ΔL = 4.8 mm. The estimated delay time for the elimination of nanoparticles with MLI was 10 minutes, the pressure in the tumor was 4.2 kPa.
Как и в примере 1, значение давления в центре опухоли также было определенно прямым инзазивным методом «Тампон-в-игле». Значение давления внутри опухоли составило 4,5 кПа.As in Example 1, the pressure at the center of the tumor was also determined by the directly invasive Swab-in-Needle method. The pressure inside the tumor was 4.5 kPa.
Таким образом, значение максимального давления в центре опухоли, определенное с помощью предлагаемого метода на основании задержки выведения наночастиц, конъюгированных с лектином вискумин, и методом прямого инвазивного измерения путем введения в опухоль датчика, составляет не более 10%.Thus, the value of the maximum pressure in the center of the tumor, determined using the proposed method based on the delay in the excretion of nanoparticles conjugated with viscumin lectin, and the method of direct invasive measurement by introducing a sensor into the tumor, is no more than 10%.
Поскольку все выкладки, приведенные в патенте, не затрагивают специфичные для организма мыши параметры, их можно использовать и для аналогичных исследований у человека.Since all calculations presented in the patent do not affect the parameters specific to the mouse organism, they can be used for similar studies in humans.
Claims (27)
Translated fromRussian

Priority Applications (1)
| Application Number | Priority Date | Filing Date | Title |
|---|---|---|---|
| RU2016152532ARU2632625C1 (en) | 2016-12-30 | 2016-12-30 | Method for determination of pressure in tumour |
Applications Claiming Priority (1)
| Application Number | Priority Date | Filing Date | Title |
|---|---|---|---|
| RU2016152532ARU2632625C1 (en) | 2016-12-30 | 2016-12-30 | Method for determination of pressure in tumour |
Publications (1)
| Publication Number | Publication Date |
|---|---|
| RU2632625C1true RU2632625C1 (en) | 2017-10-06 |
Family
ID=60040727
Family Applications (1)
| Application Number | Title | Priority Date | Filing Date |
|---|---|---|---|
| RU2016152532ARU2632625C1 (en) | 2016-12-30 | 2016-12-30 | Method for determination of pressure in tumour |
Country Status (1)
| Country | Link |
|---|---|
| RU (1) | RU2632625C1 (en) |
Citations (2)
| Publication number | Priority date | Publication date | Assignee | Title |
|---|---|---|---|---|
| US20060287647A1 (en)* | 2001-06-15 | 2006-12-21 | Monteris Medical, Inc. | Hyperthermia treatment and probe therefor |
| CN101912622A (en)* | 2010-08-11 | 2010-12-15 | 东南大学 | Targeted microbubble probe for magnetic resonance imaging and blood pressure monitoring and preparation method thereof |
- 2016
- 2016-12-30RURU2016152532Apatent/RU2632625C1/enactive
Patent Citations (2)
| Publication number | Priority date | Publication date | Assignee | Title |
|---|---|---|---|---|
| US20060287647A1 (en)* | 2001-06-15 | 2006-12-21 | Monteris Medical, Inc. | Hyperthermia treatment and probe therefor |
| CN101912622A (en)* | 2010-08-11 | 2010-12-15 | 东南大学 | Targeted microbubble probe for magnetic resonance imaging and blood pressure monitoring and preparation method thereof |
Non-Patent Citations (6)
| Title |
|---|
| Boucher Y. et al. Interstitial pressure gradients in tissue-isolated and subcutaneous tumors: implications for therapy // Cancer res. 1990, 50(15): 4478-4484* |
| Gao M.et al. Combretastatin-A4 phosphate improves the distribution and antitumor efficacy of albumin-bound paclitaxel in W256 breast carcinoma model // Oncotarget. 2016 Sep 6; 7(36): 58133-58141* |
| Heldin С.Н. et al. High interstitial fluid pressure - an obstacle in cancer therapy // Nat. Rev. Cancer 2004, 4: 806-13. Jain R.K. et al. The role of mechanical forces in tumor growth and therapy// Ann. Rev. Biomed. Eng. 2014, 16: 321-46* |
| Murakami M. et al. Docetaxel conjugate nanoparticles that target α-smooth muscle actin-expressing stromal cells suppress breast cancer metastasis // Cancer Res. 2013 Aug 1; 73(15): 4862-71.* |
| Никифоров В.Н. Медицинские применения магнитных наночастиц // Известия Акад. инженерн. наук им. А.М. Прохорова, 2013, 3, с.23-34.* |
| Никифоров В.Н. Медицинские применения магнитных наночастиц // Известия Акад. инженерн. наук им. А.М. Прохорова, 2013, 3, с.23-34. Gao M.et al. Combretastatin-A4 phosphate improves the distribution and antitumor efficacy of albumin-bound paclitaxel in W256 breast carcinoma model // Oncotarget. 2016 Sep 6; 7(36): 58133-58141. Heldin С.Н. et al. High interstitial fluid pressure - an obstacle in cancer therapy // Nat. Rev. Cancer 2004, 4: 806-13. Jain R.K. et al. The role of mechanical forces in tumor growth and therapy// Ann. Rev. Biomed. Eng. 2014, 16: 321-46. Boucher Y. et al. Interstitial pressure gradients in tissue-isolated and subcutaneous tumors: implications for therapy // Cancer res. 1990, 50(15): 4478-4484. Murakami M. et al. Docetaxel conjugate nanoparticles that target α-smooth muscle actin-expressing stromal cells suppress breast cancer metastasis // Cancer Res. 2013 Aug 1; 73(15): 4862-71.* |
Similar Documents
| Publication | Publication Date | Title |
|---|---|---|
| US10695025B2 (en) | Wearable ultrasonic device for circulating tumor cell detection | |
| Zhou et al. | Hypoxia-triggered self-assembly of ultrasmall iron oxide nanoparticles to amplify the imaging signal of a tumor | |
| Cheng et al. | Construction and validation of nano gold tripods for molecular imaging of living subjects | |
| JP5805651B2 (en) | Detection, measurement, and imaging of cells and other biological materials such as cancer using target nanoparticles and their magnetic particles | |
| Drevs et al. | PTK787/ZK 222584, a specific vascular endothelial growth factor-receptor tyrosine kinase inhibitor, affects the anatomy of the tumor vascular bed and the functional vascular properties as detected by dynamic enhanced magnetic resonance imaging | |
| US9833144B2 (en) | Probes, methods of making probes, and methods of use | |
| US20120035458A1 (en) | Detection, measurement, and imaging of cells such as cancer and other biologic substances using targeted nanoparticles and magnetic properties thereof | |
| Platt et al. | Canine model of convection-enhanced delivery of cetuximab-conjugated iron-oxide nanoparticles monitored with magnetic resonance imaging | |
| Cho et al. | Sensitive angiogenesis imaging of orthotopic bladder tumors in mice using a selective magnetic resonance imaging contrast agent containing VEGF121/rGel | |
| Li et al. | Targeted Fe-doped silica nanoparticles as a novel ultrasound–magnetic resonance dual-mode imaging contrast agent for HER2-positive breast cancer | |
| Zhang et al. | Optical magnetic multimodality imaging of plectin-1-targeted imaging agent for the precise detection of orthotopic pancreatic ductal adenocarcinoma in mice | |
| Saito et al. | Longitudinal imaging studies of tumor microenvironment in mice treated with the mTOR inhibitor rapamycin | |
| Takakusagi et al. | A multimodal molecular imaging study evaluates pharmacological alteration of the tumor microenvironment to improve radiation response | |
| Yasui et al. | Quantitative imaging of pO2 in orthotopic murine gliomas: hypoxia correlates with resistance to radiation | |
| Centelles et al. | Focused ultrasound induced hyperthermia accelerates and increases the uptake of anti-HER-2 antibodies in a xenograft model | |
| Huang et al. | Ultrasound-induced magnetic imaging of tumors targeted by biofunctional magnetic nanoparticles | |
| Kombala et al. | Development of a nanoscale chemical exchange saturation transfer magnetic resonance imaging contrast agent that measures pH | |
| Dou et al. | Custom-designed laser-based heating apparatus for triggered release of cisplatin from thermosensitive liposomes with magnetic resonance image guidance | |
| Zhao et al. | Non-invasive assessment for intratumoural distribution of interstitial fluid flow | |
| CA2439298A1 (en) | Methods and reagents to acquire mri signals and images | |
| US10194825B2 (en) | Methods and apparatuses for the localization and treatment of disease such as cancer | |
| US20140322137A1 (en) | Detection Of Targeted Biological Substances Using Magnetic Relaxation Of Individual Nanoparticles | |
| RU2632625C1 (en) | Method for determination of pressure in tumour | |
| Qiu et al. | CXCR4-targeted ultrasound microbubbles for imaging and enhanced chemotherapy/Immunotherapy in liver cancer | |
| US20130052131A1 (en) | Nanoparticles, methods of making nanoparticles, and methods of use |