RU2426107C2 - Voltammetric method of determining concentration of analyte in sample and device for determining concentration of analyte - Google Patents
Voltammetric method of determining concentration of analyte in sample and device for determining concentration of analyteDownload PDFInfo
- Publication number
- RU2426107C2 RU2426107C2RU2008117118/28ARU2008117118ARU2426107C2RU 2426107 C2RU2426107 C2RU 2426107C2RU 2008117118/28 ARU2008117118/28 ARU 2008117118/28ARU 2008117118 ARU2008117118 ARU 2008117118ARU 2426107 C2RU2426107 C2RU 2426107C2
- Authority
- RU
- Russia
- Prior art keywords
- sample
- analyte
- excitation
- current
- concentration
- Prior art date
Links
- 239000012491analyteSubstances0.000titleclaimsabstractdescription126
- 238000004832voltammetryMethods0.000titleclaimsabstractdescription10
- 230000005284excitationEffects0.000claimsabstractdescription209
- 239000000126substanceSubstances0.000claimsabstractdescription94
- 238000001208nuclear magnetic resonance pulse sequenceMethods0.000claimsabstractdescription72
- 125000004122cyclic groupChemical group0.000claimsdescription92
- 238000000034methodMethods0.000claimsdescription76
- 230000002441reversible effectEffects0.000claimsdescription69
- WQZGKKKJIJFFOK-GASJEMHNSA-NGlucoseNatural productsOC[C@H]1OC(O)[C@H](O)[C@@H](O)[C@@H]1OWQZGKKKJIJFFOK-GASJEMHNSA-N0.000claimsdescription68
- 239000008103glucoseSubstances0.000claimsdescription68
- 230000003647oxidationEffects0.000claimsdescription48
- 238000007254oxidation reactionMethods0.000claimsdescription48
- 238000009792diffusion processMethods0.000claimsdescription36
- 238000012545processingMethods0.000claimsdescription27
- 230000004044responseEffects0.000claimsdescription10
- 239000007788liquidSubstances0.000claimsdescription9
- 239000013060biological fluidSubstances0.000claimsdescription8
- 238000012935AveragingMethods0.000claimsdescription7
- 239000003795chemical substances by applicationSubstances0.000claimsdescription7
- 230000007423decreaseEffects0.000claimsdescription7
- 238000011084recoveryMethods0.000claimsdescription5
- 230000004888barrier functionEffects0.000claimsdescription4
- 238000004891communicationMethods0.000claimsdescription3
- 230000002596correlated effectEffects0.000claimsdescription3
- 230000000977initiatory effectEffects0.000claimsdescription3
- 150000002500ionsChemical class0.000claims3
- 125000002791glucosyl groupChemical groupC1([C@H](O)[C@@H](O)[C@H](O)[C@H](O1)CO)*0.000claims1
- 230000000694effectsEffects0.000abstractdescription23
- 239000000523sampleSubstances0.000description108
- 238000004458analytical methodMethods0.000description70
- WQZGKKKJIJFFOK-VFUOTHLCSA-Nbeta-D-glucoseChemical compoundOC[C@H]1O[C@@H](O)[C@H](O)[C@@H](O)[C@@H]1OWQZGKKKJIJFFOK-VFUOTHLCSA-N0.000description70
- 239000003153chemical reaction reagentSubstances0.000description59
- 239000010410layerSubstances0.000description58
- 239000004020conductorSubstances0.000description48
- 238000005534hematocritMethods0.000description44
- 238000010586diagramMethods0.000description32
- 238000006722reduction reactionMethods0.000description31
- 230000009467reductionEffects0.000description30
- 230000002829reductive effectEffects0.000description30
- YAGKRVSRTSUGEY-UHFFFAOYSA-NferricyanideChemical compound[Fe+3].N#[C-].N#[C-].N#[C-].N#[C-].N#[C-].N#[C-]YAGKRVSRTSUGEY-UHFFFAOYSA-N0.000description29
- 238000002484cyclic voltammetryMethods0.000description24
- 238000005259measurementMethods0.000description22
- 230000006870functionEffects0.000description19
- 108010015776Glucose oxidaseProteins0.000description18
- 239000004366Glucose oxidaseSubstances0.000description17
- 238000006243chemical reactionMethods0.000description17
- 229940116332glucose oxidaseDrugs0.000description17
- 235000019420glucose oxidaseNutrition0.000description17
- 108090000854OxidoreductasesProteins0.000description15
- 102000004316OxidoreductasesHuman genes0.000description15
- 210000004027cellAnatomy0.000description15
- 239000000463materialSubstances0.000description14
- 238000001075voltammogramMethods0.000description14
- 102000004190EnzymesHuman genes0.000description13
- 108090000790EnzymesProteins0.000description13
- 229940088598enzymeDrugs0.000description13
- 239000011230binding agentSubstances0.000description12
- 238000003869coulometryMethods0.000description12
- 230000007704transitionEffects0.000description12
- 238000004082amperometric methodMethods0.000description11
- 230000001965increasing effectEffects0.000description11
- 239000000203mixtureSubstances0.000description11
- 210000004369bloodAnatomy0.000description10
- 239000008280bloodSubstances0.000description10
- 230000008859changeEffects0.000description10
- 230000000875corresponding effectEffects0.000description10
- 238000011049fillingMethods0.000description10
- 239000002609mediumSubstances0.000description10
- 238000003860storageMethods0.000description9
- 230000008901benefitEffects0.000description8
- 230000001590oxidative effectEffects0.000description8
- 229910052723transition metalInorganic materials0.000description8
- 150000003624transition metalsChemical class0.000description8
- 229920002134Carboxymethyl cellulosePolymers0.000description6
- 229920003171Poly (ethylene oxide)Polymers0.000description6
- 238000007796conventional methodMethods0.000description6
- 229910052799carbonInorganic materials0.000description5
- 229920002678cellulosePolymers0.000description5
- 239000001913celluloseSubstances0.000description5
- 238000000840electrochemical analysisMethods0.000description5
- 238000002848electrochemical methodMethods0.000description5
- 238000011534incubationMethods0.000description5
- 229910052751metalInorganic materials0.000description5
- 239000002184metalSubstances0.000description5
- 230000008569processEffects0.000description5
- 239000002344surface layerSubstances0.000description5
- 238000012546transferMethods0.000description5
- 239000001856Ethyl celluloseSubstances0.000description4
- ZZSNKZQZMQGXPY-UHFFFAOYSA-NEthyl celluloseChemical compoundCCOCC1OC(OC)C(OCC)C(OCC)C1OC1C(O)C(O)C(OC)C(CO)O1ZZSNKZQZMQGXPY-UHFFFAOYSA-N0.000description4
- 108010050375Glucose 1-DehydrogenaseProteins0.000description4
- KDLHZDBZIXYQEI-UHFFFAOYSA-NPalladiumChemical compound[Pd]KDLHZDBZIXYQEI-UHFFFAOYSA-N0.000description4
- 239000004372Polyvinyl alcoholSubstances0.000description4
- 230000015572biosynthetic processEffects0.000description4
- 230000001934delayEffects0.000description4
- 229920001249ethyl cellulosePolymers0.000description4
- 235000019325ethyl celluloseNutrition0.000description4
- 239000003446ligandSubstances0.000description4
- BASFCYQUMIYNBI-UHFFFAOYSA-NplatinumChemical compound[Pt]BASFCYQUMIYNBI-UHFFFAOYSA-N0.000description4
- 229920000642polymerPolymers0.000description4
- 229920002451polyvinyl alcoholPolymers0.000description4
- 238000006479redox reactionMethods0.000description4
- XLYOFNOQVPJJNP-UHFFFAOYSA-NwaterSubstancesOXLYOFNOQVPJJNP-UHFFFAOYSA-N0.000description4
- OKTJSMMVPCPJKN-UHFFFAOYSA-NCarbonChemical compound[C]OKTJSMMVPCPJKN-UHFFFAOYSA-N0.000description3
- MYMOFIZGZYHOMD-UHFFFAOYSA-NDioxygenChemical compoundO=OMYMOFIZGZYHOMD-UHFFFAOYSA-N0.000description3
- PEDCQBHIVMGVHV-UHFFFAOYSA-NGlycerineChemical compoundOCC(O)COPEDCQBHIVMGVHV-UHFFFAOYSA-N0.000description3
- 239000012472biological sampleSubstances0.000description3
- 125000004432carbon atomChemical groupC*0.000description3
- 230000015556catabolic processEffects0.000description3
- 239000011248coating agentSubstances0.000description3
- 238000000576coating methodMethods0.000description3
- 230000002950deficientEffects0.000description3
- 238000006731degradation reactionMethods0.000description3
- 206010012601diabetes mellitusDiseases0.000description3
- 229910001882dioxygenInorganic materials0.000description3
- 238000003487electrochemical reactionMethods0.000description3
- 239000004312hexamethylene tetramineSubstances0.000description3
- 230000006872improvementEffects0.000description3
- 239000002858neurotransmitter agentSubstances0.000description3
- 238000007639printingMethods0.000description3
- 238000000926separation methodMethods0.000description3
- 108010025188Alcohol oxidaseProteins0.000description2
- IJGRMHOSHXDMSA-UHFFFAOYSA-NAtomic nitrogenChemical compoundN#NIJGRMHOSHXDMSA-UHFFFAOYSA-N0.000description2
- BPYKTIZUTYGOLE-IFADSCNNSA-NBilirubinChemical compoundN1C(=O)C(C)=C(C=C)\C1=C\C1=C(C)C(CCC(O)=O)=C(CC2=C(C(C)=C(\C=C/3C(=C(C=C)C(=O)N\3)C)N2)CCC(O)=O)N1BPYKTIZUTYGOLE-IFADSCNNSA-N0.000description2
- 108010089254Cholesterol oxidaseProteins0.000description2
- 241000218691CupressaceaeSpecies0.000description2
- LFQSCWFLJHTTHZ-UHFFFAOYSA-NEthanolChemical compoundCCOLFQSCWFLJHTTHZ-UHFFFAOYSA-N0.000description2
- 229920002153Hydroxypropyl cellulosePolymers0.000description2
- XEEYBQQBJWHFJM-UHFFFAOYSA-NIronChemical group[Fe]XEEYBQQBJWHFJM-UHFFFAOYSA-N0.000description2
- BQCADISMDOOEFD-UHFFFAOYSA-NSilverChemical compound[Ag]BQCADISMDOOEFD-UHFFFAOYSA-N0.000description2
- 108010092464Urate OxidaseProteins0.000description2
- 239000013543active substanceSubstances0.000description2
- 125000004429atomChemical group0.000description2
- 230000006399behaviorEffects0.000description2
- 150000001721carbonChemical group0.000description2
- 229910002091carbon monoxideInorganic materials0.000description2
- HVYWMOMLDIMFJA-DPAQBDIFSA-NcholesterolChemical compoundC1C=C2C[C@@H](O)CC[C@]2(C)[C@@H]2[C@@H]1[C@@H]1CC[C@H]([C@H](C)CCCC(C)C)[C@@]1(C)CC2HVYWMOMLDIMFJA-DPAQBDIFSA-N0.000description2
- 239000000470constituentSubstances0.000description2
- 150000004696coordination complexChemical class0.000description2
- 238000012937correctionMethods0.000description2
- 230000001419dependent effectEffects0.000description2
- 238000000151depositionMethods0.000description2
- 230000008021depositionEffects0.000description2
- 238000013461designMethods0.000description2
- 210000003743erythrocyteAnatomy0.000description2
- KTWOOEGAPBSYNW-UHFFFAOYSA-NferroceneChemical compound[Fe+2].C=1C=C[CH-]C=1.C=1C=C[CH-]C=1KTWOOEGAPBSYNW-UHFFFAOYSA-N0.000description2
- PCHJSUWPFVWCPO-UHFFFAOYSA-NgoldChemical compound[Au]PCHJSUWPFVWCPO-UHFFFAOYSA-N0.000description2
- 229910052737goldInorganic materials0.000description2
- 239000010931goldSubstances0.000description2
- 239000001863hydroxypropyl celluloseSubstances0.000description2
- 235000010977hydroxypropyl celluloseNutrition0.000description2
- 230000010354integrationEffects0.000description2
- 229910052742ironInorganic materials0.000description2
- 238000004519manufacturing processMethods0.000description2
- 229910052763palladiumInorganic materials0.000description2
- 125000001791phenazinyl groupChemical classC1(=CC=CC2=NC3=CC=CC=C3N=C12)*0.000description2
- 229910052697platinumInorganic materials0.000description2
- 229920000036polyvinylpyrrolidonePolymers0.000description2
- 239000001267polyvinylpyrrolidoneSubstances0.000description2
- 235000013855polyvinylpyrrolidoneNutrition0.000description2
- 239000011148porous materialSubstances0.000description2
- 238000011002quantificationMethods0.000description2
- 239000000376reactantSubstances0.000description2
- 238000005070samplingMethods0.000description2
- 230000001953sensory effectEffects0.000description2
- 229910052709silverInorganic materials0.000description2
- 239000004332silverSubstances0.000description2
- HKZLPVFGJNLROG-UHFFFAOYSA-Msilver monochlorideChemical compound[Cl-].[Ag+]HKZLPVFGJNLROG-UHFFFAOYSA-M0.000description2
- 239000000758substrateSubstances0.000description2
- 239000000725suspensionSubstances0.000description2
- 238000012360testing methodMethods0.000description2
- AKRDMBNEEYBOIK-GEMLJDPKSA-N(2s)-2-amino-5-[[(2r)-1-(carboxymethylamino)-1-oxo-3-sulfanylpropan-2-yl]amino]-5-oxopentanoic acid;7,9-dihydro-3h-purine-2,6,8-trioneChemical compoundN1C(=O)NC(=O)C2=C1NC(=O)N2.OC(=O)[C@@H](N)CCC(=O)N[C@@H](CS)C(=O)NCC(O)=OAKRDMBNEEYBOIK-GEMLJDPKSA-N0.000description1
- GEYOCULIXLDCMW-UHFFFAOYSA-N1,2-phenylenediamineChemical compoundNC1=CC=CC=C1NGEYOCULIXLDCMW-UHFFFAOYSA-N0.000description1
- SMZOUWXMTYCWNB-UHFFFAOYSA-N2-(2-methoxy-5-methylphenyl)ethanamineChemical compoundCOC1=CC=C(C)C=C1CCNSMZOUWXMTYCWNB-UHFFFAOYSA-N0.000description1
- NIXOWILDQLNWCW-UHFFFAOYSA-N2-Propenoic acidNatural productsOC(=O)C=CNIXOWILDQLNWCW-UHFFFAOYSA-N0.000description1
- VXUGVISSBXKUEL-UHFFFAOYSA-N2-hydroxypropanoic acid;2-oxopropanoic acidChemical compoundCC(O)C(O)=O.CC(=O)C(O)=OVXUGVISSBXKUEL-UHFFFAOYSA-N0.000description1
- 108010015428Bilirubin oxidaseProteins0.000description1
- UGFAIRIUMAVXCW-UHFFFAOYSA-NCarbon monoxideChemical compound[O+]#[C-]UGFAIRIUMAVXCW-UHFFFAOYSA-N0.000description1
- RYGMFSIKBFXOCR-UHFFFAOYSA-NCopperChemical compound[Cu]RYGMFSIKBFXOCR-UHFFFAOYSA-N0.000description1
- 108020005199DehydrogenasesProteins0.000description1
- 229920002307DextranPolymers0.000description1
- IMROMDMJAWUWLK-UHFFFAOYSA-NEthenolChemical groupOC=CIMROMDMJAWUWLK-UHFFFAOYSA-N0.000description1
- 108010010803GelatinProteins0.000description1
- 108010063907Glutathione ReductaseProteins0.000description1
- 102100036442Glutathione reductase, mitochondrialHuman genes0.000description1
- 102000057621Glycerol kinasesHuman genes0.000description1
- 108700016170Glycerol kinasesProteins0.000description1
- 102000003855L-lactate dehydrogenaseHuman genes0.000description1
- 108700023483L-lactate dehydrogenasesProteins0.000description1
- JVTAAEKCZFNVCJ-UHFFFAOYSA-MLactateChemical compoundCC(O)C([O-])=OJVTAAEKCZFNVCJ-UHFFFAOYSA-M0.000description1
- 102100022119Lipoprotein lipaseHuman genes0.000description1
- CERQOIWHTDAKMF-UHFFFAOYSA-NMethacrylic acidChemical compoundCC(=C)C(O)=OCERQOIWHTDAKMF-UHFFFAOYSA-N0.000description1
- 150000001204N-oxidesChemical class0.000description1
- 229930192627NaphthoquinoneNatural products0.000description1
- OAICVXFJPJFONN-UHFFFAOYSA-NPhosphorusChemical compound[P]OAICVXFJPJFONN-UHFFFAOYSA-N0.000description1
- 239000002202Polyethylene glycolSubstances0.000description1
- 108010039918PolylysineProteins0.000description1
- LCTONWCANYUPML-UHFFFAOYSA-MPyruvateChemical compoundCC(=O)C([O-])=OLCTONWCANYUPML-UHFFFAOYSA-M0.000description1
- 108010042687Pyruvate OxidaseProteins0.000description1
- 108091007187ReductasesProteins0.000description1
- KJTLSVCANCCWHF-UHFFFAOYSA-NRutheniumChemical group[Ru]KJTLSVCANCCWHF-UHFFFAOYSA-N0.000description1
- 229910021607Silver chlorideInorganic materials0.000description1
- 229920002472StarchPolymers0.000description1
- 102000000019Sterol EsteraseHuman genes0.000description1
- 108010055297Sterol EsteraseProteins0.000description1
- NINIDFKCEFEMDL-UHFFFAOYSA-NSulfurChemical compound[S]NINIDFKCEFEMDL-UHFFFAOYSA-N0.000description1
- LEHOTFFKMJEONL-UHFFFAOYSA-NUric AcidChemical compoundN1C(=O)NC(=O)C2=C1NC(=O)N2LEHOTFFKMJEONL-UHFFFAOYSA-N0.000description1
- TVWHNULVHGKJHS-UHFFFAOYSA-NUric acidNatural productsN1C(=O)NC(=O)C2NC(=O)NC21TVWHNULVHGKJHS-UHFFFAOYSA-N0.000description1
- 230000003213activating effectEffects0.000description1
- 239000012736aqueous mediumSubstances0.000description1
- 238000003556assayMethods0.000description1
- QVGXLLKOCUKJST-UHFFFAOYSA-Natomic oxygenChemical compound[O]QVGXLLKOCUKJST-UHFFFAOYSA-N0.000description1
- 230000002238attenuated effectEffects0.000description1
- 210000001124body fluidAnatomy0.000description1
- 239000010839body fluidSubstances0.000description1
- 238000004364calculation methodMethods0.000description1
- 239000001768carboxy methyl celluloseSubstances0.000description1
- 235000010948carboxy methyl celluloseNutrition0.000description1
- 239000008112carboxymethyl-celluloseSubstances0.000description1
- 239000007795chemical reaction productSubstances0.000description1
- 235000012000cholesterolNutrition0.000description1
- 239000005515coenzymeSubstances0.000description1
- 238000010276constructionMethods0.000description1
- 229910052802copperInorganic materials0.000description1
- 239000010949copperSubstances0.000description1
- 125000000058cyclopentadienyl groupChemical groupC1(=CC=CC1)*0.000description1
- 238000001514detection methodMethods0.000description1
- 238000003745diagnosisMethods0.000description1
- 239000003989dielectric materialSubstances0.000description1
- 230000037213dietEffects0.000description1
- 235000005911dietNutrition0.000description1
- 208000037265diseases, disorders, signs and symptomsDiseases0.000description1
- 230000005611electricityEffects0.000description1
- 239000000839emulsionSubstances0.000description1
- ZSWFCLXCOIISFI-UHFFFAOYSA-Nendo-cyclopentadieneNatural productsC1C=CC=C1ZSWFCLXCOIISFI-UHFFFAOYSA-N0.000description1
- 238000005516engineering processMethods0.000description1
- 230000002708enhancing effectEffects0.000description1
- 239000000706filtrateSubstances0.000description1
- 150000002211flavinsChemical class0.000description1
- 239000011888foilSubstances0.000description1
- 235000011389fruit/vegetable juiceNutrition0.000description1
- 239000007789gasSubstances0.000description1
- 229920000159gelatinPolymers0.000description1
- 239000008273gelatinSubstances0.000description1
- 235000019322gelatineNutrition0.000description1
- 235000011852gelatine dessertsNutrition0.000description1
- 125000005842heteroatomChemical group0.000description1
- 150000002443hydroxylaminesChemical class0.000description1
- 230000003993interactionEffects0.000description1
- 230000000670limiting effectEffects0.000description1
- 108010022197lipoprotein cholesterolProteins0.000description1
- 230000014759maintenance of locationEffects0.000description1
- FPYJFEHAWHCUMM-UHFFFAOYSA-Nmaleic anhydrideChemical compoundO=C1OC(=O)C=C1FPYJFEHAWHCUMM-UHFFFAOYSA-N0.000description1
- 230000007246mechanismEffects0.000description1
- 229910021645metal ionInorganic materials0.000description1
- 238000001465metallisationMethods0.000description1
- 150000002739metalsChemical class0.000description1
- 229920000609methyl cellulosePolymers0.000description1
- 239000001923methylcelluloseSubstances0.000description1
- 235000010981methylcelluloseNutrition0.000description1
- 238000012806monitoring deviceMethods0.000description1
- 238000012544monitoring processMethods0.000description1
- DLZPPUIHGWXDNJ-UHFFFAOYSA-Nn-phenylphenothiazin-3-imineChemical classC1=CC=CC=C1N=C1C=C2SC3=CC=CC=C3N=C2C=C1DLZPPUIHGWXDNJ-UHFFFAOYSA-N0.000description1
- LJXXBBCNKKOAHS-UHFFFAOYSA-Nn-phenylphenoxazin-3-imineChemical compoundC1=CC=CC=C1N=C1C=C2OC3=CC=CC=C3N=C2C=C1LJXXBBCNKKOAHS-UHFFFAOYSA-N0.000description1
- 150000002791naphthoquinonesChemical class0.000description1
- 229910052757nitrogenInorganic materials0.000description1
- 150000002832nitroso derivativesChemical class0.000description1
- 229910052755nonmetalInorganic materials0.000description1
- 230000003287optical effectEffects0.000description1
- 230000033116oxidation-reduction processEffects0.000description1
- 239000012476oxidizable substanceSubstances0.000description1
- 229910052760oxygenInorganic materials0.000description1
- 239000001301oxygenSubstances0.000description1
- 230000000737periodic effectEffects0.000description1
- 125000001484phenothiazinyl groupChemical classC1(=CC=CC=2SC3=CC=CC=C3NC12)*0.000description1
- 229910052698phosphorusInorganic materials0.000description1
- 239000011574phosphorusSubstances0.000description1
- 229920001308poly(aminoacid)Polymers0.000description1
- 229920001467poly(styrenesulfonates)Polymers0.000description1
- 229920002401polyacrylamidePolymers0.000description1
- 229920001223polyethylene glycolPolymers0.000description1
- 229920000656polylysinePolymers0.000description1
- YEBIHIICWDDQOL-YBHNRIQQSA-NpolyoxinChemical compoundO[C@@H]1[C@H](O)[C@@H](C(C=O)N)O[C@H]1N1C(=O)NC(=O)C(C(O)=O)=C1YEBIHIICWDDQOL-YBHNRIQQSA-N0.000description1
- 229960002796polystyrene sulfonateDrugs0.000description1
- 239000011970polystyrene sulfonateSubstances0.000description1
- 239000002244precipitateSubstances0.000description1
- 238000001556precipitationMethods0.000description1
- 238000002360preparation methodMethods0.000description1
- 238000003672processing methodMethods0.000description1
- 102000004169proteins and genesHuman genes0.000description1
- 108090000623proteins and genesProteins0.000description1
- 230000008929regenerationEffects0.000description1
- 238000011069regeneration methodMethods0.000description1
- 230000001105regulatory effectEffects0.000description1
- 238000011160researchMethods0.000description1
- 230000027756respiratory electron transport chainEffects0.000description1
- 238000012552reviewMethods0.000description1
- 229910052707rutheniumInorganic materials0.000description1
- 210000003296salivaAnatomy0.000description1
- 150000003839saltsChemical class0.000description1
- 239000004065semiconductorSubstances0.000description1
- 230000011664signalingEffects0.000description1
- 238000001179sorption measurementMethods0.000description1
- 239000008107starchSubstances0.000description1
- 235000019698starchNutrition0.000description1
- 229910052717sulfurInorganic materials0.000description1
- 239000011593sulfurSubstances0.000description1
- 230000009897systematic effectEffects0.000description1
- 230000036962time dependentEffects0.000description1
- 230000009466transformationEffects0.000description1
- 150000003626triacylglycerolsChemical class0.000description1
- WFKWXMTUELFFGS-UHFFFAOYSA-NtungstenChemical compound[W]WFKWXMTUELFFGS-UHFFFAOYSA-N0.000description1
- 229910052721tungstenInorganic materials0.000description1
- 239000010937tungstenSubstances0.000description1
- 229940116269uric acidDrugs0.000description1
- 210000002700urineAnatomy0.000description1
- 238000001771vacuum depositionMethods0.000description1
- 229910052720vanadiumInorganic materials0.000description1
- 239000003232water-soluble binding agentSubstances0.000description1
Images


Classifications
- G—PHYSICS
- G01—MEASURING; TESTING
- G01N—INVESTIGATING OR ANALYSING MATERIALS BY DETERMINING THEIR CHEMICAL OR PHYSICAL PROPERTIES
- G01N27/00—Investigating or analysing materials by the use of electric, electrochemical, or magnetic means
- G01N27/26—Investigating or analysing materials by the use of electric, electrochemical, or magnetic means by investigating electrochemical variables; by using electrolysis or electrophoresis
- G01N27/416—Systems
- G01N27/48—Systems using polarography, i.e. measuring changes in current under a slowly-varying voltage
- A—HUMAN NECESSITIES
- A61—MEDICAL OR VETERINARY SCIENCE; HYGIENE
- A61B—DIAGNOSIS; SURGERY; IDENTIFICATION
- A61B5/00—Measuring for diagnostic purposes; Identification of persons
- A61B5/145—Measuring characteristics of blood in vivo, e.g. gas concentration or pH-value ; Measuring characteristics of body fluids or tissues, e.g. interstitial fluid or cerebral tissue
- A61B5/14532—Measuring characteristics of blood in vivo, e.g. gas concentration or pH-value ; Measuring characteristics of body fluids or tissues, e.g. interstitial fluid or cerebral tissue for measuring glucose, e.g. by tissue impedance measurement
- A—HUMAN NECESSITIES
- A61—MEDICAL OR VETERINARY SCIENCE; HYGIENE
- A61B—DIAGNOSIS; SURGERY; IDENTIFICATION
- A61B5/00—Measuring for diagnostic purposes; Identification of persons
- A61B5/145—Measuring characteristics of blood in vivo, e.g. gas concentration or pH-value ; Measuring characteristics of body fluids or tissues, e.g. interstitial fluid or cerebral tissue
- A61B5/1468—Measuring characteristics of blood in vivo, e.g. gas concentration or pH-value ; Measuring characteristics of body fluids or tissues, e.g. interstitial fluid or cerebral tissue using chemical or electrochemical methods, e.g. by polarographic means
- A61B5/1486—Measuring characteristics of blood in vivo, e.g. gas concentration or pH-value ; Measuring characteristics of body fluids or tissues, e.g. interstitial fluid or cerebral tissue using chemical or electrochemical methods, e.g. by polarographic means using enzyme electrodes, e.g. with immobilised oxidase
- C—CHEMISTRY; METALLURGY
- C12—BIOCHEMISTRY; BEER; SPIRITS; WINE; VINEGAR; MICROBIOLOGY; ENZYMOLOGY; MUTATION OR GENETIC ENGINEERING
- C12Q—MEASURING OR TESTING PROCESSES INVOLVING ENZYMES, NUCLEIC ACIDS OR MICROORGANISMS; COMPOSITIONS OR TEST PAPERS THEREFOR; PROCESSES OF PREPARING SUCH COMPOSITIONS; CONDITION-RESPONSIVE CONTROL IN MICROBIOLOGICAL OR ENZYMOLOGICAL PROCESSES
- C12Q1/00—Measuring or testing processes involving enzymes, nucleic acids or microorganisms; Compositions therefor; Processes of preparing such compositions
- C12Q1/001—Enzyme electrodes
- G—PHYSICS
- G01—MEASURING; TESTING
- G01N—INVESTIGATING OR ANALYSING MATERIALS BY DETERMINING THEIR CHEMICAL OR PHYSICAL PROPERTIES
- G01N27/00—Investigating or analysing materials by the use of electric, electrochemical, or magnetic means
- G01N27/26—Investigating or analysing materials by the use of electric, electrochemical, or magnetic means by investigating electrochemical variables; by using electrolysis or electrophoresis
- G01N27/28—Electrolytic cell components
- G01N27/30—Electrodes, e.g. test electrodes; Half-cells
- G01N27/327—Biochemical electrodes, e.g. electrical or mechanical details for in vitro measurements
- G01N27/3271—Amperometric enzyme electrodes for analytes in body fluids, e.g. glucose in blood
- G01N27/3273—Devices therefor, e.g. test element readers, circuitry
- G—PHYSICS
- G01—MEASURING; TESTING
- G01N—INVESTIGATING OR ANALYSING MATERIALS BY DETERMINING THEIR CHEMICAL OR PHYSICAL PROPERTIES
- G01N27/00—Investigating or analysing materials by the use of electric, electrochemical, or magnetic means
- G01N27/26—Investigating or analysing materials by the use of electric, electrochemical, or magnetic means by investigating electrochemical variables; by using electrolysis or electrophoresis
- G01N27/28—Electrolytic cell components
- G01N27/30—Electrodes, e.g. test electrodes; Half-cells
- G01N27/327—Biochemical electrodes, e.g. electrical or mechanical details for in vitro measurements
- G01N27/3271—Amperometric enzyme electrodes for analytes in body fluids, e.g. glucose in blood
- G01N27/3274—Corrective measures, e.g. error detection, compensation for temperature or hematocrit, calibration
- G—PHYSICS
- G01—MEASURING; TESTING
- G01N—INVESTIGATING OR ANALYSING MATERIALS BY DETERMINING THEIR CHEMICAL OR PHYSICAL PROPERTIES
- G01N27/00—Investigating or analysing materials by the use of electric, electrochemical, or magnetic means
- G01N27/26—Investigating or analysing materials by the use of electric, electrochemical, or magnetic means by investigating electrochemical variables; by using electrolysis or electrophoresis
- G01N27/403—Cells and electrode assemblies
- G01N27/413—Concentration cells using liquid electrolytes measuring currents or voltages in voltaic cells
- G—PHYSICS
- G01—MEASURING; TESTING
- G01N—INVESTIGATING OR ANALYSING MATERIALS BY DETERMINING THEIR CHEMICAL OR PHYSICAL PROPERTIES
- G01N33/00—Investigating or analysing materials by specific methods not covered by groups G01N1/00 - G01N31/00
- G01N33/48—Biological material, e.g. blood, urine; Haemocytometers
- G01N33/50—Chemical analysis of biological material, e.g. blood, urine; Testing involving biospecific ligand binding methods; Immunological testing
- G01N33/53—Immunoassay; Biospecific binding assay; Materials therefor
- G01N33/543—Immunoassay; Biospecific binding assay; Materials therefor with an insoluble carrier for immobilising immunochemicals
- G01N33/54366—Apparatus specially adapted for solid-phase testing
- G01N33/54373—Apparatus specially adapted for solid-phase testing involving physiochemical end-point determination, e.g. wave-guides, FETS, gratings
- G01N33/5438—Electrodes
Landscapes
- Health & Medical Sciences (AREA)
- Life Sciences & Earth Sciences (AREA)
- Chemical & Material Sciences (AREA)
- Physics & Mathematics (AREA)
- Immunology (AREA)
- Molecular Biology (AREA)
- Engineering & Computer Science (AREA)
- General Health & Medical Sciences (AREA)
- Pathology (AREA)
- Biochemistry (AREA)
- Analytical Chemistry (AREA)
- Hematology (AREA)
- Biomedical Technology (AREA)
- General Physics & Mathematics (AREA)
- Chemical Kinetics & Catalysis (AREA)
- Biophysics (AREA)
- Organic Chemistry (AREA)
- Electrochemistry (AREA)
- Medical Informatics (AREA)
- Wood Science & Technology (AREA)
- Public Health (AREA)
- Animal Behavior & Ethology (AREA)
- Surgery (AREA)
- Heart & Thoracic Surgery (AREA)
- Optics & Photonics (AREA)
- Proteomics, Peptides & Aminoacids (AREA)
- Biotechnology (AREA)
- Microbiology (AREA)
- Urology & Nephrology (AREA)
- Veterinary Medicine (AREA)
- Zoology (AREA)
- Bioinformatics & Cheminformatics (AREA)
- General Engineering & Computer Science (AREA)
- Genetics & Genomics (AREA)
- General Chemical & Material Sciences (AREA)
- Cell Biology (AREA)
- Emergency Medicine (AREA)
- Food Science & Technology (AREA)
- Medicinal Chemistry (AREA)
- Investigating Or Analysing Biological Materials (AREA)
Abstract
Description
Translated fromRussianССЫЛКА НА ПЕРЕКРЕСТНЫЕ ЗАЯВКИCROSS REFERENCE LINK
По настоящей заявке испрашивается приоритет предварительной патентной заявки США №60/722584, поданной 30 сентября 2005 года.This application claims the priority of provisional patent application US No. 60/722584, filed September 30, 2005.
ОБЛАСТЬ ТЕХНИКИFIELD OF TECHNOLOGY
Настоящее изобретение относится к количественному определению аналитов в биологических жидкостях.The present invention relates to the quantification of analytes in biological fluids.
ПРЕДШЕСТВУЮЩИЙ УРОВЕНЬ ТЕХНИКИBACKGROUND OF THE INVENTION
Количественное определение аналитов в биологических жидкостях применяют при диагностике и лечении физиологических расстройств. Например, определение уровня глюкозы в биологических жидкостях, таких как кровь, важно для людей, страдающих диабетом, которые должны часто тестировать уровень глюкозы крови для контролирования диеты и/или лечения.Quantification of analytes in biological fluids is used in the diagnosis and treatment of physiological disorders. For example, determining glucose levels in body fluids such as blood is important for people with diabetes, who must often test their blood glucose levels to monitor their diet and / or treatment.
Для данного типа анализа применяют электрохимические системы. В ходе анализа аналит подвергают окислительно-восстановительной реакции с помощью фермента или аналогичного препарата для генерирования электрического тока, который можно измерять и который соотносится с концентрацией аналита. Путем уменьшения времени, требуемого на анализ, можно получить предпочтение для пользователя, в то же время обеспечивая надлежащую точность и воспроизводимость.For this type of analysis, electrochemical systems are used. During the analysis, the analyte is subjected to a redox reaction using an enzyme or similar preparation to generate an electric current that can be measured and which correlates with the concentration of the analyte. By reducing the time required for analysis, it is possible to obtain a preference for the user, while at the same time ensuring proper accuracy and reproducibility.
Один из примеров электрохимической сенсорной системы для анализа аналитов в биологических жидкостях включает измерительное устройство и сенсорную панель. Сенсорная панель включает реагенты, которые реагируют с аналитом и переносят электроны аналита в ходе анализа, и электроды для передачи электронов через проводники к устройству. Измерительное устройство имеет контакты для получения электронов от панели, и для него обеспечена возможность приложения разности потенциалов между контактами. Устройство может регистрировать ток, проходящий через сенсор, и переводить значения тока в показатель содержания аналита в образце. Эти сенсорные системы могут анализировать одну каплю цельной крови (WB) объемом от 1 до 15 микролитров (мкл).One example of an electrochemical sensor system for analyzing analytes in biological fluids includes a measuring device and a touch panel. The touch panel includes reagents that react with the analyte and transfer the analyte electrons during the analysis, and electrodes for transferring electrons through the conductors to the device. The measuring device has contacts for receiving electrons from the panel, and it is possible to apply a potential difference between the contacts. The device can record the current passing through the sensor and translate the current values into an indicator of the analyte content in the sample. These sensory systems can analyze one drop of whole blood (WB) with a volume of 1 to 15 microliters (µl).
Примеры настольных измерительных устройств включают анализатор BAS 100B, поставляемый BAS Instruments, West Lafayette, Indiana; анализатор CH Instrument, поставляемый CH Instruments, Austin, Texas; электрохимическую рабочую станцию Cypress, поставляемую Cypress Systems, Lawrence, Kansas; и электрохимический прибор EG&G, поставляемый Princeton Research Instruments, Princeton, New Jersey. Примеры переносных измерительных устройств включают измерители Ascensia Breeze® и Elite® от Bayer Corporation.Examples of benchtop measuring devices include a BAS 100B analyzer available from BAS Instruments, West Lafayette, Indiana; CH Instrument analyzer available from CH Instruments, Austin, Texas; Cypress Electrochemical Workstation supplied by Cypress Systems, Lawrence, Kansas; and an EG&G electrochemical apparatus supplied by Princeton Research Instruments, Princeton, New Jersey. Examples of portable measuring devices include Ascensia Breeze® and Elite® meters from Bayer Corporation.
Сенсорная панель может содержать рабочий электрод, где аналит подвергается электрохимической реакции, и противоэлектрод, где происходит противоположная электрохимическая реакция, обеспечивая прохождение тока между электродами. Таким образом, если окисление происходит на рабочем электроде, восстановление происходит на противоэлектроде (смотрите, например, Fundamentals Of Analytical Chemistry, 4th издание, D.A.Skoog и D.M.West; Филадельфия: Saunders College Publishing (1982), стр. 304-341).The touch panel may include a working electrode, where the analyte undergoes an electrochemical reaction, and a counter electrode, where the opposite electrochemical reaction occurs, allowing current to flow between the electrodes. Thus, if oxidation occurs at the working electrode, reduction occurs at the counter electrode (see, for example, Fundamentals Of Analytical Chemistry, 4th edition, DASkoog and DMWest; Philadelphia: Saunders College Publishing (1982), pp 304-341.).
Сенсорная панель также может включать регулирующий контрольный электрод для подачи инвариантного относительного потенциала на измерительное устройство. Хотя известно множество материалов для контрольных электродов, типичной является смесь серебра (Ag) и хлорида серебра (AgCl) благодаря нерастворимости смеси в водной среде анализируемого раствора. Контрольный электрод можно также использовать в качестве противоэлектрода. Сенсорная панель с использованием такого сочетания контрольного электрода-противоэлектрода описана в патенте US №5820551.The touch panel may also include a control reference electrode for supplying an invariant relative potential to the measuring device. Although many materials are known for control electrodes, a mixture of silver (Ag) and silver chloride (AgCl) is typical due to the insolubility of the mixture in the aqueous medium of the analyzed solution. The reference electrode can also be used as a counter electrode. A touch panel using this combination of a reference electrode-counter electrode is described in US patent No. 5820551.
Сенсорную панель можно изготовить нанесением электродов на диэлектрическую подложку с использованием множества способов (смотрите, например, патенты US №№6531040, 5798031 и 5120420). Один или несколько слоев реагента можно получить нанесением на один или несколько электродов, таких как рабочий электрод и/или противоэлектрод. В одном из аспектов более одного электрода можно покрыть одинаковым слоем реагента, например, когда на рабочий электрод и противоэлектрод наносят одинаковую композицию. В другом аспекте слои реагента, содержащие разные композиции, можно наносить или наносить в микроколичествах на рабочий электрод и противоэлектрод с использованием способа, описанного в предварительной патентной заявке США №60/513817, поданной 24 октября 2003 года. Таким образом, слой реагента на рабочем электроде может содержать фермент, медиатор и связующее вещество, в то время как слой реагента на противоэлектроде содержит растворимое окислительно-восстановительное вещество, которое может являться таким же, как медиатор, или другим, и связующее вещество.The touch panel can be made by applying electrodes to a dielectric substrate using a variety of methods (see, for example, US patents Nos. 6531040, 5798031 and 5120420). One or more reagent layers can be obtained by applying to one or more electrodes, such as a working electrode and / or counter electrode. In one aspect, more than one electrode can be coated with the same reagent layer, for example, when the same composition is applied to the working electrode and counter electrode. In another aspect, reagent layers containing different compositions can be applied or applied in micro amounts to the working electrode and counter electrode using the method described in provisional patent application US No. 60/513817, filed October 24, 2003. Thus, the reagent layer on the working electrode may contain an enzyme, a mediator and a binder, while the reagent layer on the counter electrode contains a soluble redox substance, which may be the same as the mediator, or another, and a binder.
Слой реагента может содержать ионизирующее вещество для облегчения окисления или восстановления аналита, а также любые медиаторы или другие вещества, которые помогают переносить электроны между аналитом и проводником. Ионизирующее вещество может являться специфичным для аналита ферментом, таким как глюкозооксидаза или глюкозодегидрогеназа, чтобы катализировать окисление глюкозы в образце WB. Слой реагента также может содержать связующее вещество, которое удерживает вместе фермент и медиатор. В таблице I ниже представлены общепринятые сочетания ферментов и медиаторов для использования со специфическими аналитами.The reagent layer may contain an ionizing substance to facilitate oxidation or reduction of the analyte, as well as any mediators or other substances that help transfer electrons between the analyte and the conductor. The ionizing agent may be an analyte-specific enzyme, such as glucose oxidase or glucose dehydrogenase, to catalyze the oxidation of glucose in a WB sample. The reagent layer may also contain a binder that holds the enzyme and mediator together. Table I below presents generally accepted combinations of enzymes and mediators for use with specific analytes.
Связующее вещество может включать полимеры различных типов и молекулярных масс, такие как CMC (карбоксилметилцеллюлоза) и/или PEO (полиэтиленоксид). Кроме связывания реагентов друг с другом, связующее вещество может помогать при фильтрации красных кровяных клеток, предотвращая покрытие ими поверхности электрода.The binder may include polymers of various types and molecular weights, such as CMC (carboxyl methyl cellulose) and / or PEO (polyethylene oxide). In addition to binding the reagents to each other, a binder can help filter red blood cells, preventing them from coating the electrode surface.
Примеры общепринятых электрохимических сенсорных систем для анализа аналитов в биологических жидкостях включают биосенсоры Precision®, поставляемые Abbott, Abbott Park, Illinois; биосенсоры Accucheck®, поставляемые Roche, Indianapolis, Indiana; и биосенсоры OneTouch Ultra®, поставляемые Lifescan, Milpitas, California.Examples of conventional electrochemical sensor systems for analyzing analytes in biological fluids include biosensors Precision®, supplied by Abbott, Abbott Park, Illinois; biosensors Accucheck®, supplied by Roche, Indianapolis, Indiana; and OneTouch Ultra® biosensors available from Lifescan, Milpitas, California.
Один из электрохимических способов, которые применяют для количественного определения аналитов в биологических жидкостях, представляет собой кулонометрию. Например, в патенте US №6120676 раскрыт кулонометрический способ для измерений глюкозы WB. При кулонометрии концентрацию аналита количественно определяют полным окислением аналита в малом объеме и интегрированием тока по времени окисления для получения электрического заряда, представляющего концентрацию аналита. Таким образом, кулонометрия фиксирует суммарное количество аналита, которое присутствует на сенсорной панели.One of the electrochemical methods that are used to quantify analytes in biological fluids is coulometry. For example, US Pat. No. 6,120,676 discloses a coulometric method for measuring WB glucose. In coulometry, the analyte concentration is quantified by the complete oxidation of the analyte in a small volume and by integrating the current over the oxidation time to obtain an electric charge representing the analyte concentration. Thus, coulometry captures the total amount of analyte that is present on the touch panel.
Важный аспект кулонометрии состоит в том, что по направлению к концу кривой интегрирования заряда по времени скорость, с которой ток изменяется со временем, становится по существу постоянной, что приводит к стационарному состоянию. Эта стационарная часть кулонометрической кривой образует относительно плоский участок, плато, позволяя определить соответствующий ток. Однако для кулонометрического способа требуется полное превращение всего объема аналита для достижения стационарного состояния. Как результат, этот способ требует значительного количества времени и не обеспечивает быстрое получение результатов, которые необходимы пользователям электрохимических устройств, таких как средства, осуществляющие мониторинг глюкозы. Другая проблема кулонометрии состоит в том, что необходимо контролировать малый объем сенсорной ячейки для обеспечения точных результатов, что может являться сложным при массовом производстве устройства.An important aspect of coulometry is that towards the end of the time integration curve of the charge, the speed with which the current changes with time becomes essentially constant, which leads to a stationary state. This stationary part of the coulometric curve forms a relatively flat section, a plateau, allowing you to determine the corresponding current. However, the coulometric method requires the complete conversion of the entire analyte volume to achieve a stationary state. As a result, this method requires a significant amount of time and does not provide quick results that are necessary for users of electrochemical devices, such as glucose monitoring devices. Another problem of coulometry is that it is necessary to control the small volume of the sensor cell to ensure accurate results, which can be difficult in mass production of the device.
Другим электрохимическим способом, который применяют для количественного определения аналитов в биологических жидкостях, является амперометрия. При амперометрии ток измеряют в течение импульса считывания, при этом постоянную разность потенциалов (напряжение) прикладывают между рабочим электродом и противоэлектродом сенсорной панели. Измеряемый ток используют для количественного определения аналита в образце. С помощью амперометрии измеряют скорость, с которой электрохимически активное вещество, такое как аналит, подвергается окислению или восстановлению около рабочего электрода. Описано много вариаций амперометрического способа для биосенсоров, например, в патентах US №№5620579, 5653863, 6153069 и 6413411.Another electrochemical method that is used to quantify analytes in biological fluids is amperometry. In amperometry, the current is measured during the read pulse, and a constant potential difference (voltage) is applied between the working electrode and the touch panel counter electrode. The measured current is used to quantify the analyte in the sample. Amperometry measures the rate at which an electrochemically active substance, such as an analyte, undergoes oxidation or reduction near the working electrode. Many variations of the amperometric method for biosensors are described, for example, in US patents Nos. 5620579, 5653863, 6153069 and 6413411.
Недостатком общепринятых амперометрических способов является нестационарная природа тока после приложения разности потенциалов. Скорость изменения тока вначале является очень высокой, но с течением времени становится более низкой по мере проведения анализа вследствие изменяющейся природы лежащего в основе процесса диффузии. До тех пор пока скорость потребления восстановленного медиатора на поверхности электрода не сравняется со скоростью диффузии, невозможно получить стационарный ток. Таким образом, для общепринятых способов амперометрии измерение тока в течение переходного периода перед достижением стационарного состояния может быть связано с большей неточностью, чем измерение, осуществляемое в течение стационарного периода времени.A disadvantage of conventional amperometric methods is the unsteady nature of the current after applying the potential difference. The rate of change of current is initially very high, but with time it becomes lower as the analysis is carried out due to the changing nature of the underlying diffusion process. Until the consumption rate of the reduced mediator on the electrode surface is equal to the diffusion rate, it is impossible to obtain a stationary current. Thus, for conventional methods of amperometry, the measurement of current during the transition period before reaching the stationary state may be associated with greater inaccuracy than the measurement performed during the stationary period of time.
«Гематокритный эффект» препятствует точному анализу концентрации глюкозы в образцах WB. Образцы WB содержат красные кровяные (RB) клетки и плазму. Плазма в основном состоит из воды, но также содержит некоторые белки и глюкозу. Гематокрит представляет собой объем составной части из RB-клеток по отношению к суммарному объему образца WB, и его часто выражают в виде процентной доли. Образцы цельной крови, как правило, обладают процентными долями гематокрита от 20 до 60%, со средним значением около 40%.The “hematocrit effect" prevents accurate analysis of glucose concentration in WB samples. WB samples contain red blood (RB) cells and plasma. Plasma is mainly composed of water, but also contains some proteins and glucose. Hematocrit is the volume of a component of RB cells with respect to the total volume of a WB sample, and is often expressed as a percentage. Whole blood samples typically have hematocrit percentages of 20 to 60%, with an average of about 40%.
В общепринятых сенсорных панелях глюкозу можно окислять ферментом, который затем передает электроны на медиатор. Этот восстановленный медиатор затем перемещается к рабочему электроду, где он электрохимически окисляется. Количество окисленного медиатора может коррелировать с током, проходящим между рабочим электродом и противоэлектродом сенсорной панели. Количественно ток, измеряемый на рабочем электроде, прямо пропорционален коэффициенту диффузии медиатора. Гематокритный эффект препятствует этому процессу, так как RB-клетки блокируют диффузию медиатора к рабочему электроду. Следовательно, гематокритный эффект влияет на количество тока, измеряемого на рабочем электроде, без какой-либо связи с количеством глюкозы в образце.In conventional touch panels, glucose can be oxidized with an enzyme, which then transfers electrons to the neurotransmitter. This reduced neurotransmitter then moves to the working electrode, where it is electrochemically oxidized. The amount of oxidized mediator can correlate with the current passing between the working electrode and the touch electrode counter electrode. Quantitatively, the current measured at the working electrode is directly proportional to the diffusion coefficient of the mediator. The hematocrit effect prevents this process, since RB cells block the diffusion of the mediator to the working electrode. Therefore, the hematocrit effect affects the amount of current measured at the working electrode, without any connection with the amount of glucose in the sample.
Образцы WB, содержащие варьирующие концентрации RB-клеток, могут приводить к неточностям в измерении, так как сенсор может не отличать более низкую концентрацию медиатора от более высокой концентрации медиатора, если RB-клетки блокируют диффузию к рабочему электроду. Например, если анализируют образцы WB, содержащие идентичные уровни глюкозы, но обладающие гематокритами 20, 40 и 60%, три разных показания глюкозы будут выданы общепринятой сенсорной системой, основанной на одном множестве калибровочных постоянных (наклон и отсекаемый отрезок, например). Даже если концентрации глюкозы одинаковы, система выдаст сообщение о том, что образец с 20% гематокритом содержит больше глюкозы, чем образец с 60% гематокрита, вследствие того, что RB-клетки препятствуют диффузии медиатора к рабочему электроду.WB samples containing varying concentrations of RB cells can lead to measurement inaccuracies, since the sensor may not distinguish between a lower mediator concentration and a higher mediator concentration if RB cells block diffusion to the working electrode. For example, if WB samples are analyzed that contain identical glucose levels but have hematocrit of 20, 40, and 60%, three different glucose readings will be generated by a common sensor system based on one set of calibration constants (slope and cut-off line, for example). Even if glucose concentrations are the same, the system will report that a sample with 20% hematocrit contains more glucose than a sample with 60% hematocrit, due to the fact that RB cells interfere with the diffusion of the mediator to the working electrode.
Нормальный диапазон гематокрита (концентрация RBC) для человека составляет от 20 до 60% и концентрируется в области 40%. Отклонение гематокрита отвечает за различие между эталонной концентрацией глюкозы, полученной с помощью эталонного прибора, такого как YSI 2300 STAT PLUSTM, поставляемого YSI Inc., Yellow Springs, Ohio, и опытным показанием глюкозы, полученным с помощью переносной сенсорной системы, для образцов, содержащих отличающиеся уровни гематокрита. Различие между эталонными и опытными показаниями возникает из-за варьирующихся уровней гематокрита в конкретных образцах WB.The normal range of hematocrit (RBC concentration) for humans is from 20 to 60% and is concentrated in the region of 40%. The hematocrit deviation is responsible for the difference between the reference glucose concentration obtained using a reference device such as the YSI 2300 STAT PLUS™ supplied by YSI Inc., Yellow Springs, Ohio, and the experimental glucose reading obtained using a portable sensor system for samples containing different hematocrit levels. The difference between the reference and experimental readings arises from the varying hematocrit levels in specific WB samples.
Кроме гематокритного эффекта неточности измерения также могут возникать в случае, если концентрация измеряемого вещества не коррелирует с концентрацией аналита. Например, если сенсорная система определяет концентрацию восстановленного медиатора, полученную в ответ на окисление аналита, любой восстановленный медиатор, не полученный окислением аналита, будет приводить к тому, что сенсорная система будет показывать большее количество аналита, чем то, которое действительно присутствует в образце, вследствие фонового влияния медиатора.In addition to the hematocrit effect, measurement inaccuracies can also occur if the concentration of the measured substance does not correlate with the concentration of the analyte. For example, if the sensor system determines the concentration of the reduced mediator obtained in response to the oxidation of the analyte, any restored mediator not obtained by oxidation of the analyte will result in the sensor system showing a greater amount of analyte than what is actually present in the sample, due to background influence of a mediator.
Кроме эффектов гематокрита и фонового влияния медиатора, другие факторы также могут приводить к неточностям в способности общепринятой электрохимической сенсорной системы определять концентрацию аналита в образце. В одном из аспектов эти неточности могут возникать вследствие того, что часть сенсорной панели, которая содержит образец, может отличаться по объему от панели к панели. Неточности могут также возникать в случае, если не обеспечено достаточное количество образца для полного заполнения объема пространства заглушки, состояние, обозначаемое как неполное заполнение. В других аспектах неточности могут возникать в ходе измерения вследствие случайного «шума» и когда у сенсорной системы отсутствует способность точно определять изменения температуры в образце.In addition to the effects of hematocrit and the background effect of the mediator, other factors can also lead to inaccuracies in the ability of a conventional electrochemical sensor system to determine the concentration of analyte in a sample. In one aspect, these inaccuracies may occur due to the fact that the portion of the touch panel that contains the sample may vary in volume from panel to panel. Inaccuracies can also occur if a sufficient amount of sample is not provided to completely fill the volume of the stub space, a condition designated as incomplete filling. In other aspects, inaccuracies can occur during measurement due to random “noise” and when the sensor system does not have the ability to accurately determine temperature changes in the sample.
В попытке преодолеть один или несколько из этих недостатков в общепринятых сенсорных системах применяют множество технических приемов, не только в отношении механической конструкции сенсорной панели и выбора реагента, но также относительно способа, с помощью которого в измерительном устройстве прикладывают разность электрических потенциалов к панели. Например, общепринятые способы снижения гематокритного эффекта для амперометрических сенсоров включают использование фильтров, как описано в патентах US №№5708247 и 5951836; обращение полярности прикладываемого тока, как описано в публикации WO 01/57510; и способы, которые делают максимальным внутреннее сопротивление образца, как описано в патенте US №5628890.In an attempt to overcome one or more of these shortcomings, conventional sensor systems employ a variety of techniques, not only with respect to the mechanical design of the touch panel and the choice of reagent, but also with respect to the method by which the difference in electric potentials is applied to the panel. For example, conventional methods for reducing the hematocrit effect for amperometric sensors include the use of filters, as described in US patent No. 5708247 and 5951836; reversing the polarity of the applied current, as described in WO 01/57510; and methods that maximize the internal resistance of the sample, as described in US patent No. 5628890.
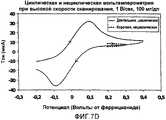
Многочисленные способы приложения разности электрических потенциалов к панели, обычно обозначаемые как импульсные способы, последовательности или циклы, используют для преодоления неточностей в определении концентрации аналита. Например, в патенте US №4897162 импульсный способ включает непрерывное приложение возрастающей и падающей разности потенциалов, которые смешиваются, приводя к волне в виде последовательности треугольных импульсов. Более того, в публикации WO 2004/053476 и патентных заявках US 2003/0178322 и 2003/0113933 описаны импульсные способы, которые включают непрерывное приложение возрастающей и падающей разности потенциалов, которые также изменяют полярность.Numerous methods for applying the electric potential difference to the panel, commonly referred to as pulsed methods, sequences, or cycles, are used to overcome inaccuracies in determining analyte concentration. For example, in US Pat. No. 4,897,162, the pulsed method involves the continuous application of an increasing and falling potential difference, which mix, resulting in a wave in the form of a sequence of triangular pulses. Moreover, WO 2004/053476 and patent applications US 2003/0178322 and 2003/0113933 describe pulsed methods that include the continuous application of an increasing and falling potential difference, which also reverse polarity.
Другие общепринятые способы сочетают специфическую конфигурацию электрода с импульсной последовательностью, адаптированной для этой конфигурации. Например, в патенте US №5942102 сочетается специфическая конфигурация электрода, снабженная тонкослойной ячейкой, с непрерывным импульсом, так что продукты реакции от противоэлектрода поступают на рабочий электрод. Это сочетание используют для проведения реакции до тех пор, пока изменение тока от времени не станет постоянным, причем достигают истинного стационарного состояния для медиатора, перемещающегося между рабочим электродом и противоэлектродом в ходе скачка потенциала. Так как каждый из этих способов имеет различные преимущества и недостатки, ни один из них не является идеальным.Other conventional methods combine a specific electrode configuration with a pulse sequence adapted for this configuration. For example, US Pat. No. 5,942,102 combines a specific electrode configuration equipped with a thin-layer cell with a continuous pulse, so that reaction products from the counter electrode arrive at the working electrode. This combination is used to carry out the reaction until the change in current from time to time becomes constant, whereby a true stationary state is reached for a mediator moving between the working electrode and the counter electrode during a potential jump. Since each of these methods has various advantages and disadvantages, none of them is ideal.
КРАТКОЕ ИЗЛОЖЕНИЕ СУЩЕСТВА ИЗОБРЕТЕНИЯSUMMARY OF THE INVENTION
Задачей настоящего изобретения является улучшение электрохимических сенсорных систем, в особенности тех, которые могут обеспечить все более точное определение концентрации аналита за меньшее время, и создание систем, устройства и способов, которые обеспечивают преодоление, по меньшей мере, одного из недостатков известных систем.The objective of the present invention is to improve electrochemical sensor systems, especially those that can provide an increasingly accurate determination of analyte concentration in less time, and the creation of systems, devices and methods that overcome at least one of the disadvantages of known systems.
Согласно изобретению предложен вольтамперометрический способ определения концентрации аналита в образце, который включает следующие шаги: приложение импульсной последовательности к образцу и измерение результирующих токов, причем импульсная последовательность состоит, по меньшей мере, из двух рабочих циклов. В дополнение к, по меньшей мере, двум рабочим циклам, импульсная последовательность может содержать терминальный импульс считывания и/или начальную временную задержку, и ее можно прикладывать к сенсорной панели, содержащей диффузионный барьерный слой на рабочем электроде. Способ может обладать меньшей погрешностью, связанной с фоновым влиянием медиатора, чем концентрация аналита, определяемая другим способом или вольтамперометрическим способом, у которого отсутствует импульсная последовательность, содержащая, по меньшей мере, два рабочих цикла. Образец может являться жидкостью, включая биологическую жидкость, а аналит может представлять собой глюкозу.The invention provides a voltammetric method for determining the concentration of analyte in a sample, which includes the following steps: applying a pulse sequence to the sample and measuring the resulting currents, the pulse sequence consisting of at least two duty cycles. In addition to at least two duty cycles, the pulse sequence may include a terminal read pulse and / or an initial time delay, and it can be applied to a touch panel containing a diffusion barrier layer on the working electrode. The method may have a smaller error associated with the background effect of the mediator than the concentration of the analyte, determined by another method or voltammetric method, in which there is no pulse sequence containing at least two duty cycles. The sample may be a liquid, including biological fluid, and the analyte may be glucose.
Рабочие циклы могут включать возбуждение, включающее разность потенциалов, изменяющуюся с течением времени, или разность потенциалов, изменяющуюся линейно с течением времени, такое как линейное, циклическое, нециклическое возбуждение или сочетание этих типов возбуждения. Величину тока можно регистрировать в ходе каждого возбуждения, и импульсная последовательность может включать терминальный импульс считывания. Рабочие циклы могут включать нециклические возбуждения, по существу невключающие пик обратного окисления или пик обратного восстановления, и могут уменьшать концентрацию медиатора в образце, не связанную с аналитом, по отношению к способу, где рабочие циклы включают циклические возбуждения. Рабочие циклы могут включать нециклические возбуждения, завершающиеся перед инициацией пика обратного тока, причем нециклические возбуждения по существу не включают пики прямого и обратного окисления и восстановления, или нециклические возбуждения по существу в пределах ограниченной диффузией области тока окислительно-восстановительной пары.Duty cycles can include a drive that includes a potential difference that changes over time, or a potential difference that changes linearly over time, such as linear, cyclic, non-cyclic excitation, or a combination of these types of excitation. The magnitude of the current can be recorded during each excitation, and the pulse sequence may include a terminal read pulse. Duty cycles may include non-cyclic excitations that are substantially non-inclusive of a peak of reverse oxidation or a peak of reverse reduction, and can reduce the concentration of a mediator in a non-analyte sample in relation to a method where the duty cycles include cyclic excitations. Duty cycles may include non-cyclic excitations terminating before the initiation of the reverse current peak, and non-cyclic excitations essentially do not include direct and reverse oxidation and reduction peaks, or non-cyclic excitations essentially within the diffusion limited current region of the redox pair.
Способ может включать определение, по меньшей мере, одного контурного профиля и использование, по меньшей мере, одного вида обработки данных, такого как полуинтеграл, полупроизводная или производная, по отношению к результирующим токам. Способ может также включать определение совокупности калибровочных множеств, исходя из токов, и определение количества рабочих циклов, исходя из совокупности калибровочных множеств. Определение концентрации аналита может включать усреднение множества величин концентраций, полученных исходя из совокупности калибровочных множеств.The method may include determining at least one contour profile and using at least one type of data processing, such as a semi-integral, a semi-derivative, or a derivative, with respect to the resulting currents. The method may also include determining a set of calibration sets based on currents and determining the number of duty cycles based on a set of calibration sets. Determining the analyte concentration may include averaging a plurality of concentration values obtained from a plurality of calibration sets.
Способ также может включать определение того, является ли сенсорная панель, содержащая образец, не полностью заполненной образцом. Это определение может включать сравнение, по меньшей мере, одной величины токов с предварительно выбранной величиной. Способ также может включать определение содержания активного ионизирующего вещества сенсорной панели, причем определение можно осуществлять с помощью определения соотношения величин прямого и обратного сканированных токов. В одном из аспектов это соотношение ранее коррелировало с известными количествами активного ионизирующего вещества. В другом аспекте наклон калибровки можно изменять в ответ на содержание активного ионизирующего вещества сенсорной панели. В другом аспекте соотношение времени возбуждения/релаксации рабочих циклов может составлять от 0,3 до 0,2.The method may also include determining whether the touch panel containing the sample is not completely filled with the sample. This definition may include comparing at least one current value with a preselected value. The method may also include determining the content of the active ionizing substance of the touch panel, and the determination can be carried out by determining the ratio of forward and reverse scanned currents. In one aspect, this ratio has previously correlated with known amounts of active ionizing agent. In another aspect, the calibration slope can be changed in response to the content of the active ionizing agent of the touch panel. In another aspect, the ratio of time of excitation / relaxation of duty cycles can be from 0.3 to 0.2.
Предложено переносное устройство для измерения аналитов для определения концентрации аналита в образце. Устройство содержит стробируемое вольтамперометрическое измерительное устройство, адаптированное для подключения сенсорной панели. Стробируемое амперометрическое измерительное устройство содержит, по меньшей мере, два контакта устройства, электрически связанные с дисплеем посредством электрической схемы. Сенсорная панель включает, по меньшей мере, первый и второй контакты сенсорной панели. Первый контакт сенсорной панели электрически связан с рабочим электродом, и второй контакт сенсорной панели электрически связан с противоэлектродом посредством проводников. Первый слой реагента находится, по меньшей мере, на одном из электродов и содержит оксидоредуктазу и, по меньшей мере, одно из веществ окислительно-восстановительной пары. Электроды могут располагаться на одной и той же или разных подложках.A portable device for measuring analytes to determine the concentration of analyte in a sample is proposed. The device contains a gated voltammetric measuring device adapted for connecting a touch panel. A gated amperometric measuring device comprises at least two device contacts electrically connected to the display via an electrical circuit. The touch panel includes at least the first and second contacts of the touch panel. The first contact of the touch panel is electrically connected to the working electrode, and the second contact of the touch panel is electrically connected to the counter electrode via conductors. The first layer of reagent is located at least on one of the electrodes and contains oxidoreductase and at least one of the substances of the redox pair. The electrodes may be located on the same or different substrates.
Предложено переносное измерительное устройство для определения концентрации аналита в образце, адаптированное для подключения сенсорной панели. Устройство содержит контакты, по меньшей мере, один дисплей и электрическую схему, устанавливающую электрическую связь между контактами и дисплеем. Схема содержит электрическое зарядное устройство и процессор, причем процессор электрически связан со считываемым компьютером носителем информации. Носитель содержит читаемую компьютером программу, которая при выполнении процессором заставляет зарядное устройство формировать стробированную вольтамперометрическую импульсную последовательность, включающую, по меньшей мере, два рабочих цикла.A portable measuring device for determining the concentration of analyte in a sample, adapted for connecting a touch panel, is proposed. The device contains contacts, at least one display and an electrical circuit that establishes an electrical connection between the contacts and the display. The circuit includes an electric charger and a processor, the processor being electrically connected to a computer-readable storage medium. The medium contains a computer-readable program that, when executed by the processor, causes the charger to form a gated voltammetric pulse sequence including at least two duty cycles.
Предложен способ уменьшения погрешности, связанной с фоновым влиянием медиатора в определяемой концентрации аналита в образце, который заключается в использовании стробированной вольтамперометрической импульсной последовательности, включающей, по меньшей мере, два рабочих цикла.A method is proposed for reducing the error associated with the background effect of a mediator in a determined analyte concentration in a sample, which consists in using a gated voltammetric pulse sequence including at least two duty cycles.
Предложен способ определения продолжительности импульсной последовательности, включающей, по меньшей мере, 2 рабочих цикла, для определения концентрации аналита в образце, который заключается в определении совокупности множеств калибровочных постоянных, определяемых исходя из токов, регистрируемых в течение, по меньшей мере, 2 рабочих циклов, и определении продолжительности импульсной последовательности в ответ на определяемую концентрацию аналита в образце. Импульсная последовательность может являться стробированной вольтамперометрической импульсной последовательностью.A method is proposed for determining the duration of a pulse sequence, including at least 2 duty cycles, to determine the concentration of analyte in a sample, which consists in determining the set of calibration constants determined from currents recorded during at least 2 duty cycles, and determining the duration of the pulse sequence in response to a detectable analyte concentration in the sample. The pulse sequence may be a gated voltammetric pulse sequence.
Предложен способ, сигнализирующий пользователю о добавлении дополнительного образца на сенсорную панель, который заключается в определении, является ли сенсорная панель не полностью заполненной, путем сравнения, по меньшей мере, одной величины тока, зарегистрированной от импульсной последовательности, включающей, по меньшей мере, 2 рабочих цикла, с предварительно выбранной величиной, и сигнализации пользователю о добавлении дополнительного образца на сенсорную панель, если панель не полностью заполнена. Импульсная последовательность может являться стробированной вольтамперометрической импульсной последовательностью. Сенсорная панель может включать два электрода, и определение можно осуществлять менее чем за пять секунд.A method is proposed that signals the user to add an additional sample to the touch panel, which consists in determining whether the touch panel is not completely filled by comparing at least one current value recorded from the pulse sequence, including at least 2 working cycle, with a pre-selected value, and signaling the user to add an additional sample to the touch panel, if the panel is not completely filled. The pulse sequence may be a gated voltammetric pulse sequence. The touch panel may include two electrodes, and the determination can be carried out in less than five seconds.
Предложен вольтамперометрический способ определения концентрации аналита в образце, который включает в себя: приложение импульсной последовательности к образцу и измерение результирующих токов, причем импульсная последовательность включает, по меньшей мере, 2 рабочих цикла, обладающих соотношениями времени возбуждения/релаксации от 0,3 до 0,2. Способ может являться более точным, чем определение концентрации аналита с помощью другого способа, где соотношение времени возбуждения/релаксации импульса выше 0,3.A voltammetric method for determining the analyte concentration in a sample is proposed, which includes: applying a pulse sequence to the sample and measuring the resulting currents, the pulse sequence comprising at least 2 duty cycles having excitation / relaxation ratios of 0.3 to 0, 2. The method may be more accurate than determining the concentration of the analyte using another method, where the ratio of the time of excitation / relaxation of the pulse is higher than 0.3.
Предложен электрохимический способ определения концентрации аналита в образце, который включает усовершенствование, включающее приложение стробированной вольтамперометрической импульсной последовательности к образцу, включающей, по меньшей мере, два рабочих цикла.An electrochemical method is proposed for determining the concentration of analyte in a sample, which includes an improvement that includes the application of a gated voltammetric pulse sequence to the sample, including at least two duty cycles.
Предлагаются следующие определения для ясного и непротиворечивого понимания описания и формулы изобретения.The following definitions are provided for a clear and consistent understanding of the description and claims.
Термин «аналит» определяют как одно или несколько веществ, присутствующих в образце. С помощью анализа определяют присутствие и/или концентрацию аналита, присутствующего в образце.The term “analyte” is defined as one or more substances present in a sample. The analysis determines the presence and / or concentration of the analyte present in the sample.
Термин «образец» определяют как композицию, которая может содержать неизвестное количество аналита. Как правило, образец для электрохимического анализа представляет собой жидкость, и предпочтительно образец является водной смесью. Образец может являться биологическим образцом, таким как кровь, моча или слюна. Образец также может представлять собой производное биологического образца, такое как экстракт, раствор, фильтрат или растворенный преципитат.The term “sample” is defined as a composition that may contain an unknown amount of analyte. Typically, the sample for electrochemical analysis is a liquid, and preferably the sample is an aqueous mixture. The sample may be a biological sample, such as blood, urine or saliva. The sample may also be a derivative of a biological sample, such as an extract, solution, filtrate or dissolved precipitate.
Термин «вольтамперометрия» определяют как способ анализа, в котором концентрацию аналита в образце определяют электрохимическим измерением скорости окисления или восстановления аналита при изменяющейся разности потенциалов.The term "voltammetry" is defined as an analysis method in which the analyte concentration in a sample is determined by electrochemical measurement of the rate of oxidation or reduction of the analyte with a varying potential difference.
Термин «система» или «сенсорная система» определяют как сенсорную панель, электрически связанную через проводники с измерительным устройством, которое позволяет количественно определять аналит в образце.The term “system” or “sensor system” is defined as a touch panel electrically connected through conductors to a measuring device that allows the analyte to be quantified in a sample.
Термин «сенсорная панель» определяют как устройство, которое содержит образец в ходе анализа и обеспечивает электрическую связь между образцом и измерительным устройством. Часть сенсорной панели, которая содержит образец, часто обозначают как «пространство заглушки».The term “touch panel” is defined as a device that contains a sample during analysis and provides electrical communication between the sample and the measuring device. The part of the touch panel that contains the sample is often referred to as the “stub space”.
Термин «проводник» определяют как проводящее электричество вещество, которое остается неизменным в ходе электрохимического анализа.The term "conductor" is defined as a substance that conducts electricity, which remains unchanged during electrochemical analysis.
Термин «измерительное устройство» определяют как одно или несколько электронных устройств, которые могут прикладывать электрическую разность потенциалов к проводникам сенсорной панели и измерять результирующий ток. Измерительное устройство также может включать технологическую возможность определения присутствия и/или концентрации одного или нескольких аналитов в ответ на регистрируемые величины токов.The term "measuring device" is defined as one or more electronic devices that can apply an electric potential difference to the conductors of the touch panel and measure the resulting current. The measuring device may also include the technological ability to determine the presence and / or concentration of one or more analytes in response to the recorded current values.
Термин «точность» определяют как то, насколько близко количество аналита, измеряемого сенсорной панелью, соответствует истинному количеству аналита в образце. В одном из аспектов точность можно выражать в терминах погрешности.The term "accuracy" is defined as how close the amount of analyte measured by the touch panel corresponds to the true amount of analyte in the sample. In one aspect, accuracy can be expressed in terms of error.
Термин «воспроизводимость» определяют как то, насколько близко расположены множественные измерения аналита для одного и того же образца. В одном из аспектов воспроизводимость можно выражать в терминах разброса или вариации между множественными измерениями.The term “reproducibility” is defined as how close are multiple analyte measurements for the same sample. In one aspect, reproducibility can be expressed in terms of scatter or variation between multiple dimensions.
Термин «окислительно-восстановительная реакция» определяют как химическую реакцию между двумя веществами, включающую перенос, по меньшей мере, одного электрона от первого вещества ко второму веществу. Таким образом, окислительно-восстановительная реакция включает окисление и восстановление. Окислительный полуэлемент реакции включает утрату, по меньшей мере, одного электрона первым веществом, в то время как восстановительный полуэлемент включает присоединение, по меньшей мере, одного электрона вторым веществом. Ионный заряд вещества, которое окислено, становится более положительным на количество, равное количеству утраченных электронов. Аналогично, ионный заряд вещества, которое восстановлено, становится менее положительным на количество, равное количеству присоединенных электронов.The term “redox reaction” is defined as a chemical reaction between two substances, including the transfer of at least one electron from the first substance to the second substance. Thus, the redox reaction includes oxidation and reduction. The oxidative half-element of the reaction includes the loss of at least one electron by the first substance, while the reducing half-element includes the addition of at least one electron to the second substance. The ionic charge of a substance that is oxidized becomes more positive by an amount equal to the number of lost electrons. Similarly, the ionic charge of a substance that is reduced becomes less positive by an amount equal to the number of attached electrons.
Термин «медиатор» определяют как вещество, которое может являться окисленным или восстановленным и которое может переносить один или несколько электронов. Медиатор является реагентом в электрохимическом анализе и не является интересующим аналитом, но обеспечивает непрямое измерение аналита. В простейшей системе медиатор подвергается окислительно-восстановительной реакции в ответ на окисление или восстановление аналита. Окисленный или восстановленный медиатор затем подвергается противоположной реакции на рабочем электроде сенсорной панели и восстанавливает свою первоначальную степень окисления.The term “mediator” is defined as a substance that can be oxidized or reduced and that can carry one or more electrons. The mediator is a reagent in electrochemical analysis and is not an analyte of interest, but provides an indirect analyte measurement. In the simplest system, a mediator undergoes a redox reaction in response to oxidation or reduction of the analyte. The oxidized or reduced mediator then undergoes an opposite reaction on the working electrode of the touch panel and restores its original oxidation state.
Термин «связующее вещество» определяют как материал, который обеспечивает физическое закрепление и удерживание реагентов, при этом обладая химической совместимостью с реагентами.The term "binder" is defined as a material that provides physical fixation and retention of the reagents, while possessing chemical compatibility with the reagents.
Термин «фоновое влияние медиатора» определяют как погрешность, вносимую в измеряемую концентрацию аналита, связанную с измеряемым веществом, которая не зависит от лежащей в основе концентрации аналита.The term “background effect of the mediator” is defined as the error introduced in the measured analyte concentration associated with the measured substance, which is independent of the underlying analyte concentration.
Термин «измеряемое вещество» определяют как любое электрохимически активное вещество, которое можно подвергнуть окислению или восстановлению при подходящем потенциале на рабочем электроде электрохимической сенсорной панели. Примеры измеряемых веществ включают аналиты, оксидоредуктазы и медиаторы.The term "measurable substance" is defined as any electrochemically active substance that can be oxidized or reduced at a suitable potential on the working electrode of the electrochemical touch panel. Examples of measured substances include analytes, oxidoreductases and mediators.
Термин «неполное заполнение» определяют как то, когда недостаточное количество образца вносят на сенсорную панель для получения точного анализа.The term "incomplete filling" is defined as when an insufficient amount of sample is applied to the touch panel to obtain an accurate analysis.
Термин «окислительно-восстановительная пара» определяют как два сопряженных вида химического вещества, обладающих разными степенями окисления. Восстановление вещества, обладающего более высокой степенью окисления, приводит к образованию вещества, обладающего более низкой степенью окисления. Альтернативно, окисление вещества, обладающего более низкой степенью окисления, приводит к образованию вещества, обладающего более высокой степенью окисления.The term “redox pair” is defined as two conjugated types of a chemical substance with different degrees of oxidation. The reduction of a substance with a higher oxidation state leads to the formation of a substance with a lower oxidation state. Alternatively, the oxidation of a substance with a lower oxidation state results in the formation of a substance with a higher oxidation state.
Термин «степень окисления» определяют как формальный ионный заряд химического вещества, такого как атом. Более высокая степень окисления, такая как (III), является более положительной, и более низкая степень окисления, такая как (II), является менее положительной.The term “oxidation state” is defined as the formal ionic charge of a chemical, such as an atom. A higher oxidation state, such as (III), is more positive, and a lower oxidation state, such as (II), is less positive.
Термин «обратимая окислительно-восстановительная пара» определяют как пару окислительно-восстановительных веществ, где разделение между прямым и обратным сканированиями полуинтеграла составляет самое большее 30 мВ на полувысоте перехода siss. Например, на фиг.10A приведены прямое и обратное полуинтегральное сканирования для окислительно-восстановительной пары феррицианид/ферроцианид в дополнение к высоте перехода siss. На линии, где полувысота линии перехода siss пересекает линии прямого и обратного сканирований, разделение между линиями составляет 29 мВ, что устанавливает обратимость окислительно-восстановительной пары феррицианид/ферроцианид при изображенной скорости сканирования.The term “reversible redox pair” is defined as a pair of redox substances, where the separation between direct and reverse scans of the half-integral is at most 30 mV at half maximum of the siss transition. For example, FIG. 10A shows forward and reverse semi-integrated scans for a redox ferricyanide / ferrocyanide pair in addition to the transition height siss . On the line where the half-height of the siss transition line crosses the forward and reverse scan lines, the separation between the lines is 29 mV, which establishes the reversibility of the redox ferricyanide / ferrocyanide pair at the scan speed shown.
Термин «квазиобратимая окислительно-восстановительная пара» определяют как окислительно-восстановительную пару, где разделение между прямым и обратным сканированиями полуинтеграла больше 30 мВ на полувысоте перехода siss для окислительно-восстановительной пары.The term “quasi-reversible redox pair” is defined as a redox pair, where the separation between direct and reverse scans of the half-integral is more than 30 mV at half maximum of the siss transition for the redox pair.
Термин «растворимое окислительно-восстановительное вещество» определяют как вещество, которое способно подвергаться окислению или восстановлению и которое растворимо в воде (pH 7, 25°C) на уровне, по меньшей мере, 1,0 грамма на литр. Растворимое окислительно-восстановительное вещество включает электроактивные органические молекулы, органические комплексы переходных металлов и координационные комплексы переходных металлов. В термин «растворимое окислительно-восстановительное вещество» не включают элементарные металлы и одиночные ионы металлов, в особенности те, которые нерастворимы или плохо растворимы в воде.The term "soluble redox substance" is defined as a substance that is capable of undergoing oxidation or reduction and which is soluble in water (
Термин «оксидоредуктаза» определяют как любой фермент, который облегчает окисление или восстановление аналита. Оксидоредуктаза является реагентом. Термин «оксидоредуктаза» включает «оксидазы», которые облегчают окислительные реакции, в которых молекулярный кислород является акцептором электронов; «редуктазы», которые облегчают восстановительные реакции, в которых аналит подвергается восстановлению и молекулярный кислород не является аналитом; и «дегидрогеназы», которые облегчают окислительные реакции, в которых молекулярный кислород не является акцептором электронов (смотрите, например, Oxford Dictionary of Biochemistry and Molecular Biology, Revised Edition, A.D.Smith, Ed., New York: Oxford University Press (1997) pp. 161, 476, 477 и 560).The term “oxidoreductase” is defined as any enzyme that facilitates the oxidation or reduction of an analyte. Oxidoreductase is a reagent. The term “oxidoreductase” includes “oxidases” that facilitate oxidative reactions in which molecular oxygen is an electron acceptor; “Reductases” that facilitate reduction reactions in which the analyte undergoes reduction and molecular oxygen is not an analyte; and “dehydrogenases,” which facilitate oxidative reactions in which molecular oxygen is not an electron acceptor (see, for example, Oxford Dictionary of Biochemistry and Molecular Biology, Revised Edition, ADSmith, Ed., New York: Oxford University Press (1997) pp . 161, 476, 477 and 560).
Термин «электроактивная органическая молекула» определяют как органическую молекулу, у которой отсутствует металл, способный подвергаться окислительной или восстановительной реакции. Электроактивные органические молекулы могут служить в качестве медиаторов.The term "electroactive organic molecule" is defined as an organic molecule in which there is no metal capable of undergoing an oxidative or reducing reaction. Electroactive organic molecules can serve as mediators.
Термин «органический комплекс переходных металлов», также обозначаемый как «OTM-комплекс», определяют как комплекс, в котором переходный металл связан, по меньшей мере, с одним атомом углерода посредством сигма-связи (формальный заряд -1 на атоме углерода, связанном сигма-связью с переходным металлом) или пи-связи (формальный заряд 0 на атомах углерода, связанных пи-связью с переходным металлом). Например, ферроцен представляет собой OTM-комплекс с двумя циклопентадиенильными (Cp) кольцами, каждое из которых посредством своих пяти углеродных атомов связано с центральным атомом железа двумя пи-связями и одной сигма-связью. Другой пример OTM-комплекса представляет собой феррицианид (III) и его восстановленный аналог ферроцианид (II), где шесть цианолигандов (формальный заряд -1 на каждом из 6 лигандов) связаны сигма-связью с центральным атомом железа через атомы углерода.The term “organic transition metal complex”, also referred to as the “OTM complex”, is defined as a complex in which the transition metal is bonded to at least one carbon atom via a sigma bond (formal charge -1 on the carbon atom bound to sigma a bond with a transition metal) or a p-bond (
Термин «координационный комплекс» определяют как комплекс, обладающий хорошо определенной координационной геометрией, такой как октаэдрическая или квадратная плоская. В отличие от OTM-комплексов, которые определяют по их связям, координационные комплексы определяют по их геометрии. Таким образом, координационные комплексы могут являться OTM-комплексами (такими как ранее упомянутый феррицианид), или комплексами, где атомы неметаллов иные, чем углерод, такие как гетероатомы, включающие азот, серу, кислород и фосфор, связаны дативной связью с центральным атомом переходного металла. Например, рутений-гексамин представляет собой координационный комплекс, обладающий хорошо определенной октаэдрической геометрией, где шесть лигандов NH3 (формальный заряд 0 на каждом из 6 лигандов) соединены дативной связью с центральным атомом рутения. Более полное обсуждение органических комплексов переходных металлов, координационных комплексов и связей переходных металлов можно найти в Collman et al., Principles and Applications of Organotransition Metal Chemistry (1987) и Miessler & Tarr, Inorganic Chemistry (1991).The term “coordination complex” is defined as a complex having a well-defined coordination geometry, such as an octahedral or square plane. In contrast to OTM complexes, which are determined by their bonds, coordination complexes are determined by their geometry. Thus, coordination complexes can be OTM complexes (such as the previously mentioned ferricyanide), or complexes where non-metal atoms other than carbon, such as heteroatoms including nitrogen, sulfur, oxygen and phosphorus, are bound by a native bond to the central transition metal atom . For example, ruthenium-hexamine is a coordination complex with a well-defined octahedral geometry, where six NH3 ligands (
Термин «стационарный» определяют как то, когда изменение электрохимического сигнала (тока) по отношению к независимой входной переменной (напряжение или время) является по существу постоянным, например в пределах ±10 или ±5%.The term "stationary" is defined as when the change in the electrochemical signal (current) with respect to the independent input variable (voltage or time) is substantially constant, for example within ± 10 or ± 5%.
Термин «относительно постоянный» определяют как то, когда изменение величины токов или скорости диффузии находится в пределах ±20, ±10 или ±5%.The term "relatively constant" is defined as when the change in the magnitude of the currents or the diffusion rate is within ± 20, ± 10, or ± 5%.
Термин «точка поворота» определяют как точку в циклическом или нециклическом сканировании, где прямое сканирование заканчивается и начинается обратное сканирование.The term “pivot point” is defined as a point in a cyclic or non-cyclic scan, where the forward scan ends and the reverse scan begins.
Термин «линейное возбуждение» определяют как возбуждение, при котором напряжение изменяется в одном «прямом» направлении с фиксированной скоростью, например, от -0,5 В до +0,5 В для обеспечения диапазона возбуждения 1,0 В. Диапазон возбуждения может охватывать восстановленные и окисленные состояния окислительно-восстановительной пары так, что происходит переход из одного состояния в другое. Линейное возбуждение можно аппроксимировать сериями инкрементных изменений разности потенциалов. Если инкременты расположены очень близко друг к другу во времени, то они соответствуют непрерывному линейному возбуждению. Таким образом, приложение изменения разности потенциалов, аппроксимирующего линейное изменение, можно рассматривать как линейное возбуждение.The term "linear excitation" is defined as excitation in which the voltage changes in one "forward" direction at a fixed speed, for example, from -0.5 V to +0.5 V to provide an excitation range of 1.0 V. The excitation range can cover reduced and oxidized states of the redox pair so that there is a transition from one state to another. Linear excitation can be approximated by a series of incremental changes in the potential difference. If the increments are located very close to each other in time, then they correspond to continuous linear excitation. Thus, the application of a change in the potential difference approximating a linear change can be considered as linear excitation.
Термин «циклическое возбуждение» определяют как сочетание линейного прямого возбуждения и линейного обратного возбуждения, где диапазон возбуждения включает пики окисления и восстановления окислительно-восстановительной пары. Например, изменение разности потенциалов циклическим образом от -0,5 В до +0,5 В и обратно до -0,5 В является примером циклического возбуждения для окислительно-восстановительной пары феррицианид/ферроцианид, как используют в глюкозном сенсоре, где пики как окисления, так и восстановления включены в диапазон возбуждения.The term “cyclic excitation” is defined as a combination of linear direct excitation and linear reverse excitation, where the excitation range includes oxidation and reduction peaks of the redox pair. For example, changing the potential difference in a cyclic manner from -0.5 V to +0.5 V and back to -0.5 V is an example of cyclic excitation for a redox ferricyanide / ferrocyanide pair, as used in a glucose sensor, where the peaks are like oxidation and recovery are included in the excitation range.
Термин «нециклическое возбуждение» определяют в одном из аспектов как возбуждение, включающее более одного пика прямого или обратного тока, чем другой пик тока. Например, возбуждение, включающее прямое и обратное линейные возбуждения, где прямое возбуждение начинается при другом напряжении, чем то, где заканчивается обратное возбуждение, например, от -0,5 В до +0,5 В и обратно до +0,25 В, является примером нециклического возбуждения. В другом примере нециклическое возбуждение может начинаться и заканчиваться по существу при том же напряжении, когда возбуждение начинается самое большее при ±20, ±10 или ±5 мВ от формального потенциала E°' окислительно-восстановительной пары. В другом аспекте нециклическое возбуждение определяют как возбуждение, включающее прямое и обратное линейное возбуждения, которые по существу не включают пики окисления и восстановления окислительно-восстановительной пары. Например, возбуждение может начинаться, обращаться и заканчиваться в пределах ограниченной диффузией области окислительно-восстановительной пары, таким образом, не включая пики окисления и восстановления пары.The term "non-cyclic excitation" is defined in one aspect as excitation comprising more than one peak of the forward or reverse current than another peak of the current. For example, excitation, including direct and reverse linear excitations, where direct excitation begins at a different voltage than where the reverse excitation ends, for example, from -0.5 V to +0.5 V and vice versa to +0.25 V, is an example of non-cyclic excitation. In another example, non-cyclic excitation can begin and end at essentially the same voltage when the excitation starts at most at ± 20, ± 10 or ± 5 mV from the formal potential E ° ′ of the redox pair. In another aspect, non-cyclic excitation is defined as excitation comprising direct and reverse linear excitations, which essentially do not include oxidation and reduction peaks of the redox pair. For example, excitation can begin, reverse, and end within the diffusion-limited region of the redox pair, thus not including oxidation and reduction peaks of the pair.
Термины «быстрое возбуждение», «скорость быстрого возбуждения», «быстрое сканирование» и «скорость быстрого сканирования» определяют как возбуждение, где напряжение изменяется со скоростью, по меньшей мере, 176 мВ/с. Предпочтительные скорости быстрого возбуждения являются скоростями более чем 200, 500, 1000 или 2000 мВ/с.The terms “rapid excitation”, “rapid excitation rate”, “quick scan” and “fast scan rate” are defined as excitation, where the voltage changes at a speed of at least 176 mV / s. Preferred rapid excitation rates are velocities greater than 200, 500, 1000 or 2000 mV / s.
Термины «медленное возбуждение», «скорость медленного возбуждения», «медленное сканирование» и «скорость медленного сканирования» определяют как возбуждение, где напряжение изменяется со скоростью самое большее 175 мВ/с. Предпочтительные скорости медленного возбуждения являются скоростями более медленными чем 150, 100, 50 или 10 мВ/с.The terms “slow excitation”, “slow excitation speed”, “slow scanning” and “slow scanning speed” are defined as excitation, where the voltage changes at a speed of at most 175 mV / s. Preferred slow excitation rates are slower than 150, 100, 50, or 10 mV / s.
Термин «средняя начальная толщина» относится к средней высоте слоя перед внесением образца жидкости. Термин «средний» используют вследствие того, что верхняя поверхность слоя не является ровной, обладая пиками и углублениями.The term "average initial thickness" refers to the average height of the layer before introducing a sample of liquid. The term "medium" is used due to the fact that the upper surface of the layer is not even, having peaks and depressions.
Термин «окислительно-восстановительная интенсивность» (RI) определяют как суммарное время возбуждения, разделенное на сумму задержек суммарного времени возбуждения и суммарного времени релаксации для импульсной последовательности.The term “redox intensity” (RI) is defined as the total excitation time divided by the sum of the delays of the total excitation time and the total relaxation time for the pulse sequence.
Термин «переносное устройство» определяют как устройство, которое может удерживать рука человека и которое является переносным. Примером переносного устройства является измерительное устройство, сопутствующее системе мониторинга глюкозы крови Ascensia® Elite, поставляемой Bayer HealthCare, LLC, Elkhart, IN.The term “portable device” is defined as a device that can be held by a person’s hand and which is portable. An example of a portable device is a measurement device accompanying an Ascensia® Elite blood glucose monitoring system supplied by Bayer HealthCare, LLC, Elkhart, IN.
Термин «на» определяют как «поверх», и он относится к той ориентации, которая будет описана. Например, если первый элемент накладывают, по меньшей мере, на часть второго элемента, то говорят, что первый элемент «накладывают на» второй. В другом примере, если первый элемент находится поверх, по меньшей мере, части второго элемента, то говорят, что первый элемент находится «на» втором. Использование термина «на» не исключает присутствие веществ между верхним и нижним элементами, которые будут описаны. Например, первый элемент может обладать покрытием на своей верхней поверхности, однако второй элемент, располагающийся, по меньшей мере, поверх части первого элемента и его верхнего покрытия, можно описать как располагающийся «на» первом элементе. Таким образом, использование термина «на» может означать или не означать, что два элемента будут находиться в физическом контакте.The term “on” is defined as “over”, and it refers to the orientation that will be described. For example, if the first element is superimposed on at least a part of the second element, then it is said that the first element is “superimposed” on the second. In another example, if the first element is on top of at least part of the second element, then they say that the first element is "on" the second. The use of the term “on” does not exclude the presence of substances between the upper and lower elements to be described. For example, the first element may have a coating on its upper surface, however, the second element located at least over part of the first element and its upper coating can be described as being located “on” the first element. Thus, the use of the term “on” may or may not mean that the two elements will be in physical contact.
КРАТКОЕ ОПИСАНИЕ ЧЕРТЕЖЕЙBRIEF DESCRIPTION OF THE DRAWINGS
Изобретение можно лучше понять из следующего описания предпочтительных вариантов воплощения со ссылками на сопровождающие чертежи, на которых:The invention can be better understood from the following description of preferred embodiments with reference to the accompanying drawings, in which:
фиг.1A изображает общий вид собранной сенсорной панели, согласно изобретению;figa depicts a General view of the assembled touch panel according to the invention;
фиг.1B - вид сверху сенсорной панели с удаленной заглушкой, согласно изобретению;figv is a top view of the touch panel with the remote plug, according to the invention;
фиг.2 - вид сверху сенсорной панели на фиг.1B, согласно изобретению;figure 2 is a top view of the touch panel in figv, according to the invention;
фиг.3A и 3B - рабочий электрод, содержащий поверхностный проводник и DBL, в ходе приложения длительного и короткого импульсов считывания, согласно изобретению;figa and 3B - working electrode containing a surface conductor and DBL, during the application of long and short read pulses, according to the invention;
фиг.4A и 4B - диаграммы, иллюстрирующие усовершенствование точности измерения, когда DBL сочетают с коротким возбуждением, согласно изобретению;4A and 4B are diagrams illustrating an improvement in measurement accuracy when DBL is combined with short excitation according to the invention;
фиг.5 - блок-схему последовательности шагов электрохимического аналитического способа определения присутствия и концентрации аналита в образце, согласно изобретению;5 is a flowchart of an electrochemical analytical method for determining the presence and concentration of analyte in a sample according to the invention;
фиг.6A-6F - шесть примеров импульсных последовательностей, где к сенсорной панели прикладывали множественные рабочие циклы после внесения образца, согласно изобретению;6A-6F are six examples of pulse sequences where multiple duty cycles were applied to a touch panel after a sample was applied, according to the invention;
фиг.7A - циклическую вольтамперограмму для сенсорной системы, согласно изобретению;figa is a cyclic voltammogram for a sensor system according to the invention;
фиг.7B - диаграмму сравнения циклического сканирования с нециклическим сканированием, где прямое возбуждение нециклического сканирования началось вблизи формального потенциала E°' для окислительно-восстановительной пары, согласно изобретению;FIG. 7B is a comparison diagram of a cyclic scan with a non-cyclic scan, where direct excitation of a non-cyclic scan started near the formal potential E ° ′ for the redox pair according to the invention;
фиг.7C - диаграмму нециклического сканирования, где обратное сканирование заканчивается пиком обратного тока, согласно изобретению;figs is a diagram of a non-cyclic scan, where the reverse scan ends with a peak reverse current, according to the invention;
фиг.7D - диаграмму циклического сканирования с нециклическим сканированием, наложенным в области DLC, согласно изобретению;FIG. 7D is a cyclic scan diagram with non-cyclic scan superimposed in a DLC region according to the invention; FIG.
фиг.8A-8D - диаграммы выходных токов, нанесенных в виде вольтамперограмм, исходя из импульсной последовательности, представленной на фиг.6C для образцов WB с 40% гематокритом, содержащих 50, 100 и 400 мг/дл глюкозы, согласно изобретению;figa-8D are diagrams of the output currents plotted as voltammograms, based on the pulse sequence shown in figs for samples WB with 40% hematocrit containing 50, 100 and 400 mg / dl glucose according to the invention;
фиг.9A-9C - контурные профили вольтамперограмм на фиг.8A-8C, согласно изобретению;figa-9C - contour profiles of voltammograms on figa-8C, according to the invention;
фиг.10A - диаграмму полуинтеграла, соответствующего циклической вольтамперограмме на фиг.7A, согласно изобретению;figa is a diagram of the half-integral corresponding to the cyclic voltammogram in figa, according to the invention;
На фиг.10B - диаграмму полуинтеграла нециклических данных, соответствующих нециклической вольтамперограмме на фиг.7C, согласно изобретению;FIG. 10B is a semi-integral diagram of non-cyclic data corresponding to the non-cyclic voltammogram in FIG. 7C according to the invention;
фиг.10C - диаграммы полуинтегралов циклических и нециклических возбуждений на фиг.7B, согласно изобретению;figs - diagrams of the semi-integrals of cyclic and non-cyclic excitations on figv, according to the invention;
фиг.10D - диаграмму полуинтеграла и зарегистрированные величины токов для нециклического возбуждения на фиг.7D, согласно изобретению;fig.10D is a diagram of the half-integral and the recorded current values for non-cyclic excitation in fig.7D, according to the invention;
фиг.11 - контурные профили, полученные полуинтегрированием вольтамперограмм, исходя из семи импульсных последовательностей возбуждения для образцов WB, содержащих различные количества глюкозы, согласно изобретению;11 - contour profiles obtained by the semi-integration of voltammograms, based on seven pulse excitation sequences for samples WB containing various amounts of glucose, according to the invention;
фиг.12A - циклическую вольтамперограмму, полуинтеграл и полупроизводную 16 мМ ферроцианида в образце WB с 20% гематокритом, согласно изобретению;figa is a cyclic voltammogram, half-integral and half-derivative of 16 mm ferrocyanide in a sample of WB with 20% hematocrit, according to the invention;
фиг.12B - увеличенное изображение полупроизводной кривой на фиг.12A, согласно изобретению;figv is an enlarged image of the semi-derivative curve in figa, according to the invention;
фиг.13A-13C - производные циклических вольтамперограмм, согласно изобретению;figa-13C - derivatives of cyclic voltammograms, according to the invention;
фиг.14 - диаграммы полуинтегральных токов, зарегистрированных в виде функции от времени для контурных профилей на фиг.11, согласно изобретению;Fig.14 is a diagram of semi-integrated currents recorded as a function of time for the contour profiles of Fig.11, according to the invention;
фиг.15 - циклические вольтамперограммы, полученные при неполном заполнении сенсорной панели, согласно изобретению;Fig - cyclic voltammograms obtained with incomplete filling of the touch panel according to the invention;
фиг.16A - диаграммы полуинтегральных циклических вольтамперограмм, полученных с пяти сенсорных полосок со скоростями сканирования 1 В/с для образца, содержащего 100 мг/дл глюкозы и 40% гематокрита в WB, согласно изобретению;figa - diagrams of semi-integrated cyclic voltammograms obtained from five sensor strips with scanning speeds of 1 V / s for a sample containing 100 mg / dl glucose and 40% hematocrit in WB, according to the invention;
фиг.16B - диаграмму отношения величин токов для прямого и обратного сканирования, произведенных при разности потенциалов 0,15 В, в виде функции от концентрации фермента, согласно изобретению;figv is a diagram of the relationship of the magnitude of the currents for direct and reverse scanning produced at a potential difference of 0.15 V, as a function of the concentration of the enzyme, according to the invention;
фиг.16C - диаграмму зависимости для наклона калибровки линейной зависимости для сенсорной панели в виде функции от содержания GO (% от сухой массы), согласно изобретению;figs is a dependency diagram for the slope of the linear dependence calibration for the touch panel as a function of GO content (% of dry weight), according to the invention;
фиг.17 - схему измерительного устройства, согласно изобретению.17 is a diagram of a measuring device according to the invention.
ПОДРОБНОЕ ОПИСАНИЕ ПРЕДПОЧТИТЕЛЬНЫХ ВАРИАНТОВ ВОПЛОЩЕНИЯ ИЗОБРЕТЕНИЯDETAILED DESCRIPTION OF THE PREFERRED EMBODIMENTS OF THE INVENTION
Электрохимическая аналитическая система определяет концентрацию аналитов в образце, например концентрацию глюкозы в цельной крови. Система содержит, по меньшей мере, одно устройство, которое прикладывает стробированные вольтамперометрические импульсные последовательности, включающие множественные рабочие циклы, к образцу. Каждый рабочий цикл включает линейное, циклическое или нециклическое возбуждение, в течение которого токи (силу тока) измеряют от сенсорной панели, в то время как разность потенциалов (напряжение), приложенная к панели, изменяется линейно с течением времени. Каждый рабочий цикл также включает релаксацию, которую может обеспечить разомкнутая цепь. Система может сравнивать данные по результирующему току для определения концентрации аналита в образце, в то же время корректируя результаты для вариаций факторов, не зависящих от аналита. В системе можно также применять один или несколько видов обработки данных, включая те, которые основаны на полуинтегрировании, взятии производных и полупроизводных для анализа вольтамперометрических данных.An electrochemical analytical system determines the concentration of analytes in a sample, for example, the concentration of glucose in whole blood. The system comprises at least one device that applies gated voltammetric pulse sequences including multiple duty cycles to the sample. Each duty cycle includes a linear, cyclic, or non-cyclic excitation, during which currents (amperage) are measured from the touch panel, while the potential difference (voltage) applied to the panel changes linearly over time. Each duty cycle also includes relaxation that an open circuit can provide. The system can compare the resultant current data to determine the analyte concentration in the sample, while adjusting the results for variations in factors independent of the analyte. One or several types of data processing can also be used in the system, including those based on semi-integration, taking derivatives and semi-derivatives for analysis of voltammetric data.
Стробированные вольтамперометрические импульсные последовательности обеспечивают повышенную точность и воспроизводимость анализа, в то же время уменьшая время осуществления анализа. Систематические погрешности, вносимые гематокритным эффектом, и случайные погрешности, вносимые варьированием объема пространства заглушки, можно уменьшить с помощью сочетания диффузионного барьерного слоя со стробированными импульсными последовательностями. Погрешности, возникающие в других случаях из-за нестационарного состояния сенсора и/или фонового влияния медиатора, также можно уменьшить. Время, требуемое для анализа, можно уменьшить устранением потребности в дополнительных задержках и импульсах, таких как задержки «инкубации» для обеспечения регидратации реагента, импульсы «выгорания» для восстановления электродов и импульсы регенерации медиатора для восстановления состояния окисления медиатора. Стробированные импульсные последовательности также могут обеспечить определение динамического тока и контурных профилей, которые дают множественные точки калибровки, детектирование неполного заполнения и способность осуществлять компенсацию температуры в анализе. Вследствие того что стробированные импульсные последовательности могут быстро давать пригодные данные, можно устранить длительные времена ожидания общепринятой кулонометрии и неточность нестационарных измерений в общепринятой амперометрии.Gated voltammetric pulse sequences provide increased accuracy and repeatability of the analysis, while reducing analysis time. The systematic errors introduced by the hematocrit effect and the random errors introduced by varying the volume of the stub space can be reduced by combining the diffusion barrier layer with gated pulse sequences. Errors arising in other cases due to the unsteady state of the sensor and / or the background influence of the mediator can also be reduced. The time required for analysis can be reduced by eliminating the need for additional delays and impulses, such as delays of “incubation” for reagent rehydration, “burn-out” pulses for electrode recovery, and mediator regeneration pulses for restoration of a mediator oxidation state. Gated pulse sequences can also provide dynamic current and loop profiles that provide multiple calibration points, underfill detection, and the ability to compensate for temperature in the analysis. Due to the fact that gated pulse sequences can quickly provide useful data, it is possible to eliminate long waiting times for conventional coulometry and the inaccuracy of non-stationary measurements in conventional amperometry.
На фиг.1A-1B представлена сенсорная панель 100, которую можно применять в заявленной сенсорной системе. Фиг.1A представляет собой перспективное изображение собранной сенсорной панели 100, включающей основание сенсора 110, по меньшей мере, частично покрытое заглушкой 120, которая включает выпускное отверстие 130, вогнутую область 140 и отверстие на входном конце 150. Частично закрытый объем 160 (пространство заглушки) образован между основанием 110 и заглушкой 120. Также можно применять другие конструкции сенсорной панели, совместимые с настоящим изобретением, например, описанные в патентах US №№5120420 и 5798031.On figa-1B presents the
Жидкий образец для анализа можно переносить в пространство заглушки 160 внесением жидкости в отверстие 150. Жидкость заполняет пространство заглушки 160, при этом вытесняя содержащийся там воздух через выпускное отверстие 130. Пространство заглушки 160 может содержать композицию (не показана), которая помогает удерживать жидкий образец в пространстве заглушки. Примеры таких композиций включают набухающие в воде полимеры, такие как карбоксиметилцеллюлоза и полиэтиленгликоль, и пористые полимерные матрицы, такие как декстран и полиакриламид.The liquid sample for analysis can be transferred into the space of the
На фиг.1B представлен вид сверху сенсорной панели 100 с удаленной заглушкой 120. Проводники 170 и 180 могут проходить под слоем диэлектрика 190 от отверстия 150 к рабочему электроду 175 и противоэлектроду 185 соответственно. В одном из аспектов рабочий электрод и противоэлектрод 175, 185 могут располагаться, по существу, на одной плоскости. В другом аспекте электроды 175, 185 могут быть обращены друг к другу, так как описано в патентной заявке US 2004/0054267.FIG. 1B is a plan view of the
Хотя рабочий электрод и противоэлектрод 175, 185 могут находиться более близко, в одном из аспектов электроды 175, 185 можно отделить более чем на 200 или 250 мкм. Аналогично, хотя, по меньшей мере, один из электродов 175, 185 может находиться более близко, в одном из аспектов, по меньшей мере, один электрод можно отделить от верхней части заглушки 120, по меньшей мере, на 100 мкм. В одном из аспектов рабочий электрод и противоэлектрод 175, 185 могут обладать областями поверхности около 1 и 1,2 мм2 соответственно. Слой диэлектрика 190 может частично покрывать электроды 175, 185, и его можно изготовить из любого подходящего диэлектрического материала, такого как изоляционный полимер.Although the working electrode and
Противоэлектрод 185 компенсирует потенциал на рабочем электроде 175 сенсорной панели 100. В одном из аспектов этот потенциал может представлять собой относительный потенциал, достигаемый формированием противоэлектрода 185 из окислительно-восстановительной пары, такой как Ag/AgCl, для формирования контрольного электрода-противоэлектрода. В другом аспекте разность потенциалов можно обеспечить для сенсорной системы формированием противоэлектрода 185 из инертного материала, такого как углерод, и внесением растворимого окислительно-восстановительного вещества, такого как феррицианид, в пространство заглушки 160.The
Альтернативно, сенсорную панель 100 можно снабдить третьим проводником и электродом (не показаны) для обеспечения относительной разности потенциалов в сенсорной системе. Третий электрод можно изготовить в виде регулирующего контрольного электрода или в виде инертного материала, который использует растворимое окислительно-восстановительное вещество для обеспечения относительной разности потенциалов. Третий электрод может также обеспечивать измерительному устройству возможность определить, подключена ли сенсорная панель и/или заполнено ли образцом пространство заглушки 160. Можно также снабдить панель 100 дополнительными проводниками и/или электродами для обеспечения этих и других функций.Alternatively, the
На фиг.2 представлен вид сбоку сенсорной панели, изображенной на фиг.1B, на которой показана структура слоев рабочего электрода 175 и противоэлектрода 185. Проводники 170 и 180 могут лежать прямо на основании 110. Поверхностные слои проводников 270 и 280, не обязательно, можно наносить на проводники 170 и 180 соответственно. Поверхностные слои проводников 270, 280 можно изготовить из одинаковых или разных материалов.FIG. 2 is a side view of the touch panel of FIG. 1B, which shows the layer structure of the working
Материал или материалы, используемые для изготовления проводников 170, 180 и поверхностных слоев проводников 270, 280, могут включать любой электрический проводник. Предпочтительные электрические проводники являются неионизирующими, так что материал не подвергается общему окислению или общему восстановлению в ходе анализа образца. Проводники 170, 180 предпочтительно содержат тонкий слой металлической пасты или металла, такого как золото, серебро, платина, палладий, медь или вольфрам. Поверхностные слои проводников 270, 280 предпочтительно содержат углерод, золото, платину, палладий или их сочетания. Если у проводника отсутствует поверхностный слой проводника, то проводник предпочтительно изготавливают из неионизирующего материала.The material or materials used to make the
Поверхностный материал проводника можно наносить на проводники 170, 180 любым известным способом, совместимым с функционированием сенсорной панели, включая нанесение фольги, химическое вакуумное нанесение, осаждение суспензии, металлизацию и т.п. В случае осаждения суспензии смесь можно наносить в виде пасты на проводники 170, 180.The surface material of the conductor can be applied to the
Слои реагентов 275 и 285 можно наносить на проводники 170 и 180 соответственно, и они могут содержать реагенты и не обязательно связующее вещество. Связующее вещество предпочтительно является полимерным материалом, который, по меньшей мере, частично является водорастворимым. Подходящие частично водорастворимые полимерные материалы для использования в качестве связующего вещества могут включать поли(этиленоксид) (PEO), карбоксиметилцеллюлозу (CMC), поливиниловый спирт (PVA), гидроксиэтиленцеллюлозу (HEC), гидроксипропилцеллюлозу (HPC), метилцеллюлозу, этилцеллюлозу, этилгидроксиэтилцеллюлозу, карбоксиметилэтилцеллюлозу, поливинилпирролидон (PVP), полиаминокислоты, такие как полилизин, полистиролсульфонат, желатин, акриловую кислоту, метакриловую кислоту, крахмал, малеиновый ангидрид, их соли, их производные и их сочетания. Среди вышеупомянутых связующих веществ предпочтительными являются PEO, PVA, CMC и PVA, более предпочтительными в настоящее время являются CMC и PEO.Reagent layers 275 and 285 can be applied to
Кроме связующего вещества слои реагентов 275 и 285 могут содержать одинаковые или разные реагенты. В одном из аспектов реагенты, присутствующие в первом слое 275, можно отбирать для использования с рабочим электродом 175, в то время как реагенты, присутствующие во втором слое 285, можно отбирать для использования с противоэлектродом 185. Например, реагенты в слое 285 могут облегчать свободное перемещение электронов между образцом и проводником 180. Аналогично, реагенты в слое 275 могут облегчать взаимодействие аналита.In addition to the binder, the layers of
Слой реагента 275 может содержать оксидоредуктазу, специфичную для аналита, которая может облегчать реагирование аналита, в то же время усиливая специфичность сенсорной системы для аналита, в особенности в многокомпонентных биологических образцах. Примеры некоторых специфических оксидоредуктаз и соответствующих аналитов приведены ниже в таблице II.The
В настоящее время особенно предпочтительные оксидоредуктазы для анализа глюкозы включают глюкозооксидазу, глюкозодегидрогеназу, их производные или их сочетания.Currently, particularly preferred oxidoreductases for glucose analysis include glucose oxidase, glucose dehydrogenase, derivatives thereof, or combinations thereof.
Слой реагента 275 также может содержать медиатор для более эффективной передачи результатов реакции с аналитом к поверхностному проводнику 270 и/или проводнику 170. Примеры медиаторов включают OTM-комплексы, координационные комплексы и электроактивные органические молекулы. Конкретные примеры включают соединения ферроцена, ферроцианид, феррицианид, коферменты замещенных или незамещенных пирролохинолинхинонов (PQQ), замещенные или незамещенные 3-фенилимино-3H-фенотиазины (PIPT), 3-фенилимино-3H-феноксазин (PIPO), замещенные или незамещенные бензохиноны, замещенные или незамещенные нафтохиноны, N-оксиды, нитрозосоединения, гидроксиламины, оксины, флавины, феназины, производные феназинов, фенотиазины, индофенолы и индамины. Эти и другие медиаторы, которые можно включить в слой реагента, раскрыты в патентах US №№5653863, 5520786, 4746607, 3791988 и в EP №№0354441 и 0330517.The
В настоящее время особенно предпочтительные медиаторы для анализа глюкозы включают феррицианид, рутений-гексамин, PIPT, PIPO или их сочетания. Обзор пригодных электрохимических медиаторов для биологических окислительно-восстановительных систем можно найти в Analytica Clinica Acta 140 (1982), стр. 1-18.Currently, particularly preferred mediators for glucose analysis include ferricyanide, ruthenium-hexamine, PIPT, PIPO, or combinations thereof. A review of suitable electrochemical mediators for biological redox systems can be found in Analytica Clinica Acta 140 (1982), pp. 1-18.
Слои реагентов 275, 285 можно наносить любыми известными способами, такими как печатание, нанесение жидкости или струйное нанесение. В одном из аспектов слои наносят печатанием. При прочих равных условиях угол печатной пластины может обратно пропорционально влиять на толщину слоев реагентов. Например, если пластину передвигают под углом около 82° по отношению к основанию 110, то слой может иметь толщину около 10 мкм. Аналогично, если используют угол пластины около 62° по отношению к основанию 110, то можно получить более толстый слой 30 мкм. Таким образом, меньшие углы пластины будут обеспечивать более толстые слои реагентов. Кроме угла пластины другие факторы, такие как вязкость наносимого материала, а также размер сита и сочетание эмульсий могут влиять на результирующую толщину слоев реагентов 275, 285.The layers of
Рабочий электрод 175 может также содержать диффузионный барьерный слой (DBL), который составляет одно целое со слоем реагента 275 или который представляет собой отдельный слой 290, такой как слой на фиг.2. Таким образом, DBL можно сформировать в виде сочетания реагент/DBL на проводнике, в виде отдельного слоя на проводнике или в виде отдельного слоя на слое реагента. Если рабочий электрод 175 содержит отдельный DBL 290, то слой реагента 275 может или не может располагаться на DBL 290. Вместо расположения на DBL 290 слой реагента 275 может располагаться на любой части сенсорной панели 100, которая обеспечивает растворение реагента в образце. Например, слой реагента 175 может располагаться на основании 110 или на заглушке 120.The working
DBL обеспечивает пористое пространство, обладающее внутренним объемом, где может находиться измеряемое вещество. Поры DBL можно выбирать так, что измеряемое вещество может диффундировать в DBL, в то время как физически более крупные составные части образца, такие как RB-клетки, по существу исключаются. Хотя в общепринятых сенсорных панелях используют разнообразные материалы для отфильтровывания RB-клеток с поверхности рабочего электрода, DBL обеспечивает внутренний объем для содержания и отделения части измеряемого вещества от образца.DBL provides a porous space with an internal volume where the measured substance can be. DBL pores can be selected so that the measured substance can diffuse into DBL, while physically larger constituent parts of the sample, such as RB cells, are substantially eliminated. Although conventional touch panels use a variety of materials to filter out RB cells from the surface of the working electrode, DBL provides an internal volume for containing and separating part of the measured substance from the sample.
Если слой реагента 275 содержит водорастворимое связующее вещество, любая часть связующего вещества, которая не растворяется в образце перед приложением возбуждения, может функционировать в качестве интегрального DBL. Средняя начальная толщина сочетания DBL/слой реагента составляет предпочтительно менее 30 или 23 микрометров (мкм) и более предпочтительно менее 16 мкм. В настоящее время особенно предпочтительная средняя начальная толщина сочетания DBL/слой реагента составляет от 1 до 30 мкм или от 3 до 12 мкм. Требуемую среднюю начальную толщину сочетания DBL/слой реагента можно выбрать для конкретной длины возбуждения, основываясь на том, когда скорость диффузии измеряемого вещества от DBL к поверхности проводника, такой как поверхность проводника 170 или поверхность поверхности проводника 270 на фиг.2, станет относительно постоянной.If the
Более того, использование слишком толстого DBL в сочетании с короткой длиной возбуждения может задержать тот момент, когда скорость диффузии измеряемого вещества от DBL к поверхности проводника станет относительно постоянной. Например, если рабочие циклы, включающие последовательные 1-секундные возбуждения, разделенные 0,5-секундными релаксациями, прикладывают к рабочему электроду с использованием сочетания DBL/слой реагента, обладающего средней начальной толщиной 30 мкм, то предпочтительную скорость диффузии измеряемого вещества от DBL к поверхности проводника можно не достичь до тех пор, пока не будут приложены, по меньшей мере, 6 рабочих циклов (>~10 секунд). С другой стороны, если те же самые рабочие циклы прикладывают к рабочему электроду с использованием сочетания DBL/слой реагента, обладающего средней начальной толщиной 11 мкм, то относительно постоянную скорость диффузии можно достичь после второго возбуждения (~2,5 секунды). Таким образом, существует верхний предел для предпочтительной средней начальной толщины DBL для данного рабочего цикла. Более подробное исследование соотношения между толщиной DBL, длиной возбуждения и временем до достижения относительно постоянной скорости диффузии раскрыто в публикации WO 2006/042304 от 12 октября 2005 года.Moreover, the use of a too thick DBL in combination with a short excitation length can delay the moment when the diffusion rate of the measured substance from DBL to the surface of the conductor becomes relatively constant. For example, if duty cycles involving successive 1-second excitations separated by 0.5-second relaxation are applied to the working electrode using a DBL / reagent layer having an average initial thickness of 30 μm, then the preferred diffusion rate of the measured substance from DBL to the surface the conductor can not be reached until at least 6 duty cycles (> ~ 10 seconds) are applied. On the other hand, if the same duty cycles are applied to the work electrode using a combination of DBL / reagent layer having an average initial thickness of 11 μm, then a relatively constant diffusion rate can be achieved after the second excitation (~ 2.5 seconds). Thus, there is an upper limit for the preferred average initial thickness DBL for a given duty cycle. A more detailed study of the relationship between DBL thickness, excitation length and time to reach a relatively constant diffusion rate is disclosed in WO 2006/042304 of October 12, 2005.
Отдельный DBL 290 может включать любое вещество, которое обеспечивает требуемое поровое пространство, в то же время являясь частично или медленно растворимым в образце. В одном из аспектов отдельный DBL 290 может включать вещество, которое связывает реагент, но не содержит реагентов. Отдельный DBL 290 может обладать средней начальной толщиной, по меньшей мере, 1 мкм, предпочтительно от 5 до 25 мкм и более предпочтительно от 8 до 15 мкм.A
На фиг.3A и 3B представлен рабочий электрод 300, содержащий поверхностный проводник 330 и отдельный DBL 305 в ходе приложения длительного и короткого импульсов считывания. Когда образец WB наносят на рабочий электрод 300, RB-клетки 320 покрывают DBL 305. Аналит, присутствующий в образце, образует наружное измеряемое вещество 310, внешнее по отношению к DBL 305. Часть наружного измеряемого вещества 310 диффундирует в отдельный DBL 305 для получения внутреннего измеряемого вещества 315.3A and 3B, a working
Как показано на фиг.3A, если непрерывный 10-секундный импульс считывания прикладывают к рабочему электроду 300, то как наружное, так и внутреннее измеряемое вещество 310 и 315 подвергаются возбуждению на поверхностном проводнике 330 за счет изменения в состоянии окисления. В ходе длительного импульса считывания наружное измеряемое вещество 310 диффундирует через область образца, где располагаются RB-клетки 320, и через DBL 305 к поверхностному проводнику 330. Диффузия наружного измеряемого вещества 310 через RB-клетки 320 в ходе импульса считывания вносит в анализ гематокритный эффект. Вследствие того что существенная часть измеряемого вещества, подвергаемая возбуждению на поверхностном проводнике 330, происходит извне DBL 320, длительный импульс считывания, приложенный к сенсорной панели, обладающей DBL, в отношении гематокритного эффекта может действовать аналогично короткому импульсу считывания, приложенному к панели, не содержащей DBL.As shown in FIG. 3A, if a continuous 10 second read pulse is applied to the working
С другой стороны, на фиг.3B представлена ситуация, где короткое возбуждение приложено к сенсорной панели 300, снабженной DBL, для возбуждения внутреннего измеряемого вещества 315, в то же время, по существу, исключая из возбуждения измеряемое вещество 310, наружное по отношению к DBL 305. В ходе короткого возбуждения измеряемое вещество 310 или остается наружным по отношению к DBL 305, или существенно не диффундирует через DBL до достижения поверхностного проводника 330. Таким образом, короткое возбуждение может обеспечивать существенное снижения влияния гематокритного эффекта на анализ. Посредством уменьшения гематокритного эффекта можно уменьшить ошибки анализа (погрешность), вносимые составными частями образца, включая RB-клетки.On the other hand, FIG. 3B shows a situation where a short excitation is applied to the
Другим преимуществом избирательного анализа измеряемого вещества, внутреннего по отношению к DBL, в сочетании с коротким возбуждением является снижение невоспроизводимости измерений от сенсорных полосок, обладающих изменяющимися объемами пространства заглушки. Вариации объема пространства заглушки между сенсорными панелями могут приводить к невоспроизводимости, так как в электронных схемах в известных измерительных устройствах прикладывают одинаковую электрическую разность потенциалов и осуществляют одинаковые вычисления для каждого анализа. Если импульс считывания продолжается после того времени, когда, по существу, проанализировано все измеряемое вещество, присутствующее в пространстве заглушки, то анализ больше не отражает концентрацию измеряемого вещества в образце, но вместо этого отражает количество измеряемого вещества в пространстве заглушки, совсем другое измерение. Таким образом, для сенсорной панели, обладающей более значительным объемом пространства заглушки, будет зарегистрирована более высокая концентрация аналита, чем для сенсорной панели, обладающей меньшим объемом пространства заглушки, вне зависимости от концентрации аналита в образце. По существу, ограничивая анализ измеряемым веществом, присутствующим в DBL, можно снизить невоспроизводимость, в противном случае вносимую образованием вариаций сенсорных полосок.Another advantage of the selective analysis of the measured substance, internal to DBL, in combination with short excitation, is the reduction of the irreproducibility of measurements from sensor strips having varying volumes of the stub space. Variations in the volume of the stub space between the touch panels can lead to irreproducibility, since the same electrical potential difference is applied in electronic circuits in known measuring devices and the same calculations are performed for each analysis. If the read pulse continues after the time when essentially all the measured substance present in the stub space is analyzed, then the analysis no longer reflects the concentration of the measured substance in the sample, but instead reflects the amount of the measured substance in the stub space, a completely different measurement. Thus, a higher analyte concentration will be recorded for a touch panel with a larger volume of stub space than for a touch panel with a smaller volume of stub space, regardless of the analyte concentration in the sample. Essentially, by limiting the analysis to the measurable substance present in the DBL, it is possible to reduce the irreproducibility, otherwise introduced by the formation of variations of the sensor strips.
На фиг.4A и 4B представлены диаграммы, иллюстрирующие усовершенствование измерения точности, когда DBL сочетали с коротким возбуждением. На фиг.4A показана значительная неточность, представленная как расхождение между калибровочными линиями 16% и 48% (полный диапазон гематокритной погрешности), полученными от сенсорной панели, не содержащей DBL, после 1-секундного возбуждения. На фиг.4B показано меньшее расхождение между калибровочными линиями, представляющими более точный результат, когда DBL сочетали с 1-секундным возбуждением. Полный диапазон гематокритной погрешности для DBL в сочетании с коротким возбуждением оказался меньше приблизительно на две третьих, чем полный диапазон погрешности без DBL.4A and 4B are diagrams illustrating an improvement in accuracy measurement when DBL is combined with short excitation. FIG. 4A shows a significant inaccuracy, presented as the difference between the calibration lines of 16% and 48% (full range of hematocrit error) obtained from the touch panel without DBL after 1 second excitation. FIG. 4B shows a smaller discrepancy between calibration lines representing a more accurate result when DBL was combined with 1 second excitation. The total hematocrit error range for DBL in combination with short excitation turned out to be approximately two-thirds less than the full error range without DBL.
Как описано выше, короткий импульс считывания или возбуждение может обеспечивать усовершенствование точности и/или воспроизводимости анализа. Однако если для анализа используют одиночное короткое возбуждение, то можно не достичь относительно постоянной скорости диффузии измеряемого вещества из DBL к поверхности проводника в ходе анализа. Это состояние также может приводить к неточности измерения вследствие того, что концентрация измеряемого вещества в DBL не точно соответствует концентрации в образце. Более того, одиночное возбуждение не может эффективно уменьшать фоновый сигнал от медиатора.As described above, a short read pulse or drive can provide improved accuracy and / or reproducibility of the analysis. However, if a single short excitation is used for analysis, then a relatively constant diffusion rate of the measured substance from DBL to the surface of the conductor during the analysis may not be achieved. This condition can also lead to inaccurate measurements due to the fact that the concentration of the measured substance in DBL does not exactly correspond to the concentration in the sample. Moreover, single excitation cannot effectively reduce the background signal from the mediator.
На фиг.5 представлена блок-схема последовательности операций электрохимического анализа 500 для определения присутствия и не обязательно концентрации аналита 522 в образце 512, посредством которого можно преодолеть недостатки, связанные с короткими возбуждениями. В одном из аспектов в анализе 500 можно уменьшать погрешность из-за фонового влияния медиатора, в то же время обеспечивая более короткое время анализа с DBL или без него. В предпочтительном аспекте анализ 500 можно завершить менее чем за 3 минуты или менее чем за 1 минуту. В более предпочтительном аспекте анализ 500 можно завершить за время от 2 до 50 или от 4 до 32 секунд.5 is a flowchart of an
На шаге 510 образец 512 вносят на сенсорную панель 514, такую как сенсорная панель на фиг.1A-1B и 2. Слои реагентов, такие как 275 и/или 285 (фиг.2), начинают растворять в образце 512, таким образом обеспечивая протекание реакции. На этой стадии анализа можно, не обязательно, предусмотреть начальную временную задержку, или «инкубационный период», для того, чтобы реагенты прореагировали с образцом 512. Предпочтительно необязательная временная задержка может составлять от 1 до 10 секунд. Более подробное рассмотрение начальных временных задержек раскрыто в патентах US №№5620579 и 5653863. В одном из аспектов анализ 500 может уменьшать потребность в инкубационном периоде.At
В ходе реакции часть аналита 522, присутствующая в образце 512, химически или биохимически окислена или восстановлена на шаге 520, например, оксидоредуктазой. При окислении или восстановлении, не обязательно, можно осуществлять перенос электронов между аналитом 522 и медиатором 532 на шаге 530.During the reaction, a portion of analyte 522 present in sample 512 is chemically or biochemically oxidized or reduced in
На шаге 540 измеряемое вещество 542, которое может являться заряженным аналитом 522 с шага 520 или заряженным медиатором 532 с шага 530, подвергают электрохимическому возбуждению (окислению или восстановлению). Например, если образец 512 представляет собой цельную кровь, содержащую глюкозу, окисленную глюкозооксидазой на шаге 520 и переносящую электрон для восстановления медиатора феррицианида (III) в ферроцианид (II) на шаге 530, то возбуждение на шаге 540 приводит к окислению ферроцианида (II) в феррицианид (III) на рабочем электроде. Таким образом, электрон избирательно переносится с аналита глюкозы на рабочий электрод сенсорной панели, где его можно детектировать измерительным устройством (не показано).In
Возбуждение на шаге 540 включает вольтамперометрическое сканирование, при котором меняющуюся разность потенциалов или «сканирование» прикладывают между электродами сенсорной панели 514 при, по существу, фиксированной скорости (В/с). Скорость сканирования может являться низкой или высокой; однако быстрые сканирования предпочтительны вследствие природы стробированных импульсных последовательностей. В одном из аспектов скорость, при которой происходит сканирование потенциала, составляет, по меньшей мере, 2 мВ/с, предпочтительно от 20 до 5000 мВ/с, более предпочтительно от 200 до 2000 мВ/с. В настоящее время особенно предпочтительная скорость сканирования составляет от 500 до 1500 мВ/с.The excitation in
Продолжительность возбуждения на шаге 540 составляет самое большее 4 или 5 секунд и предпочтительно менее 3, 2, 1,5 или 1 секунды. В другом аспекте продолжительность возбуждения на шаге 540 составляет от 0,1 до 3 секунд, от 0,1 до 2 секунд или от 0,1 до 1,5 секунды. Более предпочтительно продолжительность возбуждения на шаге 540 составляет от 0,4 до 1,2 секунды.The excitation duration in
На шаге 550 токи, полученные в результате сканирующего возбуждения на шаге 540, можно отслеживать и регистрировать в виде функции от приложенной разности потенциалов (напряжения). Это контрастирует с общепринятой амперометрией и кулонометрией, при которых прикладывают постоянное напряжение, в то время как ток измеряют в виде функции от времени. В одном из аспектов ток отслеживают и регистрируют на шаге возбуждения 540. В другом аспекте ток не отслеживают в течение релаксации на шаге 560 или, по меньшей мере, в течение части релаксации на шаге 560. В другом аспекте ток и потенциал на рабочем электроде можно отслеживать в течение, по меньшей мере, части релаксации на шаге 560, но величины не используют при определении концентрации аналита 522.In
На шаге 560 образец подвергается релаксации, при которой измерительное устройство может открыть цепь через сенсорную панель 514, таким образом давая возможность системе перейти на шаг релаксации. В течение релаксации на шаге 560 ток, приложенный в ходе возбуждения на шаге 540, по существу уменьшен, по меньшей мере, на половину, предпочтительно на порядок величины и более предпочтительно до нуля. Предпочтительно состояние с нулевым током обусловлено открытой цепью. В одном из аспектов продолжительность шага релаксации 560 составляет, по меньшей мере, 10, 5, 3, 2, 1,5, 1 или 0,5 секунды. В другом аспекте продолжительность шага релаксации 560 составляет от 0,1 до 3 секунд, от 0,1 до 2 секунд или от 0,1 до 1,5 секунды. Более предпочтительно продолжительность шага релаксации 560 составляет от 0,2 до 1,5 секунды, и она обусловлена открытой цепью.At
В течение шага релаксации 560 ионизирующее вещество может реагировать с аналитом с образованием дополнительного количества измеряемого вещества без воздействия со стороны электрической разности потенциалов. Таким образом, в глюкозной сенсорной системе, содержащей глюкозооксидазу и медиатор феррицианид в качестве реагентов, может образовываться дополнительное количество ферроцианида (восстановленного медиатора), соответствующее концентрации аналита в образце без воздействия электрической разности потенциалов в течение шага релаксации 560.During
Возбуждение на шаге 540, регистрация на шаге 550 и релаксация на шаге 560 составляют одиночный рабочий цикл. На шаге 570 рабочий цикл повторяют, по меньшей мере, один раз, давая в сумме, по меньшей мере, два рабочих цикла. В одном из аспектов рабочий цикл повторяют, по меньшей мере, дважды, давая в сумме, по меньшей мере, три рабочих цикла в течение 180 секунд, 90 секунд или менее. В другом аспекте импульсная последовательность анализа 500 включает, по меньшей мере, 4, 6, 8, 10, 14, 18 или 22 рабочих цикла, приложенных в течение независимо выбранного периода времени 120, 90, 60, 30, 15, 10 или 5 секунд. В другом аспекте рабочие циклы прикладывают в течение периода времени от 5 до 60 секунд. В другом аспекте от 3 до 18 или от 3 до 10 рабочих циклов можно прикладывать в течение 30 секунд или менее. В другом аспекте от 4 до 8 рабочих циклов можно прикладывать в течение 3-16 секунд.Excitation in
Повторяющаяся периодическая природа рабочих циклов анализа 500 прямо контрастирует с известными способами, в которых напряжение непрерывно прикладывают к сенсорной панели, и с нее непрерывно поступает ток в течение 5-10 секунд в ходе продолжения импульса считывания. Для этих общепринятых способов приложенное напряжение может обладать фиксированной разностью потенциалов или может обладать разностью потенциалов, которая изменяется с положительной на отрицательную или с положительной или отрицательной разности потенциалов на нулевую разность потенциалов по отношению к относительной разности потенциалов. Даже при нулевой относительной разности потенциалов в этих способах ток непрерывно поступает от сенсорной панели в течение импульса считывания, который дает возможность электрохимической реакции продолжаться на всем протяжении импульса считывания. Таким образом, в этих общепринятых способах как реакция, в которой образуется измеряемое вещество, соответствующее концентрации аналита, так и диффузия измеряемого вещества к рабочему электроду подвергаются действию тока в течение части общепринятого импульса считывания, соответствующей нулевой разности потенциалов. Импульсные последовательности анализа 500 также заметно отличаются от общепринятых способов, в которых используют одиночный длительный импульс со множественными измерениями, такой как импульсы, описанные в патенте US №5243516, благодаря множественным шагам релаксации 560.The repeating periodic nature of the analysis work cycles 500 directly contrasts with known methods in which voltage is continuously applied to the touch panel and current is continuously supplied from it for 5-10 seconds during the continuation of the read pulse. For these conventional methods, the applied voltage may have a fixed potential difference or may have a potential difference that changes from positive to negative or from positive or negative potential difference to zero potential difference with respect to the relative potential difference. Even at a zero relative potential difference in these methods, the current continuously flows from the touch panel during the read pulse, which allows the electrochemical reaction to continue throughout the read pulse. Thus, in these conventional methods, both the reaction in which the measured substance is formed, corresponding to the analyte concentration, and the diffusion of the measured substance to the working electrode are exposed to current during part of the conventional read pulse corresponding to the zero potential difference. The pulse sequences of the
На шаге 580 зарегистрированные величины токов и напряжения можно преобразовать с помощью одной или нескольких обработок данных. Преобразованные величины можно использовать для определения присутствия и/или концентрации аналита 522 в образце 512. Преобразованные величины можно также использовать для определения других характеристик анализа 500, включая гематокритную концентрацию образца, многочисленные калибровочные множества, неполное заполнение и содержание активного ионизирующего вещества сенсорной панели, как изложено ниже.At
На фиг.6A-6F представлено шесть примеров стробированных вольтамперометрических импульсных последовательностей, которые можно использовать в способе 500. В каждой импульсной последовательности множественные рабочие циклы прикладывали к сенсорной панели после внесения образца. Часть каждого рабочего цикла, соответствующую вольтамперометрическому возбуждению, можно прикладывать линейным (фиг.6A), циклическим (фиг.6B) или нециклическим образом (фиг.6C-6F). В этих примерах использовали наклонные (линейные) или треугольно-волновые (циклические или нециклические) импульсы возбуждения; однако также можно использовать другие типы волн, совместимые с сенсорной системой и образцом.6A-6F show six examples of gated voltammetric pulse sequences that can be used in
На фиг.6A представлены множественные наклонные возбуждения, где напряжение возрастало линейно с течением времени до конца. На фиг.6B представлены множественные треугольно-волновые возбуждения, предоставляющие циклические данные, которые включают диапазон полного потенциала медиатора феррицианида. На фиг.6C представлено шесть рабочих циклов, содержащих шесть треугольно-волновых возбуждений, предоставляющих нециклические данные, которые начинаются и заканчиваются по существу при одинаковом напряжении. Вследствие того что последнее возбуждение на фиг.6C, терминальный импульс считывания 640, не содержит релаксацию, показано только шесть рабочих циклов. На фиг.6D представлено семь рабочих циклов, включающих семь треугольно-волновых возбуждений, предоставляющих нециклические данные. Первому рабочему циклу предшествует начальный инкубационный период. На фиг.6E представлены множественные треугольно-волновые возбуждения, предоставляющие нециклические данные, которые начинаются и заканчиваются при разных напряжениях. На фиг.6F представлены множественные треугольно-волновые возбуждения, приводящие к нециклическим данным, которые по существу не включают пики окисления и восстановления окислительно-восстановительной пары феррицианид/ферроцианид.On figa presents multiple inclined excitations, where the voltage increased linearly over time to the end. FIG. 6B illustrates multiple triangular wave excitations providing cyclic data that include the full potential range of the ferricyanide mediator. On figs presents six duty cycles containing six triangular-wave excitations, providing non-cyclic data that begin and end at essentially the same voltage. Due to the fact that the last excitation in FIG. 6C, the terminal read
Терминальный импульс считывания 640 может обладать такой же продолжительностью и скоростью сканирования, как возбуждения предшествующих рабочих циклов, как изображено на фиг.6C, или терминальный импульс считывания 640 может обладать другой продолжительностью или скоростью. В одном из аспектов терминальный импульс считывания 640 может обладать большей продолжительностью и повышенным напряжением по отношению к возбуждениям предшествующих рабочих циклов. Повышенное напряжение может обеспечивать способность детектировать вещество, обладающее большим окислительным потенциалом, такое как контрольный раствор. Более полное обсуждение, относящееся к терминальным импульсам считывания, раскрыто в предварительной заявке на патент US №60/669729 от 8 апреля 2005 года.The terminal read
Контрольные растворы, содержащие известные количества глюкозы, можно использовать для подтверждения того, что система анализа правильно функционирует. Конкретные композиции для контрольных растворов раскрыты в патентах US №№3920580, 4572899, 4729959, 5028542, 5605837 и публикациях WO 93/21928, WO 95/13535 и WO 95/13536. Если измерительное устройство не может отличить сигнал от контрольного раствора по сравнению с образцом, показания контрольного раствора можно сохранять как величины для аналита. Таким образом, в запатентованных способах история определения глюкозы может включать неточности относительно диабетического состояния пациента.Control solutions containing known amounts of glucose can be used to confirm that the assay system is functioning properly. Specific compositions for control solutions are disclosed in US patent No. 3920580, 4572899, 4729959, 5028542, 5605837 and publications WO 93/21928, WO 95/13535 and WO 95/13536. If the measuring device cannot distinguish the signal from the control solution compared to the sample, the readings of the control solution can be stored as values for the analyte. Thus, in patented methods, the history of glucose determination may include inaccuracies regarding the patient's diabetic state.
Если измерительный прибор не может идентифицировать контрольные растворы и отделить их характеристики от характеристик образцов крови, значения глюкозы в контрольных растворах будут включены в историю измерений глюкозы, которые могут приводить к неправильной интерпретации диабетического состояния пациента.If the measuring device cannot identify the control solutions and separate their characteristics from the characteristics of the blood samples, the glucose values in the control solutions will be included in the history of glucose measurements, which may lead to a misinterpretation of the patient's diabetic state.
Каждый из рабочих циклов для импульсных последовательностей, изображенных на фиг.6A-6F, дает времена возбуждения более короткой продолжительности, чем последующие времена релаксации для открытой цепи; однако это не требуется. На фиг.6C продолжительность возбуждений составляет 0,8 секунды при скорости 1 В/с, в то время как продолжительность каждой релаксации составляет около 3,2 секунды. Таким образом, каждый рабочий цикл имеет продолжительность около 4 секунд, и импульсная последовательность продолжается около 24,8 секунд, включая терминальный импульс считывания, для обеспечения интенсивности окисления-восстановления (RI) 0,226 (5,6/24,8). Импульсная последовательность на фиг.6D обеспечивает более низкую RI 0,2 (5,6/28), что связано с инкубационным периодом перед первым рабочим циклом.Each of the duty cycles for the pulse sequences depicted in FIGS. 6A-6F gives excitation times of shorter duration than subsequent relaxation times for an open circuit; however, this is not required. 6C, the excitation duration is 0.8 seconds at a speed of 1 V / s, while the duration of each relaxation is about 3.2 seconds. Thus, each duty cycle has a duration of about 4 seconds, and the pulse sequence lasts about 24.8 seconds, including a terminal read pulse, to provide an oxidation-reduction (RI) intensity of 0.226 (5.6 / 24.8). The pulse sequence in FIG. 6D provides a lower RI of 0.2 (5.6 / 28), which is associated with the incubation period before the first work cycle.
Чем выше RI для импульсной последовательности, тем меньше фоновая неточность, вносимая в анализ медиатором. Импульсные последовательности, представленные на фиг.6A-6F, являются окислительными импульсами, предназначенными для возбуждения (например, окисления) восстановленного медиатора, который является измеряемым веществом. Таким образом, чем больше окислительный ток, приложенный к сенсорной панели в данный период времени, тем меньше шанс того, что медиатор, восстановленный способами, другими, чем окисление аналита, даст вклад в регистрируемые величины токов. В сочетании множественные возбуждения стробированной вольтамперометрической импульсной последовательности могут устранять потребность в начальном импульсе для восстановления окислительного состояния медиатора. Для феррицианида являются предпочтительными импульсные последовательности, обладающие величинами RI, по меньшей мере, 0,01, 0,3, 0,6 или 1, с более предпочтительными на настоящее время величинами RI от 0,1 до 0,8, от 0,2 до 0,7 или от 0,4 до 0,6.The higher the RI for the pulse sequence, the less the background inaccuracy introduced into the analysis by the mediator. The pulse sequences shown in FIGS. 6A-6F are oxidative pulses designed to excite (eg, oxidize) a reduced neurotransmitter, which is a measured substance. Thus, the greater the oxidizing current applied to the touch panel in a given period of time, the less is the chance that the mediator restored by methods other than the oxidation of the analyte will contribute to the recorded current values. In combination, the multiple excitations of the gated voltammetric pulse sequence can eliminate the need for an initial pulse to restore the oxidative state of the mediator. For ferricyanide, impulse sequences having RI values of at least 0.01, 0.3, 0.6, or 1 are preferred with currently preferred RI values of 0.1 to 0.8, 0.2 up to 0.7 or from 0.4 to 0.6.
В ходе линейного возбуждения, такого как прямое возбуждение 610 (фиг.6A), измеряют ток на рабочем электроде, в то время как потенциал на рабочем электроде изменяется линейно с течением времени с постоянной скоростью. Диапазон возбуждения, например, от -0,5 В до +0,5 В, может охватывать восстановленное и окисленное состояния окислительно-восстановительной пары так, что происходит переход из первого состояния во второе состояние. Можно считать, что ток, измеряемый на рабочем электроде, может состоять из трех компонентов: равновесный ток, диффузионный ток и поверхностный ток. Поверхностный ток, который может происходить из любого вещества, адсорбированного на электроде, как правило, мал. Равновесный и диффузионный токи являются основными компонентами, представленными в результирующей вольтамперограмме.During linear excitation, such as direct excitation 610 (FIG. 6A), the current at the working electrode is measured, while the potential at the working electrode varies linearly over time at a constant speed. The excitation range, for example, from -0.5 V to +0.5 V, can cover the reduced and oxidized states of the redox pair so that a transition occurs from the first state to the second state. We can assume that the current measured at the working electrode can consist of three components: equilibrium current, diffusion current, and surface current. The surface current that can come from any substance adsorbed on the electrode is usually small. Equilibrium and diffusion currents are the main components presented in the resulting voltammogram.
Линейную вольтамперограмму (зависимость тока от напряжения) можно охарактеризовать диаграммой, которая начинается на начальном токе, достигает максимального тока и в ходе возбуждения уменьшается до более низкого уровня, ограниченного диффузией тока (DLC). Начальный ток по существу зависит от приложенной разности потенциалов, в то время как DLC не зависит. Если сканирование является достаточно медленным, DLC можно рассматривать как область плато на вольтамперограмме.A linear voltammogram (dependence of current on voltage) can be characterized by a diagram that starts at the initial current, reaches maximum current, and during excitation decreases to a lower level limited by current diffusion (DLC). The initial current essentially depends on the applied potential difference, while the DLC is independent. If the scan is slow enough, the DLC can be considered as a plateau region on the voltammogram.
Область DLC представляет собой состояние, при котором окисление или восстановление измеряемого вещества на поверхности проводника достигает максимальной скорости, которая по существу ограничена диффузией. Диффузию можно ограничить скоростью, при которой измеряемое вещество перемещается от образца к поверхности проводника. Альтернативно, если рабочий электрод сенсорной панели содержит DBL, то диффузию можно ограничить скоростью, при которой измеряемое вещество перемещается от DBL к поверхности проводника.The DLC region is a state in which the oxidation or reduction of the measured substance on the surface of the conductor reaches a maximum speed, which is essentially limited by diffusion. Diffusion can be limited by the speed at which the measured substance moves from the sample to the surface of the conductor. Alternatively, if the touch pad working electrode contains DBL, diffusion can be limited by the speed at which the measured substance moves from DBL to the surface of the conductor.
Величины DLC, зарегистрированные при относительно постоянной скорости диффузии после регидратации слоя реагента, могут минимизировать неточности, которые в противном случае могут быть внесены вариациями в скоростях регидратации и диффузии реагентов. Таким образом, как только достигнута относительно постоянная скорость диффузии, зарегистрированные величины DLC могут более точно соответствовать концентрации измеряемого вещества и, таким образом, аналита.DLC values recorded at a relatively constant diffusion rate after rehydration of the reagent layer can minimize inaccuracies that might otherwise be introduced by variations in the rehydration and diffusion rates of the reagents. Thus, as soon as a relatively constant diffusion rate is reached, the recorded DLC values can more accurately correspond to the concentration of the measured substance and, thus, the analyte.
После окончания прямого возбуждения 610 для циклического или нециклического возбуждения, такого как возбуждения на фиг.6B и 6C соответственно, прикладывают линейное возбуждение 620 обратного потенциала. Линейное сканирование обратного потенциала возбуждения 620 можно приложить по существу с такой же скоростью, как прямое сканирование 610. Таким образом, диапазон возбуждения сканируют от первой более низкой величины до более высокой величины и в обратном направлении, до второй более низкой величины, где первая и вторая более низкие величины могут являться или не являться одинаковыми для циклического или нециклического сканирований соответственно. С помощью циклических и, в некоторых случаях, нециклических возбуждений можно исследовать переход окислительно-восстановительного вещества из восстановленного состояния в окисленное состояние (и наоборот) по отношению к приложенной разности потенциалов или по отношению к скорости диффузии окислительно-восстановительного вещества к поверхности проводника.After the end of
По отношению к линейному возбуждению циклические и нециклические возбуждения могут обеспечивать лучшее представление области DLC возбуждения. Преимущество циклических и нециклических возбуждений может являться в особенности полезным для количественного определения DLC от квазиобратимых окислительно-восстановительных пар при скоростях быстрого сканирования.With respect to linear excitation, cyclic and non-cyclic excitations can provide a better representation of the DLC excitation region. The advantage of cyclic and non-cyclic excitations can be especially useful for the quantitative determination of DLC from quasi-reversible redox pairs at fast scan rates.
На фиг.7A представлены данные по циклическому возбуждению 25 мВ/с для окислительно-восстановительной пары феррицианид/ферроцианид в виде циклической вольтамперограммы. Вольтамперограмма характеризуется пиком прямого тока в ходе прямой части сканирования от -0,3 В до +0,6 В, указывающим на окисление ферроцианида, и пиком обратного тока в ходе сканирования обратного напряжения от +0,6 В в обратном направлении до -0,3 В, указывающим на восстановление феррицианида. Пики прямого и обратного тока концентрируются вокруг формального потенциала E°' окислительно-восстановительной пары ферроцианид/феррицианид при отнесении к противоэлектроду. В данном аспекте потенциал противоэлектрода по существу определяется восстановительным потенциалом феррицианида, основного окислительно-восстановительного вещества, присутствующего на противоэлектроде.7A shows cyclic excitation data of 25 mV / s for a redox ferricyanide / ferrocyanide pair in the form of a cyclic voltammogram. The voltammogram is characterized by a peak in the forward current during the forward part of the scan from -0.3 V to +0.6 V, indicating oxidation of ferrocyanide, and a peak in the reverse current during scanning the reverse voltage from +0.6 V in the opposite direction to -0, 3 B, indicating reduction of ferricyanide. Forward and reverse current peaks are concentrated around the formal potential E ° ’of the redox pair ferrocyanide / ferricyanide when assigned to the counter electrode. In this aspect, the potential of the counter electrode is essentially determined by the reduction potential of ferricyanide, the main redox substance present on the counter electrode.
Хотя потенциалы, при которых начинаются прямое и обратное сканирования (диапазон возбуждения) можно выбирать так, чтобы включить восстановленное и окисленное состояния окислительно-восстановительной пары, диапазон возбуждения можно уменьшить для укорочения времени анализа. Однако диапазон возбуждения предпочтительно содержит область DLC для окислительно-восстановительной пары. Например, при скорости сканирования 25 мВ/с концентрация восстановленного [Red] и окисленного [Ox] вещества обратимой окислительно-восстановительной пары ферроцианид/феррицианид и результирующий электродный потенциал описывает уравнение НернстаAlthough the potentials at which direct and reverse scans begin (excitation range) can be chosen so as to include the reduced and oxidized states of the redox pair, the excitation range can be reduced to shorten the analysis time. However, the excitation range preferably contains a DLC region for the redox pair. For example, at a scanning speed of 25 mV / s, the concentration of the reduced [Red] and oxidized [Ox] substance of the reversible redox ferrocyanide / ferricyanide pair and the resulting electrode potential describes the Nernst equation

где: R представляет собой газовую постоянную 8,314 Дж/(моль*К); F представляет собой постоянную Фарадея 965000 Кл/экв.; n представляет собой количество эквивалентов на моль; T представляет собой температуру в градусах по Кельвину. Если потенциал на рабочем электроде отнесен к своему собственному окислительно-восстановительному потенциалу, то формальный потенциал E°' обратится по существу в нуль и уравнение сократится до:where: R represents a gas constant of 8.314 J / (mol * K); F represents the Faraday constant of 965,000 C / equiv .; n represents the number of equivalents per mole; T represents the temperature in degrees Kelvin. If the potential at the working electrode is related to its own redox potential, then the formal potential E ° 'will essentially vanish and the equation will be reduced to:

Из уравнения (2) следует, что, когда отношение окисленного медиатора к восстановленному медиатору изменяется на 10, потенциал на рабочем электроде изменяется приблизительно на 60 мВ. Также верно обратное. Таким образом, для отношений концентраций феррицианида [Ox] к ферроцианиду [Red] 10:1, 100:1, 1000:1 и 10000:1 потенциал на рабочем электроде станет приблизительно 60, 120, 180 и 240 мВ по отношению к нулевому потенциалу соответственно.From equation (2) it follows that when the ratio of the oxidized mediator to the restored mediator changes by 10, the potential at the working electrode changes by approximately 60 mV. The converse is also true. Thus, for the ratio of the concentrations of ferricyanide [Ox] to ferrocyanide [Red] 10: 1, 100: 1, 1000: 1 and 10000: 1, the potential at the working electrode will become approximately 60, 120, 180 and 240 mV with respect to the zero potential, respectively .
Таким образом, когда отношение феррицианида к ферроцианиду составляет ~1000:1, диапазон сканирования от -180 мВ до +180 мВ может обеспечить по существу полное окисление восстановленного вещества на рабочем электроде. При 180 мВ скорость окисления ограничена тем, насколько быстро восстановленная форма медиатора может диффундировать к поверхности проводника и от этого потенциала прямо туда, где существует область DLC. Таким образом, если точка возврата установлена на ~400 мВ от нулевого потенциала, то можно получить область DLC ~200 мВ.Thus, when the ratio of ferricyanide to ferrocyanide is ~ 1000: 1, a scan range of -180 mV to +180 mV can provide substantially complete oxidation of the reduced substance at the working electrode. At 180 mV, the oxidation rate is limited by how quickly the restored form of the mediator can diffuse to the surface of the conductor and from this potential directly to where the DLC region exists. Thus, if the return point is set to ~ 400 mV from the zero potential, then a DLC region of ~ 200 mV can be obtained.
Для обратимых систем может оказаться предпочтительным обеспечение диапазона возбуждения от 400 до 600 мВ, таким образом, вызывая возбуждение от 200 до 300 мВ с каждой стороны от формального потенциала E°' окислительно-восстановительной пары. Для квазиобратимых систем может оказаться предпочтительным обеспечение диапазона возбуждения от 600 до 1000 мВ, таким образом, вызывая возбуждение от 300 до 500 мВ с каждой стороны от формального потенциала E°' окислительно-восстановительной пары.For reversible systems, it may be preferable to provide an excitation range of 400 to 600 mV, thus causing an excitation of 200 to 300 mV on each side of the formal potential E ° ′ of the redox pair. For quasi-reversible systems, it may be preferable to provide an excitation range from 600 to 1000 mV, thus causing excitation from 300 to 500 mV on each side of the formal potential E ° ′ of the redox pair.
Для квазиобратимых систем может оказаться предпочтительным больший диапазон возбуждения вследствие того, что область DLC может быть меньше. В дополнение к окислительно-восстановительным парам, которые по природе являются квазиобратимыми, возбуждение при быстром сканировании может приводить к тому, что окислительно-восстановительная пара, которая обратима при скоростях медленного возбуждения, обладает квазиобратимым поведением. Таким образом, может оказаться предпочтительным обеспечение большего диапазона квазиобратимого возбуждения для обратимой окислительно-восстановительной пары при скоростях быстрого возбуждения.For quasi-reversible systems, a larger excitation range may be preferable because the DLC region may be smaller. In addition to redox pairs, which are quasi-reversible in nature, excitation during fast scanning can cause redox pairs that are reversible at slow excitation rates to have quasi-reversible behavior. Thus, it may be preferable to provide a larger range of quasi-reversible excitation for a reversible redox couple at rapid excitation rates.
Предпочтительно, по меньшей мере, 25, 50, 100, 150 или 300 мВ области DLC представлено выбранным диапазоном возбуждения. В другом аспекте точка возврата для циклического или нециклического возбуждения выбрана так, что представлено от 25 до 400 мВ, от 50 до 350 мВ, от 100 до 300 мВ или от 175 до 225 мВ области DLC. Для обратимых систем точку возврата для циклического или нециклического возбуждения можно выбрать так, что представлено от 180 до 260 мВ или от 200 до 240 мВ области DLC. Для квазиобратимых систем точку возврата для циклического или нециклического возбуждения можно выбрать так, что представлено от 180 до 400 мВ или от 200 до 260 мВ области DLC.Preferably, at least 25, 50, 100, 150, or 300 mV of the DLC region is represented by the selected excitation range. In another aspect, the return point for cyclic or non-cyclic excitation is selected such that 25 to 400 mV, 50 to 350 mV, 100 to 300 mV, or 175 to 225 mV of the DLC region are represented. For reversible systems, the return point for cyclic or non-cyclic excitation can be chosen so that it represents from 180 to 260 mV or from 200 to 240 mV of the DLC region. For quasi-reversible systems, the return point for cyclic or non-cyclic excitation can be chosen so that it represents from 180 to 400 mV or from 200 to 260 mV of the DLC region.
После того как точка возврата выбрана для обеспечения требуемой области DLC, можно выбрать продолжительность обратного сканирования для нециклического сканирования. Как можно видеть на фиг.7B, начало прямого сканирования и завершение обратного сканирования при около -0,025 мВ приводило к нециклическому сканированию, которое включало больше пиков прямого тока, чем пиков обратного тока. Из сравнения на фиг.7B следует, что, хотя пиковые значения токов, полученные для циклического (a) и нециклического (b) сканирований, отличаются, область DLC сканирований остается приблизительно одинаковой, в особенности в отношении обратного сканирования.Once a return point is selected to provide the desired DLC area, you can select the duration of the reverse scan for non-cyclic scanning. As can be seen in FIG. 7B, the beginning of the forward scan and the end of the reverse scan at about -0.025 mV led to a non-cyclic scan, which included more forward current peaks than reverse current peaks. From the comparison of FIG. 7B, it follows that although the peak currents obtained for the cyclic (a) and non-cyclic (b) scans are different, the DLC scan area remains approximately the same, especially with respect to reverse scanning.
В другом аспекте обратное возбуждение можно завершить перед достижением пика обратного тока, как изображено на фиг.7C. Тогда, когда прямое возбуждение начиналось при потенциале, достаточно отрицательном, таком как при -0,3 мВ на фиг.7C, по сравнению с серединой диапазона потенциала окислительно-восстановительной пары, такой как -0,05 мВ на фиг.7C, прямое возбуждение включало полный диапазон окислительно-восстановительного потенциала окислительно-восстановительной пары. Таким образом, посредством завершения обратного возбуждения при потенциале от 50 до 500 мВ, от 150 до 450 мВ или от 300 до 400 мВ в отрицательной области от точки возврата, например, пик обратного тока можно не включать для окислительно-восстановительной пары феррицианид/ферроцианид.In another aspect, the reverse excitation can be completed before reaching the peak of the reverse current, as shown in figs. Then, when direct excitation started at a potential negative enough, such as at -0.3 mV in FIG. 7C, compared with the middle of the potential range of the redox pair, such as -0.05 mV in FIG. 7C, direct excitation included the full range of redox potential of the redox pair. Thus, by completing the reverse excitation at a potential of 50 to 500 mV, 150 to 450 mV, or 300 to 400 mV in the negative region from the return point, for example, the peak of the reverse current can be omitted for the redox ferricyanide / ferrocyanide pair.
Аналогично, обратное возбуждение можно также завершить перед достижением пика обратного тока посредством завершения возбуждения тогда, когда ток обратного возбуждения отклоняется по величине от DLC. Изменение тока обратного возбуждения, по меньшей мере, на 2%, 5%, 10% или 25% можно использовать для указания на начало пика тока обратного возбуждения.Similarly, the reverse excitation can also be completed before reaching the peak of the reverse current by completing the excitation when the reverse excitation current deviates in magnitude from the DLC. A change in the reverse excitation current of at least 2%, 5%, 10%, or 25% can be used to indicate the beginning of the peak of the reverse excitation current.
На фиг.7D сравнивается циклическая вольтамперограмма 1 В/с, включающая пики прямого и обратного окисления окислительно-восстановительной пары, с нециклической вольтамперограммой 1 В/с, которая не включает пики прямого и обратного окисления окислительно-восстановительной пары. Нециклическое возбуждение обладало начальными и конечными точками 200 мВ и точкой возврата 300 мВ. Предпочтительные диапазоны возбуждения для нециклических возбуждений в пределах области DLC окислительно-восстановительной пары феррицианид/ферроцианид, которые не включают пики прямого и обратного окисления и восстановления, составляют от 10 до 200 мВ, более предпочтительно от 50 до 100 мВ. Хотя циклическая вольтамперограмма, включающая полный диапазон сканирования, значительно затухала после достижения пикового значения тока, нециклическая вольтамперограмма давала по существу плоскую область тока за пределами диапазона сканирования. Эта область тока может непосредственно коррелировать с концентрацией аналита в образце.On fig.7D compares the cyclic voltammogram 1 V / s, including the peaks of direct and reverse oxidation of the redox pair, with the non-cyclic voltammogram 1 V / s, which does not include the peaks of direct and reverse oxidation of the redox pair. Non-cyclic excitation had start and end points of 200 mV and a return point of 300 mV. Preferred excitation ranges for non-cyclic excitations within the DLC region of a ferricyanide / ferrocyanide redox pair that do not include direct and reverse oxidation and reduction peaks are from 10 to 200 mV, more preferably from 50 to 100 mV. Although a cyclic voltammogram including the full scan range attenuated significantly after reaching a peak current value, a non-cyclic voltammogram gave a substantially planar current region outside the scan range. This current region can directly correlate with the analyte concentration in the sample.
Как видно на фиг.7D, величины токов, зарегистрированные для нециклического возбуждения, в числовом отношении меньше, чем величины циклического возбуждения, хотя фоновый ток ниже для нециклического возбуждения. Это полезное уменьшение фонового тока неожиданно получено без необходимости инициации нециклического возбуждения в части пика восстановления циклического возбуждения. Таким образом, быстрое и короткое нециклическое возбуждение в пределах области DLC окислительно-восстановительной пары может повышать точность определения аналита благодаря уменьшению фонового тока, что может обеспечить повышение отношения сигнала к фону.As seen in FIG. 7D, the current values recorded for non-cyclic excitation are numerically smaller than the cyclic excitation values, although the background current is lower for non-cyclic excitation. This useful decrease in background current is unexpectedly obtained without the need to initiate non-cyclic excitation in the portion of the peak recovery of cyclic excitation. Thus, fast and short non-cyclic excitation within the DLC region of the redox pair can increase the accuracy of analyte determination by reducing the background current, which can provide an increase in the signal-to-background ratio.
Циклическое и нециклическое возбуждения могут давать многочисленные преимущества по отношению к линейным возбуждениям. В одном из аспектов часть обратного сканирования от точки возврата до точки, где начинается пик обратного тока, может лучше представлять истинные величины DLC, чем область DLC прямого сканирования. Область DLC обратного возбуждения может более точно представлять концентрацию аналита для квазиобратимых окислительно-восстановительных систем или при высоких скоростях возбуждения благодаря тому, что прямое возбуждение может не отображать отдельную область DLC.Cyclic and non-cyclic excitations can provide numerous advantages with respect to linear excitations. In one aspect, a portion of the reverse scan from the return point to the point where the peak of the reverse current begins can better represent the true DLC values than the forward scan DLC area. The reverse-excitation DLC region can more accurately represent the analyte concentration for quasi-reversible redox systems or at high excitation rates due to the fact that direct excitation may not display a separate DLC region.
Нециклические возбуждения могут обладать многочисленными преимуществами по сравнению с циклическими возбуждениями, включая более короткое время возбуждения и существенное уменьшение количества медиатора, электрохимически превращенного в измеряемое состояние. Таким образом, если медиатор восстановлен под влиянием аналита и электрохимически окислен в ходе измерения, завершение обратного возбуждения перед электрохимическим восстановлением окисленного медиатора снижает количество восстановленного медиатора в образце, которое не соответствует аналиту. Аналогично, начало прямого возбуждения при потенциале, более высоком, чем тот, при котором восстановлено измеряемое вещество, также может снижать количество восстановленного медиатора в образце, которое не соответствует аналиту. Оба вида нециклического возбуждения могут обеспечить более короткое время анализа, что является значительным преимуществом для пользователя.Non-cyclic excitations can have numerous advantages over cyclic excitations, including a shorter excitation time and a significant reduction in the amount of mediator electrochemically converted to a measurable state. Thus, if the mediator is reduced under the influence of the analyte and electrochemically oxidized during the measurement, completion of the reverse excitation before electrochemical reduction of the oxidized mediator reduces the amount of reduced mediator in the sample, which does not correspond to the analyte. Similarly, the onset of direct excitation at a potential higher than that at which the measured substance is reduced can also reduce the amount of reduced mediator in the sample that does not match the analyte. Both types of non-cyclic excitation can provide a shorter analysis time, which is a significant advantage for the user.
На фиг.8A-8D показаны выходные динамические токи, представленные в виде функции потенциала, исходя из импульсной последовательности на фиг.6C с использованием 7 треугольно-волновых возбуждений для образцов WB, содержащих 40% гематокрит и 0, 50, 100 и 400 мг/дл глюкозы. Скорость сканирования составляла 1 В/с. Вместо общепринятого длительного импульса считывания, приводящего к избыточному окислению измеряемого вещества, за каждым треугольным возбуждением следовала релаксация для обеспечения разрыва в профиле тока. Токи из каждого последовательного возбуждения наносили на диаграмму в виде отдельной «повторной» линии, таким образом, давая повторы от 1 до 7 включительно для каждой фигуры.On figa-8D shows the output dynamic currents, presented as a function of potential, based on the pulse sequence on figs using 7 triangular-wave excitations for samples WB containing 40% hematocrit and 0, 50, 100 and 400 mg / for glucose. The scan rate was 1 V / s. Instead of the generally accepted long read pulse leading to excessive oxidation of the measured substance, each triangular excitation was followed by relaxation to ensure a gap in the current profile. The currents from each sequential excitation were applied to the diagram in the form of a separate "repeated" line, thus giving repetitions from 1 to 7 inclusive for each figure.
Величины токов для каждого из множественных возбуждений (каждый повтор) вольтамперограмм на фиг.8A-8D превращали в одиночное значение данных и соединяли для получения контурных профилей фиг.9A-9C. Для фиг.9A и 9B превращение осуществляли отбором величины токов при одинаковом потенциале на области DLC каждого последовательного возбуждения, например, 300 мВ. На фиг.9A величины токов из фиг.8A-8D непосредственно наносили на диаграмму в виде функции от времени исходя из завершения импульсной последовательности. На фиг.9B использована полуинтегральная обработка данных величин токов перед нанесением. Для фиг.9C множественные возбуждения превращали в одиночные значения данных отбором пиковой величины токов для каждого повтора и с использованием обработки данных с взятием полупроизводной. Таким образом, оси X контурных профилей представляют собой время, имитируя данные, полученные для известной системы в стационарном состоянии, где изменение тока с течением времени является по существу постоянным. Хотя токи зарегистрированных вольтамперограмм можно обрабатывать множеством способов для извлечения полезной информации, в настоящее время является предпочтительной обработка данных с взятием полуинтеграла, полупроизводной и производной.The current values for each of the multiple excitations (each repetition) of the voltammograms in Figs. 8A-8D were converted into a single data value and connected to obtain the contour profiles of Figs. 9A-9C. For FIGS. 9A and 9B, the conversion was performed by sampling the currents at the same potential in the DLC region of each successive excitation, for example, 300 mV. In FIG. 9A, the current values from FIGS. 8A-8D are directly plotted as a function of time based on the completion of the pulse sequence. On figv used semi-integrated data processing of current values before application. For FIG. 9C, multiple excitations were converted into single data values by sampling the peak currents for each repetition and using semi-derivative data processing. Thus, the X-axis of the contour profiles represent time, simulating data obtained for a known system in a stationary state, where the change in current over time is essentially constant. Although the currents of recorded voltammograms can be processed in a variety of ways to extract useful information, it is now preferable to process data using a semi-integral, a semi-derivative, and a derivative.
Профили динамического тока, полученные, исходя из стробированных вольтамперометрических импульсных последовательностей, коренным образом отличаются от профилей тока, полученных, исходя из известного анализа с использованием одиночного импульса считывания. Хотя токи, зарегистрированные, исходя из одиночного импульса считывания, происходят из одиночной релаксации/диффузии, каждая временная точка на контурном профиле динамических токов происходит из возбуждения после независимого процесса релаксации/диффузии. Более того, с увеличением продолжительности возбуждения корреляция между током и концентрацией аналита может уменьшаться часто вследствие гематокритного эффекта. Таким образом, можно увеличить точность анализа с использованием множественных коротких возбуждений по сравнению с анализом с использованием более длительного импульса считывания, обладающего продолжительностью объединенных множественных возбуждений.Dynamic current profiles obtained from gated voltammetric pulse sequences are fundamentally different from current profiles obtained from known analysis using a single read pulse. Although currents recorded from a single read pulse come from single relaxation / diffusion, each time point on the contour profile of dynamic currents comes from excitation after an independent relaxation / diffusion process. Moreover, with increasing excitation duration, the correlation between current and analyte concentration can often decrease due to the hematocrit effect. Thus, it is possible to increase the accuracy of an analysis using multiple short excitations as compared to analysis using a longer read pulse having a duration of combined multiple excitations.
Применение этих обработок данных для анализа глюкозы описано ниже. Более подробное обсуждение обработок данных для преобразования электрохимических токов и связанных с ними программных реализаций можно найти в Bard, A.J., Faulkner, L.R., «Electrochemical Methods: Fundamentals and Applications», 1980; Oldham, K.B., «A Signal-Independent Electroanalytical Method», Anal. Chem. 1972, 44, 196; Goto, M., Oldham, K.B., «Semi-integral Electroanalysis: Shapes of Neopolarograms», Anal. Chem. 1973, 45, 2043; Dalrymple-Alford, P., Goto, M., Oldham, K.B., «Peak Shapes in Semi-differential Electroanalysis», Anal. Chem. 1977, 49, 1390; Oldham, K.B., «Convolution: A General Electrochemical Procedure Implemented by a Universal Algorithm», Anal. Chem. 1986, 58, 2296; Pedrosa, J.M., Martin, M.T., Ruiz, J.J., Camacho, L., «Application of the Cyclic Semi-Integral Voltammetry and Cyclic Semi-Differential Voltammetry to the Determination of the Reduction Mechanism of a Ni-Porphyrin» J. Electroanal. Chem. 2002, 523, 160; Klicka, R., «Adsorption in Semi-Differential Voltammetry», J. Electroanal. Chem. 1998, 455, 253.The use of these data processing for glucose analysis is described below. A more detailed discussion of data processing for converting electrochemical currents and related software implementations can be found in Bard, A.J., Faulkner, L.R., Electrochemical Methods: Fundamentals and Applications, 1980; Oldham, K.B., “A Signal-Independent Electroanalytical Method”, Anal. Chem. 1972, 44, 196; Goto, M., Oldham, K.B., Semi-integral Electroanalysis: Shapes of Neopolarograms, Anal. Chem. 1973, 45, 2043; Dalrymple-Alford, P., Goto, M., Oldham, K.B., Peak Shapes in Semi-differential Electroanalysis, Anal. Chem. 1977, 49, 1390; Oldham, K.B., "Convolution: A General Electrochemical Procedure Implemented by a Universal Algorithm", Anal. Chem. 1986, 58, 2296; Pedrosa, J.M., Martin, M.T., Ruiz, J.J., Camacho, L., "Application of the Cyclic Semi-Integral Voltammetry and Cyclic Semi-Differential Voltammetry to the Determination of the Reduction Mechanism of a Ni-Porphyrin" J. Electroanal. Chem. 2002, 523, 160; Klicka, R., Adsorption in Semi-Differential Voltammetry, J. Electroanal. Chem. 1998, 455, 253.
Полуинтегрированием вольтамперограммы можно отделить DLC от равновесного тока, измененного гематокритом (начальный пик), так как можно наблюдать отдельные сигналы для измененного гематокритом равновесного si-тока и гематокрита. Это в особенности верно при медленных скоростях сканирования. Полуинтеграл экспериментально полученного вольтамперометрического тока i(t) выражается уравнениемBy the half-integration of the voltammogram, one can separate the DLC from the equilibrium current changed by the hematocrit (initial peak), since it is possible to observe separate signals for the equilibrium si current and hematocrit changed by the hematocrit. This is especially true at slow scan speeds. The semi-integral of the experimentally obtained voltammetric current i (t) is expressed by the equation

где: i(t) представляет собой функцию от времени вольтамперометрического тока, полученного в ходе сканирования;where: i (t) is a function of the time of the voltammetric current obtained during the scan;
I(t) представляет собой преобразование и полуинтеграл i(t);I (t) represents the transformation and the semi-integral i (t);
u представляет собой параметр преобразования; иu is a conversion parameter; and
d-1/2/dt-1/2 представляет собой оператор полуинтегрирования.d-1/2 / dt-1/2 is the semi-integration operator.
При достаточно высоком окислительном потенциале стационарный полуинтегральный ток представлен в виде:With a sufficiently high oxidation potential, the stationary semi-integral current is presented in the form:

где: Ilim представляет собой DLC при условии того, что поверхностная концентрация окисляемого вещества равна нулю. Обратите внимание на то, что единицей измерения полуинтегрального тока является Кл/с1/2, что не является традиционной единицей измерения для выражения электрического тока, которая представляет собой Кл/с.where: Ilim represents a DLC, provided that the surface concentration of the oxidizable substance is zero. Please note that the unit of measurement for the half-integral current is C / s1/2 , which is not a traditional unit of measurement for expressing the electric current, which is C / s.
Для простоты Ilim обозначен как DLC при полуинтегрировании (SI) с единицей измерения Кл/с1/2. Этот SI-ток (Кл/с1/2) представляет собой только полуинтегрирование тока (Кл/с). Полуинтегрирование коренным образом отличается от кулонометрии, где используют полный интеграл кривой i-t для получения полного заряда, проходящего через электроды.For simplicity, Ilim is denoted as DLC for half integration (SI) with a unit of measure C / s1/2 . This SI current (C / s1/2 ) represents only the half-integration of the current (C / s). Semi-integration is fundamentally different from coulometry, where the full integral of the it curve is used to obtain the total charge passing through the electrodes.
Хотя уравнение (3) дает теоретическое определение полуинтеграла, для цифровой обработки данных i-t можно разделить на N равномерно расположенных временных интервалов между t=0 и t=NΔt. Один из таких алгоритмов цифровой обработки выражается уравнением (5), где t=kΔt и u=jΔt, и i определяют в середине каждого интервала.Although equation (3) gives a theoretical definition of the half-integral, for digital data processing i-t can be divided into N equally spaced time intervals between t = 0 and t = NΔt. One of these digital processing algorithms is expressed by equation (5), where t = kΔt and u = jΔt, and i are determined in the middle of each interval.

Предпочтительный алгоритм для цифровой обработки представлен в виде:The preferred digital processing algorithm is presented as:

где: Г(x) представляет собой гамма-функцию от x, где Г(1/2)=π1/2, Г(3/2)=1/2π1/2 и Г(5/2)=3/2*1/2π1/2 и т.д.where: Г (x) is a gamma function of x, where Г (1/2) = π1/2 , Г (3/2) = 1 / 2π1/2 and Г (5/2) = 3 / 2 * 1 / 2π1/2 , etc.
Из уравнения (4) можно видеть, что у SI-тока отсутствует фактор зависимости от времени известных амперометрических способов. Таким образом, характеристику SI-тока можно рассматривать в виде серий токов плато, вместо непрерывно изменяющихся амперометрических токов, полученных с помощью общепринятой амперометрии. Вследствие того что полуинтегрирование позволяет количественно определять DLC, можно использовать более высокую скорость сканирования, чем ту, когда количественно определяют пиковые значения токов. Таким образом, линейная, циклическая или нециклическая вольтамперометрия в сочетании с полуинтегрированием может быстро получить DLC в зависимости от концентраций глюкозы. Таким образом, можно уменьшить недостатки времен длительного ожидания кулонометрии и нестационарной природы тока в общепринятой амперометрии.From equation (4) it can be seen that the SI current does not have a time-dependent factor for the known amperometric methods. Thus, the SI current characteristic can be considered as a series of plateau currents, instead of continuously changing amperometric currents obtained using conventional amperometry. Due to the fact that semi-integration allows you to quantify DLC, you can use a higher scanning speed than that when quantitatively determine the peak values of currents. Thus, linear, cyclic or non-cyclic voltammetry in combination with semi-integration can quickly obtain DLC depending on glucose concentrations. Thus, it is possible to reduce the shortcomings of the long standby times of coulometry and the unsteady nature of the current in conventional amperometry.
Из уравнения (4) также следует, что обратимые или квазиобратимые окислительно-восстановительные пары предпочтительны для использования с полуинтегрированием. Это происходит потому, что полуинтеграл от обратимой или квазиобратимой окислительно-восстановительной пары может показывать резкий переход от восстановленного состояния в окисленное состояние (и наоборот) и широкую область DLC, таким образом, позволяя более легко определить переход. Феррицианид/ферроцианид и состояния +3 и +2 рутения-гексамина являются примерами окислительно-восстановительных пар, обладающих предпочтительными обратимыми (медленное сканирование) или квазиобратимыми (быстрое сканирование) типами поведения.It also follows from equation (4) that reversible or quasi-reversible redox pairs are preferred for use with semi-integration. This is because the half-integral of a reversible or quasi-reversible redox pair can show a sharp transition from the reduced state to the oxidized state (and vice versa) and a wide DLC region, thus making it easier to determine the transition. Ferricyanide / ferrocyanide and the states +3 and +2 of ruthenium-hexamine are examples of redox pairs having preferred reversible (slow scan) or quasi-reversible (fast scan) behaviors.
Плохо активированные электроды не могут обеспечить приемлемое состояние DLC даже с обратимыми или квазиобратимыми окислительно-восстановительными парами. Известные способы активации электродов, такие как способы, описанные в патенте US №5429735, можно использовать для достижения предпочтительной активности электродов.Poorly activated electrodes cannot provide an acceptable DLC state even with reversible or quasi-reversible redox pairs. Known methods for activating electrodes, such as the methods described in US patent No. 5429735, can be used to achieve the preferred activity of the electrodes.
В дополнение к полуинтегралам также можно использовать полупроизводные вольтамперограммы для количественного определения аналита измерением пика полупроизводной. Полупроизводная экспериментально полученного вольтамперометрического тока i(t) обладает следующими математическими формами:In addition to the half-integrals, the semi-derivatives of voltammograms can also be used to quantify the analyte by measuring the peak of the semi-derivative. The semi-derivative of the experimentally obtained voltammetric current i (t) has the following mathematical forms:

где: I(t) представляет собой полуинтеграл функции от времени i(t). Уравнения, используемые для обработки данных с взятием полуинтеграла, полупроизводной и производной, описанные ниже, реализованы с помощью набора программного обеспечения для электрохимической рабочей станции, версии 4,07, модифицированной 26 апреля 2004 года, который прилагается к электрохимической рабочей станции CH Instruments, модель CHI 660A.where: I (t) is the half-integral of the function of time i (t). The equations used to process the data using the semi-integral, semi-derivative and derivative described below are implemented using the software kit for the electrochemical workstation, version 4.07, modified on April 26, 2004, which is attached to the CH Instruments electrochemical workstation, model CHI 660A.
На фиг.10A представлена полуинтегральная циклическая вольтамперограмма из фиг.7A. Аналогично, на фиг.10B представлена полуинтегральная нециклическая вольтамперограмма из фиг.7C, где обратное возбуждение заканчивалось перед инициацией пика обратного тока. На фиг.10C установлено, что если полуинтеграл циклического и нециклического возбуждений фиг.7B представлен в виде диаграммы, то область DLC обратного сканирования легко установлена, обеспечивая точную регистрацию тока до 50 мВ от точки возврата. Более того, часть пика полуинтегральной диаграммы соответствует значению гематокрита в образце, и размеры пика можно количественно соотнести с уровнем гематокрита.On figa presents a semi-integrated cyclic voltammogram from figa. Similarly, FIG. 10B shows a semi-integrated non-cyclic voltammogram of FIG. 7C, where the reverse excitation ended before the peak of the reverse current was initiated. On figs found that if the half-integral of cyclic and non-cyclic excitations figv presented in the form of a diagram, the DLC area of the reverse scan is easily installed, providing accurate registration of current up to 50 mV from the return point. Moreover, part of the peak of the semi-integral diagram corresponds to the hematocrit value in the sample, and the peak sizes can be quantitatively correlated with the hematocrit level.
На фиг.10D показаны полуинтегралы для циклического и 200-300 мВ нециклического возбуждений фиг.7D. Форма si-вольтамперограммы для короткого нециклического возбуждения отличается от вольтамперограммы циклического возбуждения вследствие того, что область окислительно-восстановительного перехода отсутствует в нециклическом возбуждении. Посредством начала нециклического возбуждения в области DLC фоновый si-ток уменьшается с более высокой скоростью по сравнению со скоростью, наблюдаемой для циклической вольтамперограммы, улучшая отношение сигнала к фону для нециклического возбуждения. Более того, обратный si-ток для нециклического возбуждения обладает плато, более точно отображающим концентрацию аналита в образце, чем прямой si-ток. Таким образом, нециклическое сканирование области DLC обеспечило повышение точности анализа по сравнению с циклическим возбуждением.On fig.10D shows the half-integrals for cyclic and 200-300 mV non-cyclic excitations fig.7D. The shape of the si-voltammogram for short non-cyclic excitation differs from the voltammogram of cyclic excitation due to the fact that the region of the redox transition is absent in non-cyclic excitation. By initiating non-cyclic excitation in the DLC region, the background si current decreases at a higher rate than the rate observed for the cyclic voltammogram, improving the signal-to-background ratio for non-cyclic excitation. Moreover, the reverse si current for non-cyclic excitation has a plateau that more accurately displays the analyte concentration in the sample than the direct si current. Thus, non-cyclic scanning of the DLC region provided an increase in the accuracy of the analysis compared to cyclic excitation.
На фиг.11 показаны контурные профили, полученные путем полуинтегрирования вольтамперограмм для семи импульсных последовательностей возбуждения для образцов WB, содержащих 0, 56, 111, 221,75, 455,25 и 712,5 мг/дл глюкозы плазмы. Для каждой концентрации глюкозы достигалось равновесие по отношению к регидратации DBL при наивысшей величине тока на контурном профиле для каждой концентрации глюкозы. Таким образом, показания 1110 (самое высокое) и 1120 (более низкое) устанавливают, что для концентрации глюкозы 455 мг/дл равновесие достигнуто относительно регидратации DBL приблизительно за четыре секунды.11 shows contour profiles obtained by half-integration of voltammograms for seven pulse excitation sequences for WB samples containing 0, 56, 111, 221.75, 455.25 and 712.5 mg / dl of plasma glucose. For each glucose concentration, equilibrium was achieved with respect to DBL rehydration at the highest current on the contour profile for each glucose concentration. Thus, readings 1110 (highest) and 1120 (lower) establish that for a glucose concentration of 455 mg / dl, equilibrium was reached with respect to DBL rehydration in approximately four seconds.
Величины токов, зарегистрированные при относительно постоянной скорости диффузии, могут минимизировать неточности, которые в противном случае могут быть внесены из-за вариаций в скоростях регидратации и диффузии реагентов. Таким образом, после достижения относительно постоянной скорости диффузии зарегистрированные величины токов могут более точно соответствовать концентрации измеряемого вещества и, таким образом, аналита. Более того, для фиг.11 можно осуществить полный анализ всего за семь секунд вследствие того, что если известна наибольшая величина тока 1110 контурного профиля, то его величина может непосредственно коррелировать с концентрацией аналита. Дополнительные значения данных можно получить для уменьшения фоновой ошибки, обусловленной медиатором, как обсуждалось ранее относительно RI.The current values recorded at a relatively constant diffusion rate can minimize inaccuracies that might otherwise be made due to variations in the rehydration and diffusion rates of the reagents. Thus, after reaching a relatively constant diffusion rate, the recorded current values can more accurately correspond to the concentration of the measured substance and, thus, the analyte. Moreover, for FIG. 11, a complete analysis can be performed in just seven seconds due to the fact that if the largest current value of the loop profile current 1110 is known, then its value can directly correlate with the analyte concentration. Additional data values can be obtained to reduce the background error due to the mediator, as previously discussed with respect to RI.
Другой формой обработки данных, которую можно использовать для получения контурного профиля, является взятие полупроизводной. Одна операция получения полупроизводной состоит во взятии полной производной полуинтеграла, как ранее описано в отношении уравнения (8). В отличие от области плато, представляющей вольтамперометрическое сканирование на полуинтегральных диаграммах, полупроизводные диаграммы преобразуют данные вольтамперометрического сканирования в пик, сосредоточенный в области перехода окислительно-восстановительной пары.Another form of data processing that can be used to obtain a contour profile is to take a semi-derivative. One operation for obtaining a semi-derivative is to take the full derivative of the half-integral, as previously described with respect to equation (8). In contrast to the plateau region representing voltammetric scanning on semi-integrated diagrams, semi-derivative diagrams convert voltammetric scanning data to a peak concentrated in the transition region of the redox pair.
На фиг.12A представлены циклическая вольтамперограмма (a), полуинтеграл (b) и полупроизводная (c) для 16 мМ ферроцианида в образце WB с 20% гематокритом. В этом случае на рабочем электроде сенсорной панели отсутствуют фермент и окисленный медиатор. Фиг.12B представляет собой увеличенное изображение полупроизводной кривой фиг.12A, на которой показана высота пика для прямого сканирования. Величина высоты пика прямого или обратного сканирования может коррелировать с концентрацией аналита в образце. Более того, обработка данных с взятием полупроизводной может по своей природе обеспечивать поправку на гематокрит для определения глюкозы, в особенности для образцов, содержащих менее 40% гематокрита. Более подробное описание применения обработки данных с взятием полупроизводной для анализа глюкозы можно найти в публикации WO 2005/114164 от 16 мая 2005 года.12A shows a cyclic voltammogram (a), half-integral (b) and half-derivative (c) for 16 mM ferrocyanide in a WB sample with 20% hematocrit. In this case, the enzyme and the oxidized mediator are absent on the working electrode of the touch panel. 12B is an enlarged image of the semi-derivative curve of FIG. 12A showing the peak height for direct scanning. The peak height of the forward or reverse scan can correlate with the concentration of analyte in the sample. Moreover, semi-derivative data processing may by its nature provide hematocrit correction for glucose determination, especially for samples containing less than 40% hematocrit. A more detailed description of the application of semi-derivative data processing for glucose analysis can be found in WO 2005/114164 of May 16, 2005.
Кроме обработки данных с взятием полуинтеграла и полупроизводной, также можно использовать обработку данных с взятием производной для получения контурного профиля и, таким образом, определения концентрации аналита в образце. На фиг.13A-13C представлены производные циклических вольтамперограмм для образцов, обладающих 20, 40 и 60% гематокритом. На этих производных диаграммах показано начальное увеличение тока с возрастанием напряжения, с последующим снижением и, наконец, область DLC. Гематокритный эффект, представленный в виде более отрицательных величин пиков, можно видеть на отрицательном пике, расположенном при около 0,1 В на фиг.12A-12C с более высокой концентрациями RB-клеток.In addition to processing data with taking the half-integral and semi-derivative, you can also use data processing with taking the derivative to obtain a contour profile and, thus, determine the concentration of analyte in the sample. On figa-13C presents derivatives of cyclic voltammograms for samples with 20, 40 and 60% hematocrit. These derivative diagrams show the initial increase in current with increasing voltage, followed by a decrease, and finally, the DLC region. The hematocrit effect, represented as more negative peak values, can be seen at the negative peak located at about 0.1 V in FIGS. 12A-12C with higher RB cell concentrations.
Хотя величины положительных и отрицательных пиков производной, таких как пики, изображенные на производной диаграмме фиг.13B, зависят от концентрации, отношение отрицательного пика к положительному пику исключает зависимость от концентрации, таким образом, являясь зависимым от гематокрита. Вследствие того что это отношение (HI-DER) не зависит от концентрации и зависит от гематокрита, отношение указывает на процентную долю гематокрита в образце. Таким образом, это отношение пиков производной можно использовать для определения уравнения поправки на гематокрит для определения аналита. Более подробное описание применения обработки данных с взятием производной для анализа глюкозы можно найти в публикации WO 2005/114164.Although the values of the positive and negative peaks of the derivative, such as the peaks shown in the derivative diagram of FIG. 13B, depend on the concentration, the ratio of the negative peak to the positive peak excludes the dependence on concentration, thus being hematocrit dependent. Because this ratio (HI-DER) is concentration independent and hematocrit dependent, the ratio indicates the percentage of hematocrit in the sample. Thus, this ratio of the peaks of the derivative can be used to determine the hematocrit correction equation for determining the analyte. A more detailed description of the application of derivative data processing for glucose analysis can be found in WO 2005/114164.
Кроме способности стробированных импульсных последовательностей уменьшать неточность вследствие гематокритного эффекта и вследствие фонового сигнала медиатора, сочетание профиля динамического тока каждого возбуждения и результирующих контурных профилей можно использовать для получения нескольких множеств калибровочных постоянных для сенсорной системы, таким образом, повышая точность анализа. Каждое полученное множество калибровочных постоянных можно использовать для соотнесения конкретного показания тока с конкретной концентрацией измеряемого вещества в образце. Таким образом, в одном из аспектов увеличение точности можно получить усреднением величин для глюкозы, полученных с использованием нескольких множеств калибровочных постоянных.In addition to the ability of gated pulse sequences to reduce inaccuracy due to the hematocrit effect and due to the mediator background signal, the combination of the dynamic current profile of each excitation and the resulting contour profiles can be used to obtain several sets of calibration constants for the sensor system, thereby increasing the accuracy of the analysis. Each set of calibration constants obtained can be used to correlate a specific current reading with a specific concentration of the measured substance in the sample. Thus, in one aspect, an increase in accuracy can be obtained by averaging the values for glucose obtained using several sets of calibration constants.
В общепринятых электрохимических сенсорных системах, как правило, используют одно множество калибровочных постоянных, такое как наклон и отсекаемый отрезок, для преобразования показаний тока в соответствующую концентрацию аналита в образце. Однако одиночное множество калибровочных постоянных может приводить к неточностям в концентрации аналита, определяемой по зарегистрированным величинам токов вследствие того, что в измерении участвует фоновый шум.Conventional electrochemical sensor systems typically use one set of calibration constants, such as a slope and a cut-off line, to convert the current readings to the corresponding analyte concentration in the sample. However, a single set of calibration constants can lead to inaccuracies in the analyte concentration, determined from the recorded current values due to the fact that background noise is involved in the measurement.
Посредством получения величины токов или преобразованной величины токов после обработки данных в фиксированное время в пределах каждого рабочего цикла стробированной вольтамперометрической импульсной последовательности можно получить несколько множеств калибровочных постоянных. На фиг.14 представлены диаграммы полуинтегральных токов, зарегистрированных на 7,4, 10,65, 13,9 и 17,15 секунды для контурных профилей фиг.11. Каждая из этих четырех калибровочных линий независима от другой, и ее можно использовать, по меньшей мере, двумя способами.By obtaining the magnitude of the currents or the converted magnitude of the currents after processing the data at a fixed time within each duty cycle of the gated voltammetric pulse sequence, several sets of calibration constants can be obtained. On Fig presents diagrams of semi-integrated currents recorded for 7.4, 10.65, 13.9 and 17.15 seconds for the contour profiles of Fig.11. Each of these four calibration lines is independent of the other, and it can be used in at least two ways.
Во-первых, можно использовать несколько множеств калибровочных постоянных для определения количества рабочих циклов, которые следует прикладывать в ходе импульсной последовательности для получения требуемой точности и воспроизводимости. Например, если величины токов, полученные исходя из первых трех возбуждений, указывают на высокую концентрацию глюкозы, такую как >150 или 200 мг/дл, сенсорная система может рано закончить анализ, например после 4-го возбуждения, изображенного на фиг.11. Таким образом, можно существенно сократить время, требуемое для анализа. Такое сокращение возможно вследствие того, что невоспроизводимость при высоких концентрациях глюкозы, как правило, меньше, чем при более низких концентрациях глюкозы. Наоборот, если величины токов, полученные исходя из первых трех возбуждений, указывают на низкую концентрацию глюкозы, такую как ≤150 или 100 мг/дл, сенсорная система может продлить анализ до более 5 или 7 возбуждений. Таким образом, точность и/или воспроизводимость анализа можно повышать включением 5 или более рабочих циклов.First, you can use several sets of calibration constants to determine the number of duty cycles that should be applied during the pulse sequence to obtain the required accuracy and reproducibility. For example, if the current values obtained from the first three excitations indicate a high glucose concentration, such as> 150 or 200 mg / dl, the sensory system may finish the analysis early, for example, after the 4th excitation shown in Fig. 11. Thus, the time required for analysis can be significantly reduced. Such a reduction is possible due to the fact that irreproducibility at high glucose concentrations is generally less than at lower glucose concentrations. Conversely, if the current values obtained from the first three excitations indicate a low glucose concentration, such as ≤150 or 100 mg / dl, the sensor system can extend the analysis to more than 5 or 7 excitations. Thus, the accuracy and / or reproducibility of the analysis can be improved by the inclusion of 5 or more duty cycles.
Во-вторых, несколько множеств калибровочных постоянных можно использовать для повышения точности и/или воспроизводимости анализа путем усреднения. Например, если время измерения исследуемой глюкозы составляет 17,15 секунды, можно использовать токи на 10,65, 13,9 и 17,15 секунды для вычисления концентраций глюкозы с использованием наклонов и отсекаемых отрезков от соответствующих калибровочных линий; таким образом, G10,65=(i10,65-Int10,65)/Slope10,65, G13,9=(i13,9-Int13,9)/Slope13,9 и G17,15=(i17,15-Int17,15)/Slope17,15. Теоретически, эти три значения глюкозы должны быть эквивалентными, отличаясь только благодаря случайным изменениям. Таким образом, значения глюкозы G10,65, G13,9 и G17,15 можно усреднить и можно вычислить окончательное значение глюкозы (G10,65+G13,9+G17,15)/3. Усреднение значений исходя из калибровочных линий может обеспечить уменьшение шума при скорости 1/√3).Secondly, several sets of calibration constants can be used to increase the accuracy and / or reproducibility of the analysis by averaging. For example, if the measurement time of the test glucose is 17.15 seconds, currents of 10.65, 13.9 and 17.15 seconds can be used to calculate glucose concentrations using slopes and cutoffs from the corresponding calibration lines; thus, G10.65 = (i10.65 -Int10.65 ) / Slope10.65 , G13.9 = (i13.9 -Int13.9 ) / Slope13.9 and G17, 15 = (i17.15 -Int17.15 ) / Slope17.15 . Theoretically, these three glucose values should be equivalent, differing only due to random changes. Thus, glucose values G10.65 , G13.9 and G17.15 can be averaged and the final glucose value (G10.65 + G13.9 + G17.15 ) / 3 can be calculated. Averaging values based on calibration lines can provide noise reduction at a speed of 1 / √3).
Неожиданным преимуществом стробированных вольтамперометрических импульсных последовательностей, включающих относительно короткие возбуждения и относительно длительные релаксации, изображенные на фиг.6C, является способность упрощать калибровку. В то время как несколько множеств калибровочных постоянных, которые можно получить исходя из динамических и контурных профилей, могут обеспечить преимущество в точности анализа, импульсная последовательность, изображенная на фиг.6C, исходя из одиночного множества калибровочных постоянных, может обеспечить точность, аналогичную той, которую получают с использованием нескольких множеств калибровочных постоянных. Этот эффект можно наблюдать на контурных профилях фиг.11 и результирующих калибровочных линиях на фиг.14.An unexpected advantage of gated voltammetric pulse sequences including the relatively short excitations and relatively long relaxations depicted in FIG. 6C is the ability to simplify calibration. While several sets of calibration constants, which can be obtained from dynamic and contour profiles, can provide an advantage in the accuracy of analysis, the pulse sequence shown in Fig. 6C, based on a single set of calibration constants, can provide an accuracy similar to that obtained using several sets of calibration constants. This effect can be observed on the contour profiles of FIG. 11 and the resulting calibration lines in FIG.
Это неожиданное повышение точности можно отнести за счет относительно длительных времен релаксации по сравнению с короткими релаксациями. В одном из аспектов предпочтительны отношения времени возбуждения/релаксации (ERT) от 0,3 до 0,2, с более предпочтительными отношениями ERT от 0,27 до 0,22. Например, стробированную вольтамперометрическую импульсную последовательность, обладающую отношением ERT 0,25 (0,8 секунды/3,2 секунды), изображенную на фиг.6C, можно предпочесть импульсу, обладающему отношением ERT больше 0,3, такому как импульсная последовательность на фиг.6B, обладающая отношением ERT 0,56 (1,4 секунды/2,5 секунды). Не вдаваясь в конкретные теоретические подробности, относительно длительные времена релаксаций могут обеспечить состояние, при котором средняя скорость потребления измеряемого вещества в ходе возбуждения компенсирована скоростью поступления измеряемого вещества, диффундирующего в DBL. Таким образом, несколько множеств калибровочных постоянных могут перейти в одиночное множество, и преобразование зарегистрированных данных в концентрацию аналита можно упростить осуществлением процесса усреднения зарегистрированных данных тока перед определением концентрации аналита.This unexpected increase in accuracy can be attributed to the relatively long relaxation times compared to short relaxations. In one aspect, excitation / relaxation time (ERT) ratios of 0.3 to 0.2 are preferred, with more preferred ERT ratios of 0.27 to 0.22. For example, the gated voltammetric pulse sequence having an ERT ratio of 0.25 (0.8 seconds / 3.2 seconds) shown in FIG. 6C may be preferred to a pulse having an ERT ratio greater than 0.3, such as the pulse sequence in FIG. 6B having an ERT ratio of 0.56 (1.4 seconds / 2.5 seconds). Without going into specific theoretical details, relatively long relaxation times can provide a state in which the average rate of consumption of the measured substance during excitation is compensated by the rate of arrival of the measured substance diffusing into DBL. Thus, several sets of calibration constants can become a single set, and the conversion of recorded data to analyte concentration can be simplified by the process of averaging the recorded current data before determining the analyte concentration.
Динамические профили тока, получаемые с помощью множественных рабочих циклов, можно использовать для определения того, является ли сенсорная панель не полностью заполненной образцом, чтобы позволить пользователю внести дополнительное количество образца на сенсорную панель. Кроме рабочего электрода и противоэлектрода, общепринятые сенсорные системы могут определять состояние неполного заполнения с помощью использования третьего электрода или электродной пары; однако третий электрод или электродная пара приводят к усложнению и увеличению стоимости сенсорной системы.Dynamic current profiles obtained using multiple duty cycles can be used to determine if the touchpad is not fully populated with a sample to allow the user to add an additional amount of sample to the touch panel. In addition to the working electrode and counter electrode, conventional sensor systems can determine the state of incomplete filling using a third electrode or electrode pair; however, the third electrode or electrode pair leads to a complication and increase in the cost of the sensor system.
Известные двухэлектродные системы способны определять, что анализ «плохой», но не могут определять, вызвана ли причина неудачного анализа неполным заполнением или дефектной сенсорной панелью. Способность определять, вызван ли неправильный анализ неполным заполнением, является полезной, так как его можно исправить внесением дополнительного количества образца на ту же самую сенсорную панель и повторением анализа, предотвращая хорошую панель от забраковывания.Known two-electrode systems are able to determine that the analysis is “bad,” but they cannot determine whether the cause of the failed analysis is due to incomplete filling or a defective touch panel. The ability to determine whether an incorrect analysis is caused by incomplete filling is useful, as it can be corrected by adding an additional amount of the sample to the same touch panel and repeating the analysis, preventing a good panel from rejecting.
На фиг.15 представлены циклические вольтамперограммы, полученные при неполном заполнении сенсорной панели, в то время как на фиг.8A представлены серии семи циклических вольтамперограмм, полученных с помощью стробированной вольтамперометрической импульсной последовательности от нормально заполненной сенсорной панели. В обоих случаях скорость сканирования составляла 1 В/с. Даже если образец на фиг.8A совсем не содержал глюкозы и образец, использованный на фиг.15, содержал 400 мг/дл глюкозы, величины токов, полученные от неполностью заполненной панели, обладающей концентрацией глюкозы 400 мг/дл, оказались значительно ниже величин от нормально заполненной панели, не содержащей глюкозы. Таким образом, можно определить с помощью второго рабочего цикла импульсной последовательности, что полученные токи ниже, чем ранее выбранная величина, и что сенсорная панель не полностью заполнена. Например, для системы на фиг.15 начальные величины токов меньше 0 означают, что сенсорная панель не полностью заполнена.On Fig presents cyclic voltammograms obtained with incomplete filling of the touch panel, while on figa presents a series of seven cyclic voltammograms obtained using a gated voltammetric pulse sequence from a normally filled touch panel. In both cases, the scan rate was 1 V / s. Even if the sample in FIG. 8A did not contain glucose at all and the sample used in FIG. 15 contained 400 mg / dl of glucose, the current values obtained from an incompletely filled panel having a glucose concentration of 400 mg / dl were significantly lower than normal filled glucose-free panel. Thus, it can be determined using the second duty cycle of the pulse sequence that the received currents are lower than the previously selected value, and that the touch panel is not completely filled. For example, for the system of FIG. 15, initial currents of less than 0 mean that the touch panel is not completely full.
Таким образом, стробированные вольтамперометрические импульсные последовательности по настоящему изобретению позволяют детектировать неполное заполнение в двухэлектродной сенсорной панели; что, как правило, требует третьего электрода в известных сенсорных системах. Более того, определение неполного заполнения можно осуществлять менее чем за 5 секунд, предоставляя время измерительному устройству сигнализировать пользователю, например, направлением сигнала к светоизлучающему устройству или дисплею, чтобы добавить дополнительное количество образца на панель.Thus, the gated voltammetric pulse sequences of the present invention allow to detect incomplete filling in the two-electrode touch panel; which typically requires a third electrode in known sensor systems. Moreover, the determination of incomplete filling can be carried out in less than 5 seconds, allowing time for the measuring device to signal to the user, for example, by sending a signal to a light-emitting device or display to add an additional amount of sample to the panel.
Общая проблема для точности способов анализа с использованием панели состоит в том, что реагенты, в особенности фермент, деградируют с течением времени. Один из этих эффектов деградации фермента состоит в изменении калибровочных величин и, таким образом, воспроизводимости и/или точности анализа.A common problem for the accuracy of panel analysis methods is that reagents, especially an enzyme, degrade over time. One of these effects of enzyme degradation consists in changing calibration values and, thus, reproducibility and / or accuracy of the analysis.
Динамические профили тока, получаемые путем множественных рабочих циклов по настоящему изобретению, можно использовать для определения содержания активного ионизирующего вещества старых сенсорных панелей, где ионизирующее вещество может деградировать. Знание количества ионизирующего вещества, доступного для реакции с аналитом, может позволить идентифицировать дефектные сенсорные панели и скорректировать величину концентрации аналита для обеспечения требуемой точности и воспроизводимости анализа. Таким образом, можно обеспечить точность и/или воспроизводимость анализа, полученного для сенсорных панелей, обладающих варьирующими количествами активного ионизирующего вещества вследствие вариаций изготовления или деградации реагента.The dynamic current profiles obtained by multiple duty cycles of the present invention can be used to determine the active ionizing agent content of old touch panels where the ionizing agent may degrade. Knowing the amount of ionizing substance available for reaction with the analyte can identify defective touch panels and adjust the analyte concentration to ensure the required accuracy and reproducibility of the analysis. Thus, it is possible to ensure the accuracy and / or reproducibility of the analysis obtained for touch panels with varying amounts of active ionizing substance due to variations in the manufacture or degradation of the reagent.
На фиг.16A представлены полуинтегральные циклические вольтамперограммы, полученные от пяти сенсорных панелей со скоростями сканирования 1 В/с, для образца, содержащего 100 мг/дл глюкозы и 40% гематокрита в WB. Хотя на фиг.16A представлены нециклические вольтамперограммы, способ можно также применять для циклических сканирований. Ионизирующим веществом, используемым в слое реагента для сенсорных панелей, являлся фермент глюкозооксидаза (GO). Каждая сенсорная панель содержала, в процентных долях от сухой массы, 1,7, 3,5, 5,3, 7 или 10 процентов (масса/масса) GO по отношению к суммарной сухой массе вещества, образующего слой реагента. Как показано, величины токов для прямых сканирований возрастают по отношению к величинам для обратных сканирований с возрастанием процентной доли ионизирующего вещества. Таким образом, различие между величинами токов для прямого и обратного сканирования можно использовать для определения процентной доли активного ионизирующего вещества, присутствующего в слое реагента сенсорной панели.On figa presents semi-integrated cyclic voltammograms obtained from five touch panels with scanning speeds of 1 V / s, for a sample containing 100 mg / dl glucose and 40% hematocrit in WB. Although non-cyclic voltammograms are shown in FIG. 16A, the method can also be used for cyclic scans. The ionizing substance used in the reagent layer for touch panels was the enzyme glucose oxidase (GO). Each touch panel contained, in percentages of dry weight, 1.7, 3.5, 5.3, 7, or 10 percent (mass / mass) GO relative to the total dry mass of the substance forming the reactant layer. As shown, the current values for direct scans increase with respect to the values for reverse scans with an increase in the percentage of ionizing substance. Thus, the difference between the values of the currents for forward and reverse scanning can be used to determine the percentage of active ionizing substance present in the reagent layer of the touch panel.
На фиг.16B представлена диаграмма отношения величин si-тока для прямого и обратного сканирования, зарегистрированных при потенциале 0,15 в виде функции процентной доли GO. После того как определена корреляция между отношениями прямого и обратного тока и процентной долей активной GO, количество активной GO, присутствующей в слое реагента, можно определить исходя из величин токов, измеренных для панели. Отношение прямого и обратного сканирований можно определить до или в течение части анализа аналита импульсной последовательности, таким образом, предоставляя пользователю уведомление о том, является ли панель дефектной.On figv presents a diagram of the ratio of the values of si-current for forward and reverse scanning, recorded at a potential of 0.15 as a function of the percentage of GO. After the correlation between the ratios of the forward and reverse current and the percentage of active GO is determined, the amount of active GO present in the reagent layer can be determined based on the values of the currents measured for the panel. The ratio of forward and reverse scans can be determined before or during part of the analyte analysis of the pulse sequence, thus providing the user with a notification about whether the panel is defective.
Действительное содержание активного ионизирующего вещества на панели можно затем использовать для изменения наклона калибровки на основе взаимоотношения, как показано на фиг.16C. На фиг.16C представлена типичная зависимость наклона калибровки в виде линейной зависимости для сенсорной панели как функции от содержания GO (% от сухой массы). На диаграмме показано, что с возрастанием содержания GO понижается наклон калибровки. Таким образом, если действительное содержание GO в слое реагента вычислить исходя из фиг.16B, то измененный наклон для сенсорной панели на основе GO можно вычислить исходя из многочлена 2-й степени на фиг.16C с использованием содержания GO в качестве входных данных. Полученный на выходе наклон затем можно использовать для исправления величины концентрации глюкозы в зависимости от отличающихся количеств активного ионизирующего вещества, присутствующего в слое реагента сенсорной панели. Таким образом, можно уменьшить неточность и/или невоспроизводимость, которая в противном случае может возникнуть вследствие деградации фермента.The actual content of active ionizing agent in the panel can then be used to change the calibration slope based on the relationship, as shown in FIG. 16C. On figs presents a typical dependence of the calibration slope in the form of a linear dependence for the touch panel as a function of GO content (% of dry weight). The diagram shows that with increasing GO content, the calibration slope decreases. Thus, if the actual GO content in the reagent layer is calculated based on FIG. 16B, then the altered slope for the GO-based touch panel can be calculated based on the 2nd degree polynomial in FIG. 16C using the GO content as input. The slope obtained at the outlet can then be used to correct the value of the glucose concentration depending on the differing amounts of active ionizing substance present in the reagent layer of the touch panel. Thus, it is possible to reduce inaccuracy and / or irreproducibility, which otherwise could result from degradation of the enzyme.
На фиг.17 представлено измерительное устройство 1700, содержащее контакты 1720, электрически связанные с электрической схемой 1710 и дисплеем 1730. В одном из аспектов измерительное устройство 1700 является переносным и адаптировано для портативного использования и подключения сенсорной панели 100 (фиг.1A). В другом аспекте измерительное устройство 1700 является переносным измерительным устройством, адаптированным для подключения сенсорной панели и генерации стробированных вольтамперометрических импульсных последовательностей.On Fig presents a
Контакты 1720 адаптированы для обеспечения электрической связи с электрической схемой 1710 и контактами сенсорной панели, такими как контакты 170 и 180 сенсорной панели 100 на фиг.1B. Электрическая схема 1710 может включать электрическое зарядное устройство 1750, процессор 1740 и считываемый компьютером носитель информации 1745. Электрическое зарядное устройство 1750 может представлять собой потенциостат, генератор сигналов и т.п. Таким образом, зарядное устройство 1750 может прикладывать напряжение на контакты 1720, в то же время при регистрации результирующего тока функционируя в качестве зарядного регистрирующего устройства.The
Процессор 1740 можно электрически связать с зарядным устройством 1750, считываемым компьютером носителем информации 1745 и дисплеем 1730. Если зарядное устройство не адаптировано для регистрации тока, то процессор 1740 можно адаптировать для регистрации тока на контактах 1720.The
Считываемый компьютером носитель информации 1745 может являться любым носителем информации, таким как магнитное, оптическое, полупроводниковое запоминающее устройство и т.п. Считываемый компьютером носитель информации 1745 может являться стационарным запоминающим устройством или съемным запоминающим устройством, таким как съемная карта памяти. Дисплей 1730 может являться аналоговым или цифровым, в одном из аспектов LCD-дисплей адаптирован для показа числовых данных.A computer-
Если контакты сенсорной панели, содержащей образец, электрически связаны с контактами 1720, то процессор 1740 может заставить зарядное устройство 1750 прикладывать стробированную вольтамперометрическую импульсную последовательность к образцу, таким образом, начиная анализ. Процессор 1740 может начать анализ, например, в зависимости от подключения сенсорной панели, нанесения образца на предварительно подключенную сенсорную панель или в зависимости от ввода пользователем.If the contacts of the touch panel containing the sample are electrically connected to the
Инструкции относительно генерации стробированной вольтамперометрической импульсной последовательности может обеспечить считываемая компьютером системная программа, которая хранится на считываемом компьютером носителе информации 1745. Программа может являться объектной программой или любой другой программой, описывающей или контролирующей функционирование, описанное в данной заявке. Данные, которые получают исходя из стробированной вольтамперометрической импульсной последовательности, можно подвергать одной или нескольким обработкам данных, включая определение скоростей распада, постоянных K, наклонов, отсекаемых отрезков и/или температуры образца, с помощью процессора 1740, и результаты, такие как исправленная концентрация аналита, выводятся на дисплей 1730. Как и в случае инструкций относительно импульсной последовательности, обработку данных можно осуществлять процессором 1740 с помощью считываемой компьютером системной программы, которая хранится на считываемом компьютером носителе информации 1745.Instructions for generating a gated voltammetric pulse sequence can be provided by a computer-readable system program that is stored on a computer-
ПРИМЕРЫEXAMPLES
Пример 1: Получение вольтамперометрических данныхExample 1: voltammetric data acquisition
Циклическая вольтамперограмма (фиг.7A) получена с помощью электрохимической рабочей станции CH путем приложения разности потенциалов между рабочим электродом и противоэлектродом сенсорной панели, которая линейно изменялась на 1 В/с со скоростью сканирования 0,025 В/с. Ток, полученный на рабочем электроде в ходе приложения разности потенциалов, зарегистрирован и нанесен на диаграмму в виде функции от приложенной разности потенциалов. После начального возбуждения 0,8 секунды потенциостат открыл цепь для обеспечения релаксации 3,2 секунды. Шесть дополнительных возбуждений приложено к панели с использованием импульсной последовательности на фиг.6C. Таким образом, получено семь нециклических вольтамперограмм для концентраций глюкозы 0, 50, 100 и 400 мг/дл (фиг.8A-8D) соответственно.The cyclic voltammogram (Fig. 7A) was obtained using the electrochemical workstation CH by applying a potential difference between the working electrode and the counter electrode of the touch panel, which was linearly changed by 1 V / s with a scanning speed of 0.025 V / s. The current obtained at the working electrode during the application of the potential difference is recorded and plotted on the diagram as a function of the applied potential difference. After an initial excitation of 0.8 seconds, the potentiostat opened the circuit to provide relaxation of 3.2 seconds. Six additional excitations are applied to the panel using the pulse sequence in FIG. 6C. Thus, seven non-cyclic voltammograms were obtained for glucose concentrations of 0, 50, 100 and 400 mg / dl (FIGS. 8A-8D), respectively.
Пример 2: Получение контурных диаграмм для множественной обработки данныхExample 2: Obtaining contour diagrams for multiple data processing
Фиг.9A, 9B и 9C представляют собой контурные диаграммы необработанных вольтамперометрических токов, обработанных данных с взятием полуинтеграла и полупроизводной, соответственно. На фиг.9A необработанные величины тока при 0,3 В отбирали из каждого прямого сканирования для получения семи экспериментальных значений. На результирующей контурной диаграмме представлены необработанные величины токов в виде функции от времени с того момента, как каждый рабочий цикл включал возбуждение 0,8 секунды с последующей релаксацией 3,2 секунды.Figa, 9B and 9C are contour diagrams of raw voltammetric currents, processed data with taking the half-integral and half-derivative, respectively. 9A, untreated currents at 0.3 V were selected from each direct scan to obtain seven experimental values. The resulting contour diagram shows the raw values of the currents as a function of time from the moment that each duty cycle included 0.8 seconds excitation followed by a relaxation of 3.2 seconds.
На фиг.9B представлена контурная диаграмма тех же вольтамперометрических данных, преобразованных путем обработки данных с взятием полуинтеграла согласно уравнению (3) и полученных с помощью уравнений (5) и (6). Полуинтегральную обработку данных осуществляли так, как представлено в программном пакете для электрохимической рабочей станции CH, версия 4,07, модифицированная 26 апреля 2004 года, которая прилагается к электрохимической рабочей станции CH Instruments, модель CHI 660A. После полуинтегральной обработки полуинтегральные токи при 0,3 В отбирали из обратной части каждого сканирования и наносили на диаграмму в виде функции от времени, как ранее описано для фиг.9A.On figv presents a contour diagram of the same voltammetric data converted by processing data with the taking of the half-integral according to equation (3) and obtained using equations (5) and (6). Semi-integrated data processing was performed as presented in the software package for the CH electrochemical workstation, version 4.07, modified on April 26, 2004, which is attached to the CH Instruments electrochemical workstation, model CHI 660A. After semi-integrated processing, semi-integrated currents at 0.3 V were selected from the back of each scan and plotted as a function of time, as previously described for FIG. 9A.
На фиг.9C представлена контурная диаграмма тех же вольтамперометрических данных, преобразованных путем обработки данных с взятием полупроизводной согласно уравнению (8). Используемую обработку данных с взятием полупроизводной осуществляли так, как представлено в программном пакете для электрохимической рабочей станции CH, версия 4,07, модифицированная 26 апреля 2004 года, которая прилагается к электрохимической рабочей станции CH Instruments, модель CHI 660A. После обработки с взятием полупроизводной пиковую величину тока отбирали из каждого сканирования и наносили на диаграмму в виде функции от времени, как ранее описано для фиг.9A и 9B. Таким образом, ось Y на фиг.9C обладает для полупроизводных токов размерностью мкКл/с3/2.On figs presents a contour diagram of the same voltammetric data converted by processing data with the taking of the semi-derivative according to equation (8). The semi-derivative data processing used was carried out as presented in the software package for the CH electrochemical workstation, version 4.07, modified on April 26, 2004, which is attached to the CH Instruments electrochemical workstation, model CHI 660A. After the semi-derivative process, the peak current was taken from each scan and plotted as a function of time, as previously described for FIGS. 9A and 9B. Thus, the Y axis in FIG. 9C has3/2 μC / s for semi-derivative currents.
Пример 3: Построение калибровочных диаграмм и определение концентрации аналитаExample 3: Construction of calibration charts and determination of analyte concentration
Как показано на фиг.14, калибровочная диаграмма для способа полуинтегральной обработки данных получена взятием полуинтегральных токов для четырех разных концентраций глюкозы на 8,8, 12,8, 16,8 и 20,8 секунды из фиг.9B и нанесением на диаграмму токов в виде функции от концентрации глюкозы в плазме YSI. Концентрации глюкозы в образцах определяли из калибровочной диаграммы, вставляя полуинтегральный обработанный ток из измерения образца в конкретное время в наклон и отсекаемый отрезок калибровочной линии.As shown in FIG. 14, the calibration chart for the semi-integrated data processing method was obtained by taking semi-integrated currents for four different glucose concentrations for 8.8, 12.8, 16.8 and 20.8 seconds from FIG. 9B and plotting the currents in as a function of the concentration of glucose in YSI plasma. Glucose concentrations in the samples were determined from the calibration chart by inserting the semi-integrated processed current from the sample measurement at a specific time into the slope and cut-off section of the calibration line.
Калибровочные диаграммы для необработанных и обработанных с взятием полупроизводной данных получали аналогично. Калибровочные диаграммы затем использовали для определения концентраций глюкозы в образцах, исходя из необработанных и обработанных с взятием полупроизводной измеренных величин токов, взятых в конкретное время.Calibration charts for unprocessed and semi-derivative processed data were obtained similarly. Calibration charts were then used to determine glucose concentrations in the samples, based on untreated measured values of currents taken at a specific time and taken semi-derivative.
Пример 4: Определение концентрации аналита исходя из нескольких калибровочных множествExample 4: Determination of analyte concentration based on several calibration sets
На фиг.4 представлены, по меньшей мере, четыре калибровочные линии для времен вплоть до 20,8 секунды. Для времени анализа 16,8 секунды калибровочные значения на 8,8 и 12,8 секунды использовали для калибрования значений глюкозы. Три значения глюкозы, вычисленные исходя из калибровочных значений 8,8, 12,8 и 16,8 секунды, получили в результате независимых окислений, разделенных временем релаксации перед возбуждением 8,8, 12,8 и 16,8 секунды. Отображая одинаковую концентрацию глюкозы в образце, величины концентрации отличались вследствие экспериментального шума. Таким образом, путем усреднения этих величин, G=(G8,8+G12,8+G16,8)/3 возросло отношение сигнала к шуму для конечной величины концентрации глюкозы.Figure 4 shows at least four calibration lines for times up to 20.8 seconds. For an analysis time of 16.8 seconds, calibration values of 8.8 and 12.8 seconds were used to calibrate glucose values. Three glucose values calculated on the basis of calibration values of 8.8, 12.8 and 16.8 seconds were obtained as a result of independent oxidations, separated by a relaxation time of 8.8, 12.8 and 16.8 seconds before excitation. By displaying the same glucose concentration in the sample, the concentration values differed due to experimental noise. Thus, by averaging these values, G = (G8.8 + G12.8 + G16.8 ) / 3, the signal-to-noise ratio for the final glucose concentration increased.
Хотя описаны различные варианты осуществления изобретения, будет очевидно для специалистов в данной области, что в пределах объема изобретения возможны другие варианты осуществления и реализации.Although various embodiments of the invention have been described, it will be apparent to those skilled in the art that other embodiments and implementations are possible within the scope of the invention.
Claims (38)
Translated fromRussianосуществляют приложение импульсной последовательности к образцу, причем импульсная последовательность имеет, по меньшей мере, два рабочих цикла,
при этом каждый из рабочих циклов содержит возбуждение и релаксацию,
причем возбуждение имеет потенциал, изменяющийся во времени, и
релаксация находится в пределах от 0,1 до 3 с и содержит снижение тока до, по меньшей мере, половины величины тока при максимальном возбуждении,
измеряют результирующие токи от, по меньшей мере, одного из возбуждений,
определяют концентрацию аналита в образце от, по меньшей мере, одного из результирующих токов.1. Voltammetric method for determining the concentration of analyte in the sample, which consists in the fact that
carry out the application of the pulse sequence to the sample, and the pulse sequence has at least two duty cycles,
each of the work cycles contains excitement and relaxation,
moreover, the excitation has a potential that varies over time, and
the relaxation is in the range from 0.1 to 3 s and contains a decrease in current to at least half the magnitude of the current at maximum excitation,
measure the resulting currents from at least one of the excitations,
determine the concentration of the analyte in the sample from at least one of the resulting currents.
определяют продолжительность импульсной последовательности в зависимости от определяемой концентрации аналита в образце.34. The method according to claim 1, in which additionally determine the set of calibration sets based on the currents recorded during at least two duty cycles, and
determine the duration of the pulse sequence depending on the determined concentration of analyte in the sample.
сравнивают, по меньшей мере, одну величину результирующего тока с предварительно заданной величиной,
определяют, является ли сенсорная панель не полностью заполненной, исходя из результата сравнения,
сигнализируют пользователю о добавлении дополнительного количества образца на сенсорную панель, если панель не полностью заполнена.35. The method according to claim 1, in which
at least one value of the resulting current is compared with a predetermined value,
determine whether the touch panel is not completely filled, based on the result of the comparison,
signal the user to add an additional amount of sample to the touch panel if the panel is not completely filled.
указанное устройство адаптировано для подключения сенсорной панели, и содержит,
по меньшей мере, два контакта,
по меньшей мере, один дисплей, и
электрическую схему, обеспечивающую электрическую связь, по меньшей мере, между двумя контактами и, по меньшей мере, одним дисплеем, и содержащую процессор, электрически связанный с электрическим зарядным устройством, и считываемым компьютером носителем информации,
при этом процессор предназначен для генерирования импульсной последовательности от электрического зарядного устройства, по меньшей мере, к двум контактам, причем импульсная последовательность содержит, по меньшей мере, два рабочих цикла,
при этом каждый из рабочих циклов содержит возбуждение и релаксацию,
причем возбуждение имеет потенциал, изменяющийся во времени, и во время релаксации электрическое зарядное устройство снижает величину тока, подаваемого к, по меньшей мере, двум контактам, до, по меньшей мере, половины от величины тока при максимальном возбуждении в течение от 0,1 до 3 с,
при этом процессор предназначен для измерения, по меньшей мере, одного профиля тока, по меньшей мере, на двух контактах,
и предназначен также для определения концентрации аналита в образце в ответ на, по меньшей мере, один профиль тока.37. A portable measuring device for determining the concentration of analyte in a sample,
the specified device is adapted to connect a touch panel, and contains,
at least two contacts
at least one display, and
an electrical circuit providing electrical communication between at least two contacts and at least one display, and comprising a processor electrically coupled to an electric charger and a computer readable medium
wherein the processor is designed to generate a pulse sequence from an electric charger to at least two contacts, and the pulse sequence contains at least two duty cycles,
each of the work cycles contains excitement and relaxation,
moreover, the excitation has a potential that varies over time, and during relaxation, the electric charger reduces the amount of current supplied to at least two contacts to at least half of the current at maximum excitation for from 0.1 to 3 s
wherein the processor is designed to measure at least one current profile at least at two contacts,
and is also intended to determine the analyte concentration in the sample in response to at least one current profile.
Applications Claiming Priority (2)
| Application Number | Priority Date | Filing Date | Title |
|---|---|---|---|
| US72258405P | 2005-09-30 | 2005-09-30 | |
| US60/722,584 | 2005-09-30 |
Publications (2)
| Publication Number | Publication Date |
|---|---|
| RU2008117118A RU2008117118A (en) | 2009-11-10 |
| RU2426107C2true RU2426107C2 (en) | 2011-08-10 |
Family
ID=37517158
Family Applications (1)
| Application Number | Title | Priority Date | Filing Date |
|---|---|---|---|
| RU2008117118/28ARU2426107C2 (en) | 2005-09-30 | 2006-09-11 | Voltammetric method of determining concentration of analyte in sample and device for determining concentration of analyte |
Country Status (18)
| Country | Link |
|---|---|
| US (6) | US8404100B2 (en) |
| EP (2) | EP3483598B1 (en) |
| JP (15) | JP5671205B2 (en) |
| KR (5) | KR101577176B1 (en) |
| CN (2) | CN103048442B (en) |
| AR (1) | AR055189A1 (en) |
| AU (1) | AU2006297572B2 (en) |
| BR (1) | BRPI0616743B1 (en) |
| CA (3) | CA2623480C (en) |
| DO (1) | DOP2006000206A (en) |
| ES (1) | ES2716136T3 (en) |
| NO (1) | NO20082030L (en) |
| PE (1) | PE20070730A1 (en) |
| RU (1) | RU2426107C2 (en) |
| TW (1) | TW200736606A (en) |
| UY (1) | UY29819A1 (en) |
| WO (1) | WO2007040913A1 (en) |
| ZA (1) | ZA200801918B (en) |
Cited By (2)
| Publication number | Priority date | Publication date | Assignee | Title |
|---|---|---|---|---|
| RU2528584C1 (en)* | 2013-03-19 | 2014-09-20 | Федеральное государственное бюджетное образовательное учреждение высшего профессионального образования "Национальный исследовательский Томский политехнический университет" | Method of determining glutathione in standard test aqueous solutions via cyclic voltammetry on graphite electrode, modified with colloidal gold particles |
| RU2661608C2 (en)* | 2012-09-28 | 2018-07-17 | Цилаг Гмбх Интернэшнл | System and method for determining hematocrit insensitive glucose concentration |
Families Citing this family (81)
| Publication number | Priority date | Publication date | Assignee | Title |
|---|---|---|---|---|
| JP2604918B2 (en) | 1991-05-30 | 1997-04-30 | 株式会社クボタ | Pile and posture measurement method of the pile |
| EP1713926B1 (en) | 2004-02-06 | 2012-08-01 | Bayer HealthCare, LLC | Oxidizable species as an internal reference for biosensors and method of use |
| KR101577176B1 (en) | 2005-09-30 | 2015-12-14 | 바이엘 헬스케어 엘엘씨 | Gated voltammetry analyte determination |
| RU2455925C2 (en)* | 2006-02-27 | 2012-07-20 | БАЙЕР ХЕЛТКЭА ЭлЭлСи | Determination of investigated substance with correction to temperature for systems of biosensors |
| US8529751B2 (en) | 2006-03-31 | 2013-09-10 | Lifescan, Inc. | Systems and methods for discriminating control solution from a physiological sample |
| US7966859B2 (en) | 2006-05-03 | 2011-06-28 | Bayer Healthcare Llc | Underfill detection system for a biosensor |
| BRPI0711433A2 (en)* | 2006-05-08 | 2011-11-16 | Bayer Healthcare Llc | Abnormal output detection system for a biosensor |
| WO2008036516A1 (en) | 2006-09-22 | 2008-03-27 | Bayer Healthcare Llc | Biosensor system having enhanced stability and hematocrit performance |
| US9538657B2 (en) | 2012-06-29 | 2017-01-03 | General Electric Company | Resonant sensor and an associated sensing method |
| US9658178B2 (en) | 2012-09-28 | 2017-05-23 | General Electric Company | Sensor systems for measuring an interface level in a multi-phase fluid composition |
| US20100134286A1 (en)* | 2008-12-01 | 2010-06-03 | General Electric Company | Radio frequency based sensors employing analyte recognition element |
| US9589686B2 (en) | 2006-11-16 | 2017-03-07 | General Electric Company | Apparatus for detecting contaminants in a liquid and a system for use thereof |
| US9536122B2 (en) | 2014-11-04 | 2017-01-03 | General Electric Company | Disposable multivariable sensing devices having radio frequency based sensors |
| US10914698B2 (en) | 2006-11-16 | 2021-02-09 | General Electric Company | Sensing method and system |
| USD587142S1 (en) | 2006-12-22 | 2009-02-24 | Abbott Diabetes Care Inc. | Sensors |
| HRP20150979T1 (en) | 2007-09-24 | 2015-11-20 | Bayer Healthcare Llc | MULTI-SECTORAL AND TEST SENSORS FOR POTENTIAL, PROCEDURES AND SYSTEMS |
| JP5812603B2 (en) | 2007-12-10 | 2015-11-17 | バイエル・ヘルスケア・エルエルシーBayer HealthCareLLC | Slope-based correction |
| WO2009076302A1 (en) | 2007-12-10 | 2009-06-18 | Bayer Healthcare Llc | Control markers for auto-detection of control solution and methods of use |
| JP5455924B2 (en)* | 2007-12-10 | 2014-03-26 | バイエル・ヘルスケア・エルエルシー | Speed reading gate amperometry |
| US8603768B2 (en) | 2008-01-17 | 2013-12-10 | Lifescan, Inc. | System and method for measuring an analyte in a sample |
| US8551320B2 (en) | 2008-06-09 | 2013-10-08 | Lifescan, Inc. | System and method for measuring an analyte in a sample |
| EP2310843B1 (en) | 2008-07-10 | 2018-09-05 | Ascensia Diabetes Care Holdings AG | Systems and methods including amperometric and voltammetric duty cycles |
| JP5773883B2 (en) | 2008-12-08 | 2015-09-02 | バイエル・ヘルスケア・エルエルシーBayer HealthCareLLC | Low total salt reagent compositions and systems for biosensors |
| JP5738770B2 (en) | 2008-12-08 | 2015-06-24 | バイエル・ヘルスケア・エルエルシーBayer HealthCareLLC | Biosensor system with signal conditioning |
| TWI388823B (en) | 2009-04-09 | 2013-03-11 | Bionime Corp | A method for estimating the distribution of a sample |
| US9603522B2 (en) | 2009-08-26 | 2017-03-28 | Mayo Foundation For Medical Education And Research | Detecting neurochemical or electrical signals within brain tissue |
| US8668819B2 (en) | 2009-11-10 | 2014-03-11 | Bayer Healthcare Llc | Underfill recognition system for a biosensor |
| US8877034B2 (en) | 2009-12-30 | 2014-11-04 | Lifescan, Inc. | Systems, devices, and methods for measuring whole blood hematocrit based on initial fill velocity |
| US8101065B2 (en) | 2009-12-30 | 2012-01-24 | Lifescan, Inc. | Systems, devices, and methods for improving accuracy of biosensors using fill time |
| US8691075B2 (en)* | 2009-12-30 | 2014-04-08 | Roche Diagnostics Operations, Inc. | Method for measuring analyte concentration in a liquid sample |
| RU2568884C2 (en) | 2010-03-22 | 2015-11-20 | БАЙЕР ХЕЛТКЭА ЭлЭлСи | Compensation of discrepancy for biosensor |
| GB201007711D0 (en) | 2010-05-07 | 2010-06-23 | Pa Consulting Services | Devices and methods for testing analytes |
| EP2577303B1 (en) | 2010-06-07 | 2022-08-03 | Ascensia Diabetes Care Holdings AG | Underfill management system for a biosensor |
| CN103210310B (en) | 2010-06-07 | 2015-03-18 | 拜尔健康护理有限责任公司 | Slope-based compensation including secondary output signals |
| EP2770063B1 (en)* | 2010-09-28 | 2017-04-19 | Lifescan Scotland Limited | Glucose electrochemical measurement method with error detection |
| US8617370B2 (en) | 2010-09-30 | 2013-12-31 | Cilag Gmbh International | Systems and methods of discriminating between a control sample and a test fluid using capacitance |
| US8932445B2 (en) | 2010-09-30 | 2015-01-13 | Cilag Gmbh International | Systems and methods for improved stability of electrochemical sensors |
| RU2454660C1 (en)* | 2010-10-12 | 2012-06-27 | Российская Федерация, От Имени Которой Выступает Министерство Образования И Науки Российской Федерации | Method for quantitative determination of coenzyme q10 antioxidant in substance through cyclic voltammetry |
| US8542023B2 (en) | 2010-11-09 | 2013-09-24 | General Electric Company | Highly selective chemical and biological sensors |
| WO2012083258A2 (en)* | 2010-12-16 | 2012-06-21 | Sensor Innovations, Inc. | Electrochemical sensors |
| US9841403B2 (en) | 2011-07-21 | 2017-12-12 | Mayo Foundation For Medical Education And Research | Differentiating analytes detected using fast scan cyclic voltammetry |
| JP6082396B2 (en) | 2011-09-21 | 2017-02-15 | バイエル・ヘルスケア・エルエルシーBayer HealthCare LLC | Biosensor with error compensation |
| EP2781914A1 (en)* | 2011-11-18 | 2014-09-24 | Murata Manufacturing Co., Ltd. | Method for measuring hematocrit levels, quantitative analysis method using said measurement method, and sensor chip |
| JP5783891B2 (en)* | 2011-12-12 | 2015-09-24 | グンゼ株式会社 | Measurement display device |
| KR101357134B1 (en)* | 2012-05-23 | 2014-02-05 | 주식회사 아이센스 | Method for Measuring Analytes in Blood Samples Using Electrochemical Biosensor and a Portable Analyzer |
| US9746452B2 (en) | 2012-08-22 | 2017-08-29 | General Electric Company | Wireless system and method for measuring an operative condition of a machine |
| US10598650B2 (en) | 2012-08-22 | 2020-03-24 | General Electric Company | System and method for measuring an operative condition of a machine |
| US9080196B2 (en) | 2012-09-28 | 2015-07-14 | Cilag Gmbh International | System and method for determining hematocrit insensitive glucose concentration |
| US10684268B2 (en) | 2012-09-28 | 2020-06-16 | Bl Technologies, Inc. | Sensor systems for measuring an interface level in a multi-phase fluid composition |
| EP2919000B1 (en)* | 2012-12-12 | 2019-05-08 | PHC Holdings Corporation | Blood component measuring device and method for measuring blood component |
| WO2014110263A2 (en) | 2013-01-09 | 2014-07-17 | Mayo Foundation For Medical Education And Research | Systems for the detection and delivery of neurochemical and electrical signals for functional restoration |
| EP2972397B1 (en) | 2013-03-14 | 2021-10-13 | Ascensia Diabetes Care Holdings AG | System error compensation of analyte concentration determinations |
| CA2902545A1 (en) | 2013-03-14 | 2014-10-02 | Bayer Healthcare Llc | Progressive approximation of sample analyte concentration |
| EP3276355B1 (en) | 2013-03-14 | 2020-05-06 | Ascensia Diabetes Care Holdings AG | Normalized calibration of analyte concentration determinations |
| CN105190299B (en)* | 2013-03-15 | 2018-04-20 | 豪夫迈·罗氏有限公司 | The method based on descriptor of electrochemical measurement analyte and the unit and system with reference to this method |
| US9395319B2 (en) | 2013-05-02 | 2016-07-19 | Lifescan Scotland Limited | Analytical test meter |
| KR20160009619A (en)* | 2013-06-10 | 2016-01-26 | 에프. 호프만-라 로슈 아게 | Method and system for detecting an analyte in a body fluid |
| GB2515299B (en)* | 2013-06-18 | 2015-12-30 | Suresensors Ltd | Methods and apparatus for determining analyte in a sample |
| JP6454342B2 (en)* | 2013-08-09 | 2019-01-16 | メイヨ・ファウンデーション・フォー・メディカル・エデュケーション・アンド・リサーチ | Use of kinetic cyclic voltammetry to assess analyte kinetics and concentration |
| JP6549355B2 (en)* | 2014-06-16 | 2019-07-24 | 株式会社エンプラス | Fluid handling device |
| EP3198272B1 (en)* | 2014-09-26 | 2022-04-06 | Abbott Point Of Care, Inc. | Cartridge device identification for coagulation assays in fluid samples |
| ES2911898T3 (en) | 2014-09-26 | 2022-05-23 | Abbott Point Of Care Inc | Single channel cartridge device for blood coagulation assays on fluid samples |
| EP3197603A1 (en) | 2014-09-26 | 2017-08-02 | Abbott Point of Care Inc. | Cartridge device with segmented fluidics for assaying coagulation in fluid samples |
| EP3198280B1 (en) | 2014-09-26 | 2021-05-26 | Abbott Point Of Care, Inc. | Sensors for assaying coagulation in fluid samples |
| EP3954457A3 (en) | 2014-09-26 | 2022-05-18 | Abbott Point Of Care Inc | Microfabricated device with micro-environment sensors for assaying coagulation in fluid samples |
| WO2016049533A1 (en) | 2014-09-26 | 2016-03-31 | Abbott Point Of Care Inc. | Cartridge device with fluidic junctions for coagulation assays in fluid samples |
| WO2016049557A1 (en) | 2014-09-26 | 2016-03-31 | Abbott Point Of Care Inc. | Ellagic acid formulations for use in coagulation assays |
| CN107110820B (en) | 2014-11-12 | 2019-05-07 | 旭化成株式会社 | Equilibrium potential estimation method, equilibrium potential estimation device, concentration estimation device, program, medium, and blood glucose estimation device |
| US9903832B2 (en) | 2015-04-28 | 2018-02-27 | Industrial Technology Research Institute | Methods for measuring analyte concentration |
| CN106370715A (en)* | 2015-07-21 | 2017-02-01 | 天津亿朋医疗器械有限公司 | Blood component analysis method and blood component analysis apparatus |
| JP6817111B2 (en)* | 2016-03-16 | 2021-01-20 | アークレイ株式会社 | Material measurement method and measuring device using electrochemical biosensor |
| WO2018011692A1 (en) | 2016-07-12 | 2018-01-18 | Ascensia Diabetes Care Holdings Ag | Method for electrochemical analysis by use of alternating output signals from two electrodes |
| WO2018067235A1 (en)* | 2016-10-05 | 2018-04-12 | Roche Diabetes Care, Inc. | Detection reagents and electrode arrangements for multi-analyte diagnostic test elements, as well as methods of using the same |
| CN110249219B (en) | 2016-12-05 | 2022-08-23 | 安晟信医疗科技控股公司 | Risk factor monitoring |
| US11040197B2 (en) | 2017-06-22 | 2021-06-22 | Mayo Foundation For Medical Education And Research | Voltammetric neurochemical detection in whole blood |
| FI3700422T3 (en)* | 2017-10-24 | 2023-04-27 | Roche Diabetes Care Gmbh | Electrochemical sensor and method for producing thereof |
| US11852605B2 (en)* | 2018-06-21 | 2023-12-26 | Trustees Of Dartmouth College | Metal-organic frameworks for electrochemical detection of analytes |
| JP6989183B2 (en)* | 2018-08-09 | 2022-01-05 | ビービービー インコーポレイテッド | Biosensor using magnetic nanoparticles, detection device and detection method using this |
| US20220386908A1 (en)* | 2019-10-25 | 2022-12-08 | The Regents Of The University Of California | Device and method of detecting and calibrating a voltammetric response to in vivo biochemicals |
| WO2022137272A1 (en) | 2020-12-21 | 2022-06-30 | フジデノロ株式会社 | Measurement device and measurement method |
| TWI865976B (en)* | 2022-11-30 | 2024-12-11 | 國立彰化師範大學 | Error data processing method of electrochemical detection |
Citations (4)
| Publication number | Priority date | Publication date | Assignee | Title |
|---|---|---|---|---|
| US4304853A (en)* | 1979-04-24 | 1981-12-08 | Marcel Jozefonvicz | Method of determination for proteases and antiproteases |
| US4897162A (en)* | 1986-11-14 | 1990-01-30 | The Cleveland Clinic Foundation | Pulse voltammetry |
| US5873990A (en)* | 1995-08-22 | 1999-02-23 | Andcare, Inc. | Handheld electromonitor device |
| US6413398B1 (en)* | 1999-09-13 | 2002-07-02 | Her Majesty The Queen In Right Of Canada, As Represented By The Canadian Food Inspection Agency | Method for electrochemical detection |
Family Cites Families (686)
| Publication number | Priority date | Publication date | Assignee | Title |
|---|---|---|---|---|
| DE229500C (en) | ||||
| DE271179C (en) | ||||
| DE1617732C2 (en) | 1966-03-01 | 1972-12-21 | Promoveo-Sobioda & Cie, Seyssinet (Frankreich) | Device for examining living cells of microorganisms |
| US3420205A (en) | 1966-03-23 | 1969-01-07 | Miles Lab | Indicating device |
| US3505136A (en) | 1966-09-19 | 1970-04-07 | Union Special Machine Co | Method and apparatus for bonding thermoplastic sheet materials |
| US3573139A (en) | 1967-10-13 | 1971-03-30 | Eiji Mori | Method and apparatus for welding plastic members |
| US3562041A (en) | 1967-10-26 | 1971-02-09 | Cavitron Corp | Method and apparatus for the ultrasonic joining of materials according to a pattern |
| US3551295A (en) | 1967-11-29 | 1970-12-29 | Northrop Corp | Microbiological detection and identification system |
| US3510268A (en) | 1968-06-05 | 1970-05-05 | Hooker Chemical Corp | Preparation of flaked phosphorous acid |
| US3621381A (en) | 1968-10-16 | 1971-11-16 | Leeds & Northrup Co | Coulometric system having compensation for temperature induced viscosity changes |
| BE754658A (en) | 1969-08-12 | 1971-02-10 | Merck Patent Gmbh | INDICATOR SHEET, CONSISTING OF AN IMPREGNATED, ABSORBENT, SHEATHED HAIR MATERIAL |
| US3770607A (en) | 1970-04-07 | 1973-11-06 | Secretary | Glucose determination apparatus |
| US3919627A (en) | 1970-08-06 | 1975-11-11 | Gerald F Allen | Conductivity measuring method and apparatus utilizing coaxial electrode cells |
| US3776832A (en) | 1970-11-10 | 1973-12-04 | Energetics Science | Electrochemical detection cell |
| US3720093A (en) | 1970-12-03 | 1973-03-13 | Us Navy | Carbon dioxide indicating meter |
| US3791933A (en) | 1971-02-25 | 1974-02-12 | Geomet | Rapid methods for assay of enzyme substrates and metabolites |
| CH559912A5 (en) | 1971-09-09 | 1975-03-14 | Hoffmann La Roche | |
| US3763422A (en) | 1971-10-21 | 1973-10-02 | Corning Glass Works | Method and apparatus for electrochemical analysis of small samples of blood |
| US3791988A (en) | 1972-03-23 | 1974-02-12 | Hoffmann La Roche | Diagnostic test for glucose |
| US3925183A (en) | 1972-06-16 | 1975-12-09 | Energetics Science | Gas detecting and quantitative measuring device |
| US3948745A (en) | 1973-06-11 | 1976-04-06 | The United States Of America As Represented By The Department Of Health, Education And Welfare | Enzyme electrode |
| US3952183A (en)* | 1973-06-28 | 1976-04-20 | Glory Kogyo Kabushiki Kaisha | Sheet counting apparatus |
| US3920580A (en) | 1973-07-12 | 1975-11-18 | Miles Lab | Liquid control solution |
| US3902970A (en) | 1973-07-30 | 1975-09-02 | Leeds & Northrup Co | Flow-through amperometric measuring system and method |
| CH585907A5 (en) | 1973-08-06 | 1977-03-15 | Hoffmann La Roche | |
| US3917453A (en) | 1974-08-16 | 1975-11-04 | Polaroid Corp | Method and device for determining the concentration of a substance in a fluid |
| US3937615A (en) | 1974-12-17 | 1976-02-10 | Leeds & Northrup Company | Auto-ranging glucose measuring system |
| FR2295419A1 (en) | 1974-12-21 | 1976-07-16 | Kyoto Daiichi Kagaku Kk | REFLECTANCE MEASURING DEVICE AND COMPOSITE TEST PAPER STRUCTURE SUBJECT TO SUCH MEASUREMENT |
| SE399768B (en) | 1975-09-29 | 1978-02-27 | Lilja Jan E | CYVETT FOR SAMPLING, MIXING OF, THE SAMPLE WITH A REAGENTS AND DIRECT PERFORMANCE OF, SPECIAL OPTICAL, ANALYSIS OF THE SAMPLE MIXED WITH THE REAGENTS |
| US4008448A (en) | 1975-10-03 | 1977-02-15 | Polaroid Corporation | Solenoid with selectively arrestible plunger movement |
| JPS5260694A (en)* | 1975-11-14 | 1977-05-19 | Enuefu Kairo Setsukei Burotsuk | Polarograph |
| US4230537A (en) | 1975-12-18 | 1980-10-28 | Monsanto Company | Discrete biochemical electrode system |
| US4077861A (en) | 1976-01-28 | 1978-03-07 | Teledyne Industries, Inc. | Polarographic sensor |
| US4040908A (en) | 1976-03-12 | 1977-08-09 | Children's Hospital Medical Center | Polarographic analysis of cholesterol and other macromolecular substances |
| US4137495A (en) | 1976-03-27 | 1979-01-30 | Brown David M B | Oil detector |
| US4065263A (en) | 1976-04-02 | 1977-12-27 | Woodbridge Iii Richard G | Analytical test strip apparatus |
| US4053381A (en) | 1976-05-19 | 1977-10-11 | Eastman Kodak Company | Device for determining ionic activity of components of liquid drops |
| US4123701A (en) | 1976-07-01 | 1978-10-31 | United States Surgical Corporation | Disposable sample card having a well with electrodes for testing a liquid sample |
| US4127448A (en) | 1977-02-28 | 1978-11-28 | Schick Karl G | Amperometric-non-enzymatic method of determining sugars and other polyhydroxy compounds |
| JPS5912135B2 (en) | 1977-09-28 | 1984-03-21 | 松下電器産業株式会社 | enzyme electrode |
| JPS5460996A (en) | 1977-10-22 | 1979-05-16 | Mitsubishi Chem Ind | Method of measuring amount of sugar |
| US4229426A (en) | 1978-02-22 | 1980-10-21 | Duke University, Inc. | Breast cyst fluid protein assay |
| US4214968A (en) | 1978-04-05 | 1980-07-29 | Eastman Kodak Company | Ion-selective electrode |
| DE2817363C2 (en) | 1978-04-20 | 1984-01-26 | Siemens AG, 1000 Berlin und 8000 München | Method for determining the concentration of sugar and a suitable electrocatalytic sugar sensor |
| US4321123A (en) | 1978-04-21 | 1982-03-23 | Matsushita Electric Industrial Co., Ltd. | Coenzyme immobilized electrode |
| DE2823485C2 (en) | 1978-05-30 | 1986-03-27 | Albert Prof. Dr. 3550 Marburg Huch | Trough electrode |
| US4184936A (en) | 1978-07-24 | 1980-01-22 | Eastman Kodak Company | Device for determining ionic activity |
| DE2965939D1 (en) | 1978-10-02 | 1983-08-25 | Xerox Corp | Electrostatographic processing system |
| US4233029A (en) | 1978-10-25 | 1980-11-11 | Eastman Kodak Company | Liquid transport device and method |
| US4225410A (en) | 1978-12-04 | 1980-09-30 | Technicon Instruments Corporation | Integrated array of electrochemical sensors |
| US4329642A (en) | 1979-03-09 | 1982-05-11 | Siliconix, Incorporated | Carrier and test socket for leadless integrated circuit |
| FR2455083A1 (en)* | 1979-04-24 | 1980-11-21 | Jozefonvicz Marcel | Electrochemical protease or anti-protease determn. - by amperometric determn. of amine released from peptide amide substrate |
| JPS55146036A (en)* | 1979-05-02 | 1980-11-14 | Masashi Goto | Polarograph of step wave semidifferentiation and integration |
| US4273639A (en) | 1979-06-20 | 1981-06-16 | Eastman Kodak Company | Capillary bridge in apparatus for determining ionic activity |
| US4297569A (en) | 1979-06-28 | 1981-10-27 | Datakey, Inc. | Microelectronic memory key with receptacle and systems therefor |
| US4265250A (en) | 1979-07-23 | 1981-05-05 | Battle Research And Development Associates | Electrode |
| US4263343A (en) | 1979-08-13 | 1981-04-21 | Eastman Kodak Company | Reference elements for ion-selective membrane electrodes |
| US4301412A (en) | 1979-10-29 | 1981-11-17 | United States Surgical Corporation | Liquid conductivity measuring system and sample cards therefor |
| US4303887A (en) | 1979-10-29 | 1981-12-01 | United States Surgical Corporation | Electrical liquid conductivity measuring system |
| US4403984A (en) | 1979-12-28 | 1983-09-13 | Biotek, Inc. | System for demand-based adminstration of insulin |
| US4628193A (en) | 1980-01-30 | 1986-12-09 | Blum Alvin S | Code reading operations supervisor |
| US4381775A (en) | 1980-02-05 | 1983-05-03 | Takeda Chemical Industries, Ltd. | Method for low pressure filtration of plasma from blood |
| US4323536A (en) | 1980-02-06 | 1982-04-06 | Eastman Kodak Company | Multi-analyte test device |
| US4297184A (en) | 1980-02-19 | 1981-10-27 | United Chemi-Con, Inc. | Method of etching aluminum |
| US4413407A (en) | 1980-03-10 | 1983-11-08 | Eastman Kodak Company | Method for forming an electrode-containing device with capillary transport between electrodes |
| US4340458A (en) | 1980-06-02 | 1982-07-20 | Joslin Diabetes Center, Inc. | Glucose sensor |
| DE3029579C2 (en) | 1980-08-05 | 1985-12-12 | Boehringer Mannheim Gmbh, 6800 Mannheim | Method and means for separating plasma or serum from whole blood |
| US4816224A (en) | 1980-08-05 | 1989-03-28 | Boehringer Mannheim Gmbh | Device for separating plasma or serum from whole blood and analyzing the same |
| US4407959A (en) | 1980-10-29 | 1983-10-04 | Fuji Electric Co., Ltd. | Blood sugar analyzing apparatus |
| US4420564A (en) | 1980-11-21 | 1983-12-13 | Fuji Electric Company, Ltd. | Blood sugar analyzer having fixed enzyme membrane sensor |
| DE3047782A1 (en) | 1980-12-18 | 1982-07-08 | Drägerwerk AG, 2400 Lübeck | CIRCUIT FOR THE CORRECTION OF THE SENSOR OUTPUT SIZE |
| US4426451A (en) | 1981-01-28 | 1984-01-17 | Eastman Kodak Company | Multi-zoned reaction vessel having pressure-actuatable control means between zones |
| US4436094A (en) | 1981-03-09 | 1984-03-13 | Evreka, Inc. | Monitor for continuous in vivo measurement of glucose concentration |
| US4407290A (en) | 1981-04-01 | 1983-10-04 | Biox Technology, Inc. | Blood constituent measuring device and method |
| WO1982003729A1 (en) | 1981-04-08 | 1982-10-28 | Lo Gorton | Electrode for the electrochemical regeneration of co-enzyme,a method of making said electrode,and the use thereof |
| GB2096825A (en) | 1981-04-09 | 1982-10-20 | Sibbald Alastair | Chemical sensitive semiconductor field effect transducer |
| AT369254B (en) | 1981-05-07 | 1982-12-27 | Otto Dipl Ing Dr Tech Prohaska | MEDICAL PROBE |
| US4440175A (en) | 1981-08-10 | 1984-04-03 | University Patents, Inc. | Membrane electrode for non-ionic species |
| DE3133826A1 (en) | 1981-08-27 | 1983-03-10 | Boehringer Mannheim Gmbh, 6800 Mannheim | ANALYSIS TEST STRIP AND METHOD FOR THE PRODUCTION THEREOF |
| WO1983000926A1 (en) | 1981-08-28 | 1983-03-17 | Clark, Stanley | Reflectance meter |
| EP0078636B2 (en) | 1981-10-23 | 1997-04-02 | MediSense, Inc. | Sensor for components of a liquid mixture |
| US4431004A (en) | 1981-10-27 | 1984-02-14 | Bessman Samuel P | Implantable glucose sensor |
| US4477557A (en)* | 1981-11-25 | 1984-10-16 | Georg Rauch | Stencil making and utilization methods, apparatus and articles |
| NZ199380A (en) | 1981-12-23 | 1986-08-08 | J R Baker | Determination of serum glucose levels in blood samples |
| US4499552A (en)* | 1981-12-31 | 1985-02-12 | International Business Machines Corporation | Electrochemical cell simulating circuit arrangement |
| DE3202067C2 (en) | 1982-01-23 | 1984-06-20 | Holger Dr. 5100 Aachen Kiesewetter | Device for determining the hematocrit value |
| JPS58155865A (en) | 1982-03-12 | 1983-09-16 | 株式会社クラレ | Hollow yarn membrane for treating serum |
| US4473457A (en) | 1982-03-29 | 1984-09-25 | Eastman Kodak Company | Liquid transport device providing diversion of capillary flow into a non-vented second zone |
| DE3225408A1 (en) | 1982-07-07 | 1984-01-12 | Biotest-Serum-Institut Gmbh, 6000 Frankfurt | AQUEOUS SOLUTION FOR SUSPENDING AND STORING CELLS, ESPECIALLY ERYTHROCYTES |
| DE3228542A1 (en) | 1982-07-30 | 1984-02-02 | Siemens AG, 1000 Berlin und 8000 München | METHOD FOR DETERMINING THE CONCENTRATION OF ELECTROCHEMICALLY IMPLEMENTABLE SUBSTANCES |
| DE3228551A1 (en) | 1982-07-30 | 1984-02-02 | Siemens AG, 1000 Berlin und 8000 München | METHOD FOR DETERMINING SUGAR CONCENTRATION |
| US4571292A (en) | 1982-08-12 | 1986-02-18 | Case Western Reserve University | Apparatus for electrochemical measurements |
| DE3233809A1 (en) | 1982-09-11 | 1984-03-15 | Boehringer Mannheim Gmbh, 6800 Mannheim | CUEVETTE FOR DETERMINING CHEMICAL COMPOUNDS IN LIQUIDS |
| JPS59111051A (en)* | 1982-12-14 | 1984-06-27 | インステイテユ−ト・エレクトロヒミ−・アカデミ−・ナウク・エスエスエスア−ル | Method and device for measuring content of organic carbon inwater or aqueous solution |
| US4490216A (en) | 1983-02-03 | 1984-12-25 | Molecular Devices Corporation | Lipid membrane electroanalytical elements and method of analysis therewith |
| US4679562A (en) | 1983-02-16 | 1987-07-14 | Cardiac Pacemakers, Inc. | Glucose sensor |
| GB8308389D0 (en) | 1983-03-26 | 1983-05-05 | Cambridge Life Sciences | Assay technique |
| GB8308554D0 (en) | 1983-03-29 | 1983-05-05 | Hyslop C P | Optical measuring cells |
| CA1226036A (en) | 1983-05-05 | 1987-08-25 | Irving J. Higgins | Analytical equipment and sensor electrodes therefor |
| US5682884A (en) | 1983-05-05 | 1997-11-04 | Medisense, Inc. | Strip electrode with screen printing |
| US5509410A (en) | 1983-06-06 | 1996-04-23 | Medisense, Inc. | Strip electrode including screen printing of a single layer |
| JPS59227494A (en) | 1983-06-09 | 1984-12-20 | Fuji Photo Film Co Ltd | Manufacture of support for lithographic plate |
| DE3326689A1 (en) | 1983-07-23 | 1985-01-31 | Boehringer Mannheim Gmbh, 6800 Mannheim | METHOD AND DEVICE FOR PRODUCING A TEST STRIP |
| US4517291A (en) | 1983-08-15 | 1985-05-14 | E. I. Du Pont De Nemours And Company | Biological detection process using polymer-coated electrodes |
| US4552458A (en) | 1983-10-11 | 1985-11-12 | Eastman Kodak Company | Compact reflectometer |
| SE8305704D0 (en) | 1983-10-18 | 1983-10-18 | Leo Ab | Cuvette |
| US4579893A (en) | 1984-01-06 | 1986-04-01 | Eastman Kodak Company | Benzoxazole stabilizer compounds and polymeric materials stabilized therewith |
| US4703017C1 (en) | 1984-02-14 | 2001-12-04 | Becton Dickinson Co | Solid phase assay with visual readout |
| US4591550A (en) | 1984-03-01 | 1986-05-27 | Molecular Devices Corporation | Device having photoresponsive electrode for determining analytes including ligands and antibodies |
| DE3407754A1 (en) | 1984-03-02 | 1985-09-12 | Boehringer Mannheim Gmbh, 6800 Mannheim | DEVICE FOR DETERMINING THE DIFFUSION REFLECTIVITY OF A SAMPLE AREA OF SMALL DIMENSIONS |
| GB8406752D0 (en) | 1984-03-15 | 1984-04-18 | Unilever Plc | Chemical and clinical tests |
| US4849330A (en) | 1984-04-27 | 1989-07-18 | Molecular Devices Corporation | Photoresponsive redox detection and discrimination |
| EP0170375B1 (en) | 1984-06-13 | 1990-05-16 | Unilever Plc | Devices for use in chemical test procedures |
| US5141868A (en) | 1984-06-13 | 1992-08-25 | Internationale Octrooi Maatschappij "Octropa" Bv | Device for use in chemical test procedures |
| JPS6149120A (en) | 1984-08-15 | 1986-03-11 | Yamaha Motor Co Ltd | 4 stroke internal-combustion engine |
| US4820399A (en) | 1984-08-31 | 1989-04-11 | Shimadzu Corporation | Enzyme electrodes |
| DK365785A (en) | 1984-09-17 | 1986-03-18 | Hoffmann La Roche | metal complex |
| US4648665A (en) | 1984-10-16 | 1987-03-10 | Amp Incorporated | Electronic key assemblies |
| WO1986002732A1 (en) | 1984-10-31 | 1986-05-09 | Unilever Plc | Apparatus for use in electrical, e.g. electrochemical, measurement procedures, and its production and use, and composite assemblies incorporating the apparatus |
| DD229500A1 (en) | 1984-12-05 | 1985-11-06 | Mueller Emil Dipl Chem Dr | DIGITAL PULSE DELIVERY FOR ELECTROCHEMICAL POTENTIAL LEAK MEASUREMENTS |
| US4713347A (en) | 1985-01-14 | 1987-12-15 | Sensor Diagnostics, Inc. | Measurement of ligand/anti-ligand interactions using bulk conductance |
| US4746607A (en) | 1985-02-07 | 1988-05-24 | Eastman Kodak Company | Use of substituted quinone electron transfer agents in analytical determinations |
| GB8504521D0 (en) | 1985-02-21 | 1985-03-27 | Genetics Int Inc | Electrochemical assay |
| US5279294A (en) | 1985-04-08 | 1994-01-18 | Cascade Medical, Inc. | Medical diagnostic system |
| US4652830A (en) | 1985-04-18 | 1987-03-24 | Eg&G Ocean Products, Inc. | Analyzer for comparative measurements of bulk conductivity |
| US4671288A (en) | 1985-06-13 | 1987-06-09 | The Regents Of The University Of California | Electrochemical cell sensor for continuous short-term use in tissues and blood |
| US4897173A (en) | 1985-06-21 | 1990-01-30 | Matsushita Electric Industrial Co., Ltd. | Biosensor and method for making the same |
| US4938860A (en) | 1985-06-28 | 1990-07-03 | Miles Inc. | Electrode for electrochemical sensors |
| US4686479A (en) | 1985-07-22 | 1987-08-11 | Young Chung C | Apparatus and control kit for analyzing blood sample values including hematocrit |
| US4806312A (en) | 1985-08-28 | 1989-02-21 | Miles Inc. | Multizone analytical element having detectable signal concentrating zone |
| US4806311A (en) | 1985-08-28 | 1989-02-21 | Miles Inc. | Multizone analytical element having labeled reagent concentration zone |
| US4734184A (en) | 1985-08-29 | 1988-03-29 | Diamond Sensor Systems, Inc. | Self-activating hydratable solid-state electrode apparatus |
| US4805624A (en) | 1985-09-09 | 1989-02-21 | The Montefiore Hospital Association Of Western Pa | Low-potential electrochemical redox sensors |
| EP0215669A3 (en) | 1985-09-17 | 1989-08-30 | Seiko Instruments Inc. | Analytical device and method for analysis of biochemicals, microbes and cells |
| US4680268A (en) | 1985-09-18 | 1987-07-14 | Children's Hospital Medical Center | Implantable gas-containing biosensor and method for measuring an analyte such as glucose |
| US5500350A (en) | 1985-10-30 | 1996-03-19 | Celltech Limited | Binding assay device |
| JPH028826Y2 (en) | 1985-11-09 | 1990-03-02 | ||
| CA1254616A (en) | 1985-11-11 | 1989-05-23 | Calum J. Mcneil | Electrochemical enzymic assay procedures |
| US4714874A (en) | 1985-11-12 | 1987-12-22 | Miles Inc. | Test strip identification and instrument calibration |
| US4935106A (en) | 1985-11-15 | 1990-06-19 | Smithkline Diagnostics, Inc. | Ion selective/enzymatic electrode medical analyzer device and method of use |
| US4729959A (en) | 1986-02-24 | 1988-03-08 | Streck Laboratories, Inc. | Glucose reference control for glucose test strips |
| JPS62209350A (en) | 1986-03-11 | 1987-09-14 | Iwao Tabuse | Molecule confirmative organic thin film, its preparation and chemical sensor using said thin film |
| GB8608700D0 (en) | 1986-04-10 | 1986-05-14 | Genetics Int Inc | Measurement of electroactive species in solution |
| US4795542A (en) | 1986-04-24 | 1989-01-03 | St. Jude Medical, Inc. | Electrochemical concentration detector device |
| US5066372A (en) | 1986-05-02 | 1991-11-19 | Ciba Corning Diagnostics Corp. | Unitary multiple electrode sensor |
| US4703756A (en) | 1986-05-06 | 1987-11-03 | The Regents Of The University Of California | Complete glucose monitoring system with an implantable, telemetered sensor module |
| GB2190035A (en) | 1986-05-08 | 1987-11-11 | Polysystems Machinery Manufact | Film extrustion die-lip heater |
| US4731726A (en) | 1986-05-19 | 1988-03-15 | Healthware Corporation | Patient-operated glucose monitor and diabetes management system |
| GB8612861D0 (en) | 1986-05-27 | 1986-07-02 | Cambridge Life Sciences | Immobilised enzyme biosensors |
| US4750496A (en) | 1987-01-28 | 1988-06-14 | Xienta, Inc. | Method and apparatus for measuring blood glucose concentration |
| JPS636451A (en) | 1986-06-27 | 1988-01-12 | Terumo Corp | Enzyme sensor |
| GB8618022D0 (en) | 1986-07-23 | 1986-08-28 | Unilever Plc | Electrochemical measurements |
| US5059394A (en) | 1986-08-13 | 1991-10-22 | Lifescan, Inc. | Analytical device for the automated determination of analytes in fluids |
| US5049487A (en) | 1986-08-13 | 1991-09-17 | Lifescan, Inc. | Automated initiation of timing of reflectance readings |
| US4935346A (en) | 1986-08-13 | 1990-06-19 | Lifescan, Inc. | Minimum procedure system for the determination of analytes |
| US4894137A (en) | 1986-09-12 | 1990-01-16 | Omron Tateisi Electronics Co. | Enzyme electrode |
| US4865873A (en) | 1986-09-15 | 1989-09-12 | General Electric Company | Electroless deposition employing laser-patterned masking layer |
| ES2036564T3 (en) | 1986-12-05 | 1993-06-01 | Sumitomo Electric Industries, Ltd. | AUTOMATIC CALIBRATION DEVICE FOR A SENSOR FOR MEASURING THE PARTIAL PRESSURE OF A GAS. |
| JPH039267Y2 (en) | 1986-12-27 | 1991-03-07 | ||
| JPS63198861A (en)* | 1987-02-13 | 1988-08-17 | Omron Tateisi Electronics Co | Method for electrochemical measurement of solute concentration |
| GB2201248B (en) | 1987-02-24 | 1991-04-17 | Ici Plc | Enzyme electrode sensors |
| US4929330A (en) | 1987-03-31 | 1990-05-29 | Daikin Industries, Ltd. | Diffusion-limiting membrane holding means for sensor |
| US4759828A (en) | 1987-04-09 | 1988-07-26 | Nova Biomedical Corporation | Glucose electrode and method of determining glucose |
| CA1315181C (en) | 1987-04-13 | 1993-03-30 | Joel M. Blatt | Test strip device with volume metering capillary gap |
| US4956275A (en) | 1987-04-14 | 1990-09-11 | Molecular Devices Corporation | Migratory detection immunoassay |
| EP0290683A3 (en) | 1987-05-01 | 1988-12-14 | Diva Medical Systems B.V. | Diabetes management system and apparatus |
| DE3715938A1 (en) | 1987-05-13 | 1988-11-24 | Boehringer Mannheim Gmbh | CONTAINER FOR TEST STRIP |
| US4975647A (en) | 1987-06-01 | 1990-12-04 | Nova Biomedical Corporation | Controlling machine operation with respect to consumable accessory units |
| US4797256A (en) | 1987-06-05 | 1989-01-10 | Boehringer Mannheim Corporation | Registration device for blood test strips |
| US5447837A (en) | 1987-08-05 | 1995-09-05 | Calypte, Inc. | Multi-immunoassay diagnostic system for antigens or antibodies or both |
| US4940945A (en) | 1987-11-02 | 1990-07-10 | Biologix Inc. | Interface circuit for use in a portable blood chemistry measuring apparatus |
| DE3742786A1 (en) | 1987-12-17 | 1989-06-29 | Boehringer Mannheim Gmbh | ANALYSIS SYSTEM FOR DETERMINING A COMPONENT OF A LIQUID |
| US4832814A (en) | 1987-12-28 | 1989-05-23 | E. I. Du Pont De Nemours And Company | Electrofusion cell and method of making the same |
| US4877580A (en) | 1988-02-09 | 1989-10-31 | Technimed Corporation | Assay kit including an analyte test strip and a color comparator |
| US5126247A (en) | 1988-02-26 | 1992-06-30 | Enzymatics, Inc. | Method, system and devices for the assay and detection of biochemical molecules |
| DD271179A1 (en) | 1988-03-03 | 1989-08-23 | Univ Rostock | DEVICE FOR THE ELECTROCHEMICAL DETERMINATION OF AMMONIA IN GASES |
| USRE36268E (en) | 1988-03-15 | 1999-08-17 | Boehringer Mannheim Corporation | Method and apparatus for amperometric diagnostic analysis |
| US5128015A (en) | 1988-03-15 | 1992-07-07 | Tall Oak Ventures | Method and apparatus for amperometric diagnostic analysis |
| US5108564A (en) | 1988-03-15 | 1992-04-28 | Tall Oak Ventures | Method and apparatus for amperometric diagnostic analysis |
| DE68924026T3 (en) | 1988-03-31 | 2008-01-10 | Matsushita Electric Industrial Co., Ltd., Kadoma | BIOSENSOR AND ITS MANUFACTURE. |
| US4954087A (en) | 1988-04-27 | 1990-09-04 | I-Stat Corporation | Static-free interrogating connector for electric components |
| US5112758A (en) | 1988-05-09 | 1992-05-12 | Epitope, Inc. | Treating body fluids for diagnostic testing |
| JPH028826A (en) | 1988-06-28 | 1990-01-12 | Canon Inc | Camera with auto bracket function |
| US5075077A (en) | 1988-08-02 | 1991-12-24 | Abbott Laboratories | Test card for performing assays |
| ES2085854T3 (en) | 1988-08-02 | 1996-06-16 | Abbott Lab | METHOD AND DEVICE FOR THE PRODUCTION OF CALIBRATION DATA FOR ANALYSIS. |
| DE3826922A1 (en) | 1988-08-09 | 1990-02-22 | Boehringer Mannheim Gmbh | PROCESS FOR THE COLOR-RIMETRIC DETERMINATION OF AN ANALYTE BY ENZYMATIC OXIDATION |
| US4883455A (en) | 1988-09-13 | 1989-11-28 | Minnesota Mining And Manufacturing Company | Cardioplegia administration set |
| US5096669A (en) | 1988-09-15 | 1992-03-17 | I-Stat Corporation | Disposable sensing device for real time fluid analysis |
| JPH02120657A (en) | 1988-10-31 | 1990-05-08 | A & D Co Ltd | Concentration measuring sensor and sensor receiving member |
| EP0411068A4 (en) | 1988-11-08 | 1992-01-15 | Applied Biosystems, Inc. | Assayomate |
| US5439826A (en) | 1988-12-02 | 1995-08-08 | Bio-Tek Instruments, Inc. | Method of distinguishing among strips for different assays in an automated instrument |
| IL88618A (en) | 1988-12-07 | 1993-02-21 | Bromine Compounds Ltd | Chiral cyanohydrination of m-phenoxybenzaldehyde over polymer-supported cyclo (phenylalanyl- histidine) |
| US5039618A (en) | 1989-02-02 | 1991-08-13 | Hybrivet Systems, Inc. | Test swab cartridge type device and method for detecting lead and cadmium |
| US5118183A (en) | 1989-02-10 | 1992-06-02 | X-Rite, Incorporated | Automated strip reader densitometer |
| JP2654682B2 (en) | 1989-02-17 | 1997-09-17 | 富士写真フイルム株式会社 | Biochemical analyzer, biochemical analysis correction method and correction value recording medium |
| US5269891A (en) | 1989-03-09 | 1993-12-14 | Novo Nordisk A/S | Method and apparatus for determination of a constituent in a fluid |
| US5312762A (en) | 1989-03-13 | 1994-05-17 | Guiseppi Elie Anthony | Method of measuring an analyte by measuring electrical resistance of a polymer film reacting with the analyte |
| DE3911539A1 (en) | 1989-04-08 | 1990-10-11 | Boehringer Mannheim Gmbh | TEST CARRIER ANALYSIS SYSTEM |
| US5059199A (en) | 1989-04-12 | 1991-10-22 | Olympus Optical Co., Ltd. | Treating device for endoscopes |
| US4929545A (en) | 1989-04-14 | 1990-05-29 | Boehringer Mannheim Corporation | Method and reagent for determination of an analyte via enzymatic means using a ferricyanide/ferric compound system |
| US5312590A (en) | 1989-04-24 | 1994-05-17 | National University Of Singapore | Amperometric sensor for single and multicomponent analysis |
| US4936346A (en) | 1989-04-24 | 1990-06-26 | Deere & Company | Detent mechanism for a control valve |
| US5234813A (en) | 1989-05-17 | 1993-08-10 | Actimed Laboratories, Inc. | Method and device for metering of fluid samples and detection of analytes therein |
| CH677149A5 (en) | 1989-07-07 | 1991-04-15 | Disetronic Ag | |
| US5262035A (en) | 1989-08-02 | 1993-11-16 | E. Heller And Company | Enzyme electrodes |
| US4976724A (en) | 1989-08-25 | 1990-12-11 | Lifescan, Inc. | Lancet ejector mechanism |
| US6395227B1 (en) | 1989-08-28 | 2002-05-28 | Lifescan, Inc. | Test strip for measuring analyte concentration over a broad range of sample volume |
| US5306623A (en) | 1989-08-28 | 1994-04-26 | Lifescan, Inc. | Visual blood glucose concentration test strip |
| US5620863A (en) | 1989-08-28 | 1997-04-15 | Lifescan, Inc. | Blood glucose strip having reduced side reactions |
| AU640162B2 (en) | 1989-08-28 | 1993-08-19 | Lifescan, Inc. | Blood separation and analyte detection techniques |
| US4936106A (en) | 1989-08-29 | 1990-06-26 | White Consolidated Industries, Inc. | Retractable control unit for refrigerators |
| US5018164A (en) | 1989-09-12 | 1991-05-21 | Hughes Aircraft Company | Excimer laser ablation method and apparatus for microcircuit fabrication |
| JP2665806B2 (en) | 1989-09-13 | 1997-10-22 | 株式会社豊田中央研究所 | Hematocrit measuring device |
| US5639671A (en) | 1989-09-18 | 1997-06-17 | Biostar, Inc. | Methods for optimizing of an optical assay device |
| DE69025134T2 (en) | 1989-11-24 | 1996-08-14 | Matsushita Electric Ind Co Ltd | Method of manufacturing a biosensor |
| DE3940152A1 (en) | 1989-12-05 | 1991-06-06 | Boehringer Mannheim Gmbh | TEST STRIP EVALUATOR FOR MULTIPLE TEST STRIPS |
| US4963814A (en) | 1989-12-15 | 1990-10-16 | Boehringer Mannheim Corporation | Regulated bifurcated power supply |
| US5243516A (en) | 1989-12-15 | 1993-09-07 | Boehringer Mannheim Corporation | Biosensing instrument and method |
| US4999632A (en) | 1989-12-15 | 1991-03-12 | Boehringer Mannheim Corporation | Analog to digital conversion with noise reduction |
| US4999582A (en) | 1989-12-15 | 1991-03-12 | Boehringer Mannheim Corp. | Biosensor electrode excitation circuit |
| US5508171A (en) | 1989-12-15 | 1996-04-16 | Boehringer Mannheim Corporation | Assay method with enzyme electrode system |
| EP0505494B1 (en) | 1989-12-15 | 1995-07-12 | Boehringer Mannheim Corporation | Redox mediator reagent and biosensor |
| US5286362A (en) | 1990-02-03 | 1994-02-15 | Boehringer Mannheim Gmbh | Method and sensor electrode system for the electrochemical determination of an analyte or an oxidoreductase as well as the use of suitable compounds therefor |
| DE4003194A1 (en) | 1990-02-03 | 1991-08-08 | Boehringer Mannheim Gmbh | METHOD AND SENSOR ELECTRODE SYSTEM FOR THE ELECTROCHEMICAL DETERMINATION OF AN ANALYT, OR AN OXIDOR REDUCTASE, AND USE OF SUITABLE COMPOUNDS THEREFOR |
| US5028542A (en) | 1990-02-07 | 1991-07-02 | Boehringer Mannheim Corporation | Glucose measurement control reagent and method of making the same |
| US5141850A (en) | 1990-02-07 | 1992-08-25 | Hygeia Sciences, Inc. | Porous strip form assay device method |
| US5108819A (en) | 1990-02-14 | 1992-04-28 | Eli Lilly And Company | Thin film electrical component |
| JPH03260739A (en) | 1990-03-09 | 1991-11-20 | Advantest Corp | Sequence action type logic circuit |
| JPH07101215B2 (en)* | 1990-04-11 | 1995-11-01 | 国立身体障害者リハビリテーションセンター総長 | Analytical method using biofunctional substance-immobilized electrode |
| US5187100A (en) | 1990-05-29 | 1993-02-16 | Lifescan, Inc. | Dispersion to limit penetration of aqueous solutions into a membrane |
| US5288387A (en) | 1990-06-12 | 1994-02-22 | Daikin Industries, Ltd. | Apparatus for maintaining the activity of an enzyme electrode |
| US5057447A (en) | 1990-07-09 | 1991-10-15 | Texas Instruments Incorporated | Silicide/metal floating gate process |
| US5250439A (en) | 1990-07-19 | 1993-10-05 | Miles Inc. | Use of conductive sensors in diagnostic assays |
| US5202261A (en) | 1990-07-19 | 1993-04-13 | Miles Inc. | Conductive sensors and their use in diagnostic assays |
| US5320732A (en) | 1990-07-20 | 1994-06-14 | Matsushita Electric Industrial Co., Ltd. | Biosensor and measuring apparatus using the same |
| JPH0820412B2 (en) | 1990-07-20 | 1996-03-04 | 松下電器産業株式会社 | Quantitative analysis method and device using disposable sensor |
| US5112455A (en) | 1990-07-20 | 1992-05-12 | I Stat Corporation | Method for analytically utilizing microfabricated sensors during wet-up |
| US5182707A (en) | 1990-07-23 | 1993-01-26 | Healthdyne, Inc. | Apparatus for recording reagent test strip data by comparison to color lights on a reference panel |
| US5569591A (en) | 1990-08-03 | 1996-10-29 | University College Of Wales Aberystwyth | Analytical or monitoring apparatus and method |
| US5120421A (en) | 1990-08-31 | 1992-06-09 | The United States Of America As Represented By The United States Department Of Energy | Electrochemical sensor/detector system and method |
| US5526808A (en) | 1990-10-04 | 1996-06-18 | Microcor, Inc. | Method and apparatus for noninvasively determining hematocrit |
| US5642734A (en) | 1990-10-04 | 1997-07-01 | Microcor, Inc. | Method and apparatus for noninvasively determining hematocrit |
| HU9301278D0 (en) | 1990-10-30 | 1993-09-28 | Hypoguard Ltd | Collecting and signalling device |
| US5046618A (en) | 1990-11-19 | 1991-09-10 | R. P. Scherer Corporation | Child-resistant blister pack |
| DE4041905A1 (en) | 1990-12-27 | 1992-07-02 | Boehringer Mannheim Gmbh | TEST CARRIER ANALYSIS SYSTEM |
| DE4100727C2 (en) | 1991-01-09 | 1994-12-22 | Klein Karl Dittmar Dr | Analytical method for enzyme electrode sensors |
| FR2673183B1 (en) | 1991-02-21 | 1996-09-27 | Asulab Sa | MONO, BIS OR TRIS (2,2'-BIPYRIDINE SUBSTITUTED) COMPLEXES OF A SELECTED METAL AMONG IRON, RUTHENIUM, OSMIUM OR VANADIUM AND THEIR PREPARATION PROCESSES. |
| US5232668A (en) | 1991-02-27 | 1993-08-03 | Boehringer Mannheim Corporation | Test strip holding and reading mechanism for a meter |
| WO1992015950A1 (en) | 1991-02-27 | 1992-09-17 | Boehringer Mannheim Corporation | Method of communicating with microcomputer controlled instruments |
| US5246858A (en) | 1991-02-27 | 1993-09-21 | Boehringer Mannheim Corporation | Apparatus and method for analyzing a body fluid |
| WO1992015704A1 (en) | 1991-02-27 | 1992-09-17 | Boehringer Mannheim Corporation | Improved method and reagent for determination of an analyte |
| EP0572571B1 (en) | 1991-02-27 | 2003-12-03 | Roche Diagnostics Corporation | Apparatus and method for analyzing body fluids |
| US5192415A (en) | 1991-03-04 | 1993-03-09 | Matsushita Electric Industrial Co., Ltd. | Biosensor utilizing enzyme and a method for producing the same |
| US5593852A (en) | 1993-12-02 | 1997-01-14 | Heller; Adam | Subcutaneous glucose electrode |
| US5223117A (en) | 1991-05-03 | 1993-06-29 | Mass. Institute Of Technology | Two-terminal voltammetric microsensors |
| JP3118015B2 (en) | 1991-05-17 | 2000-12-18 | アークレイ株式会社 | Biosensor and separation and quantification method using the same |
| DE4117847A1 (en) | 1991-05-31 | 1992-12-03 | Lre Relais & Elektronik Gmbh | Evaluating bar coded optical information - subjecting output from sensor to peak and min. valve generation with comparison process |
| US5232516A (en) | 1991-06-04 | 1993-08-03 | Implemed, Inc. | Thermoelectric device with recuperative heat exchangers |
| GB9113211D0 (en) | 1991-06-19 | 1991-08-07 | Hypoguard Uk Ltd | Support membrane |
| GB9113212D0 (en) | 1991-06-19 | 1991-08-07 | Hypoguard Uk Ltd | Reagent mixture |
| DE4123348A1 (en) | 1991-07-15 | 1993-01-21 | Boehringer Mannheim Gmbh | ELECTROCHEMICAL ANALYSIS SYSTEM |
| US5179288A (en) | 1991-09-30 | 1993-01-12 | Ortho Pharmaceutical Corporation | Apparatus and method for measuring a bodily constituent |
| US5264103A (en) | 1991-10-18 | 1993-11-23 | Matsushita Electric Industrial Co., Ltd. | Biosensor and a method for measuring a concentration of a substrate in a sample |
| US5605662A (en) | 1993-11-01 | 1997-02-25 | Nanogen, Inc. | Active programmable electronic devices for molecular biological analysis and diagnostics |
| US5220920A (en) | 1991-11-08 | 1993-06-22 | Via Medical Corporation | Electrochemical measurement system having interference reduction circuit |
| IL103674A0 (en) | 1991-11-19 | 1993-04-04 | Houston Advanced Res Center | Method and apparatus for molecule detection |
| JPH05163139A (en) | 1991-12-12 | 1993-06-29 | Ajinomoto Co Inc | Antiarteriosclerotic agent |
| JP3135959B2 (en) | 1991-12-12 | 2001-02-19 | アークレイ株式会社 | Biosensor and separation and quantification method using the same |
| US5261411A (en) | 1991-12-27 | 1993-11-16 | Abbott Laboratories | Thermal drift correction while continuously monitoring cardiac output |
| US5334296A (en) | 1992-01-15 | 1994-08-02 | Andcare, Inc. | Peroxidase colloidal gold oxidase biosensors for mediatorless glucose determination |
| US5217594A (en) | 1992-01-15 | 1993-06-08 | Enzyme Technology Research Group, Inc. | Convenient determination of trace lead in whole blood and other fluids |
| US5468366A (en) | 1992-01-15 | 1995-11-21 | Andcare, Inc. | Colloidal-gold electrosensor measuring device |
| JP3084877B2 (en) | 1992-01-21 | 2000-09-04 | 松下電器産業株式会社 | Manufacturing method of glucose sensor |
| DE69314363T2 (en) | 1992-02-03 | 1998-02-19 | Lifescan Inc | Improved oxidative coupling dye for the spectrophotometric quantitative analysis of analytes |
| US5391272A (en) | 1992-03-06 | 1995-02-21 | Andcare, Inc. | Electrochemical immunoassay methods |
| US5635364A (en) | 1992-03-27 | 1997-06-03 | Abbott Laboratories | Assay verification control for an automated analytical system |
| AU4032793A (en) | 1992-04-21 | 1993-11-18 | Tadeusz Malinski | Nitric oxide sensor |
| US5603820A (en) | 1992-04-21 | 1997-02-18 | The United States Of America As Represented By The Department Of Health And Human Services | Nitric oxide sensor |
| WO1993021928A1 (en) | 1992-04-24 | 1993-11-11 | Streck Laboratories, Inc. | Liquid glucose control solution and process of making the same |
| US5232667A (en) | 1992-05-21 | 1993-08-03 | Diametrics Medical, Inc. | Temperature control for portable diagnostic system using a non-contact temperature probe |
| US5710011A (en) | 1992-06-05 | 1998-01-20 | Medisense, Inc. | Mediators to oxidoreductase enzymes |
| GB9212010D0 (en) | 1992-06-05 | 1992-07-15 | Medisense Inc | Mediators to oxidoreductase enzymes |
| US5353351A (en) | 1992-06-09 | 1994-10-04 | At&T Bell Laboratories | Secure teleconferencing |
| GB9215733D0 (en) | 1992-07-24 | 1992-09-09 | British Tech Group | Method of and apparatus for determining a property of a sample |
| US6303691B1 (en) | 1992-07-31 | 2001-10-16 | Exxon Mobil Chemical Patents Inc. | Impact modification of polyamides |
| JP2541081B2 (en) | 1992-08-28 | 1996-10-09 | 日本電気株式会社 | Biosensor and method of manufacturing and using biosensor |
| US5508200A (en) | 1992-10-19 | 1996-04-16 | Tiffany; Thomas | Method and apparatus for conducting multiple chemical assays |
| US5387327A (en) | 1992-10-19 | 1995-02-07 | Duquesne University Of The Holy Ghost | Implantable non-enzymatic electrochemical glucose sensor |
| US5342790A (en) | 1992-10-30 | 1994-08-30 | Becton Dickinson And Company | Apparatus for indirect fluorescent assay of blood samples |
| US5389215A (en) | 1992-11-05 | 1995-02-14 | Nippon Telegraph And Telephone Corporation | Electrochemical detection method and apparatus therefor |
| JP2954436B2 (en) | 1992-11-11 | 1999-09-27 | 株式会社日立製作所 | Test piece supply device and analyzer using the same |
| US6168563B1 (en) | 1992-11-17 | 2001-01-02 | Health Hero Network, Inc. | Remote health monitoring and maintenance system |
| US5371687A (en) | 1992-11-20 | 1994-12-06 | Boehringer Mannheim Corporation | Glucose test data acquisition and management system |
| ZA938555B (en) | 1992-11-23 | 1994-08-02 | Lilly Co Eli | Technique to improve the performance of electrochemical sensors |
| FR2699170B1 (en) | 1992-12-15 | 1995-07-28 | Asulab Sa | Complexes of a transition metal with 2,2'-bipyridine ligands substituted by at least one alkyl ammonium radical, their manufacturing process and their use as redox mediator. |
| US5344754A (en) | 1993-01-13 | 1994-09-06 | Avocet Medical, Inc. | Assay timed by electrical resistance change and test strip |
| US5515847A (en) | 1993-01-28 | 1996-05-14 | Optiscan, Inc. | Self-emission noninvasive infrared spectrophotometer |
| FR2701117B1 (en) | 1993-02-04 | 1995-03-10 | Asulab Sa | Electrochemical measurement system with multizone sensor, and its application to glucose measurement. |
| JPH06235760A (en)* | 1993-02-10 | 1994-08-23 | Hitachi Ltd | Nuclear magnetic resonance apparatus and method for automatically setting measurement conditions of this apparatus |
| IL109159A (en) | 1993-03-29 | 2003-11-23 | Isk Biotech Corp | Immunoassays for tetrachloroiso-phthalonitrile and its metabolites and antibodies for use therein |
| DE4310583A1 (en) | 1993-03-31 | 1994-10-06 | Boehringer Mannheim Gmbh | Test strip analysis system |
| GB9307347D0 (en) | 1993-04-07 | 1993-06-02 | Ecossensors Ltd | Biological species detection method and biosensor thereof |
| DE59410388D1 (en) | 1993-04-23 | 2004-10-21 | Roche Diagnostics Gmbh | Floppy disk with test elements arranged in a circle |
| DE4313253A1 (en) | 1993-04-23 | 1994-10-27 | Boehringer Mannheim Gmbh | System for analyzing the contents of liquid samples |
| US5376254A (en) | 1993-05-14 | 1994-12-27 | Fisher; Arkady V. | Potentiometric electrochemical device for qualitative and quantitative analysis |
| US5843691A (en) | 1993-05-15 | 1998-12-01 | Lifescan, Inc. | Visually-readable reagent test strip |
| ATE156270T1 (en) | 1993-05-29 | 1997-08-15 | Cambridge Life Sciences | SENSORS BASED ON POLYMER CONVERSION |
| DE4318519C2 (en) | 1993-06-03 | 1996-11-28 | Fraunhofer Ges Forschung | Electrochemical sensor |
| US5385846A (en) | 1993-06-03 | 1995-01-31 | Boehringer Mannheim Corporation | Biosensor and method for hematocrit determination |
| DE4318891A1 (en) | 1993-06-07 | 1994-12-08 | Mannesmann Ag | Electrochemical gas trace measuring system with function control |
| ES2153335T3 (en) | 1993-06-08 | 2006-09-01 | Roche Diagnostics Operations, Inc. | BIOSENSOR METER THAT DETECTS THE PROPER ADJUSTMENT OF THE ELECTRODES AND DISTINGUISHES SAMPLING STRIPS AND CHECKING STRIPS. |
| US5352351A (en) | 1993-06-08 | 1994-10-04 | Boehringer Mannheim Corporation | Biosensing meter with fail/safe procedures to prevent erroneous indications |
| US5405511A (en) | 1993-06-08 | 1995-04-11 | Boehringer Mannheim Corporation | Biosensing meter with ambient temperature estimation method and system |
| US5366609A (en) | 1993-06-08 | 1994-11-22 | Boehringer Mannheim Corporation | Biosensing meter with pluggable memory key |
| US5403462A (en) | 1993-06-24 | 1995-04-04 | Yissum Research Development Company Of The Hebrew Univeristy Of Jerusalem | Electrochemical electrodes and methods for the preparation thereof |
| JPH0716224A (en)* | 1993-06-30 | 1995-01-20 | Shimadzu Corp | Ultrasonic transmission inspection device |
| DE4323672A1 (en) | 1993-07-15 | 1995-01-19 | Boehringer Mannheim Gmbh | Device for the simultaneous determination of analytes |
| US5413690A (en) | 1993-07-23 | 1995-05-09 | Boehringer Mannheim Corporation | Potentiometric biosensor and the method of its use |
| US5658443A (en) | 1993-07-23 | 1997-08-19 | Matsushita Electric Industrial Co., Ltd. | Biosensor and method for producing the same |
| GB2296571B (en) | 1993-07-26 | 1998-02-11 | Phase Dynamics Inc | System and method for monitoring substances and reactions |
| US5748002A (en) | 1996-01-26 | 1998-05-05 | Phase Dynamics Inc. | RF probe for montoring composition of substances |
| US5410474A (en) | 1993-07-27 | 1995-04-25 | Miles Inc. | Buttonless memory system for an electronic measurement device |
| US5792668A (en) | 1993-08-06 | 1998-08-11 | Solid State Farms, Inc. | Radio frequency spectral analysis for in-vitro or in-vivo environments |
| US5508203A (en) | 1993-08-06 | 1996-04-16 | Fuller; Milton E. | Apparatus and method for radio frequency spectroscopy using spectral analysis |
| WO1995006240A1 (en) | 1993-08-24 | 1995-03-02 | Metrika Laboratories, Inc. | Novel disposable electronic assay device |
| US5837546A (en) | 1993-08-24 | 1998-11-17 | Metrika, Inc. | Electronic assay device and method |
| US5427912A (en) | 1993-08-27 | 1995-06-27 | Boehringer Mannheim Corporation | Electrochemical enzymatic complementation immunoassay |
| US5494831A (en) | 1993-08-30 | 1996-02-27 | Hughes Aircraft Company | Electrochemical immunosensor system and methods |
| EP0775311B1 (en) | 1993-08-31 | 2002-07-03 | Roche Diagnostics Corporation | Analog heater control for medical instrument |
| JPH09502119A (en) | 1993-08-31 | 1997-03-04 | ベーリンガー・マンハイム・コーポレーション | Power supply monitoring and control device for medical equipment |
| US5526111A (en) | 1993-08-31 | 1996-06-11 | Boehringer Mannheim Corporation | Method and apparatus for calculating a coagulation characteristic of a sample of blood a blood fraction or a control |
| US5522255A (en) | 1993-08-31 | 1996-06-04 | Boehringer Mannheim Corporation | Fluid dose, flow and coagulation sensor for medical instrument |
| FR2710413B1 (en) | 1993-09-21 | 1995-11-03 | Asulab Sa | Measuring device for removable sensors. |
| US5437772A (en) | 1993-11-01 | 1995-08-01 | The Electrosynthesis Co., Inc. | Portable lead detector |
| JPH07128338A (en) | 1993-11-02 | 1995-05-19 | Kyoto Daiichi Kagaku:Kk | Convenient blood sugar meter and data managing method therefor |
| DE69432430T2 (en) | 1993-11-12 | 2003-12-24 | Roche Diagnostics Corp., Indianapolis | GLUCOSE CALIBRATOR AND CONTROL MATERIAL FOR TEST STRIPS |
| CA2175907A1 (en) | 1993-11-12 | 1995-05-18 | Myron Rapkin | Glucose control material for test strips |
| US5589326A (en) | 1993-12-30 | 1996-12-31 | Boehringer Mannheim Corporation | Osmium-containing redox mediator |
| US5421189A (en) | 1994-01-21 | 1995-06-06 | Ciba Corning Diagnostics Corp. | Electrical connection system for electrochemical sensors |
| US5762770A (en)* | 1994-02-21 | 1998-06-09 | Boehringer Mannheim Corporation | Electrochemical biosensor test strip |
| US5437999A (en) | 1994-02-22 | 1995-08-01 | Boehringer Mannheim Corporation | Electrochemical sensor |
| US5536249A (en) | 1994-03-09 | 1996-07-16 | Visionary Medical Products, Inc. | Pen-type injector with a microprocessor and blood characteristic monitor |
| AUPM506894A0 (en) | 1994-04-14 | 1994-05-05 | Memtec Limited | Novel electrochemical cells |
| DE4417245A1 (en) | 1994-04-23 | 1995-10-26 | Lpkf Cad Cam Systeme Gmbh | High resolution structured metallisation prodn. |
| JP3331253B2 (en) | 1994-05-10 | 2002-10-07 | バイエルコーポレーション | Test strip removal device for automatic analyzer |
| US6322676B1 (en) | 1998-03-25 | 2001-11-27 | University Of Iowa Research Foundation | Magnetic composites exhibiting distinct flux properties due to gradient interfaces |
| JP3027306B2 (en) | 1994-06-02 | 2000-04-04 | 松下電器産業株式会社 | Biosensor and manufacturing method thereof |
| DE4422068A1 (en) | 1994-06-23 | 1996-01-04 | Siemens Ag | Electro-catalytic glucose sensor in catheter form |
| US5429735A (en) | 1994-06-27 | 1995-07-04 | Miles Inc. | Method of making and amperometric electrodes |
| EP0690306A1 (en) | 1994-06-28 | 1996-01-03 | Mochida Pharmaceutical Co., Ltd. | Method and device for specific binding assay |
| US5700695A (en) | 1994-06-30 | 1997-12-23 | Zia Yassinzadeh | Sample collection and manipulation method |
| US5477326A (en) | 1994-06-30 | 1995-12-19 | Bayer Corporation | Spectrophotometer arrangement with multi-detector readhead |
| GB9415499D0 (en) | 1994-08-01 | 1994-09-21 | Bartlett Philip N | Electrodes and their use in analysis |
| US6949179B2 (en) | 1994-08-25 | 2005-09-27 | University Of Iowa Research Foundation | Methods for forming magnetically modified electrodes and articles produced thereby |
| US6001248A (en) | 1994-08-25 | 1999-12-14 | The University Of Iowa Research Foundation | Gradient interface magnetic composites and systems therefor |
| MX9701792A (en) | 1994-09-08 | 1997-06-28 | Johnson & Johnson | Optically readable strip for analyte detection having on-strip standard. |
| US5563031A (en) | 1994-09-08 | 1996-10-08 | Lifescan, Inc. | Highly stable oxidative coupling dye for spectrophotometric determination of analytes |
| US5922530A (en) | 1994-09-08 | 1999-07-13 | Lifescan, Inc. | Stable coupling dye for photometric determination of analytes |
| US5526120A (en) | 1994-09-08 | 1996-06-11 | Lifescan, Inc. | Test strip with an asymmetrical end insuring correct insertion for measuring |
| US6335203B1 (en) | 1994-09-08 | 2002-01-01 | Lifescan, Inc. | Optically readable strip for analyte detection having on-strip orientation index |
| GB9419882D0 (en) | 1994-10-03 | 1994-11-16 | Mcnaughtan Arthur | Electrochemical detection system |
| DE4437274C2 (en) | 1994-10-18 | 1998-11-05 | Inst Chemo Biosensorik | Analyte selective sensor |
| US5597532A (en) | 1994-10-20 | 1997-01-28 | Connolly; James | Apparatus for determining substances contained in a body fluid |
| US5504011A (en) | 1994-10-21 | 1996-04-02 | International Technidyne Corporation | Portable test apparatus and associated method of performing a blood coagulation test |
| IE72524B1 (en) | 1994-11-04 | 1997-04-23 | Elan Med Tech | Analyte-controlled liquid delivery device and analyte monitor |
| US5572159A (en) | 1994-11-14 | 1996-11-05 | Nexgen, Inc. | Voltage-controlled delay element with programmable delay |
| AUPM950094A0 (en) | 1994-11-16 | 1994-12-08 | Australian Membrane And Biotechnology Research Institute | Detection device and method |
| US5644501A (en) | 1994-12-06 | 1997-07-01 | Lin; Shengfu | Method of using a computer to collect chemical signals directly |
| DE4445947C2 (en) | 1994-12-22 | 1998-03-12 | Draegerwerk Ag | Process for the detection of sources of error in amperometric measuring cells |
| US5575403A (en) | 1995-01-13 | 1996-11-19 | Bayer Corporation | Dispensing instrument for fluid monitoring sensors |
| US5630986A (en) | 1995-01-13 | 1997-05-20 | Bayer Corporation | Dispensing instrument for fluid monitoring sensors |
| US5569608A (en) | 1995-01-30 | 1996-10-29 | Bayer Corporation | Quantitative detection of analytes on immunochromatographic strips |
| US6153069A (en) | 1995-02-09 | 2000-11-28 | Tall Oak Ventures | Apparatus for amperometric Diagnostic analysis |
| EP0727925A1 (en) | 1995-02-14 | 1996-08-21 | Lpkf Cad/Cam Systeme Gmbh | Process for structured metallizing of the surface of substrates |
| US5620890A (en) | 1995-03-14 | 1997-04-15 | The United States Of America As Represented By The Secretary Of Agriculture | Monoclonal antibodies to hygromycin B and the method of making the same |
| US5582697A (en) | 1995-03-17 | 1996-12-10 | Matsushita Electric Industrial Co., Ltd. | Biosensor, and a method and a device for quantifying a substrate in a sample liquid using the same |
| US5650062A (en) | 1995-03-17 | 1997-07-22 | Matsushita Electric Industrial Co., Ltd. | Biosensor, and a method and a device for quantifying a substrate in a sample liquid using the same |
| US6170318B1 (en) | 1995-03-27 | 2001-01-09 | California Institute Of Technology | Methods of use for sensor based fluid detection devices |
| US5788833A (en) | 1995-03-27 | 1998-08-04 | California Institute Of Technology | Sensors for detecting analytes in fluids |
| US5571401A (en) | 1995-03-27 | 1996-11-05 | California Institute Of Technology | Sensor arrays for detecting analytes in fluids |
| US6537498B1 (en) | 1995-03-27 | 2003-03-25 | California Institute Of Technology | Colloidal particles used in sensing arrays |
| JP3498105B2 (en) | 1995-04-07 | 2004-02-16 | アークレイ株式会社 | Sensor, method for manufacturing the same, and measuring method using the sensor |
| US5554269A (en) | 1995-04-11 | 1996-09-10 | Gas Research Institute | Nox sensor using electrochemical reactions and differential pulse voltammetry (DPV) |
| GB9507991D0 (en) | 1995-04-19 | 1995-06-07 | Univ Manchester Metropolitan | Sensor |
| US5620579A (en) | 1995-05-05 | 1997-04-15 | Bayer Corporation | Apparatus for reduction of bias in amperometric sensors |
| US5520786A (en) | 1995-06-06 | 1996-05-28 | Bayer Corporation | Mediators suitable for the electrochemical regeneration of NADH, NADPH or analogs thereof |
| US5656502A (en) | 1995-06-07 | 1997-08-12 | Diagnostic Chemicals Limited | Test strip holder and method of use |
| DE19521019A1 (en) | 1995-06-13 | 1996-12-19 | Boehringer Mannheim Gmbh | Method and means for the simultaneous colorimetric and electrochemical measurement of an analyte |
| AUPN363995A0 (en) | 1995-06-19 | 1995-07-13 | Memtec Limited | Electrochemical cell |
| US5856174A (en) | 1995-06-29 | 1999-01-05 | Affymetrix, Inc. | Integrated nucleic acid diagnostic device |
| US5698083A (en) | 1995-08-18 | 1997-12-16 | Regents Of The University Of California | Chemiresistor urea sensor |
| US5786584A (en) | 1995-09-06 | 1998-07-28 | Eli Lilly And Company | Vial and cartridge reading device providing audio feedback for a blood glucose monitoring system |
| US5658802A (en) | 1995-09-07 | 1997-08-19 | Microfab Technologies, Inc. | Method and apparatus for making miniaturized diagnostic arrays |
| US5650061A (en) | 1995-09-18 | 1997-07-22 | The Regents Of The University Of California | Large amplitude sinusoidal voltammetry |
| US5665215A (en) | 1995-09-25 | 1997-09-09 | Bayer Corporation | Method and apparatus for making predetermined events with a biosensor |
| JPH0989832A (en) | 1995-09-26 | 1997-04-04 | Kdk Corp | Ion selective electrode and ion analysis employing it |
| US5628890A (en) | 1995-09-27 | 1997-05-13 | Medisense, Inc. | Electrochemical sensor |
| US6689265B2 (en) | 1995-10-11 | 2004-02-10 | Therasense, Inc. | Electrochemical analyte sensors using thermostable soybean peroxidase |
| AU722471B2 (en) | 1995-10-17 | 2000-08-03 | Lifescan, Inc. | Blood glucose strip having reduced sensitivity to hematocrit |
| US6058934A (en) | 1995-11-02 | 2000-05-09 | Chiron Diagnostics Corporation | Planar hematocrit sensor incorporating a seven-electrode conductivity measurement cell |
| US6638415B1 (en) | 1995-11-16 | 2003-10-28 | Lifescan, Inc. | Antioxidant sensor |
| US6174420B1 (en) | 1996-11-15 | 2001-01-16 | Usf Filtration And Separations Group, Inc. | Electrochemical cell |
| US6521110B1 (en) | 1995-11-16 | 2003-02-18 | Lifescan, Inc. | Electrochemical cell |
| AUPN661995A0 (en)* | 1995-11-16 | 1995-12-07 | Memtec America Corporation | Electrochemical cell 2 |
| JPH09207343A (en) | 1995-11-29 | 1997-08-12 | Matsushita Electric Ind Co Ltd | Laser processing method |
| FR2742543B1 (en) | 1995-12-19 | 1998-02-13 | Univ Geneve | RELIABLE INTEGRATED ELECTROCHEMICAL MICROSENSORS AND MICROSYSTEMS FOR DIRECT CHEMICAL ANALYSIS OF COMPOUNDS IN AQUEOUS COMPLEX MEDIA |
| JP3365184B2 (en) | 1996-01-10 | 2003-01-08 | 松下電器産業株式会社 | Biosensor |
| US5755954A (en) | 1996-01-17 | 1998-05-26 | Technic, Inc. | Method of monitoring constituents in electroless plating baths |
| CA2245664A1 (en) | 1996-02-08 | 1997-08-14 | Australian Membrane And Biotechnology Research Institute | Enzyme detection biosensors |
| US5989917A (en) | 1996-02-13 | 1999-11-23 | Selfcare, Inc. | Glucose monitor and test strip containers for use in same |
| US5605837A (en) | 1996-02-14 | 1997-02-25 | Lifescan, Inc. | Control solution for a blood glucose monitor |
| US5708247A (en) | 1996-02-14 | 1998-01-13 | Selfcare, Inc. | Disposable glucose test strips, and methods and compositions for making same |
| US6241862B1 (en) | 1996-02-14 | 2001-06-05 | Inverness Medical Technology, Inc. | Disposable test strips with integrated reagent/blood separation layer |
| DE19605583A1 (en) | 1996-02-15 | 1997-08-21 | Bayer Ag | Electrochemical sensors with improved selectivity and increased sensitivity |
| JP3370504B2 (en) | 1996-03-13 | 2003-01-27 | 松下電器産業株式会社 | Biosensor |
| US5801057A (en) | 1996-03-22 | 1998-09-01 | Smart; Wilson H. | Microsampling device and method of construction |
| US5723284A (en) | 1996-04-01 | 1998-03-03 | Bayer Corporation | Control solution and method for testing the performance of an electrochemical device for determining the concentration of an analyte in blood |
| US6399023B1 (en) | 1996-04-16 | 2002-06-04 | Caliper Technologies Corp. | Analytical system and method |
| GB9607898D0 (en) | 1996-04-17 | 1996-06-19 | British Nuclear Fuels Plc | Improvements in and relating to sensors |
| JP3828578B2 (en) | 1996-04-22 | 2006-10-04 | イムラ・ジャパン株式会社 | CO gas sensor and CO gas concentration measuring method |
| US5890489A (en) | 1996-04-23 | 1999-04-06 | Dermal Therapy (Barbados) Inc. | Method for non-invasive determination of glucose in body fluids |
| US6001307A (en) | 1996-04-26 | 1999-12-14 | Kyoto Daiichi Kagaku Co., Ltd. | Device for analyzing a sample |
| DE19758948B3 (en) | 1996-05-17 | 2013-11-14 | Roche Diagnostics Operations, Inc. | Multi-chamber tube for use in a body fluid sampling device for collecting a body fluid sample |
| DE19621241C2 (en) | 1996-05-25 | 2000-03-16 | Manfred Kessler | Membrane electrode for measuring the glucose concentration in liquids |
| FR2749307B1 (en) | 1996-05-29 | 1998-09-04 | Roquette Freres | PROCESS FOR THE PREPARATION OF D-ARABITOL |
| US5660791A (en) | 1996-06-06 | 1997-08-26 | Bayer Corporation | Fluid testing sensor for use in dispensing instrument |
| US5719667A (en) | 1996-07-30 | 1998-02-17 | Bayer Corporation | Apparatus for filtering a laser beam in an analytical instrument |
| US5883378A (en) | 1996-07-30 | 1999-03-16 | Bayer Corporation | Apparatus and methods for transmitting electrical signals indicative of optical interactions between a light beam and a flowing suspension of particles |
| US5745308A (en) | 1996-07-30 | 1998-04-28 | Bayer Corporation | Methods and apparatus for an optical illuminator assembly and its alignment |
| US5691486A (en) | 1996-07-30 | 1997-11-25 | Bayer Corporation | Apparatus and methods for selecting a variable number of test sample aliquots to mix with respective reagents |
| US6358752B1 (en) | 1996-09-27 | 2002-03-19 | Cornell Research Foundation, Inc. | Liposome-enhanced test device and method |
| US5958791A (en) | 1996-09-27 | 1999-09-28 | Innovative Biotechnologies, Inc. | Interdigitated electrode arrays for liposome-enhanced immunoassay and test device |
| US5945341A (en) | 1996-10-21 | 1999-08-31 | Bayer Corporation | System for the optical identification of coding on a diagnostic test strip |
| GB9622304D0 (en) | 1996-10-26 | 1996-12-18 | Univ Manchester | Sensor |
| US5856195A (en) | 1996-10-30 | 1999-01-05 | Bayer Corporation | Method and apparatus for calibrating a sensor element |
| US5874046A (en) | 1996-10-30 | 1999-02-23 | Raytheon Company | Biological warfare agent sensor system employing ruthenium-terminated oligonucleotides complementary to target live agent DNA sequences |
| ES2186003T3 (en) | 1996-10-30 | 2003-05-01 | Amira Medical | SYNCHRONIZED ANALYZE ANALYSIS SYSTEM. |
| US6110354A (en) | 1996-11-01 | 2000-08-29 | University Of Washington | Microband electrode arrays |
| US6632349B1 (en) | 1996-11-15 | 2003-10-14 | Lifescan, Inc. | Hemoglobin sensor |
| AU5895898A (en) | 1996-12-20 | 1998-07-17 | Gamera Bioscience Corporation | An affinity binding-based system for detecting particulates in a fluid |
| JP3460183B2 (en) | 1996-12-24 | 2003-10-27 | 松下電器産業株式会社 | Biosensor |
| FR2757949B1 (en) | 1996-12-30 | 1999-01-22 | Commissariat Energie Atomique | MICROSYSTEM FOR BIOLOGICAL ANALYSIS AND ITS MANUFACTURING METHOD |
| AU6157898A (en) | 1997-02-06 | 1998-08-26 | E. Heller & Company | Small volume (in vitro) analyte sensor |
| EP0859230A1 (en) | 1997-02-10 | 1998-08-19 | Cranfield University | Detection of analytes using electrochemistry |
| JPH10243786A (en) | 1997-03-03 | 1998-09-14 | Koji Hayade | Modified glucose dehydrogenase |
| US6391558B1 (en) | 1997-03-18 | 2002-05-21 | Andcare, Inc. | Electrochemical detection of nucleic acid sequences |
| AUPO581397A0 (en) | 1997-03-21 | 1997-04-17 | Memtec America Corporation | Sensor connection means |
| US6226081B1 (en) | 1997-03-24 | 2001-05-01 | Optikos Corporation | Optical height of fill detection system and associated methods |
| AUPO585797A0 (en) | 1997-03-25 | 1997-04-24 | Memtec America Corporation | Improved electrochemical cell |
| JP2857872B2 (en) | 1997-03-31 | 1999-02-17 | 大成歯科工業株式会社 | Dental investment |
| KR100241928B1 (en) | 1997-03-31 | 2000-03-02 | 박종근 | Determination device in which the electrode is integrally formed on the porous thin film and the quantification method using the same |
| DE19714674A1 (en) | 1997-04-09 | 1998-10-15 | Lre Technology Partner Gmbh | Test strip pack and measuring device for using one |
| US5885839A (en) | 1997-04-15 | 1999-03-23 | Lxn Corporation | Methods of determining initiation and variable end points for measuring a chemical reaction |
| TW344029B (en) | 1997-05-02 | 1998-11-01 | Nat Science Council | Electrochemical sensor for measuring the concentration of hydrogen peroxide and precursor of hydrogen peroxide in liquid and method therefor |
| US5759364A (en) | 1997-05-02 | 1998-06-02 | Bayer Corporation | Electrochemical biosensor |
| US5798031A (en) | 1997-05-12 | 1998-08-25 | Bayer Corporation | Electrochemical biosensor |
| US6391645B1 (en) | 1997-05-12 | 2002-05-21 | Bayer Corporation | Method and apparatus for correcting ambient temperature effect in biosensors |
| US5921925A (en) | 1997-05-30 | 1999-07-13 | Ndm, Inc. | Biomedical electrode having a disposable electrode and a reusable leadwire adapter that interfaces with a standard leadwire connector |
| US6040195A (en) | 1997-06-10 | 2000-03-21 | Home Diagnostics, Inc. | Diagnostic sanitary test strip |
| US6013459A (en) | 1997-06-12 | 2000-01-11 | Clinical Micro Sensors, Inc. | Detection of analytes using reorganization energy |
| JP2002505008A (en) | 1997-06-16 | 2002-02-12 | エラン コーポレーション ピーエルシー | Methods for calibrating and testing sensors for in vivo measurement of analytes and devices for use in such methods |
| US6168957B1 (en) | 1997-06-25 | 2001-01-02 | Lifescan, Inc. | Diagnostic test strip having on-strip calibration |
| US6309526B1 (en) | 1997-07-10 | 2001-10-30 | Matsushita Electric Industrial Co., Ltd. | Biosensor |
| JP3375040B2 (en) | 1997-07-29 | 2003-02-10 | 松下電器産業株式会社 | Substrate quantification method |
| CA2244332C (en) | 1997-07-30 | 2002-04-02 | Becton, Dickinson And Company | Bonding agent and method of bonding electrode to printed conductive trace |
| DE19735379B4 (en) | 1997-08-14 | 2008-06-05 | Perkinelmer Optoelectronics Gmbh | Sensor system and manufacturing process |
| US6054039A (en) | 1997-08-18 | 2000-04-25 | Shieh; Paul | Determination of glycoprotein and glycosylated hemoglobin in blood |
| US6121050A (en) | 1997-08-29 | 2000-09-19 | Han; Chi-Neng Arthur | Analyte detection systems |
| JP3552884B2 (en) | 1997-09-04 | 2004-08-11 | 沖電気工業株式会社 | Pattern for measuring overlay accuracy |
| US6061128A (en) | 1997-09-04 | 2000-05-09 | Avocet Medical, Inc. | Verification device for optical clinical assay systems |
| US6129823A (en) | 1997-09-05 | 2000-10-10 | Abbott Laboratories | Low volume electrochemical sensor |
| US6071391A (en) | 1997-09-12 | 2000-06-06 | Nok Corporation | Enzyme electrode structure |
| US6259937B1 (en) | 1997-09-12 | 2001-07-10 | Alfred E. Mann Foundation | Implantable substrate sensor |
| US6007775A (en) | 1997-09-26 | 1999-12-28 | University Of Washington | Multiple analyte diffusion based chemical sensor |
| DE19743270A1 (en) | 1997-09-30 | 1999-04-01 | Siemens Ag | Manufacturing process for a ceramic layer |
| WO1999017117A1 (en) | 1997-09-30 | 1999-04-08 | Amira Medical | Analytical device with capillary reagent carrier |
| US6001239A (en) | 1998-09-30 | 1999-12-14 | Mercury Diagnostics, Inc. | Membrane based electrochemical test device and related methods |
| FI107080B (en) | 1997-10-27 | 2001-05-31 | Nokia Mobile Phones Ltd | measuring device |
| SE9703958D0 (en) | 1997-10-29 | 1997-10-29 | Pacesetter Ab | Method and device for determination of concentration |
| US6231920B1 (en) | 1997-10-29 | 2001-05-15 | University Of Puerto Rico | Electroanalytical applications of screen-printable surfactant-induced sol-gel graphite composites |
| AU1449699A (en) | 1997-10-31 | 1999-05-24 | Technical Chemicals & Products, Inc. | Reflectometer |
| US6102872A (en) | 1997-11-03 | 2000-08-15 | Pacific Biometrics, Inc. | Glucose detector and method |
| EP1037553B1 (en) | 1997-11-12 | 2007-01-24 | Lightouch Medical, Inc. | Method for non-invasive measurement of an analyte |
| DE69811268T2 (en) | 1997-11-28 | 2003-07-10 | Provalis Dianostics Ltd | SYSTEM AND APPARATUS FOR CARRYING OUT AN ASSAY PROCEDURE |
| US6579690B1 (en) | 1997-12-05 | 2003-06-17 | Therasense, Inc. | Blood analyte monitoring through subcutaneous measurement |
| US5997817A (en) | 1997-12-05 | 1999-12-07 | Roche Diagnostics Corporation | Electrochemical biosensor test strip |
| US6069011A (en) | 1997-12-10 | 2000-05-30 | Umm Electronics, Inc. | Method for determining the application of a sample fluid on an analyte strip using first and second derivatives |
| JP2001527216A (en) | 1997-12-19 | 2001-12-25 | アミラ メディカル | Embossed test strip system |
| US7407811B2 (en) | 1997-12-22 | 2008-08-05 | Roche Diagnostics Operations, Inc. | System and method for analyte measurement using AC excitation |
| US6645368B1 (en) | 1997-12-22 | 2003-11-11 | Roche Diagnostics Corporation | Meter and method of using the meter for determining the concentration of a component of a fluid |
| US7494816B2 (en) | 1997-12-22 | 2009-02-24 | Roche Diagnostic Operations, Inc. | System and method for determining a temperature during analyte measurement |
| US7390667B2 (en) | 1997-12-22 | 2008-06-24 | Roche Diagnostics Operations, Inc. | System and method for analyte measurement using AC phase angle measurements |
| US5971923A (en) | 1997-12-31 | 1999-10-26 | Acuson Corporation | Ultrasound system and method for interfacing with peripherals |
| US6262749B1 (en) | 1997-12-31 | 2001-07-17 | Acuson Corporation | Ultrasonic system and method for data transfer, storage and/or processing |
| JP3848993B2 (en) | 1998-01-06 | 2006-11-22 | アークレイ株式会社 | Method and apparatus for measuring the amount of components in the presence of coexisting substances |
| US6394952B1 (en) | 1998-02-03 | 2002-05-28 | Adeza Biomedical Corporation | Point of care diagnostic systems |
| JP3978489B2 (en) | 1998-02-26 | 2007-09-19 | アークレイ株式会社 | Blood measuring device |
| US6206282B1 (en) | 1998-03-03 | 2001-03-27 | Pyper Products Corporation | RF embedded identification device |
| US6134461A (en) | 1998-03-04 | 2000-10-17 | E. Heller & Company | Electrochemical analyte |
| US6103033A (en) | 1998-03-04 | 2000-08-15 | Therasense, Inc. | Process for producing an electrochemical biosensor |
| CA2265119C (en) | 1998-03-13 | 2002-12-03 | Cygnus, Inc. | Biosensor, iontophoretic sampling system, and methods of use thereof |
| US6339694B1 (en) | 1998-03-30 | 2002-01-15 | Airnet Communications Corporation | Method and apparatus employing automatic RF muting and wireless remote control of RF downlink transmission for a wireless repeater |
| US6091975A (en) | 1998-04-01 | 2000-07-18 | Alza Corporation | Minimally invasive detecting device |
| DE69937326T2 (en) | 1998-04-02 | 2008-07-17 | Matsushita Electric Industrial Co., Ltd., Kadoma | METHOD FOR DETERMINING A SUBSTRATE |
| US6246966B1 (en) | 1998-04-06 | 2001-06-12 | Bayer Corporation | Method and apparatus for data management authentication in a clinical analyzer |
| DE19815684A1 (en) | 1998-04-08 | 1999-10-14 | Roche Diagnostics Gmbh | Process for the preparation of analytical aids |
| US5995236A (en) | 1998-04-13 | 1999-11-30 | Mit Development Corporation | Blood fluid characteristics analysis instrument |
| US6175752B1 (en) | 1998-04-30 | 2001-01-16 | Therasense, Inc. | Analyte monitoring device and methods of use |
| US6271044B1 (en) | 1998-05-06 | 2001-08-07 | University Of Pittsburgh Of The Commonwealth System Of Higher Education | Method and kit for detecting an analyte |
| GB2337122B (en) | 1998-05-08 | 2002-11-13 | Medisense Inc | Test strip |
| US6272364B1 (en) | 1998-05-13 | 2001-08-07 | Cygnus, Inc. | Method and device for predicting physiological values |
| DE69910003T2 (en) | 1998-05-13 | 2004-04-22 | Cygnus, Inc., Redwood City | MONITORING PHYSIOLOGICAL ANALYSIS |
| WO1999058050A1 (en) | 1998-05-13 | 1999-11-18 | Cygnus, Inc. | Signal processing for measurement of physiological analytes |
| US6526298B1 (en) | 1998-05-18 | 2003-02-25 | Abbott Laboratories | Method for the non-invasive determination of analytes in a selected volume of tissue |
| DE29809191U1 (en) | 1998-05-20 | 1998-08-13 | LRE Technology Partner GmbH, 80807 München | Test strip measuring system |
| DE19824629A1 (en) | 1998-06-02 | 1999-12-16 | Biotul Bio Instr Gmbh | Biosensor for in-situ study of reduction-oxidation processes |
| US6287595B1 (en) | 1998-06-10 | 2001-09-11 | Delsys Pharmaceuticals Corporation | Biomedical assay device |
| US6022366A (en) | 1998-06-11 | 2000-02-08 | Stat Medical Devices Inc. | Lancet having adjustable penetration depth |
| JP3874321B2 (en) | 1998-06-11 | 2007-01-31 | 松下電器産業株式会社 | Biosensor |
| US6294281B1 (en) | 1998-06-17 | 2001-09-25 | Therasense, Inc. | Biological fuel cell and method |
| EP1114395A1 (en)* | 1998-06-19 | 2001-07-11 | Equator Technologies, Inc. | Decoding an encoded image having a first resolution directly into a decoded image having a second resolution |
| JP2002518998A (en) | 1998-06-24 | 2002-07-02 | セラセンス、インク. | Multi-sensor array and method for electrochemical recognition of nucleotide sequences |
| US6656702B1 (en) | 1998-07-03 | 2003-12-02 | Matsushita Electric Industrial Co., Ltd. | Biosensor containing glucose dehydrogenase |
| US6521182B1 (en) | 1998-07-20 | 2003-02-18 | Lifescan, Inc. | Fluidic device for medical diagnostics |
| US6261519B1 (en) | 1998-07-20 | 2001-07-17 | Lifescan, Inc. | Medical diagnostic device with enough-sample indicator |
| US6162397A (en) | 1998-08-13 | 2000-12-19 | Lifescan, Inc. | Visual blood glucose test strip |
| US6281006B1 (en) | 1998-08-24 | 2001-08-28 | Therasense, Inc. | Electrochemical affinity assay |
| US6251260B1 (en) | 1998-08-24 | 2001-06-26 | Therasense, Inc. | Potentiometric sensors for analytic determination |
| US6638716B2 (en) | 1998-08-24 | 2003-10-28 | Therasense, Inc. | Rapid amperometric verification of PCR amplification of DNA |
| JP3267936B2 (en) | 1998-08-26 | 2002-03-25 | 松下電器産業株式会社 | Biosensor |
| KR100682488B1 (en) | 1998-08-26 | 2007-02-15 | 센서즈 포 메드슨 앤드 사이언스 인코포레이티드 | Optical system |
| US6087182A (en) | 1998-08-27 | 2000-07-11 | Abbott Laboratories | Reagentless analysis of biological samples |
| JP4530541B2 (en) | 1998-09-17 | 2010-08-25 | クリニカル・マイクロ・センサーズ・インコーポレイテッド | Signal detection method for analyte detection |
| US5902731A (en) | 1998-09-28 | 1999-05-11 | Lifescan, Inc. | Diagnostics based on tetrazolium compounds |
| ATE241933T1 (en) | 1998-09-30 | 2003-06-15 | Cygnus Therapeutic Systems | METHOD AND DEVICE FOR PREDICTING PHYSIOLOGICAL MEASUREMENT VALUES |
| GB9821482D0 (en) | 1998-10-03 | 1998-11-25 | Cranfield Biotech Ltd | Novel methods for measurement of individual aliphatic compounds in mixtures |
| US6591125B1 (en) | 2000-06-27 | 2003-07-08 | Therasense, Inc. | Small volume in vitro analyte sensor with diffusible or non-leachable redox mediator |
| US6338790B1 (en) | 1998-10-08 | 2002-01-15 | Therasense, Inc. | Small volume in vitro analyte sensor with diffusible or non-leachable redox mediator |
| DE19851164C2 (en) | 1998-11-06 | 2003-04-10 | Draeger Safety Ag & Co Kgaa | Method and device for operating an electrochemical measuring cell |
| KR100442906B1 (en) | 1998-11-16 | 2004-08-02 | 더 프록터 앤드 갬블 캄파니 | Ultrasonic cleaning compositions |
| US6126609A (en) | 1998-11-23 | 2000-10-03 | Keith & Rumph Inventors, Inc. | Apparatus for taking blood samples from a patient |
| US6136610A (en) | 1998-11-23 | 2000-10-24 | Praxsys Biosystems, Inc. | Method and apparatus for performing a lateral flow assay |
| CA2351398A1 (en) | 1998-11-30 | 2000-06-08 | Abbott Laboratories | Analyte test instrument having improved calibration and communication processes |
| JP4352108B2 (en)* | 1998-12-15 | 2009-10-28 | アークレイ株式会社 | Substrate quantification method |
| US6128519A (en) | 1998-12-16 | 2000-10-03 | Pepex Biomedical, Llc | System and method for measuring a bioanalyte such as lactate |
| US6414213B2 (en) | 1999-01-07 | 2002-07-02 | Showa Denko K.K. | Titanium oxide particle-coated interior member or indoor equipment |
| US6203952B1 (en) | 1999-01-14 | 2001-03-20 | 3M Innovative Properties Company | Imaged article on polymeric substrate |
| ATE202428T1 (en) | 1999-01-23 | 2001-07-15 | Ident Gmbh X | RFID TRANSPONDER WITH PRINTABLE SURFACE |
| US6246862B1 (en) | 1999-02-03 | 2001-06-12 | Motorola, Inc. | Sensor controlled user interface for portable communication device |
| US6475372B1 (en) | 2000-02-02 | 2002-11-05 | Lifescan, Inc. | Electrochemical methods and devices for use in the determination of hematocrit corrected analyte concentrations |
| US6197040B1 (en) | 1999-02-23 | 2001-03-06 | Lifescan, Inc. | Lancing device having a releasable connector |
| US6045567A (en) | 1999-02-23 | 2000-04-04 | Lifescan Inc. | Lancing device causing reduced pain |
| CA2263666A1 (en) | 1999-03-18 | 2000-09-18 | Pierre-Louis Foucault | Cable failure device |
| US6150124A (en) | 1999-05-20 | 2000-11-21 | Umm Electronics, Inc. | Method for passively determining the application of a sample fluid on an analyte strip |
| JP2000332103A (en) | 1999-05-24 | 2000-11-30 | Mitsubishi Electric Corp | Semiconductor device, its manufacturing method and its manufacturing apparatus |
| CA2376532A1 (en) | 1999-06-10 | 2000-12-21 | Song Shi | Biosensors which utilize charge neutral conjugated polymers |
| US6193873B1 (en) | 1999-06-15 | 2001-02-27 | Lifescan, Inc. | Sample detection to initiate timing of an electrochemical assay |
| EP1192269A2 (en) | 1999-06-18 | 2002-04-03 | Therasense, Inc. | MASS TRANSPORT LIMITED i IN VIVO /i ANALYTE SENSOR |
| JP4450124B2 (en) | 1999-06-25 | 2010-04-14 | 株式会社デンソー | Rotating electric machine and manufacturing method thereof |
| GB9915433D0 (en) | 1999-07-01 | 1999-09-01 | Europ Org For Nuclear Research | A monolithic semiconductor detector |
| JP2001021525A (en)* | 1999-07-02 | 2001-01-26 | Akebono Brake Res & Dev Center Ltd | Measuring method using biosensor |
| JP4288775B2 (en)* | 1999-07-29 | 2009-07-01 | 株式会社エクォス・リサーチ | CO gas sensor |
| CA2305922C (en) | 1999-08-02 | 2005-09-20 | Bayer Corporation | Improved electrochemical sensor design |
| US6841052B2 (en) | 1999-08-02 | 2005-01-11 | Bayer Corporation | Electrochemical-sensor design |
| DE19936693A1 (en) | 1999-08-04 | 2001-02-08 | Lre Technology Partner Gmbh | Instrument for the measurement of blood sugar concentrations has a test field with electrodes for the test strip and a circuit for measurement/evaluation of the current strength for display |
| ES2298155T3 (en)* | 1999-09-20 | 2008-05-16 | Roche Diagnostics Operations, Inc. | METHOD FOR MONITORING AN ANALYTE USING AN ELECTROCHEMICAL BIOSENSOR THAT CAN BE DISCONNECTED BY APPLYING AN ELECTRICAL POTENTIAL. |
| US6699384B1 (en) | 1999-09-21 | 2004-03-02 | Battelle Memorial Institute | Compact electrochemical sensor system and method for field testing for metals in saliva or other fluids |
| US7276146B2 (en) | 2001-11-16 | 2007-10-02 | Roche Diagnostics Operations, Inc. | Electrodes, methods, apparatuses comprising micro-electrode arrays |
| US6645359B1 (en) | 2000-10-06 | 2003-11-11 | Roche Diagnostics Corporation | Biosensor |
| US6136549A (en) | 1999-10-15 | 2000-10-24 | Feistel; Christopher C. | systems and methods for performing magnetic chromatography assays |
| US6218571B1 (en) | 1999-10-27 | 2001-04-17 | Lifescan, Inc. | 8-(anilino)-1-naphthalenesulfonate analogs |
| AU1457401A (en) | 1999-11-02 | 2001-05-14 | Advanced Sensor Technologies, Inc. | Microscopic combination amperometric and potentiometric sensor |
| US20060091006A1 (en) | 1999-11-04 | 2006-05-04 | Yi Wang | Analyte sensor with insertion monitor, and methods |
| US6616819B1 (en) | 1999-11-04 | 2003-09-09 | Therasense, Inc. | Small volume in vitro analyte sensor and methods |
| CA2423837C (en) | 1999-11-04 | 2007-09-11 | Therasense, Inc. | Small volume in vitro analyte sensor and methods |
| EP1230248B1 (en) | 1999-11-15 | 2007-06-06 | Therasense, Inc. | Transition metal complexes attached to a polymer via a flexible chain |
| WO2001038862A1 (en) | 1999-11-22 | 2001-05-31 | Matsushita Electric Industrial Co., Ltd. | Cholesterol sensor and method for determining cholesterol |
| JP4050434B2 (en) | 1999-11-29 | 2008-02-20 | 松下電器産業株式会社 | Sample discrimination method |
| US6316264B1 (en) | 1999-12-17 | 2001-11-13 | Bayer Corporation | Test strip for the assay of an analyte in a liquid sample |
| US6627057B1 (en) | 1999-12-23 | 2003-09-30 | Roche Diagnostic Corporation | Microsphere containing sensor |
| ATE277865T1 (en) | 2000-01-31 | 2004-10-15 | Diagnoswiss Sa | METHOD FOR PRODUCING MICROSTRUCTURES WITH DIFFERENT SURFACE PROPERTIES IN A MULTI-LAYER BODY BY PLASMA ETCHING |
| US6485923B1 (en) | 2000-02-02 | 2002-11-26 | Lifescan, Inc. | Reagent test strip for analyte determination having hemolyzing agent |
| US6558529B1 (en) | 2000-02-07 | 2003-05-06 | Steris Inc. | Electrochemical sensor for the specific detection of peroxyacetic acid in aqueous solutions using pulse amperometric methods |
| US6824669B1 (en) | 2000-02-17 | 2004-11-30 | Motorola, Inc. | Protein and peptide sensors using electrical detection methods |
| US6538735B1 (en) | 2000-02-25 | 2003-03-25 | Packard Instrument Company | Method and apparatus for producing and measuring light and for determining the amounts of analytes in microplate wells |
| WO2001065246A1 (en) | 2000-03-01 | 2001-09-07 | november Aktiengesellschaft Gesellschaft für Molekulare Medizin | Quantifying target molecules contained in a liquid |
| GB0005564D0 (en) | 2000-03-08 | 2000-05-03 | Inverness Medical Ltd | Measurjement of substances in liquid |
| DE10014724A1 (en) | 2000-03-24 | 2001-09-27 | Endress Hauser Gmbh Co | Liquid level and density monitoring method employed in food, chemical industry, involves evaluating vibration of vibrating rods arranged immersed in liquid at two different modes and recognizing mass change in rods |
| US6571651B1 (en) | 2000-03-27 | 2003-06-03 | Lifescan, Inc. | Method of preventing short sampling of a capillary or wicking fill device |
| US6488827B1 (en) | 2000-03-31 | 2002-12-03 | Lifescan, Inc. | Capillary flow control in a medical diagnostic device |
| US6623501B2 (en) | 2000-04-05 | 2003-09-23 | Therasense, Inc. | Reusable ceramic skin-piercing device |
| EP1156302B1 (en) | 2000-05-15 | 2004-09-29 | Krohne Messtechnik Gmbh & Co. Kg | Level measuring device |
| GB0015406D0 (en) | 2000-06-24 | 2000-08-16 | British Nuclear Fuels Plc | Sensor for metal ions |
| US6444115B1 (en) | 2000-07-14 | 2002-09-03 | Lifescan, Inc. | Electrochemical method for measuring chemical reaction rates |
| JP3913454B2 (en) | 2000-08-29 | 2007-05-09 | 株式会社リガク | Measuring method of surface leakage current of sample |
| US6420128B1 (en) | 2000-09-12 | 2002-07-16 | Lifescan, Inc. | Test strips for detecting the presence of a reduced cofactor in a sample and method for using the same |
| US6939451B2 (en) | 2000-09-19 | 2005-09-06 | Aclara Biosciences, Inc. | Microfluidic chip having integrated electrodes |
| US6555061B1 (en) | 2000-10-05 | 2003-04-29 | Lifescan, Inc. | Multi-layer reagent test strip |
| AU2002220583A1 (en) | 2000-10-10 | 2002-04-22 | Aventis Research And Technologies Gmbh And Co Kg | Device and method for electrically accelerated immobilisation of molecules |
| DE10049901C2 (en) | 2000-10-10 | 2003-01-02 | Aventis Res & Tech Gmbh & Co | Apparatus and method for electrically accelerated immobilization and for detection of molecules |
| US6540890B1 (en) | 2000-11-01 | 2003-04-01 | Roche Diagnostics Corporation | Biosensor |
| US6447657B1 (en) | 2000-12-04 | 2002-09-10 | Roche Diagnostics Corporation | Biosensor |
| US7419580B2 (en) | 2000-12-14 | 2008-09-02 | The University Of Hong Kong | Methods and apparatus for the oxidation of glucose molecules |
| US6558528B1 (en) | 2000-12-20 | 2003-05-06 | Lifescan, Inc. | Electrochemical test strip cards that include an integral dessicant |
| US6512986B1 (en) | 2000-12-30 | 2003-01-28 | Lifescan, Inc. | Method for automated exception-based quality control compliance for point-of-care devices |
| US6560471B1 (en) | 2001-01-02 | 2003-05-06 | Therasense, Inc. | Analyte monitoring device and methods of use |
| CN102012389B (en) | 2001-01-17 | 2013-04-10 | 爱科来株式会社 | Quantitative analyzing method and quantitative analyzer using sensor |
| US20020157967A1 (en) | 2001-02-26 | 2002-10-31 | Institute Of Ocupational Safety And Health, Council Of Labor Affairs, Executive Yuan | Electrochemical gaseous chlorine sensor and method for making the same |
| US6541266B2 (en) | 2001-02-28 | 2003-04-01 | Home Diagnostics, Inc. | Method for determining concentration of an analyte in a test strip |
| US6562625B2 (en) | 2001-02-28 | 2003-05-13 | Home Diagnostics, Inc. | Distinguishing test types through spectral analysis |
| US6525330B2 (en) | 2001-02-28 | 2003-02-25 | Home Diagnostics, Inc. | Method of strip insertion detection |
| WO2002077633A1 (en) | 2001-03-23 | 2002-10-03 | The Regents Of The University Of California | Open circuit potential amperometry and voltammetry |
| EP1397068A2 (en) | 2001-04-02 | 2004-03-17 | Therasense, Inc. | Blood glucose tracking apparatus and methods |
| US6676816B2 (en) | 2001-05-11 | 2004-01-13 | Therasense, Inc. | Transition metal complexes with (pyridyl)imidazole ligands and sensors using said complexes |
| US6491803B1 (en) | 2001-05-18 | 2002-12-10 | Apex Biotechnology Corporation | Test strip and biosensor incorporating with nanometer metal particles |
| US6549796B2 (en) | 2001-05-25 | 2003-04-15 | Lifescan, Inc. | Monitoring analyte concentration using minimally invasive devices |
| US20030136673A1 (en) | 2001-05-31 | 2003-07-24 | Denis Pilloud | Amperometric sensors using synthetic substrates based on modeled active-site chemistry |
| US6501976B1 (en) | 2001-06-12 | 2002-12-31 | Lifescan, Inc. | Percutaneous biological fluid sampling and analyte measurement devices and methods |
| ITBO20010375A1 (en) | 2001-06-13 | 2002-12-13 | Valter Lolli | METHOD FOR THE PRODUCTION OF HEAD ELEMENTS FOR THERMAL RADIATORS, AND HEAD ELEMENT MADE WITH SUCH METHOD |
| US6576416B2 (en) | 2001-06-19 | 2003-06-10 | Lifescan, Inc. | Analyte measurement device and method of use |
| US7011630B2 (en) | 2001-06-22 | 2006-03-14 | Animas Technologies, Llc | Methods for computing rolling analyte measurement values, microprocessors comprising programming to control performance of the methods, and analyte monitoring devices employing the methods |
| GB0115586D0 (en) | 2001-06-26 | 2001-08-15 | Zellweger Analytics Ltd | Monitoring of gas sensors |
| CN100401045C (en) | 2001-07-18 | 2008-07-09 | 爱科来株式会社 | Analytical Tools and Analytical Devices |
| EP1279742A1 (en) | 2001-07-23 | 2003-01-29 | Applied NanoSystems B.V. | Method of binding a compound to a sensor surface using hydrophobin |
| CN1156573C (en) | 2001-07-25 | 2004-07-07 | 中国科学院武汉病毒研究所 | A kind of preparation method for the fusion protein of glucose sensor |
| AT410223B (en)* | 2001-08-09 | 2003-03-25 | Adlassnig Alexander Mag Dr | BIOSENSORS IN THICK FILM TECHNOLOGY |
| JP2003061650A (en) | 2001-08-27 | 2003-03-04 | Toyobo Co Ltd | New histamine enzyme and its production, and highly sensitive measuring method for histamine |
| PT2330407E (en)* | 2001-09-14 | 2013-07-09 | Arkray Inc | Method, tool and device for measuring concentration |
| US6537598B1 (en) | 2001-09-27 | 2003-03-25 | Micro-Tender Industries, Inc. | Method for tenderizing raw beef |
| US6797150B2 (en)* | 2001-10-10 | 2004-09-28 | Lifescan, Inc. | Determination of sample volume adequacy in biosensor devices |
| US7018843B2 (en) | 2001-11-07 | 2006-03-28 | Roche Diagnostics Operations, Inc. | Instrument |
| US20030116447A1 (en) | 2001-11-16 | 2003-06-26 | Surridge Nigel A. | Electrodes, methods, apparatuses comprising micro-electrode arrays |
| US6689411B2 (en) | 2001-11-28 | 2004-02-10 | Lifescan, Inc. | Solution striping system |
| US20030113933A1 (en) | 2001-12-18 | 2003-06-19 | Rasmus Jansson | Analysis of components in liquids |
| KR100407822B1 (en) | 2001-12-04 | 2003-12-01 | 한국전자통신연구원 | Electrochemical immune-sensor, and kit and method for detecting biochemical analyte using the same |
| US6856125B2 (en)* | 2001-12-12 | 2005-02-15 | Lifescan, Inc. | Biosensor apparatus and method with sample type and volume detection |
| KR100475634B1 (en) | 2001-12-24 | 2005-03-15 | 주식회사 아이센스 | Biosensor equipped with sample introducing part which enables quick introduction of a small amount of sample |
| JP2005515413A (en) | 2002-01-15 | 2005-05-26 | アガマトリックス, インコーポレイテッド | Electrochemical signal processing method and apparatus |
| US6863800B2 (en) | 2002-02-01 | 2005-03-08 | Abbott Laboratories | Electrochemical biosensor strip for analysis of liquid samples |
| WO2004046099A2 (en) | 2002-02-01 | 2004-06-03 | William Marsh Rice University | Method of making a molecule-surface interface |
| US7018518B2 (en) | 2002-02-04 | 2006-03-28 | Yissum Research Development Company Of The Hebrew University Of Jerusalem | Biosensor carrying redox enzymes |
| EP1476413A1 (en) | 2002-02-08 | 2004-11-17 | General Electric Company | Process and catalyst for purifying phenol |
| CA2475375A1 (en) | 2002-02-10 | 2003-08-21 | Agamatrix, Inc. | Method and apparatus for assay of electrochemical properties |
| ATE507766T1 (en) | 2002-03-22 | 2011-05-15 | Animas Technologies Llc | PERFORMANCE IMPROVEMENT OF AN ANALYTE MONITORING DEVICE |
| GB0208095D0 (en) | 2002-04-09 | 2002-05-22 | Dobson John V | Electrochemical sensor system and sensing method |
| US7087150B2 (en) | 2002-05-03 | 2006-08-08 | Rosemount Analytical Inc. | Chloramine amperometric sensor |
| DE10222312B4 (en) | 2002-05-18 | 2005-02-03 | Man B&W Diesel A/S | Crosshead engine |
| US20040099531A1 (en) | 2002-08-15 | 2004-05-27 | Rengaswamy Srinivasan | Methods and apparatus for electrochemically testing samples for constituents |
| JP3993049B2 (en) | 2002-09-03 | 2007-10-17 | 独立行政法人科学技術振興機構 | Element for electrochemical analysis of physiologically active substance and analysis method using the same |
| WO2004023128A1 (en) | 2002-09-05 | 2004-03-18 | Unisearch Limited | Detection of target nucleic acid molecules by alteration of reaction of a redox species following hybridization with immoblized capture nucleic acid molecules |
| US7175746B2 (en) | 2002-10-22 | 2007-02-13 | Council Of Scientific And Industrial Research | Polymer based enzyme electrode for estimation of cholesterol and process for preparation thereof |
| EP1413745B1 (en) | 2002-10-22 | 2012-02-22 | Ford Global Technologies, LLC | Fuel injector and a direct injected combustion engine |
| US7501053B2 (en) | 2002-10-23 | 2009-03-10 | Abbott Laboratories | Biosensor having improved hematocrit and oxygen biases |
| AU2003291025A1 (en) | 2002-11-18 | 2004-06-15 | Advanced Sensor Technologies | Microscopic multi-site sensor array with integrated control and analysis circuitry |
| ES2286209T3 (en)* | 2002-11-21 | 2007-12-01 | Lifescan, Inc. | DETERMINATION OF THE ADEQUACY OF THE SAMPLE VOLUME IN BIODETECTORS. |
| AU2003283935A1 (en) | 2002-12-09 | 2004-06-30 | Otre Ab | Simplified signal processing method for voltammetry |
| WO2005081653A2 (en) | 2002-12-11 | 2005-09-09 | The Johns Hopkins University | Techniques for sensing chloride ions in wet or dry media |
| GB0300820D0 (en) | 2003-01-14 | 2003-02-12 | Diagnoswiss Sa | Membrane-microchannel strip |
| US7267837B2 (en) | 2003-01-16 | 2007-09-11 | Arun Kumar | Enzyme electrode and process for preparation thereof |
| US7132041B2 (en) | 2003-02-11 | 2006-11-07 | Bayer Healthcare Llc | Methods of determining the concentration of an analyte in a fluid test sample |
| JP4614630B2 (en) | 2003-03-31 | 2011-01-19 | 有限会社筑波物質情報研究所 | Functional polymer compound and biosensor using the same |
| US8071028B2 (en) | 2003-06-12 | 2011-12-06 | Abbott Diabetes Care Inc. | Method and apparatus for providing power management in data communication systems |
| US7452457B2 (en) | 2003-06-20 | 2008-11-18 | Roche Diagnostics Operations, Inc. | System and method for analyte measurement using dose sufficiency electrodes |
| US7488601B2 (en) | 2003-06-20 | 2009-02-10 | Roche Diagnostic Operations, Inc. | System and method for determining an abused sensor during analyte measurement |
| US7597793B2 (en) | 2003-06-20 | 2009-10-06 | Roche Operations Ltd. | System and method for analyte measurement employing maximum dosing time delay |
| GB0314944D0 (en) | 2003-06-26 | 2003-07-30 | Univ Cranfield | Electrochemical detector for metabolites in physiological fluids |
| ES2709991T3 (en) | 2003-08-21 | 2019-04-22 | Agamatrix Inc | Method and apparatus for the analysis of electrochemical properties |
| TWM240701U (en) | 2003-09-17 | 2004-08-11 | Molex Taiwan Ltd | Electronic card connector |
| US8007656B2 (en)* | 2003-10-24 | 2011-08-30 | Bayer Healthcare Llc | Enzymatic electrochemical biosensor |
| JP4449431B2 (en) | 2003-11-19 | 2010-04-14 | パナソニック株式会社 | Substrate concentration measurement method |
| CN100472210C (en)* | 2003-12-04 | 2009-03-25 | 松下电器产业株式会社 | Method for measuring blood components and sensor and measuring device used in the method |
| US8105478B2 (en)* | 2004-01-29 | 2012-01-31 | Siemens Aktiengesellschaft | Method for measuring the concentration or change in concentration of a redox-active substance and corresponding device |
| ATE532063T1 (en)* | 2004-02-06 | 2011-11-15 | Bayer Healthcare Llc | ELECTROCHEMICAL BIOSENSOR |
| US20060240540A1 (en)* | 2004-03-01 | 2006-10-26 | Junji Nakatsuka | Biosensor, biosensor chip, and biosensor device |
| EP1751533A2 (en) | 2004-05-14 | 2007-02-14 | Bayer Healthcare, LLC | Voltammetric systems for assaying biological analytes |
| CA2887517C (en) | 2004-10-12 | 2017-09-12 | Bayer Healthcare Llc | Concentration determination in a diffusion barrier layer |
| GB0501826D0 (en) | 2005-01-28 | 2005-03-09 | Melys Diagnostics Ltd | Apparatus for measurement of analyte concentration |
| JP5385607B2 (en)* | 2005-07-20 | 2014-01-08 | バイエル・ヘルスケア・エルエルシー | Gated current measuring instrument |
| US7749371B2 (en) | 2005-09-30 | 2010-07-06 | Lifescan, Inc. | Method and apparatus for rapid electrochemical analysis |
| KR101577176B1 (en) | 2005-09-30 | 2015-12-14 | 바이엘 헬스케어 엘엘씨 | Gated voltammetry analyte determination |
| CN1328156C (en) | 2005-10-27 | 2007-07-25 | 上海大学 | Process for preparing powder material of nano oxide |
| US7822557B2 (en) | 2006-10-31 | 2010-10-26 | Abbott Diabetes Care Inc. | Analyte sensors and methods |
| WO2008079731A1 (en) | 2006-12-22 | 2008-07-03 | Home Diagnostics, Inc. | Gel formation to reduce hematocrit sensitivity in electrochemical test |
| US20090026094A1 (en) | 2007-05-11 | 2009-01-29 | Home Diagnostics, Inc. | Two-pulse systems and methods for determining analyte concentration |
| US8101062B2 (en) | 2007-07-26 | 2012-01-24 | Nipro Diagnostics, Inc. | System and methods for determination of analyte concentration using time resolved amperometry |
| AU2008279067A1 (en) | 2007-07-26 | 2009-01-29 | Nipro Diagnostics, Inc. | System and methods for determination of analyte concentration using time resolved amperometry |
- 2006
- 2006-09-11KRKR1020157020318Apatent/KR101577176B1/enactiveActive
- 2006-09-11CNCN201210217074.1Apatent/CN103048442B/enactiveActive
- 2006-09-11JPJP2008533391Apatent/JP5671205B2/enactiveActive
- 2006-09-11CACA2623480Apatent/CA2623480C/ennot_activeExpired - Fee Related
- 2006-09-11CACA2882830Apatent/CA2882830C/ennot_activeExpired - Fee Related
- 2006-09-11USUS12/037,715patent/US8404100B2/enactiveActive
- 2006-09-11EPEP18209978.8Apatent/EP3483598B1/enactiveActive
- 2006-09-11CACA2986870Apatent/CA2986870A1/ennot_activeAbandoned
- 2006-09-11KRKR20087010438Apatent/KR101477815B1/enactiveActive
- 2006-09-11EPEP06803250.7Apatent/EP1934591B1/enactiveActive
- 2006-09-11WOPCT/US2006/035129patent/WO2007040913A1/enactiveApplication Filing
- 2006-09-11ESES06803250Tpatent/ES2716136T3/enactiveActive
- 2006-09-11KRKR1020137022120Apatent/KR101477947B1/enactiveActive
- 2006-09-11BRBRPI0616743-8Apatent/BRPI0616743B1/ennot_activeIP Right Cessation
- 2006-09-11KRKR1020137022121Apatent/KR101477948B1/enactiveActive
- 2006-09-11CNCN200680035552XApatent/CN101273266B/enactiveActive
- 2006-09-11KRKR1020137022119Apatent/KR20130100022A/ennot_activeCeased
- 2006-09-11AUAU2006297572Apatent/AU2006297572B2/ennot_activeCeased
- 2006-09-11RURU2008117118/28Apatent/RU2426107C2/enactive
- 2006-09-25PEPE2006001158Apatent/PE20070730A1/ennot_activeApplication Discontinuation
- 2006-09-27DODO2006000206Apatent/DOP2006000206A/enunknown
- 2006-09-28UYUY29819Apatent/UY29819A1/ennot_activeApplication Discontinuation
- 2006-09-28ARARP060104293Apatent/AR055189A1/enunknown
- 2006-09-29TWTW095136275Apatent/TW200736606A/enunknown
- 2008
- 2008-02-29ZAZA200801918Apatent/ZA200801918B/enunknown
- 2008-04-30NONO20082030Apatent/NO20082030L/ennot_activeApplication Discontinuation
- 2012
- 2012-01-10JPJP2012002225Apatent/JP5722241B2/enactiveActive
- 2013
- 2013-02-28USUS13/780,589patent/US8647489B2/enactiveActive
- 2013-06-07JPJP2013120349Apatent/JP5730349B2/enactiveActive
- 2013-12-20USUS14/136,286patent/US9110013B2/enactiveActive
- 2014
- 2014-10-24JPJP2014216798Apatent/JP5959595B2/enactiveActive
- 2015
- 2015-07-10USUS14/796,544patent/US9835582B2/enactiveActive
- 2015-12-28JPJP2015256036Apatent/JP6122095B2/enactiveActive
- 2017
- 2017-02-15JPJP2017025899Apatent/JP6388972B2/enactiveActive
- 2017-11-07USUS15/805,575patent/US10670553B2/enactiveActive
- 2018
- 2018-07-02JPJP2018125830Apatent/JP6574510B2/enactiveActive
- 2018-07-02JPJP2018125836Apatent/JP6522836B2/enactiveActive
- 2018-07-02JPJP2018125833Apatent/JP6571247B2/enactiveActive
- 2018-07-02JPJP2018125835Apatent/JP6522835B2/enactiveActive
- 2018-07-02JPJP2018125828Apatent/JP6522834B2/enactiveActive
- 2019
- 2019-07-09JPJP2019127664Apatent/JP6721767B2/enactiveActive
- 2019-12-20JPJP2019230158Apatent/JP6721774B2/enactiveActive
- 2020
- 2020-04-30JPJP2020080433Apatent/JP2020197526A/enactivePending
- 2020-05-04USUS16/866,053patent/US11435312B2/enactiveActive
- 2021
- 2021-01-04JPJP2021000206Apatent/JP2021073447A/enactivePending
Patent Citations (4)
| Publication number | Priority date | Publication date | Assignee | Title |
|---|---|---|---|---|
| US4304853A (en)* | 1979-04-24 | 1981-12-08 | Marcel Jozefonvicz | Method of determination for proteases and antiproteases |
| US4897162A (en)* | 1986-11-14 | 1990-01-30 | The Cleveland Clinic Foundation | Pulse voltammetry |
| US5873990A (en)* | 1995-08-22 | 1999-02-23 | Andcare, Inc. | Handheld electromonitor device |
| US6413398B1 (en)* | 1999-09-13 | 2002-07-02 | Her Majesty The Queen In Right Of Canada, As Represented By The Canadian Food Inspection Agency | Method for electrochemical detection |
Cited By (2)
| Publication number | Priority date | Publication date | Assignee | Title |
|---|---|---|---|---|
| RU2661608C2 (en)* | 2012-09-28 | 2018-07-17 | Цилаг Гмбх Интернэшнл | System and method for determining hematocrit insensitive glucose concentration |
| RU2528584C1 (en)* | 2013-03-19 | 2014-09-20 | Федеральное государственное бюджетное образовательное учреждение высшего профессионального образования "Национальный исследовательский Томский политехнический университет" | Method of determining glutathione in standard test aqueous solutions via cyclic voltammetry on graphite electrode, modified with colloidal gold particles |
Also Published As
Similar Documents
| Publication | Publication Date | Title |
|---|---|---|
| US11435312B2 (en) | Devices using gated voltammetry methods | |
| AU2013200186B2 (en) | Gated Voltammetry |