KR20180088165A - Energy management device and operating method thereof - Google Patents
Energy management device and operating method thereofDownload PDFInfo
- Publication number
- KR20180088165A KR20180088165AKR1020170012894AKR20170012894AKR20180088165AKR 20180088165 AKR20180088165 AKR 20180088165AKR 1020170012894 AKR1020170012894 AKR 1020170012894AKR 20170012894 AKR20170012894 AKR 20170012894AKR 20180088165 AKR20180088165 AKR 20180088165A
- Authority
- KR
- South Korea
- Prior art keywords
- energy
- graph
- axis
- management device
- energy management
- Prior art date
- Legal status (The legal status is an assumption and is not a legal conclusion. Google has not performed a legal analysis and makes no representation as to the accuracy of the status listed.)
- Ceased
Links
Images


Classifications
- G—PHYSICS
- G06—COMPUTING OR CALCULATING; COUNTING
- G06Q—INFORMATION AND COMMUNICATION TECHNOLOGY [ICT] SPECIALLY ADAPTED FOR ADMINISTRATIVE, COMMERCIAL, FINANCIAL, MANAGERIAL OR SUPERVISORY PURPOSES; SYSTEMS OR METHODS SPECIALLY ADAPTED FOR ADMINISTRATIVE, COMMERCIAL, FINANCIAL, MANAGERIAL OR SUPERVISORY PURPOSES, NOT OTHERWISE PROVIDED FOR
- G06Q10/00—Administration; Management
- G06Q10/06—Resources, workflows, human or project management; Enterprise or organisation planning; Enterprise or organisation modelling
- G06Q10/063—Operations research, analysis or management
- G—PHYSICS
- G06—COMPUTING OR CALCULATING; COUNTING
- G06T—IMAGE DATA PROCESSING OR GENERATION, IN GENERAL
- G06T19/00—Manipulating 3D models or images for computer graphics
- G06T19/20—Editing of 3D images, e.g. changing shapes or colours, aligning objects or positioning parts
- G—PHYSICS
- G06—COMPUTING OR CALCULATING; COUNTING
- G06F—ELECTRIC DIGITAL DATA PROCESSING
- G06F3/00—Input arrangements for transferring data to be processed into a form capable of being handled by the computer; Output arrangements for transferring data from processing unit to output unit, e.g. interface arrangements
- G06F3/01—Input arrangements or combined input and output arrangements for interaction between user and computer
- G06F3/048—Interaction techniques based on graphical user interfaces [GUI]
- G06F3/0484—Interaction techniques based on graphical user interfaces [GUI] for the control of specific functions or operations, e.g. selecting or manipulating an object, an image or a displayed text element, setting a parameter value or selecting a range
- G06F3/0486—Drag-and-drop
- G—PHYSICS
- G06—COMPUTING OR CALCULATING; COUNTING
- G06Q—INFORMATION AND COMMUNICATION TECHNOLOGY [ICT] SPECIALLY ADAPTED FOR ADMINISTRATIVE, COMMERCIAL, FINANCIAL, MANAGERIAL OR SUPERVISORY PURPOSES; SYSTEMS OR METHODS SPECIALLY ADAPTED FOR ADMINISTRATIVE, COMMERCIAL, FINANCIAL, MANAGERIAL OR SUPERVISORY PURPOSES, NOT OTHERWISE PROVIDED FOR
- G06Q50/00—Information and communication technology [ICT] specially adapted for implementation of business processes of specific business sectors, e.g. utilities or tourism
- G06Q50/06—Energy or water supply
- G—PHYSICS
- G06—COMPUTING OR CALCULATING; COUNTING
- G06Q—INFORMATION AND COMMUNICATION TECHNOLOGY [ICT] SPECIALLY ADAPTED FOR ADMINISTRATIVE, COMMERCIAL, FINANCIAL, MANAGERIAL OR SUPERVISORY PURPOSES; SYSTEMS OR METHODS SPECIALLY ADAPTED FOR ADMINISTRATIVE, COMMERCIAL, FINANCIAL, MANAGERIAL OR SUPERVISORY PURPOSES, NOT OTHERWISE PROVIDED FOR
- G06Q50/00—Information and communication technology [ICT] specially adapted for implementation of business processes of specific business sectors, e.g. utilities or tourism
- G06Q50/10—Services
- G—PHYSICS
- G01—MEASURING; TESTING
- G01R—MEASURING ELECTRIC VARIABLES; MEASURING MAGNETIC VARIABLES
- G01R21/00—Arrangements for measuring electric power or power factor
- G01R21/133—Arrangements for measuring electric power or power factor by using digital technique
- G—PHYSICS
- G06—COMPUTING OR CALCULATING; COUNTING
- G06T—IMAGE DATA PROCESSING OR GENERATION, IN GENERAL
- G06T2200/00—Indexing scheme for image data processing or generation, in general
- G06T2200/24—Indexing scheme for image data processing or generation, in general involving graphical user interfaces [GUIs]
- G—PHYSICS
- G06—COMPUTING OR CALCULATING; COUNTING
- G06T—IMAGE DATA PROCESSING OR GENERATION, IN GENERAL
- G06T2219/00—Indexing scheme for manipulating 3D models or images for computer graphics
- G06T2219/20—Indexing scheme for editing of 3D models
- G06T2219/2016—Rotation, translation, scaling
- Y—GENERAL TAGGING OF NEW TECHNOLOGICAL DEVELOPMENTS; GENERAL TAGGING OF CROSS-SECTIONAL TECHNOLOGIES SPANNING OVER SEVERAL SECTIONS OF THE IPC; TECHNICAL SUBJECTS COVERED BY FORMER USPC CROSS-REFERENCE ART COLLECTIONS [XRACs] AND DIGESTS
- Y02—TECHNOLOGIES OR APPLICATIONS FOR MITIGATION OR ADAPTATION AGAINST CLIMATE CHANGE
- Y02E—REDUCTION OF GREENHOUSE GAS [GHG] EMISSIONS, RELATED TO ENERGY GENERATION, TRANSMISSION OR DISTRIBUTION
- Y02E40/00—Technologies for an efficient electrical power generation, transmission or distribution
- Y02E40/70—Smart grids as climate change mitigation technology in the energy generation sector
- Y02E40/76—
- Y—GENERAL TAGGING OF NEW TECHNOLOGICAL DEVELOPMENTS; GENERAL TAGGING OF CROSS-SECTIONAL TECHNOLOGIES SPANNING OVER SEVERAL SECTIONS OF THE IPC; TECHNICAL SUBJECTS COVERED BY FORMER USPC CROSS-REFERENCE ART COLLECTIONS [XRACs] AND DIGESTS
- Y02—TECHNOLOGIES OR APPLICATIONS FOR MITIGATION OR ADAPTATION AGAINST CLIMATE CHANGE
- Y02P—CLIMATE CHANGE MITIGATION TECHNOLOGIES IN THE PRODUCTION OR PROCESSING OF GOODS
- Y02P90/00—Enabling technologies with a potential contribution to greenhouse gas [GHG] emissions mitigation
- Y02P90/80—Management or planning
- Y02P90/82—Energy audits or management systems therefor
- Y—GENERAL TAGGING OF NEW TECHNOLOGICAL DEVELOPMENTS; GENERAL TAGGING OF CROSS-SECTIONAL TECHNOLOGIES SPANNING OVER SEVERAL SECTIONS OF THE IPC; TECHNICAL SUBJECTS COVERED BY FORMER USPC CROSS-REFERENCE ART COLLECTIONS [XRACs] AND DIGESTS
- Y04—INFORMATION OR COMMUNICATION TECHNOLOGIES HAVING AN IMPACT ON OTHER TECHNOLOGY AREAS
- Y04S—SYSTEMS INTEGRATING TECHNOLOGIES RELATED TO POWER NETWORK OPERATION, COMMUNICATION OR INFORMATION TECHNOLOGIES FOR IMPROVING THE ELECTRICAL POWER GENERATION, TRANSMISSION, DISTRIBUTION, MANAGEMENT OR USAGE, i.e. SMART GRIDS
- Y04S40/00—Systems for electrical power generation, transmission, distribution or end-user application management characterised by the use of communication or information technologies, or communication or information technology specific aspects supporting them
- Y04S40/16—
Landscapes
- Engineering & Computer Science (AREA)
- Business, Economics & Management (AREA)
- Theoretical Computer Science (AREA)
- General Physics & Mathematics (AREA)
- Physics & Mathematics (AREA)
- General Engineering & Computer Science (AREA)
- Economics (AREA)
- Human Resources & Organizations (AREA)
- Tourism & Hospitality (AREA)
- Health & Medical Sciences (AREA)
- Strategic Management (AREA)
- Marketing (AREA)
- General Business, Economics & Management (AREA)
- Human Computer Interaction (AREA)
- General Health & Medical Sciences (AREA)
- Primary Health Care (AREA)
- Public Health (AREA)
- Water Supply & Treatment (AREA)
- Entrepreneurship & Innovation (AREA)
- Software Systems (AREA)
- Computer Hardware Design (AREA)
- Computer Graphics (AREA)
- Architecture (AREA)
- Quality & Reliability (AREA)
- Operations Research (AREA)
- Game Theory and Decision Science (AREA)
- Educational Administration (AREA)
- Development Economics (AREA)
- Remote Monitoring And Control Of Power-Distribution Networks (AREA)
Abstract
Translated fromKoreanDescription
Translated fromKorean본 발명은 에너지 관리 장치 및 그의 동작 방법에 관한 것이다. 구체적으로, 본 발명은 지능형 전력 시스템(Smart Grid)을 구성하는 에너지 관리 장치 및 그의 동작 방법에 관한 것이다.The present invention relates to an energy management apparatus and an operation method thereof. Specifically, the present invention relates to an energy management apparatus and an operation method thereof constituting an intelligent power system (Smart Grid).
현재, 가정 또는 회사에 전력을 공급하는 전력 시스템(전력망)은, 생산자가 통제하는 수직적이고 중앙 집중적인 네트워크 체제로 되어 있다. 구체적으로, 공급자는 전기, 물, 가스 등과 같은 에너지원(Energy source)을 단순히 공급만하고, 수요처는 공급받은 에너지원을 단순히 사용만 하였다. 따라서, 에너지 생산, 분배, 또는 에너지 사용 등의 측면에서 효과적인 관리가 수행되기 어려웠다.Currently, power systems (power grids) that power homes or businesses are in a vertical, centralized network regulated by producers. Specifically, the supplier simply supplies an energy source such as electricity, water, or gas, and the customer simply uses the supplied energy source. Therefore, effective management in terms of energy production, distribution, or energy use is difficult to perform.
즉, 에너지는 에너지 공급자로부터 다수의 수요처를 향하여 분산되는, 중앙에서 주변부로 퍼져나가는 방사형구조이고, 수요자 중심이 아닌 단방향의 공급자 중심이라는 특징을 가지고 있다.In other words, energy is a radial structure spreading from the energy supplier to many consumers, spreading from the center to the periphery, and is characterized by a one-way supplier center rather than the consumer center.
또한, 전기에 대한 가격의 정보도 실시간으로 알 수 있는 것이 아니라, 전력거래소를 통하여 제한적으로만 알 수 있었고, 가격 제도 또한 사실상의 고정 가격제이기 때문에 가격 변화를 통한 수요자에 대한 인센티브와 같은 유인책을 사용할 수 없다는 문제점도 있었다.In addition, price information on electricity can not be known in real time, but only through the KPX, and since the price system is also a fixed price system, incentives such as incentives for consumers through price changes are used There was also a problem that it can not be.
이러한 전력 시스템 하에서는 지구 온난화 방지라는 글로벌 과제, 에너지 원자재 가격 상승의 대처 방안 부재, 에너지 과소비 억제 문제 및 전력의 안정적 공급 문제를 해결할 수 없다.Under such a power system, it is impossible to solve the global problem of global warming prevention, the countermeasure of the countermeasure of the rise in the price of energy raw materials, the problem of the suppression of energy over consumption and the stable supply of electric power.
따라서, 현재의 전력 시스템으로부터 탈피하여 소비자와 공급자 간의 양방향 정보 전달 체제의 구축을 통한 전력 산업의 효율성을 제고하기 위해서는 지능형 전력 시스템(Smart Grid)의 개발의 필요하다. 나아가, 소비자들로 하여금 자신의 전력 수요를 조절할 수 있도록 지능형 전력 시스템의 구축이 필요하며, 이러한 시스템과의 양방향 통신이 가능한 에너지 관리 장치의 개발이 필요하다.Therefore, it is necessary to develop an intelligent power system (Smart Grid) to improve the efficiency of the electric power industry by establishing a bi-directional information transmission system between consumers and suppliers. Furthermore, it is necessary to build an intelligent power system so that consumers can control their own electric power demand, and it is necessary to develop an energy management device capable of bidirectional communication with such a system.
본 발명은, 시스템의 에너지 운영 현황을 다각적으로 모니터링할 수 있는 에너지 관리 장치를 제공하는 것을 목적으로 한다.An object of the present invention is to provide an energy management apparatus capable of variously monitoring the energy operation status of the system.
본 발명의 실시 예에 따른 에너지 관리 장치는, X축, Y축 및 Z축을 각각 시간, 에너지 장치 및 에너지 분석 대상 중 어느 하나로 맵핑하여 에너지 운영 현황을 나타내는 3차원 에너지 그래프를 표시할 수 있다.The energy management apparatus according to an embodiment of the present invention can display a three-dimensional energy graph indicating energy operation status by mapping the X axis, Y axis, and Z axis to any one of time, energy device, and energy analysis target.
본 발명의 실시 예에 따른 에너지 관리 장치는, 3차원 에너지 그래프, X축-Y축 그래프, X축-Z축 그래프 및 Y축-Z축 그래프 중 어느 하나가 표시되도록 에너지 그래프의 표시 방식을 용이하게 변경할 수 있다.The energy management apparatus according to the embodiment of the present invention can easily display the energy graph display mode so that any one of the three-dimensional energy graph, the X-axis-Y axis graph, the X axis-Z axis graph, and the Y axis- .
본 발명의 실시 예에 따른 에너지 관리 장치는, 드래그 앤 드랍 명령을 통해 표시된 그래프의 표시 방향을 변경할 수 있다. 보다 구체적으로, 에너지 관리 장치는 드래그 앤 드랍 명령을 통해 3차원 에너지 그래프를 회전시키거나 X축-Y축 그래프, X축-Z축 그래프 또는 Y축-Z축 그래프를 3차원 에너지 그래프로 변경시킬 수 있다.The energy management apparatus according to the embodiment of the present invention can change the display direction of the displayed graph through the drag and drop command. More specifically, the energy management device may be configured to rotate the three-dimensional energy graph through a drag and drop command, or to change the X-axis-Y axis graph, the X axis-Z axis graph, or the Y axis- .
본 발명의 다양한 실시 예에 따르면, 에너지 장치의 전력 상태 정보를 3차원으로 표시함으로써 사용자가 에너지 운영 현황을 직관적으로 알 수 있는 효과가 있다.According to various embodiments of the present invention, the power status information of the energy device is displayed in three dimensions, so that the user can intuitively know the energy operation status.
본 발명의 다양한 실시 예에 따르면, 에너지 운영 현황을 다양한 형태의 그래프로 표시 및 그래프 형태를 용이하게 전환시킴으로써, 사용자가 에너지 운영 현황을 용이하게 분석할 수 있고, 분석에 소요되는 시간을 절약하는 효과가 있다.According to various embodiments of the present invention, the energy operation status can be displayed in various forms of graphs and graph types can be easily switched, thereby enabling a user to easily analyze the energy operation status and saving time required for analysis .
본 발명의 다양한 실시 예에 따르면, 그래프의 표시 방향을 변경함으로써 사용자가 자유롭게 에너지 분석에 필요한 부분을 집중 탐색하고, 상세하게 분석할 수 있는 효과가 있다.According to various embodiments of the present invention, by changing the display direction of the graph, the user can freely browse the parts necessary for energy analysis and analyze them in detail.
도 1은 본 발명에 따른 지능형 전력 시스템을 개략적으로 보여주는 도면이다.
도 2는 본 발명에 따른 지능형 전력 시스템을 개략적으로 보여주는 블럭도이다.
도 3은 본 발명의 실시 예에 따른 사용처용 전력 시스템을 개략적으로 보여주는 블럭도이다.
도 4는 본 발명의 실시 예에 따른 에너지 관리 장치의 구성요소를 나타내는 블럭도이다.
도 5는 종래 에너지 운영 현황을 표시하는 방법을 나타내는 예시 도면이다.
도 6은 본 발명의 실시 예에 따른 에너지 관리 장치가 에너지 운영 현황을 표시하는 방법을 나타내는 순서도이다.
도 7은 본 발명의 실시 예에 따른 에너지 관리 장치가 에너지 분석 화면을 표시하는 방법을 설명하기 위한 도면이다.
도 8은 본 발명의 실시 예에 따른 3차원 표시 방식에 따른 에너지 그래프를 설명하기 위한 도면이다.
도 9는 본 발명의 실시 예에 따른 X축-Y축 보기 방식에 따른 에너지 그래프를 설명하기 위한 도면이다.
도 10은 본 발명의 실시 예에 따른 X축-Z축 보기 방식에 따른 에너지 그래프를 설명하기 위한 도면이다.
도 11 내지 도 12는 본 발명의 실시 예에 따른 Y축-Z축 보기 방식에 따른 에너지 그래프를 설명하기 위한 도면이다.
도 13 내지 도 16은 본 발명의 실시 예에 따른 에너지 관리 장치가 팝업 윈도우를 표시하는 방법을 설명하기 위한 도면이다.
도 17a 내지 도 17c는 본 발명의 실시 예에 따른 에너지 관리 장치가 에너지 그래프의 표시 방향을 변경하는 방법을 설명하기 위한 도면이다.
도 18a 내지 도 18c는 본 발명의 실시 예에 따른 에너지 관리 장치가 에너지 그래프의 표시 방향을 변경하는 방법을 설명하기 위한 도면이다.
도 19a 내지 도 19c는 본 발명의 실시 예에 따른 에너지 관리 장치가 에너지 그래프의 표시 방향을 변경하는 방법을 설명하기 위한 도면이다.
도 20a 내지 도 20c는 본 발명의 실시 예에 따른 에너지 관리 장치가 에너지 그래프의 표시 방향을 변경하는 방법을 설명하기 위한 도면이다.1 is a schematic illustration of an intelligent power system in accordance with the present invention.
2 is a schematic block diagram of an intelligent power system in accordance with the present invention.
3 is a block diagram schematically illustrating a power system for use according to an embodiment of the present invention.
4 is a block diagram illustrating components of an energy management apparatus according to an embodiment of the present invention.
5 is an exemplary diagram showing a method of displaying a conventional energy operation status.
6 is a flowchart illustrating a method of displaying an energy management status according to an embodiment of the present invention.
7 is a view for explaining a method of displaying an energy analysis screen by the energy management apparatus according to the embodiment of the present invention.
8 is a view for explaining an energy graph according to a three-dimensional display system according to an embodiment of the present invention.
FIG. 9 is a diagram for explaining an energy graph according to the X-axis and Y-axis viewing method according to the embodiment of the present invention.
10 is a view for explaining an energy graph according to the X-axis and Z-axis viewing method according to the embodiment of the present invention.
11 to 12 are views for explaining an energy graph according to the Y-axis view method according to the embodiment of the present invention.
13 to 16 are diagrams for explaining a method of displaying a pop-up window by the energy management apparatus according to the embodiment of the present invention.
17A to 17C are views for explaining a method of changing the display direction of the energy graph by the energy management apparatus according to the embodiment of the present invention.
18A to 18C are diagrams for explaining a method of changing the display direction of the energy graph by the energy management apparatus according to the embodiment of the present invention.
19A to 19C are views for explaining a method of changing the display direction of the energy graph by the energy management apparatus according to the embodiment of the present invention.
20A to 20C are diagrams for explaining a method of changing the display direction of the energy graph by the energy management apparatus according to the embodiment of the present invention.
이하의 내용은 단지 본 발명의 원리를 예시한다. 그러므로 당업자는 비록 본 명세서에 명확히 설명되거나 도시되지 않았지만 본 발명의 원리를 구현하고 본 발명의 개념과 범위에 포함된 다양한 장치를 발명할 수 있는 것이다. 또한, 본 명세서에 열거된 모든 조건부 용어 및 실시 예들은 원칙적으로, 본 발명의 개념이 이해되도록 하기 위한 목적으로만 명백히 의도되고, 이와 같이 특별히 열거된 실시 예들 및 상태들에 제한적이지 않는 것으로 이해되어야 한다.The following merely illustrates the principles of the invention. Thus, those skilled in the art will be able to devise various apparatuses which, although not explicitly described or shown herein, embody the principles of the invention and are included in the concept and scope of the invention. Furthermore, all of the conditional terms and embodiments listed herein are, in principle, only intended for the purpose of enabling understanding of the concepts of the present invention, and are not to be construed as limited to such specifically recited embodiments and conditions do.
또한, 본 발명의 원리, 관점 및 실시 예들뿐만 아니라 특정 실시 예를 열거하는 모든 상세한 설명은 이러한 사항의 구조적 및 기능적 균등물을 포함하도록 의도되는 것으로 이해되어야 한다. 또한 이러한 균등물들은 현재 공지된 균등물뿐만 아니라 장래에 개발될 균등물 즉 구조와 무관하게 동일한 기능을 수행하도록 발명된 모든 소자를 포함하는 것으로 이해되어야 한다.It is also to be understood that the detailed description, as well as the principles, aspects and embodiments of the invention, as well as specific embodiments thereof, are intended to cover structural and functional equivalents thereof. It is also to be understood that such equivalents include all elements contemplated to perform the same function irrespective of the currently known equivalents as well as the equivalents to be developed in the future, i.e., the structure.
본 명세서의 청구범위에서, 상세한 설명에 기재된 기능을 수행하기 위한 수단으로 표현된 구성요소는 예를 들어 상기 기능을 수행하는 회로 소자의 조합 또는 펌웨어/마이크로 코드 등을 포함하는 모든 형식의 소프트웨어를 포함하는 기능을 수행하는 모든 방법을 포함하는 것으로 의도되었으며, 상기 기능을 수행하도록 상기 소프트웨어를 실행하기 위한 적절한 회로와 결합된다. 이러한 청구범위에 의해 정의되는 본 발명은 다양하게 열거된 수단에 의해 제공되는 기능들이 결합되고 청구항이 요구하는 방식과 결합되기 때문에 상기 기능을 제공할 수 있는 어떠한 수단도 본 명세서로부터 파악되는 것과 균등한 것으로 이해되어야 한다.In the claims hereof, the elements represented as means for performing the functions described in the detailed description include all types of software including, for example, a combination of circuit elements performing the function or firmware / microcode etc. , And is coupled with appropriate circuitry to execute the software to perform the function. It is to be understood that the invention defined by the appended claims is not to be construed as encompassing any means capable of providing such functionality, as the functions provided by the various listed means are combined and combined with the manner in which the claims require .
상술한 목적, 특징 및 장점은 첨부된 도면과 관련한 다음의 상세한 설명을 통하여 보다 분명해질 것이며, 그에 따라 본 발명이 속하는 기술분야에서 통상의 지식을 가진 자가 본 발명의 기술적 사상을 용이하게 실시할 수 있을 것이다. 또한, 본 발명을 설명함에 있어서 본 발명과 관련된 공지 기술에 대한 구체적인 설명이 본 발명의 요지를 불필요하게 흐릴 수 있다고 판단되는 경우에 그 상세한 설명을 생략하기로 한다.BRIEF DESCRIPTION OF THE DRAWINGS The above and other objects, features and advantages of the present invention will become more apparent from the following detailed description of the present invention when taken in conjunction with the accompanying drawings, in which: There will be. In the following description, well-known functions or constructions are not described in detail since they would obscure the invention in unnecessary detail.
이하의 설명에서 사용되는 구성요소에 대한 접미사 "모듈" 및 "부"는 단순히 본 명세서 작성의 용이함을 고려하여 부여되는 것으로서, 상기 "모듈" 및 "부"는 서로 혼용되어 사용될 수도 있다.The suffix "module" and " part "for components used in the following description are given merely for ease of description, and the" module "and" part "
이하, 첨부된 도면을 참조하여 본 발명의 다양한 실시 예에 따른 에너지 관리 장치 및 그의 동작 방법을 상세히 설명하기로 한다.Hereinafter, an energy management apparatus and an operation method thereof according to various embodiments of the present invention will be described in detail with reference to the accompanying drawings.
먼저, 도 1은 본 발명에 따른 지능형 전력 시스템을 개략적으로 보여주는 도면이다.1 is a schematic view of an intelligent power system according to the present invention.
지능형 전력 시스템(지능형 전력망, Smart Grid)는 기존의 전력 시스템에 전보기술(IT)을 접목하여 전력 공급자와 소비자가 양방향으로 실시간 정보를 교환함으로써 에너지 효율을 최적화하는 차세대 전력 시스템이다.Intelligent power system (intelligent power grid, Smart Grid) is a next generation power system that combines electric power system with IT to optimize energy efficiency by exchanging information in real time between power supplier and consumer.
지능형 전력 시스템은 전기, 물, 가스 등과 같이 에너지원(Energy source)을 관리할 수 있다. 에너지원은, 발생량 또는 사용량 등이 계측(meter)될 수 있는 것을 의미한다.Intelligent power systems can manage energy sources such as electricity, water, and gas. The energy source means that the generated amount or the used amount can be measured.
따라서, 위에서 언급되지 않은 에너지원도 본 시스템의 관리 대상에 포함될 수 있다. 이하에서는 에너지원으로서 일 예로 전기에 대해서 설명하기로 하며, 본 명세서의 내용은 다른 에너지원에도 동일하게 적용될 수 있다.Therefore, an energy source not mentioned above can also be included in the management of the present system. Hereinafter, the electricity will be described as an example of the energy source, and the contents of this specification can be similarly applied to other energy sources.
도 1을 참조하면, 일 실시 예의 지능형 전력 시스템은, 전기를 생산하는 발전소(Power plant)를 포함한다. 발전소는, 화력발전이나 원자력발전 등을 통하여 전기를 생산하는 발전소와, 친환경 에너지인 수력, 태양광, 풍력 등을 이용한 발전소를 포함할 수 있다.Referring to FIG. 1, an intelligent power system of an embodiment includes a power plant that produces electricity. The power plant may include a power plant that produces electricity through thermal power generation or nuclear power generation, and a power plant that uses environmentally friendly energy such as hydro, solar, and wind power.
그리고, 발전소에서 발생된 전기는 송전선을 통하여 전력소로 송전되고, 전력소(substation)에서는 변전소로 전기를 송전하여 전기가 가정이나 사무실 같은 수요처로 분배되도록 한다.Electricity generated in the power plant is transmitted to the electric power plant through the transmission line, and electric power is transmitted to the substation in the substation so that electricity is distributed to the consumer such as the home or the office.
그리고, 친환경 에너지에 의하여 생산된 전기도 변전소로 송전되어 각 수요처로 분배되도록 한다. 그리고, 변전소에서 송전된 전기는 전기저장장치를 거쳐서 또는 직접 사무실이나 각 가정으로 분배된다.Electricity generated by environmentally friendly energy is also transmitted to the substation and distributed to each customer. Electricity transmitted from the substation is distributed through an electric storage device or directly to the office or each household.
가정용 네트워크(HAN, Home Area Network)를 사용하는 가정에서도 태양광이나 PHEV(하이브리드 전기자동차, Plug in Hybrid Electric Vehicle)에 장착된 연료전지 등을 통하여 전기를 자체적으로 생산하거나, 저장하거나, 분배하거나, 남는 전기를 외부(일 례로 전력회사)에 되팔 수도 있다.In the home using a home network (HAN, home area network), electric power can be produced, stored, distributed, or distributed through a solar cell or a fuel cell mounted on a PHEV (Hybrid Electric Vehicle) The remaining electricity can be sent back to the outside (for example, a power company).
또한, 지능형 전력 시스템에는, 수요처(가정 또는 사무실 등)의 전기 사용량을 실시간으로 파악하는 스마트 미터(Smart meter)와, 다수의 수요처의 전기 사용량을 실시간으로 계측하는 계측장치(AMI: Advanced Metering infrastructure)를 포함할 수 있다. 즉, 계측장치는 다수의 스마트 미터에서 계측된 정보를 받아 전기 사용량을 계측할 수 있다.In addition, the intelligent power system includes a smart meter for real-time monitoring of electricity consumption at a customer (home or office), an AMI (Advanced Metering infrastructure) for measuring electricity usage in a large number of customers, . ≪ / RTI > That is, the measuring apparatus can measure the electricity usage amount by receiving the measured information from a plurality of smart meters.
본 명세서에서, 계측은 스마트 미터 및 계측장치 자체가 계측하는 것뿐만 아니라, 다른 구성요소로부터 발생량 또는 사용량을 수신하여 스마트 미터 및 계측장치가 인식할 수 있는 것을 포함한다.In this specification, the measurement includes not only what the smart meter and the measuring apparatus itself measure, but also what the smart meter and the measuring apparatus can recognize, by receiving the amount of generation or usage from other components.
또한, 지능형 전력 시스템은, 에너지를 관리하는 에너지 관리 시스템(EMS: Energy Management System)을 포함할 수 있다. 에너지 관리 시스템은 에너지와 관련(에너지의 생성, 분배, 사용, 저장 등)하여, 하나 이상의 구성요소의 작동에 대한 정보를 생성할 수 있다. 에너지 관리 시스템은 적어도 구성요소의 작동에 관한 명령을 생성할 수 있다. 에너지 관리 장치(Energy Management Device)는 에너지 관리 시스템을 구성하는 하나의 에너지 제어 장치일 수 있다.In addition, the intelligent power system may include an energy management system (EMS) that manages energy. An energy management system can generate information about the operation of one or more components, such as energy generation (generation, distribution, use, storage, etc.). The energy management system may generate at least instructions regarding the operation of the component. The energy management device may be an energy control device constituting the energy management system.
본 명세서에서 에너지 관리 장치에 의해서 수행되는 기능 또는 솔루션은 에너지 관리 기능(Energy Management Function) 또는 에너지 관리 솔루션(Energy Management Solution)이라고 언급될 수 있다.The function or solution performed by the energy management apparatus in this specification may be referred to as an energy management function or an energy management solution.
본 발명의 실시 예에 따른 에너지 관리 장치는 지능형 전력 시스템에서 별도의 구성으로 하나 이상이 존재하거나, 하나 이상의 구성요소에 에너지 관리 기능 또는 솔루션으로서 포함될 수 있다.The energy management apparatus according to an embodiment of the present invention may be included in an intelligent power system as an energy management function or as a solution in one or more components or in a separate configuration.
도 2는 본 발명에 따른 지능형 전력 시스템을 개략적으로 보여주는 블럭도이다.2 is a schematic block diagram of an intelligent power system in accordance with the present invention.
도 1 및 도 2를 참조하면, 본 발명의 지능형 전력 시스템(100)은 다수의 컴포넌트 들에 의해서 구성된다. 예를 들어, 발전소, 변전소, 전력소, 에너지 관리 장치, 가전제품, 스마트 미터, 축전기, 웹 서버, 계측장치, 홈 서버 등이 지능형 전력 시스템의 컴포넌트들이다. 에너지 관리 장치는 로컬 에너지 관리 장치 및 글로벌 에너지 관리 장치를 포함하는 개념이다. 즉, 에너지 관리 장치가 속한 시스템에 따라 명칭을 달리하여 설명한 것뿐이므로, 명칭에 제한되지 않는다.Referring to Figures 1 and 2, the
또한, 본 발명에서, 각 컴포넌트는 다수의 세부 컴포넌트 들에 의해서 구성될 수 있다. 일 례로, 일 컴포넌트가 가전제품인 경우, 가전제품을 구성하는 마이컴, 히터, 디스플레이, 모터 등이 세부 컴포넌트일 수 있다.Further, in the present invention, each component can be constituted by a plurality of detailed components. For example, when one component is a household appliance, the microcomputer, the heater, the display, and the motor constituting the household appliance may be detailed components.
즉, 본 발명에서는 특정 기능을 수행하는 모든 것이 컴포넌트가 될 수 있으며, 이러한 컴포넌트 들은 본 발명의 지능형 전력 시스템을 구성한다. 그리고, 두 컴포넌트 들은 통신수단에 의해서 통신할 수 있다.That is, in the present invention, everything that performs a specific function may be a component, and these components constitute the intelligent power system of the present invention. And the two components can communicate by communication means.
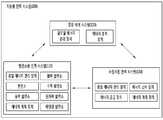
본 발명의 일 실시 예에 따른 지능형 전력 시스템(100)은 적어도 하나 이상의 발전소용 전력 시스템(110), 중앙 제어 시스템(120) 및 사용처용 전력 시스템(130)으로 구성될 수 있다.The
발전소용 전력 시스템(110)은 발전소들 간의 전력 정보(에너지 정보)를 공유하기 위함이다. 사용처용 전력 시스템(130)은 가정 내의 전기 기구들 간의 전력 정보를 공유하거나 사무실 내의 전기 기구들 간의 전력 정보를 공유하기 위함이다. 로컬 영역 시스템은 발전소용 전력 시스템(110) 또는 사용처용 전력 시스템(130)을 의미한다.The power plant power system 110 is for sharing power information (energy information) between power plants. The power system 130 for use is to share electric power information between the electric devices in the home or to share electric power information between the electric devices in the office. The local area system refers to a power system 110 for a power plant or a power system 130 for a user.
중앙 제어 시스템(120)은 로컬 영역 시스템 간의 전력 정보를 제어하기 위함이다. 글로벌 영역 시스템은 중앙 제어 시스템(120)을 의미할 수 있다. 글로벌 영역 시스템은 적어도 2 이상의 로컬 영역 시스템을 포함하는 것으로, 로컬 영역 시스템에 대응하는 상대적인 개념으로 이해할 수 있다.The central control system 120 is for controlling power information between local area systems. The global area system may refer to the central control system 120. The global area system includes at least two local area systems and can be understood as a relative concept corresponding to the local area system.
발전소용 전력 시스템(110)은 화력 발전이나 수력 발전 또는 원자력 발전을 통하여 전력을 발생시키는 발전소와 신재생 에너지인 태양광 또는 풍력을 이용한 태양광 발전소와 풍력 발전소를 포함할 수 있다. 여기서, 화력 발전소, 수력 발전소 등 발전소용 전력 시스템(110)을 구성하는 유닛을 “발전 컴포넌트”라 이름할 수 있다.The electric power system 110 for a power plant may include a power plant generating electric power through thermal power generation, hydroelectric power generation or nuclear power generation, and a photovoltaic power generation plant and a wind power generation plant using solar power or wind power, which is renewable energy. Here, a unit constituting the power system 110 for a power plant such as a thermal power plant or a hydroelectric power plant may be called a " power generation component ".
화력 발전소, 수력 발전소 또는 원자력 발전소에서 생산된 전력은 송전 선로를 통해 변전소로 보내지고, 변전소는 전압이나 전류의 성질을 바꾸어 가정용/사무실용 전력 시스템 내의 수요처로 전력을 분배하게 된다. 또한, 신재생 에너지에 의하여 생산된 전력도 변전소로 보내져 각 수요처로 분배된다.Power generated from thermal power plants, hydroelectric power plants or nuclear power plants is sent to the substation through the transmission line, and the substation changes the nature of the voltage or current to distribute the power to the customer in the home / office power system. In addition, power generated by renewable energy is sent to the substation and distributed to each customer.
중앙 제어 시스템(120)은 지능형 전력 시스템(110) 내의 로컬 영역 시스템 간의 전력 공급, 전력 소비, 전력 분배 및 관리 등을 제어하는 역할을 하며, 글로벌 에너지 관리 장치와 에너지 분석(계측 장치)를 포함한다.The central control system 120 serves to control power supply, power consumption, power distribution and management, etc. between the local area systems in the intelligent power system 110 and includes a global energy management device and an energy analysis (metering device) .
글로벌 에너지 관리 장치는 로컬 영역 시스템들을 제어하는 역할을 한다. 예를 들어, 글로벌 에너지 관리 장치는 발전소용 전력 네트워크(110) 내의 로컬 에너지 관리 장치와 사용처용 전력 시스템(130) 내의 로컬 에너지 관리 장치로부터 에너지 관련 정보들을 수신하여, 지능형 전력 시스템(100)의 전체적인 에너지 관리를 가능하게 한다.Global energy management devices are responsible for controlling local area systems. For example, the global energy management device may receive energy related information from a local energy management device in a power network 110 for a power plant and a local energy management device in a power system 130 for use, Enables energy management.
지능형 전력 시스템(100)은 에너지 관리 시스템(EMS, Energy Management System)을 포함할 수 있다. 에너지 관리 시스템이라 함은, 에너지 관리 프로그램을 이용하여 에너지 관리 장치를 제어하는 시스템을 의미한다.The
에너지 관리 시스템은 에너지 관리 장치들간의 통신을 통해서 각 수요처의 전력을 실시간 예측할 수 있다. 에너지 관리 시스템은 각 수요처 또는 공급처마다 구비될 수 있고, 더 나아가 각 로컬 영역 시스템 또는 각 글로벌 영역 시스템마다 구비될 수도 있다. 에너지 관리 시스템은 에너지 관리 장치에 포함된 형태로 제공될 수 있다.The energy management system can predict the power of each customer in real time through communication between energy management devices. The energy management system may be provided for each customer or source, and may be further provided for each local area system or each global area system. The energy management system may be provided in the form embedded in an energy management device.
에너지 관리 장치의 예로, 자동 온도 제어 장치, 케이블 셋톱 박스, 지능형 디스플레이 장치 또는 자동 등화 제어 장치 등을 들 수 있다. 또는, 에너지 관리 장치는 휴대 단말기 형태로 제공될 수 있으며, 이동 통신망 상에서 기지국, 외부의 단말, 서버 중 적어도 하나와 무선 신호를 송수신할 수 있다. 휴대 단말기의 예로는, 휴대폰, 스마트 폰(smart phone), 노트북 컴퓨터(notebook computer), 디지털방송용 단말기, PDA(Personal Digital Assistants), PMP(Portable Multimedia Player), 네비게이션, 웨어러블 기기(wearable device) 등을 들 수 있다. 그리고, 휴대 단말기에 근거리 통신 기술이 적용될 수 있으며, 근거리 통신 기술로는 블루투스(Bluetooth), RFID(Radio Frequency Identification), 적외선 통신(IrDA, Infrared Data Association), UWB(Ultra Wideband), ZigBee 등이 이용될 수 있다.Examples of the energy management device include an automatic temperature control device, a cable set-top box, an intelligent display device, or an automatic equalization control device. Alternatively, the energy management apparatus may be provided in the form of a portable terminal, and may transmit and receive a radio signal with at least one of a base station, an external terminal, and a server on a mobile communication network. Examples of the portable terminal include a mobile phone, a smart phone, a notebook computer, a digital broadcasting terminal, a PDA (Personal Digital Assistants), a PMP (Portable Multimedia Player), a navigation device, a wearable device, . The local area communication technology may be applied to the portable terminal. For example, Bluetooth, Radio Frequency Identification (RFID), Infrared Data Association (UDA), Ultra Wideband (UWB), ZigBee .
지능형 전력 시스템(100)은 에너지 계측 시스템(energy metering system)을 포함할 수 있다. 에너지 계측 시스템이라 함은 계측 장치들로부터 에너지 사용량을 측정하고, 에너지 사용에 관한 정보를 수집하고 분석하는 시스템을 의미한다. 계측 장치의 예로, 전기 미터기(electricity meters), 가스 미터기(gas meters) 또는 수도 미터기(water meters) 등을 들 수 있다. 에너지 계측 장치는 에너지 계측 시스템을 구성하는 하나의 구성 요소일 수 있다.The
에너지 관리 시스템과 에너지 계측 시스템은 소비자로 하여금 전기를 효율적으로 사용하도록 하고, 전력 공급자에게는 시스템 상의 문제를 탐지하여 시스템을 효율적으로 운영할 수 있는 능력을 제공한다.Energy management systems and energy metering systems enable consumers to use electricity efficiently, and power suppliers provide the ability to detect system problems and efficiently operate the system.
예를 들어, 전력시장의 실시간 가격신호가 각 가정에 설치된 에너지 관리 시스템을 통하여 중계되며, 에너지 관리 시스템은 각 전기 기기와 통신을 하고 이를 제어하므로 사용자는 에너지 관리 시스템을 통해 각 전기 기기의 전력정보를 인식하고 이를 기초로 소모전력량이나 전기요금 한계설정 등과 같은 전력 정보 처리를 수행함으로써 에너지 및 비용을 절약할 수 있다.For example, a real-time price signal of a power market is relayed through an energy management system installed in each home. Since the energy management system communicates with and controls each electric device, the user can use the energy management system Based on which the power information processing such as the amount of consumed power and the setting of the electricity rate limit can be performed to save energy and cost.
사용처용 전력 시스템(130)의 경우, 가정에서도 태양광이나 하이브리드 전기자동차(PHEV, Plug in Hybrid Electric Vehicle)에 장착된 연료전지를 통하여 전기를 스스로 생산하여 소비할 수 있고, 남는 전기는 다른 로컬 영역 시스템에 공급 또는 매매할 수도 있다. 그리고, 각 로컬 영역 시스템에서는 에너지 계측 장치가 마련되어서 각 수요처에서 사용되는 전력 및 전기요금을 실시간을 파악할 수 있고, 로컬 영역 시스템 내의 전력 공급 유닛은 현재 사용되는 전력량 및 전기요금을 인지하여 상황에 따라 전력소모량이나 전기요금을 줄이는 방안을 강구할 수 있다. 또한, 로컬 영역 시스템 사이 또는 로컬 영역 시스템 내의 유닛들 사이에서 양방향 통신이 가능하며, 어느 하나의 로컬 영역 시스템 내 유닛과 다른 하나의 로컬 영역 시스템 내 유닛(컴포넌트) 사이의 양방향 통신도 가능하다. 여기서, 유닛은 발전소, 전기 회사, 분산 전원, 에너지 관리 시스템, 에너지 계측 시스템, 에너지 관리 장치 또는 전기 기기 등을 포함할 수 있다. 예를 들어, 발전소용 전력 시스템(110)와 사용처용 전력 시스템(130) 사이의 양방향 통신이 가능하며, 사용처용 전력 시스템(130) 내 전기 기기들 사이의 양방향 통신도 가능하다. 또는 발전소용 전력 시스템(110) 내의 발전소와 사용처용 전력 시스템(130) 내의 에너지 관리 시스템 사이의 양방향 통신도 가능하다. 따라서, 각 수요처의 전력 소비 현황을 서로 모니터링하여 관리함으로써 적응적인 전기 생산 및 전기 분배가 가능하게 된다.In the case of the power system 130 used at home, electric power can be produced and consumed through the fuel cell mounted in the sunlight or a hybrid electric vehicle (PHEV) at home, It may be supplied or sold to the system. In each local area system, an energy measuring device is provided to grasp real-time power and electricity charges used in each customer, and the power supply unit in the local area system recognizes the current amount of electric power and electric charge, You can find ways to reduce power consumption and electricity bills. Further, bi-directional communication is possible between the local area systems or between units in the local area system, and bidirectional communication between units in any one local area system and another unit (component) in the local area system is also possible. Here, the unit may include a power station, an electric company, a distributed power source, an energy management system, an energy measurement system, an energy management device, or an electric device. For example, bi-directional communication is possible between the power system 110 for a power plant and the power system 130 for use, and bi-directional communication is possible between the electric devices in the power system 130 for the user. Or bi-directional communication between the power plant in the power system 110 for the power plant and the energy management system in the power system 130 for the user is also possible. Therefore, it is possible to adaptively generate electric power and distribute electricity by monitoring and managing the power consumption status of each customer.
다음으로 도 3은 본 발명의 실시 예에 따른 사용처용 전력 시스템을 개략적으로 보여주는 블럭도이다.3 is a schematic block diagram of a power system for use according to an embodiment of the present invention.
사용처용 전력 시스템(130)은 지능형 전력 시스템(100) 내에 포함된 하나의 로컬 영역 시스템에 해당할 수 있다. 사용처용 전력 시스템(130)은 지능형 전력 시스템(100) 내의 다른 로컬 영역 시스템과 양방향 통신이 가능하며, 독자적으로 에너지 공급, 소비, 저장, 측량, 관리 및 통신 등이 가능하다.The user power system 130 may correspond to one local area system included in the
사용처용 전력 시스템(130)은 크게 에너지 공급 장치, 에너지 소비 장치, 로컬 에너지 관리 장치 및 에너지 계측 장치로 구성될 수 있다.The user power system 130 can be largely composed of an energy supply device, an energy consumption device, a local energy management device, and an energy measurement device.
사용처용 전력 시스템(130)은 공중파 채널을 통해 사용처용 전력 시스템(130) 내 구성 유닛의 일반적인 관리를 위한 정보를 수신할 수 있다. 예를 들어, 공중파 채널을 통해 수신 가능한 정보로는 유닛 식별 정보(Unit Identifier), 현재 요금 정보, 현재 요금의 상대적 레벨 정보(예를 들어, 높음, 중간, 낮음), 용도 정보(예를 들어, 거주용, 상업용), 오류 확인 정보(예를 들어, CRC 정보) 등을 들 수 있다. 그리고, 공중파 채널을 수신하기 위한 방송 수신 모듈로는, DMB-T(Digital Multimedia Broadcasting-Terrestrial), DMB-S(Digital Multimedia Broadcasting-Satellite), MediaFLO(Media Forward Link Only), DVB-H(Digital Video Broadcast-Handheld), ISDB-T(Integrated Services Digital Broadcast-Terrestrial) 등을 들 수 있다.The user power system 130 can receive information for general management of the configuration unit in the power system 130 for use by the user via the airwave channel. For example, information that can be received through the airwave channel includes unit identifier, current fare information, relative level information of the current fare (e.g., high, medium, low), usage information (e.g., Residential, commercial), error confirmation information (for example, CRC information), and the like. The broadcast receiving module for receiving the airwave channel may be a Digital Multimedia Broadcasting-Terrestrial (DMB-T), a Digital Multimedia Broadcasting-Satellite (DMB-S), a Media Forward Link Only Broadcast-Handheld (ISDB-T), and Integrated Services Digital Broadcast-Terrestrial (ISDB-T).
한편, 에너지 계측 장치로부터 획득된 정보는 외부의 에너지 분석 장치로 전송될 수 있고, 로컬 에너지 관리 장치로부터 획득된 정보는 외부의 글로벌 에너지 관리 장치 또는 다른 로컬 에너지 관리 장치로 전송될 수 있다.On the other hand, the information obtained from the energy measurement device can be transmitted to an external energy analysis device, and the information obtained from the local energy management device can be transmitted to an external global energy management device or other local energy management device.
에너지 공급 장치는 사용처용 전력 시스템(130) 내의 모든 유닛에 전력을 공급하는 역할을 하며, 분산형 전원, 집중형 전원 및 에너지 저장 시스템(ESS, Energy Storage System) 등을 포함할 수 있다.The energy supply device serves to supply power to all the units in the power system 130 for the user, and may include a distributed power source, a centralized power source, and an energy storage system (ESS).
분산형 전원은 기존의 발전소로부터 제공되는 전력을 제외한 다른 전력 공급원을 의미한다. 예를 들어, 다른 로컬 영역 시스템 또는 자가 전력 공급원(예를 들어, 태양광, 풍력 발전원, 연료 전지 등)으로부터 제공되는 전력을 의미할 수 있다. 분산형 전원은 태양광, 하이브리드 전기 자동차 등을 통해 자체적으로 전기를 생산 및 저장할 수 있으며, 나아가 다른 로컬 영역 시스템에 전기를 제공할 수도 있다.A distributed power source means a power source other than the power supplied from an existing power plant. For example, power from another local area system or from a self-powered source (e.g., solar, wind power, fuel cell, etc.). Distributed power supplies can produce and store electricity themselves through solar, hybrid electric vehicles, and even provide electricity to other local area systems.
(중앙)집중형 전원은 지역난방공사 등에서 대규모 발전을 통해 공급하는 에너지원을 의미한다. 구체적으로, 외부 발전소에서 발생된 전기가 송전선을 통해 전력소로 송전되고, 전력소에서는 변전소로 전기를 송전한다. 집중현 전원은 변전소를 통해 공급된 에너지원을 의미할 수 있다. 집중형 전원은 효율이 높은 반면에, 초기 투자 비용이 많이 높은 단점이 있다.(Central) Concentrated power means the energy source supplied by the district heating corporation through large-scale power generation. Specifically, electricity generated from an external power plant is transmitted to a power station through a transmission line, and electricity is transmitted from a power station to a substation. Concentrated current power can refer to an energy source supplied through a substation. Concentrated power sources have high efficiency, but they have a high initial investment cost.
ESS는 외부 전력 공급원으로부터 제공되는 에너지를 저장하고, 필요시 사용처용 전력 시스템(130) 내 유닛들에 에너지를 분배하는 역할을 한다.The ESS is responsible for storing the energy provided by the external power source and distributing energy to units in the power system 130 for use when needed.
에너지 소비 장치는 에너지 공급 장치들로부터 제공되는 에너지를 로컬 에너지 관리 장치로부터 전달된 명령에 기초하여 에너지를 소비하게 되며, 가전 기기, 자동 온도 제어 장치, 케이블 셋톱 박스, 자동 등화 제어 장치 등의 전기 기기를 포함할 수 있다. 에너지 소비 장치는 일 례로 가전제품(냉장고, 세탁기, 에어컨, 조리기기, 청소기, 건조기, 식기세척기, 제습기, 디스플레이 기기, 조명기기 등) 또는 가전제품을 구성하는 히터, 모터, 디스플레이 등일 수 있다. 본 실시 예에서 에너지 소비 장치의 종류에는 제한이 없음을 밝혀둔다.The energy consuming device consumes energy from the energy supplying devices based on a command transmitted from the local energy managing device, and the electric power is consumed by the electric appliance such as a household appliance, an automatic temperature control device, a cable set-top box, . ≪ / RTI > The energy consuming device may be, for example, a heater, a motor, a display, etc. constituting a home appliance (a refrigerator, a washing machine, an air conditioner, a cooking appliance, a vacuum cleaner, a drier, a dishwasher, a dehumidifier, a display device, It is noted that there is no limitation in the kind of the energy consuming device in the present embodiment.
로컬 에너지 관리 장치는 사용처용 전력 시스템(130)을 구성하는 모든 장치를 제어하는 역할을 한다. 로컬 에너지 관리 장치를 구성하는 각각의 구성요소는 도 4에서 후술하기로 한다.The local energy management device controls all the devices constituting the power system 130 for the user. Each of the components constituting the local energy management apparatus will be described later in Fig.
에너지 계측 장치는 에너지 공급 장치 또는 에너지 소비 장치와 연결되어 에너지 사용량을 측정하고 에너지 사용에 관한 정보를 수집하고 분석하는 역할을 하며, 전기 미터기, 가스 미터기, 수도 미터기 등을 포함할 수 있다. 에너지 계측 장치로부터 획득된 정보는 에너지 계측 시스템으로 전송될 수 있다. 에너지 계측 시스템으로 전송된 정보는 중앙 제어 시스템(120) 내의 에너지 분석 장치로 전송될 수 있다.An energy measurement device is connected to an energy supply device or an energy consumption device to measure energy usage, collect and analyze information on energy use, and may include an electricity meter, a gas meter, a water meter, and the like. The information obtained from the energy measuring device can be transmitted to the energy measuring system. The information transmitted to the energy measurement system may be transmitted to an energy analysis device in the central control system 120.
사용처용 전력 시스템(130) 내의 모든 유닛들은 서로 양방향 통신이 가능하며, 에너지 관리 장치를 통해 모든 유닛들이 제어될 수 있다.All the units in the power system 130 for use at the user side are capable of two-way communication with each other, and all the units can be controlled through the energy management device.
이하, 도 4에서는 본 발명의 실시 예에 따른 에너지 관리 장치의 구성요소를 설명한다. 에너지 관리 장치는 지능형 전력 시스템(100)의 에너지를 제어하기 위한 글로벌 에너지 관리 장치 또는 로컬 에너지 시스템의 에너지를 제어하기 위한 에너지 관리 장치를 의미한다.Hereinafter, components of the energy management apparatus according to the embodiment of the present invention will be described with reference to FIG. The energy management device refers to a global energy management device for controlling the energy of the
도 4는 본 발명의 실시 예에 따른 에너지 관리 장치의 구성요소를 나타내는 블럭도이다.4 is a block diagram illustrating components of an energy management apparatus according to an embodiment of the present invention.
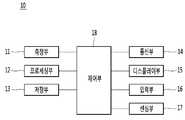
도 4를 참조하면, 본 발명의 실시 예에 따른 에너지 관리 장치(10)는 측정부(11), 프로세싱부(12), 저장부(13), 통신부(14), 디스플레이부(15), 입력부(16), 센싱부(17) 및 제어부(18)를 포함할 수 있다.4, an
측정부(11)는 각 장치의 전력 상태 정보를 측정하고 모니터링한다. 각 장치의 전력 상태 정보라 함은 지능형 전력 시스템(100)을 구성하는 유닛의 전력 상태를 나타내는 정보를 의미한다. 여기서, 유닛은 발전소, 전기 회사, 분산형 전원, 에너지 관리 시스템, 에너지 계측 시스템, 또는 전기 기기 등을 포함할 수 있다. 그리고, 전력 상태 정보의 예로는 순간 전력 수요량, 누적 전력 소비량, 누적 전력 생산량, 주기당 전력 소비량, 주기당 전력 생산량 또는 허용 전력량 등을 들 수 있다.The
또한, 측정부(11)는 현재의 에너지 상태(예를 들어, 시간당 에너지 소비량 또는 현재 요금 상태), 해당 장치의 현재 상태(예를 들어, 작동중, 대기중, 정비중), 작동 모드 상태(예를 들어, 충전중, 사용중), 전력의 품질 상태(예를 들어, 주파수, 중립 전압, 고조파 상태), 환경 상태(예를 들어, 온도, 습도, 움직임, 바람, 빛의 세기) 및 환경적 영향(예를 들어, CO2 배출량) 등을 모니터링할 수 있다. 측정부(11)로부터 측정된 전력 상태 정보는 프로세싱부(12) 또는 제어부(18)로 출력되거나 통신부(14)를 통하여 다른 에너지 관리 장치(10)로 전송될 수 있다.The measuring
프로세싱부(12)는 측정부(11)로부터 수신된 전력 상태 정보를 이용하여 에너지 소비 정보를 계산한다. 에너지 소비 정보라 함은, 사용자의 에너지 소비를 관리하기 위해 필요한 제반 정보를 의미한다. 에너지 소비 정보의 예로서 누적 에너지 소비의 에너지 비용, 순간 전력 소비의 에너지 비용, 시간당 에너지 비용, 계층별 에너지 비용(energy cost for rate tiers/energy blocks), 사용 시간과 에너지 관계에 따른 에너지 비용(energy cost for Time-of-use energy rates), 주기별 피크 요금에 따른 비용(cost for Critical Peak Pricing), 소비율에 따른 요구 비용(cost for Capacity billing rates), 청구 요인에 따른 비용(예를 들어, 세금, 대여료, 할인), 사용자 정의된 파라미터에 따른 비용, 주기별 히스토리에 따른 비용, 주기별 히스토리에 따른 전력 생산량/소비량, 또는 환경적 영향 정보(예를 들어, 이산화탄소 배출량, 이산화탄소 배출 예측량) 등을 들 수 있다. 계산된 에너지 소비 정보는 디스플레이부(15)를 통하여 디스플레이되거나 통신부(14)를 통하여 다른 에너지 관리 장치로 전송될 수 있다.The
저장부(13)는 측정부(11)를 통해 측정된 각 장치의 전력 상태 정보 또는 프로세싱부(12)를 통해 계산된 에너지 소비 정보를 저장한다. 저장부(13)는 저장된 각 정보를 기 설정된 주기마다 업데이트할 수 있다. 구체적으로, 저장부(13)는 소정 기간 이상 저장된 에너지 소비 정보를 삭제하고, 기 설정된 주기마다 새로운 에너지 소비 정보를 수신하여 저장할 수 있다. 예를 들어, 에너지 소비 정보를 삭제하는 소정 기간은 3개월이고, 새로운 에너지 소비 정보를 수신하는 주기는 1일일 수 있으나, 이는 예시적인 것에 불과하므로 이에 제한되지 않음이 타당하다.The
통신부(14)는 유선 또는 무선으로 구성될 수 있으며, 측정부(11), 프로세싱부(12) 및 제어부(18)로부터 출력된 정보를 다른 에너지 관리 장치(10)로 전송하거나, 다른 에너지 관리 장치(10)로부터 전송된 정보를 측정부(11), 프로세싱부(12), 저장부(13) 및 제어부(18)로 전달한다. 통신부(14)는 단순 통신선이거나 전력선 통신수단(Power line communication means)일 수 있다. 전력선 통신수단은 두 컴포넌트와 각각 연결되는 통신기(일 례로 모뎀 등)를 포함할 수 있다. 다른 예로서, 통신부(14)는 zigbee, wi-fi, 블루투스 등일 수 있다.The
디스플레이부(15)는 에너지 관리에 필요한 정보를 표시한다. 구체적으로, 디스플레이부(15)는 각 장치의 작동 상태를 표시하거나 각 장치의 초기화를 설정할 수 있는 리셋 정보를 표시할 수 있다. 예를 들어, 디스플레이부(15)는 알람 정보(예를 들어, 한계 가격 정보를 알리는 알람, 이벤트 메시지)를 제공할 수 있으며, 각 장치의 상세한 정보(예를 들어, 장치의 종류, 모델명, 기본 설정 사항, 배터리 수명)를 디스플레이할 수도 있다.The
또한, 디스플레이부(15)는 측정부(11)를 통해 측정된 장치의 전력 상태 정보, 프로세싱부(12)를 통해 계산된 에너지 소비 정보 또는 통신부(14)를 통해 수신된 정보를 표시할 수 있다. 디스플레이부(15)는 제어부(18)를 통해 전달된 에너지 관련 정보를 표시할 수 있다. 또한, 디스플레이부(15)는 입력부(16)를 통해 수신된 사용자 명령 등을 표시할 수 있다.The
입력부(16)는 에너지 관리에 필요한 사용자 명령을 수신할 수 있다. 예를 들어, 입력부(16)는 에너지 공급 장치 또는 에너지 소비 장치를 제어하기 위한 사용자 명령을 수신할 수 있다. 또 다른 예로, 입력부(16)는 에너지 관리 장치(10)의 제어에 필요한 각종 설정 정보를 입력하는 명령을 수신할 수 있다.The
입력부(16)는 사용자로부터 입력된 정보를 측정부(11), 프로세싱부(12) 또는 제어부(18)로 전달할 수 있다.The
센싱부(17)는 시스템을 구성하는 적어도 하나 이상의 에너지 장치의 제어 신호를 감지할 수 있다. 에너지 장치는 에너지를 생산 또는 소비하는 장치를 의미한다. 예를 들어, 에너지 관리 장치(10)가 사용처용 전력 시스템(130)에 포함된 경우 에너지 장치는 에너지 공급 장치(태양광 발전기, 풍력 발전기, 연료 전지, 집중형 전원 및 ESS) 및 에너지 소비 장치(전기 기기)를 포함한다. 센싱부(17)는 이와 같은 에너지 장치의 제어 신호를 감지할 수 있다. 제어 신호는 전원 온/오프 신호, 동작 모드 설정 신호 등을 포함할 수 있다.The
제어부(18)는 에너지 관리 장치(10)의 동작에 필요한 전반적인 동작을 제어한다. 제어부(18)는 에너지 관리 장치(10)를 구성하는 다른 구성요소의 동작을 제어할 수 있다.The
제어부(18)는 입력 신호에 기초하여 에너지 관리 장치(10)를 제어한다. 예를 들어, 제어부(18)는 전기 부하의 온/오프를 제어할 수 있고, 또는 시간 간격의 설정에 따라 전기 부하의 온/오프를 제어할 수도 있다. 제어부(18)는 기 설정된 임계치의 범위 내에서 사용자의 설정에 따라 보다 정밀한 제어도 가능할 수 있다. 또한, 제어부(18)는 임계값, 설정값 또는 가격점 등에 기초하여 작동 모드를 제한할 수 있다. 예를 들어, 표준 모드로 작동하는 도중 일정한 가격점에 도달하게 되는 경우 표준 모드를 제한하고, 절약 모드로 전환되도록 할 수 있다. 이처럼 제어부(18)는 입력부(16)로부터 수신된 입력 정보에 기초하여 효율적인 전력 소비에 최적인 제어 명령을 출력하게 된다.The
또한, 제어부(18)는 시스템 내 에너지 장치를 제어할 수 있다. 예를 들어, 제어부(18)는 시스템 내 에너지 장치의 전원을 온 또는 오프시키거나 에너지 장치의 동작 모드를 제어할 수 있다.In addition, the
또한, 제어부(18)는 측정부(11)를 통해 획득된 각 에너지 장치의 전력 상태 정보를 이용하여, 에너지 운영 현황을 디스플레이부(15)에 표시하도록 제어할 수 있다.The
에너지 운영 현황은 시스템 내 에너지 장치의 에너지 발전 정보, 에너지 소비 정보 및 에너지 효율 정보를 포함할 수 있다.The energy operation status may include energy generation information, energy consumption information and energy efficiency information of the energy devices in the system.
도 5는 종래 에너지 운영 현황을 표시하는 방법을 나타내는 예시 도면이다. 구체적으로, 도 5에 도시된 그래프는 시스템 내 임의의 에너지 공급 장치가 생산하는 에너지 발전량을 시간의 흐름에 따라 나타낸 예시 그래프이다.5 is an exemplary diagram showing a method of displaying a conventional energy operation status. Specifically, the graph shown in FIG. 5 is an exemplary graph showing the amount of energy generation produced by any energy supply device in the system in accordance with the passage of time.
도 5에 도시된 바와 같이, 종래 에너지 관리 장치는 에너지 운영 현황을 평면 그래프로 표시하고 있다. 따라서, 주로 한 화면에 하나의 에너지 관리 장치의 에너지 운영 현황만을 표시하기 때문에 에너지 운영 현황을 에너지 장치 별로 확인해야 하는 불편함이 있다. 또한, 여러 개의 에너지 관리 장치를 비교하면서 에너지 운영 현황을 분석하기 어려운 점이 있다.As shown in FIG. 5, the conventional energy management apparatus displays the energy operation status in a plane graph. Therefore, there is an inconvenience that it is necessary to check the energy operation status by each energy device, because only one energy management device displays energy operation status on one screen. In addition, it is difficult to analyze the energy operation status while comparing several energy management devices.
또한, 한 화면에 복수 개의 에너지 관리 장치의 에너지 운영 현황을 표시하더라도 평면 상에 여러 개의 데이터가 오버랩 되어 에너지 운영 현황의 분석이 용이하지 않다.In addition, even if energy management statuses of a plurality of energy management devices are displayed on one screen, it is not easy to analyze the energy operation status because a plurality of data overlap on a plane.
다음으로, 도 6 내지 도 20을 참조하여 본 발명의 실시 예에 따른 에너지 관리 장치(10)가 에너지 운영 현황을 표시하는 방법을 설명한다.Next, a method of displaying the energy management status by the
먼저, 도 6은 본 발명의 실시 예에 따른 에너지 관리 장치가 에너지 운영 현황을 표시하는 방법을 나타내는 순서도이다.6 is a flowchart illustrating a method of displaying an energy management status according to an embodiment of the present invention.
디스플레이부(15)는 에너지 분석 화면을 표시할 수 있다(S101).The
제어부(18)는 측정부(11)를 통해 시스템 내 에너지 장치의 전력 상태 정보를 획득할 수 있다. 또는, 제어부(18)는 통신부(14)를 통해 시스템 내 에너지 장치의 전력 상태 정보를 에너지 계측 장치로부터 수신할 수 있다.The
제어부(18)는 시스템 내 에너지 장치의 전력 상태 정보를 통해 에너지 운영 현황을 분석할 수 있다. 구체적으로, 제어부(18)는 시스템 내 에너지 장치의 에너지 발전량, 에너지 소비량 및 에너지 효율 등을 분석할 수 있다.The
제어부(18)는 분석된 에너지 운영 현황에 기초하여, 에너지 분석 화면을 표시하도록 디스플레이부(15)를 제어할 수 있다.The
다음으로, 도 7은 본 발명의 실시 예에 따른 에너지 관리 장치가 에너지 분석 화면을 표시하는 방법을 설명하기 위한 도면이다.7 is a view for explaining a method of displaying an energy analysis screen by the energy management apparatus according to the embodiment of the present invention.
입력부(16)는 에너지 분석 화면 표시 명령을 수신할 수 있다. 제어부(18)는 에너지 분석 화면 표시 명령을 수신하면, 에너지 운영 현황을 분석하여 도 7에 도시된 바와 같은 에너지 분석 화면을 표시할 수 있다.The
도 7을 참조하면, 에너지 분석 화면은 에너지 그래프(600) 및 에너지 분석 메뉴(700)를 포함할 수 있다. 에너지 분석 메뉴(700)는 분석 종류 메뉴(710), 축별 옵션 메뉴(720) 및 표시 방식 메뉴(730)를 포함할 수 있다.Referring to FIG. 7, the energy analysis screen may include an
분석 종류 메뉴(710)는 에너지 그래프(600)로 표시될 에너지 분석 대상을 선택하기 위한 메뉴이다. 분석 종류 메뉴(710)는 에너지 발전량, 에너지 소비량 및 에너지 발전 효율을 포함할 수 있다. 그러나, 이는 예시적인 것으로, 분석 종류 메뉴(710)는 실외기별 냉동 성능 지표 및 조명별 디밍(dimming) 등과 같이 적어도 하나 이상의 유닛으로 구성되는 그룹의 에너지 관련 정보를 더 포함할 수 있다.The
제어부(18)는 분석 종류 메뉴(710)를 통해 에너지 분석 대상을 선택하는 명령을 수신하고, 수신된 명령에 대응하는 에너지 그래프(600)를 표시할 수 있다.The
축별 옵션 메뉴(720)는 에너지 그래프(600)를 구성하는 제1 축 내지 제3 축을 설정하기 위한 메뉴이다. 제1 축 내지 제3 축은 X축, Y축 및 Z축일 수 있다.The
제1 내지 제3 축은 각각 시간, 에너지 장치 및 에너지 분석 대상 중 어느 하나로 맵핑될 수 있다.The first to third axes may each be mapped to either time, energy device, or energy analysis object.
시간은, 에너지 그래프(600)를 표시하는 시간 단위를 나타낸다. 제어부(18)는 시간축 옵션 메뉴를 통해 1시간, 1일, 1주, 1달 및 1년 중 어느 하나를 선택하는 명령을 수신하고, 선택된 단위에 기초하여 에너지 그래프(600)를 표시할 수 있다.The time represents a time unit representing the
에너지 분석 대상은, 에너지 그래프(600)로 표시되는 에너지 데이터를 의미할 수 있다. 에너지 분석 대상은 에너지 발전량, 에너지 소비량, 에너지 발전 효율, 실외기별 냉동 성능 지표 및 조명별 디밍 중 적어도 하나 이상을 포함할 수 있다.The energy analysis object may mean energy data represented by the
제어부(18)는 에너지 분석 대상을 선택하는 명령을 수신하면, 선택된 에너지 분석 대상과 관련된 에너지 데이터를 획득하여 에너지 그래프(600)로 표시할 수 있다.Upon receipt of the instruction to select an energy analysis target, the
에너지 장치는, 에너지 그래프(600)로 표시되는 에너지 데이터에 대응하는 에너지 공급 장치 또는 에너지 소비 장치를 의미할 수 있다. 즉, 에너지 장치는 에너지 분석 대상에 따라 달리질 수 있다.The energy device may mean an energy supply device or an energy consumption device corresponding to the energy data represented by the
예를 들어, 에너지 분석 대상이 에너지 발전량 또는 에너지 발전 효율이면 에너지 장치는 에너지 공급 장치이고, 에너지 분석 대상이 에너지 소비량이면 에너지 장치는 에너지 소비 장치이고, 에너지 분석 대상이 실외기별 냉동 성능 지표이면 에너지 장치는 빌딩 내 실외기이고, 에너지 분석 대상이 조명별 디밍이면 에너지 장치는 빌딩 내 조명일 수 있다.For example, if the energy analysis target is energy generation or energy generation efficiency, if the energy device is an energy supply device, the energy analysis target is energy consumption device, and the energy device is an energy consumption device. If the energy analysis target is an outdoor performance- Is an outdoor unit in a building, and if the energy analysis target is dimming by illumination, the energy device may be an illumination in a building.
본 발명과 같이, 에너지 관리 장치(10)는 축별 옵션 메뉴(720)를 제공하여 사용자가 자유롭게 에너지 운영 현황을 분석할 수 있는 방법을 제공하는 효과가 있다.As in the present invention, the
한편, 제어부(18)는 분석 종류 메뉴(710)를 통해 에너지 분석 대상이 선택되면, 축별 옵션 메뉴(720)의 에너지 분석 대상 축과 에너지 장치 축이 자동으로 선택되도록 제어할 수 있다. 또는, 제어부(18)는 에너지 분석 대상 축 또는 에너지 장치 축의 변경에 따라 분석 종류 메뉴(710)의 선택 항목이 변경되도록 제어할 수 있다.Meanwhile, when the energy analysis target is selected through the
표시 방식 메뉴(730)는 3차원 보기 항목(731), X축-Y축 보기 항목(732), X축-Z축 보기 항목(733) 및 Y축-Z축 보기 항목(734)을 포함할 수 있다.The
제어부(18)는 표시 방식 메뉴(730)에서 어느 하나의 항목을 선택하는 명령을 수신하면, 선택된 항목에 대응하는 에너지 그래프로 표시 방식을 변경할 수 있다.When the
에너지 그래프의 표시 방식은 도 8 내지 도 11을 통해 후술하기로 한다.The display method of the energy graph will be described later with reference to FIG. 8 to FIG.
다시 도 6을 설명한다.6 will be described again.
제어부(18)는 표시 방식 변경 명령을 수신하는지 판단할 수 있다(S103).The
즉, 제어부(18)는 표시 방식 메뉴(730)를 통해 에너지 그래프의 표시 방식을 변경하는 명령을 수신하였는지 판단할 수 있다.That is, the
제어부(18)는 표시 방식 변경 명령을 수신하면, 변경된 표시 방식에 대응하는 에너지 그래프를 표시할 수 있다(S105).Upon receipt of the display mode change command, the
다음으로, 도 8 내지 도 11을 참조하여, 에너지 그래프의 표시 방식을 설명한다.Next, the display method of the energy graph will be described with reference to Figs. 8 to 11. Fig.
먼저, 도 8은 본 발명의 실시 예에 따른 3차원 표시 방식에 따른 에너지 그래프를 설명하기 위한 도면이다.8 is a view for explaining an energy graph according to a three-dimensional display system according to an embodiment of the present invention.
제어부(18)는 제1 축(810), 제2 축(820) 및 제3 축(830)이 각각 시간, 에너지 장치 및 에너지 분석 대상인 3차원 에너지 그래프(610)를 표시할 수 있다. 제1 축 내지 제3 축(810, 820, 830)은 각각 X축, Y축 및 Z축 중 어느 하나일 수 있다.The
이하, 제1 축(810)은 X축으로 시간을 나타내고, 제2 축(820)은 Y축으로 에너지 공급 장치를 나타내고, 제3 축(830)은 Z축으로 에너지 발전량을 나타내는 3차원 에너지 그래프(610)를 예로 들어 설명하나, 이는 발명의 설명을 위해 예시로 든 것에 불과하므로 이에 제한되지 않음이 타당하다.Hereinafter, the
도 8에 도시된 3차원 에너지 그래프(610)를 참조하면, 제1 축(810)인 X축은 1시간 단위로 시간을 나타내고, 제2 축(820)인 Y축은 에너지 공급 장치를 나타내고, 제3 축(830)인 Z축은 에너지 발전량을 나타낸다. 이에 따르면, 1일동안 에너지 공급 장치별 에너지 발전량을 한 화면에 모두 표시할 수 있는 효과가 있다.Referring to the three-
한편, 제어부(18)는 에너지 공급 장치별로 색상을 달리하여 3차원 에너지 그래프(610)를 표시할 수 있다.On the other hand, the
또한, 제어부(18)는 에너지 발전량에 따라 3차원 에너지 그래프(610)의 채도를 변경하여 표시할 수 있다. 구체적으로, 제어부(18)는 에너지 발전량에 비례하여 채도가 증가하도록 3차원 에너지 그래프(610를 표시할 수 있다.Also, the
이와 같이, 본 발명에 따른 에너지 관리 장치는 3차원 표시 방식의 에너지 그래프를 이용하여 에너지 운영 현황을 사용자가 단번에 알기 쉽도록 직관적으로 표시할 수 있는 효과가 있다.As described above, the energy management apparatus according to the present invention has the effect of intuitively displaying the energy operation status using the energy graph of the three-dimensional display system so that the user can understand the energy operation status at a time.
다음으로 도 9는 본 발명의 실시 예에 따른 X축-Y축 보기 방식에 따른 에너지 그래프를 설명하기 위한 도면이다.9 is a diagram for explaining an energy graph according to the X-axis and Y-axis viewing method according to the embodiment of the present invention.
제어부(18)는 표시 방식 메뉴(730)에서 X축-Y축 보기 항목(732)을 선택하는 명령을 수신하면, 도 9에 도시된 바와 같이 가로 막대형 그래프(620)를 표시할 수 있다.The
제어부(18)는 가로 막대형 그래프(620)를 에너지 공급 장치 별로 표시할 수 있다.The
제어부(18)는 가로 막대형 그래프(620)를 표시하는 경우 3차원 표시 방식에서 Z축에 해당하는 데이터를 채도로 표시할 수 있다. 즉, 하나의 가로 막대형 그래프(620)는 복수 개의 영역으로 분할되고, 분할된 각 영역은 Z축에 해당하는 데이터에 따라 채도가 상이할 수 있다.When the
예를 들어, 제어부(18)는 에너지 공급 장치 별로 시간에 따른 에너지 발전량을 채도를 다르게 하여 표시할 수 있다. 즉, 제어부(18)는 에너지 발전량이 높을수록 채도를 진하게 표시하는 방법으로 가로 막대형 그래프(620)를 표시할 수 있다.For example, the
이와 같은 가로 막대형 그래프(620)는 도 8의 3차원 표시 방식의 에너지 그래프(810)를 위에서(Z축 방향에서) 바라본 모습일 수 있다.Such a
한편, 이 경우에도 제어부(18)는 에너지 공급 장치별로 색상을 달리하여 에너지 그래프를 표시할 수 있다.Also in this case, the
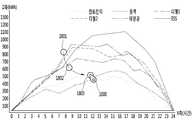
다음으로 도 10은 본 발명의 실시 예에 따른 X축-Z축 보기 방식에 따른 에너지 그래프를 설명하기 위한 도면이다.10 is a view for explaining an energy graph according to the X-axis and Z-axis view method according to the embodiment of the present invention.
제어부(18)는 표시 방식 메뉴(730)에서 X축-Z축 보기 항목(732)을 선택하는 명령을 수신하면, 도 10에 도시된 바와 같이 꺾은선 그래프(630)를 표시할 수 있다. 구체적으로, 제어부(18)는 3차원 표시 방식에서 Y축에 해당하는 에너지 공급 장치 별로 그래프가 구분되도록 꺾은선 그래프(630)를 표시할 수 있다.When the
예를 들어, 제어부(18)는 에너지 공급 장치 별로 꺾은선 그래프(630)의 색상 또는 선의 종류 등이 상이하도록 표시할 수 있다.For example, the
이와 같은, 꺾은선 그래프(630)는 도 8의 3차원 표시 방식의 에너지 그래프(810)를 정면에서(X축 방향에서) 바라본 모습일 수 있다.Such a
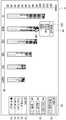
다음으로 도 11 내지 도 12는 본 발명의 실시 예에 따른 Y축-Z축 보기 방식에 따른 에너지 그래프를 설명하기 위한 도면이다.11 to 12 are diagrams for explaining an energy graph according to the Y-axis view method according to the embodiment of the present invention.
본 발명의 일 실시 예에 따르면, 제어부(18)는 표시 방식 메뉴(730)에서 Y축-Z축 보기 항목(734)을 선택하는 명령을 수신하면 도 11에 도시된 바와 같이 세로 막대형 그래프(640)를 표시할 수 있다. 구체적으로, 제어부(18)는 에너지 공급 장치 별 최대 에너지 발전량을 세로 막대형 그래프(640)로 표시할 수 있다. 즉, 세로 막대형 그래프(640)는 Z축에 대응하는 데이터의 최대 값을 나타낼 수 있다.According to one embodiment of the present invention, upon receipt of an instruction to select the Y axis-Z
따라서, 사용자는 에너지 공급 장치 별 최대 에너지 발전량을 단번에 알 수 있는 효과가 있다.Therefore, the user can know the maximum energy generation amount per energy supply device at a time.
한편, 도 12에 도시된 바와 같이, 본 발명의 다른 실시 예에 따르면, 제어부(18)는 Y축-Z축 보기 항목(734)을 선택하는 명령을 수신하면 세로 막대형 그래프(640)와 함께 피크 시간 윈도우(1201 내지 1206)를 더 표시할 수 있다.12, according to another embodiment of the present invention, when the
피크 시간 윈도우(1201 내지 1206)은 각 에너지 공급 장치가 생산하는 에너지 발전량이 최대인 시간 정보를 포함한다. 즉, 피크 시간 윈도우(1201 내지 1206)은 Z축에 대응하는 데이터가 최대 값을 나타낼 때의 시간 정보를 포함할 수 있다.The
이를 통해, 사용자는 에너지 공급 장치 별 최대 에너지 발전량 및 최대 에너지 발전량에 대응하는 시간 정보를 알 수 있는 효과가 있다.Accordingly, the user can know the time information corresponding to the maximum energy generation amount and the maximum energy generation amount for each energy supply device.
이와 같은, 세로 막대형 그래프(640)는 도 8의 3차원 표시 방식의 에너지 그래프(810)를 측면에서(Y축 방향에서) 바라본 모습일 수 있다.Such a
도 8 내지 도 11을 통해 에너지 분석 화면을 통해 표시하는 에너지 그래프 (600)를 설명하였다.The
이와 같이, 본 발명에 따른 에너지 관리 장치(10)는 표시 방식 메뉴(730)를 통해 3차원 에너지 그래프(610), 가로 막대형 그래프(620), 꺾은선 그래프(630) 및 세로 막대형 그래프(640) 중 어느 하나로 용이하게 변경할 수 있다. 즉, 사용자는 어느 한 형태의 그래프를 보다가 다른 형태의 그래프로 용이하게 변경할 수 있어, 에너지 운영 현황을 용이하게 분석할 수 있는 효과가 있다.As described above, the
특히, 제어부(18)는 에너지 분석 화면을 표시하는 경우 초기 에너지 그래프로 3차원 에너지 그래프(610)를 표시한 다음, 보다 상세한 에너지 운영 현황을 나타내는 그래프로 즉시 변경할 수 있는 표시 방식 메뉴(730)를 제공함으로써 사용자로 하여금 에너지 분석을 용이하게 할 수 있는 방법을 제공하는 효과가 잇다.In particular, when displaying the energy analysis screen, the
이와 같이, 제어부(18)는 에너지 분석 화면을 표시하는 경우 초기 에너지 그래프로 3차원 표시 방식의 에너지 그래프를 표시할 수 있다.In this way, when the energy analysis screen is displayed, the
또는, 제어부(18)는 입력부(16)를 통해 초기 에너지 그래프 설정 명령을 수신하여, 설정된 표시 방식에 대응하는 에너지 그래프를 초기에 표시할 수 있다. 구체적으로, 제어부(18)는 3차원 에너지 그래프, X축-Y축 그래프, X축-Z축 그래프 및 Y축-Z축 그래프 중 어느 하나를 초기 에너지 그래프로 설정하는 명령을 수신할 수 있다. 제어부(18)는 에너지 분석 화면을 표시하는 경우 초기 에너지 그래프를 설정된 표시 방식에 따라 표시할 수 있다.Alternatively, the
제어부(18)는 에너지 그래프를 표시하고, 표시된 에너지 그래프의 일 영역에 포인터가 위치하는지 감지할 수 있다(S107).The
포인터는 입력부(16)를 통해 수신되는 신호에 기초하여 디스플레이부(15) 상에서 이동할 수 있다. 또는, 디스플레이부(15)는 터치 스크린을 구비하여, 포인터는 터치 입력을 통해 이동할 수 있다.The pointer can move on the
제어부(18)는 디스플레이부(15)에 표시된 그래프 중 일 영역에 포인터가 위치하는지 감지할 수 있다. 디스플레이부(15)에 표시된 그래프는 3차원 에너지 그래프(610), 가로 막대형 그래프(620), 꺾은선 그래프(640) 및 세로 막대형 그래프(640) 중 어느 하나일 수 있다.The
만약, 제어부(18)는 에너지 그래프의 일 영역에서 포인터가 감지되지 않으면, 표시 중이 에너지 분석 화면을 계속해서 표시할 수 있다.If the pointer is not detected in one area of the energy graph, the
제어부(18)는 에너지 그래프의 일 영역에서 포인터가 감지되면, 포인터가 위치한 영역에 대응하는 에너지 정보를 획득할 수 있다(S109).When the pointer is detected in one area of the energy graph, the
구체적으로, 제어부(18)는 그래프에서 포인터가 위치한 영역에 대응하는 시간 정보, 에너지 장치 정보 및 에너지량 정보 중 적어도 하나 이상을 획득할 수 있다.Specifically, the
제어부(18)는 획득된 에너지 정보를 팝업 윈도우에 표시할 수 있다(S111).The
구체적으로, 제어부(18)는 포인터 위치에 대응하는 에너지 정보를 팝업 윈도우에 표시할 수 있다.Specifically, the
다음으로 도 13 내지 도 16은 본 발명의 실시 예에 따른 에너지 관리 장치가 팝업 윈도우를 표시하는 방법을 설명하기 위한 도면이다.13 to 16 are views for explaining a method of displaying a pop-up window by the energy management apparatus according to the embodiment of the present invention.
도 13에 도시된 바와 같이, 제어부(18)는 3차원 에너지 그래프(610)의 일 영역에 포인터(1000)가 위치함을 감지할 수 있다. 예를 들어, 제어부(18)는 포인터(1000)가 3차원 에너지 그래프(610)의 18:00~19:00 연료 전지의 발전에 대응하는 영역에 위치함을 감지할 수 있다.As shown in FIG. 13, the
제어부(18)는 포인터(1000)의 위치에 대응하는 에너지 정보를 획득하여, 팝업 윈도우(1300)에 표시할 수 있다. 팝업 윈도우(1300)는 18:00~19:00 연료 전지의 발전량은 570kWh을 나타내는 정보를 포함할 수 있다.The
또는, 도 14에 도시된 바와 같이, 제어부(18)는 가로 막대형 그래프(620)의 일 영역에 포인터(1000)가 위치함을 감지할 수 있다. 예를 들어, 제어부(18)는 가로 막대형 그래프(620)의 06:00~07:00 풍력 발전에 대응하는 영역에 포인터(1000)가 위치함을 감지할 수 있다.Alternatively, as shown in FIG. 14, the
제어부(18)는 포인터(1000)의 위치에 대응하는 에너지 정보를 획득하여, 팝업 윈도우(1300)에 표시할 수 있다. 팝업 윈도우(1300)는 06:00~07:00 풍력 발전량은 320kWh을 나타내는 정보를 포함할 수 있다.The
또는, 도 15에 도시된 바와 같이, 제어부(18)는 꺾은선 그래프(630)의 일 영역에 포인터(1000)가 위치함을 감지할 수 있다. 예를 들어, 제어부(18)는 꺾은선 그래프(630)의 11:00~12:00 연료전지 발전에 대응하는 영역에 포인터(1000)가 위치함을 감지할 수 있다.Alternatively, as shown in FIG. 15, the
제어부(18)는 포인터(1000)의 위치에 대응하는 에너지 정보를 획득하여, 팝업 윈도우(1300)에 표시할 수 있다. 팝업 윈도우(1300)는 11:00~12:00 연료전지 발전량은 550kWh을 나타내는 정보를 포함할 수 있다.The
또는, 도 16에 도시된 바와 같이, 제어부(18)는 세로 막대형 그래프(640)의 일 영역에 포인터(1000)가 위치함을 감지할 수 있다. 예를 들어, 제어부(18)는 세로 막대형 그래프(640)의 12:00~13:00 태양광 발전에 대응하는 영역에 포인터(1000)가 위치함을 감지할 수 있다.Alternatively, as shown in FIG. 16, the
제어부(18)는 포인터(1000)의 위치에 대응하는 에너지 정보를 획득하여, 팝업 윈도우(1300)를 표시할 수 있다. 팝업 윈도우(13000)는 12:00~13:00 태양광 발전량은 930kWh임을 나타내는 정보를 포함할 수 있다.The
제어부(18)는 이와 같이 에너지 그래프(600)상에서 포인터(1000)가 감지되면 팝업 윈도우(1300)를 표시하도록 제어할 수 있다. 그러나, 이는 예시적인 것으로, 제어부(18)는 포인터(1000)를 통해 에너지 그래프(600)의 일 영역을 더블 클릭하는 명령을 수신하는 경우에 팝업 윈도우(1300)를 표시할 수 있으며, 에너지 그래프(600)의 특정 영역을 선택하는 명령을 모두 포함할 수 있다.The
다시 도 6을 설명한다.6 will be described again.
제어부(18)는 에너지 그래프(600)의 일 영역에서 포인터를 드래그 앤 드랍하는 명령의 수신 여부를 감지할 수 있다(S113).The
구체적으로, 제어부(18)는 에너지 그래프(600)의 일 영역을 포인터(1000)로 선택하여 타 영역까지 드래그하여 드랍하는 명령을 수신하는지 감지할 수 있다.Specifically, the
제어부(18)는 드래그 앤 드랍 명령이 감지되면, 드래그 앤 드랍 명령에 기초하여 에너지 그래프의 표시 방향을 변경할 수 있다(S115).When the drag and drop command is detected, the
제어부(18)는 에너지 그래프(600)를 드래그 방향으로 드래그 거리만큼 회전시켜 표시할 수 있다.The
일 실시 예에 따르면, 제어부(18)는 3차원 에너지 그래프(610)를 회전시킬 수 있다. 구체적으로, 제어부(18)는 드래그 앤 드랍 명령에 따라 3차원 에너지 그래프(610)를 회전시켜 표시 방향을 변경할 수 있다.According to one embodiment, the
이에 따르면, 사용자는 분석 주제에 따라 3차원 에너지 그래프(610)를 자유롭게 회전시켜 필요한 영역을 상세하게 분석할 수 있는 효과가 있다.According to this, the user can freely rotate the three-
또한, 제어부(18)는 드래그 방향 및 드래그 거리에 따라 3차원 에너지 그래프(610)를 회전시켜 X축-Y축 방식의 그래프(가로 막대형 그래프, 620), X축-Z축 방식의 그래프(꺾은선 그래프, 630) 또는 Y축-Z축 방식의 그래프(세로 막대형 그래프, 640)로 변경하여 표시할 수 있다.The
즉, 제어부(18)는 단계 S103, S105를 통해 설명한 바와 같이 숏컷으로 에너지 그래프의 표시 방식을 즉시 변경할 수도 있으나, 위와 같이 드래그 앤 드랍 명령을 통해 그래프의 표시 방식을 세세하게 변경할 수도 있다.That is, the
숏컷으로 변경하는 방식에 따르면, 사용자는 신속하게 분석 주제에 맞는 그래프로 변경하여 분석 시간을 단축할 수 있는 효과가 있다. 반면에, 드래그 앤 드랍 명령을 통해 그래프를 변경하는 방식에 따르면, 사용자는 에너지 분석에 필요한 부분을 탐색하고, 보다 상세하게 분석할 수 있는 효과가 있다.According to the method of changing to the shortcut, the user can quickly change the graph to fit the analysis subject, thereby shortening the analysis time. On the other hand, according to the method of changing the graph through the drag-and-drop command, the user can search for a part necessary for energy analysis and analyze it in detail.
마찬가지로, 제어부(18)는 드래그 앤 드랍 명령을 통해 X축-Y축 방식의 그래프(가로 막대형 그래프, 620), X축-Z축 방식의 그래프(꺾은선 그래프, 630) 또는 Y축-Z축 방식의 그래프(세로 막대형 그래프, 640)를 회전시켜 3차원 에너지 그래프(610)로 변경할 수 있다.Likewise, the
다음으로, 도 17a 내지 도 17c, 도 18a 내지 도 18c, 도 19a 내지 도 19c 및 도 20a 내지 도 20c는 본 발명의 실시 예에 따른 에너지 관리 장치가 에너지 그래프의 표시 방향을 변경하는 방법을 설명하기 위한 도면이다.Next, FIGS. 17A to 17C, 18A to 18C, 19A to 19C, and 20A to 20C illustrate how the energy management apparatus according to the embodiment of the present invention changes the display direction of the energy graph FIG.
도 17a를 참조하면, 제어부(18)는 3차원 에너지 그래프의 제1 영역(1701)을 포인터(1000)로 선택하여 제3 영역(1703)까지 드래그 앤 드랍하는 명령을 수신할 수 있다. 즉, 포인터(1000)는 제1 영역(1701)에서부터 제2 영역(1702)을 통과하여 제3 영역(1703)까지 이동할 수 있다.Referring to FIG. 17A, the
제어부(18)는 포인터(1000)가 제1 영역(1701)에서부터 제2 영역(1702)을 통과하여 제3 영역(1703)까지 이동하는 동안 3차원 에너지 그래프를 회전시켜 표시할 수 있다.The
구체적으로, 제어부(18)는 3차원 에너지 그래프를 회전시켜, 포인터(1000)가 제2 영역(1702)에 위치하면 도 17b에 도시된 바와 같은 그래프를 표시할 수 있다. 이후, 제어부(18)는 포인터(1000)가 제3 영역(1703)에 위치하면 도 17c에 도시된 바와 같은 그래프를 표시할 수 있다. 이와 같이, 제어부(17)는 드래그 방향 및 드래그 거리에 따라 3차원 에너지 그래프를 세로 막대형 그래프로 변경할 수 있다.Specifically, the
그러나, 이는 예시적인 것으로, 제어부(18)는 드래그 방향에 따라 3차원 에너지 그래프에서 X축-Y축 그래프(가로 막대형 그래프) 또는 X축-Z축 그래프(꺾은선 그래프)로 변경하여 표시할 수도 있다.However, this is an illustrative example, and the
다음으로, 도 18a를 참조하면, 제어부(18)는 꺾은선 그래프의 제1 영역(1801)을 포인터(1000)로 선택하여 제3 영역(1803)까지 드래그 앤 드랍하는 명령을 수신할 수 있다. 포인터(1000)는 제1 영역(1801)에서부터 제2 영역(1802)을 통과하여 제3 영역(1803)까지 이동할 수 있다.18A, the
제어부(18)는 포인터(1000)가 제1 영역(1801)에서부터 제2 영역(1802)을 통과하여 제3 영역(1803)까지 이동하는 동안 3차원 에너지 그래프로 변경하여 에너지 그래프를 표시할 수 있다.The
구체적으로, 제어부(18)는 꺾은선 그래프에서 제1 영역(1801)을 선택하여 드래그하는 명령을 수신하자마자 3차원 에너지 그래프로 변경하여 표시할 수 있다. 이후, 제어부(18)는 드래그 방향 및 드래그 거리에 따라 3차원 에너지 그래프의 표시 방향을 변경할 수 있다. 예를 들어, 제어부(18)는 포인터(1000)가 제2 영역(1803)에 위치하면 도 18b에 도시된 바와 같은 그래프를 표시할 수 있다. 이후, 제어부(18)는 포인터(1000)가 제3 영역(1803)에 위치하면 도 18c에 도시된 바와 같은 에너지 그래프를 표시할 수 있다.Specifically, the
한편, 도 19a를 참조하면, 제어부(18)는 꺾은선 그래프의 상측 가운데에 해당하는 제1 영역(1901)에서 하측 가운데에 해당하는 제3 영역(1903)까지 드래그 앤 드랍하는 명령을 수신할 수 있다. 포인터(1000)는 제1 영역(1901)에서부터 제2 영역(1902)을 통과하여 제3 영역(1903)까지 이동할 수 있다.19A, the
제어부(18)는 포인터(1000)가 제1 영역(1901)에서부터 제2 영역(1902)을 통과하여 제3 영역(1903)까지 이동하는 동안 에너지 그래프를 변경하여 표시할 수 있다.The
구체적으로, 제어부(18)는 꺾은선 그래프에서 제1 영역(1901)을 선택하여 드래그하는 명령을 수신하면 3차원 에너지 그래프로 변경하여 표시할 수 있다. 이후, 제어부(18)는 드래그 방향 및 드래그 거리에 따라 3차원 에너지 그래프의 표시 방향을 변경할 수 있다. 예를 들어, 제어부(18)는 포인터(1000)가 제2 영역(1902)에 위치하면 도 19b에 도시된 바와 같은 그래프를 표시할 수 있다. 이후, 제어부(18)는 포인터(1000)가 제3 영역(1903)에 위치하면 도 19c에 도시된 바와 같은 에너지 그래프를 표시할 수 있다.Specifically, when the
이와 같이, 제어부(18)는 드래그 방향 및 드래그 거리에 따라 꺾은선 그래프에서 3차원 에너지로 변경하고, 다시 3차원 에너지를 가로 막대형 그래프로 변경할 수 있다. 그러나, 이는 예시적인 것으로, 드래그 방향 및 드래그 거리에 따라 그래프 형태는 다양하게 변경될 수 있다.As described above, the
또한, 도 18a 내지 도 18c 및 도 19a 내지 도 19c에 도시된 바와 같이, 제어부(18)는 동일한 에너지 그래프일지라도 드래그 방향 및 드래그 거리에 따라 상이한 에너지 그래프로 변경할 수 있다. 따라서, 사용자는 에너지 분석 주제에 따라 에너지 그래프를 다양하게 변경하여 분석할 수 있다.Also, as shown in Figs. 18A to 18C and Figs. 19A to 19C, the
다음으로, 도 20a를 참조하면, 제어부(18)는 가로 막대형 그래프의 좌측 아래쪽에 해당하는 제1 영역(2001)에서 중심에 해당하는 제3 영역(2003)으로 포인터(1000)를 드래그 앤 드랍하는 명령을 수신할 수 있다. 포인터(1000)는 제1 영역(2001)에서부터 제2 영역(2002)을 통과하여 제3 영역(2003)까지 이동할 수 있다.20A, the
제어부(18)는 포인터(1000)가 제1 영역(2001) 에서부터 제2 영역(2002)을 통과하여 제3 영역(2003)까지 이동하는 동안 에너지 그래프를 변경 및 회전시켜 표시할 수 있다.The
구체적으로, 제어부(18)는 가로 막대형 그래프에서 제1 영역(2001)을 선택하여 드래그하는 명령을 수신하면 3차원 에너지 그래프로 변경하여 표시할 수 있다. 이후, 제어부(18)는 3차원 에너지 그래프를 회전시켜, 포인터(1000)가 제2 영역(2002)에 위치하면 도 20b에 도시된 바와 같은 그래프를 표시할 수 있다. 이후, 제어부(18)는 포인터(1000)가 제3 영역(2003)에 위치하면 도 20c에 도시된 바와 같은 그래프를 표시할 수 있다. 이와 같이, 제어부(18)는 가로 막대형 그래프에서 3차원 에너지 그래프로 변경하고, 3차원 에너지 그래프의 회전 방향을 변경하여 표시할 수 있다.Specifically, when the
도 17a 내지 도 17c, 도 18a 내지 도 18c, 도 19a 내지 도 19c 및 도 20a 내지 도 20c에 도시된 드래그 앤 드랍 명령은 발명의 설명을 위해 예시로 든 것에 불과하고, 에너지 관리 장치의 포인터는 가능한 모든 방향 및 모든 거리로 드래그 앤 드랍 될 수 있다.The drag and drop commands shown in Figs. 17A to 17C, Figs. 18A to 18C, Figs. 19A to 19C and Figs. 20A to 20C are merely illustrative for the description of the invention, Can be dragged and dropped in all directions and all distances.
이와 같은 방법으로, 사용자는 디스플레이부(15)에 표시된 에너지 그래프(600)를 필요에 따라 변경하면서, 시스템의 에너지 운영 현황을 보다 자유롭고 상세하게 분석할 수 있는 효과가 있다.In this way, the user can change the
이상에서는 본 발명의 바람직한 실시 예에 대하여 도시하고 설명하였지만, 본 발명은 상술한 특정의 실시 예에 한정되지 아니하며, 청구범위에서 청구하는 본 발명의 요지를 벗어남이 없이 당해 발명이 속하는 기술분야에서 통상의 지식을 가진 자에 의해 다양한 변형 실시가 가능한 것은 물론이고, 이러한 변형 실시들은 본 발명의 기술적 사상이나 전망으로부터 개별적으로 이해되어서는 안 될 것이다.While the present invention has been particularly shown and described with reference to exemplary embodiments thereof, it is clearly understood that the same is by way of illustration and example only and is not to be construed as limiting the scope of the invention as defined by the appended claims. It will be understood by those skilled in the art that various changes in form and details may be made therein without departing from the spirit and scope of the present invention.
본 발명의 일 실시 예에 의하면, 전술한 방법은, 프로그램이 기록된 매체에 프로세서가 읽을 수 있는 코드로서 구현하는 것이 가능하다. 프로세서가 읽을 수 있는 매체의 예로는, ROM, RAM, CD-ROM, 자기 테이프, 플로피 디스크, 광 데이터 저장장치 등이 있다.According to an embodiment of the present invention, the above-described method can be implemented as a code readable by a processor on a medium on which a program is recorded. Examples of the medium that can be read by the processor include ROM, RAM, CD-ROM, magnetic tape, floppy disk, optical data storage, and the like.
상기와 같이 설명된 에너지 관리 장치는 상기 설명된 실시 예들의 구성과 방법이 한정되게 적용될 수 있는 것이 아니라, 상기 실시 예들은 다양한 변형이 이루어질 수 있도록 각 실시 예들의 전부 또는 일부가 선택적으로 조합되어 구성될 수도 있다.The energy management apparatus described above can be applied to a configuration and a method of the embodiments described above in a limited manner, but the embodiments may be modified so that all or some of the embodiments are selectively combined .
Claims (15)
Translated fromKorean상기 에너지 관리 장치가 속한 시스템을 구성하는 적어도 하나 이상의 에너지 장치의 전력 상태 정보를 획득하는 측정부;
상기 획득된 전력 상태 정보에 기초하여 에너지 운영 현황을 분석하는 제어부; 및
상기 분석된 에너지 운영 현황을 3차원 에너지 그래프로 표시하는 디스플레이부를 포함하고,
상기 3차원 에너지 그래프의 X축, Y축 및 Z축은 각각 시간, 에너지 장치 및 에너지 분석 대상 중 어느 하나로 맵핑되는,
에너지 관리 장치.An energy management device comprising:
A measuring unit for obtaining power state information of at least one or more energy apparatuses constituting the system to which the energy management apparatus belongs;
A controller for analyzing the energy operation status based on the obtained power state information; And
And a display unit for displaying the analyzed energy operation status as a three-dimensional energy graph,
Wherein the X-axis, the Y-axis, and the Z-axis of the three-dimensional energy graph are each mapped to one of a time, an energy device,
Energy management device.
상기 제어부는, 표시 방식 변경 명령을 수신하면 상기 3차원 에너지 그래프를 X축-Y축 그래프, X축-Z축 그래프 및 Y축-Z축 그래프 중 어느 하나의 그래프로 변경하는,
에너지 관리 장치.The method according to claim 1,
Wherein the control unit changes the three-dimensional energy graph to any one of an X-axis-Y-axis graph, an X-axis-Z-axis graph, and a Y-
Energy management device.
상기 X축-Y축 그래프는 가로 막대형 그래프이고, 상기 가로 막대형 그래프는 상기 Z축에 대응하는 데이터에 따라 채도가 상이하게 표시되는,
에너지 관리 장치.3. The method of claim 2,
Wherein the X-axis and Y-axis graphs are bar graphs, and the bar graphs are displayed with different saturation according to data corresponding to the Z-
Energy management device.
상기 X축-Z축 그래프는 꺾은선 그래프인,
에너지 관리 장치.3. The method of claim 2,
The X-axis-Z-axis graph is a line graph,
Energy management device.
상기 Y축-Z축 그래프는 세로 막대형 그래프이고, 상기 세로 막대형 그래프는 상기 Z축에 대응하는 데이터의 최대 값을 나타내는,
에너지 관리 장치.3. The method of claim 2,
Wherein the Y-axis and Z-axis graphs are columnar bar graphs, and the columnar bar graphs represent maximum values of data corresponding to the Z-
Energy management device.
상기 Y축-Z축 그래프는, 상기 Z축에 대응하는 데이터가 최대 값을 나타내는 경우의 시간 정보를 더 포함하는,
에너지 관리 장치.6. The method of claim 5,
Wherein the Y axis-Z axis graph further includes time information when data corresponding to the Z axis indicates a maximum value,
Energy management device.
상기 제어부는, 상기 변경된 그래프 중 일 영역을 드래그 앤 드랍하는 명령을 수신하면 상기 변경된 그래프를 상기 3차원 에너지 그래프로 변경하는,
에너지 관리 장치.3. The method of claim 2,
Wherein the control unit changes the changed graph to the three-dimensional energy graph upon receiving an instruction to drag and drop one of the changed graphs,
Energy management device.
상기 제어부는, 상기 3차원 에너지 그래프 중 일 영역을 드래그 앤 드랍하는 명령을 수신하면 상기 3차원 에너지 그래프의 표시 방향을 변경하는,
에너지 관리 장치.The method according to claim 1,
Wherein the control unit changes the display direction of the three-dimensional energy graph when receiving an instruction to drag and drop one of the three-dimensional energy graphs,
Energy management device.
상기 제어부는, 상기 3차원 에너지 그래프를 상기 에너지 장치마다 상이한 색으로 표시하는,
에너지 관리 장치.The method according to claim 1,
Wherein the control unit displays the three-dimensional energy graph in a different color for each energy device,
Energy management device.
상기 에너지 운영 현황은 상기 시스템을 구성하는 에너지 장치의 에너지 발전량, 에너지 소비량 및 에너지 효율 중 적어도 하나 이상을 포함하는,
에너지 관리 장치.The method according to claim 1,
Wherein the energy operation status includes at least one of energy generation amount, energy consumption amount and energy efficiency of an energy device constituting the system,
Energy management device.
상기 에너지 운영 현황이 상기 에너지 발전량이면 상기 X축은 시간을 나타내고, 상기 Y축은 에너지 공급 장치를 나타내고, 상기 Z축은 발전량을 나타내는,
에너지 관리 장치.11. The method of claim 10,
Wherein the X axis represents time, the Y axis represents an energy supply device, and the Z axis represents a power generation amount when the energy operation status is the energy generation amount,
Energy management device.
상기 제어부는, 상기 디스플레이부에 표시된 그래프의 일 영역에 포인터가 위치함을 감지하면 상기 포인터가 위치한 영역에 대응하는 에너지 정보를 팝업 윈도우에 표시하는,
에너지 관리 장치.3. The method of claim 2,
Wherein the controller displays energy information corresponding to an area where the pointer is located in a pop-up window when it detects that a pointer is located in one area of a graph displayed on the display unit,
Energy management device.
상기 에너지 정보는 시간 정보, 에너지 장치 정보 및 에너지량 정보 중 적어도 하나 이상을 포함하는,
에너지 관리 장치.13. The method of claim 12,
Wherein the energy information includes at least one of time information, energy device information, and energy amount information,
Energy management device.
상기 에너지 관리 장치가 속한 시스템을 구성하는 적어도 하나 이상의 에너지 장치의 전력 상태 정보를 획득하는 단계;
상기 획득된 전력 상태 정보에 기초하여 에너지 운영 현황을 분석하는 단계; 및
상기 분석된 에너지 운영 현황을 3차원 에너지 그래프로 표시하는 단계를 포함하고,
상기 3차원 에너지 그래프의 X축, Y축 및 Z축은 각각 시간, 에너지 장치 및 에너지 분석 대상 중 어느 하나로 맵핑되는,
에너지 관리 장치의 동작 방법.A method of operating an energy management device,
Obtaining power state information of at least one energy device constituting the system to which the energy management device belongs;
Analyzing the energy operation status based on the obtained power state information; And
And displaying the analyzed energy operation status with a three-dimensional energy graph,
Wherein the X-axis, the Y-axis, and the Z-axis of the three-dimensional energy graph are each mapped to one of a time, an energy device,
A method of operating an energy management device.
표시 방식 변경 명령을 수신하면, 상기 3차원 에너지 그래프를 X축-Y축 그래프, X축-Z축 그래프 및 Y축-Z축 그래프 중 어느 하나의 그래프로 변경하는 단계를 더 포함하는,
에너지 관리 장치의 동작 방법.15. The method of claim 14,
Dimensional energy graph is changed to any one of an X-axis-Y-axis graph, an X-axis-Z-axis graph, and a Y-axis-Z-axis graph when receiving the display mode change command.
A method of operating an energy management device.
Priority Applications (4)
| Application Number | Priority Date | Filing Date | Title |
|---|---|---|---|
| KR1020170012894AKR20180088165A (en) | 2017-01-26 | 2017-01-26 | Energy management device and operating method thereof |
| EP18744860.0AEP3576039A4 (en) | 2017-01-26 | 2018-01-16 | ENERGY MANAGEMENT DEVICE AND OPERATING METHOD THEREFOR |
| PCT/KR2018/000764WO2018139799A1 (en) | 2017-01-26 | 2018-01-16 | Energy management apparatus and operating method thereof |
| US16/480,201US11004274B2 (en) | 2017-01-26 | 2018-01-16 | Energy management apparatus and operating method thereof |
Applications Claiming Priority (1)
| Application Number | Priority Date | Filing Date | Title |
|---|---|---|---|
| KR1020170012894AKR20180088165A (en) | 2017-01-26 | 2017-01-26 | Energy management device and operating method thereof |
Publications (1)
| Publication Number | Publication Date |
|---|---|
| KR20180088165Atrue KR20180088165A (en) | 2018-08-03 |
Family
ID=62979493
Family Applications (1)
| Application Number | Title | Priority Date | Filing Date |
|---|---|---|---|
| KR1020170012894ACeasedKR20180088165A (en) | 2017-01-26 | 2017-01-26 | Energy management device and operating method thereof |
Country Status (4)
| Country | Link |
|---|---|
| US (1) | US11004274B2 (en) |
| EP (1) | EP3576039A4 (en) |
| KR (1) | KR20180088165A (en) |
| WO (1) | WO2018139799A1 (en) |
Cited By (1)
| Publication number | Priority date | Publication date | Assignee | Title |
|---|---|---|---|---|
| KR20200083336A (en) | 2018-12-28 | 2020-07-08 | (주)에스엔케이 | Power Measuring System Using Network |
Families Citing this family (1)
| Publication number | Priority date | Publication date | Assignee | Title |
|---|---|---|---|---|
| JP2023006476A (en)* | 2021-06-30 | 2023-01-18 | 新東工業株式会社 | Information display system, information display method, and information display program |
Family Cites Families (19)
| Publication number | Priority date | Publication date | Assignee | Title |
|---|---|---|---|---|
| US6449761B1 (en)* | 1998-03-10 | 2002-09-10 | Monterey Design Systems, Inc. | Method and apparatus for providing multiple electronic design solutions |
| JP2000193695A (en)* | 1998-12-28 | 2000-07-14 | Energy Conservation Center Japan | Power usage monitoring method and device |
| US20050265580A1 (en)* | 2004-05-27 | 2005-12-01 | Paul Antonucci | System and method for a motion visualizer |
| US8598378B2 (en)* | 2008-03-14 | 2013-12-03 | University Of Hawaii | Methods and compositions for extraction and transesterification of biomass components |
| US8520000B2 (en) | 2008-07-02 | 2013-08-27 | Icharts, Inc. | Creation, sharing and embedding of interactive charts |
| KR101867812B1 (en)* | 2009-10-21 | 2018-06-18 | 엘지전자 주식회사 | A network system supplying electric power and a control method thereof |
| US20110131253A1 (en)* | 2009-11-30 | 2011-06-02 | Sap Ag | System and Method of Schema Matching |
| JP5509015B2 (en)* | 2010-09-28 | 2014-06-04 | 株式会社東芝 | Power information display device |
| US9292013B2 (en) | 2012-01-12 | 2016-03-22 | Enerallies, Inc. | Energy management computer system |
| JP5905324B2 (en)* | 2012-04-25 | 2016-04-20 | 京セラ株式会社 | Power management device, display device, display method, and image creation program |
| KR101447635B1 (en)* | 2012-09-04 | 2014-10-07 | 삼성물산(주) | Industrial Facilities Energy Management System |
| JP5892094B2 (en)* | 2013-03-21 | 2016-03-23 | カシオ計算機株式会社 | Graph display control device, graph display control method, and graph display control program |
| JP5892982B2 (en)* | 2013-07-30 | 2016-03-23 | 三菱電機株式会社 | Energy management system, display device, display method, and program |
| KR20150026095A (en)* | 2013-08-30 | 2015-03-11 | 삼성전자주식회사 | Apparatus and method for displaying a chart in an eletronic device |
| JP5650874B1 (en)* | 2014-02-27 | 2015-01-07 | パナソニック インテレクチュアル プロパティ コーポレーション オブアメリカPanasonic Intellectual Property Corporation of America | Control method, information providing method, and program |
| JP6064960B2 (en)* | 2014-09-25 | 2017-01-25 | 横河電機株式会社 | Energy management system, display control device, display method, and program |
| US10055114B2 (en)* | 2016-01-22 | 2018-08-21 | Johnson Controls Technology Company | Building energy management system with ad hoc dashboard |
| CN109310053B (en)* | 2016-06-16 | 2022-06-07 | 索尼公司 | Information processing apparatus, information processing method and computer program product |
| CN110573188B (en)* | 2017-01-30 | 2022-02-01 | 生命细胞公司 | Device comprising a muscle matrix, method for production and use |
- 2017
- 2017-01-26KRKR1020170012894Apatent/KR20180088165A/ennot_activeCeased
- 2018
- 2018-01-16USUS16/480,201patent/US11004274B2/enactiveActive
- 2018-01-16WOPCT/KR2018/000764patent/WO2018139799A1/ennot_activeCeased
- 2018-01-16EPEP18744860.0Apatent/EP3576039A4/ennot_activeCeased
Cited By (1)
| Publication number | Priority date | Publication date | Assignee | Title |
|---|---|---|---|---|
| KR20200083336A (en) | 2018-12-28 | 2020-07-08 | (주)에스엔케이 | Power Measuring System Using Network |
Also Published As
| Publication number | Publication date |
|---|---|
| EP3576039A1 (en) | 2019-12-04 |
| EP3576039A4 (en) | 2020-06-24 |
| US20190371081A1 (en) | 2019-12-05 |
| US11004274B2 (en) | 2021-05-11 |
| WO2018139799A1 (en) | 2018-08-02 |
Similar Documents
| Publication | Publication Date | Title |
|---|---|---|
| Mahapatra et al. | Home energy management system (HEMS): Concept, architecture, infrastructure, challenges and energy management schemes | |
| US8868248B2 (en) | Smart control device | |
| US11616391B2 (en) | Energy management device and operation method therefor | |
| EP2494737B1 (en) | Method of controlling network system | |
| US9491005B2 (en) | Network system and method of controlling network system | |
| EP2494736B1 (en) | Method of controlling network system | |
| KR20110057559A (en) | Method and device for energy management in intelligent power supply network | |
| KR101142220B1 (en) | Home electricity energy management apparatus and integrated electricity energy management system using the same apparatus | |
| KR20120000011A (en) | Network system and energy consumption department | |
| US11170455B2 (en) | Energy management apparatus and operation method thereof | |
| US20120204044A1 (en) | Method of controlling network system | |
| US11004274B2 (en) | Energy management apparatus and operating method thereof | |
| KR101181783B1 (en) | Energy management system and air-conditioning system including the same | |
| KR20120016740A (en) | Smart devices | |
| KR101218019B1 (en) | A home appliance | |
| KR20120000018A (en) | Network system | |
| Menaga et al. | Smart Grid Meter Using ZigBee WSN | |
| KR101733487B1 (en) | Method for controlling a device | |
| KR101759747B1 (en) | Electric appliance | |
| KR101760522B1 (en) | Controlling mehtod of electric appliance | |
| KR20120029565A (en) | A network system | |
| KR20120029568A (en) | A network system | |
| KR20120067033A (en) | A network system | |
| KR20120029566A (en) | A network system | |
| KR20120000021A (en) | Network system and its control method |
Legal Events
| Date | Code | Title | Description |
|---|---|---|---|
| PA0109 | Patent application | Patent event code:PA01091R01D Comment text:Patent Application Patent event date:20170126 | |
| PG1501 | Laying open of application | ||
| A201 | Request for examination | ||
| PA0201 | Request for examination | Patent event code:PA02012R01D Patent event date:20211028 Comment text:Request for Examination of Application Patent event code:PA02011R01I Patent event date:20170126 Comment text:Patent Application | |
| E902 | Notification of reason for refusal | ||
| PE0902 | Notice of grounds for rejection | Comment text:Notification of reason for refusal Patent event date:20240620 Patent event code:PE09021S01D | |
| E601 | Decision to refuse application | ||
| PE0601 | Decision on rejection of patent | Patent event date:20250219 Comment text:Decision to Refuse Application Patent event code:PE06012S01D |