KR20170025454A - System and method for space-time analysis of social media data - Google Patents
System and method for space-time analysis of social media dataDownload PDFInfo
- Publication number
- KR20170025454A KR20170025454AKR1020150121909AKR20150121909AKR20170025454AKR 20170025454 AKR20170025454 AKR 20170025454AKR 1020150121909 AKR1020150121909 AKR 1020150121909AKR 20150121909 AKR20150121909 AKR 20150121909AKR 20170025454 AKR20170025454 AKR 20170025454A
- Authority
- KR
- South Korea
- Prior art keywords
- data
- social media
- analysis
- spatial
- media data
- Prior art date
- Legal status (The legal status is an assumption and is not a legal conclusion. Google has not performed a legal analysis and makes no representation as to the accuracy of the status listed.)
- Withdrawn
Links
Images


Classifications
- G—PHYSICS
- G06—COMPUTING OR CALCULATING; COUNTING
- G06Q—INFORMATION AND COMMUNICATION TECHNOLOGY [ICT] SPECIALLY ADAPTED FOR ADMINISTRATIVE, COMMERCIAL, FINANCIAL, MANAGERIAL OR SUPERVISORY PURPOSES; SYSTEMS OR METHODS SPECIALLY ADAPTED FOR ADMINISTRATIVE, COMMERCIAL, FINANCIAL, MANAGERIAL OR SUPERVISORY PURPOSES, NOT OTHERWISE PROVIDED FOR
- G06Q50/00—Information and communication technology [ICT] specially adapted for implementation of business processes of specific business sectors, e.g. utilities or tourism
- G06Q50/01—Social networking
- G06F17/277—
- G—PHYSICS
- G06—COMPUTING OR CALCULATING; COUNTING
- G06Q—INFORMATION AND COMMUNICATION TECHNOLOGY [ICT] SPECIALLY ADAPTED FOR ADMINISTRATIVE, COMMERCIAL, FINANCIAL, MANAGERIAL OR SUPERVISORY PURPOSES; SYSTEMS OR METHODS SPECIALLY ADAPTED FOR ADMINISTRATIVE, COMMERCIAL, FINANCIAL, MANAGERIAL OR SUPERVISORY PURPOSES, NOT OTHERWISE PROVIDED FOR
- G06Q50/00—Information and communication technology [ICT] specially adapted for implementation of business processes of specific business sectors, e.g. utilities or tourism
- G06Q50/10—Services
- G06Q50/16—Real estate
Landscapes
- Business, Economics & Management (AREA)
- Engineering & Computer Science (AREA)
- Tourism & Hospitality (AREA)
- Primary Health Care (AREA)
- Economics (AREA)
- General Health & Medical Sciences (AREA)
- Human Resources & Organizations (AREA)
- Marketing (AREA)
- Health & Medical Sciences (AREA)
- Strategic Management (AREA)
- Physics & Mathematics (AREA)
- General Business, Economics & Management (AREA)
- General Physics & Mathematics (AREA)
- Theoretical Computer Science (AREA)
- Computing Systems (AREA)
- Information Retrieval, Db Structures And Fs Structures Therefor (AREA)
Abstract
Translated fromKoreanDescription
Translated fromKorean본 발명은 소셜 미디어 데이터의 텍스트 정보와 위치 정보, 시간 정보를 이용하여 다양한 주제 카테고리 별로 분류하고 시공간적 클러스터와 핫스팟을 탐지하고 기존 자료와의 상관성을 분석하는 시스템에 관한 것으로, 텍스트 마이닝을 통해 특정 주제와 관련된 소셜 미디어 객체들만을 추출한 후, 시공간 분석 기법을 통해 추출된 소셜 미디어 객체들의 시공간적 분포 특성을 파악하는 시스템에 관한 것이다.The present invention relates to a system for classifying temporal and spatial clusters and hot spots and analyzing correlation with existing data by using text information, location information, and time information of social media data, And extracts only the social media objects associated with the extracted social media objects, and then grasps the spatio-temporal distribution characteristics of the extracted social media objects through the spatiotemporal analysis technique.
트위터, 페이스북, 구글 트랜드, 블로그, 까페, 신문기사 등 소셜 미디어 데이터는 공통적으로 특정한 사건에 대한 텍스트 형식의 내용과 위치 관련 정보, 작성 시간에 대한 정보 등을 담고 있다. 이러한 소셜 미디어 데이터를 활용하기 위해서는 기본적으로 특정 주제에 해당하는, 또는 관련되어 있는 텍스트를 담고 있는 객체들만을 추출하는 텍스트 마이닝 과정, 그리고 그러한 객체들이 공간적으로 분포하고 있는 특성을 분석하는 공간 분석 과정이 요구된다. 텍스트 마이닝 과정은 일반적으로 단어들을 추출하는 형태소 분석, 단어들의 문서내 출현 빈도수를 계산하여 상대적 중요도를 산출하는 과정 등으로 구성되어 있다. 공간 분석 과정을 일반적으로 공간 자료 간의 중첩 분석, 버퍼(Buffer) 분석, 내삽(Interpolation), 공간적 클러스터링, 핫스팟 분석, 공간적 상관성/연관성 분석 등으로 구성되어 있다.Social media data such as Twitter, Facebook, Google trends, blogs, cafes, and newspaper articles commonly contain information about text format, location information, and creation time for a particular event. In order to utilize these social media data, a text mining process that basically extracts only objects that contain text corresponding to or related to a specific subject, and a spatial analysis process that analyzes the characteristics of such objects are spatially distributed Is required. The text mining process consists of morpheme analysis, which extracts words in general, and calculating the relative importance of words in the documents. The spatial analysis process consists of overlap analysis, buffer analysis, interpolation, spatial clustering, hot spot analysis, and spatial correlation / correlation analysis among spatial data in general.
종래의 소셜 미디어 데이터 분석 및 활용기술은 일반적으로 소셜 미디어에 포함된 텍스트 부분을 분석해서 특정 주제 분야 또는 감정관련 키워드가 출현하는 빈도를 계산하거나 이에 대한 시계열적 추이를 살피는 기술이 주를 이루고 있다. 또한, 소셜 미디어의 네트워크 관계 속성을 이용하여 네트워크 분석을 통해 사람과 사람간의 연결관계 특성을 파악하는 기술이 주를 이루고 있다. 그러나, 소셜 미디어에서 담고 있는 위치정보 또는 장소와 관련된 정보에 대한 추출 및 시공간적 분포 패턴의 분석 기술은 상당히 유용한 정보를 제공해 줄 수 있음에도 불구하고 아직 개발이 미진한 측면이 있다. 즉, 어떤 특정 시간대에 어떤 특정 위치에서 특정한 메시지가 소셜 미디어 상에 표현되는가에 대한 정보를 파악하기 위해서는 소셜 미디어가 담고 있는 텍스트 정보뿐만 아니라 위치 및 장소 정보, 시간적 정보까지 동시에 분석할 수 있는 분석 프로세스 정립이 필요하다. 그리고 이를 위해서는 소셜 미디어 데이터의 공간자료 변환 기법과 시공간 분석 기법, 지도 상에 분석결과를 시각화하는 기법 등이 필요하다.Conventional methods of analyzing and utilizing social media data generally include a technique of analyzing a text portion included in social media to calculate a frequency of occurrence of a specific subject field or an emotion related keyword, or to observe a time series transition thereon. In addition, the technology that grasps the characteristics of connection between people and people through network analysis using the network relation attributes of social media is mainly made up. However, the extraction of the location information or the information related to the place in the social media and the analysis technique of the spatio - temporal distribution pattern can provide a lot of useful information, but the development has not been done yet. In other words, in order to grasp information on how a specific message is displayed on social media at a specific time in a specific time period, an analysis process that can analyze not only text information contained in social media but also location, It is necessary to establish. To do this, we need spatial data transformation, time-space analysis, and visualization of the results on a map.
본 발명은 종래의 소셜 미디어 분석 기술에 있어서 텍스트 정보와 위치 정보, 시간 정보를 동시에 분석하지 못하는 문제점을 해결하기 위해 텍스트 마이닝 기법과 공간자료 변환 기법, 시공간 분석 기법, 그리고 분석결과를 배경지도상에 시각화하는 기능을 포함하는 분석 시스템을 개발하는데 목적이 있다.In order to solve the problem of not simultaneously analyzing text information, location information and time information in the conventional social media analysis technology, text mining technique, spatial data conversion technique, space time analysis technique, The goal is to develop an analysis system that includes visualization capabilities.
본 발명의 일실시예에 따른 소셜 미디어 데이터의 시공간 분석 시스템은 소셜 미디어 데이터를 수집하는 데이터 수집부, 소셜 미디어의 텍스트 부분에 대하여 단어들을 추출하고 주제 카테고리 별로 분류하는 텍스트 분석부, 소셜 미디어의 위치정보와 장소명 정보를 활용하여 점데이터로 변환하는 공간자료 변환부, 특정 주제 카테고리에 따라 추출된 소셜 미디어 데이터에 대하여 시공간 클러스터링 분석과 핫스팟 분석, 여타 자료와의 상관성 분석을 적용시키는 시공간 분석부, 시공간 분석 결과(클러스터링, 핫스팟 등)를 배경지도 위에 시각화시키는 분석결과 표시부를 포함할 수 있다.A system for analyzing time-space of social media data according to an embodiment of the present invention includes a data collecting unit for collecting social media data, a text analyzing unit for extracting words from the text portion of the social media, A spatial data conversion unit for converting the data into point data using information and place name information, a space time analysis unit for applying space time clustering analysis and hot spot analysis and correlation analysis with other data to social media data extracted according to a specific subject category, And an analysis result display section for visualizing the analysis result (clustering, hot spot, etc.) on the background map.
본 발명을 통해 트위터, 페이스북, 구글 트랜드, 블로그, 신문기사 등 다양한 형태의 소셜 미디어 데이터로부터 특정한 주제 분야의 메시지가 포함된 데이터들만을 추출해서 시공간적인 분포 패턴을 보다 쉽고 정확하게 파악할 수 있는 효과가 있다. 또한, 이를 통해 소셜 미디어 상에서 특정한 주제 분야의 메시지들이 언제, 어디에서 주로 나타나는지에 대한 경향을 종합적으로 분석할 수 있는 효과가 있다.Through the present invention, it is possible to easily and accurately grasp the temporal and spatial distribution patterns by extracting only data including messages of a specific subject field from various types of social media data such as Twitter, Facebook, Google trend, blog, have. It also has the effect of comprehensively analyzing trends in when and where messages in a particular subject area appear on social media.
부수적으로는 이러한 종합적인 소셜 미디어 분석을 통해 특정 키워드와 관련된 메시지들의 시공간적인 분포 패턴을 파악함으로써 국가 정책의 파급효과 또는 기업의 제품 마케팅 효과에 대한 분석을 보다 효과적으로 수행할 수 있다.Incidentally, this comprehensive social media analysis can analyze the spillover effect of national policy or the effect of the product marketing of the company more effectively by grasping the spatio-temporal distribution pattern of the messages related to a specific keyword.
도 1은 본 발명의 일실시예에 따른 소셜 미디어 데이터의 시공간 분석 시스템이다.
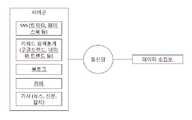
도 2는 본 발명의 일실시예에 따른 소셜 미디어 데이터의 시공간 분석 시스템의 서버군의 구조이다.
도 3은 본 발명의 일실시예에 따른 소셜 미디어 데이터의 시공간 분석 시스템의 텍스트 분석부의 구조이다.
도 4는 본 발명의 일실시예에 따른 소셜 미디어 데이터의 시공간 분석 시스템의 공간자료 변환부의 동작을 나타내는 플로우차트이다.
도 5는 본 발명의 일실시예에 따른 소셜 미디어 데이터의 시공간 분석 시스템의 시공간 분석부의 구조이다.
도 6은 본 발명의 일실시예에 따른 소셜 미디어 데이터의 시공간 분석 시스템에서 적용한 발명 흐름도이다.
도 7은 트윗 데이터와 시군구 행정구역경계, 및 격자망 데이터셋을 크기별로 중첩시킨 결과의 일례이다.
도 8은 주택매매가격지수의 격자화된 데이터의 공간적 분포의 일례이다.
도 9는 주택전세가격지수의 격자화된 데이터의 공간적 분포의 일례이다.
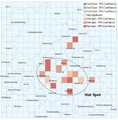
도 10은 격자화된 트윗 데이터에 대한 Hotspot 분석 결과의 일례이다.
도 11은 격자화된 주택매매가격지수 데이터에 대한 Hotspot 분석 결과의 일례이다.
도 12는 격자화된 주택전세가격지수 데이터에 대한 Hotspot 분석 결과의 일례이다.
도 13은 본 발명의 일실시예에 따른 소셜 미디어 데이터의 시공간 분석 시스템에서 적용한 발명 흐름도이다.
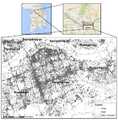
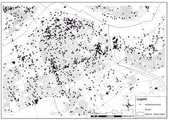
도 14는 서울시 강남구를 중심으로 한 영역에 분포된 트윗 데이터의 일례이다.
도 15는 도 14의 트윗 데이터가 음식 카테고리로 재분류된 결과의 일례이다.
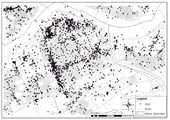
도 16은 도 14의 트윗 데이터가 엔터테인먼트 카테고리로 재분류된 결과의 일례이다.
도 17은 도 14의 트윗 데이터가 업무 및 공부 카테고리로 재분류된 결과의 일례이다.
도 18은 음식 카테고리에 대하여 도 14의 트윗 데이터에 클러스터링을 적용한 결과의 일례이다.
도 19는 엔터테인먼트 카테고리에 대하여 도 14의 트윗 데이터에 클러스터링을 적용한 결과의 일례이다.
도 20은 업무 및 공부 카테고리에 대하여 도 14의 트윗 데이터에 클러스터링을 적용한 결과의 일례이다.1 is a time-space analysis system for social media data according to an embodiment of the present invention.
2 is a diagram illustrating a structure of a server group of a time-space analysis system for social media data according to an exemplary embodiment of the present invention.
3 is a structure of a text analysis unit of a spatiotemporal analysis system for social media data according to an embodiment of the present invention.
FIG. 4 is a flowchart illustrating an operation of the spatial data conversion unit of the spatiotemporal analysis system for social media data according to an embodiment of the present invention.
5 is a structure of a time-space analysis unit of a time-space analysis system for social media data according to an embodiment of the present invention.
FIG. 6 is a flowchart of an invention applied in a space-time analysis system of social media data according to an embodiment of the present invention.
7 is an example of a result obtained by superimposing tweet data, a county administrative district boundary, and a grid data set on a size basis.
8 is an example of the spatial distribution of lattice data of the home price index.
9 is an example of the spatial distribution of the latticed data of the housing rent price index.
10 is an example of a Hotspot analysis result on the gridted tweet data.
11 is an example of a hotspot analysis result of the grid-linked home price index data.
FIG. 12 is an example of a hotspot analysis result of the latticed housing rental price index data.
FIG. 13 is a flowchart of an invention applied in a space-time analysis system of social media data according to an embodiment of the present invention.
FIG. 14 is an example of tweet data distributed in an area centered on Gangnam-gu, Seoul.
Fig. 15 is an example of a result of sorting the tweet data of Fig. 14 into food categories.
Fig. 16 is an example of a result of the tweet data of Fig. 14 being reclassified into an entertainment category.
FIG. 17 is an example of the result that the tweet data of FIG. 14 is reclassified into business and study categories.
Fig. 18 is an example of a result of applying clustering to the tweet data of Fig. 14 for the food category.
FIG. 19 is an example of a result of applying clustering to the tweet data of FIG. 14 with respect to the entertainment category.
FIG. 20 is an example of a result of applying clustering to the tweet data of FIG. 14 for the task and study categories.
이하, 본 발명의 실시예를 첨부된 도면을 참조하여 상세하게 설명한다.DETAILED DESCRIPTION OF THE PREFERRED EMBODIMENTS Hereinafter, embodiments of the present invention will be described in detail with reference to the accompanying drawings.
본 발명의 구성은 다음과 같다.The structure of the present invention is as follows.
본 발명은 소셜 미디어 데이터의 텍스트 정보와 위치 정보를 이용하여 다양한 주제 카테고리 별로 분류하고 공간적 클러스터와 핫스팟을 탐지하는 시스템에 관한 것으로, (a) 소셜 미디어 데이터를 수집하는 데이터 수집부, (b) 소셜 미디어의 텍스트 부분에 대하여 단어들을 추출하고 주제 카테고리 별로 분류하는 텍스트 분석부, (c) 소셜 미디어의 위치정보와 장소명 정보를 활용하여 점데이터로 변환하는 공간자료 변환부, (d) 특정 주제 카테고리에 따라 추출된 소셜 미디어 데이터에 대하여 시공간 클러스터링 분석과 핫스팟 분석, 여타 자료와의 상관성 분석을 적용시키는 시공간 분석부, (e) 시공간 분석 결과(클러스터링, 핫스팟 등)를 배경지도 위에 시각화시키는 분석결과 표시부로 구성됨으로써 원하는 주제 카테고리에 해당하는 텍스트 정보에 포함하고 있는 소셜 미디어 데이터를 자동으로 추출하고 시공간적 분포 특성을 살펴보는 과정을 자동으로 수행할 수 있고, 자료의 분석비용과 시간의 절감 효과를 기대할 수 있다.The present invention relates to a system for classifying spatial clusters and hot spots by classifying them into various subject categories by using text information and location information of social media data. The system includes (a) a data collection unit for collecting social media data, (b) (C) a spatial data conversion unit for converting the data into point data using the location information and the place name information of the social media, (d) (E) spatial and temporal analysis results (clustering, hotspot, etc.) are visualized on the background map, and the results of the analysis are displayed on the background map The text information corresponding to the desired subject category It is possible to automatically extract the social media data and analyze the spatio-temporal distribution characteristics automatically, and it can expect the cost of data analysis and time saving.
이때, 서버군은 도 2와 같은 구조로 구성될 수 있다. 또한, 텍스트 분석부는 도 3과 같은 구조로 구성될 수 있다. 그리고, 공간자료 변환부는 도 4와 같은 플로우차트에 따라 동작할 수 있다. 또한, 시공간 분석부는 도 5와 같은 구조로 구성될 수 있다.At this time, the server group may have a structure as shown in FIG. In addition, the text analyzer may have a structure as shown in FIG. The spatial data conversion unit can operate according to the flowchart shown in FIG. The space-time analyzing unit may be configured as shown in FIG.
본 발명은 소셜 미디어를 활용하는 모든 분야에서 활용이 가능하며 특히 국가기관이나 공공기관에서 정책 홍보 및 모니터링, 민간 기업에서 특정 제품이나 서비스에 대한 마케팅, 음식점이나 상점에서의 소셜 미디어를 활용한 마케팅 등의 분야에서 활용이 가능하다.The present invention can be utilized in all fields utilizing social media. In particular, the present invention can be used for publicity and monitoring of policies in government agencies or public institutions, marketing for specific products or services in private companies, marketing using social media in restaurants or stores In the field.
본 기술은 소셜 미디어 분야뿐만 아니라 소셜 미디어와 같이 텍스트 정보와 위치 관련 정보, 시간 관련 정보를 담고 있는 유사한 형태의 정보 서비스 분야에서도 활용이 가능하다. This technology can be used not only in the social media field but also in a similar type of information service field including text information, location information and time related information such as social media.
본 발명의 대상 데이터는 지오태그 정보를 포함하고 있는 트윗(Tweet) 데이터를 주요 대상 데이터로 하였고 부동산 가격 정보로는 행정구역(시군구) 단위의 주택가격지수(매매지수, 전세지수)를 보조 데이터로 하였다. 두 대상 데이터의 시간적 범위는 2013년 8월 한 달 간 수집된 자료로 한정하였고 공간적 범위는 서울특별시를 중심으로 하여 일산, 분당, 과천 등 주요 신도시들을 포함하는 수도권으로 하였다.The target data of the present invention includes tweet data including geotag information as main target data, and house price index (sales index, rental index) in the administrative district (city or county) as auxiliary price data Respectively. The temporal range of the two target data is limited to the data gathered in August, 2013, and the spatial range is the metropolitan area including major cities such as Ilsan, Bundang, Gwacheon, etc.
위치기반 소셜 미디어 정보와 부동산 가격 정보와의 공간적 관련성을 분석하기 위한 방법론으로 본 발명에서는 두 자료의 격자 자료화(Rasterization)를 통한 데이터 통합, 각 대상 데이터의 공간적 분포를 시각적으로 확인하기 위한 Hotspot 분석, 그리고 공간시차를 고려한 상관계수 분석으로 구성된 일련의 방법론을 도 6과 같이 적용해 보았다.It is a methodology for analyzing the spatial relationship between location-based social media information and real estate price information. In the present invention, data integration through the rasterization of two data, hotspot analysis for visual confirmation of the spatial distribution of each object data , And correlation coefficient analysis considering spatial disparity are applied as shown in Fig.
본 발명의 대상 데이터는 소셜 미디어 데이터와 부동산 가격지수 데이터이다. 먼저, 소셜 미디어 데이터로는 지오태그 정보를 포함하고 있는 트윗 데이터를 주요 대상 데이터로 하였다. 트윗 데이터는 2013년 8월 한 달간 수집된 자료로 한정하였고 공간적 범위는 서울특별시를 중심으로 하여 일산, 분당, 과천 등 주요 신도시들을 포함하는 수도권으로 하였다. 즉, 트윗 데이터의 위치값에 대하여 사각형 형태의 공간질의(Spatial Query)를 적용하였는데, 범위는 좌상단 (176778.7, 472112.8), 우하단 (218778.7, 432112.8)으로 하였다.The subject data of the present invention are social media data and real estate price index data. First, as the social media data, the tweet data including the geo tag information is used as the main target data. The tweet data was limited to the data collected for a month in August, 2013, and the spatial range was the metropolitan area including major cities such as Ilsan, Bundang, Gwacheon, etc. In other words, a spatial query (square query) was applied to the location of the tweet data. The range was the upper left (176778.7, 472112.8) and the lower right (218778.7, 432112.8).
부동산 가격 정보로는 한국감정원에서 구축, 제공하고 있는 행정구역(시군구) 단위의 주택가격지수(매매지수, 전세지수)를 보조 대상 데이터로 하였으며, 시간적 범위는 2013년 8월로 한정하고 공간적 범위는 트윗 데이터의 수집범위에 맞게 서울특별시(25개 구), 인천광역시(계양구, 부평구, 남동구의 3개 구), 경기도(고양시, 부천시, 안양시, 성남시 등) 일부지역을 포함하여 총 51개 시군구에 대한 주택가격지수를 수집하였다.For the real estate price information, the housing price index (sales index, rental index) of the administrative district (city or county) unit constructed and provided by the Korea Appraisal Center is used as the auxiliary data. The time range is limited to August 2013, A total of 51 towns and villages, including some parts of Seoul (25 districts), Incheon Metropolitan City (Gyeonggi Province, Bupyeong District, Namdong District), Kyonggi Province (Goyang City, Bucheon City, Anyang City and Seongnam City) House price index.
1. 데이터 공간자료화1. Data space documentation
본 발명에서는 위치 태그를 가진 트윗 데이터를 수집하기 위해, 트위터 공개 API를 활용하여 위치 태그를 가진 트윗 데이터 중 대상 범위 내에 포함되는 트윗 데이터만을 자동으로 추출하였다.In the present invention, to collect tweet data having a location tag, only the tweet data included in the target range of the tweet data having the location tag is automatically extracted using the Twitter public API.
이때, 키워드 필터링을 적용하였는데, 부동산 관련 키워드(부동산, 주택가격, 집값, 아파트 시세, 실거래가, 주택매매, 전세, 월세, 아파트 분양, 양도소득세 등)를 포함한 트윗 데이터들을 필터링하였다. 총 193,831개의 트윗 데이터 중 키워드 필터링을 통해 250개 데이터가 추출되었다. 트윗 데이터 지오태그 상의 위치정보는 경위도 좌표로 되어 있어 좌표변환을 통해 경위도 좌표를 TM(Transverse Mercator)좌표체계로 변환하였으며, 이를 위해 국토지리정보원의 NGIpro(Ver. 2.53) 소프트웨어를 활용하였다.At this time, we applied keyword filtering and filtered tweet data including real estate related keywords (real estate, house price, house price, apartment price, real transaction price, home sales, charter, rent, apartment sale, transfer income tax, etc.). Of the total 193,831 tweet data, 250 data were extracted through keyword filtering. The location information on the tweet data geo tag has the latitude and longitude coordinates, and the longitude and latitude coordinates are transformed into the TM (Transverse Mercator) coordinate system using the NGIpro (Ver. 2.53) software of the National Geographic Information Service.
다음으로, 주택가격지수(매매지수, 전세지수) 데이터는 행정경계(시군구) 폴리곤 데이터를 활용하여 공간조인(Spatial Join)을 통해 공간자료화 하였다.Next, the housing price index (sales index, rental index) data was spatialized by spatial joining using administrative boundary (city and county) polygon data.
2. 격자 데이터화(Rasterization)2. Rasterization
트윗 데이터와 주택가격지수 데이터는 각각 포인트 데이터와 폴리곤 데이터 형태이기 때문에 데이터의 형식에도 차이가 있지만 공간적 세밀도에서도 차이를 보인다. 이러한 데이터 차이가 있어 두 데이터의 공간적 분포를 비교하기 위해서는 통합된 형태의 데이터를 구축할 필요가 있다(Liao et al. 2010).Since the tweet data and the house price index data are in the form of point data and polygon data, respectively, the format of the data also differs, but the spatial detail also differs. Because of this difference in data, it is necessary to construct an integrated form of data in order to compare the spatial distribution of the two data (Liao et al. 2010).
이에 본 발명에서는 격자 데이터셋 형태로 두 데이터를 변환시킴으로써 공간적 분포의 비교분석과 공간적 상관성 분석을 보다 용이하게 하고자 하였다.Therefore, the present invention aims to facilitate comparative analysis of spatial distribution and spatial correlation analysis by transforming two data in a grid data set form.
격자형 데이터셋의 구축을 위해 우선, ArcMap Toolbox 중 'Create Fishnet' 기능을 적용하여 격자망 데이터를 생성하였다. 격자망 데이터셋의 범위는 트윗 데이터를 추출한 범위와 동일하게 설정하였다.In order to construct grid data set, grid data was generated by applying 'Create Fishnet' function in ArcMap Toolbox. The range of the lattice network dataset is set equal to the extracted range of the tweet data.
적절한 격자의 크기를 도출하는데 있어서, 일반적인 방격분석(Quadrat Analysis)에서 사용하는 점 자료 수 대비 대 상면적 비율, 대상지역 내 시군구 최소면적 등을 종합적으로 고려하여 2km×2km 격자크기를 적용하였다(Yu, 1998).In order to derive the appropriate grid size, a grid size of 2 km × 2 km was applied considering the total area ratio of target data to the number of points used in general quadrat analysis and the minimum area of city and county in the target area (Yu , 1998).
이러한 격자망 데이터셋에 트윗 데이터를 중첩시켜 각 격자 내에 포함된 트윗 데이터의 개수를 세어 격자의 속성정보로 입력하였다. 주택가격지수 역시 격자망 데이터셋과 중첩하여 각 격자에 대한 가격지수를 재계산 하여 입력하였다.The tweet data is superimposed on the grid data set, and the number of tweet data included in each grid is counted to input the attribute information of the grid. The house price index is also re-calculated by adding the price index for each grid overlaid with the grid data set.
이때 한 격자 내에 다수의 행정경계 폴리곤이 만날 경우에는 각 폴리곤의 격자 내 포함 비율을 계산하여 면적 비율을 가중치로 한 주택가격지수의 가중평균합을 구하였다(Shin, 2004; Jung et al.,2009).In this case, when a plurality of administrative boundary polygons are encountered in one lattice, the ratio of each polygon in the lattice is calculated, and the weighted average sum of the house price index with the area ratio as the weight is obtained (Shin, 2004; Jung et al., 2009 ).
3. Hotspot 분석3. Hotspot Analysis
본 발명에서는 소셜 미디어인 트윗 데이터와 주택가격지수 데이터의 전반적인 공간적 분포를 비교하기 위해 Hotspot 분석을 실시하였다. Hotspot 분석은 데이터 셋의 각 사상(Feature)에 대해 Getis-Ord Gi* 통계량을 계산하고 z값과 p값을 이용하여 높은 값 혹은 낮은 값의 사상이 공간적으로 군집을 이루는지를 탐색해준다(Kim and Park, 2013).In the present invention, hotspot analysis was performed to compare the overall spatial distribution of social media in-tweet data and house price index data. Hotspot analysis computes the Getis-Ord Gi * statistic for each feature in the dataset and uses the z and p values to find out whether the high or low ideality spatially clusters (Kim and Park , 2013).
본 발명에서는 ArcMapToolbox 중, 'Hotspot Analysis' 도구를 이용하여 격자화된 트윗 데이터와 주택가격지수 데이터 각각에 대한 국지적 공간 클러스터링을 탐색하여 시각적으로 비교하였다. In the present invention, the spatial spatial clustering of the grid data and the house price index data is visually compared using the 'Hotspot Analysis' tool of the ArcMapToolbox.
4. 공간적 상관성 분석4. Spatial Correlation Analysis
공간적 상관성 분석은 트윗 데이터와 주택가격지수 데이터의 공간적인 분포 패턴이 어느 정도의 유사성 또는 상관성을 가지는지를 수치적으로 파악하기 위한 과정이다. 이를 위해 본 발명에서는 이변량 공간 상관성 측도로, 공간시차를 적용한 피어슨 상관계수를 적용하였다(Lee, 2001).The spatial correlation analysis is a process for numerically grasping the degree of similarity or correlation between the spatial distribution pattern of the tweet data and the house price index data. To this end, the present invention uses a Pearson correlation coefficient applying spatial parallax as a bivariate spatial correlation measure (Lee, 2001).
이 상관계수는 일반적인 상관분석에서 쓰이는 피어슨 상관계수에 공간시차(Spatial Lag)를 적용한 것으로, 여기서 공간시차란 공간가중치 행렬(Spatial Weight Matrix)에 의해 정의된 이웃들의 가중 평균합이다. 트윗 데이터와 주택가격지수의 격자 데이터에 대하여 수학식 1과 같이 공간적 상관계수(Spatial Correlation Coefficient, SCC)를 계산하였다(Lee,2014). The correlation coefficient is a Spatial Lag applied to the Pearson correlation coefficient used in general correlation analysis, where the spatial disparity is a weighted average sum of neighbors defined by a Spatial Weight Matrix. Spatial Correlation Coefficient (SCC) was calculated for the grid data of the Tweet data and the house price index as shown in Equation (1) (Lee, 2014).

여기서 SCCAB는 A, B 데이터 간의 공간적 상관계수, i는 각 격자, n은 격자의 개수,

5. 데이터 격자화 및 통합5. Data Gridification and Integration
도 7는 트윗 데이터와 시군구 행정구역경계, 그리고 격자망 데이터셋을 크기별로 중첩시킨 결과를 나타낸다.FIG. 7 shows the result of overlapping the tweet data, the county administrative district boundary, and the grid data set by size.
도 8, 도 9는 각각 주택매매가격지수와 주택전세가격지수의 격자화된 데이터의 공간적 분포를 나타낸다.8 and 9 show the spatial distribution of the lattice data of the home sale price index and the housing rent price index, respectively.
도 8에 따르면 주택매매가격지수의 경우 과천시 지역이 높은 값을 나타내고 있으며, 파주시와 고양시 일산동구, 양주시 지역 등이 낮은 값을 나타내고 있다. 또한, 도 9에 따르면 주택전세가격지수의 경우 과천시와 의왕시 지역이 높은 값을 나타내고 있으며, 고양시 덕양구, 양주시, 성남시 수정구, 종로구 등 지역이 낮은 값을 나타내고 있다.According to FIG. 8, the value of the home price index is high in Gwacheon, and the values of Paju, Goyang, Ilsan, and Yangju are low. Also, according to FIG. 9, the housing price index of Gwacheon and Uiwang areas is high, and the values of Doyang-gu, Yangju, Seongnam-si and Jongno-gu are low.
6. Hotspot 분석 결과6. Hotspot Analysis Results
도 10, 도 11, 및 도 12는 각각 격자화한 트윗 데이터와 주택가격지수 데이터에 대한 Hotspot 분석 결과를 나타낸다.FIGS. 10, 11, and 12 show Hotspot analysis results of the grid data and the home price index data, respectively.
도 10, 도 11, 및 도 12를 통해 세 데이터에 대한 Hotspot 지역과 Coldspot 지역을 비교 분석해본 결과는 다음과 같다.10, 11, and 12, the results of comparing and analyzing the Hotspot area and the Coldspot area of the three data are as follows.
트윗 데이터에 대한 Hotspot 지역은 마포구와 서대문구, 강북구, 서초구 등 지역에서 탐색되었다. 주택매매가격지수 데이터에 대한 Hotspot 지역은 과천시를 중심으로 하여 관악구, 서초구, 성남시 중원구 등의 지역에서 가장 두드러지게 나타났으며, 부천시 지역에서도 약한 Hotspot 지역이 탐색되었다. 고양시 지역은 전체적으로 Coldspot 지역으로 탐색되었다.The hotspot area for the tweet data was discovered in the areas of Mapo-gu, Seodaemun-gu, Gangbuk-gu, Seocho-gu. The Hotspot area for housing sales price index data was most prominent in Gwanak - gu, Seocho - gu, Seongnam - si and Jungwon - gu in Gwacheon city and weak Hotspot area in Bucheon city. The Goyang City area was entirely searched for in the Coldspot area.
주택전세가격지수 데이터에 대한 Hotspot 지역은 매매가격지수와 마찬가지로 과천시가 강한 Hotspot 지역으로 나타났으며, 안양시 동안구까지 Hotspot 지역이 나타났다.The Hotspot area for the housing rent price index data is the Hotspot area with strong Gwacheon city like the selling price index, and the Hotspot area has appeared until the end of Anyang city.
결과적으로, 서초구는 트윗 데이터와 주택매매가격지수 데이터에서 공통적인 Hotspot 지역으로 나타났으며, 주택전세지수 데이터와 트윗 데이터 간에는 뚜렷한 공간적 상관성이 나타나지 않았다.As a result, Seocho-gu showed a common hotspot area in the tweet data and the house price index data, and there was no significant spatial correlation between the housing rent index data and the tweet data.
7. 공간적 상관성 분석 결과7. Results of Spatial Correlation Analysis
트윗 데이터와 주택가격지수 데이터의 공간적 상관성을 분석하기 위해 격자화된 트윗 데이터와 매매지수, 전세지수 데이터 간의 SCC를 측정하였다. 표1은 측정된 SCC값을 정리한 표이다.To analyze the spatial correlation of the tweet data and the house price index data, we measured the SCC between the grided tweet data, the trading index and the rent index data. Table 1 summarizes the measured SCC values.

표 1에 따르면 전체적으로 주택가격지수 데이터의 공간적 분포는 트윗 데이터의 공간적 분포와 음의 상관성을 띄는 것을 확인할 수 있고 특히 주택전세가격지수보다는 주택매매가격지수가 음의 상관성이 더 뚜렷한 것으로 나타났다.Table 1 shows that the spatial distribution of the housing price index data is negatively correlated with the spatial distribution of the tweet data as a whole. In particular, the home price index has a negative correlation with the housing rent price index.
이것은 주택가격지수의 공간적 분포를 설명하는데 있어서 트윗 데이터를 활용하였을 때, 일부 지역에 대해서는 유사한 분포를 탐지할 수 있으나 전체적인 경향을 비교하였을 때에는 상관성이 높지 않은 것으로 해석할 수 있다. 따라서 소셜 미디어 데이터를 활용하여 주택가격지수의 패턴을 분석, 예측하기 위해서는 보다 다양한 요소를 고려할 필요가 있을 것으로 판단된다.This can be interpreted as showing a similar distribution when the tweet data is used to explain the spatial distribution of the house price index, but it can be interpreted that the correlation is not high when the overall trends are compared. Therefore, it is necessary to consider various factors in order to analyze and forecast the pattern of housing price index using social media data.
도 13은 본 발명의 일실시예에 따른 소셜 미디어 데이터의 시공간 분석 시스템에서 적용한 발명 흐름도이다.FIG. 13 is a flowchart of an invention applied in a space-time analysis system of social media data according to an embodiment of the present invention.
도 13은 도 6과는 다른 발명을 적용한 실시예의 발명 흐름도이다.FIG. 13 is a flowchart of the invention of an embodiment to which the invention different from FIG. 6 is applied.
이때, 본 발명에서는 위치기반 소셜미디어 데이터로부터 중요한 키워드들을 텍스트 마이닝 기법을 통해 추출하고 이를 카테고리화 함으로써 대상지역에 대한 키워드들이 가지는 지역적 의미를 살펴보고자 하였다. 또한, 이들 키워드들의 공간적 분포 패턴을 살펴보고 이를 통해 특정 지역에서 어떤 키워드들이 주로 소셜 미디어 데이터 상에 나타나는지를 파악하고 이러한 분석패턴이 그 지역의 주요한 벤치마크와 어떠한 연관성이있는지 비교할 수 있는 일련의 분석방법론을 적용해보고자 하였다.At this time, in the present invention, important keywords from the location-based social media data are extracted through a text mining technique and categorized, thereby exploring the regional meaning of the keywords for the target area. In addition, we examine the spatial distribution patterns of these keywords, identify a set of keywords that primarily appear on social media data in a particular region, and then perform a series of analyzes to compare how these patterns are related to the major benchmarks in the region Methodology.
본 발명에서는 위치태그를 포함하는 트위터 데이터를 대상으로 하여 서울시 강남지역(강남구, 서초구 등)에 대한 주요 키워드를 추출하고 키워드들을 카테고리화한 후, 각 카테고리에 해당하는 트윗 데이터의 공간적인 분포를 분석하고, 이러한 분포와 그 지역의 주요한 벤치마크 POI(Point of Interest)와 어떠한 연관이 있는지 살펴보고자 하였다.In the present invention, the main keywords for the Gangnam area (Gangnam-gu, Seocho-gu, etc.) in Seoul are extracted and the keywords are categorized, and then the spatial distribution of the tweet data corresponding to each category is analyzed And to see how this distribution relates to the region's major benchmark POI (Point of Interest).
이를 위하여 본 발명에서는 도 13에 도시된 바와 같이 먼저, 위치태그를 포함한 트윗 데이터들에 대해 텍스트 마이닝을 통해 트윗 데이터에 전체적으로 포함되어 있는 주요 키워드들을 도출하고 이를 '음식', '엔터테인먼트', '업무 및 공부'의 세 개 카테고리로 분류하였으며, 각 카테고리의 키워드들을 포함하는 트윗 데이터들을 그룹화한 후, 각 카테고리별 트윗 데이터 소그룹의 공간적 분포 패턴에 대해 클러스터링을 실시하였다. 클러스터링된 지역을 지도상에 표시한 후, 기존의 건물 및 주요 POI들과 중첩하여 각 클러스터의 지역적 특성과 비교해 보았다.To this end, as shown in FIG. 13, first, main keywords included in the tweet data are extracted through text mining on tweet data including a location tag, and the keywords are classified into 'food', 'entertainment' And 'Study'. We grouped the tweet data including the keywords of each category, and then clustered the spatial distribution patterns of the tweet data small group for each category. After displaying the clustered area on the map, it was compared with the regional characteristics of each cluster by overlapping with existing buildings and major POIs.
8. 대상데이터8. Target data
본 발명에서는 위치기반 소셜미디어 데이터에 대해 경위도 속성정보를 지닌 트윗 데이터를 트위터 서비스에서 자체적으로 제공하는 인터페이스4)를 통해 2013년 8월 한달 간 수집한 데이터5)를 대상으로 하였다.In the present invention, the data collected over a month in August 2013 through the interface 4) that provides the tweet data having the latitude and longitude attribute information to the location-based social media data is provided by the Twitter service itself.
대상 지역의 공간적 범위는 좌상단 TM좌표와 우하단 TM 좌표를 각각 (198950.9, 448231.7), (209530.1, 441079.0)으로 하는 사각형 범위이다. 이 지역은 서울시 강남구를 중심으로 서초구, 송파구, 용산구, 성동구, 광진구 일부를 포함하는 지역이며, 이 지역은 주거지역, 상업지역, 업무지역 등이 모두 존재하는 지역이다. 대상 데이터인 트윗 데이터의 개수는 총 35,533개이며, 전체적인 분포는 도 14와 같이 번화가 지역(강남역, 신사역, 압구정역, 코엑스, 이태원, 건대입구역, 신천 등)을 중심으로 몰려있는 현상을 발견할 수 있다.The spatial range of the target area is a rectangular area with upper left TM and lower right TM coordinates (198950.9, 448231.7), (209530.1, 441079.0), respectively. This area includes Seocho-gu, Songpa-gu, Yongsan-gu, Seongdong-gu, and Gwangjin-gu in the center of Gangnam-gu in Seoul, which is a residential area, commercial area and business area. As shown in FIG. 14, the total number of tweet data is 35,533, which is the target data, and it is possible to find a phenomenon that the whole population is concentrated around the central area (Gangnam Station, Shinsa Station, Apgujung Station, COEX, Itaewon, have.
본 발명에서는 트윗 데이터의 텍스트 정보들에 대하여 텍스트 마이닝 기법을 적용함으로써 주요한 키워드를 도출하고 카테고리화하였다. 본 발명에서 적용한 텍스트 마이닝 기법은 발명자가 직접 Java와 Matlab을 통해 구현한 프로그램 코드에 의해 실행되었다.In the present invention, key keywords are derived and categorized by applying a text mining technique to the text information of the tweet data. The text mining technique applied in the present invention was executed by the inventor's program code implemented directly through Java and Matlab.
9. 키워드 추출9. Keyword Extraction
본 발명에서 적용한 키워드 추출 프로세스는 다음과 같다. 먼저, 위치 태그된 트윗 데이터들에 대해 코멘트에 해당하는 텍스트 부분만을 모두 추출한 다음, 텍스트에 포함된 모든 단어들을 자연어 처리(Natural Language Processing) 기술을 통해 수집한다. 수집된 단어들에 대해 조사나 동사의 활용형 등을 제거하고 단어의 기본 원형으로 변환한다. 여기서 문장부호, 숫자, 대명사, 일상에서 흔히 사용되는 일반적인 단어들을 제거한다. 이러한 과정을 통해 추출된 단어들에 대해 전체 텍스트 내에서의 출현 빈도를 계산하였다. 아래의 표 2는 단어들 중 가장 출현빈도가 높은 단어순으로 나열한 결과이다.The keyword extraction process applied in the present invention is as follows. First, all the text parts corresponding to the comments are extracted from the location-tagged tweet data, and all the words included in the text are collected through the natural language processing technique. The collected words are removed from the survey or the verb form and converted into the basic prototype of the word. Here, punctuation marks, numbers, pronouns, common words commonly used in daily life are eliminated. The frequency of occurrence of the extracted words in the whole text was calculated. Table 2 below lists the most frequently occurring words among the words.

10. 키워드 카테고리화10. Categorize keywords
9절에서 추출된 키워드들은 여러 가지의 카테고리로 분류할 수 있다. 가장 주요한 카테고리로는 '음식', '엔터테인먼트(유흥, 스포츠, 문화예술, 취미활동등)', '업무 및 공부', '사람', '동물', '날씨 및 기후', '지명', '시간', '이동', '기타 일상행위' 등이 있었다.The keywords extracted in Section 9 can be classified into various categories. The most important categories are 'food', 'entertainment' (entertainment, sports, cultural arts, hobbies), 'work and study', 'people', 'animals', 'weather and climate' Time, '' movement, 'and' other daily activities. '
이러한 카테고리들 중, '음식', '엔터테인먼트', '업무 및 공부'의 카테고리는 단어의 빈도수가 높은 동시에 지역적 특성을 가장 잘 표현할 수 있는 주요한 카테고리이며, 나머지 카테고리들은 지역적 의미와는 관련성이 높지 않은 일상적인 단어들로 판단된다. 따라서 본 발명에서는 '음식', '엔터테인먼트', '업무 및 공부' 이 세 가지 카테고리만을 분석의 대상으로 선택하였으며, 이들 카테고리에 해당하는 단어들을 재분류하였다. 이러한 카테고리의 분류와 주요 카테고리의 선정은 발명의 목적에 따라 발명자가 달리 적용할 수 있을 것으로 판단된다.Among these categories, the categories of 'food', 'entertainment', 'work and study' are the main categories that can best express the local characteristics with high frequency of words, while the remaining categories are not highly relevant to the local meaning It is judged as ordinary words. Therefore, in the present invention, only three categories of "food", "entertainment", "work and study" were selected as subjects for analysis, and words corresponding to these categories were reclassified. The classification of these categories and the selection of the main categories may be applied differently by the inventor for the purposes of the invention.
표 3은 본 발명에서 선택한 세 가지 카테고리와 각 카테고리에 포함된 단어들을 나열한 것이다.Table 3 lists the three categories selected in the present invention and the words included in each category.

11. 공간적 클러스터링 분석11. Spatial Clustering Analysis
본 발명은 위에서 도출된 세 가지 카테고리 별 키워드들을 포함하는 트윗 데이터들을 재분류하고, 공간적 클러스터링 기법을 적용함으로써 각 카테고리 별 주요 클러스터를 탐지하였다. 트윗 데이터 재분류 및 공간 클러스터링 기법의 구현 및 시각화는 ArcGIS SW (Ver. 10.3)에서 제공하는 분석기능들과 지도 시각화 기능들을 활용하였다.The present invention recovers tweet data including three categories of keywords derived from the above, and detects major clusters of each category by applying a spatial clustering technique. Implementation and visualization of tweet data reclassification and spatial clustering techniques utilized the analysis functions and map visualization functions provided by ArcGIS SW (Ver. 10.3).
12. 트윗 데이터 카테고리별 재분류12. Reclassify by Tweet data category
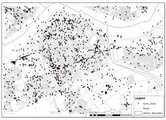
본 발명은 위의 3장에서 추출된 키워드들을 포함하는 트윗 데이터들을 탐색하여 카테고리별로 트윗 데이터를 재분류하였다. 분류 결과, '음식' 카테고리에 포함된 트윗 데이터는 총 3,781개로 전체 트윗 데이터의 약 10.6%를 차지하였으며, '엔터테인먼트' 카테고리에 포함된 트윗 데이터는 4,425개로 전체의 12.5% 정도를 차지하였다. 또한, '업무 및 공부' 카테고리에 포함된 트윗 데이터는 2,356개로, 전체의 6.6%를 차지하는 것으로 나타났다. 도 15, 도 16 및 도 17은 각각 세 가지 카테고리별로 재분류된 트윗 데이터들을 나타낸다.The present invention searches for tweet data including the keywords extracted in the above section 3 and reclassifies the tweet data by category. As a result of the classification, the total number of tweet data included in the category 'Food' was 3,781, which accounted for 10.6% of total tweet data, and the number of tweet data included in 'Entertainment' category was 4,425, which accounted for 12.5% of the total. In addition, 2,756 tweets included in the 'work and study' category accounted for 6.6% of the total. FIGS. 15, 16 and 17 show tweet data sorted by three categories, respectively.
카테고리별로 재분류된 트윗 데이터들의 공간적 분포를 살펴보면 전체적으로 약간의 차이가 있음을 발견할 수 있다. '음식' 카테고리의 트윗 데이터들은 주로 이태원, 가로수길, 압구정 로데오거리, 강남역 지역에 집중적으로 분포하고 있으며, '엔터테인먼트' 카테고리의 트윗 데이터들은 주로 코엑스몰, 잠실 종합운동장, 예술의 전당 지역에 집중적으로 분포하고 있다. '업무 및 공부' 카테고리의 트윗 데이터들은 반포 지역에 약간 모여 있는 것 외에는 전체적으로 골고루 분포하고 있었다.If we look at the spatial distribution of the tweet data recategorized by category, we can find that there is a slight difference in the whole. The tweet data in the category 'Food' is mainly distributed in Itaewon, Avenue Road, Apgujeong Rodeo Street and Gangnam Station area. The data of 'Entertainment' category is mainly focused on COEX Mall, Jamsil Sports Complex, . The tweet data in the 'Work and Study' category were distributed evenly across the Banpo area except for a few gatherings.
13. 공간적 클러스터링13. Spatial Clustering
위에서 재분류된 트윗 데이터들에 대하여 공간적 클러스터링을 실시하였다. 공간적 클러스터링 기법에는 계층적 클러스터링, 비계층적 클러스터링, 밀도 기반의 클러스터링, 격자기반 클러스터링 등 다양한 기법들이 개발되어 왔다(Kang et al., 2004). 본 발명에서는 격자기반 클러스터링 기법을 적용하였는데 클러스터링 과정은 다음과 같다.Spatial clustering was performed on the tweet data recategorized above. Various techniques such as hierarchical clustering, non-hierarchical clustering, density-based clustering, and grid-based clustering have been developed for spatial clustering techniques (Kang et al., 2004). In the present invention, a lattice-based clustering technique is applied, but the clustering process is as follows.
첫째, 대상지역을 격자로 나누고 각 격자 내에 포함되는 카테고리별 트윗 데이터의 개수를 구한다. 이때 격자의 크기는 대상지역의 범위(120.5㎢)와 트윗 데이터의 개수(35,533개)를 고려하여 50m로 결정하였다.First, divide the target area into grids and obtain the number of tweet data per category included in each grid. At this time, the size of the grid was determined as 50m considering the range of the target area (120.5km2) and the number of tweet data (35,533).
둘째, 격자 내 트윗 데이터 개수에 대한 핫스팟 분석을 실시한다.Second, we perform hot spot analysis on the number of tweet data in the grid.
셋째, 핫스팟 분석결과로부터 신뢰수준 90% 이상의 핫스팟 지역으로 선정된 지역을 잘라낸다.Third, from the results of the hot spot analysis, the region selected as the hot spot area with the confidence level of 90% or more is cut out.
넷째, 잘라낸 지역에 대해 버퍼를 적용하여 핫스팟 지역에 대한 폴리곤 데이터를 형성한다. 이때 버퍼의 크기는 실험적으로 40m를 적용하였다. 이 40m 수치는 인접한 핫스팟들을 합쳐주는 동시에 두 격자 이상 떨어진 핫스팟은 분리시키는 수준으로 결정되었다.Fourth, a polygon data for a hot spot region is formed by applying a buffer to the cut-out region. At this time, the buffer size was experimentally set to 40 m. This 40m figure was determined to be the level at which hotspots adjacent to each other are combined, while hotspots separated by more than two lattices are separated.
다섯째, 일정면적 이하의 핫스팟 폴리곤은 제거하였다. 이때 핫스팟 폴리곤의 최소면적 기준은 35,000㎡을 적용하였는데 이 수치는 두개 이하의 격자 그룹으로 구성된 핫스팟을 제거할 수 있는 수준으로 결정되었다.Fifth, hot spot polygons below a certain area were removed. At this time, the minimum area standard of the hot spot polygon is 35,000
마지막으로, 격자형태의 핫스팟을 부드러운 곡선으로 변환하기 위해 선형 단순화 기법을 적용하였다. 이때 적용한 선형 단순화 기법은 곡선의 형태보존에 우수한 Bend Simplify 기법(Wang and Muller,1998)이며 임계치는 전체적인 형상을 변형시키지 않는 범위 내에서 핫스팟 폴리곤을 곡선화 할 수 있도록 실험적으로 300m를 적용하였다.Finally, a linear simplification technique is applied to convert the grid-shaped hotspots into smooth curves. Bend Simplify (Wang and Muller, 1998), which is an excellent method for preserving the shape of a curve, applied the linear simplification method to experiment and 300m was applied to curve the hot spot polygon within the range that does not deform the overall shape of the threshold.
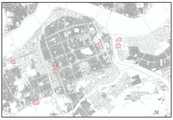
도 18, 도19 및 도 20은 각각 세 가지 카테고리에 대하여 클러스터링을 적용한 결과이다. 클러스터링의 위치를 나타내기 위해 건물 및 도로 중심선과 중첩해서 시각화하였다.FIGS. 18, 19 and 20 show the result of applying clustering to three categories, respectively. In order to show the location of the clustering, we superimposed the building and road center line to visualize it.
14. 건물 및 벤치마크 POI와 클러스터링 결과 비교14. Comparing Clustering Results with Building and Benchmark POI
위에서 도출된 각 카테고리별 클러스터링 결과와 해당지역의 건물 및 주요 벤치마크 POI를 비교해본 결과는 아래와 같다.The results of clustering results of each category derived from the above and the results of comparing buildings and major benchmark POIs in the area are as follows.
첫째, '음식' 카테고리에 해당하는 트윗 클러스터는 총 33개이며, 방배역 주변지역, 양재역 주변지역, 매봉역 4번 출구 지역, 도곡동 타워펠리스 인근, 교대역 주변지역, 신반포역 4번 출구 지역, 역삼역 주변, 선릉역,선정릉, 포스코 사거리, 삼성동 코엑스몰을 연결하는 대규모 음식점 지역, 강남역, 교보타워 사거리, 우성아파트 사거리를 연결하는 대규모 상가밀집지역, 잠실운동장 신천역 지역, 잠실 롯데월드, 석촌호수 남쪽, 강남구청역 주변, 신사역과 가로수길, 압구정동, 청담동을 아우르는 대규모 상가지역, 이태원 지역 등의 상가지역과 일치하였다. 그러나 한남 오거리, 르네상스호텔 사거리, 서초3동 사거리, 잠실학원 사거리, 동부간선도로와 올림픽대로 교차지점 등 음식점이 많지 않은 지역과 일치하는 클러스터도 있었다.First, there are 33 tweets clusters in the category of 'food', and there are 33 clusters in the vicinity of Bangbae Station, around Yangjae Station, at exit 4 of Maebong Station, near Tower Palace, Dogok - dong, Jamsil Lotte World, South Seokchon Lake, Gangnam District Office, Gangnam Station, Kyobo Tower Crossroad, Woosung Apartment Complex, Jamsil Stadium, Sincheon Station Area, Jamsil Lotte World, It is in line with shopping districts such as the surrounding area, shrine area and boulevard road, Apgujeong-dong, large-scale shopping district including Cheongdam-dong, and Itaewon area. However, there were also clusters that corresponded to areas where there were not many restaurants such as Hannam Oguri, Renaissance Hotel Sagley, Seocho 3-dong Sagley, Jamsil Gakwon Sagley, Dongbu Highway and Olympic Boulevard.
둘째, '엔터테인먼트' 카테고리에 해당하는 트윗 클러스터는 총 7개이며, 예술의 전당, 강남역 극장가, 코엑스몰, 잠실운동장과 일치하였으나 문화시설이 없는 신반포역 4번출구 지역과 일치하는 클러스터도 있었다.Secondly, there are 7 clusters of tweets that correspond to 'entertainment' category, and there were clusters that coincided with the arts center, Gangnam Station Theater, COEX Mall, Jamsil Stadium,
셋째, '업무 및 공부' 카테고리에 해당하는 트윗 클러스터는 총 29개로, 양재역 인근 지역, 교대역 주변 지역, 강남구청역 인근지역, 선정릉역 인근 지역, 테헤란로 인근의 고층빌딩 지역, 신사역과 가로수길 인근 지역, 청담동 패션거리, 잠실역 교차로 인근 지역과 같은 업무관련 건물 밀집지역들과 일치하였다. 또한, 방배동 학원거리, 신반포역 인근 학원지역, 예술의 전당 인근지역, 고속터미널 내 대형서점, 개포동 경기여고 주변지역, 압구정 현대아파트 주변지역, 잠실학원 사거리 주변지역 등과 같이 공부에 관련된 지역들과도 일치하였다. 특히 강남역과 교보타워 사거리를 아우르는 클러스터는 업무와 공부 관련 건물이 혼재하는 지역이라고 할 수 있다. 그러나 잠실운동장 주변지역과 같이 업무 또는 공부와 관련이 없는 지역과 일치한 클러스터도 있었다.Third, there are 29 clusters of tweets that correspond to 'work and study' category, and there are 29 clusters in the vicinity of Yangjae Station, near Gyeongbok Station, near Gangnam Ward Station, near Jungryung Station, high - rise buildings near Teheranro, , Cheongdam-dong Fashion Street, and Jamsil Station intersection. In addition, there are many areas related to study such as Bangbae-dong Gakwon street, Sinbangpo area, Gakwon area, near art center, large bookstore in express terminal, Gapo-dong Gyeonggi high school area, Apgujeong Hyundai apartment area, Respectively. In particular, clusters covering Gangnam Station and Kyobo Tower crossroads can be said to be areas where work and study related buildings are mixed. However, there were also clusters that coincided with areas not related to work or study, such as the area around Jamsil Stadium.
본 발명에서는 위치기반 소셜 미디어 데이터로부터 텍스트 정보를 분석함으로써, 주요한 키워드를 도출하고, 이러한 키워드들을 담고 있는 메시지들이 공간적으로 어떻게 분포하고 있는지 살펴보고자 하였다. 이에 대한 결론은 다음과 같다.In the present invention, text information is analyzed from location-based social media data to extract key keywords and to see how the messages containing these keywords are spatially distributed. The conclusion is as follows.
1. '음식' 카테고리의 트윗 데이터들로부터 도출한 클러스터는 음식점 밀집지역을 포함하는 대규모 상가지역들과 일치하였다.1. Clusters derived from tweet data in the 'food' category were consistent with large-scale shopping districts, including restaurants.
2. '엔터테인먼트' 카테고리의 클러스터들은 극장, 공연장, 경기장 등 주요한 문화 및 여가 관련 POI와 일치하였다.2. Clusters in the 'Entertainment' category were consistent with major cultural and leisure-related POIs such as theaters, theaters, and stadiums.
3. '업무 및 공부' 카테고리의 클러스터들은 학원 밀집지역, 사무용 빌딩 밀집지역들과 대부분 일치하는 결과를 나타내었다. 그러나 몇몇의 클러스터들은 실세계의 건물 또는 POI와 일치하지 않는 경우도 있었다.3. Clusters in the 'work and study' category showed the most consistent results with dense clusters and office buildings. However, some clusters did not match real-world buildings or POIs.
본 발명은 소셜 미디어 데이터에 대한 텍스트 마이닝과 공간분석 기법을 접목하고 이러한 분석결과와 실제건물 및 POI들과의 관련성을 살펴보았다는 측면에서 의의가 있다고 할 수 있다. 이러한 노력들은 향후 소셜 미디어 데이터를 이용한 다양한 공간 빅데이터 분석 모델을 개발하는 데 활용될 수 있으며, 정책 의사결정 지원 시스템 또는 위치기반 마케팅 분야에 있어서도 유용하게 활용될 수 있을 것으로 예상된다.The present invention can be said to be significant in that the text mining and spatial analysis techniques for social media data are combined with each other, and the relation between the analysis results and actual buildings and POIs is examined. These efforts can be used to develop various spatial data analysis models using social media data, and it is expected to be useful for policy decision support system or location based marketing.
이상과 같이 본 발명은 비록 한정된 실시예와 도면에 의해 설명되었으나, 본 발명은 상기의 실시예에 한정되는 것은 아니며, 본 발명이 속하는 분야에서 통상의 지식을 가진 자라면 이러한 기재로부터 다양한 수정 및 변형이 가능하다.While the invention has been shown and described with reference to certain preferred embodiments thereof, it will be understood by those of ordinary skill in the art that various changes in form and details may be made therein without departing from the spirit and scope of the invention as defined by the appended claims. This is possible.
그러므로, 본 발명의 범위는 설명된 실시예에 국한되어 정해져서는 아니 되며, 후술하는 특허청구범위뿐 아니라 이 특허청구범위와 균등한 것들에 의해 정해져야 한다.Therefore, the scope of the present invention should not be limited to the described embodiments, but should be determined by the equivalents of the claims, as well as the claims.
Claims (1)
Translated fromKorean소셜 미디어의 텍스트 부분에 대하여 단어들을 추출하고 주제 카테고리 별로 분류하는 텍스트 분석부;
소셜 미디어의 위치정보와 장소명 정보를 활용하여 점데이터로 변환하는 공간자료 변환부;
특정 주제 카테고리에 따라 추출된 소셜 미디어 데이터에 대하여 시공간 클러스터링 분석과 핫스팟 분석, 여타 자료와의 상관성 분석을 적용시키는 시공간 분석부; 및
시공간 분석 결과(클러스터링, 핫스팟 등)를 배경지도 위에 시각화시키는 분석결과 표시부
를 포함하는 소셜 미디어 데이터의 시공간 분석 시스템.
A data collection unit for collecting social media data;
A text analyzer for extracting words from a text portion of the social media and classifying the extracted words by theme categories;
A spatial data conversion unit for converting the location information of the social media and the location name information into point data;
A space - time analyzer for applying spatial - temporal clustering analysis, hot - spot analysis, and correlation analysis to social media data extracted according to a specific subject category; And
An analysis result display section that visualizes the result of space time analysis (clustering, hot spot, etc.) on a background map
Time-based analysis system for social media data.
Priority Applications (1)
| Application Number | Priority Date | Filing Date | Title |
|---|---|---|---|
| KR1020150121909AKR20170025454A (en) | 2015-08-28 | 2015-08-28 | System and method for space-time analysis of social media data |
Applications Claiming Priority (1)
| Application Number | Priority Date | Filing Date | Title |
|---|---|---|---|
| KR1020150121909AKR20170025454A (en) | 2015-08-28 | 2015-08-28 | System and method for space-time analysis of social media data |
Publications (1)
| Publication Number | Publication Date |
|---|---|
| KR20170025454Atrue KR20170025454A (en) | 2017-03-08 |
Family
ID=58403666
Family Applications (1)
| Application Number | Title | Priority Date | Filing Date |
|---|---|---|---|
| KR1020150121909AWithdrawnKR20170025454A (en) | 2015-08-28 | 2015-08-28 | System and method for space-time analysis of social media data |
Country Status (1)
| Country | Link |
|---|---|
| KR (1) | KR20170025454A (en) |
Cited By (12)
| Publication number | Priority date | Publication date | Assignee | Title |
|---|---|---|---|---|
| KR101888010B1 (en)* | 2017-05-26 | 2018-09-06 | (주)씨에이씨컴퍼니 | System and method for providing of statistical trends service of real-estate |
| KR20190139311A (en)* | 2017-04-27 | 2019-12-17 | 스냅 인코포레이티드 | Map-based graphical user interface indicating geospatial activity metrics |
| CN110750730A (en)* | 2019-09-10 | 2020-02-04 | 合肥工业大学 | Method and system for group detection based on spatiotemporal constraints |
| KR102113969B1 (en)* | 2019-10-28 | 2020-06-02 | 이화여자대학교 산학협력단 | Method of improving classification accuracy of sns image data for tourism using space information deep learning, recording medium and device for performing the method |
| KR20200091193A (en)* | 2019-01-22 | 2020-07-30 | 광운대학교 산학협력단 | Apparatus and method for automatically analyzing urban areas, station area and hot place through location-based sns data |
| US11418906B2 (en) | 2017-04-27 | 2022-08-16 | Snap Inc. | Selective location-based identity communication |
| KR20230055081A (en)* | 2021-10-18 | 2023-04-25 | 한국과학기술원 | Urban Soundscape Detecting System using Social Media and Method thereof |
| KR102593054B1 (en) | 2022-05-09 | 2023-10-24 | 한국과학기술정보연구원 | Method and apparatus for evaluation of embedding model performance |
| US11842411B2 (en) | 2017-04-27 | 2023-12-12 | Snap Inc. | Location-based virtual avatars |
| US12113760B2 (en) | 2016-10-24 | 2024-10-08 | Snap Inc. | Generating and displaying customized avatars in media overlays |
| KR102727795B1 (en) | 2023-12-28 | 2024-11-08 | 주식회사 젠티 | Method and apparatus for improving the performance of artificial intelligence models |
| US12363056B2 (en) | 2017-01-23 | 2025-07-15 | Snap Inc. | Customized digital avatar accessories |
- 2015
- 2015-08-28KRKR1020150121909Apatent/KR20170025454A/ennot_activeWithdrawn
Cited By (33)
| Publication number | Priority date | Publication date | Assignee | Title |
|---|---|---|---|---|
| US12113760B2 (en) | 2016-10-24 | 2024-10-08 | Snap Inc. | Generating and displaying customized avatars in media overlays |
| US12316589B2 (en) | 2016-10-24 | 2025-05-27 | Snap Inc. | Generating and displaying customized avatars in media overlays |
| US12363056B2 (en) | 2017-01-23 | 2025-07-15 | Snap Inc. | Customized digital avatar accessories |
| US12112013B2 (en) | 2017-04-27 | 2024-10-08 | Snap Inc. | Location privacy management on map-based social media platforms |
| US12086381B2 (en) | 2017-04-27 | 2024-09-10 | Snap Inc. | Map-based graphical user interface for multi-type social media galleries |
| US12393318B2 (en) | 2017-04-27 | 2025-08-19 | Snap Inc. | Map-based graphical user interface for ephemeral social media content |
| KR20190139311A (en)* | 2017-04-27 | 2019-12-17 | 스냅 인코포레이티드 | Map-based graphical user interface indicating geospatial activity metrics |
| US12340064B2 (en) | 2017-04-27 | 2025-06-24 | Snap Inc. | Map-based graphical user interface indicating geospatial activity metrics |
| US11385763B2 (en) | 2017-04-27 | 2022-07-12 | Snap Inc. | Map-based graphical user interface indicating geospatial activity metrics |
| US11392264B1 (en) | 2017-04-27 | 2022-07-19 | Snap Inc. | Map-based graphical user interface for multi-type social media galleries |
| US11409407B2 (en) | 2017-04-27 | 2022-08-09 | Snap Inc. | Map-based graphical user interface indicating geospatial activity metrics |
| US11418906B2 (en) | 2017-04-27 | 2022-08-16 | Snap Inc. | Selective location-based identity communication |
| KR20220119185A (en)* | 2017-04-27 | 2022-08-26 | 스냅 인코포레이티드 | Methods and systems for surfacing subject matter on posting anomality |
| US11451956B1 (en) | 2017-04-27 | 2022-09-20 | Snap Inc. | Location privacy management on map-based social media platforms |
| US11474663B2 (en) | 2017-04-27 | 2022-10-18 | Snap Inc. | Location-based search mechanism in a graphical user interface |
| US11556221B2 (en) | 2017-04-27 | 2023-01-17 | Snap Inc. | Friend location sharing mechanism for social media platforms |
| KR20200002996A (en)* | 2017-04-27 | 2020-01-08 | 스냅 인코포레이티드 | Map-based graphical user interface that displays geospatial activity metrics |
| US12223156B2 (en) | 2017-04-27 | 2025-02-11 | Snap Inc. | Low-latency delivery mechanism for map-based GUI |
| US11782574B2 (en) | 2017-04-27 | 2023-10-10 | Snap Inc. | Map-based graphical user interface indicating geospatial activity metrics |
| KR20200002969A (en)* | 2017-04-27 | 2020-01-08 | 스냅 인코포레이티드 | Location privacy management for map-based social media platforms |
| US11893647B2 (en) | 2017-04-27 | 2024-02-06 | Snap Inc. | Location-based virtual avatars |
| US11995288B2 (en) | 2017-04-27 | 2024-05-28 | Snap Inc. | Location-based search mechanism in a graphical user interface |
| US12058583B2 (en) | 2017-04-27 | 2024-08-06 | Snap Inc. | Selective location-based identity communication |
| US12131003B2 (en) | 2017-04-27 | 2024-10-29 | Snap Inc. | Map-based graphical user interface indicating geospatial activity metrics |
| US11842411B2 (en) | 2017-04-27 | 2023-12-12 | Snap Inc. | Location-based virtual avatars |
| KR101888010B1 (en)* | 2017-05-26 | 2018-09-06 | (주)씨에이씨컴퍼니 | System and method for providing of statistical trends service of real-estate |
| KR20200091193A (en)* | 2019-01-22 | 2020-07-30 | 광운대학교 산학협력단 | Apparatus and method for automatically analyzing urban areas, station area and hot place through location-based sns data |
| CN110750730A (en)* | 2019-09-10 | 2020-02-04 | 合肥工业大学 | Method and system for group detection based on spatiotemporal constraints |
| KR102141777B1 (en)* | 2019-10-28 | 2020-08-05 | 이화여자대학교 산학협력단 | Method of classifying sns image data for tourism and analyzing preference by tourists using convolution neural network, recording medium and device for performing the method |
| KR102113969B1 (en)* | 2019-10-28 | 2020-06-02 | 이화여자대학교 산학협력단 | Method of improving classification accuracy of sns image data for tourism using space information deep learning, recording medium and device for performing the method |
| KR20230055081A (en)* | 2021-10-18 | 2023-04-25 | 한국과학기술원 | Urban Soundscape Detecting System using Social Media and Method thereof |
| KR102593054B1 (en) | 2022-05-09 | 2023-10-24 | 한국과학기술정보연구원 | Method and apparatus for evaluation of embedding model performance |
| KR102727795B1 (en) | 2023-12-28 | 2024-11-08 | 주식회사 젠티 | Method and apparatus for improving the performance of artificial intelligence models |
Similar Documents
| Publication | Publication Date | Title |
|---|---|---|
| KR20170025454A (en) | System and method for space-time analysis of social media data | |
| Hu et al. | A graph-based approach to detecting tourist movement patterns using social media data | |
| Du et al. | Large-scale urban functional zone mapping by integrating remote sensing images and open social data | |
| Zhai et al. | Beyond Word2vec: An approach for urban functional region extraction and identification by combining Place2vec and POIs | |
| Wang et al. | Machine learning-based regional scale intelligent modeling of building information for natural hazard risk management | |
| Hasnat et al. | Identifying tourists and analyzing spatial patterns of their destinations from location-based social media data | |
| Wieczorek et al. | Geographic information systems | |
| Lansley et al. | The geography of Twitter topics in London | |
| Gao et al. | A multidimensional spatial scan statistics approach to movement pattern comparison | |
| Hu et al. | Automated urban land-use classification with remote sensing | |
| Bhatta | Urban growth analysis and remote sensing: a case study of Kolkata, India 1980–2010 | |
| De Albuquerque et al. | A geographic approach for combining social media and authoritative data towards identifying useful information for disaster management | |
| Pham et al. | Urban growth and change analysis using remote sensing and spatial metrics from 1975 to 2003 for Hanoi, Vietnam | |
| Dong et al. | Evaluation of small-area population estimation using LiDAR, Landsat TM and parcel data | |
| Yu et al. | Mobile phone data in urban commuting: A network community detection‐based framework to unveil the spatial structure of commuting demand | |
| Wang et al. | IS2Fun: Identification of subway station functions using massive urban data | |
| CN105183870A (en) | Urban functional domain detection method and system by means of microblog position information | |
| Deng et al. | A density-based approach for detecting network-constrained clusters in spatial point events | |
| Chen et al. | Large-scale urban building function mapping by integrating multi-source web-based geospatial data | |
| Liu et al. | Activity knowledge discovery: Detecting collective and individual activities with digital footprints and open source geographic data | |
| Lansley et al. | Big data and geospatial analysis | |
| Ganguly et al. | Optimization of spatial statistical approaches to identify land use/land cover change hot spots of Pune region of Maharashtra using remote sensing and GIS techniques | |
| Liu | Identifying urban land use social functional units: a case study using OSM data | |
| Wu et al. | Mining typhoon victim information based on multi-source data fusion using social media data in China: a case study of the 2019 Super Typhoon Lekima | |
| Zeini et al. | An exploratory study of place-names in Sinai Peninsula, Egypt: a spatial approach |
Legal Events
| Date | Code | Title | Description |
|---|---|---|---|
| PA0109 | Patent application | Patent event code:PA01091R01D Comment text:Patent Application Patent event date:20150828 | |
| PG1501 | Laying open of application | ||
| PC1203 | Withdrawal of no request for examination |