KR20110094064A - Confirmation method and use of sleep and wakefulness pattern - Google Patents
Confirmation method and use of sleep and wakefulness patternDownload PDFInfo
- Publication number
- KR20110094064A KR20110094064AKR1020117013607AKR20117013607AKR20110094064AKR 20110094064 AKR20110094064 AKR 20110094064AKR 1020117013607 AKR1020117013607 AKR 1020117013607AKR 20117013607 AKR20117013607 AKR 20117013607AKR 20110094064 AKR20110094064 AKR 20110094064A
- Authority
- KR
- South Korea
- Prior art keywords
- sleep
- data
- animal
- frequency
- rem
- Prior art date
- Legal status (The legal status is an assumption and is not a legal conclusion. Google has not performed a legal analysis and makes no representation as to the accuracy of the status listed.)
- Ceased
Links
Images


Classifications
- A—HUMAN NECESSITIES
- A61—MEDICAL OR VETERINARY SCIENCE; HYGIENE
- A61B—DIAGNOSIS; SURGERY; IDENTIFICATION
- A61B5/00—Measuring for diagnostic purposes; Identification of persons
- A61B5/24—Detecting, measuring or recording bioelectric or biomagnetic signals of the body or parts thereof
- A61B5/316—Modalities, i.e. specific diagnostic methods
- A61B5/369—Electroencephalography [EEG]
- A—HUMAN NECESSITIES
- A61—MEDICAL OR VETERINARY SCIENCE; HYGIENE
- A61B—DIAGNOSIS; SURGERY; IDENTIFICATION
- A61B5/00—Measuring for diagnostic purposes; Identification of persons
- A61B5/0002—Remote monitoring of patients using telemetry, e.g. transmission of vital signals via a communication network
- A61B5/0015—Remote monitoring of patients using telemetry, e.g. transmission of vital signals via a communication network characterised by features of the telemetry system
- A61B5/0022—Monitoring a patient using a global network, e.g. telephone networks, internet
- A—HUMAN NECESSITIES
- A61—MEDICAL OR VETERINARY SCIENCE; HYGIENE
- A61B—DIAGNOSIS; SURGERY; IDENTIFICATION
- A61B5/00—Measuring for diagnostic purposes; Identification of persons
- A61B5/24—Detecting, measuring or recording bioelectric or biomagnetic signals of the body or parts thereof
- A61B5/25—Bioelectric electrodes therefor
- A61B5/279—Bioelectric electrodes therefor specially adapted for particular uses
- A61B5/291—Bioelectric electrodes therefor specially adapted for particular uses for electroencephalography [EEG]
- A61B5/293—Invasive
- A—HUMAN NECESSITIES
- A61—MEDICAL OR VETERINARY SCIENCE; HYGIENE
- A61B—DIAGNOSIS; SURGERY; IDENTIFICATION
- A61B5/00—Measuring for diagnostic purposes; Identification of persons
- A61B5/24—Detecting, measuring or recording bioelectric or biomagnetic signals of the body or parts thereof
- A61B5/316—Modalities, i.e. specific diagnostic methods
- A61B5/369—Electroencephalography [EEG]
- A61B5/372—Analysis of electroencephalograms
- A—HUMAN NECESSITIES
- A61—MEDICAL OR VETERINARY SCIENCE; HYGIENE
- A61B—DIAGNOSIS; SURGERY; IDENTIFICATION
- A61B5/00—Measuring for diagnostic purposes; Identification of persons
- A61B5/24—Detecting, measuring or recording bioelectric or biomagnetic signals of the body or parts thereof
- A61B5/316—Modalities, i.e. specific diagnostic methods
- A61B5/369—Electroencephalography [EEG]
- A61B5/377—Electroencephalography [EEG] using evoked responses
- A—HUMAN NECESSITIES
- A61—MEDICAL OR VETERINARY SCIENCE; HYGIENE
- A61B—DIAGNOSIS; SURGERY; IDENTIFICATION
- A61B5/00—Measuring for diagnostic purposes; Identification of persons
- A61B5/48—Other medical applications
- A61B5/4806—Sleep evaluation
- A61B5/4809—Sleep detection, i.e. determining whether a subject is asleep or not
- A—HUMAN NECESSITIES
- A61—MEDICAL OR VETERINARY SCIENCE; HYGIENE
- A61B—DIAGNOSIS; SURGERY; IDENTIFICATION
- A61B5/00—Measuring for diagnostic purposes; Identification of persons
- A61B5/48—Other medical applications
- A61B5/4806—Sleep evaluation
- A61B5/4812—Detecting sleep stages or cycles
- A—HUMAN NECESSITIES
- A61—MEDICAL OR VETERINARY SCIENCE; HYGIENE
- A61B—DIAGNOSIS; SURGERY; IDENTIFICATION
- A61B5/00—Measuring for diagnostic purposes; Identification of persons
- A61B5/48—Other medical applications
- A61B5/4806—Sleep evaluation
- A61B5/4815—Sleep quality
- A—HUMAN NECESSITIES
- A61—MEDICAL OR VETERINARY SCIENCE; HYGIENE
- A61B—DIAGNOSIS; SURGERY; IDENTIFICATION
- A61B5/00—Measuring for diagnostic purposes; Identification of persons
- A61B5/72—Signal processing specially adapted for physiological signals or for diagnostic purposes
- A61B5/7235—Details of waveform analysis
Landscapes
- Health & Medical Sciences (AREA)
- Life Sciences & Earth Sciences (AREA)
- Engineering & Computer Science (AREA)
- General Health & Medical Sciences (AREA)
- Veterinary Medicine (AREA)
- Biophysics (AREA)
- Biomedical Technology (AREA)
- Heart & Thoracic Surgery (AREA)
- Medical Informatics (AREA)
- Molecular Biology (AREA)
- Surgery (AREA)
- Animal Behavior & Ethology (AREA)
- Physics & Mathematics (AREA)
- Public Health (AREA)
- Pathology (AREA)
- Psychiatry (AREA)
- Psychology (AREA)
- Anesthesiology (AREA)
- Computer Networks & Wireless Communication (AREA)
- Artificial Intelligence (AREA)
- Computer Vision & Pattern Recognition (AREA)
- Physiology (AREA)
- Signal Processing (AREA)
- Measurement And Recording Of Electrical Phenomena And Electrical Characteristics Of The Living Body (AREA)
- Measurement Of The Respiration, Hearing Ability, Form, And Blood Characteristics Of Living Organisms (AREA)
Abstract
Translated fromKoreanDescription
Translated fromKorean본 출원은 2008년 11월 14일자로 출원된 미국 가출원 제 61/114,986호, 2008년 11월 14일자로 출원된 미국 가출원 제 61/114,997호 및 2008년 11월 17일자로 출원된 미국 가출원 제 61/115,464호의 이익을 주장하며, 이의 개시내용은 본원에서 전체가 참고로 인용된다.This application is directed to US Provisional Application No. 61 / 114,986, filed November 14, 2008, US Provisional Application No. 61 / 114,997, filed November 14, 2008, and US Provisional Application No. 61, filed November 17, 2008. / 115,464, the disclosure of which is incorporated herein by reference in its entirety.
본 발명은 인간을 포함하는 동물로부터 수집된 데이터를 추출하고 평가하고, 더 나아가 생체지표(biomarker) 및 진단응용(diagnostic application)을 개발할 수 있는 수면의 패턴을 판정하기 위한 분석 방법에 관한 것이다.The present invention relates to an analytical method for extracting and evaluating data collected from animals, including humans, and further determining sleep patterns capable of developing biomarkers and diagnostic applications.
인간을 포함한 동물은 적절히 기능하기 위해 수면을 필요로 한다. 우리들 일생의 최대 1/3이 수면에 할애되고 있다. 수면 부족은 기억 및 운동 기능뿐만 아니라 생리적으로 해로운 영향을 미친다. 심지어 다양한 질병들이 우울증, 알츠하이머 병 및 신장병과 같은 수면 장애와 관련될 수 있다. 일반적으로 수면 장애의 진단은, 환자가 수면 실험실에서 머리와 신체에 전극에 부착한 상태에서, 두뇌 활동, 근육 활동 및 그 밖의 요인들에 대해 수집된 미가공 데이터의 분석의 결과이다. 보통 이러한 결과는 데이터의 개별적인 분석에 따라 다르다.Animals, including humans, need sleep to function properly. Up to one third of our lives are devoted to sleep. Lack of sleep not only affects memory and motor function, but also has a physiologically harmful effect. Even various diseases can be associated with sleep disorders such as depression, Alzheimer's disease and kidney disease. Diagnosis of sleep disorders is generally the result of analysis of raw data collected about brain activity, muscle activity and other factors, with the patient attached to electrodes on the head and body in the sleep laboratory. Usually these results depend on the individual analysis of the data.
뇌전도(뇌파, electroencephalogram: EEG)는 두뇌에 의해 생산되는 전기적 활동을 측정하는데 사용되는 장비이다. 두뇌의 기능 활동은 두피에 부착된 전극에 의해 수집된다. EEG는 환자의 두뇌 기능에 대한 중요한 정보를 제공한다. 두피 EEG는 신경 전달 물질(neurotransmitters)에 의해 결속된 수지상 조직(dendrites)으로부터의 또는 수지상 조직 내로의 이온의 흐름에 기인하는 세포외 공간(extracellular space)에서의 후-시냅스(post-synapse)에 존재하는 전류의 합을 측정하는 것으로 여겨진다. EEG는 간질에 대한 진단 도구로서 신경학에서 주로 사용되지만, 그 기술은 수면 장애를 포함하는 그 밖의 병리학의 연구 분야에서 사용될 수 있다. 전통적으로 수면 기록은 EEG를 포함하는 데이터의 다중 채널을 필요로 한다.Electroencephalogram (EEG) is a device used to measure the electrical activity produced by the brain. The brain's functional activity is collected by electrodes attached to the scalp. EEG provides important information about the brain function of the patient. Scalp EEG is present at post-synapse in extracellular space resulting from the flow of ions from or into dendrites bound by neurotransmitters. It is thought to measure the sum of the currents. EEG is primarily used in neurology as a diagnostic tool for epilepsy, but the technique can be used in the field of research of other pathologies, including sleep disorders. Traditionally, sleep recording requires multiple channels of data, including EEG.
1937년, 인간 수면의 분류 체계(taxonomy)가 고안되었다. 이러한 5단계 분류 체계는 1953년에 발견된 급속 안구 운동(rapid eye movement: REM, 렘) 수면을 포함하지 않았다. 5년 후, Dement와 Kleitman은 렘 수면과 4개의 비-렘(non-REM: NREM) 단계를 망라하는 수면에 대한 서술을 제공하였다. 1968년, Rechtschaffen과 Kales가 주도하는 위원회는 Dement와 Kleitman이 확립한 수면 단계에 대한 이전 서술과의 연관성를 제공하는 "인간 대상의 수면 단계에 대한 표준 용어, 기법 및 채점 시스템의 설명서(A Manual of Standardized terminology, Techniques and Scoring System for Sleep Stages of Human Subject)" (R-K)을 고안했다. R-K는 인간 수면을 두 개의 서파 수면(slow wave sleep: SWS) 단계(단계 III 및 단계 IV), 두 개의 중간 수면(intermediate sleep) 단계 (단계 I 및 단계 II) 및 렘 수면으로 분류한다. 이러한 분류에서, SWS EEG는 많은 양의 고진폭(high amplitude)의 서파활동(slow wave activity)의 중간으로 이루어지고; REM은 간헐적인 급속 안구 운동(REMs)과 저진폭(low-amplitude)의 근전도(electromyogram: EMG)와 함께 비교적 낮은 전압의 혼합 주파수의 EEG나타내고; IS는 12-14 Hz의 수면 방추 진동(spindle oscillations)과 짧은 고진폭 K-복합체(K-complexes)를 더 보여주는 단계 II와 함께 비교적 낮은 전압과 혼합 주파수의 EEG를 가지며; 각성 EEG는 알파 활동 및/또는 낮은 전압의 혼합 주파수 활동을 포함한다. 수면과 각성 단계의 이러한 특성은 수면 연구를 이끄는데 커다란 영향을 주었다. 최근에, R-K에 의해 제공된 규칙들이 수정되었고, 3개의 비-렘 단계는 남기고 단계 III 및 단계 IV의 구분이 제거되었다. 수면 채점자(sleep scorer)들이 새로운 시스템에 적응할 것으로 기대되지만, 수면 단계의 정확한 수는 아직도 대단한 토론의 주제이다.In 1937, the taxonomy of human sleep was devised. This five-level classification did not include the rapid eye movement (REM) sleep discovered in 1953. Five years later, Dement and Kleitman provided a description of sleep covering REM sleep and four non-REM (NREM) stages. In 1968, a committee led by Rechtschaffen and Kales established a "A Manual of Standardized Standards, Techniques and Grading System for the Sleep Stages of Human Subjects" that provides a link to previous descriptions of the sleep stages established by Dement and Kleitman. terminology, Techniques and Scoring System for Sleep Stages of Human Subject) "(RK). R-K classifies human sleep into two slow wave sleep (SWS) stages (stage III and stage IV), two intermediate sleep stages (stage I and stage II) and REM sleep. In this class, the SWS EEG is made up of a medium amount of high amplitude slow wave activity; REM represents a relatively low voltage mixed frequency EEG with intermittent rapid eye movements (REMs) and low-amplitude electromyogram (EMG); The IS has a relatively low voltage and mixed frequency EEG with stage II further showing 12-14 Hz sleep oscillations and short high amplitude K-complexes; Awakening EEG includes alpha activity and / or low voltage mixed frequency activity. These characteristics of the sleep and wakefulness stages have had a great impact on leading sleep studies. Recently, the rules provided by R-K have been revised and the distinction between stages III and IV has been removed leaving three non-REM stages. Sleep scorers are expected to adapt to the new system, but the exact number of sleep stages is still the subject of great discussion.
렘 수면은 흔히 급속 안구 운동의 기간으로 특징지어 진다. 렘은 또한 안구 운동이 거의 없거나 아예 없는 렘 수면의 긴장부(tonic part) 동안의 긴장성(tonic) 및 위상성(phasic)으로 설명되었다. 렘의 위상부(phasic part)는 많은 안구 운동으로 이루어져 있다. 렘 수면은 또한 "역설적(paradoxical)" 수면으로도 불리는데, 그 이유는 신체와 두뇌가 자고 있는 동안 미가공 EEG가 깨어 있는 사람의 두뇌와 비슷한 패턴을 보이기 때문이다.REM sleep is often characterized by a period of rapid eye movement. REM has also been described as tonic and phasic during the tonic part of REM sleep with little or no eye movement. The phasic part of REM consists of many eye movements. REM sleep is also called "paradoxical" sleep because the raw EEG shows a pattern similar to the brain of awake person while the body and brain are sleeping.
인간 채점의 주관적인 특성뿐만 아니라 개개인들에 있어서의 수면 구조의 다양성을 고려해 볼 때, R-K에 대한 "확고한" 해석을 기반으로 야간 수면을 분명한 단계들로 객관적으로 분할하는 것은 어렵고; 지도 및 자율 분류기(supervised and unsupervised classifiers)와 같은 기법들이 인간 또는 동물의 두뇌 활동에 대한 단일 채널을 이용하여 다중 데이터 세트 전체에 걸쳐서 수면 단계 자동 분류를 성공하지 못했다 (Himanen, S. & Hasan, J.,SleepMed. Rev.4, 149 (2000); Kelly, J., et al.,Clin.Electroenceph.16, 16 (1985); H. Danker-Hopfe, et al.,J SleepRes.13, 63 (2004); Chediak, A., et al., J.ClinSleepMed.2, 427 (2006); Roberts, S. & Tarrassenko, L.,IEEProceedings-F139, 420 (1992); Gervasoni, D., et al.,J.Neurosci.24, 11137 (2004); Anderer, P., et al.,Neuropsychobiology51, 115 (2005); Flexer, A., et al.,ArtifIntellMed.33,199 (2005)).Given the subjective nature of human scoring as well as the diversity of sleep structures in individuals, it is difficult to objectively divide nightly sleep into distinct steps based on a “firm” interpretation of RK; Techniques such as supervised and unsupervised classifiers have not succeeded in automatically classifying sleep stages across multiple data sets using a single channel of human or animal brain activity (Himanen, S. & Hasan, J.). .,SleepMed. Rev.4 , 149 (2000); Kelly, J., et al.,Clin.Electroenceph.16 , 16 (1985); H. Danker-Hopfe, et al.,J SleepRes.13 , 63 (2004); Chediak, A., et al. ,J.ClinSleepMed.2 , 427 (2006); Roberts, S. & Tarrassenko, L.,IEEProceedings-F139 , 420 (1992); Gervasoni, D., et al.,J.Neurosci .24 , 11137 (2004); Anderer, P., et al.,
전압장(voltage field)이 두개골로부터 더욱 인가될수록, EEG가 전기적 활동을 검출하는 것이 더욱 어렵다. 인간 EEG 기록은 두개골에 의해 저주파 필터링되기 때문에, 상하 서파 수면 상태(up and down SWS states) 동안의 고주파 및 저주파의 상호교차(interdigitation) 또는 렘 수면 동안의 감마 진동(gamma oscillation)과 같은 동물의 두개내 연구에서 검출된 더 높은 주파수 신호는 관찰하기가 어려우나, 자기 측정(magnetic measurement)을 이용하여 검출된 바 있다. 인간 EEG의 두피 기록은 좋지 못한 공간 분해능을 갖는다. 따라서 동물 연구에서 제안된 바와 같이, 인간의 서파 수면과 렘 수면이 공간적으로 각각 "동기화" 및 "비동기화"되었는지는 알려지지 않았다. (Destexhe, A., et al.,Neurosci.19, 4595 (1999); Gottesmann, C.,Neurosci.Biobehav.Rev.20, 367 (1996); Llin, R., U. Ribary,Proc.Natl.Acad.Sci.USA90, 2078 (1993); Destexhe, A., & Sejnowski, T.J. "ThalamocorticalAssemblies", Destexhe, A., & T. J. Sejnowski, Eds. (Oxford Univ. Press, Oxford, 2001) pp. 347-391.The more voltage field is applied from the skull, the more difficult it is for the EEG to detect electrical activity. Since human EEG records are low frequency filtered by the skull, two of the animals, such as high and low frequency interdigitation during up and down SWS states, or gamma oscillation during REM sleep The higher frequency signals detected in my study are difficult to observe, but have been detected using magnetic measurements. Scalp recordings of human EEG have poor spatial resolution. Thus, as suggested in animal studies, it is not known whether human slow wave sleep and REM sleep are spatially "synchronized" and "unsynchronized," respectively. (Destexhe, A., et al, Neurosci 19, 4595 (1999);.... Gottesmann, C., Neurosci Biobehav Rev 20, 367 (1996);.. Llin, R., U. Ribary, Proc Natl.Acad.Sci.USA90 , 2078 (1993); Destexhe, A., & Sejnowski, TJ "ThalamocorticalAssemblies", Destexhe, A., & TJ Sejnowski, Eds. (Oxford Univ. Press, Oxford, 2001) pp. 347-391.
수면 패턴의 연구는 지속적으로 중요한 연구 주제였다. 인간에 적용하기 위해, 과학적인 동물 연구에서 일반적으로 사용되는 설치류가 잘 알려져 있다. 연구는 병리적 상태, 유전학적 검사, 화장품 안전성, 백신 및 수술 절차뿐만 아니라 약품의 안전성 및 효능을 판정하기 위해 실행된다. 설치류에서부터 조류 및 유인원에 이르는 동물에서의 EEG에 대한 조직적 연구는 수술 요건에 의해 방해되었다. 전극 삽입은 동물에 있어서 스트레스, 출혈 및 피로를 유발할 수 있다. 또한 전극 삽입의 어려움은 고도로 훈련된 직원을 필요로 한다. 따라서 EEG의 단일 채널로부터 침습적인 방법의 부재 하에 두뇌 활동에 있어서의 감지하기 어려운 그러나 통계상 유의한 변화를 검출할 수 있는 자동화된 수면 분석 방법에 대한 상당한 필요가 존재한다. 인간에 있어서, 또 다른 필요는 생체지표 및 진단응용을 위한 새로운 수면 패턴을 사용하는 것이다.The study of sleep patterns has continued to be an important research topic. For use in humans, rodents commonly used in scientific animal studies are well known. Studies are conducted to determine the safety and efficacy of drugs as well as pathological conditions, genetic tests, cosmetic safety, vaccines and surgical procedures. Systematic studies of EEG in animals from rodents to birds and apes have been hampered by surgical requirements. Electrode insertion can cause stress, bleeding and fatigue in animals. Difficulties in electrode insertion also require highly trained staff. Thus, there is a significant need for an automated sleep analysis method capable of detecting subtle but statistically significant changes in brain activity in the absence of invasive methods from a single channel of EEG. For humans, another need is to use new sleep patterns for biomarkers and diagnostic applications.
발명의 요약Summary of the Invention
일반적으로 본 발명은 수면에 대한 단일 채널 분석 방법 및 비침습적인 기록의 조합을 기반으로 동물의 두피로부터 수집된 약화된 리듬의 추출 및 분석을 위한 신규한 분석 방법을 기술한다.In general, the present invention describes a novel analysis method for the extraction and analysis of attenuated rhythms collected from the scalp of an animal based on a combination of a single channel analysis method for sleep and a non-invasive record.
본 발명의 일 양태는 종래의 방법에 비해 적은 량의 데이터를 사용하여 급속 안구 운동(rapid eye movement: REM, 렘) 수면 및 숙면과 같은 수면 단계를 구별하기 위한 방법이다. EEG의 단일 채널은 수면과 각성 단계를 분리하는데 충분하며 이들 수면 및 각성 단계는 분명히 분리 가능한 것이다.One aspect of the present invention is a method for distinguishing sleep stages such as rapid eye movement (REM) sleep and good sleep using a smaller amount of data compared to conventional methods. A single channel of the EEG is sufficient to separate the sleep and wake up stages, and these sleep and wake up stages are clearly separable.
본 발명은 또한 C3-A1 EEG 유도를 넘어서 EOG의 단일 채널도 포함하는 대안적인 유도를 일반화한다.The present invention also generalizes alternative induction that involves a single channel of EOG beyond C3-A1 EEG induction.
본 발명의 또 다른 양태는 두피 또는 머리에 부착된 오직 하나 또는 두 개의 전극을 사용하여 수면 중 생산되는 이전에 확인되지 않은 주파수를 검출하기 위한 알고리즘을 사용하기 위한 방법이다.Another aspect of the invention is a method for using an algorithm for detecting previously unidentified frequencies produced during sleep using only one or two electrodes attached to the scalp or head.
본 발명의 또 다른 양태는 산재한 개수의 인간 수면 단계의 존재이며 렘 수면이 "깨어 있는 것 같은(awake-like)" 또는 "역설적(paradoxical)"이라는 것을 부인한다. 렘 수면이 세타(theta)파를 보이는 것으로 알려져 있지만, 다른 단계들 사이뿐만 아니라 분명한 렘/W 분리는 인간 EEG의 단일 채널로부터의 이전 분석에 의해 분명하지가 않다. 렘 수면의 이중모드 시간적 단편화 패턴(bimodal temporal fragmentation pattern)이 또한 두드러진다.Another aspect of the invention is the presence of an interspersed number of human sleep stages and denies that REM sleep is "awake-like" or "paradoxical". Although REM sleep is known to show theta waves, the apparent REM / W separation as well as between different stages is not clear by previous analysis from a single channel of human EEG. The bimodal temporal fragmentation pattern of REM sleep is also prominent.
또한 본 발명의 범위 내에 있는 것은 심각한 증상의 시작 이전에 수면 장애와 관련된 질병을 진단하는데 사용될 수 있는 방법이다.Also within the scope of the present invention are methods that can be used to diagnose diseases associated with sleep disorders prior to the onset of serious symptoms.
본 발명은 또한 수면 및 각성 패턴을 기반으로 시스템 내에서의 약물의 검출뿐만 아니라 수면 및 각성에 대한 약물의 효과를 연구하기 위한 방법을 포함한다.The present invention also includes methods for studying the effects of drugs on sleep and wakefulness as well as detection of drugs in the system based on sleep and wakefulness patterns.
또한 본 발명의 범위 내에 있는 것은 수면 및 각성 상태의 생체지표를 정확히 도출할 수 있도록 수면 및 각성 패턴의 특징을 확인하고 규정하는 능력이다.Also within the scope of the present invention is the ability to identify and define features of sleep and wakefulness patterns to accurately derive biomarkers of sleep and wakefulness.
마지막으로, 이러한 방법들은 임상 및 비교 연구 모두에 있어서 수동으로 채점된 수면 단계화(sleep staging)에 대해 신속하고 경제적이며 정량적으로 엄격한 대안을 제공하며 많은 새로운 응용을 찾는다.Finally, these methods provide a rapid, economical and quantitatively rigorous alternative to manually graded sleep staging in both clinical and comparative studies and find many new applications.
실시양태는 자동으로 수면 상태를 판정하기 위한 이러한 정보의 사용을 설명한다. 수면의 질, 병리적 상태 및 약물의 효능을 자동으로 평가하는 그 밖의 응용이 설명된다. 본 개시에 따른 이러한 응용들은 명세서 및 도면, 그리고 청구범위로부터 분명해질 수 있다.Embodiments illustrate the use of this information to automatically determine sleep status. Other applications for automatically evaluating sleep quality, pathological conditions, and efficacy of drugs are described. Such applications in accordance with the present disclosure may be apparent from the specification and drawings, and from the claims.
본 발명을 명확하게 이해하고 용이하게 실시하게 위해, 본 발명은 하기 도면을 참고하여 설명될 것이며, 본원에서 동일한 부호는 동일하거나 유사한 성분을 나타내고, 상기 도면은 명세서에 인용되어, 명세서의 일부를 구성한다. 하기 도면에서:
도 1은 대상의 수면 상태 정보를 판정하기 위한 예시적인 시스템의 흐름도이다.
도 2는 대상의 수면 상태를 판정하기 위한 예시적인 시스템의 블록도이다.
도 3은 대상의 수면 상태를 판정하기 위한 다른 예시적인 시스템의 블록도이다.
도 4는 자동 데이터와 수동 데이터 중 하나를 이용하여 대상의 수면 상태를 판정하기 위한 예시적인 시스템의 블록도이다.
도 5는 수면 상태로부터 대상의 병리적 상태를 판정하기 위한 예시적인 시스템의 블록도이다.
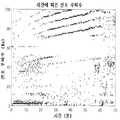
도 6은 3초 스펙트럼 윈도우(3 second spectral window) 및 1초 슬라이딩 윈도우(1 second sliding window)를 사용하는 멀티테이퍼 분석(multitaper analysis)에 의해 스펙트로그램으로 변환된 쥐 뇌전도의 하나의 채널에 대한 결과이다. 광구배(light gradient)는 광반사용 고파워 및 암반사용 저파워를 갖는 각 주파수에서의 스펙트럼 파워를 나타낸다. 점들은 1초에 해당된다.
도 7은 선호 주파수(Preferred Frequency) 분석의 결과이다. 각각의 점은 기준선에 대해 최대 변동을 갖는 주파수에 각각 해당된다.
도 8은 EEG와는 독립적으로 맹검 방식(blind manner)으로 채점된 행동 단계를 반영하기 위해 도 1의 b의 선호 주파수 분석 플롯을 착색(coloring)한 결과이다. 점들은 1초에 해당된다.
도 9는 정규화 파워에서의 피크 변이(peak fluctuation)에 대한 선호 주파수 플롯의 민감도를 증명하는 시간에 따른 스펙트럼 변동의 희박성(sparseness)에 해당되는 시간적 단편화의 결과이다.
도 10은 정규화 파워에서의 피크 변이에 대한 선호 주파수 플롯의 민감도를 증명하는 주어진 시간에서의 스펙트럼 범위 내의 스펙트럼 변동의 희박성에 해당되는 스펙트럼 단편화의 결과이다.
도 11은 세 개의 클러스터(cluster), 즉 깊은 마취(청색), 각성(황색 및 적색) 및 경련(자홍색)의 발생 여부를 증명하기 위해 SPEARS의 일부로서 단일 채널 상의 독립적인 성분 분석을 이용한 결과이다.
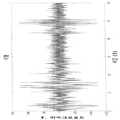
도 12는 깊은 마취에 대한 30초 동안의 미가공 EEG 데이터를 표시한 결과이다.
도 13은 경련과 함께 보다 가벼운 마취에 대한 30초 동안의 미가공 EEG 데이터를 표시한 결과이다.
도 14는 이동에 대한 30초 동안의 미가공 EEG 데이터를 표시한 결과이다.
도 15는 움직임 아티팩트(movement artifact) 및 조용한 각성에 대한 30초 동안의 미가공 EEG 데이터를 표시한 결과이다.
도 16은 렘 수면의 이중모드 시간적 단편화이다. 시간적 단편화는 두 개의 상이한 대상(도16의 a 및 b, 도16의 c 및 d)의 두 개의 상이한 수면 기록에 대한 30초 동안의 분해능으로 산정되었다. 라벨(label)은 수동 채점(도16의 a 및 c)과 또는 자동 채점(도16의 b 및 d) 중 하나로부터 표시된다. 적색으로 표시된 렘 수면은 높거나 낮은 시간적 단편화를 갖는 두 개의 상이한 그룹으로 나뉘어 진다. 이는 수동 또는 자동 알고리즘이 채점을 수행한 것과는 독립적으로 상기 기록 둘 모두에서 자명하였다.
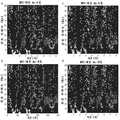
도 17은 미가공 및 정규화된 스펙트로그램을 나타낸다. 미가공 스펙트로그램 데이터는 1초 동안의 인크리먼트에 대한 30초 동안의 스펙트럼 분해능(도 17의 a) 또는 3초 동안의 스펙트럼 분해능(도 17의 b)으로 계산되었다. 이어, 각각의 스펙트로그램은 시간 및 주파수에 대해 수회 정규화되어, 1초 동안의 인크리먼트에 대한 30초 동안의 스펙트럼 분해능(도 17의 c)에서의 정규화된 스펙트로그램, 및 3초 동안의 스펙트럼 분해능(도 17의 d)에서의 다른 정규화된 스펙트로그램을 수득하였다. 움직임 아티팩트만이 미가공 데이터(도 17의 a 및 b)에서 높은 주파수(20 Hz 초과) 함량을 갖는 반면, 정규화된 스펙트로그램은 훨씬 더 높은 주파수 활동(도 17의 c 및 d)을 갖는다.
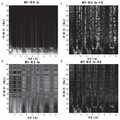
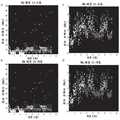
도 18은 다중 정규화를 갖는 스펙트로그램에 대한 선호 주파수 분석을 나타낸다. 선호 주파수 공간은 도 17에서 정규화된 스펙트로그램에 대해 산정되었으며, 수동 채점(도 18의 a) 및 자동 채점(도 18의 b)을 이용하여 라벨링(labeling)된다. SWS는 저주파수(10 Hz 미만) 활동에 의해 나타났다. REM은 베타 및 저감마((20 내지 40 Hz)) 활동을 갖는다. IS는 감마 활동(30 내지 50 Hz) 및 고감마 활동(50 Hz 초과)뿐만 아니라 수면 방추 활동(spindle activity) (12 내지 15 Hz)을 나타냈다. W는 베타, 저감마 및 고감마 활동(80 Hz 초과)을 나타냈다. 도 18의 c 및 d는 서로 다른 대상에 대해 도 18의 a 및 b와 각각 동일하다.
도 19는 높은 시간적 분해능으로 다중 정규화를 갖는 스펙트로그램에 대한 선호 주파수 분석을 상술한다. 도 19의 a 및 b는 도 17의 b 및 d와 각각 동일하다. 도 18의 a 및 b의 분석은 도 19의 c 및 d를 얻기 위해 도 19의 a 및 b에 각각 적용되었다. 도 18에서 관찰된 트렌드(trend)는 이러한 시간적 분해능에서 보강된다. 또한 고주파수 정보는 SWS의 경우에는 알아볼 수 있다.
도 20은 알고리즘 흐름도를 나타낸다. 알고리즘은 재료 및 방법에서 개시된 변수를 이용하여 SWS, IS, REM 및 W를 순차적으로 확인한다. 이어, 데이터는 시간에 따라 평탄화(smoothing)된다. REM/W 분리는 렘 분포에 대한 p값을 산정함으로써 다시 측정된다. 후자인 p값이 고정 값을 초과하는 경우 REM은 거절되고 W로 교체된다. REM이 수용되는 경우, 이는 W, REM 및 W로 분리된다. 예방책으로서, 야간의 매우 초기에 발생하는 REM-유사 이벤트(REM-like event)는 W로서 라벨링될 수 있다. 성능의 증가는 REM 및 W가 상이한 클러스터를 형성하는 경향을 나타낼 때 최소였다. 이것이 사용 가능한 하나의 알고리즘이다:
도 20에서 사용된 필터는 다음과 같다.
sws_필터 = 평균(2NS(3 Hz 이하));
w_필터 = 평균 (2NS(9 내지 12 Hz));
nrem_필터 = 평균(2NS(60 내지 100 Hz))+평균(2NS(3 내지 4 Hz))-[평균(2NS(12 내지 14 Hz))+평균(2NS(25 내지 60 Hz))+평균(2NS(15 내지 25 Hz))];
AA = 평균(2NS(12 내지 14 Hz));
BB = 평균(2NS(15 내지 25 Hz));
CC = 평균(WS(3 Hz 이하));
DD = 평균 (2NS(9 내지 12 HZ);
WS 및 2NS는 미가공 및 이중으로 정규화된 스펙트로그램에 각각 해당된다. 시간적 단편화는 시간 및 주파수를 통해 정규화된 스펙트럼의 시간적 구배의 절대값의 평균에 대한 z 스코어(z-score)에 해당되며, 달리 언급하지 않는 한 1 내지 100 Hz 범위 상에서 산정된다.
도 21은 자동 채점 및 수동 채점 사이의 약간의 불일치를 나타낸다. 전체 일치율(agreement rate)은 76.97 %였지만, 인간에 의해 IS로서 채점된 절반의 에포크(도 21의 a 및 c, 청록색)는 알고리즘에 의해 REM인 것으로 밝혀졌다 (도 21의 b 및 d, 적색). 이들 에포크는 PFS(도 21의 a 및 b) 및 시간적 단편화 공간(도 21의 c 및 d) 둘 모두에서 IS의 특징보다 REM의 특징에 더 가까운 특징을 나타냈으며, 특히 제 2 세트의 에포크가 수면 상태가 된지 약 2.5시간 이후에 나타났다. 제 2 채점자뿐만 아니라 인간 채점자에 의한 이들 에포크에 대한 재검토에서는 REM의 흔적을 발견하지 못했다. 수동 점수는 변하지 않고 유지되었다.
도 22는 선호 주파수 공간 및 시간적 단편화를 나타낸다. 이러한 표시는 도 21에 도시된 것과 유사한 어레이(array)를 갖는다. 도 18에 있어서 자동 및 수동 채점 사이의 전체 일치율은 83.8 %이다.
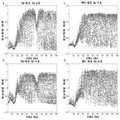
도 23은 스펙트로그램이 시간 및 주파수에 따라 수회 정규화된 반복 정규화에 의한 정규화 공간에서의 스펙트럼을 나타낸다. 렘 수면은 수동으로 채점된다. 안정된 성분 및 불안정한 성분은 K-평균 클러스터링 알고리즘(K-means clustering algorithm)을 이용하여 분리되었다. 안정된 성분(적색) 및 불안정한 성분(녹색)의 스펙트럼의 평균은 다중 기록에 대해 시간 및 주파수를 통한 다중 정규화를 나타내는 공간에 나타나 있다 (도 23의 a 및 b: VA, 도 23의 c 및 d: MPI). 렘 수면의 불안정한 부분에 대한 저주파수에서의 증가된 상대적인 파워는 안정된 부분에 반대되는 것임을 주의한다. 60 Hz에서의 오목한 곳(depression)은 VA 데이터가 60 Hz 노치 필터(60 Hz notch filter)의 사용으로 인해 나타날 가능성이 가장 큰 것이다.
도 24는 대상에 의해 수집된 데이터를 나타낸다. 각각의 세로줄(column)은 각각 다른 대상에 해당된다. 시간적인 단편화는 시간에 대해 플로팅된다. 색깔은 수면 및 각성 상태(적색= REM, 백색 = SWS, 청록색 = 중간 수면, 및 황색 = 각성)를 나타낸다. 가로줄(row)은 다음과 같다: 제 1 가로줄은 미가공 데이터로부터 아티팩트 및 REM 랜드마크(REM landmark)의 제거를 나타내고; 제 2 가로줄은 전체 종렬 상의 분석에 해당되고, 제 3 가로줄은 REM에 대해 오직 안구 운동 아티팩트 상의 분석에 해당되고; 제 4 가로줄은 REM에 대해 오직 경계표 및 아티팩트(안구는 제외됨) 상의 분석에 해당된다.
도 25는 도 24의 데이터에 대한 플롯을 나타내지만, 오직 REM 데이터만이 그래프로 도시된다. 이중모드의 시간적 단편화는 아티팩트가 제거되었음에도 불구하고 첫 번째 가로줄에 보여질 수 있다.
도 26은 오직 데이터 포인트(data point)만이 표시된 상태에서 도 25의 REM 데이터를 나타낸다.
도 27은 도 25의 첫 번째 두 개의 가로줄을 도시한다.
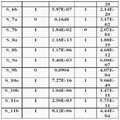
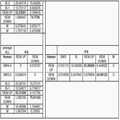
도 28은 테이블 S5이다. 이 테이블에는 렘 수면의 시간적으로 단편화된 부분에 대한 통계치가 도시되어 있다. REM의 비율(%), 에피소드(episode)의 수, 이들의 평균 기간 및 분리는 데이터 세트 둘 모두에 대한 각각의 기록에 나타나 있다.
도 29는 테이블 S6이다. 이 테이블에는 렘 수면의 단편화된 부분 및 단편화되지 않은 부분이 위상성 또는 긴장성 REM에 해당되지 않는 것으로 나타나 있다. VA 데이터에서만, REM은 안구 운동(긴장성 REM)이 없는 에포크 및 0 내지 25 %, 25 내지 50 %, 50 내지 75 %, 및 75 내지 100 %의 안구 운동(위상성 REM)이 이루어진 에포크로 하위 분류되었다. 각 대상에 있어서, 상기에서 나열된 하위 상태(substate) 중 하나가 REM의 불안정한 부분에서 나타나는 시간의 비율(%)이 기록된다. 긴장성 REM 및 위상성 REM 둘 모두는 REM의 불안정한 부분에서 발생한다.
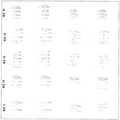
도 30a 및 30b는 테이블 S7이다. 이 테이블에는 REM이 단계 I 및 W와는 구별되는 독특한 시간적 단편화 패턴을 갖는 것으로 나타나 있다. 테이블 S2 및 S3에서와 같이 30초 동안의 분해능에서 KS 분석이 수행된다. 귀무 가설(null hypothesis)은, 수동 채점에 의해 정의된 바와 같이, 26개의 기록 중 23개의 기록에서 단계 I(좌측 세로줄)에 대한 REM에 의해 거절되었으며, 26개의 기록 중 24개의 기록에서 단계 W(우측 세로줄)에 대한 REM에 의해 거절되었다.
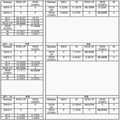
도 31a 내지 도 31e는 테이블 S9로서, 렘 성분에 대한 일치 매트릭스(agreement matrix)이다. 각 대상에 대해 두 개의 매트릭스가 나타나 있다. 좌측 및 우측 매트릭스는 세로줄 방향과 가로줄 방향으로 각각 판독되어야 한다. 좌측 매트릭스 내의 각 박스는, 자동 알고리즘에 의해 정의된 바와 같이, REM의 단편화된 성분(REM UP)과 안정된 성분(REM DOWN) 중 하나로서 상기와 같이 나열된 단계의 에포크가 인간 채점자에 의해 정의된 바와 같이 좌측상의 단계로서 라벨링되는 시간의 비율(%)에 해당된다. M은 움직임으로서 라벨링된 에포크에 해당된다. 우측 매트릭스 내의 박스는, 수동으로 확인된 REM의 자동 분리에 의해 정의된 바와 같이, 좌측상의 에포크가 알고리즘에 의해 정의된 바와 같이 상술한 에포크로서 나열되는 시간의 비율(%)에 해당된다. REM UP/DOWN의 구분은, 인간 채점자에 의해 확인되든지 또는 알고리즘에 의해 확인되든지 간에, REM 데이터 상의 K-평균 알고리즘에 의해 항상 수행된다. 또한 평균 일치 비율(%)은 VA 대상, MPI 대상, 및 이들 둘의 데이터 세트에 대해 각각 산정되었다. 이들 매트릭스는, 선호 주파수 맵(frequency map)의 검사에서 알고리즘(MPI 7b 및 11a)과 인간 채점자(MPI 8a) 중 하나의 일부에 대해 신뢰할 수 없는 실행이 나타나는 3개의 경우에 대해서는 제외되었다. 수동으로 라벨링된 대부분의 REM 성분은 자동으로 라벨링된 동일한 REM 성분(우측 매트릭스)의 범주에 포함되었다. 알고리즘에 의해 정의된 바와 같은 REM의 불안정한 부분은, REM으로서 채점되지 않은 경우(좌측 매트릭스)에는 대개의 경우 인간에 의해 단계 II와 혼동될 가능성이 있었다.
도 32는 테이블 S10이다. 이 테이블에는 REM 아웃라이어(REM outlier)가 도시되어 있다. 4명의 VA 대상의 경우, 1초 동안 수동으로 채점된 단계 II에서는 알고리즘에 의해 REM으로 채점되었던 대부분의 수면 방추(spindle) 또는 K-복합체가 불안정한 부분에서 발생하는 것으로 나타났다. 4명의 대상(좌측 세로줄: 대상 10은 예외) 중 3명의 대상에서 방추파 또는 K-복합체가 없는 기준선 단계 II에 대해서도 동일한 결과가 사실이었다.
도 33은 테이블 S12로서, 최근접 이웃 분석(nearest neighbor analysis))이다. 아티팩트가 전혀 없는 에포크는 아티팩트에 대한 근접성이 REM의 단편화된 부분의 원인이 되는지에 대해 결정하기 위해 확인되었다. XY 비율(%)은 X로 이루어진 Y(TOP 또는 DOWN)의 이웃의 비율(%)을 의미한다(0 = 이웃에 아티팩트가 없음, 1 = 하나의 이웃이 아티팩트임, 및 2 = 양쪽 이웃이 아티팩트임). 이전 테이블에서와 같이, 각각의 가로줄은 각각의 채점자를 나타낸다. 대상 9, 18 및 20에 대한 결과 내에서 관측된 유사성 및 차이점은 이전 범례(legend)에 설명되어 있다. 대상 9 및 19는, 임의의 이웃 아티팩트를 갖지 않는 자동으로 확인된 REM의 단편화된 부분에서 각각18/34 및 45/85의 에포크를 가지며, 이는 두 경우 모두에서 비율(%)이 동일하게 된다.
도 34는 4쌍의 쌍둥이에 대해 수행된 연구 결과를 나타낸다. 1 내지 4번의 세로줄 각각은 4쌍의 쌍둥이(제 1쌍은 이란성이고, 제 2 내지 제 4 쌍은 일란성임)에 해당된다. 오직 REM만이 도시된다(시간에 따른 시간적 단편화). 쌍둥이는 유사한 시간적 단편화 패턴을 나타낸다.BRIEF DESCRIPTION OF THE DRAWINGS In order to clearly understand and to facilitate the present invention, the present invention will be described with reference to the following drawings, wherein like reference numerals refer to the same or similar components, which are incorporated herein by reference and constitute a part of the specification. do. In the drawings below:
1 is a flowchart of an example system for determining sleep state information of a subject.
2 is a block diagram of an example system for determining a sleep state of a subject.
3 is a block diagram of another exemplary system for determining a sleep state of a subject.
4 is a block diagram of an example system for determining a sleep state of a subject using one of automatic data and manual data.
5 is a block diagram of an example system for determining a pathological state of a subject from a sleep state.
FIG. 6 shows results for one channel of rat electroencephalogram converted to spectrogram by multitaper analysis using a 3 second spectral window and a 1 second sliding window. to be. Light gradient represents the spectral power at each frequency with high power for light reflection and low power for rock reflection. The dots correspond to one second.
7 is a result of a preferred frequency analysis. Each point corresponds to a frequency with the largest variation with respect to the baseline.
FIG. 8 is the result of coloring the preferred frequency analysis plot of b of FIG. 1 to reflect behavioral steps scored in a blind manner independent of EEG. The dots correspond to one second.
9 is the result of temporal fragmentation corresponding to the sparseness of spectral fluctuations over time demonstrating the sensitivity of a preferred frequency plot to peak fluctuation at normalized power.
10 is the result of spectral fragmentation corresponding to the leanness of spectral fluctuations within a spectral range at a given time demonstrating the sensitivity of the preferred frequency plot to peak variations at normalized power.
FIG. 11 shows the results of using independent component analysis on a single channel as part of SPEARS to demonstrate whether three clusters, deep anesthesia (blue), arousal (yellow and red) and convulsions (magenta), have occurred. .
FIG. 12 shows the raw EEG data for 30 seconds for deep anesthesia.
FIG. 13 shows the results of raw EEG data for 30 seconds for lighter anesthesia with convulsions.
FIG. 14 shows the results of displaying raw EEG data for 30 seconds for movement.
FIG. 15 shows the results of 30 seconds of raw EEG data for movement artifacts and quiet awakening.
16 is a bimodal temporal fragmentation of REM sleep. Temporal fragmentation was estimated with 30 seconds of resolution for two different sleep records of two different subjects (a and b in FIG. 16, c and d in FIG. 16). The label is displayed from either manual scoring (a and c in FIG. 16) or automatic scoring (b and d in FIG. 16). REM sleep, shown in red, is divided into two different groups with high or low temporal fragmentation. This is evident in both of these records independent of whether manual or automated algorithms have performed scoring.
17 shows the raw and normalized spectrograms. Raw spectrogram data was calculated for 30 seconds of spectral resolution (FIG. 17 a) or 3 seconds of spectral resolution (b of FIG. 17) for increments for 1 second. Each spectrogram is then normalized several times over time and frequency, normalized spectrogram at 30 seconds of spectral resolution (c in FIG. 17) for increments for 1 second, and spectrum for 3 seconds. Another normalized spectrogram at resolution (d in FIG. 17) was obtained. Only movement artifacts have a high frequency (greater than 20 Hz) content in the raw data (a and b in FIG. 17), while normalized spectrograms have much higher frequency activity (c and d in FIG. 17).
18 shows preferred frequency analysis for spectrograms with multiple normalizations. The preferred frequency space is estimated for the normalized spectrogram in FIG. 17 and labeled using manual scoring (a in FIG. 18) and automatic scoring (b in FIG. 18). SWS was manifested by low frequency (less than 10 Hz) activity. REM has beta and gamma ((20-40 Hz)) activity. IS exhibited gamma activity (30-50 Hz) and high gamma activity (greater than 50 Hz) as well as spindle activity (12-15 Hz). W showed beta, gamma and high gamma activity (> 80 Hz). C and d in FIG. 18 are the same as a and b in FIG. 18 for different objects.
19 details the preferred frequency analysis for spectrograms with multiple normalizations with high temporal resolution. A and b of FIG. 19 are the same as b and d of FIG. The analysis of a and b of FIG. 18 was applied to a and b of FIG. 19, respectively, to obtain c and d of FIG. 19. The trend observed in FIG. 18 is reinforced at this temporal resolution. In addition, high frequency information can be found in the case of SWS.
20 shows an algorithm flow diagram. The algorithm sequentially identifies SWS, IS, REM, and W using the variables disclosed in Materials and Methods. The data is then smoothed over time. REM / W separation is measured again by estimating the p-value for the REM distribution. If the latter p value exceeds a fixed value, the REM is rejected and replaced by W. If the REM is accepted, it is separated into W, REM and W. As a precaution, a REM-like event that occurs very early in the night may be labeled as W. The increase in performance was minimal when REM and W tended to form different clusters. This is one algorithm available:
The filter used in FIG. 20 is as follows.
sws_filter = mean (2 NS (3 Hz or less));
w_filter = mean (2NS (9-12 Hz));
nrem_filter = average (2NS (60-100 Hz)) + average (2NS (3-4 Hz))-[average (2NS (12-14 Hz)) + average (2NS (25-60 Hz)) + average (2NS (15-25 Hz));
AA = mean (2NS (12-14 Hz));
BB = mean (2NS (15-25 Hz));
CC = mean (WS (3 Hz or less));
DD = mean (2NS (9-12 HZ);
WS and 2NS correspond to the raw and dual normalized spectrograms, respectively. Temporal fragmentation corresponds to the z score (z-score) of the mean of the absolute values of the temporal gradient of the spectrum normalized over time and frequency, and is calculated over the
21 shows some discrepancies between automatic scoring and manual scoring. The overall agreement rate was 76.97%, but half of the epochs (a and c in FIG. 21, cyan) scored as IS by humans were found to be REM by the algorithm (b and d in FIG. 21, red). . These epochs exhibited features closer to those of the REM than the features of the IS in both PFS (a and b in FIG. 21) and temporal fragmentation spaces (c and d in FIG. 21), in particular the second set of epochs sleeping. Appeared about 2.5 hours after the state. A review of these epochs by human scorers as well as the second scorers found no sign of REM. Passive scores remained unchanged.
22 shows preferred frequency space and temporal fragmentation. This indication has an array similar to that shown in FIG. In Fig. 18, the overall agreement between automatic and manual scoring is 83.8%.
FIG. 23 shows the spectra in the normalization space with iterative normalization with spectrograms normalized several times over time and frequency. REM sleep is scored manually. Stable and unstable components were separated using the K-means clustering algorithm. The mean of the spectra of the stable component (red) and unstable component (green) is shown in a space representing multiple normalizations over time and frequency for multiple recordings (a and b in FIG. 23, c and d in FIG. 23: MPI). Note that the increased relative power at low frequencies to the unstable part of REM sleep is the opposite of the stable part. The depression at 60 Hz is the most likely that the VA data will appear due to the use of a 60 Hz notch filter.
24 shows data collected by the subject. Each column corresponds to a different object. Temporal fragmentation is plotted against time. Color represents sleep and wakeful states (red = REM, white = SWS, cyan = medium sleep, and yellow = awake). The rows are as follows: The first row represents the removal of artifacts and REM landmarks from the raw data; The second row corresponds to the analysis on the entire column, and the third row corresponds to the analysis on the eye movement artifacts only for the REM; The fourth horizontal line corresponds to the analysis on landmarks and artifacts (except eye) for REM.
25 shows a plot for the data of FIG. 24, but only REM data is shown graphically. Temporal fragmentation in dual mode can be seen in the first row even though the artifacts have been removed.
FIG. 26 shows the REM data of FIG. 25 with only data points displayed.
FIG. 27 shows the first two horizontal lines of FIG. 25.
28 is table S5. This table shows statistics for the temporally fragmented portion of REM sleep. The percentage of REM, number of episodes, their average duration and separation are shown in each record for both data sets.
29 is table S6. This table shows that fragmented and unfragmented portions of REM sleep do not correspond to topological or tonic REM. In VA data only, REMs are subclassed into epochs without eye movement (tension REM) and epochs with 0 to 25%, 25 to 50%, 50 to 75%, and 75 to 100% of eye movements (phase REM). It became. For each subject, the percentage of time that one of the substates listed above appears in the unstable portion of the REM is recorded. Both tonic REM and topological REM occur in the unstable portion of the REM.
30A and 30B are tables S7. This table shows that the REM has a unique temporal fragmentation pattern that is distinct from steps I and W. KS analysis is performed at a resolution of 30 seconds as in tables S2 and S3. The null hypothesis was rejected by the REM for stage I (left column) in 23 of the 26 records, as defined by manual scoring, and the phase W (in 24 of 26 records). Rejected by the REM for the right column).
31A-31E are table S9, which is an agreement matrix for RAM components. Two matrices are shown for each object. The left and right matrices should be read in the vertical and horizontal lines respectively. Each box in the left matrix is one of the fragmented components (REM UP) and the stable components (REM DOWN) of the REM, as defined by the automated algorithm, as defined by the human scorer. Likewise, this corresponds to the percentage of time that is labeled as a step on the left. M corresponds to an epoch labeled as a movement. The box in the right matrix corresponds to the percentage of time that the epoch on the left is listed as the epoch described above as defined by the algorithm, as defined by the automatic separation of the manually identified REM. The distinction of REM UP / DOWN is always performed by the K-means algorithm on the REM data, whether confirmed by human scorer or by algorithm. The mean percent match was also calculated for VA subjects, MPI subjects, and both data sets, respectively. These matrices were excluded for the three cases where unreliable execution of some of the algorithms (
32 is table S10. This table shows the REM outliers. For four VA subjects, manually graded for one second, Phase II showed that most of the sleep spindles or K-composites that were scored as REM by the algorithm occurred in unstable areas. The same result was true for baseline stage II without spindles or K-complexes in 3 of 4 subjects (left column: subject 10 is the exception).
33 is table S12, which is the nearest neighbor analysis. Epochs with no artifacts were identified to determine if proximity to the artifacts caused the fragmented portion of the REM. The XY percentage (%) means the percentage of neighbors of Y (TOP or DOWN) consisting of X (0 = no artifacts in the neighborhood, 1 = one neighbor is an artifact, and 2 = both neighbors are artifacts) being). As in the previous table, each row represents each marker. Similarities and differences observed within the results for
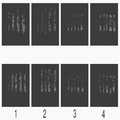
34 shows the results of the studies performed on four pairs of twins. Each of the first to fourth vertical lines corresponds to four pairs of twins (the first pair is fraternal and the second to fourth pairs are identical). Only REM is shown (temporal fragmentation over time). Twins exhibit similar temporal fragmentation patterns.
본 발명의 도면 및 설명은 본 발명의 명확한 이해를 위해 관련 있는 성분을 예시하기 위해, 공지된 그 밖의 성분을 명료성을 위해 제거하면서 단순화하였음을 이해해야 한다. 상세한 설명은 첨부된 도면과 관련하여 아래에 제공될 것이다.It is to be understood that the figures and description of the present invention have been simplified while removing other known elements for clarity in order to illustrate relevant components for a clear understanding of the present invention. A detailed description will be provided below with reference to the accompanying drawings.
본 명세서에 있어서의 "대상"이란 용어는 동물 및 인간 모두를 나타낸다.As used herein, the term "subject" refers to both animals and humans.
"안정적인 렘(stable REM)"이란 용어는 시각적으로 렘의 양봉 분포(bimodal distribution) 내의 패턴의 하단 부분을 나타낸다. "불안정한 렘(unstable REM)"이란 용어는 시각적으로 렘의 양봉 분포(bimodal distribution) 내의 패턴의 상단 부분을 나타낸다.The term "stable REM" visually refers to the lower portion of the pattern within the bimodal distribution of the REM. The term "unstable REM" visually refers to the upper portion of the pattern within the bimodal distribution of the REM.
본 명세서에 기술된 방법은 PCT/US2006/018120에 자세히 기술되어 있으며, 이의 개시 내용은 본원에서 전체적으로 참고로 인용된다.The method described herein is described in detail in PCT / US2006 / 018120, the disclosure of which is incorporated herein by reference in its entirety.
본 발명은 동물 및 인간 모두에 있어서의 EEG 데이터를 획득하고 분류하는 시스템 및 방법을 제공한다. 획득된 EEG 신호는 저파워 주파수 신호이고 1/f 분포(distribution)를 따르며, 그에 따라 신호에서의 파워는 주파수와 역의 관계, 예컨대 반비례한다.The present invention provides systems and methods for obtaining and classifying EEG data in both animals and humans. The obtained EEG signal is a low power frequency signal and follows the 1 / f distribution, whereby the power in the signal is inversely related to frequency, such as inversely.
EEG 신호는 에포크(epochs)라 불리는 일련의 인크리먼트(series increments)에 의해 시간에 따라(in time) 검사되는 것이 일반적이었다. 예컨대, EEG 신호가 수면을 분석하기 위해 사용되는 경우, 수면은 분석용으로 사용하기 위한 하나 이상의 에포크로 분할(segment)될 수 있다. 에포크는 스캐닝 윈도우(scanning window)를 사용하여 서로 다른 섹션으로 분할될 수 있으며, 스캐닝 윈도우는 시계열 인크리먼트(time series increment)의 상이한 섹션을 정의한다. 스캐닝 윈도우는 슬라이딩 윈도우(sliding window)를 통해 이동이 가능하며, 슬라이딩 윈도우는 중첩하는(overlapping) 시계열 시퀀스를 가진다. 에포크는 예컨대 전체 시계열을 선택적으로 포함할 수 있다.EEG signals were typically examined in time by a series of increments called epochs. For example, if an EEG signal is used to analyze sleep, the sleep may be segmented into one or more epochs for use for analysis. The epochs can be divided into different sections using a scanning window, which defines different sections of time series increments. The scanning window is movable through a sliding window, which sliding window has an overlapping time series sequence. Epochs can optionally include the entire time series, for example.
본 발명에 따르면, 대상의 각각 다른 형태의 수면 상태가 모니터링될 수 있다. 수면 상태는 행동 특징, 신체적 특징 또는 신호 특징을 나타내는 임의의 구분 가능한 수면 또는 각성으로 설명된다. 본 명세서에서 언급하는 수면 상태는, 서파 수면(slow wave sleep) 또는 SWS, 급속 안구 운동(rapid eye movement) 수면 또는 REM, 인터(inter) 또는 IS 상태라고도 하는 중간 수면(intermediate sleep) 및 각성 상태(awake state)를 포함한다. 각성 상태는 수면 상태의 실질적인 일부가 될 수 있으며, 각성 상태는 주의 또는 경계의 레벨로 되는 비질런스(vigilance)에 의해 특징지어 질 수 있다. 중간 수면은, 중간-1 수면과 중간-2 수면으로 특징지어 질 수 있다. EEG를 획득하는 동안 아티팩트(artifact)가 생길 수 있다. 아티팩트는 EEG를 잘못 나타내는(misrepresent) 데이터이다. 예를 들어, EEG에 기록되는 사용자 내의 움직임이 아티팩트가 될 수 있다. 아티팩트의 예로는 근육 경련(muscle twitches) 등이 있다.According to the present invention, different types of sleep states of a subject can be monitored. Sleep states are described as any distinguishable sleep or wakefulness that represents behavioral, physical, or signal features. Sleep states referred to herein include slow wave sleep or SWS, rapid eye movement sleep or intermediate sleep and awake states (also called REM, inter or IS states). awake state). The arousal state can be a substantial part of the sleep state, which can be characterized by vigilance at the level of attention or alertness. Medium sleep can be characterized as mid-1 sleep and mid-2 sleep. Artifacts may occur while acquiring an EEG. An artifact is data that misrepresents an EEG. For example, the movement in the user recorded in the EEG may be an artifact. Examples of artifacts include muscle twitches.
도 1을 참고하면, 도 1은 대상의 수면 상태 정보를 판정하기 위한 예시적인 시스템(100)의 흐름도이다. EEG 데이터(102)가 대상으로부터 수신된다.
Referring to FIG. 1, FIG. 1 is a flowchart of an
예시적인 소스 데이터Example source data
본 명세서에 개시된 모든 실시태양에 있어서, 뇌파(electroencephalography: EEG) 데이터, 뇌파(electrocardiography: EEG) 데이터, 안전도(electrooculography: EOG) 데이터, 근전도(electromyography: EMG) 데이터, 국부 지역 전위차(local field potential: LFP) 데이터, 스파이크 트레인(spike train) 데이터, 음파와 압력파를 포함하는 파동 데이터(wave data), 예들 들어 1/f 분포와 같은 데이터의 주파수 스펙트럼에 따라 다양한 주파수에 대한 파워의 다이내믹 레인지(dynamic range)에 차(differences)가 존재하는 것을 나타내는 임의의 데이터를 포함하는 다양한 소스 데이터(source data)가 분석될 수 있다. 소스 데이터는, 소스 데이터 내의 저파워 주파수에서 저장된 부호화 데이터(encoded data)를 포함할 수 있다.In all embodiments disclosed herein, electroencephalography (EGE) data, electrocardiography (EGE) data, electrooculography (EOG) data, electromyography (EGM) data, local field potential LFP) Dynamic range of power over various frequencies depending on the frequency spectrum of the data, such as spike train data, wave data including sound and pressure waves, for example 1 / f distribution Various source data may be analyzed, including any data indicating that differences exist in the dynamic range. The source data may include encoded data stored at a low power frequency in the source data.
본 발명의 일 실시태양에서, 일단 대상으로부터 수신된 데이터(102)는 분석을 위해 소프트웨어 프로그램(104)으로 전송된다.
In one embodiment of the invention, the
적어도 하나의At least one저파워Low power 주파수 범위를 갖는 소스 데이터로부터의 From source data with frequency range저파워Low power 주파수 정보를 판정하기 위한 예시적인 시스템 Example System for Determining Frequency Information
저파워 주파수 정보를 판정하기 위해, 적어도 하나의 저파워 주파수 범위를 갖는 소스 데이터(102)가 획득되고 소프트웨어(104)에 입력된다.
In order to determine the low power frequency information,
소스 데이터를 조정(Adjust your source data (adjustadjust)하기 위한 예시적인 방법Example method for
적어도 하나의 저파워 주파수 범위를 갖는 소스 데이터(102)가 수신된다. 예를 들어, 대상의 뇌파 소스 데이터가 수신될 수 있다. 단일 채널 또는 다중 채널을 통해, 소스 데이터가 수신될 수 있다.
본 발명의 바람직한 실시태양에서, 뇌파의 단일 채널은 수면과 각성 단계를 분리하는데 충분하다.In a preferred embodiment of the invention, a single channel of brain waves is sufficient to separate the sleep and wake up stages.
소스 데이터의 주파수 스펙트럼의 적어도 하나의 저파워 주파수 범위 내의 파워의 다이내믹 레인지가, 다른 더 높은 파워의 주파수 범위에 비해, 증가되도록, 소스 데이터를 조정한다. 정규화(normalization) 및 주파수 가중화(frequency weighting)를 포함하는, 본 명세서에 개시된 많은 조정 기술이 사용될 수 있다.Adjust the source data such that the dynamic range of power within at least one low power frequency range of the frequency spectrum of the source data is increased compared to other higher power frequency ranges. Many adjustment techniques disclosed herein can be used, including normalization and frequency weighting.
일 실시태양에서, 뇌파 소스 데이터는, 더 높은 파워와 더 낮은 주파수 범위의 데이터에 비해, 저파워 고주파 범위의 데이터를 증가시키거나, 또는 더욱 일반적으로는 서로 다른 신호 부분의 파워를 정규화하기 위해 정규화된다.In one embodiment, the EEG source data is normalized to increase the low power high frequency data or, more generally, to normalize the power of different signal portions compared to the higher power and lower frequency range data. do.
소스 데이터를 조정한 후, 다양한 다른 처리 과정이 실행될 수 있다. 예를 들어, 조정된 소스 데이터의 가시화(visualization)가 이루어질 수 있다. 또한, 조정된 소스 데이터로부터 저파워 주파수 정보가 추출될 수 있다. 예를 들어, 조정된 뇌파 소스 데이터로부터 저파워 주파수 정보가 추출될 수 있다. 또한 이러한 조정된 소스 데이터로부터 고파워 주파수 정보가 추출될 수 있다.After adjusting the source data, various other processing may be performed. For example, visualization of the adjusted source data can be made. In addition, low power frequency information may be extracted from the adjusted source data. For example, low power frequency information may be extracted from the adjusted EEG source data. High power frequency information can also be extracted from this adjusted source data.
본 실시예 또는 다른 실시예에서 개시하는 방법은, 하나 이상의 컴퓨터로 판독 가능한 매체 내의 컴퓨터로 실행 가능한 명령어를 통해 실행되는 컴퓨터 실행 방법(computer-implemented method)이 될 수 있다. 나타낸 모든 작용은 신호 처리 시스템 또는 그 밖의 신호 데이터 분석기 시스템 내에 통합된 소프트웨어에 의해 실행될 수 있다.The method disclosed in this embodiment or another embodiment may be a computer-implemented method executed through computer-executable instructions in one or more computer-readable media. All actions shown may be performed by software integrated into a signal processing system or other signal data analyzer system.
다시 도 1을 참고하면, 대상(106)의 수면 상태 정보를 판정하기 위해 뇌파 상기 대상의 뇌파 데이터(102)가 획득되고 소프트웨어(104)로 입력된다. 소프트웨어는 본 명세서에 개시된 바와 같은 기술들의 임의의 조합을 이용하여 대상의 수면 상태 정보를 판정할 수 있다.Referring again to FIG. 1,
대상의 수면 상태를 판정하기 위한 예시적인 시스템(200)의 블록도인 도 2를 참고하면, 데이터는 스펙트로그램(202)를 산출하기 위해 정규화될 수 있다. 또 다른 실시태양은 다이내믹 레인지를 더 증가시키기 위해 다중 정규화(multiple normalization)를 이용한다. 정규화는 시간에 따라 주파수를 정규화함으로써 또는 주파수에 따라 시간을 정규화함으로써 실행될 수 있다.
Referring to FIG. 2, which is a block diagram of an
주파수 스펙트럼에서의 시간의 경과에 따른 파워의 차를 설명하기 위해 소스 데이터를 조정하는 예시적인 방법Example Method of Adjusting Source Data to Describe Power Difference Over Time in Frequency Spectrum
예를 들어, 적어도 하나의 저파워 주파수 범위를 갖는 뇌파 데이터가 수신될 수 있다. 수신되는 뇌파 데이터 내의 아티팩트를 소스 데이터로부터 제거할 수 있다. 예컨대, 아티팩트 데이터는 소스 데이터로부터 수동으로(manually) 제거되거나, 필터링(예를 들어, DC 필터링)이나 데이터 평탄화(data smoothing) 기술을 사용하여 소스 데이터로부터 자동으로 여과될 수 있다. 소스 데이터는 또한 성분 분석(component analysis: 204)에 의해 미리 처리될 수도 있다.For example, brain wave data having at least one low power frequency range may be received. Artifacts in the received EEG data can be removed from the source data. For example, artifact data may be manually removed from the source data or automatically filtered from the source data using filtering (eg, DC filtering) or data smoothing techniques. Source data may also be preprocessed by component analysis (204).
소스 데이터는 하나 이상의 에포크(epoch)로 분할된다: 각각의 에포크는 시계열에서 데이터의 일부이다. 예를 들어, 소스 데이터는 다양한 분리 기술을 통해 다수 개의 시간 세그먼트로 분할될 수 있다. 소스 데이터를 시계열 인크리먼트로 분리하기 위해 스캐닝 윈도우와 슬라이딩 윈도우가 사용될 수 있다.Source data is divided into one or more epochs: each epoch is part of data in a time series. For example, source data can be partitioned into multiple time segments through various separation techniques. Scanning windows and sliding windows can be used to separate the source data into time series increments.
시간에 따른 하나 이상의 에포크에서의 파워의 차에 대해 하나 이상의 에포크가 정규화된다. 예를 들어, 정보를 추출하기 위한 적절한 주파수 윈도우를 결정하기 위해, 하나 이상의 주파수에서의 각 에포크의 파워가 시간의 경과에 따라 정규화될 수 있다. 이러한 정규화는, 하나 이상의 주파수(예를 들어, 델타, 감마 등)에서, 낮은 파워, 통계적으로 중요한 파워의 변동을 나타낼 수 있다. 분석을 위해 임의의 주파수 범위를 나타낼 수 있으며, 이러한 임의의 주파수 범위를 사용할 수 있다. 적절한 주파수 윈도우가 설정된 후, 하나 이상의 에포크의 각각에 대해 정보가 산출될 수 있다. 이러한 정보는, 저주파 파워(예를 들어, 델타 파워), 고주파 파워(예를 들어, 감마 파워), 표준 편차, 최대 진폭(예를 들어, 피크의 절대값의 최대값) 등을 포함할 수 있다. 감마 파워/델타 파워(Gamma power/Delta power), 델타의 시간 도함수(time derivative of Delta), 감마 파워/델타 파워의 시간 도함수(time derivative of Gamma power/Delta power) 등의 정보를 생성하는 하나 이상의 에포크의 각각에 대해 산출된 정보에 대해 추가의 산출이 이루어질 수 있다. 시간 도함수는 선행하는 에포크 및 후속하는 에포크에 대해 계산될 수 있다. 정보를 산출한 후, 그 정보는 하나 이상의 에포크에 대해 정규화될 수 있다. z-스코어링(z-채점, z-scoring) 및 이와 유사한 기술을 포함해서, 다양한 데이터 정규화(202) 기술이 실행될 수 있다.One or more epochs are normalized for the difference in power in one or more epochs over time. For example, to determine the appropriate frequency window for extracting information, the power of each epoch at one or more frequencies may be normalized over time. Such normalization may exhibit low power, statistically significant power fluctuations at one or more frequencies (eg, delta, gamma, etc.). Any frequency range can be represented for analysis, and any such frequency range can be used. After the appropriate frequency window is set, information may be calculated for each of the one or more epochs. Such information may include low frequency power (eg, delta power), high frequency power (eg, gamma power), standard deviation, maximum amplitude (eg, the maximum value of the absolute value of the peak), and the like. . One or more generating information such as Gamma power / Delta power, time derivative of Delta, time derivative of Gamma power / Delta power, etc. Further calculations may be made for the information calculated for each of the epochs. The time derivative can be calculated for the preceding epoch and the subsequent epoch. After calculating the information, the information can be normalized for one or more epochs.
주파수 스펙트럼에 대해 시간의 경과에 따른 파워의 차에 대한 설명을 위해 소스 데이터를 조정한 결과가, 데이터의 하나 이상의 에포크로서 제시될 수 있다. 예를 들어, 주파수 가중화 에포크(frequency weighted epochs)가 조정된 소스 데이터(adjusted source data)로서 제시될 수 있다.
The result of adjusting the source data to account for the difference in power over time for the frequency spectrum can be presented as one or more epochs of the data. For example, frequency weighted epochs can be presented as adjusted source data.
대상의 수면 상태 정보를 판정하기 위한 예시적인 시스템Example System for Determining Sleep State Information of a Subject
대상의 뇌파 데이터가 획득되고 분할기(segmenter)에 입력되어 획득한 데이터를 하나 이상의 에포크로 분할한다. 실제로, 에포크는 유사한(예를 들어, 동일한) 간격(length)을 갖는다. 에포크의 간격은 변경 가능한 파라미터(configurable parameter)를 사용하여 조정될 수 있다. 하나 이상의 에포크에서의 주파수 데이터를 시간의 경과에 따라 정규화하기 위해, 하나 이상의 에포크가 차례로 정규화기(normalizer, 202)에 입력되고, 그에 따라 뇌파 데이터의 하나 이상의 에포크를 주파수 가중화한다. 하나 이상의 주파수 가중화 에포크는, 데이터를 수면 상태로 분류하기 위해 분류기(classifier)에 입력되고, 그에 따라 대상(208)의 수면 상태 정보를 생성한다. 대상의 수면 상태 정보를 판정하기 위한 방법이 아래에서 상세하게 설명된다.
EEG data of the target is obtained and input to a segmenter to divide the obtained data into one or more epochs. Indeed, epochs have similar (eg, identical) lengths. The spacing of epochs can be adjusted using configurable parameters. In order to normalize the frequency data in one or more epochs over time, one or more epochs are in turn input to a
대상의 수면 상태를 판정하기 위한 또 다른 예시적인 방법Another exemplary method for determining a subject's sleep state
대상의 뇌파(EEG) 데이터가 수신된다. 예를 들어, 주파수 스펙트럼에서의 제2 주파수 범위에 비해, 주파수 스펙트럼에서의 적어도 하나의 저파워의 제1 주파수 범위에서의 파워에 대한 더 낮은 다이내믹 레인지를 나타내는 뇌파 데이터가 수신될 수 있다.EEG data of the subject is received. For example, brain wave data may be received that indicates a lower dynamic range for power in at least one low power first frequency range in the frequency spectrum compared to the second frequency range in the frequency spectrum.
대상의 뇌파 데이터는 하나 이상의 에포크로 분할된다. 예를 들어, 뇌파 데이터는 다양한 분할 기술을 통해 하나 이상의 에포크로 분할될 수 있다. EEG 데이터를 하나 이상의 에포크로 분리하기 위해, 스캐닝 윈도우와 슬라이딩 윈도우가 사용될 수 있다. 분할을 행하는 동안, 분할을 행하기 전 또는 분할을 행한 후에, 직류 필터링(direct current filtering)을 통해, 소스 데이터가 또한 필터링될 수 있다. 소스 데이터는 또한 성분 분석(204) (예를 들어, 주요 성분 분석 또는 독립 성분 분석)으로 미리 처리될 수 있다.The brain wave data of the subject is divided into one or more epochs. For example, EEG data can be segmented into one or more epochs through various segmentation techniques. To separate the EEG data into one or more epochs, scanning windows and sliding windows can be used. During the division, before or after the division, the source data can also be filtered through direct current filtering. Source data may also be pre-processed with component analysis 204 (eg, principal component analysis or independent component analysis).
전체 야간의 EEG 데이터에서, 더 높은 주파수(예를 들어, 감마)는 전체 야간의 EEG 데이터에서 낮은 주파수(예를 들어, 델타, 세타 등)보다 더 낮은 파워를 나타낸다. 하나 이상의 에포크의 주파수 파워는 시간의 경과에 따라 가중화된다. 예를 들어, 하나 이상의 주파수에서의 각 에포크의 파워는, 정보를 추출하기 위한 적절한 주파수 윈도우를 결정하기 위해 시간의 경과에 따라 정규화될 수 있다. 이러한 정규화는, 낮은 파워, 하나 이상의 주파수(예를 들어, 델타, 감마 등)에서 파워의 통계적으로 중요한 변동을 나타낼 수 있다. 또한, 각각의 에포크는, 정보를 추출하기 위한 적절한 주파수 윈도우를 결정하기 위해, 시간의 경과에 따른 가장 높은 상대 파워(relative power)를 가진 주파수로 나타낼 수 있다. 그렇지 않으면, 성분 분석(204) (예를 들어, 주요 성분 분석, principle component analysis: PCA) 또는 독립 성분 분석, independent component analysis: ICA)은, 정보를 추출하기 위한 적절한 주파수 윈도우를 추가로 결정하기 위해, 정규화(202) 이후 사용될 수 있다. 분석을 위해 임의의 주파수 범위를 나타내고 사용할 수 있다.In all night EEG data, higher frequencies (eg gamma) exhibit lower power than lower frequencies (eg delta, theta, etc.) in all night EEG data. The frequency power of one or more epochs is weighted over time. For example, the power of each epoch at one or more frequencies may be normalized over time to determine an appropriate frequency window for extracting information. Such normalization may indicate a low power, statistically significant variation in power at one or more frequencies (eg, delta, gamma, etc.). In addition, each epoch can be represented by a frequency with the highest relative power over time to determine the appropriate frequency window for extracting the information. Otherwise, component analysis 204 (eg, principle component analysis (PCA) or independent component analysis (ICA)) may be used to further determine an appropriate frequency window for extracting information. May be used after
적절한 주파수 윈도우가 설정된 후(예를 들어, 주파수를 가중화한 후), 하나 이상의 에포크의 각각에 대해 정보가 산출될 수 있다. 이러한 정보는, 저주파 파워(예를 들어, 델타 파워), 고주파 파워(예를 들어, 감마 파워), 표준 편차, 최대 진폭(예를 들어, 피크의 절대값의 최대값) 등을 포함할 수 있다. 감마 파워/델타 파워(Gamma power/Delta power), 델타의 시간 도함수(time derivative of Delta), 감마 파워/델타 파워의 시간 도함수(time derivative of Gamma power/Delta power) 등의 정보를 생성하는 하나 이상의 에포크의 각각에 대해 산출된 정보에 대해 추가의 산출이 이루어질 수 있다. 시간 도함수는 선행하는 에포크 및 후속하는 에포크에 대해 시간 도함수가 계산될 수 있다. 정보를 산출한 후, 그 정보는 하나 이상의 에포크에 대해 정규화될 수 있다. z-스코어링(z-scoring) 및 이와 유사한 기술을 포함해서, 다양한 데이터 정규화 기술이 실행될 수 있다. 더 높은 주파주의 데이터가 더 선명하게 보인다.After the appropriate frequency window is set (eg, after weighting the frequencies), information may be calculated for each of the one or more epochs. Such information may include low frequency power (eg, delta power), high frequency power (eg, gamma power), standard deviation, maximum amplitude (eg, the maximum value of the absolute value of the peak), and the like. . One or more generating information such as Gamma power / Delta power, time derivative of Delta, time derivative of Gamma power / Delta power, etc. Further calculations may be made for the information calculated for each of the epochs. The time derivative can be calculated for the preceding epoch and the subsequent epoch. After calculating the information, the information can be normalized for one or more epochs. Various data normalization techniques can be implemented, including z-scoring and similar techniques. The higher frequency data looks sharper.
대상자의 수면 상태(208)는 하나 이상의 주파수 가중화 에포크를 기반으로 분류된다. 예를 들어, 하나 이상의 주파수 가중화 에포크가, k-평균 클러스터링(k-means clustering)을 포함하는 임의의 다양한 클러스터링 방법에 의해 클러스터(206)될 수 있다. 이러한 클러스터링은, 에포크로부터 산출된 정보(예를 들어, 델타 파워, 감마 파워, 표준 편차, 최대 진폭(감마/델타), 델타의 시간 도함수, 감마/델타의 시간 도함수 등)에 기초하여 이루어질 수 있다. 성분 분석(예를 들어, PCA 또는 ICA)는 클러스터링에서 파라미터 공간(예를 들어, 사용된 정보의 타입)을 판정하는데 사용될 수 있다.The subject's
클러스터링(206)에 이어서, 에포크에 수면 상태 지정(sleep state designation)이 할당될 수 있다. 수면 상태가 지정된 에포크는, 에포크에 의해 나타내어지는 기간 동안 대상의 수면 상태의 표현으로 제시될 수 있다. 분류는 또한 수동으로 판정된 수면 상태를 통합할 수 있다(예를 들어, 수동으로 판정된 "각성"대 "수면 중" 수면 상태). 또한, 아티팩트 정보(예를 들어, 움직임 데이터, 불량한 신호 데이터 등)가 분류에서 사용될 수 있다.
Following
예시적인 수면 상태 분류 기술Exemplary Sleep State Classification Techniques
에포크는 그것이 표현하는 수면 상태에 따라 분류될 수 있다. 에포크는, 고주파 정보, 저주파 정보, 또는 고주파 및 저주파 정보를 기반으로 정규화 변수(예를 들어, 에포크에 대해 산출된 정보)에 따라 분류될 수 있다. 예들 들어, 렘 수면 상태 에포크는 높은 주파수에서의 SWS보다 상대적으로 더 높은 파워와, 낮은 주파수에서의 SWS보다 상대적으로 더 낮은 파워를 가질 수 있다. 마찬가지로, SWS 수면 상태 에포크는 높은 주파수에서의 REM보다 상대적으로 더 낮은 파워와, 낮은 주파수에서의 REM보다 상대적으로 더 높은 파워를 가질 수 있다. 또한, NREM 및 NSWS 수면으로 초기에 분류된 에포크(예를 들어, 높은 주파수와 낮은 주파수에서의 상대적으로 낮은 파워를 갖는 에포크)는 중간 수면으로 분류될 수 있으며, REM 및 SWS 수면으로 분류된 에포크(예를 들어, 높은 주파수와 낮은 주파수에서의 상대적으로 높은 파워를 갖는 에포크)는 아웃라이어(outliers)로 분류될 수 있다. 또한, NREM 및 NSWS 수면으로 초기에 분류된 에포크는 중간 단계 I 수면으로 분류될 수 있으며, REM 및 SWS 수면으로 초기에 분류된 에포크는 중간 단계 II 수면으로 분류될 수 있다. 또한 수면 상태는 수면 방추(spindles), k-복합체(k-complexes) 및 그 밖의 다른 부분을 찾기 위한 분류로 더 나눌 수 있다. 하나의 수면 상태로 초기에 분류된 에포크의 임의의 그룹은, 분류 상세의 증가하는 레벨에 따라 다수 개의 하위 분류된 수면 상태로 나눌 수 있다. 예를 들어, SWS로 분류된 에포크의 그룹은 SWS의 2개의 분명한 타입으로 재분류될 수 있다.Epochs can be classified according to the sleep state they represent. Epochs may be classified according to normalization variables (eg, information calculated for epochs) based on high frequency information, low frequency information, or high frequency and low frequency information. For example, the REM sleep state epoch may have a relatively higher power than SWS at high frequencies and a relatively lower power than SWS at low frequencies. Likewise, the SWS sleep state epoch may have a relatively lower power than the REM at high frequencies and a relatively higher power than the REM at low frequencies. In addition, epochs initially classified as NREM and NSWS sleep (eg, epochs with relatively low power at high and low frequencies) may be classified as intermediate sleep, and epochs classified as REM and SWS sleep ( For example, epochs with relatively high power at high and low frequencies may be classified as outliers. In addition, epochs initially classified as NREM and NSWS sleep may be classified as intermediate stage I sleep, and epochs initially classified as REM and SWS sleep may be classified as intermediate stage II sleep. Sleep states can also be further divided into categories to find sleep spindles, k-complexes and other parts. Any group of epochs initially classified into one sleep state can be divided into a number of subclassified sleep states according to increasing levels of classification detail. For example, a group of epochs classified as SWS can be reclassified into two distinct types of SWS.
아티팩트 데이터(예를 들어, 움직임 데이터, 불량한 신호 데이터 등)는 또한 수면 상태 분류에 사용될 수도 있다. 예를 들어, 초기에 수면 상태 지정이 할당된 에포크가 이웃하는 아티팩트 데이터에 의해 새로운 수면 상태 지정이 재할당되어야 하는지 여부를 분석하는데 아티팩트가 사용될 수 있다. 예를 들어, 선행하는 움직임 아티팩트(preceding movement artifact) 또는 각성 에포크(awake epoch)를 갖는 렘의 수면 상태 지정이 할당된 에포크는 각성의 수면 상태 지정이 재할당될 수 있다. 또한, 예를 들어 후속하는 SWS 에포크를 갖는 아티팩트 에포크는 SWS의 수면 상태 지정이 재할당될 수 있는데, 그 이유는 에포크가 각성 시 더욱 일반적인 큰 움직임 아티팩트가 아닌 큰 SWS 수면 에포크를 나타낼 가능성이 높기 때문이다. 이러한 방식에서, 예를 들어 아티팩트 데이터는 데이터 평탄화 기술(data smoothing technique)에 사용될 수 있다.
Artifact data (eg, motion data, poor signal data, etc.) may also be used for sleep state classification. For example, an artifact may be used to analyze whether an epoch initially assigned a sleep state designation should be reassigned by neighboring artifact data. For example, an epoch assigned a sleep state designation of a RAM with a preceding movement artifact or awake epoch may be reassigned to the sleep state designation of the awakening. Also, for example, an artifact epoch with a subsequent SWS epoch may be reassigned to the sleep state designation of the SWS because the epoch is likely to show a large SWS sleep epoch, rather than a more common large motion artifact upon awakening. to be. In this manner, artifact data can be used, for example, in a data smoothing technique.
예시적인 평탄화 기술Exemplary Planarization Technique
수면 상태를 할당하는 동안 어떠한 다양한 데이터 평탄화 기술이 사용될 수 있다. 예를 들어, 지정된 수면 상태를 나타내기 위해 숫자(예를 들어, 0, 1)가 사용될 수 있다. 이웃하는 에포크의 수면 상태 지정 숫자는, 에포크 중 하나가 수면 상태 지정을 부정확하게 할당한 것인지 여부를 판정하기 위해 평균화될 수 있다. 예를 들어, 수면 데이터 내에서는 SWS-NSWS-SWS(및 REM-NREM-REM)로부터 갑작스럽게 도약(abrupt jump)하는 것이 드물다. 따라서, 수면 상태에서 갑작스런 도약을 나타내는 수면 상태 지정이 에포크의 그룹에 할당되어야 한다면, 할당의 정확성을 향상시키기 위해 평탄화 기술이 적용될 수 있다.Any of the various data planarization techniques can be used while assigning sleep states. For example, numbers (eg, 0, 1) may be used to indicate a specified sleep state. The sleep state designation numbers of neighboring epochs may be averaged to determine whether one of the epochs incorrectly assigned the sleep state designation. For example, within sleep data it is rare to abrupt jump from SWS-NSWS-SWS (and REM-NREM-REM). Thus, if a sleep state designation indicating a sudden jump in the sleep state should be assigned to a group of epochs, the planarization technique can be applied to improve the accuracy of the assignment.
도 3을 참고하면, 도 3은 대상의 수면 상태를 판정하기 위한 예시적인 시스템(300)의 블록도이다. 데이터는 수동 또는 자동으로 대상(302)으로부터 수신된다. 바람직인 주파수 분석인, 시간적 단편화 또는 스펙트럼 단편화(304)는 수면의 적어도 하나의 파라미터를 판정하기 위해 데이터에 대해 실행될 수 있다. 이러한 정보는 또한 수면 상태(306)을 판단하기 위해 분류될 수 있다.Referring to FIG. 3, FIG. 3 is a block diagram of an
앞서 설명한 실시태양은 정규화가 어떻게, 예를 들어 z 스코어링(z scoring) 등을 사용하여, 뇌파 신호로부터의 많은 정보의 분석을 허용하는지를 나타냈다. 앞서 수행했던 분석은 주파수에 따라 파워 정보를 정규화했다. 정규화(normalization)는 z 스코어링을 사용하는 것이 바람직하지만, 임의의 다른 종류의 데이터 정규화 방법이 사용될 수 있다. 사용되는 정규화는 z 스코어링과 같이 측정단위와 무관한 것이 바람직하다. 해당 기술 분야에서 잘 알려진 바와 같이, z 스코어링은, 분포의 포락선(envelope)의 형태를 변경하지 않고, 분포를 정규화하는데 사용될 수 있다. z 스코어(z score)는 표준 편차의 단위로 변경되어야 한다. 각각의 z 스코어로 정규화된 단위는, 신호의 평균과 관련해서 신호에서의 파워의 양을 반영한다. 각각의 스코어로부터 평균을 감산함으로써, 스코어는 평균 편차(mean deviation)의 형태로 변환된다. 이어서, 스코어는 표준 편차와 관련하여 정규화된다. z 스코어로 정규화된 모든 단위는 1(unity)로 되는 표준 편차를 갖는다.The embodiments described above have shown how normalization allows the analysis of a lot of information from EEG signals, for example using z scoring and the like. Previous analyzes normalized power information according to frequency. Normalization preferably uses z scoring, but any other kind of data normalization method may be used. The normalization used is preferably independent of the unit of measure, such as z scoring. As is well known in the art, z scoring can be used to normalize a distribution without changing the shape of the envelope of the distribution. The z score should be changed in units of standard deviations. The unit normalized to each z score reflects the amount of power in the signal with respect to the mean of the signal. By subtracting the mean from each score, the score is converted into the form of mean deviation. The score is then normalized with respect to the standard deviation. All units normalized to z scores have a standard deviation of 1 (unity).
위에서는 z 스코어를 사용하는 정규화에 대하여 개시하고 있지만, T 스코어링이나 그 밖의 다른 방식을 포함하는 다른 정규화가 수행될 수 있다. 다중 정규화가 또한 사용될 수 있다. 정규화는 시간에 따라 주파수를 정규화함으로써 또는 주파수에 따라 시간을 정규화함으로써 실행될 수 있다.While above is described for normalization using z scores, other normalizations may be performed, including T scoring or other ways. Multiple normalization can also be used. Normalization can be performed by normalizing the frequency over time or by normalizing the time over frequency.
상기 실시태양은 특정 범위 내의 모든 주파수에서의 파워를 정규화하는 것에 대해 개시하고 있다. 이 범위는 0에서 100 hz, 128 hz 또는 5 00hz까지가 될 수 있다. 주파수의 범위는 샘플링 레이트(sampling rate)에 의해서만 제한된다. 예를 들어, 30 KHz의 예시적인 샘플링 레이트에 의해 분석은 최대 15 KHz까지 수행될 수 있다.This embodiment discloses normalizing power at all frequencies within a specific range. This range can be from 0 to 100 hz, 128 hz or 5 00hz. The range of frequencies is limited only by the sampling rate. For example, with an example sampling rate of 30 KHz, analysis can be performed up to 15 KHz.
본 실시태양에 따르면, 각각의 주파수에 대한 시간에 따른 파워를 정규화하는 추가의 정규화가 수행된다. 이에 따른 결과는, 정규화된 스펙트로그램을 생성하기 위해 사용되는, 주파수 및 시간에 따라 정규화되었던 정보가 된다. 본 실시태양은 뇌파 데이터로부터 추가의 정보를 취득할 수 있으며, 본 실시태양은 분석한 데이터로부터 수면의 서로 다른 기간을 자동으로 검출하는 것에 대해 개시한다. 검출될 수 있는 수면의 기간은, 서파 수면(short wave sleep: SWS), 급속 안구 운동 수면(rapid eye movement sleep: REM), 중간 수면(intermediate sleep: IIS) 및 각성(wakefulness)을 포함하며, 이에 한정되지 않는다. 중요한 특징에 의하면, 뇌파 활동의 단일의 채널(인간 두개골의 단일의 위치에서 얻어진 것)이 분석을 위해 사용된다. 상기한 바와 같이, 취득한 데이터는 인간 또는 다른 대상으로부터의 EEG 정보의 하나의 채널이 될 수 있다. 취득한 EEG 데이터는, 예를 들어, 256Hz의 샘플링 레이트를 사용하여 수집되거나, 더 높은 레이트에서 샘플링될 수 있다. 이 데이터는, 예를 들어 30초의 에포크로 분할되고, 주파수에 따른 특징을 갖는다.According to this embodiment, additional normalization is performed to normalize power over time for each frequency. The result is information that has been normalized over time and frequency, used to generate normalized spectrograms. This embodiment can acquire additional information from EEG data, and this embodiment discloses the automatic detection of different periods of sleep from the analyzed data. Periods of sleep that can be detected include short wave sleep (SWS), rapid eye movement sleep (REM), intermediate sleep (IIS), and wakefulness. It is not limited. According to an important feature, a single channel of EEG activity (obtained at a single location in the human skull) is used for analysis. As mentioned above, the acquired data can be one channel of EEG information from humans or other objects. The acquired EEG data can be collected using a sampling rate of 256 Hz, or sampled at a higher rate, for example. This data is divided into epochs of 30 seconds, for example, and has a characteristic according to frequency.
제1 주파수 정규화가 수행된다. 파워 정보는 각각의 주파수 빈(frequency bin)에 대해 z 스코어링 기술을 사용하여 정규화된다. 본 실시태양에서, 주파수 빈은 헤르쯔당 1에서 100 Hz 및 30개의 빈(bin)으로 확장될 수 있다. 정규화는 시간에 따라 발생한다. 이것은 정규화된 스펙트로그램 또는 NS를 발생시키고, 여기서 신호로부터의 각각의 주파수 대역은 실질적으로 동일한 가중치를 갖는다. 본 실시태양에서, 각각의 30초 에포크는, 해당 에포크 내의 가장 큰 z 스코어를 갖는 주파수인, "선호 주파수(preferred frequency)"로 표현된다.First frequency normalization is performed. Power information is normalized using a z scoring technique for each frequency bin. In this embodiment, the frequency bin can extend from 1 to 100 Hz and 30 bins per hertz. Normalization occurs over time. This generates a normalized spectrogram or NS, where each frequency band from the signal has a substantially equal weight. In this embodiment, each 30 second epoch is represented by a “preferred frequency”, which is the frequency with the largest z score in that epoch.
이것은 선호 주파수 공간이라고 하는 특별한 주파수 공간(frequency space)을 생성한다. 이러한 패턴이 어떻게 형성되는지에 대한 분석이 이루어지고, 이 패턴의 특징에 대한 분석이 허용된다. 따라서, 상이한 수면 상태가, 판별 함수(discrimination function)에 따라 정의될 수 있으며, 이러한 판별 함수는 소정의 영역에서의 소정의 활동을 찾고, 다른 영역에서는 비활동을 찾는다. 이 기능은, 활동을 갖는 영역에서의 주파수에 따른 수면 상태와 활동을 갖지 않는 주파수에 따른 수면 상태를 평가할 수 있다.This creates a special frequency space called the preferred frequency space. Analysis of how these patterns are formed is made, and analysis of the characteristics of these patterns is allowed. Thus, different sleep states can be defined according to a discriminant function, which finds a given activity in one area and inactive in another. This function can evaluate the sleep state according to the frequency in the area with activity and the sleep state according to the frequency without activity.
그러나, 더 일반적으로는, 보상된 데이터(compensated data)에 대해 임의의 형태의 동적 스펙트럼 스코어링(dynamic spectral scoring)이 수행될 수 있다. 이러한 판별 함수는, 복수 개의 주파수 범위의 각각에서, 특정한 값을 필요로 하거나, 단순히 존재해야 할 또는 존재하지 않아야 할 소정 양의 활동을 필요로 할 수 있다. 이러한 판별 함수는 또한 스펙트럼 단편화(spectral fragmentation) 및 시간적 단편화(temporal fragmentation)를 고려할 수 있다.More generally, however, any form of dynamic spectral scoring may be performed on the compensated data. This determination function may, in each of the plurality of frequency ranges, require a certain value or simply require a certain amount of activity that should or should not be present. This discriminant function may also take into account spectral fragmentation and temporal fragmentation.
주파수에 따라 제2 정규화가 실행된다. 제2 정규화는 이중으로 정규화된(doubly normalized) 스펙트로그램을 생성한다. 이는 대역이 보다 명백해지는 새로운 주파수 공간을 생성한다. 이중으로 정규화된 스펙트로그램 값은, 공간 내의 값을 최대로 분리하는 필터를 형성하는데 사용될 수 있다.Second normalization is performed in accordance with the frequency. The second normalization produces a double normalized spectrogram. This creates a new frequency space in which the band becomes more apparent. Dual normalized spectrogram values can be used to form a filter that maximizes the separation of values in space.
이중으로 정규화된 주파수에 대해 클러스터링 기술이 실행된다. 예를 들어, 이러한 클러스터링 기술은 이전 실시태양에 개시된 바와 같이 K-평균(K-means) 기술이 될 수 있다. 각각의 클러스터는 수면 상태를 나타낼 수 있다.Clustering techniques are implemented for dual normalized frequencies. For example, this clustering technique can be a K-means technique as disclosed in the previous embodiments. Each cluster may represent a sleep state.
클러스터는 실제로 다중차원적 클러스터(multi dimensional clusters)이며, 이들 스스로 추가의 정보를 찾기 위해 그래프화될 수 있다. 차원의 수는 클러스터링 변수(clustering variables)의 수에 의존할 수 있다. 이는 또한 이중으로 정규화된 스펙트로그램이 어떻게 더욱 많은 측정 특징(measurement characteristics)을 허용하는지를 보여준다.Clusters are actually multi dimensional clusters, which can themselves be graphed to find additional information. The number of dimensions may depend on the number of clustering variables. It also shows how double normalized spectrograms allow for more measurement characteristics.
스펙트럼 단편화를 설명하는 주파수에 따라 정규화된 파워에서의 평균 스프레드(average spread)의 측정이 또한 가능하다. 단편화 값은, 서로 다른 상태가 또한 판별 함수의 일부로서 사용될 수도 있기 때문에, 대안적으로 시간적 단편화를 기반으로 할 수 있다.It is also possible to measure the average spread at normalized power according to the frequency describing the spectral fragmentation. Fragmentation values may alternatively be based on temporal fragmentation because different states may also be used as part of the discriminant function.
이들 두 개의 함수는 이중으로 정규화된 스펙트럼에 대해 평가되며, NREM 수면에서 움직임 아티팩트를 생기게 했을 때의 모든 주파수에서의 이득(gain)에서의 등질의 증가(homogeneous increases)에 의존하고, W는 단일 정규화된 스펙트럼에서의 비정상적으로 상승된 단편화 값을 생기게 할 것이다.These two functions are evaluated on a double normalized spectrum, relying on homogeneous increases in gain at all frequencies when producing motion artifacts in NREM sleep, and W is single normalized. Will result in abnormally elevated fragmentation values in the spectra.
이러한 단편화 값은 판별 함수의 일부로서 사용될 수 있다. 중요한 것은, 그리고 상술한 바와 같이, 이러한 판별 함수는 일반적으로 수동 기술을 포함하여 앞서 설명한 임의의 분석 기술로부터 명백하지 않다.This fragmentation value can be used as part of the discriminant function. Importantly, and as described above, this discriminant function is generally not apparent from any of the analytical techniques described above, including manual techniques.
산출(computation)은 시간적 등록(temporal registration)을 증가시키기 위해 분할를 행하는 특징을 가지며, 또는 중첩(overlapping) 윈도우 또는 슬라이딩 윈도우를 사용할 수 있다. 이는 이전에는 전혀 가능하지 않았던 많은 기술을 가능하게 한다. 간단히 특징지으면, 뇌파 특징만을 이용하여 수면 상태와 각성 상태를 동적 스펙트럼 스코어링(dynamic spectral scoring)을 사용하여 구분하는 것이 가능하게 된다.The computation is characterized by partitioning to increase temporal registration, or may use overlapping windows or sliding windows. This enables many techniques that were not possible before. Simply characterized, it is possible to distinguish sleep states and wake states using dynamic spectral scoring using only EEG features.
상기한 데이터 분석을 위한 예시적인 방법들은 인간을 위한 표준 비침습적인 EEG 방법과 결합되었다. 이러한 결과는 동물에서 약화된 리듬을 비침습적으로 추출하고, EEG의 단일 채널로부터 두뇌 활동을 자동으로 분석하며, 동물을 위한 수면 파라미터를 충분히 분류할 수 있는 능력이다.
Exemplary methods for analyzing the data described above have been combined with standard non-invasive EEG methods for humans. These results are the ability to noninvasively extract weakened rhythms in animals, automatically analyze brain activity from a single channel of EEG, and fully classify sleep parameters for animals.
실시예Example
실시예Example 1 One
쥐를 이소플루란(isoflurane)으로 마취시켰다. 두피를 부드럽게 면도했다. 전도성 전기젤(conductive electrogel)을 도포하고 표준 6 mm 금도금 전극을 콜로디온(collodion)으로 고정하였다. 결과 데이터를 PCT 공개공보 제 WO2006/122201호에 개시된 소프트웨어와 기술을 사용하여, 상기한 고급 산출 기술로 분석하였다.Mice were anesthetized with isoflurane. Shaved the scalp gently. A conductive electrogel was applied and a standard 6 mm gold plated electrode was fixed with collodion. The resulting data was analyzed with the advanced calculation techniques described above using the software and techniques disclosed in PCT Publication No. WO2006 / 122201.
쥐의 뇌로부터의 전압 신호를 전극으로 수집하여 분석을 위한 컴퓨터로 전송한다. 이 신호는 대략 세 개의 제 2 에포크로 분해된다. 전체적인 기록 스펙트럼을 생성하기 위해 각각의 에포크에 대한 주파수 스펙트럼이 산출된다. 그리고 나서 기록 스펙트럼은 주파수에 따라 정규화되고 이는 이전에 확인되지 않은 주파수의 검출을 가능하게 한다.Voltage signals from the rat brain are collected by electrodes and sent to a computer for analysis. This signal is broken down into approximately three second epochs. The frequency spectrum for each epoch is calculated to produce an overall recording spectrum. The recording spectrum is then normalized with frequency, which enables detection of frequencies not previously identified.
매 시간의 에포크에서, 기준선(baseline)에 대한 최대 변동을 갖는 주파수만이 맵핑된다. 그 결과로 생긴 맵은 기준선에 대한 공간 내에서의 서로 다른 특징을 보여준다. 다시 도 2를 참고하면, 이러한 특징들은, 단계를 분리하기 위한 파라미터 공간을 생성하기 위한 다중 정규화된(시간 및 주파수에 따른 정규화) 스펙트로그램(202)에서 사용되는 변수를 생성하기 위해 사용될 수 있다. 성분 분석(204)은 또한 클러스터(206)를 생성하기 위한 다중 정규화된 스펙트로그램에서 사용될 수 있다.
At every epoch, only the frequency with the maximum variation with respect to the baseline is mapped. The resulting map shows different characteristics in space relative to the baseline. Referring again to FIG. 2, these features can be used to generate variables used in multiple normalized (normalization over time and frequency)
데이터의 그룹을 구분하기 위한 예시적인 컴퓨터를 이용한 방법Example Computer-Based Method for Separating Groups of Data
데이터를 별개의 클래스로 구분하기 위한 컴퓨터를 이용한 신호 처리에 매우 다양한 클러스터링 및 분류 방법이 사용된다. 본 명세서에 개시된 바와 같이, 사용된 클러스터링 방법은 k-평균 클러스터링이지만, 데이터의 그룹을 구분하기 위한 임의의 컴퓨터를 이용한 신호 처리 방법이 사용될 수 있다. 마찬가지로, 본 명세서에 개시된 것과 같은 성분 분석(예를 들어, 주요 성분 분석 및 독립 성분 분석)과 같은 분류 방법이 사용된다.A wide variety of clustering and classification methods are used for signal processing using a computer to classify data into separate classes. As disclosed herein, the clustering method used is k-means clustering, but any computer-assisted signal processing method for separating groups of data may be used. Similarly, classification methods such as component analysis (eg, principal component analysis and independent component analysis) as disclosed herein are used.
컴퓨터를 이용한 방법의 개요는 다음과 같다.The outline of the method using a computer is as follows.
클러스터링(또는 클러스터 분석)은, 클래스(classes)가 미리 알려져 있지 않고, 목표가 데이터로부터 이러한 클래스를 찾는 것인, 자율 학습(unsupervised learning)이다. 예를 들어, 유전자 발현 프로파일(gene expression profile)을 사용하는 새로운 종양 클래스(tumor classes)의 식별은 일종의 자율 학습이다.Clustering (or cluster analysis) is unsupervised learning, where classes are not known in advance, and the goal is to find these classes from data. For example, identification of new tumor classes using a gene expression profile is a kind of self-learning.
분류(또는 클래스 예측)는, 클래스가 미리 정해져 있고, 목표가 일단의 라벨화된 대상으로부터의 분류에 대한 근거를 이해하고 향후 라벨화되지 않은(unlabeled) 관측에 대한 예측 변수(predictor)를 구축하는 것인, 지도 학습 방법(supervised learning method)이다. 예를 들어, 악성 종양(malignancy)을 알려진 클래스로 분류하는 것은 일종의 지도 학습이다.Classification (or class prediction) is the establishment of predictors for future unlabeled observations where the class is predetermined, the goal being understood, and the basis for classification from a group of labeled objects. Supervised learning method. For example, classifying malignancy into a known class is a kind of supervised learning.
클러스터링은 여러 개의 별개의 단계를 포함한다:Clustering involves several distinct steps:
대상들 사이의 적절한 거리를 해소하는(defusing) 단계Defusing the proper distance between objects
클러스터링 알고리즘의 적용을 선택하는 단계.Choosing to apply a clustering algorithm.
클러스터링 과정은 일반적으로 2개의 카테고리, 즉 계층적(hierarchical) 방법과 분할(partitioning) 방법으로 나누어진다. 계층적 방법은, 분할식(top-down, 하향식) 또는 병합식 (bottom-up. 상향식)이 될 수 있다. 계층적 클러스터링 방법은 트리 또는 덴드로그램(dendrogram)을 만든다. 계층적 방법은, 모든 대상이 하나의 클러스터에 있는 가장 작은 것에서부터 각각의 관찰이 그 자신의 클러스터에 있는 가장 큰 세트까지 클러스터의 계층을 제공한다.The clustering process is generally divided into two categories, hierarchical method and partitioning method. The hierarchical method may be top-down or bottom-up. The hierarchical clustering method creates a tree or dendrogram. The hierarchical method provides a hierarchy of clusters, from the smallest of all objects in one cluster to the largest set of each observation in its own cluster.
분할 방법은 일반적으로 클러스터의 수의 사양(specification)을 필요로 한다. 이어서, 대상을 클러스터에 할당하기 위한 메커니즘이 결정되어야 한다. 이들 방법은, 데이터를 상호 배타적이고 포괄적인(mutually exclusive and exhaustive) 그룹의 미리 지정된 수 k로 분할한다. 본 방법은 어떤 기준(예를 들어, 클러스터 내의 제곱합(sum-of-square)을 최소화하는 것)에 맞을 때까지 관찰 결과를 클러스터에 반복적으로 재할당한다. 분할 방법의 예에는, k-평균 클러스터링, 대표 객체 분할(partitioning around medoids: PAM), 자기조직화 맵(self organizing maps: SOM) 및 모델 기반(model-based) 클러스터링을 포함한다.The partitioning method generally requires specification of the number of clusters. Subsequently, a mechanism for assigning the target to the cluster must be determined. These methods divide the data into a predetermined number k of mutually exclusive and exhaustive groups. The method repeatedly reassigns observations to the cluster until it meets some criteria (eg, to minimize the sum-of-square within the cluster). Examples of partitioning methods include k-means clustering, partitioning around medoids (PAM), self organizing maps (SOM), and model-based clustering.
실질적으로 사용된 대부분의 방법은 대부분 효율적인 정확한 알고리즘의 이용가능성 때문에 병합식 및 계층적 클러스터링 방법이다. 그러나, 이들 두 가지 클러스터링 방법은 각자의 장점과 단점이 있다. 계층적 클러스터링 방법의 장점은, 적어도 병합식 클러스터링 방법에 비해 연산이 빠르다는 것이며, 계층적 클러스터링 방법의 단점은 유연성이 없어서 본 방법에서 미리 만든 잘못된 판정에 대해 나중에 보정할 수 없다는 것이다. 분할 방법의 장점은 이러한 방법이 최적화 기준을 (거의 정확하게) 만족시키는 클러스터를 제공할 수 있다는 것을 포함하며, 분할 방법의 단점은 초기값 k를 필요로 하며 연산 시간이 길다는 것을 포함한다.Most of the methods used in practice are mostly merge and hierarchical clustering methods because of the availability of efficient and accurate algorithms. However, these two clustering methods have their advantages and disadvantages. The advantage of the hierarchical clustering method is that the operation is at least faster than the merged clustering method, and the disadvantage of the hierarchical clustering method is that it is inflexible and cannot be later corrected for wrong decisions made in advance in this method. Advantages of the partitioning method include that this method can provide clusters that (mostly) meet the optimization criteria, and disadvantages of the partitioning method include an initial value k and a long computation time.
요약하면, 클러스터링은 다음을 포함하는 다양한 이유 때문에 분류보다 더 어려운 문제이다: 라벨화된 관찰의 학습 세트(learning set)가 없고, 일반적으로 그룹의 수는 알 수 없고, 암시적으로 클러스터링 방법에 사용된 관련 특징과 거리 측정을 모두 미리 선택하여야 한다.
In summary, clustering is a more difficult problem than classification for a variety of reasons, including: no learning set of labeled observations, generally no number of groups, implicitly used in clustering methods All relevant features and distance measurements must be selected in advance.
분류(Classification(ClassificationClassification))
통계, 기계 학습(machine learning), 심리 측정(psychometrics)을 포함하는 기술이 사용될 수 있다. 분류기(classifier)의 예는 로지스틱 회귀(logistic regression), 판별 분석(discriminant analysis, 선형 판별 분석 및 이차 판별 분석), 주요 성분 분석(PCA), 최근접 이웃 분류기(nearest neighbor classifier, k-최근접 이웃 분류기), 분류 및 회귀 트리(classification and regression tree: CART), 마이크로어레이(microarray)에 대한 예측 분석(prediction analysis), 신경망 및 다항 로그-선형 모델(neural networks and multinomial log-linear models), 서포트 벡터 머신(support vector machines), 집계 분류기(aggregated classifiers [배깅(bagging), 부스팅(boosting), 포레스트(forest)] 및 진화 알고리즘(evolutionary algorithm)을 포함한다.Techniques can be used including statistics, machine learning, and psychometrics. Examples of classifiers include logistic regression, discriminant analysis, linear discriminant analysis and secondary discriminant analysis, principal component analysis (PCA), nearest neighbor classifier, k-nearest neighbors. Classifiers, classification and regression trees (CART), prediction analysis for microarrays, neural networks and multinomial log-linear models, support vectors Support vector machines, aggregated classifiers (bagging, boosting, forest) and evolutionary algorithms.
로지스틱 회귀는, 종속(반응) 변수가 이분 변수(dichotomous variable)이고 [즉, 일부 결과 이벤트(outcome event)의 출현 또는 비출현(non-occurrence)을 일반적으로 나타내며, 0이나 1로 일반적으로 코드화되는 2개의 값만을 취한다], 독립(입력) 변수가 연속하거나 범주에 속하거나 또는 이들 두 가지인 경우에 사용되는 선형 회귀의 변동량이다. 예를 들어, 의료 연구에 의하면, 환자가 살아있는지 죽었는지, 또는 임상 시료(clinical sample)가 어떤 바이러스성 항체(viral antibody)에 대해 양성 반응(positive)지 음성반응(negative)인지이다.Logistic regression means that the dependent variable is a dichotomous variable (ie, generally indicates the appearance or non-occurrence of some outcome event and is generally coded as 0 or 1). Take only two values], the amount of variation in the linear regression used when the independent (input) variable is continuous, belongs to a category, or both. For example, medical studies indicate whether a patient is alive or dead, or whether a clinical sample is positive or negative for a viral antibody.
정상적인 회귀(ordinary regression)와 달리, 로지스틱 회귀는 종속 변수를 종속 변수의 선형 조합으로 직접 모델화하지 않으며, 종속 변수가 정상적으로 분포된 것으로 가정하지도 않는다. 대신에, 로지스틱 회귀는 이벤트의 출현의 가능성의 함수를 설명 변수(explanatory variable)의 선형 조합으로 모델화한다. 로지스틱 회귀의 경우, 이러한 방식에서의 설명 변수에 확률을 관련시키는 함수는 로지스틱 함수이며, 설명 변수의 선형 조합의 값에 대해 플로팅될 구성될 때, 시그모이드(sigmoid) 또는 S자 모양을 갖는다.Unlike normal regression, logistic regression does not directly model the dependent variable as a linear combination of dependent variables, nor does it assume that the dependent variables are normally distributed. Instead, logistic regression models a function of the likelihood of the occurrence of an event as a linear combination of explanatory variables. In the case of logistic regression, the function of associating probabilities with explanatory variables in this manner is a logistic function and, when constructed to be plotted against the value of a linear combination of explanatory variables, has a sigmoid or S-shape.
로지스틱 회귀는, 로지스틱 회귀 모델을 데이터에 일치시키고, 이들의 일치된 확률을 기반으로 다양한 설명 변수 패턴을 분류함으로써, 분류에 사용된다. 후속하는 데이터의 분류는 이들의 공변수 패턴(covariate pattern)과 평가된 확률에 근거를 둔다.
Logistic regression is used for classification by matching logistic regression models to data and classifying various explanatory variable patterns based on their matched probabilities. Subsequent classification of the data is based on their covariate pattern and the estimated probability.
판별 분석(Discriminant AnalysisDiscriminantDiscriminantanalysisanalysis))
요약하면, 판별 분석은, 샘플을 공간에서의 포인트로 나타내고 이러한 포인트를 분류하는 것이다. 선형 판별 분석(LDA)은 두 개의 클래스에 속하는 포인트를 최적으로 구분하는 최적의 평면(optimal plane surface)을 찾는다. 이차 판별 분석(QDA)은 최적의 곡선(이차)면을 찾는다. 이 두 가지 방법은 일부 분류 에러의 형태를 최소화하기 위한 것이다.
In summary, discriminant analysis is to represent samples as points in space and classify those points. Linear discriminant analysis (LDA) finds an optimal plane surface that optimally distinguishes points belonging to two classes. Quadratic Discriminant Analysis (QDA) finds the best curve (secondary) plane. These two methods are intended to minimize some form of classification error.
피셔(Fisher)의Fisher's 선형 판별 분석( Linear discriminant analysis (FLDAFLDA 또는 orLDALDA):):
LDA는, 그룹 내의 제곱합에 대한 그룹간의 큰 비율(large ratios)을 갖는 데이터의 선형 조합(판별 변수)을 찾고, 평균 벡터(mean vector)가 판별 변수에 의한 관측값(observation) x의 클래스에 가장 가까운 클래스에 의해 관측값 x의 클래스를 예측하는 것이다. LDA의 장점은 단순하며 직관적이라는 것인데, 여기서 테스트할 때의 예측된 클래스가 가장 근접한 평균값을 가진 클래스이고, 실제로 양호한 수행으로 구현하기 용이하다는 것이다.
LDA finds a linear combination of data (a discriminant variable) with large ratios between groups to the sum of squares within the group, and the mean vector is best used for the class of observation x by the discriminant variable. We predict the class of observation x by the nearest class. The advantage of LDA is that it is simple and intuitive, where the predicted class when tested is the class with the nearest average value and is actually easy to implement with good performance.
최근접 이웃 분류기(Nearest Neighbor Classifier (nearestnearestneighborneighborclassifierclassifier):):
최근접 이웃 방법은 두 개의 데이터 세트 사이에서 상관성이 없는 것 또는 유클리드 거리(Euclidean distance)와 같은 관찰 사이에서의 거리의 측정을 기반으로 한다. K-최근접 이웃 분류기는 다음과 같이 관측값 x를 분류함으로써 작용한다:The nearest neighbor method is based on the measurement of the distance between observations, such as no correlation between two data sets or Euclidean distance. The K-nearest neighbor classifier works by classifying observations x as follows:
- x에 가장 근접한 학습 세트(learning set)에서 k 관측값을 찾는다.Find k observations in the learning set closest to x.
- x의 클래스를 다수결(majority vote)로 예측한다. 즉, 이러한 k 이웃값 중에서 가장 공통인 클래스를 선택한다. k=1인 단순한 분류기가 일반적으로 상당히 성공적으로 될 수 있다. 연관성(relevance)이 없거나 거의 없는 다수의 비연관성(irrelevant) 또는 노이즈 변수(noise variables)는 최근접 이웃 분류기의 성능을 실질적으로 열화시킬 수 있다.Predict the class of x with a majority vote. That is, the most common class is selected from these k neighbor values. Simple classifiers with k = 1 can generally be quite successful. Many irrelevant or noise variables with little or no relevance can substantially degrade the performance of the nearest neighbor classifier.
도 4를 참고하면, 도 4는 자동 데이터와 수동 데이터 중 하나를 이용하여 대상의 수면 상태를 판정하기 위한 예시적인 시스템(400)의 블록도이다, 수동으로 채점된 데이터(404)뿐만 아니라 자동 데이터(402)는 스펙트로그램(406)을 산출하는데 사용될 수 있다. 상기한 방법들은 데이터(408)을 분석하고 그리고 나서 대상의 수면 상태 정보를 판정하는데 사용될 수 있다.Referring to FIG. 4, FIG. 4 is a block diagram of an
실시예 2는 예시적인 방법들이 어떻게 자동 데이터 및 수동 데이터 중 하나를 이용하여 EEG의 단일 채널로부터의 수면 패턴을 판정하는가를 예시한다.
Example 2 illustrates how the example methods use one of automatic data and manual data to determine a sleep pattern from a single channel of the EEG.
실시예Example 2 2
26번의 야간 수면으로부터의 EEG의 단일 채널(C3-A2 유도)은 26명의 건강한 인간을 대상으로 수행된 26개의 서로 다른 수면다원검사 기록(polysomnographic recording)으로부터 획득되었다. EEG 데이터 및 실험적 절차에 의해 제공된 수동 채점은 기관감사위원회의 각 기관에 의해 승인되었다.A single channel (C3-A2 induction) of EEG from 26 nocturnal sleeps was obtained from 26 different polysomnographic recordings performed on 26 healthy humans. Manual scoring provided by EEG data and experimental procedures was approved by each agency of the Agency Audit Committee.
EEG 데이터는 256 Hz에서 수집되었고 60 Hz 노치 필터(UCSD)를 이용하여 0.3 내지 100 Hz에서 필터링되거나 또는 250 Hz에서 수집되거나 0.53 내지 70 Hz에서 필터링되었다(MPI). 이들 기록은 10 K에서 증폭되었고 R-K에 따라 30 초 에포크에서 수동으로 채점되었다. 각각의 기록에 대해, 표준 멀티테이퍼 기술(standard multitaper technique)을 이용하여 30초 에포크 상의 2개의 직교 테이퍼(orthogonal taper)에 대해 전체 야간 스펙트로그램을 산출하였다.EEG data was collected at 256 Hz and filtered at 0.3 to 100 Hz using a 60 Hz Notch Filter (UCSD) or collected at 250 Hz or filtered at 0.53 to 70 Hz (MPI). These records were amplified at 10 K and manually scored at 30 sec epoch according to R-K. For each recording, a full night spectrogram was calculated for two orthogonal tapers on a 30 second epoch using the standard multitaper technique.
그리고 나서, 파워 정보는 시간에 따라 각각의 주파수 빈(1 내지 100 Hz, 헤르쯔당 30개의 빈)에 대한 z-스코어링에 의해 정규화되었다. 이 정규화된 스펙트로그램(normalized spectrogram: NS)은 각각의 주파수 대역을 동일하게 가중화했다. 각각의 30 초 세그먼트는 가장 큰 z 스코어를 갖는 주파수에 의해 나타났다.The power information was then normalized by z-scoring for each frequency bin (1-100 Hz, 30 bins per hertz) over time. This normalized spectrogram (NS) equally weighted each frequency band. Each 30 second segment was represented by the frequency with the largest z score.
이 선호 주파수 공간(preferred frequency space, PFS) 내에서, 수면 및 각성 상태는 대략적으로 다른 패턴들로 분리되었다 (도 21 및 도 22). W는 항상 알파(7 내지 12 Hz) 대역에 의해, 그리고 가끔은 베타(15 내지 25 Hz) 대역에 의해 특징지어 졌다. IS는 수면 방추의 주파수(12 내지 15 Hz) 내에서 현저한 활동을 보였다.Within this preferred frequency space (PFS), the sleep and wake states were separated into roughly different patterns (Figures 21 and 22). W has always been characterized by the alpha (7-12 Hz) band and sometimes by the beta (15-25 Hz) band. IS showed significant activity within the frequency of sleep spindles (12-15 Hz).
놀랍게도, 렘은 세타(4 내지 8 Hz)의 조밀한 대역으로 정의되며 그리고 가끔은 SWS가 델타 활동에 의해 특징지어 지는 베타(15 내지 25 Hz) 주파수로 정의된다. 3초 윈도우 및 1 초 슬라이딩 윈도우의 중첩에 의해 산출될 때, 유사한 트렌드가 렘에 나타나는 베타 활동을 제외하면 PFS 내에서 알아볼 수 있었다.Surprisingly, RAM is defined as the dense band of theta (4 to 8 Hz) and sometimes the beta (15 to 25 Hz) frequency where SWS is characterized by delta activity. Similar trends were noticeable within PFS, except for beta activity in RAM, when calculated by the overlap of a 3 second window and a 1 second sliding window.
이 분해능에서, 렘은 30 초 동안의 분해능에서 보다 더욱 "깨어 있는 것 같은(awake-like)" 것으로 보인다. 그러나, 이 분해능에서, 수동으로 또는 자동으로 확인되었건 간에 모든 수면 상태는 선호 주파수 공간 내에서 뚜렷한 특징을 갖는다.At this resolution, the RAM appears to be more "awake-like" than at 30 seconds of resolution. However, at this resolution, all sleep states, whether manually or automatically confirmed, have distinctive features within the preferred frequency space.
각각의 시점에서, 주파수에 대해 정규화된 스펙트로그램을 z-스코어링하는 것은 이중으로 정규화된 스펙트로그램을 생성한다. 이 공간에서, PFS 내에서 명백한 대역들은 여전히 양의 값(positive values)을 갖지만, 어두운 부분은 음의 값(negative values 을 갖는 경향이 있었다. PFS 내에서의 대역으로 나타나는 주파수의 이중으로 정규화된 스펙트로그램 값들을 가산하고 그렇지 않는 값들을 감산함으로써, 상태를 최대한으로 분리하는 필터링이 수행될 수 있다. 하나는 W를 극대화하고('W필터'), 다른 하나는 W 및 렘으로부터 비-렘(NREM)을 분리하며('NREM 필터'), 세 번째 필터는 SWS와 IS를 구별한다(SWS 필터). 이러한 세 필터들의 출력은, 세 개의 넓은 수면 상태와 W가 분리되는 경향이 있는 공간을 포괄한다.At each time point, z-scoring the normalized spectrogram against frequency produces a double normalized spectrogram. In this space, the apparent bands in the PFS still have positive values, while the dark areas tend to have negative values.Double normalized spectroscopy of frequencies appearing as bands within the PFS. By adding gram values and subtracting those that are not, filtering can be performed that maximizes the state: one maximizes W ('W filter') and the other non-lem (NREM) from W and RAM. ('NREM filter'), and the third filter differentiates between SWS and IS (SWS filter), and the output of these three filters covers the three broad sleep states and the space where W tends to separate. .
놀랍게도, 단계 I는 공간 내에서 클러스터하지 않았고 SWS는 (단계 III을 위한 하나 그리고 단계 IV를 위한 하나인 두 개가 아닌) 오직 하나의 클러스터를 형성했다. 후자는 단계 III 및 단계 IV의 구분을 포기한 R-K의 최근 변경에 부합한다. 단계 I 및 단계 III의 수동 채점은 30초 동안의 인크리먼트에서 이루어졌다. 이 분해능에서, 단계 III로 수동으로 라벨화된 에포크는 다수의 기록에서 단계 II 또는 단계 IV로 수동으로 라벨화된 에포크와 분명한 차이가 없었고, 단계 I으로 수동으로 라벨화된 에포크는 PFS 내의 대부분의 기록에서 단계 II, 렘 또는 W로 수동으로 라벨화된 에포크와 분명한 차이가 없었다. 따라서 단계 I 및 단계 III는 그 자체로는 고정된 수면 상태가 아니고 오히려 과도기적인 것 같다. 그러나 렘은 쉽게 각성과 구별할 수 있었다. 따라서 인간의 렘 수면은 더 이상 "깨어 있는 것 같은(awake-like)" 또는 "역설적(paradoxical)"인 것으로 생각될 수 없다.Surprisingly, stage I did not cluster in space and SWS formed only one cluster (not two, one for stage III and one for stage IV). The latter is consistent with recent changes in R-K that gave up the distinction between stage III and stage IV. Manual scoring of stages I and III was done in increments of 30 seconds. At this resolution, epochs manually labeled with stage III were no clear difference from epochs manually labeled with stage II or stage IV in many records, and epochs manually labeled with stage I were most There was no obvious difference from Epoch manually labeled as Phase II, Rem or W in the recording. Thus, stages I and III, by themselves, are not fixed sleep states, but rather appear to be transitional. But Rem could easily distinguish it from awakening. Thus, REM sleep in humans can no longer be thought of as "awake-like" or "paradoxical".
K-평균 클러스터링 알고리즘(도 20)이 수면 상태를 분류하기 위한 상기한 공간 내의 정규화된 데이터에 적용되었다. VA 및 MPI 데이터가 별도로 필터링되었다 할지라도, 수면 및 각성 클러스터의 일반적인 위치는 세트들에 대해서도 유사했다. 또한 알고리즘이 MPI 데이터 세트 상에서 최적화되었기는 하지만, VA 데이터 상에서 80.6%로 수행되었고, 이는 데이터의 단일 채널을 사용하는 전례 없는 것이고 더욱 많은 채널을 사용하는 그 밖의 알고리즘의 성능과 유사하다. (Flexer, A., et al.,ArtifIntellMed.33,199 (2005).A K-means clustering algorithm (FIG. 20) was applied to the normalized data in the above space for classifying sleep states. Although the VA and MPI data were filtered separately, the general location of the sleep and wake clusters was similar for the sets. Also, although the algorithm was optimized on the MPI data set, it performed at 80.6% on VA data, which is unprecedented using a single channel of data and is similar to the performance of other algorithms using more channels. (Flexer, A., et al.,ArtifIntellMed.33 , 199 (2005).
평균치의 표준 오차는 또한 전자가 6명의 대상을 갖고 후자가 20명의 대상을 갖는다 할지라도 (각각 1.73% 대 1.78%) MPI 세트에 비해 VA 세트가 더 낮았다. 전체 데이터 세트에 대한 인간 채점에서의 평균 일치율은 4 단계 상에서 77.58%였다. 이러한 현저한 일치는, 정해진 야간 동안 특정한 대상의 수면 단계를 플로팅하는 자동으로 그리고 수동으로 획득한 수면 깊이 그래프들(hypnograms)의 중첩에 의해 가시화될 수 잇다. 26개의 기록 중 2개의 기록에서 알고리즘이 데이터를 잘못 라벨링하고 있는 것 같다.The standard error of the mean was also lower in the VA set compared to the MPI set, although the former had 6 subjects and the latter had 20 subjects (1.73% vs. 1.78%, respectively). The average concordance rate in human scoring for the entire data set was 77.58% on four stages. This striking agreement can be visualized by superposition of automatically and manually acquired sleep depth graphs that plot the sleep stage of a particular subject for a given night. In two of the 26 records, the algorithm seems to be mislabeling the data.
그러한 데이터가 나머지 데이터 세트와 비교했을 때 다르게 보이지만, 선호 주파수 맵 상의 수동 채점의 시각화는 그러나 수면 및 각성 단계에 대한 별개의 특징을 보여주지 못한다. VA 데이터에 있어서, 알고리즘의 성능을 동일한 사람에 의해 재채점된(rescored) 또는 더 능숙한 채점자에 의해 채점된 데이터와 비교했을 때, 알고리즘에 대한 평균 일치율은 증가했고 82.4 내지 83.3% 범위에 있었다.While such data looks different when compared to the rest of the data set, the visualization of manual scoring on the preferred frequency map, however, does not show distinct characteristics for the sleep and wakefulness stages. For VA data, the average match rate for the algorithm increased and ranged from 82.4 to 83.3% when comparing the performance of the algorithm with data scored by the same person or by a more proficient scorer.
시간 및 주파수에 따른 추가의 정규화는 30초 동안의 분해능(도 7의 a 및 b, 도 8) 및 1초 동안의 분해능(도 7의 b 및 c , 도 9) 모두에서 전체 야간 스펙트로그램에 적용될 수 있다. 여기서 수면 및 각성 단계는 광대역 패턴(도 8, 도 9의 c 및 d)을 나타내는 렘, W 및 IS를 갖는 전체 1 내지 100 Hz 스펙트럼을 타일링(tile)한다.Further normalization over time and frequency is applied to the full night spectrogram at both resolution for 30 seconds (a and b in FIG. 7, FIG. 8) and resolution for 1 second (b and c in FIG. 7, FIG. 9). Can be. The sleep and wake phases here tile the entire 1 to 100 Hz spectrum with RAM, W and IS representing the broadband pattern (c and d in FIGS. 8 and 9).
이 공간 내에서, 시간에 따라 정규화된 파워에서의 단편화를 측정할 수 있다 (시간적 단편화) (도 16, 도 21 및 도 22). 이러한 분석은 렘 수면에 대한 양봉 분포(bimodal distribution)를 드러낸다. 이러한 패턴은 주파수 범위가 4 내지 40 Hz로 좁아졌을 때 계속되었다(데이터 미도시). 렘의 더욱 단편화된 부분은, 평균 36.18±1.27초 동안 지속되며 안정된 렘의 평균 129.08±11.04초에 의해 분리된 하룻밤 당 37.42±2.70의 에포크의 비율에서 렘의 26.18±1.7 %(평균±s.e.m)을 차지했다 (도 28).Within this space, fragmentation at normalized power over time can be measured (temporal fragmentation) (Figures 16, 21 and 22). This analysis reveals a bimodal distribution of REM sleep. This pattern continued when the frequency range narrowed to 4-40 Hz (data not shown). The more fragmented portion of the RAM lasted for 36.18 ± 1.27 seconds on average and 26.18 ± 1.7% (mean ± sem) of RAM at a rate of 37.42 ± 2.70 epochs per night separated by an average of 129.08 ± 11.04 seconds of stable RAM. Accounted for (Figure 28).
렘의 이러한 성분은 긴장성 및 위상성 렘(tonic and phasic REM)과 일치하지 않으며 서로 다른 스펙트럼 특징을 보여준다 (도 23). 렘 수면의 이러한 불안정한 부분은 안정된 부분보다 더욱 단계 II와 혼동될 가능성이 있었다 (도 31a 내지 도 31e 및 도 32). 이러한 경우에, 렘이 있는 경우 약간의 수면 방추(spindles), k-복합체(k-complexes)는, 더 높은 시간적 분해능에서 렘으로 채점될지라도, 이들 에포크를 단계 II로 채점되게 했다 (도 21).This component of the rem is inconsistent with the tonic and phasic REM and shows different spectral characteristics (FIG. 23). This unstable portion of REM sleep was more likely to be confused with stage II than the stable portion (FIGS. 31A-31E and 32). In this case, some sleep spindles, k-complexes, in the presence of RAM, allowed these epochs to be scored in Phase II, even if scored with RAM at higher temporal resolution (FIG. 21). .
R-K규칙에 따르면, 어떠한 수면 방추 또는 k-복합체도 렘에서 3분 이내에 분리될 수 없다. k-복합체 및 수면 방추가 렘에서 발견될 수 있지만, 여기서 제공하는 분석에 따르면, 이러한 신호는 렘에서 관찰되는 이중모드 시간적 단편화 패턴(bimodal temporal fragmentation pattern)의 원인이 되지 않으며, 그 이유는 아마도 수면 방추 또는 k-복합체가 전혀 없는 수동으로 채점된 렘은 여전히 이러한 패턴을 보이기 때문이다 (도 16의 a 및 b, 도 21, 도 22, 도 31a 내지 도 31e 우측 세로줄).According to the R-K rule, no sleeping spindles or k-complexes can be separated within 3 minutes from the RAM. Although k-complexes and sleep spindles can be found in REM, the analysis provided herein indicates that these signals do not cause the bimodal temporal fragmentation pattern observed in REM, perhaps because of sleep This is because manually scored RAMs without any spindles or k-complexes still show this pattern (a and b in Fig. 16, Figs. 21, 22, 31a-31e right vertical row).
또한 렘은 여전히 방추 주파수 파워 없이 스펙트럼 상에서 양봉 분포를 나타낸다. 시간적 단편화는 정규화된 파워의 갑작스러운 변화에 민감하다. 이러한 변화는 또한 아티팩트에 의해 발생될 수 있고, 그것들이 발생시킨 변화는 저파워 EEG의 배경에서 증가될 것이다. 따라서 어떤 종류의 아티팩트는 모든 것은 아니더라도 대부분의 렘의 이중모드 시간적 단편화의 원인이 될 수 있다.Also, the RAM still exhibits the bee distribution on the spectrum without the spindle frequency power. Temporal fragmentation is sensitive to sudden changes in normalized power. These changes can also be caused by artifacts, and the changes they produce will increase in the background of low power EEG. Thus, some sort of artifact can, if not all, cause the bimodal temporal fragmentation of most RAM.
25 Hz보다 높은 선호 주파수를 갖는 임의의 에포크뿐만 아니라, 움직임 아티팩트를 포함하는 것으로 알려진 에포크에 인접한 에포크가 분석에서 폐기될 때, 양봉 패턴(bimodal pattern)이 여전히 보일지라도, 불안정한 렘 에포크의 비율은 감소했다. 양봉 패턴은 더 많은 아티팩트가 분리될 때 훨씬 덜 분명했다.When an epoch adjacent to an epoch known to contain motion artifacts, as well as any epoch with a preferred frequency higher than 25 Hz, is discarded in the analysis, although the bimodal pattern is still visible, the rate of unstable rem epoch is reduced. did. Beekeeping patterns were much less obvious when more artifacts were separated.
그러나 이들 아티팩트들이 단편화 분석에 포함될 때, 6개의 경우 중 4개의 경우(렘이 제 2 채점자에 의해 시각적으로 확인될 때 6개의 경우 중 5개의 경우), 렘의 단편화되지 않은 부분의 더 높은 비율을 차지했으며, 수동 채점(채점자에 따라 대상 9에서 71.91% 및 대상 20에서 50.73% 및 52.24%의 렘의 단편화되지 않은 부분)에 대해 두 경우를 제외한 모든 경우에서 그리고 자동 채점(대상 9에서 75.9%의 렘의 단편화되지 않은 부분)에 대해 하나의 경우를 제외한 모든 경우에서 렘의 두 부분 중 50% 이하를 차지했다.However, when these artifacts were included in the fragmentation analysis, four of six cases (five of six when the REM was visually identified by the second grader) would yield a higher proportion of the unfragmented portion of the REM. In both cases and automatic scoring (75.9% in target 9) for manual scoring (71.91% in
아티팩트를 포함하지 않는 에포크들에 대해 최근접 이웃 분석(nearest-neighbor analysis)이 실행됐다 (도 33). 렘의 단편화된 부분은 거의 모든 경우에서, 수동 채점에 따라(하나의 채점자에 대한 5/6 대상, 또 다른 채점자에 대한 6/6 대상), 단편화되지 않은 부분보다 아티팩트를 포함하는 더 많은 이웃들을 가졌다.Nearest-neighbor analysis was performed on epochs that did not contain artifacts (FIG. 33). The fragmented part of the RAM can be used in almost all cases, depending on manual scoring (5/6 targets for one marker, 6/6 targets for another marker), and more neighbors containing artifacts than non-fragmented portions. Had
렘이 자동으로 검출될 때, 대부분의 대상에서, 다수의 단편화된 에포크 및 단편화되지 않은 에포크는 이웃하는 아티팩트가 전혀 없었다. 이러한 데이터에 대한 추가의 분석은 관찰된 패턴 및 아마도 수면의 새로운 상태의 원인이 될 수 있는 EEG 특징을 확인하기 위해 필요할 것이다. 그럼에도 불구하고, 시간적 단편화는 렘을 W 및 단계 I과 쉽게 구별하는 또 다른 변수를 제공한다 (도 30a 및 도 30b).
When REM was automatically detected, in most subjects, many fragmented and unfragmented epochs had no neighboring artifacts at all. Further analysis of this data will be needed to identify the observed patterns and EEG characteristics that may be the cause of the new state of sleep. Nevertheless, temporal fragmentation provides another variable that easily distinguishes RAM from W and step I (FIGS. 30A and 30B).
예시적인 수면 통계치Exemplary Sleep Statistics
본 명세서에 개시된 모든 기술들에 있어서, 조정된 소스 데이터로부터 다양한 임의의 통계치가 생성될 수 있다. 예를 들어, 수면 상태로 분류된 조정된 소스 EEG 데이터로부터 수면 통계치가 생성될 수 있다. 예시적인 수면 통계치는, 수면 상태 밀도(sleep stage densities), 수면 상태 에피소드(sleep stage episodes)의 수, 수면 상태 평균 기간, 사이클 시간, 수면 상태 사이의 인터벌 시간, 수면 상태 분리 통계치(sleep stage separation statistics), 수면의 개시, 렘 수면 잠복기(REM sleep latency), 트렌드(trends)의 회귀 계수, 트렌드의 통계적 중요도의 측정값 등을 포함할 수 있다.
In all of the techniques disclosed herein, various arbitrary statistics can be generated from the adjusted source data. For example, sleep statistics may be generated from the adjusted source EEG data classified as sleep states. Exemplary sleep statistics include sleep stage densities, number of sleep stage episodes, average duration of sleep states, cycle time, interval time between sleep states, and sleep stage separation statistics. ), Initiation of sleep, REM sleep latency, regression coefficients of trends, measurements of statistical significance of trends, and the like.
예시적인 수면 데이터 프리젠터(Example sleep data presenter (PresenterPresenter))
본 명세서에서의 모든 실시예들에 있어서, 수면 상태 데이터를 기반으로 한 전자식(electronic) 또는 종이식 보고(paper-based)가 제시될 수 있다. 이러한 보고는 대상에 대해 맞춤형(customized) 수면 상태 정보, 수면 상태 통계치, 병리적 상태, 수면에서의 약물 및/또는 화학 약품 효과 등을 포함할 수 있다. 선별 검사(screening test), 행동의 변화 등에 대한 권고(recommendation)가 제시될 수도 있다. 특정한 수면 데이터 및 저주파 정보의 결과가 몇몇 예에 나타나 있지만, 그 밖의 수면 데이터 프리젠터와 데이터의 가시화가 사용될 수 있다.
In all embodiments herein, electronic or paper-based based on sleep state data can be presented. Such reports may include customized sleep state information, sleep state statistics, pathological conditions, drug and / or chemical effects in sleep, and the like, for the subject. Recommendations may be given for screening tests, changes in behavior, and the like. Although the results of specific sleep data and low frequency information are shown in some examples, other sleep data presenters and visualizations of data may be used.
예시적인 컴퓨터 실행 방법Example computer implementation
본 명세서에 개시된 모든 컴퓨터 실행 방법들은 자동화 시스템(예를 들어, 컴퓨터 시스템) 내의 소프트웨어에 의해 실행되는 소프트웨어로 수행될 수 있다. 완전 자동(예를 들어, 인간의 개입이 없음) 또는 반자동(예를 들어, 인간의 개입에 의해 도움을 받는 컴퓨터 처리) 동작이 지원될 수 있다. 사용자의 개입은 파라미터를 조정하거나 결과를 고려하는 것과 같은 어떤 경우에서는 바람직할 수 있다.All computer-implemented methods disclosed herein can be performed with software executed by software in an automated system (eg, computer system). Fully automatic (eg, no human intervention) or semi-automatic (eg, computer processing assisted by human intervention) operations may be supported. User intervention may be desirable in some cases, such as adjusting parameters or considering the results.
이러한 소프트웨어는 개시된 작용을 수행하기 위한 컴퓨터로 실행 가능한 명령을 포함하는 하나 이상의 컴퓨터로 판독 가능한 매체에 저장될 수 있다. 이러한 매체는 유형의(예를 들어, 물리적인) 매체가 될 수 있다.Such software may be stored on one or more computer readable media containing computer executable instructions for performing the disclosed operations. Such a medium may be a tangible (eg, physical) medium.
이상에서는 정보가 수면 상태를 판정하는데 어떻게 사용되는지에 대해 개시하였다. 개시된 기술들은 또한 수면 상태를 특징짓는 그 밖의 응용과 기술에 대해 사용될 수 있다. 이러한 응용은 환자가 자신들의 수면 상태에 기초하여, 그리고 자신들의 수면 상태에 기초한 두뇌 기능에서의 변화로서 이전에 판명되었던 변수를 기반으로, 어떤 종류의 약물을 섭취했는지 여부를 판정하는 것을 포함할 수 있다.The foregoing has described how information is used to determine sleep states. The disclosed techniques can also be used for other applications and techniques that characterize sleep conditions. Such an application may include determining what kind of drug a patient has taken based on their sleep state and based on a variable previously identified as a change in brain function based on their sleep state. have.
도 5를 참고하면, 도 5는 수면 상태로부터 대상의 병리적 상태를 판정하기 위한 예시적인 시스템(500)의 블록도이다. 동물의 뇌파 데이터가 수신되고 수면 상태 분석기로 입력되어 대상의 병리적 상태를 판정한다.Referring to FIG. 5, FIG. 5 is a block diagram of an
병리적 상태가 수면 상태(506)를 기반으로 동물에서 검출될 수 있다. 예를 들어, 동물(502)의 수면 상태가 수면 상태가 획득될 수 있으며, 수면 상태가 정상 수면을 나타내는지 아니면 비정상 수면을 나타내는지를 판정하도록 분석된다(504). 비정상 수면은 병리적 상태(508)를 나타낼 수 있다. 예를 들어, 병리적 상태를 갖는 동물들의 수면 상태가 획득될 수 있으며, 구분 가능한 "병리적 상태" 수면 상태 프로파일 및/또는 병리적 상태를 갖는 것을 나타내는 수면 상태 통계치를 생성하기 위해 공통 속성(common attributes)에 대해 분석된다. 이러한 프로파일 또는 통계치를, 대상이 병리적 상태를 가지고 있는지 또는 병리적 상태의 임의의 조기 진단 지표를 갖는지 여부를 판정하기 위해, 동물에 대해 판정된 수면 상태에 비교할 수 있다. 임의의 다양한 병리적 상태가 검출 및/또는 분석될 수 있다. 예를 들어, 수면 관련 병리적 상태는 간질(epilepsy), 알츠하이머병(Alzheimer's disease), 우울증(depression), 뇌 외상(brain trauma), 불면증(insomnia), 하지 불안 증후군(Restless leg syndrome) 및 수면 무호흡증(sleep apnea)을 포함할 수 있다. 예를 들어, 수면 다원 검사에 의해 알츠하이머병을 가진 환자는 치매(dementia)로 될 때까지 비례해서 감소된 렘 수면을 보일 수 있다.A pathological condition can be detected in the animal based on the
발작성 수면(narcolepsy)은 렘으로의 급작스런 전이와 관련이 있다. 발작성 수면증 동물의 뇌파에는 불안정 패턴이 있다고 최근에 보고된 바 있다. 인간뿐만 아니라 이들이 렘에 해당된다면, 발작성 수면증은 렘 단편화 패턴에 있어서 뚜렷한 차이를 갖게 될 것이다.Paroxysmal narcolepsy is associated with a sudden transition to REM. It has recently been reported that there is an instability pattern in the brain waves of paroxysmal sleepy animals. If not only humans but also REM, seizure sleepiness will have a distinct difference in REM fragmentation patterns.
그 밖의 많은 질병들이 수면 장애와 연관되어 있다. 예를 들어, 우울증은 짧은 렘 잠복기와 증가된 렘 수면에 관련이 있다. 알츠하이머 환자들은 이미 불안정한 수면 패턴을 갖는다. 이러한 상태 및 그것들의 치료는[(우울증 블록 렘에 대해 사용되는 모노아민 옥시다이제(MAOIs); 알츠하이머병에 대해 사용되고 렘에 영향을 미치는 콜린에스테라아제 저해제(cholinesterase inhibitors)] 안정된 그리고 불안정한 렘의 새로운 발현과 관련이 있을 수 있으며, 이는 병리와 치료 모두를 평가하는데 사용될 수 있다.Many other diseases are associated with sleep disorders. For example, depression is associated with short RAM incubation and increased REM sleep. Alzheimer's patients already have unstable sleep patterns. These conditions and their treatment [(monoamine oxidases (MAOIs) used for depression block rem; cholinesterase inhibitors used for Alzheimer's disease and affecting rem)] new expression of stable and unstable rem It may be used to assess both pathology and treatment.
선호 주파수 및 반복된 선호 주파수 플롯은 또한 병리와 치료의 생체지표를 추출하는데 도움이 될 수 있다.
Preference frequencies and repeated preference frequency plots can also help to extract biomarkers of pathology and treatment.
수면에 영향을 줄 수 있는 예시적인 약물 및 화학 약품Exemplary Drugs and Chemicals That May Affect Sleep
본 명세서에 개시된 모든 기술들에 있어서, 동물의 수면 상태에 대한 약물 및 화학 약품의 효과는 동물에 대해 얻어진 소스 데이터를 분석함으로써 판정될 수 있다. 예를 들어, 수면 상태는, 알코올, 니코틴 및 코카인 사용에 의해 변경될 수 있다. 수면에 영향을 주는 예시적인 약물은 스테로이드, 테오필린(theophylline), 소염제(decongestant), 벤조디아제핀(benzodiazepine), 항우울제(antidepressant), 모노아민 산화효소 억제제(monoamine oxidase inhibitor, 예를 들어, 페넬진(Phenelzine) 및 모클로베미드(Moclobemide)), 선택적 세로토닌 재흡수 억제제(selective serotonin reuptake inhibitors, 예를 들어, 플루옥세틴(Fluoxetine, Prozac® 상표 하에 판매) 및 설트랄린(Sertraline, Zoloft® 상표 하에 판매), 티록신(thyroxine), 경구 피임약(oral contraceptive pill), 항고혈압제(antihypertensives), 항히스타민제(antihistamines), 신경 이완제(neuroleptics), 암페타민(amphetamine), 바르비투르산염(barbiturates), 마취제(anesthetics) 등을 포함한다.In all of the techniques disclosed herein, the effects of drugs and chemicals on the animal's sleep state can be determined by analyzing the source data obtained for the animal. For example, sleep states can be altered by the use of alcohol, nicotine and cocaine. Exemplary drugs that affect sleep include steroids, theophylline, decongestant, benzodiazepine, antidepressants, and monoamine oxidase inhibitors such as phenelzine. And Moclobemide), selective serotonin reuptake inhibitors such as fluoxetine (sold under the trademark Prozac®) and Sultraline (sold under the trademark Zoloft®), thyroxine (thyroxine), oral contraceptive pill, antihypertensives, antihistamines, neuroleptics, amphetamine, barbiturates, anesthetics, etc. .
수면 패턴은 병리적 상태와 약물 효과를 위해 상기한 바와 같은 진단법으로서 사용될 수 있다. 아래의 실시예는 수면 패턴이 어떻게 개개인을 확인하기 위한 생체지표로 사용될 수 있는가를 예시한다.
Sleep patterns can be used as a diagnostic as described above for pathological conditions and drug effects. The examples below illustrate how sleep patterns can be used as biomarkers to identify individuals.
실시예Example 3 3
상기한 예시적인 수면 단계화 기법(sleep staging technique)을 이용하여 네 쌍의 쌍둥이에 대한 수면 데이터가 분석되었다.Sleep data for four pairs of twins were analyzed using the exemplary sleep staging technique described above.
1 내지 4번의 세로줄 각각은 4쌍의 쌍둥이(제 1쌍은 이란성이고, 제 2 내지 제 4 쌍은 일란성임)에 해당된다. 오직 REM만이 도시된다(시간에 따른 시간적 단편화). 쌍둥이는 유사한 시간적 단편화 패턴을 나타낸다 (도 34).Each of the first to fourth vertical lines corresponds to four pairs of twins (the first pair is fraternal and the second to fourth pairs are identical). Only REM is shown (temporal fragmentation over time). Twins show a similar temporal fragmentation pattern (FIG. 34).
더 많은 일반적인 목표를 수행하기 위한 서로 다른 방식을 가능하게 하는데 사용될 수 있는 일반적인 구조 및 기술과 더 구체적인 실시태양이 본 명세서에 개시된다.DETAILED DESCRIPTION General structures and techniques and more specific embodiments are disclosed herein that can be used to enable different ways to accomplish more general goals.
본 명세서 전체에서, 본 발명이 속한 기술 분야를 더욱 충분하게 개시하기 위하여 다양한 공개공보, 특허 및/또는 특허 출원들이 본원에서 인용된다. 이들 공개공보, 특허 및/또는 특허출원들의 개시내용은 본원에서 전체가 참고로 인용되며, 각각의 공개공보, 특허 및/또는 특허 출원이 참고로서 인용될 수 있도록 구체적으로 그리고 개별적으로 명시된 것과 같은 정도로, 이들은 동일한 또는 이전의 문장에서 구체적으로 참고 문헌 목록이 달려 있는 청구 주제에 대해 본원에서 전체가 참고로 인용된다.Throughout this specification, various publications, patents, and / or patent applications are cited herein in order to more fully disclose the technical field to which this invention belongs. The disclosures of these publications, patents and / or patent applications are hereby incorporated by reference in their entirety, to the extent that each publication, patent and / or patent application is specifically and individually indicated to be incorporated by reference. , Which are hereby incorporated by reference in their entirety on the subject matter in which the reference is specifically listed in the same or previous sentences.
몇몇 실시태양에 대해서만 구체적으로 개시했지만, 다른 실시태양도 가능하며, 본 발명자들은 이들이 명세서 내에 포함되도록 의도한다. 본 명세서는 다른 방식으로 달성될 수 있는 더욱 일반적인 목표를 달성하기 위한 구체적인 실시예를 개시한다. 이러한 개시내용은 예시적인 것으로 의도되며, 청구범위는 해당 기술 분야에서 통상의 기술을 가진 자가 예측할 수 있는 임의의 변경 또는 대안을 포함하도록 의도된다. 예들 들어, 그 밖의 응용이 가능하며, 다른 형태의 판별 기능과 특징화가 가능하다. 위에서 "선호 주파수(preferred frequency)" 면에서 주파수를 특징짓는 것으로 광범위하게 개시하였지만, 정보의 보다 엄격한 특징이 가능하다는 것을 이해하여야 한다. 또한, EEG데이터로부터 수면 상태를 판정하고, 수면 상태의 판정이 몇몇 상이한 종류만 있는 것으로 언급되어 있지만, 그 밖의 응용이 고려된다는 것을 이해하여야 한다.Although only certain embodiments have been described in detail, other embodiments are possible and the inventors intend for them to be included within the specification. This disclosure discloses specific embodiments for achieving more general goals that may be achieved in other ways. This disclosure is intended to be illustrative, and the claims are intended to cover any changes or alternatives that would be expected by one of ordinary skill in the art. For example, other applications are possible, and other forms of discrimination and characterization are possible. Although broadly described above as characterizing frequencies in terms of " preferred frequency, " it should be understood that more stringent characteristics of the information are possible. It is also to be understood that the sleep state is determined from the EEG data, and that the determination of the sleep state is referred to as only a few different kinds, but other applications are contemplated.
본 발명의 원리를 바람직한 실시태양에서 설명 및 개시했지만, 개시된 실시예는 예시적인 것이며, 본 발명의 원리를 벗어남이 없이 구성을 변경할 수 있다는 것은 당업자에게 자명할 것이다. 이러한 실시예들 중 어떤 것으로부터의 기술은 하나 이상의 다른 실시예에 포함될 수 있다.While the principles of the invention have been described and disclosed in the preferred embodiments, it will be apparent to those skilled in the art that the disclosed embodiments are illustrative and that modifications may be made without departing from the principles of the invention. Techniques from any of these embodiments may be included in one or more other embodiments.
또한 본 발명자들은 특허 청구의 범위에서 "~을 위한 수단(means for)"이란 단어를 사용한 청구범위는 35 USC 112의 6번째 문단에 따라 해석되는 것으로 의도한다. 또한 명세서로부터의 어떠한 제한도, 이러한 제한이 청구범위에 명백히 포함되어 있지 않은 경우에도, 청구범위에 포함되는 것으로 의도된다.
The inventors also intend that the claims using the word "means for" in the claims shall be interpreted in accordance with the sixth paragraph of 35 USC 112. Furthermore, any limitations from the specification are intended to be included in the claims even if such limitations are not expressly included in the claims.
Claims (27)
Translated fromKorean적어도 하나의 전극을 동물에 부착하는 단계;
뇌파 활동을 나타내는 데이터를 획득하는 단계;
상기 뇌파 활동을 나타내는 데이터를 분석하는 단계; 및
상기 분석 단계로부터의 수면 상태를 나타내는 적어도 하나의 파라미터를 판정하는 단계를 포함하는 방법.In the method for evaluating the brain stage of an animal,
Attaching at least one electrode to the animal;
Obtaining data indicative of EEG activity;
Analyzing data indicative of the brain wave activity; And
Determining at least one parameter indicative of a sleep state from the analyzing step.
주파수에 따른 시간에 대해 적어도 한 번 스펙트로그램(spectrogram)을 정규화(normalizing)하는 단계;
시간에 따른 주파수에 대해 적어도 한 번 스펙트로그램을 정규화하는 단계; 및
상기 분석 단계로부터의 수면 상태를 나타내는 적어도 하나의 파라미터를 판정하는 단계를 포함하는, 방법.In the method for evaluating the brain stage of an animal:
Normalizing the spectrogram at least once over time over frequency;
Normalizing the spectrogram at least once for frequency over time; And
Determining at least one parameter indicative of a sleep state from the analyzing step.
스펙트로그램을 산출하는 단계:
스펙트로그램을 정규화하는 단계:
독립된 또는 주요한 성분 분석(component analysis)을 수행하는 단계; 및
클러스터들(clusters)을 확인하는 단계를 포함하는, 방법.The method of claim 1, wherein analyzing the data indicative of brain activity comprises:
Producing the spectrogram:
Steps to normalize the spectrogram:
Performing independent or major component analysis; And
Identifying clusters.
뇌파 활동을 나타내는 데이터를 획득하기 위한 수신 수단;
상기 뇌파 활동을 나타내는 데이터를 분석하기 위한 산출 수단; 및
상기 분석 단계로부터의 수면 또는 각성 상태를 나타내는 적어도 하나의 파라미터를 판정하기 위한 프로세서를 포함하는 시스템.In a non-invasive system for acquiring and classifying animal brain waves:
Receiving means for obtaining data indicative of brain wave activity;
Calculating means for analyzing data indicative of the brain wave activity; And
And a processor for determining at least one parameter indicative of a sleep or wakeful state from said analyzing step.
일정 기간 동안 동물의 두뇌 활동을 나타내는 데이터를 수신하는 단계;
상기 두뇌 활동을 나타내는 데이터를 분석하는 단계; 및
수면 상태를 기반으로 상기 데이터를 분류하는 단계를 포함하는 방법.A method of determining a subject's sleep state over a period of time;
Receiving data indicative of brain activity of the animal for a period of time;
Analyzing data indicative of the brain activity; And
Classifying the data based on sleep status.
미처리된 동물에 대한 수면 파라미터를 획득하는 단계;
상기 미처리된 동물에 대한 수면 파라미터를 맵핑하는 단계;
처리된 동물에 대한 수면 파라미터를 획득하는 단계;
상기 처리된 동물에 대한 수면 파라미터를 맵핑하는 단계; 및
상기 미처리된 동물에 대한 파라미터를 상기 처리된 동물에 대한 파라미터와 비교하는 단계를 포함하는 시스템 및 방법.An automated system and method for measuring the effect of drug consumption in an animal;
Obtaining sleep parameters for untreated animals;
Mapping sleep parameters for the untreated animal;
Obtaining sleep parameters for the treated animal;
Mapping sleep parameters for the treated animals; And
Comparing the parameters for the untreated animal with the parameters for the treated animal.
건강한 동물에 대한 수면 파라미터를 획득하는 단계;
상기 건강한 동물에 대한 수면 파라미터를 맵핑하는 단계;
비정상적인 동물에 대한 수면 파라미터를 획득하는 단계;
상기 비정상적인 동물에 대한 수면 파라미터를 맵핑하는 단계; 및
상기 건강한 동물에 대한 파라미터를 상기 비정상적인 동물에 대한 파라미터와 비교하는 단계를 포함하는 시스템 및 방법.
An automated system and method for determining a pathological condition of an animal;
Obtaining sleep parameters for a healthy animal;
Mapping sleep parameters for the healthy animal;
Obtaining sleep parameters for the abnormal animal;
Mapping sleep parameters for the abnormal animal; And
And comparing the parameters for the healthy animal with the parameters for the abnormal animal.
Applications Claiming Priority (6)
| Application Number | Priority Date | Filing Date | Title |
|---|---|---|---|
| US11499708P | 2008-11-14 | 2008-11-14 | |
| US11498608P | 2008-11-14 | 2008-11-14 | |
| US61/114,986 | 2008-11-14 | ||
| US61/114,997 | 2008-11-14 | ||
| US11546408P | 2008-11-17 | 2008-11-17 | |
| US61/115,464 | 2008-11-17 |
Publications (1)
| Publication Number | Publication Date |
|---|---|
| KR20110094064Atrue KR20110094064A (en) | 2011-08-19 |
Family
ID=42170781
Family Applications (1)
| Application Number | Title | Priority Date | Filing Date |
|---|---|---|---|
| KR1020117013607ACeasedKR20110094064A (en) | 2008-11-14 | 2009-11-16 | Confirmation method and use of sleep and wakefulness pattern |
Country Status (10)
| Country | Link |
|---|---|
| US (1) | US20110218454A1 (en) |
| EP (1) | EP2355700A4 (en) |
| JP (2) | JP2012508628A (en) |
| KR (1) | KR20110094064A (en) |
| CN (1) | CN102438515A (en) |
| AU (1) | AU2009313766A1 (en) |
| BR (1) | BRPI0916135A2 (en) |
| CA (1) | CA2779265A1 (en) |
| IL (1) | IL212852A (en) |
| WO (1) | WO2010057119A2 (en) |
Cited By (4)
| Publication number | Priority date | Publication date | Assignee | Title |
|---|---|---|---|---|
| KR20140009715A (en)* | 2012-07-12 | 2014-01-23 | 중앙대학교 산학협력단 | Apparatus and method for determining of optimal eeg channel based on pso |
| US9364163B2 (en) | 2012-01-24 | 2016-06-14 | Neurovigil, Inc. | Correlating brain signal to intentional and unintentional changes in brain state |
| KR20220076564A (en)* | 2020-11-30 | 2022-06-08 | (주)루맥스헬스케어 | Sleep management device using artificial intelligence and sleep management system including the same |
| WO2023058869A1 (en)* | 2021-10-05 | 2023-04-13 | 이오플로우㈜ | Method and recording medium for calculating injection dosage of drug for treating sleep disorder |
Families Citing this family (46)
| Publication number | Priority date | Publication date | Assignee | Title |
|---|---|---|---|---|
| WO2012031125A2 (en) | 2010-09-01 | 2012-03-08 | The General Hospital Corporation | Reversal of general anesthesia by administration of methylphenidate, amphetamine, modafinil, amantadine, and/or caffeine |
| US20140038147A1 (en) | 2011-01-21 | 2014-02-06 | Fondamenta, Llc | Electrode for Attention Training Techniques |
| EP2699309B1 (en) | 2011-04-20 | 2017-08-09 | Medtronic, Inc. | Electrical therapy parameter determination based on a bioelectrical resonance response |
| EP2699310B1 (en) | 2011-04-20 | 2018-09-19 | Medtronic, Inc. | Apparatus for assessing neural activation |
| US8892207B2 (en) | 2011-04-20 | 2014-11-18 | Medtronic, Inc. | Electrical therapy for facilitating inter-area brain synchronization |
| US9173609B2 (en) | 2011-04-20 | 2015-11-03 | Medtronic, Inc. | Brain condition monitoring based on co-activation of neural networks |
| US8812098B2 (en) | 2011-04-28 | 2014-08-19 | Medtronic, Inc. | Seizure probability metrics |
| CN102274022B (en)* | 2011-05-10 | 2013-02-27 | 浙江大学 | A sleep state monitoring method based on EEG signals |
| US11559237B1 (en)* | 2011-08-24 | 2023-01-24 | Neurowave Systems Inc. | Robust real-time EEG suppression detection device and method |
| EP2806790B1 (en)* | 2012-01-24 | 2023-05-10 | Neurovigil, Inc. | Correlating brain signal to intentional and unintentional changes in brain state |
| EP3007755B1 (en)* | 2013-06-11 | 2023-04-19 | Agency For Science, Technology And Research | Sound-induced sleep method and a system therefor |
| WO2014210549A1 (en) | 2013-06-27 | 2014-12-31 | The General Hospital Corporation | Systems and methods for tracking non-stationary spectral structure and dynamics in physiological data |
| US10383574B2 (en) | 2013-06-28 | 2019-08-20 | The General Hospital Corporation | Systems and methods to infer brain state during burst suppression |
| US10602978B2 (en) | 2013-09-13 | 2020-03-31 | The General Hospital Corporation | Systems and methods for improved brain monitoring during general anesthesia and sedation |
| AU2014337565A1 (en)* | 2013-10-14 | 2016-06-02 | Neurovigil, Inc. | Localized collection of biological signals, cursor control in speech-assistance interface based on biological electrical signals and arousal detection based on biological electrical signals |
| CN103654744B (en)* | 2013-12-19 | 2016-02-24 | 惠州市德赛工业研究院有限公司 | A kind of sleep quality monitoring method |
| US9655559B2 (en) | 2014-01-03 | 2017-05-23 | Vital Connect, Inc. | Automated sleep staging using wearable sensors |
| AU2015204436A1 (en)* | 2014-01-08 | 2016-08-25 | Laszlo Osvath | Systems and methods for diagnosing sleep |
| DE102014101814A1 (en)* | 2014-02-13 | 2015-08-13 | Arthur Schultz | Method for automatic evaluation of a Absence EEG, computer program and evaluation device therefor |
| CN104027105B (en)* | 2014-04-23 | 2016-08-24 | 河南科技大学 | A kind of novel female fetal electrocardiogram separation method |
| CN107205652B (en)* | 2014-12-05 | 2021-06-29 | 新加坡科技研究局 | Sleep analysis system with feature generation and automatic mapping |
| CN105292476A (en)* | 2015-11-17 | 2016-02-03 | 中科创达软件股份有限公司 | Control method of unmanned plane and system thereof |
| US11864928B2 (en)* | 2016-06-01 | 2024-01-09 | Cardiac Pacemakers, Inc. | Systems and methods to detect respiratory diseases using respiratory sounds |
| CN106361276A (en)* | 2016-08-25 | 2017-02-01 | 深圳市沃特沃德股份有限公司 | Pet sleep judging method and device |
| WO2018035818A1 (en)* | 2016-08-25 | 2018-03-01 | 深圳市沃特沃德股份有限公司 | Method and device for determining sleeping state of pet |
| US10982869B2 (en)* | 2016-09-13 | 2021-04-20 | Board Of Trustees Of Michigan State University | Intelligent sensing system for indoor air quality analytics |
| CN106377251B (en)* | 2016-09-21 | 2020-06-16 | 广州视源电子科技股份有限公司 | Sleep state recognition model training method and system based on EEG signals |
| CN106388780A (en)* | 2016-09-21 | 2017-02-15 | 广州视源电子科技股份有限公司 | Sleep state detection method and system based on fusion of two classifiers and detector |
| US10786168B2 (en) | 2016-11-29 | 2020-09-29 | The General Hospital Corporation | Systems and methods for analyzing electrophysiological data from patients undergoing medical treatments |
| CN106725462B (en)* | 2017-01-12 | 2017-11-24 | 兰州大学 | Acousto-optic Sleep intervention system and method based on EEG signals |
| JP6535694B2 (en)* | 2017-02-22 | 2019-06-26 | 株式会社ジンズ | INFORMATION PROCESSING METHOD, INFORMATION PROCESSING DEVICE, AND PROGRAM |
| KR20200127202A (en)* | 2018-03-02 | 2020-11-10 | 닛토덴코 가부시키가이샤 | Method, computing device, and wearable device for detecting sleep stages |
| US12376781B2 (en)* | 2018-10-15 | 2025-08-05 | Mitsubishi Tanabe Pharma Corporation | Brain wave analysis device, brain wave analysis system, and brain wave analysis program |
| CN113383395B (en)* | 2018-10-22 | 2025-02-14 | 皇家飞利浦有限公司 | A decision support software system for sleep disorder identification |
| CN109685101B (en)* | 2018-11-13 | 2021-09-28 | 西安电子科技大学 | Multi-dimensional data self-adaptive acquisition method and system |
| JP7419719B2 (en)* | 2019-09-24 | 2024-01-23 | カシオ計算機株式会社 | Sleep stage estimation device, sleep stage estimation method and program |
| CN113367657B (en)* | 2020-03-10 | 2023-02-10 | 中国科学院脑科学与智能技术卓越创新中心 | Sleep quality evaluation method, device, equipment and storage medium based on high-frequency electroencephalogram |
| WO2021198934A1 (en)* | 2020-03-31 | 2021-10-07 | Resmed Sensor Technologies Limited | Systems and methods for detecting rem behavior disorder |
| WO2021205648A1 (en)* | 2020-04-10 | 2021-10-14 | 国立大学法人東海国立大学機構 | Objective sleep assessment method for mental disorder patient |
| JP7630781B2 (en)* | 2020-11-03 | 2025-02-18 | 国立大学法人京都大学 | How to extract a respiratory curve |
| CN112842266B (en)* | 2020-12-31 | 2024-05-14 | 湖南正申科技有限公司 | A sleep stage recognition method based on human sleep monitoring data |
| CN112617761B (en)* | 2020-12-31 | 2023-10-13 | 湖南正申科技有限公司 | Sleep stage staging method for self-adaptive focalization generation |
| CN113208620A (en)* | 2021-04-06 | 2021-08-06 | 北京脑陆科技有限公司 | Sleep stage based Alzheimer disease screening method and system |
| US20240366142A1 (en)* | 2021-05-01 | 2024-11-07 | Medtronic, Inc. | Detection of patient seizures for wearable devices |
| TWI781834B (en)* | 2021-11-29 | 2022-10-21 | 國立陽明交通大學 | Sleep evaluation method and computing device thereof |
| CN119961767B (en)* | 2025-04-08 | 2025-08-05 | 中国人民解放军总医院第二医学中心 | Sleep information processing method and device |
Family Cites Families (19)
| Publication number | Priority date | Publication date | Assignee | Title |
|---|---|---|---|---|
| US5626145A (en)* | 1996-03-20 | 1997-05-06 | Lockheed Martin Energy Systems, Inc. | Method and apparatus for extraction of low-frequency artifacts from brain waves for alertness detection |
| ATE410953T1 (en)* | 2001-06-13 | 2008-10-15 | Compumedics Ltd | METHOD FOR MONITORING CONSCIOUSNESS |
| US20040073129A1 (en)* | 2002-10-15 | 2004-04-15 | Ssi Corporation | EEG system for time-scaling presentations |
| US6993380B1 (en)* | 2003-06-04 | 2006-01-31 | Cleveland Medical Devices, Inc. | Quantitative sleep analysis method and system |
| JP4750032B2 (en)* | 2003-08-18 | 2011-08-17 | カーディアック ペースメイカーズ, インコーポレイテッド | Medical device |
| US20070249952A1 (en)* | 2004-02-27 | 2007-10-25 | Benjamin Rubin | Systems and methods for sleep monitoring |
| US20060293608A1 (en)* | 2004-02-27 | 2006-12-28 | Axon Sleep Research Laboratories, Inc. | Device for and method of predicting a user's sleep state |
| US8055348B2 (en)* | 2004-03-16 | 2011-11-08 | Medtronic, Inc. | Detecting sleep to evaluate therapy |
| US8244340B2 (en)* | 2006-12-22 | 2012-08-14 | Natus Medical Incorporated | Method, system and device for sleep stage determination using frontal electrodes |
| US20070208269A1 (en)* | 2004-05-18 | 2007-09-06 | Mumford John R | Mask assembly, system and method for determining the occurrence of respiratory events using frontal electrode array |
| US7860561B1 (en)* | 2004-06-04 | 2010-12-28 | Cleveland Medical Devices Inc. | Method of quantifying a subject's wake or sleep state and system for measuring |
| EP1779257A4 (en)* | 2004-07-21 | 2009-03-04 | Widemed Ltd | Sleep quality indicators |
| WO2006121455A1 (en)* | 2005-05-10 | 2006-11-16 | The Salk Institute For Biological Studies | Dynamic signal processing |
| KR101157289B1 (en)* | 2005-06-30 | 2012-06-15 | 엘지디스플레이 주식회사 | Backlight assembly and liquid crystal display having the same |
| US7915005B2 (en)* | 2005-11-09 | 2011-03-29 | Washington University In St. Louis | Methods for detecting sleepiness |
| JP2009530064A (en)* | 2006-03-22 | 2009-08-27 | エモーティブ システムズ ピーティーワイ リミテッド | Electrode and electrode headset |
| US7593767B1 (en)* | 2006-06-15 | 2009-09-22 | Cleveland Medical Devices Inc | Ambulatory sleepiness and apnea propensity evaluation system |
| US20080127978A1 (en)* | 2006-12-05 | 2008-06-05 | Benjamin Rubin | Pressure support system with dry electrode sleep staging device |
| US20090253996A1 (en)* | 2007-03-02 | 2009-10-08 | Lee Michael J | Integrated Sensor Headset |
- 2009
- 2009-11-16KRKR1020117013607Apatent/KR20110094064A/ennot_activeCeased
- 2009-11-16AUAU2009313766Apatent/AU2009313766A1/ennot_activeAbandoned
- 2009-11-16CNCN2009801543534Apatent/CN102438515A/enactivePending
- 2009-11-16WOPCT/US2009/064632patent/WO2010057119A2/enactiveApplication Filing
- 2009-11-16USUS13/129,185patent/US20110218454A1/ennot_activeAbandoned
- 2009-11-16JPJP2011536565Apatent/JP2012508628A/ennot_activeWithdrawn
- 2009-11-16EPEP09826930.1Apatent/EP2355700A4/ennot_activeWithdrawn
- 2009-11-16BRBRPI0916135Apatent/BRPI0916135A2/enactiveSearch and Examination
- 2009-11-16CACA2779265Apatent/CA2779265A1/ennot_activeAbandoned
- 2011
- 2011-05-12ILIL212852Apatent/IL212852A/enactiveIP Right Grant
- 2015
- 2015-05-07JPJP2015094583Apatent/JP2015177986A/enactivePending
Cited By (5)
| Publication number | Priority date | Publication date | Assignee | Title |
|---|---|---|---|---|
| US9364163B2 (en) | 2012-01-24 | 2016-06-14 | Neurovigil, Inc. | Correlating brain signal to intentional and unintentional changes in brain state |
| US9820663B2 (en) | 2012-01-24 | 2017-11-21 | Neurovigil, Inc. | Correlating brain signal to intentional and unintentional changes in brain state |
| KR20140009715A (en)* | 2012-07-12 | 2014-01-23 | 중앙대학교 산학협력단 | Apparatus and method for determining of optimal eeg channel based on pso |
| KR20220076564A (en)* | 2020-11-30 | 2022-06-08 | (주)루맥스헬스케어 | Sleep management device using artificial intelligence and sleep management system including the same |
| WO2023058869A1 (en)* | 2021-10-05 | 2023-04-13 | 이오플로우㈜ | Method and recording medium for calculating injection dosage of drug for treating sleep disorder |
Also Published As
| Publication number | Publication date |
|---|---|
| JP2015177986A (en) | 2015-10-08 |
| JP2012508628A (en) | 2012-04-12 |
| EP2355700A4 (en) | 2013-07-10 |
| EP2355700A2 (en) | 2011-08-17 |
| BRPI0916135A2 (en) | 2015-11-03 |
| CN102438515A (en) | 2012-05-02 |
| US20110218454A1 (en) | 2011-09-08 |
| IL212852A0 (en) | 2011-07-31 |
| WO2010057119A2 (en) | 2010-05-20 |
| WO2010057119A3 (en) | 2011-11-24 |
| CA2779265A1 (en) | 2010-05-20 |
| AU2009313766A1 (en) | 2011-07-07 |
| IL212852A (en) | 2015-09-24 |
Similar Documents
| Publication | Publication Date | Title |
|---|---|---|
| KR20110094064A (en) | Confirmation method and use of sleep and wakefulness pattern | |
| US11696724B2 (en) | Methods of identifying sleep and waking patterns and uses | |
| US11690557B2 (en) | Automated detection of sleep and waking states | |
| EP2498676B1 (en) | Brain activity as a marker of disease | |
| Zhou et al. | Automatic sleep stage classification with single channel EEG signal based on two-layer stacked ensemble model | |
| EP2983586B1 (en) | Methods to monitor consciousness | |
| US9326698B2 (en) | Method for automatic, unsupervised classification of high-frequency oscillations in physiological recordings | |
| US20150245800A1 (en) | Method for Detection Of An Abnormal Sleep Pattern In A Person | |
| US20150080671A1 (en) | Sleep Spindles as Biomarker for Early Detection of Neurodegenerative Disorders | |
| Christensen et al. | Data-driven modeling of sleep EEG and EOG reveals characteristics indicative of pre-Parkinson's and Parkinson's disease | |
| Gunnarsdottir et al. | A novel sleep stage scoring system: combining expert-based rules with a decision tree classifier | |
| Wessam et al. | K-complexes detection in EEG signals using fractal and frequency features coupled with an ensemble classification model | |
| Laskaris et al. | Improved detection of amnestic MCI by means of discriminative vector quantization of single-trial cognitive ERP responses | |
| Magosso et al. | A wavelet based method for automatic detection of slow eye movements: A pilot study | |
| McCloskey et al. | Data-driven cluster analysis of insomnia disorder with physiology-based qEEG variables | |
| Tiwari et al. | Supervised approach based sleep disorder detection using non-Linear dynamic features (NLDF) of EEG | |
| Castillo Rodriguez et al. | Differentiation of subclinical and clinical electrographic events in long‐term electroencephalographic recordings | |
| Hannan et al. | Clinical utility of sleep recordings during presurgical epilepsy evaluation with stereo-electroencephalography: a systematic review | |
| Zhao et al. | An energy screening and morphology characterization-based hybrid expert scheme for automatic identification of micro-sleep event K-complex | |
| AU2015268701A1 (en) | Methods of Identifying Sleep & Waking Patterns and Uses | |
| Satapathy et al. | Automated Sleep stage classification based on multiple channels of electroencephalographic signals using machine learning algorithm | |
| Wang et al. | A robust sleep apnea-hypopnea syndrome automated detection method based on fuzzy entropy using single lead-EEG signals | |
| Satapathy et al. | Automated Sleep Staging of Human Polysomnography Recordings Using Single-Channel of EEG Signals | |
| Bernardino | Towards clinically interpretable feature engineering methods for EEG Pre-Seizure Characterization | |
| Benghenia et al. | Automated Recognition of Sleep Apnea-Hypopnea Syndrome Using Continuous Wavelet Transform-Based Multiscale Dispersion Entropy of Single-Lead ECG Signal |
Legal Events
| Date | Code | Title | Description |
|---|---|---|---|
| PA0105 | International application | Patent event date:20110614 Patent event code:PA01051R01D Comment text:International Patent Application | |
| PG1501 | Laying open of application | ||
| A201 | Request for examination | ||
| PA0201 | Request for examination | Patent event code:PA02012R01D Patent event date:20141014 Comment text:Request for Examination of Application | |
| E902 | Notification of reason for refusal | ||
| PE0902 | Notice of grounds for rejection | Comment text:Notification of reason for refusal Patent event date:20160205 Patent event code:PE09021S01D | |
| AMND | Amendment | ||
| E601 | Decision to refuse application | ||
| PE0601 | Decision on rejection of patent | Patent event date:20161027 Comment text:Decision to Refuse Application Patent event code:PE06012S01D Patent event date:20160205 Comment text:Notification of reason for refusal Patent event code:PE06011S01I | |
| AMND | Amendment | ||
| PX0901 | Re-examination | Patent event code:PX09011S01I Patent event date:20161027 Comment text:Decision to Refuse Application Patent event code:PX09012R01I Patent event date:20160805 Comment text:Amendment to Specification, etc. | |
| PX0601 | Decision of rejection after re-examination | Comment text:Decision to Refuse Application Patent event code:PX06014S01D Patent event date:20170213 Comment text:Amendment to Specification, etc. Patent event code:PX06012R01I Patent event date:20170125 Comment text:Decision to Refuse Application Patent event code:PX06011S01I Patent event date:20161027 Comment text:Amendment to Specification, etc. Patent event code:PX06012R01I Patent event date:20160805 Comment text:Notification of reason for refusal Patent event code:PX06013S01I Patent event date:20160205 |