KR102333664B1 - Detection of genetic or molecular aberrations associated with cancer - Google Patents
Detection of genetic or molecular aberrations associated with cancerDownload PDFInfo
- Publication number
- KR102333664B1 KR102333664B1KR1020207033400AKR20207033400AKR102333664B1KR 102333664 B1KR102333664 B1KR 102333664B1KR 1020207033400 AKR1020207033400 AKR 1020207033400AKR 20207033400 AKR20207033400 AKR 20207033400AKR 102333664 B1KR102333664 B1KR 102333664B1
- Authority
- KR
- South Korea
- Prior art keywords
- cancer
- chromosomal
- nucleic acid
- value
- tumor
- Prior art date
- Legal status (The legal status is an assumption and is not a legal conclusion. Google has not performed a legal analysis and makes no representation as to the accuracy of the status listed.)
- Active
Links
- 206010028980NeoplasmDiseases0.000titleclaimsabstractdescription404
- 201000011510cancerDiseases0.000titleclaimsabstractdescription202
- 230000004075alterationEffects0.000titleclaimsabstractdescription15
- 230000002068genetic effectEffects0.000titleabstractdescription6
- 238000001514detection methodMethods0.000titledescription24
- 230000002759chromosomal effectEffects0.000claimsabstractdescription212
- 238000000034methodMethods0.000claimsabstractdescription135
- 238000004458analytical methodMethods0.000claimsabstractdescription93
- 230000003321amplificationEffects0.000claimsabstractdescription89
- 238000003199nucleic acid amplification methodMethods0.000claimsabstractdescription89
- 238000012217deletionMethods0.000claimsabstractdescription74
- 230000037430deletionEffects0.000claimsabstractdescription74
- 239000012472biological sampleSubstances0.000claimsabstractdescription43
- 230000001747exhibiting effectEffects0.000claimsabstractdescription18
- 238000004393prognosisMethods0.000claimsabstractdescription17
- 208000006994Precancerous ConditionsDiseases0.000claimsabstractdescription5
- 150000007523nucleic acidsChemical class0.000claimsdescription86
- 210000001519tissueAnatomy0.000claimsdescription79
- 102000039446nucleic acidsHuman genes0.000claimsdescription78
- 108020004707nucleic acidsProteins0.000claimsdescription78
- 238000009826distributionMethods0.000claimsdescription75
- 230000005856abnormalityEffects0.000claimsdescription72
- 238000012544monitoring processMethods0.000claimsdescription17
- 206010061306Nasopharyngeal cancerDiseases0.000claimsdescription9
- 238000003556assayMethods0.000claimsdescription8
- 230000003902lesionEffects0.000claimsdescription5
- 206010009944Colon cancerDiseases0.000claimsdescription3
- 208000001333Colorectal NeoplasmsDiseases0.000claimsdescription3
- 201000010536head and neck cancerDiseases0.000claimsdescription3
- 208000014829head and neck neoplasmDiseases0.000claimsdescription3
- 206010005003Bladder cancerDiseases0.000claims1
- 206010025323LymphomasDiseases0.000claims1
- 208000001894Nasopharyngeal NeoplasmsDiseases0.000claims1
- 206010060862Prostate cancerDiseases0.000claims1
- 208000000236Prostatic NeoplasmsDiseases0.000claims1
- 206010041067Small cell lung cancerDiseases0.000claims1
- 208000005718Stomach NeoplasmsDiseases0.000claims1
- 208000024770Thyroid neoplasmDiseases0.000claims1
- 208000007097Urinary Bladder NeoplasmsDiseases0.000claims1
- 206010017758gastric cancerDiseases0.000claims1
- 201000001441melanomaDiseases0.000claims1
- 208000002154non-small cell lung carcinomaDiseases0.000claims1
- 208000000587small cell lung carcinomaDiseases0.000claims1
- 201000011549stomach cancerDiseases0.000claims1
- 201000002510thyroid cancerDiseases0.000claims1
- 208000029729tumor suppressor gene on chromosome 11Diseases0.000claims1
- 201000005112urinary bladder cancerDiseases0.000claims1
- 239000012634fragmentSubstances0.000abstractdescription180
- 239000000523sampleSubstances0.000abstractdescription70
- 230000009897systematic effectEffects0.000abstractdescription6
- 108020004414DNAProteins0.000description244
- 102000053602DNAHuman genes0.000description244
- 102000054766genetic haplotypesHuman genes0.000description216
- 108700028369AllelesProteins0.000description92
- 210000000349chromosomeAnatomy0.000description91
- 208000031404Chromosome AberrationsDiseases0.000description59
- 210000004027cellAnatomy0.000description58
- 206010073071hepatocellular carcinomaDiseases0.000description48
- 231100000844hepatocellular carcinomaToxicity0.000description48
- 206010008805Chromosomal abnormalitiesDiseases0.000description37
- 238000012163sequencing techniqueMethods0.000description37
- 230000001186cumulative effectEffects0.000description35
- 231100000005chromosome aberrationToxicity0.000description21
- 238000013459approachMethods0.000description18
- 230000000875corresponding effectEffects0.000description18
- 230000008859changeEffects0.000description14
- 238000005259measurementMethods0.000description13
- 230000002018overexpressionEffects0.000description12
- 238000002271resectionMethods0.000description12
- 230000009452underexpressoinEffects0.000description12
- 208000037265diseases, disorders, signs and symptomsDiseases0.000description11
- 230000035945sensitivityEffects0.000description11
- 238000007847digital PCRMethods0.000description10
- 201000010099diseaseDiseases0.000description10
- 230000001613neoplastic effectEffects0.000description10
- 238000013519translationMethods0.000description10
- 230000014616translationEffects0.000description10
- 239000002773nucleotideSubstances0.000description9
- 125000003729nucleotide groupChemical group0.000description9
- 206010061818Disease progressionDiseases0.000description8
- 208000002454Nasopharyngeal CarcinomaDiseases0.000description8
- 230000002159abnormal effectEffects0.000description8
- 230000005750disease progressionEffects0.000description8
- 238000005516engineering processMethods0.000description8
- 230000003211malignant effectEffects0.000description8
- 201000011216nasopharynx carcinomaDiseases0.000description8
- 108090000623proteins and genesProteins0.000description8
- 230000002829reductive effectEffects0.000description8
- 210000004881tumor cellAnatomy0.000description8
- 108091028043Nucleic acid sequenceProteins0.000description7
- 238000003745diagnosisMethods0.000description7
- 230000006870functionEffects0.000description7
- 231100000590oncogenicToxicity0.000description7
- 230000002246oncogenic effectEffects0.000description7
- 210000002966serumAnatomy0.000description7
- 238000003205genotyping methodMethods0.000description6
- 238000012360testing methodMethods0.000description6
- 230000001594aberrant effectEffects0.000description5
- 238000010586diagramMethods0.000description5
- 238000010208microarray analysisMethods0.000description5
- 238000003752polymerase chain reactionMethods0.000description5
- 238000012216screeningMethods0.000description5
- 210000004369bloodAnatomy0.000description4
- 239000008280bloodSubstances0.000description4
- 210000001165lymph nodeAnatomy0.000description4
- 230000015654memoryEffects0.000description4
- 239000000203mixtureSubstances0.000description4
- 230000035772mutationEffects0.000description4
- 238000010606normalizationMethods0.000description4
- 102000054765polymorphisms of proteinsHuman genes0.000description4
- 230000010076replicationEffects0.000description4
- 238000004904shorteningMethods0.000description4
- 238000001356surgical procedureMethods0.000description4
- 230000004083survival effectEffects0.000description4
- 108020004705CodonProteins0.000description3
- 206010027476MetastasesDiseases0.000description3
- 206010061309Neoplasm progressionDiseases0.000description3
- 241000700605VirusesSpecies0.000description3
- 230000005540biological transmissionEffects0.000description3
- 238000004364calculation methodMethods0.000description3
- 238000002512chemotherapyMethods0.000description3
- 230000000694effectsEffects0.000description3
- 238000003384imaging methodMethods0.000description3
- 230000008774maternal effectEffects0.000description3
- 238000002493microarrayMethods0.000description3
- 230000003287optical effectEffects0.000description3
- 238000011002quantificationMethods0.000description3
- 238000003753real-time PCRMethods0.000description3
- 229920002477rna polymerPolymers0.000description3
- 239000004055small Interfering RNASubstances0.000description3
- 230000005751tumor progressionEffects0.000description3
- 208000000419Chronic Hepatitis BDiseases0.000description2
- 241000272470CircusSpecies0.000description2
- 206010016654FibrosisDiseases0.000description2
- 241000700721Hepatitis B virusSpecies0.000description2
- 108091092195IntronProteins0.000description2
- 108091034117OligonucleotideProteins0.000description2
- 108091027967Small hairpin RNAProteins0.000description2
- 108700025716Tumor Suppressor GenesProteins0.000description2
- 102000044209Tumor Suppressor GenesHuman genes0.000description2
- JLCPHMBAVCMARE-UHFFFAOYSA-N[3-[[3-[[3-[[3-[[3-[[3-[[3-[[3-[[3-[[3-[[3-[[5-(2-amino-6-oxo-1H-purin-9-yl)-3-[[3-[[3-[[3-[[3-[[3-[[5-(2-amino-6-oxo-1H-purin-9-yl)-3-[[5-(2-amino-6-oxo-1H-purin-9-yl)-3-hydroxyoxolan-2-yl]methoxy-hydroxyphosphoryl]oxyoxolan-2-yl]methoxy-hydroxyphosphoryl]oxy-5-(5-methyl-2,4-dioxopyrimidin-1-yl)oxolan-2-yl]methoxy-hydroxyphosphoryl]oxy-5-(6-aminopurin-9-yl)oxolan-2-yl]methoxy-hydroxyphosphoryl]oxy-5-(6-aminopurin-9-yl)oxolan-2-yl]methoxy-hydroxyphosphoryl]oxy-5-(6-aminopurin-9-yl)oxolan-2-yl]methoxy-hydroxyphosphoryl]oxy-5-(6-aminopurin-9-yl)oxolan-2-yl]methoxy-hydroxyphosphoryl]oxyoxolan-2-yl]methoxy-hydroxyphosphoryl]oxy-5-(5-methyl-2,4-dioxopyrimidin-1-yl)oxolan-2-yl]methoxy-hydroxyphosphoryl]oxy-5-(4-amino-2-oxopyrimidin-1-yl)oxolan-2-yl]methoxy-hydroxyphosphoryl]oxy-5-(5-methyl-2,4-dioxopyrimidin-1-yl)oxolan-2-yl]methoxy-hydroxyphosphoryl]oxy-5-(5-methyl-2,4-dioxopyrimidin-1-yl)oxolan-2-yl]methoxy-hydroxyphosphoryl]oxy-5-(6-aminopurin-9-yl)oxolan-2-yl]methoxy-hydroxyphosphoryl]oxy-5-(6-aminopurin-9-yl)oxolan-2-yl]methoxy-hydroxyphosphoryl]oxy-5-(4-amino-2-oxopyrimidin-1-yl)oxolan-2-yl]methoxy-hydroxyphosphoryl]oxy-5-(4-amino-2-oxopyrimidin-1-yl)oxolan-2-yl]methoxy-hydroxyphosphoryl]oxy-5-(4-amino-2-oxopyrimidin-1-yl)oxolan-2-yl]methoxy-hydroxyphosphoryl]oxy-5-(6-aminopurin-9-yl)oxolan-2-yl]methoxy-hydroxyphosphoryl]oxy-5-(4-amino-2-oxopyrimidin-1-yl)oxolan-2-yl]methyl [5-(6-aminopurin-9-yl)-2-(hydroxymethyl)oxolan-3-yl] hydrogen phosphatePolymersCc1cn(C2CC(OP(O)(=O)OCC3OC(CC3OP(O)(=O)OCC3OC(CC3O)n3cnc4c3nc(N)[nH]c4=O)n3cnc4c3nc(N)[nH]c4=O)C(COP(O)(=O)OC3CC(OC3COP(O)(=O)OC3CC(OC3COP(O)(=O)OC3CC(OC3COP(O)(=O)OC3CC(OC3COP(O)(=O)OC3CC(OC3COP(O)(=O)OC3CC(OC3COP(O)(=O)OC3CC(OC3COP(O)(=O)OC3CC(OC3COP(O)(=O)OC3CC(OC3COP(O)(=O)OC3CC(OC3COP(O)(=O)OC3CC(OC3COP(O)(=O)OC3CC(OC3COP(O)(=O)OC3CC(OC3COP(O)(=O)OC3CC(OC3COP(O)(=O)OC3CC(OC3COP(O)(=O)OC3CC(OC3COP(O)(=O)OC3CC(OC3CO)n3cnc4c(N)ncnc34)n3ccc(N)nc3=O)n3cnc4c(N)ncnc34)n3ccc(N)nc3=O)n3ccc(N)nc3=O)n3ccc(N)nc3=O)n3cnc4c(N)ncnc34)n3cnc4c(N)ncnc34)n3cc(C)c(=O)[nH]c3=O)n3cc(C)c(=O)[nH]c3=O)n3ccc(N)nc3=O)n3cc(C)c(=O)[nH]c3=O)n3cnc4c3nc(N)[nH]c4=O)n3cnc4c(N)ncnc34)n3cnc4c(N)ncnc34)n3cnc4c(N)ncnc34)n3cnc4c(N)ncnc34)O2)c(=O)[nH]c1=OJLCPHMBAVCMARE-UHFFFAOYSA-N0.000description2
- 238000002869basic local alignment search toolMethods0.000description2
- 239000011324beadSubstances0.000description2
- 210000000601blood cellAnatomy0.000description2
- 238000004422calculation algorithmMethods0.000description2
- 238000012512characterization methodMethods0.000description2
- 230000007882cirrhosisEffects0.000description2
- 208000019425cirrhosis of liverDiseases0.000description2
- 238000004590computer programMethods0.000description2
- 230000002596correlated effectEffects0.000description2
- 230000002559cytogenic effectEffects0.000description2
- 230000001419dependent effectEffects0.000description2
- 230000008034disappearanceEffects0.000description2
- 238000002224dissectionMethods0.000description2
- 230000001605fetal effectEffects0.000description2
- 239000012530fluidSubstances0.000description2
- 230000004077genetic alterationEffects0.000description2
- 208000002672hepatitis BDiseases0.000description2
- 238000009169immunotherapyMethods0.000description2
- 210000004072lungAnatomy0.000description2
- 208000020816lung neoplasmDiseases0.000description2
- 238000004949mass spectrometryMethods0.000description2
- 108091070501miRNAProteins0.000description2
- 239000002679microRNASubstances0.000description2
- 238000012986modificationMethods0.000description2
- 230000004048modificationEffects0.000description2
- 210000000056organAnatomy0.000description2
- 102000040430polynucleotideHuman genes0.000description2
- 108091033319polynucleotideProteins0.000description2
- 239000002157polynucleotideSubstances0.000description2
- 238000010837poor prognosisMethods0.000description2
- 230000008569processEffects0.000description2
- 238000012545processingMethods0.000description2
- 230000009467reductionEffects0.000description2
- 230000004044responseEffects0.000description2
- 230000000717retained effectEffects0.000description2
- 238000001228spectrumMethods0.000description2
- 238000007619statistical methodMethods0.000description2
- 238000003860storageMethods0.000description2
- 238000006467substitution reactionMethods0.000description2
- 239000000725suspensionSubstances0.000description2
- 238000002626targeted therapyMethods0.000description2
- 230000004614tumor growthEffects0.000description2
- VGONTNSXDCQUGY-RRKCRQDMSA-N2'-deoxyinosineChemical groupC1[C@H](O)[C@@H](CO)O[C@H]1N1C(N=CNC2=O)=C2N=C1VGONTNSXDCQUGY-RRKCRQDMSA-N0.000description1
- 206010003445AscitesDiseases0.000description1
- 206010061764Chromosomal deletionDiseases0.000description1
- 108091026890Coding regionProteins0.000description1
- 102000001301EGF receptorHuman genes0.000description1
- 108060006698EGF receptorProteins0.000description1
- 108700024394ExonProteins0.000description1
- 241000701044Human gammaherpesvirus 4Species0.000description1
- 108091007412Piwi-interacting RNAProteins0.000description1
- 208000020584PolyploidyDiseases0.000description1
- 108091081062Repeated sequence (DNA)Proteins0.000description1
- 240000003705Senecio vulgarisSpecies0.000description1
- 238000000692Student's t-testMethods0.000description1
- 238000009825accumulationMethods0.000description1
- 230000002411adverseEffects0.000description1
- 238000007844allele-specific PCRMethods0.000description1
- 230000003322aneuploid effectEffects0.000description1
- 208000036878aneuploidyDiseases0.000description1
- 238000010420art techniqueMethods0.000description1
- 230000008901benefitEffects0.000description1
- 210000000941bileAnatomy0.000description1
- 210000001124body fluidAnatomy0.000description1
- 239000010839body fluidSubstances0.000description1
- 230000037396body weightEffects0.000description1
- 108091092356cellular DNAProteins0.000description1
- 238000005119centrifugationMethods0.000description1
- 208000019065cervical carcinomaDiseases0.000description1
- 238000000546chi-square testMethods0.000description1
- 230000001684chronic effectEffects0.000description1
- 108091092240circulating cell-free DNAProteins0.000description1
- 238000010367cloningMethods0.000description1
- 230000000295complement effectEffects0.000description1
- 239000002299complementary DNASubstances0.000description1
- 238000012937correctionMethods0.000description1
- 230000003247decreasing effectEffects0.000description1
- 238000009795derivationMethods0.000description1
- 238000001784detoxificationMethods0.000description1
- 208000035475disorderDiseases0.000description1
- 238000004090dissolutionMethods0.000description1
- 238000001976enzyme digestionMethods0.000description1
- 210000003608feceAnatomy0.000description1
- 238000007672fourth generation sequencingMethods0.000description1
- 230000014509gene expressionEffects0.000description1
- 238000007429general methodMethods0.000description1
- 231100000118genetic alterationToxicity0.000description1
- 238000012268genome sequencingMethods0.000description1
- 230000037442genomic alterationEffects0.000description1
- 238000011331genomic analysisMethods0.000description1
- 238000009499grossingMethods0.000description1
- 208000006454hepatitisDiseases0.000description1
- 231100000283hepatitisToxicity0.000description1
- 210000003917human chromosomeAnatomy0.000description1
- 230000002998immunogenetic effectEffects0.000description1
- 230000006872improvementEffects0.000description1
- 238000003780insertionMethods0.000description1
- 230000037431insertionEffects0.000description1
- 238000011835investigationMethods0.000description1
- 230000000670limiting effectEffects0.000description1
- 210000004185liverAnatomy0.000description1
- 238000013507mappingMethods0.000description1
- 239000003550markerSubstances0.000description1
- 108020004999messenger RNAProteins0.000description1
- 230000001394metastastic effectEffects0.000description1
- 206010061289metastatic neoplasmDiseases0.000description1
- 230000011987methylationEffects0.000description1
- 238000007069methylation reactionMethods0.000description1
- 238000001531micro-dissectionMethods0.000description1
- 238000007838multiplex ligation-dependent probe amplificationMethods0.000description1
- 230000000869mutational effectEffects0.000description1
- 230000017074necrotic cell deathEffects0.000description1
- 108091027963non-coding RNAProteins0.000description1
- 102000042567non-coding RNAHuman genes0.000description1
- 210000004882non-tumor cellAnatomy0.000description1
- 238000009595pap smearMethods0.000description1
- 239000013610patient sampleSubstances0.000description1
- 230000002093peripheral effectEffects0.000description1
- 239000012071phaseSubstances0.000description1
- 210000004910pleural fluidAnatomy0.000description1
- 229920000642polymerPolymers0.000description1
- 229920001184polypeptidePolymers0.000description1
- 239000002243precursorSubstances0.000description1
- 238000002203pretreatmentMethods0.000description1
- 102000004196processed proteins & peptidesHuman genes0.000description1
- 108090000765processed proteins & peptidesProteins0.000description1
- 230000002062proliferating effectEffects0.000description1
- 230000005855radiationEffects0.000description1
- 230000008707rearrangementEffects0.000description1
- 238000011084recoveryMethods0.000description1
- 238000000611regression analysisMethods0.000description1
- 108091008146restriction endonucleasesProteins0.000description1
- 210000003296salivaAnatomy0.000description1
- 238000000926separation methodMethods0.000description1
- 238000007841sequencing by ligationMethods0.000description1
- 210000003765sex chromosomeAnatomy0.000description1
- 238000004513sizingMethods0.000description1
- 239000000344soapSubstances0.000description1
- 239000007787solidSubstances0.000description1
- 239000007790solid phaseSubstances0.000description1
- 241000894007speciesSpecies0.000description1
- 230000007480spreadingEffects0.000description1
- 238000003892spreadingMethods0.000description1
- 238000010561standard procedureMethods0.000description1
- 238000010972statistical evaluationMethods0.000description1
- 238000000528statistical testMethods0.000description1
- 208000024891symptomDiseases0.000description1
- 230000009885systemic effectEffects0.000description1
- 238000012353t testMethods0.000description1
- 210000001138tearAnatomy0.000description1
- 230000001225therapeutic effectEffects0.000description1
- 230000004797therapeutic responseEffects0.000description1
- 231100000588tumorigenicToxicity0.000description1
- 230000000381tumorigenic effectEffects0.000description1
- 229940121358tyrosine kinase inhibitorDrugs0.000description1
- 239000005483tyrosine kinase inhibitorSubstances0.000description1
- 210000002700urineAnatomy0.000description1
- 230000036642wellbeingEffects0.000description1
Images


Classifications
- G—PHYSICS
- G16—INFORMATION AND COMMUNICATION TECHNOLOGY [ICT] SPECIALLY ADAPTED FOR SPECIFIC APPLICATION FIELDS
- G16B—BIOINFORMATICS, i.e. INFORMATION AND COMMUNICATION TECHNOLOGY [ICT] SPECIALLY ADAPTED FOR GENETIC OR PROTEIN-RELATED DATA PROCESSING IN COMPUTATIONAL MOLECULAR BIOLOGY
- G16B20/00—ICT specially adapted for functional genomics or proteomics, e.g. genotype-phenotype associations
- G16B20/20—Allele or variant detection, e.g. single nucleotide polymorphism [SNP] detection
- C—CHEMISTRY; METALLURGY
- C12—BIOCHEMISTRY; BEER; SPIRITS; WINE; VINEGAR; MICROBIOLOGY; ENZYMOLOGY; MUTATION OR GENETIC ENGINEERING
- C12Q—MEASURING OR TESTING PROCESSES INVOLVING ENZYMES, NUCLEIC ACIDS OR MICROORGANISMS; COMPOSITIONS OR TEST PAPERS THEREFOR; PROCESSES OF PREPARING SUCH COMPOSITIONS; CONDITION-RESPONSIVE CONTROL IN MICROBIOLOGICAL OR ENZYMOLOGICAL PROCESSES
- C12Q1/00—Measuring or testing processes involving enzymes, nucleic acids or microorganisms; Compositions therefor; Processes of preparing such compositions
- C12Q1/68—Measuring or testing processes involving enzymes, nucleic acids or microorganisms; Compositions therefor; Processes of preparing such compositions involving nucleic acids
- C12Q1/6809—Methods for determination or identification of nucleic acids involving differential detection
- C—CHEMISTRY; METALLURGY
- C12—BIOCHEMISTRY; BEER; SPIRITS; WINE; VINEGAR; MICROBIOLOGY; ENZYMOLOGY; MUTATION OR GENETIC ENGINEERING
- C12Q—MEASURING OR TESTING PROCESSES INVOLVING ENZYMES, NUCLEIC ACIDS OR MICROORGANISMS; COMPOSITIONS OR TEST PAPERS THEREFOR; PROCESSES OF PREPARING SUCH COMPOSITIONS; CONDITION-RESPONSIVE CONTROL IN MICROBIOLOGICAL OR ENZYMOLOGICAL PROCESSES
- C12Q1/00—Measuring or testing processes involving enzymes, nucleic acids or microorganisms; Compositions therefor; Processes of preparing such compositions
- C12Q1/68—Measuring or testing processes involving enzymes, nucleic acids or microorganisms; Compositions therefor; Processes of preparing such compositions involving nucleic acids
- C12Q1/6869—Methods for sequencing
- C—CHEMISTRY; METALLURGY
- C12—BIOCHEMISTRY; BEER; SPIRITS; WINE; VINEGAR; MICROBIOLOGY; ENZYMOLOGY; MUTATION OR GENETIC ENGINEERING
- C12Q—MEASURING OR TESTING PROCESSES INVOLVING ENZYMES, NUCLEIC ACIDS OR MICROORGANISMS; COMPOSITIONS OR TEST PAPERS THEREFOR; PROCESSES OF PREPARING SUCH COMPOSITIONS; CONDITION-RESPONSIVE CONTROL IN MICROBIOLOGICAL OR ENZYMOLOGICAL PROCESSES
- C12Q1/00—Measuring or testing processes involving enzymes, nucleic acids or microorganisms; Compositions therefor; Processes of preparing such compositions
- C12Q1/68—Measuring or testing processes involving enzymes, nucleic acids or microorganisms; Compositions therefor; Processes of preparing such compositions involving nucleic acids
- C12Q1/6876—Nucleic acid products used in the analysis of nucleic acids, e.g. primers or probes
- C12Q1/6883—Nucleic acid products used in the analysis of nucleic acids, e.g. primers or probes for diseases caused by alterations of genetic material
- C12Q1/6886—Nucleic acid products used in the analysis of nucleic acids, e.g. primers or probes for diseases caused by alterations of genetic material for cancer
- G—PHYSICS
- G16—INFORMATION AND COMMUNICATION TECHNOLOGY [ICT] SPECIALLY ADAPTED FOR SPECIFIC APPLICATION FIELDS
- G16B—BIOINFORMATICS, i.e. INFORMATION AND COMMUNICATION TECHNOLOGY [ICT] SPECIALLY ADAPTED FOR GENETIC OR PROTEIN-RELATED DATA PROCESSING IN COMPUTATIONAL MOLECULAR BIOLOGY
- G16B20/00—ICT specially adapted for functional genomics or proteomics, e.g. genotype-phenotype associations
- G16B20/10—Ploidy or copy number detection
- G—PHYSICS
- G16—INFORMATION AND COMMUNICATION TECHNOLOGY [ICT] SPECIALLY ADAPTED FOR SPECIFIC APPLICATION FIELDS
- G16B—BIOINFORMATICS, i.e. INFORMATION AND COMMUNICATION TECHNOLOGY [ICT] SPECIALLY ADAPTED FOR GENETIC OR PROTEIN-RELATED DATA PROCESSING IN COMPUTATIONAL MOLECULAR BIOLOGY
- G16B30/00—ICT specially adapted for sequence analysis involving nucleotides or amino acids
- G16B30/10—Sequence alignment; Homology search
- C—CHEMISTRY; METALLURGY
- C12—BIOCHEMISTRY; BEER; SPIRITS; WINE; VINEGAR; MICROBIOLOGY; ENZYMOLOGY; MUTATION OR GENETIC ENGINEERING
- C12Q—MEASURING OR TESTING PROCESSES INVOLVING ENZYMES, NUCLEIC ACIDS OR MICROORGANISMS; COMPOSITIONS OR TEST PAPERS THEREFOR; PROCESSES OF PREPARING SUCH COMPOSITIONS; CONDITION-RESPONSIVE CONTROL IN MICROBIOLOGICAL OR ENZYMOLOGICAL PROCESSES
- C12Q2535/00—Reactions characterised by the assay type for determining the identity of a nucleotide base or a sequence of oligonucleotides
- C12Q2535/122—Massive parallel sequencing
- C—CHEMISTRY; METALLURGY
- C12—BIOCHEMISTRY; BEER; SPIRITS; WINE; VINEGAR; MICROBIOLOGY; ENZYMOLOGY; MUTATION OR GENETIC ENGINEERING
- C12Q—MEASURING OR TESTING PROCESSES INVOLVING ENZYMES, NUCLEIC ACIDS OR MICROORGANISMS; COMPOSITIONS OR TEST PAPERS THEREFOR; PROCESSES OF PREPARING SUCH COMPOSITIONS; CONDITION-RESPONSIVE CONTROL IN MICROBIOLOGICAL OR ENZYMOLOGICAL PROCESSES
- C12Q2537/00—Reactions characterised by the reaction format or use of a specific feature
- C12Q2537/10—Reactions characterised by the reaction format or use of a specific feature the purpose or use of
- C12Q2537/165—Mathematical modelling, e.g. logarithm, ratio
- C—CHEMISTRY; METALLURGY
- C12—BIOCHEMISTRY; BEER; SPIRITS; WINE; VINEGAR; MICROBIOLOGY; ENZYMOLOGY; MUTATION OR GENETIC ENGINEERING
- C12Q—MEASURING OR TESTING PROCESSES INVOLVING ENZYMES, NUCLEIC ACIDS OR MICROORGANISMS; COMPOSITIONS OR TEST PAPERS THEREFOR; PROCESSES OF PREPARING SUCH COMPOSITIONS; CONDITION-RESPONSIVE CONTROL IN MICROBIOLOGICAL OR ENZYMOLOGICAL PROCESSES
- C12Q2545/00—Reactions characterised by their quantitative nature
- C12Q2545/10—Reactions characterised by their quantitative nature the purpose being quantitative analysis
- C12Q2545/114—Reactions characterised by their quantitative nature the purpose being quantitative analysis involving a quantitation step
- C—CHEMISTRY; METALLURGY
- C12—BIOCHEMISTRY; BEER; SPIRITS; WINE; VINEGAR; MICROBIOLOGY; ENZYMOLOGY; MUTATION OR GENETIC ENGINEERING
- C12Q—MEASURING OR TESTING PROCESSES INVOLVING ENZYMES, NUCLEIC ACIDS OR MICROORGANISMS; COMPOSITIONS OR TEST PAPERS THEREFOR; PROCESSES OF PREPARING SUCH COMPOSITIONS; CONDITION-RESPONSIVE CONTROL IN MICROBIOLOGICAL OR ENZYMOLOGICAL PROCESSES
- C12Q2600/00—Oligonucleotides characterized by their use
- C12Q2600/156—Polymorphic or mutational markers
- C—CHEMISTRY; METALLURGY
- C12—BIOCHEMISTRY; BEER; SPIRITS; WINE; VINEGAR; MICROBIOLOGY; ENZYMOLOGY; MUTATION OR GENETIC ENGINEERING
- C12Q—MEASURING OR TESTING PROCESSES INVOLVING ENZYMES, NUCLEIC ACIDS OR MICROORGANISMS; COMPOSITIONS OR TEST PAPERS THEREFOR; PROCESSES OF PREPARING SUCH COMPOSITIONS; CONDITION-RESPONSIVE CONTROL IN MICROBIOLOGICAL OR ENZYMOLOGICAL PROCESSES
- C12Q2600/00—Oligonucleotides characterized by their use
- C12Q2600/172—Haplotypes
Landscapes
- Life Sciences & Earth Sciences (AREA)
- Chemical & Material Sciences (AREA)
- Health & Medical Sciences (AREA)
- Engineering & Computer Science (AREA)
- Physics & Mathematics (AREA)
- Proteomics, Peptides & Aminoacids (AREA)
- Bioinformatics & Cheminformatics (AREA)
- Analytical Chemistry (AREA)
- Organic Chemistry (AREA)
- General Health & Medical Sciences (AREA)
- Biotechnology (AREA)
- Biophysics (AREA)
- Genetics & Genomics (AREA)
- Molecular Biology (AREA)
- Zoology (AREA)
- Wood Science & Technology (AREA)
- Bioinformatics & Computational Biology (AREA)
- Theoretical Computer Science (AREA)
- Spectroscopy & Molecular Physics (AREA)
- Medical Informatics (AREA)
- Evolutionary Biology (AREA)
- Immunology (AREA)
- General Engineering & Computer Science (AREA)
- Microbiology (AREA)
- Biochemistry (AREA)
- Pathology (AREA)
- Hospice & Palliative Care (AREA)
- Oncology (AREA)
- Measuring Or Testing Involving Enzymes Or Micro-Organisms (AREA)
- Investigating Or Analysing Biological Materials (AREA)
- Chemical Kinetics & Catalysis (AREA)
- Algebra (AREA)
- General Physics & Mathematics (AREA)
- Mathematical Analysis (AREA)
- Mathematical Optimization (AREA)
- Mathematical Physics (AREA)
- Pure & Applied Mathematics (AREA)
- Apparatus Associated With Microorganisms And Enzymes (AREA)
- Polysaccharides And Polysaccharide Derivatives (AREA)
Abstract
Translated fromKorean
Description
Translated fromKorean본 발명은 유기체(생물)로부터 나온 생물학적 시료에서 유전적 또는 분자적 이상들 (aberrations)을 결정하는 시스템들, 장치, 및 방법들이 제공된다. 무세포 DNA 단편들을 포함하는 생물학적 시료들이, 예로 종양에서 결실들 및/또는 증폭들로 인한 염색체 부위들에서 불균형들을 확인하도록 분석된다. 복수의 좌위들이 각 염색체 부위로 사용된다. 다음으로 이러한 불균형들은 환자를 암에 대해 진단 (검색)할 뿐만 아니라 암을 가진 환자를 예후 판단 (prognosticate)하거나, 환자에서 전암성 병태의 존재를 검출하거나 이의 진행을 감시하는 데 사용될 수 있다. 불균형의 중증도뿐만 아니라 불균형을 나타내는 부위들의 수도 사용될 수 있다. 게놈의 비-중복 분절들의 체계적인 분석은 시료를 위한 일반적인 검색 도구를 제공한다. 추가적으로, 환자는 진행을 (예로, 치료 이후에) 검색하고 예후를 판단할 뿐만 아니라 감시하는 것을 허용하는 하나 이상의 염색체 부위들 각각의 중등도 및 염색체 부위들의 수를 추적하도록 계속 (over time) 테스트될 수 있다.The present invention provides systems, devices, and methods for determining genetic or molecular aberrations in a biological sample from an organism (organism). Biological samples containing cell-free DNA fragments are analyzed to identify imbalances in chromosomal regions due to, for example, deletions and/or amplifications in a tumor. Multiple loci are used for each chromosomal region. These imbalances can then be used not only to diagnose (detect) a patient for cancer, but also to prognosticate a patient with cancer, to detect the presence of a precancerous condition in a patient, or to monitor its progression. Not only the severity of the imbalance, but also the number of sites exhibiting the imbalance can be used. Systematic analysis of non-overlapping segments of the genome provides a general search tool for samples. Additionally, the patient may be tested over time to track the severity of each of the one or more chromosomal regions and to track the number of chromosomal regions to detect progression (eg, after treatment) and to determine prognosis as well as monitor. have.
암은 많은 사람들을 침범하는 공통적인 질환이다. 종종 암은 심각한 증상들의 소견을 보일 때까지 확인되지 않는다. 공통적인 유형들의 암의 경우, 암을 가질 수 있는 환자들을 확인하는 검색 기법들이 있다. 그러나, 이러한 기법들은 종종 신뢰할만하지 못하거나 환자를 방사선 조사에 놓이게 한다. 다른 유형들의 많은 암들의 경우는, 효과적인 검색 기법들이 전혀 없다.Cancer is a common disease that affects many people. Often, cancer is not identified until severe symptoms appear. For common types of cancer, there are search techniques that identify patients who may have cancer. However, these techniques are often unreliable or subject the patient to irradiation. For many other types of cancer, there are no effective screening techniques.
이형접합의 소실 (LOH)이 폐, 및 두경부 암들을 앓고 있는 환자들의 순환 DNA (circulating DNA)에 있는 특정한 좌위의 경우에 검출된 바 있었다 (Chen XQ, et al. Nat Med 1996; 2: 1033-5; Nawroz H,et al. Nat Med 1996; 2: 1035-7). 그러나, 이러한 기법들은 검출가능하였던 LOH의 양이 비교적 적음으로 인해 특정한 좌위를 조사하는 것이 방해를 되었다. 디지탈 PCR을 사용할 때에도, 이들 방법들은 적은 양들의 LOH를 검출하는 무능력으로 인해 여전히 실패하고 있다. 게다가, 이러한 기법들은 특이적 유형의 암에서 발생하는 것으로 알려진 특정한 좌위를 연구하는 데는 여전히 한계가 있었다. 따라서, 보편적으로 암을 검색하는 것은 가능하지 않거나 효과적이지 않았다.Loss of heterozygosity (LOH) has been detected in the case of a specific locus in the circulating DNA of patients suffering from lung and head and neck cancers (Chen XQ, et al. Nat Med 1996; 2: 1033- 5; Nawroz H, et al. Nat Med 1996; 2: 1035-7). However, these techniques have hindered the investigation of specific loci due to the relatively small amount of detectable LOH. Even when using digital PCR, these methods still fail due to their inability to detect small amounts of LOH. Moreover, these techniques are still limited in their ability to study specific loci known to occur in specific types of cancer. Therefore, it was not possible or effective to search for cancer universally.
암의 존재를 검색하는 것 이외에도, 최신의 기법들은 암을 가진 환자의 예후를 판단하고 치료의 효과들을 감시하는 데 있어서는 부족하다 (예로, 수술 또한 화학요법 또는 면역요법 또는 표적화 요법 이후의 회복). 이러한 기법들은 종종 비싸거나 (예로, 영상화 기법들), 부정확하거나, 비효과적이거나, 민감도가 떨어지거나 영상화 기법들에 사용되는 방사선 조사에 환자를 노출시킬 수 있다.In addition to detecting the presence of cancer, state-of-the-art techniques are lacking in determining the prognosis of patients with cancer and monitoring the effects of treatment (eg, surgery or recovery after chemotherapy or immunotherapy or targeted therapy). These techniques can often be expensive (eg, imaging techniques), inaccurate, ineffective, have poor sensitivity, or expose the patient to radiation used in imaging techniques.
따라서, 환자에게 암을 검색하고, 예후를 판단하고 또한 감시하는 새로운 기법들을 제공하는 것이 바람직하다.Therefore, it would be desirable to provide patients with new techniques to screen for cancer, determine the prognosis, and also monitor.
본 출원은 2010년 11월 30일자로 제출된 "암과 연관된 유전적 이상들의 검출 (Detection of genetic aberrations associated with cancer)"이라는 명칭을 가지는 미국 가특허출원 제 61/418,391호, 및 2011년 8월 31일자로 제출된 "암과 연관된 유전적 또는 분자적 이상들의 검출 (Detection of genetic or molecular aberrations associated with cancer)"이라는 명칭을 가지는 미국 가특허출원 제 61/529,877호로부터 우선권을 주장하고 또한 이들의 비-예비적 출원이며, 그들 내용들 전부가 본 명세서에서 모든 목적들을 위한 참고문헌으로 통합되어 있다.This application relates to U.S. Provisional Patent Application No. 61/418,391, entitled "Detection of genetic aberrations associated with cancer," filed on November 30, 2010, and August 2011. Claims priority from, and claims priority to, U.S. Provisional Patent Application Serial No. 61/529,877, entitled "Detection of genetic or molecular aberrations associated with cancer," filed on the 31st It is a non-preliminary application, the contents of which are incorporated herein by reference for all purposes.
본 출원은 공동 소유되어 있는 2010년 11월 5일자로 제출된 로 등 (Lo et al.)에 의한 "크기-기초 게놈 분석 (Size-Based Genomic Analysis)"(변리사 서류번호 제 80015-794101/006610US호)이라는 명칭을 가지는 미국 특허출원 제 12/940,992호 (미국 공고번호 제 2011/0276277호), 및 2010년 11월 5일자로 제출된 로 등에 의한 "모성의 생물학적 시료로부터 태아 게놈 분석 (Fetal Genomic Analysis From A Maternal Biological Sample)"(변리사 서류번호 제 80015-794103/006710US호)이라는 명칭을 가지는 미국 특허출원 제 12/940,993호 (미국 공고번호 제 2011/0105353호)에 관한 것이고, 그들의 기재내용들은 전부가 참고문헌으로 통합되어 있다.This application is a jointly owned "Size-Based Genomic Analysis" by Lo et al., filed Nov. 5, 2010, filed Nov. 5, 2010 (Patent Attorney Docket No. 80015-794101/006610US) U.S. Patent Application No. 12/940,992 (U.S. Publication No. 2011/0276277), entitled "Fetal Genomic from a maternal biological sample" by Ro et al., filed on November 5, 2010 Analysis From A Maternal Biological Sample)" (Patent Attorney Docket No. 80015-794103/006710US) relates to U.S. Patent Application No. 12/940,993 (U.S. Publication No. 2011/0105353), and their descriptions are All are incorporated by reference.
구현예들은 암과 연관된 이상들 (aberrations)을 결정하는 시스템들, 장치, 및 방법들을 제공한다. 무세포 DNA (cell-free DNA) 단편들을 포함하는 생물학적 시료들이, 예로 종양에서 결실들 및/또는 증폭들로 인한 염색체 부위들에서 불균형들 (imbalances)을 확인하도록 분석된다. 복수의 좌위들을 가지는 염색체 부위를 사용하는 것은 더 큰 효율 및/또는 정확도를 허용할 수 있다. 다음으로 이러한 분균형들은 환자를 암에 대해 진단하거나 검색할 뿐만 아니라 암을 가진 환자를 예후 판단 (prognosticate)하는 데 사용될 수 있다. 불균형의 중증도 (severity)뿐만 아니라 불균형을 나타내는 부위들의 수도 사용될 수 있다. 추가적으로, 환자는 진행을 (예로, 치료 이후) 검색하고 예후를 판단할 뿐만 아니라 감시하는 것을 허용하는 하나 이상의 염색체 부위들 각각의 중증도 및 염색체 부위들의 수를 추적하도록 계속 (over time) 테스트될 수 있다.Embodiments provide systems, apparatus, and methods for determining aberrations associated with cancer. Biological samples containing cell-free DNA fragments are analyzed to identify imbalances in chromosomal regions due to, for example, deletions and/or amplifications in tumors. Using a chromosomal region having multiple loci may allow for greater efficiency and/or accuracy. These balances can then be used to diagnose or screen a patient for cancer as well as prognosticate a patient with cancer. Not only the severity of the imbalance, but also the number of regions exhibiting the imbalance can be used. Additionally, the patient may be tested over time to track the severity of each of the one or more chromosomal regions and the number of chromosomal regions to monitor progression (eg, after treatment) and to determine prognosis as well as monitor. .
한 가지 구현예에 따르면, 암과 연관된 염색체 결실들 또는 증폭들에 대해 유기체(organism)의 생물학적 시료를 분석하는 방법이 제공된다. 생물학적 시료는 정상 세포들로부터, 및 잠재적으로는 암과 연관된 세포들로부터 기원한 핵산 분자들을 포함한다. 적어도 일정의(some) 핵산 분자들은 시료에서 무세포 상태로 존재한다. 첫 번째 및 두 번째 반수체형들 (haplotypes)이 첫 번째 염색체 부위에서 유기체의 정상 세포들을 위해 결정된다. 첫 번째 염색체 부위는 첫 번째 다수의 이종접합 좌위들을 포함한다. 시료에서 각(each) 다수의 핵산 분자들은 확인된 유기체의 기준 게놈에서 위치를 가지고 또한 결정된 개별(respective) 대립인자를 가진다. 위치들 및 결정된 대립인자들은 첫 번째 반수체형으로부터 나온 핵산 분자들의 첫 번째 그룹 및 두 번째 반수체형으로부터 나온 핵산 분자들의 두 번째 그룹을 결정하는 데 사용된다. 컴퓨터 시스템은 첫 번째 그룹의 첫 번째 수치 및 두 번째 그룹의 두 번째 수치를 계산한다. 각 수치는 핵산 분자들의 개별 그룹의 특성을 정의하였다 (예로, 그룹에서 분자들의 평균 크기 및 수). 첫 번째 수치는 첫 번째 염색체 부위가 암과 연관된 임의의(any) 세포들에서 결실 또는 증폭을 나타내지는 여부의 분류를 결정하도록 두 번째 수치와 비교된다.According to one embodiment, a method of analyzing a biological sample of an organism for chromosomal deletions or amplifications associated with cancer is provided. Biological samples include nucleic acid molecules originating from normal cells, and potentially from cells associated with cancer. At least some nucleic acid molecules are present in the sample in a cell-free state. First and second haplotypes are determined for normal cells of the organism at the first chromosomal region. The first chromosomal region contains the first plurality of heterozygous loci. Each number of nucleic acid molecules in the sample has a location in the reference genome of the identified organism and also has a respective allele determined. The positions and the determined alleles are used to determine the first group of nucleic acid molecules from the first haplotype and the second group of nucleic acid molecules from the second haplotype. The computer system calculates the first number of the first group and the second number of the second group. Each number defined a characteristic of an individual group of nucleic acid molecules (eg, the average size and number of molecules in the group). The first number is compared to the second number to determine whether the first chromosomal region exhibits deletion or amplification in any cells associated with cancer.
또 다른 구현예에 따르면, 유기체의 생물학적 시료를 분석하는 방법이 제공된다. 생물학적 시료는 정상 세포들로부터, 및 잠재적으로는 암과 연관된 세포들로부터 기원한 핵산 분자들을 포함한다. 적어도 일정의 핵산 분자들은 시료에서 무세포 상태로 존재한다. 유기체의 다수의 비-중복 염색체 부위들이 확인된다. 각 염색체 부위는 다수의 좌위들을 포함한다. 시료에서 각 다수의 핵산 분자들은 확인된 유기체의 기준 게놈에서 위치를 가진다. 각 염색체 부위를 위해, 핵산 분자들의 개별 그룹은 확인된 위치들을 기초로 하여 염색체 부위로부터 나온 것으로서 확인된다. 각 개별 그룹은 염색체 부위의 각 다수의 좌위들에 위치한 적어도 하나의 핵산 분자를 포함한다. 컴퓨터 시스템은 개별 그룹의 핵산 분자들의 특성을 정의하는 개별 그룹의 개별 수치를 계산한다. 개별 수치는 염색체 부위가 결실 또는 증폭을 나타내지는 여부의 분류를 결정하도록 기준 수치와 비교된다. 다음으로 결실 또는 증폭을 나타내는 것으로서 분류된 염색체 부위들의 양이 결정된다.According to another embodiment, a method of analyzing a biological sample from an organism is provided. Biological samples include nucleic acid molecules originating from normal cells, and potentially from cells associated with cancer. At least some nucleic acid molecules exist in a cell-free state in the sample. A number of non-overlapping chromosomal regions of an organism are identified. Each chromosomal region contains multiple loci. Each of the plurality of nucleic acid molecules in the sample has a location in the reference genome of the identified organism. For each chromosomal region, a separate group of nucleic acid molecules is identified as originating from the chromosomal region based on the identified positions. Each individual group comprises at least one nucleic acid molecule located at each of a plurality of loci in a chromosomal region. The computer system calculates individual values of the individual groups that define the properties of the nucleic acid molecules of the individual groups. Individual values are compared to reference values to determine whether a chromosomal region exhibits deletion or amplification. The amount of chromosomal regions classified as representing deletion or amplification is then determined.
또 다른 구현예에 따르면, 정상 세포들로부터, 및 잠재적으로는 암과 연관된 세포들로부터 기원한 핵산 분자들을 포함하는 생물학적 시료들을 사용하여 유기체에서 염색체 이상들의 진행을 결정하는 방법이 제공된다. 적어도 일정의 핵산 분자들은 생물학적 시료들에서 무세포 상태로 존재한다. 하나 이상의 비-중복 염색체 부위들이 유기체의 기준 게놈을 위해 확인된다. 각 염색체 부위는 다수의 좌위들을 포함한다. 서로 다른 시간대에서 채취된 시료들은 진행을 결정하도록 분석된다. 시료를 위해, 시료에 있는 각 다수의 핵산 분자들은 확인된 유기체의 기준 게놈에서 위치를 가진다. 각 염색체 부위를 위해, 핵산 분자들의 개별 그룹은 확인된 위치들을 기초로 하여 염색체 부위로부터 나온 것으로서 확인된다. 각 개별 그룹은 염색체 부위의 각 다수의 좌위들에 위치한 적어도 하나의 핵산 분자를 포함한다. 컴퓨터 시스템은 핵산 분자들의 개별 그룹의 개별 수치를 계산한다. 개별 수치는 개별 그룹의 핵산 분자들의 특성을 정의한다. 개별 수치는 첫 번째 염색체 부위가 결실 또는 증폭을 나타내지는 여부의 분류를 결정하도록 기준 수치와 비교된다. 다음으로 다수의 시간대에서의 각 염색체 부위들의 분류들은 유기체에서 염색체 이상들의 진행을 결정하는 데 사용된다.According to another embodiment, a method is provided for determining the progression of chromosomal abnormalities in an organism using biological samples comprising nucleic acid molecules originating from normal cells, and potentially from cells associated with cancer. At least some nucleic acid molecules exist in a cell-free state in biological samples. One or more non-overlapping chromosomal regions are identified for a reference genome of an organism. Each chromosomal region contains multiple loci. Samples taken at different time points are analyzed to determine progression. For a sample, each of the plurality of nucleic acid molecules in the sample has a location in the reference genome of the identified organism. For each chromosomal region, a separate group of nucleic acid molecules is identified as originating from the chromosomal region based on the identified positions. Each individual group comprises at least one nucleic acid molecule located at each of a plurality of loci in a chromosomal region. The computer system calculates individual values of individual groups of nucleic acid molecules. Individual values define the properties of individual groups of nucleic acid molecules. Individual values are compared to reference values to determine whether the first chromosomal region exhibits a deletion or amplification. Classifications of each chromosomal region at multiple time points are then used to determine the progression of chromosomal abnormalities in an organism.
본 발명의 다른 구현예들은 본 명세서에서 기술된 방법들과 연관된 시스템들, 휴대용 사용자 장치들, 및 컴퓨터 판독가능한 매체들을 지향한다.Other implementations of the invention are directed to systems, portable user devices, and computer readable media associated with the methods described herein.
본 발명의 본질 및 장점들의 보다 나은 이해는 다음의 상세한 설명 및 첨부된 도면들을 참고하여 구할 수 있다.A better understanding of the nature and advantages of the present invention may be obtained by reference to the following detailed description and accompanying drawings.
정의들definitions
본 명세서에서 사용되는 바, 용어 "생물학적 시료 (biological sample)"는 개체 (예로, 인간, 암을 가진 사람, 암을 가진 것으로 의심되는 사람, 또는 기타 유기체들)로부터 채취되고 하나 이상의 관심 있는 핵산 분자들을 포함하는 시료라면 모두를 말한다.As used herein, the term "biological sample" refers to one or more nucleic acid molecules of interest taken from a subject (eg, a human, a person having cancer, a person suspected of having cancer, or other organisms). All samples containing
용어 "핵산 (nucleic acid)" 또는 "폴리뉴클레오타이드 (polynucleotide)"는 단일- 또는 이중가닥 둘 중 하나의 형태로 데옥시리보핵산 (DNA) 또는 리보핵산 (RNA) 및 그의 중합체를 말한다. 특정하게 제한되지 않는 경우라면, 본 용어는 기준 핵산과 유사한 결합 특성들을 가지고 자연적으로 발생하는 뉴클레오타이드들과 유사한 방식으로 대사되는 천연의 뉴클레오타이드들의 기지의 유사체들을 포함하는 핵산들을 포괄한다. 달리 표시되지 않는 경우라면, 특정한 핵산 서열은 보존적으로 변형된 그의 변이체들 (예로, 중복성 (degenerate) 코돈 치환들), 대립인자들, 오소로그체 (orthologs), 단일 뉴클레오타이드 다형성들 (SNPs), 사본수 변이체들, 및 상보적 서열들뿐만 아니라 분명하게 표시된 서열도 역시 명확하게 포괄하고 있다. 상세하게, 중복성 코돈 치환들은 하나 이상의 선택된 (또는 모든) 코돈들의 세 번째 자리가 혼합-염기 및/또는 데옥시이노신 잔기들로 치환된 서열들을 생성하여 달성될 수 있다 (Batzeret al.,Nucleic Acid Res.19: 5081 (1991); Ohtsukaet al.,J.Biol.Chem.260: 2605-2608 (1985); 및 Rossoliniet al.,Mol. Cell. Probes8:91-98 (1994)). 용어 핵산은, 이에 제한되는 것은 아니지만 유전자, cDNA, mRNA, 작은 비코딩 RNA, 마이크로 RNA (miRNA), 피위-상호작용 (Piwi-interacting) RNA, 또한 유전자 또는 좌위에 의해 인코드되는 짧은 헤어핀 RNA (shRNA):를 포괄한다.The term “nucleic acid” or “polynucleotide” refers to deoxyribonucleic acid (DNA) or ribonucleic acid (RNA) and polymers thereof in either single- or double-stranded form. Unless specifically limited, the term encompasses nucleic acids comprising known analogs of natural nucleotides that have binding properties similar to those of a reference nucleic acid and are metabolized in a manner similar to naturally occurring nucleotides. Unless otherwise indicated, a particular nucleic acid sequence contains conservatively modified variants thereof (e.g., degenerate codon substitutions), alleles, orthologs, single nucleotide polymorphisms (SNPs), Copy number variants and complementary sequences as well as clearly marked sequences are also expressly encompassed. Specifically, overlapping codon substitutions can be achieved by generating sequences in which the third position of one or more selected (or all) codons is substituted with mixed-base and/or deoxyinosine residues (Batzeret al .,Nucleic Acid). Res.19 : 5081 (1991); Ohtsukaet al .,J.Biol.Chem.260 : 2605-2608 (1985); and Rossoliniet al .,Mol. Cell. Probes8 : 91-98 (1994)). The term nucleic acid includes, but is not limited to, gene, cDNA, mRNA, small non-coding RNA, micro RNA (miRNA), Piwi-interacting RNA, also short hairpin RNA encoded by a gene or locus ( shRNA):
용어 "유전자 (gene)"는 폴리펩타이드 사슬 또는 전사된 RNA 산물을 생산하는 데 관여하는 DNA의 분절을 의미한다. 이것은 선행하는 부위들 및 이어지는 코딩 부위 (리더 및 트레일러)뿐만 아니라 개별적 코딩 분절들 (엑손들) 사이의 개입 서열들 (인트론들)을 포함할 수 있다.The term “gene” refers to a segment of DNA that is involved in producing a polypeptide chain or a transcribed RNA product. It can include preceding and subsequent coding regions (leader and trailer) as well as intervening sequences (introns) between individual coding segments (exons).
본 명세서에서 사용되는 바, 용어 "임상적으로 적절한 핵산 서열" 또는 "임상적으로 적절한 염색체 부위" (또는 테스트된 부위/분절)는 잠재적인 불균형이 테스트되고 있는 더 큰 게놈 서열의 분절 또는 더 큰 게놈 서열 자체에 해당하는 폴리뉴클레오타이드 서열을 말할 수 있다. 예들로는 결실 또는 증폭되거나 잠재적으로 결실 또는 증폭되는 (단순한 중복을 포함) 게놈 분절들, 또는 분절의 소부위 (subregion)을 포함하는 더 큰 부위를 포함한다. 일정 구현예들에서, 복수의 임상적으로 적절한 핵산 서열, 또는 동등하게 임상적으로 적절한 핵산 서열의 복수의 마커들은 부위에서 불균형을 검출하는 데이타를 제공하는 데 사용될 수 있다. 예를 들어, 염색체 상의 5개 비연속 서열들로부터 나온 데이타는 가능한 불균형의 결정을 위한 추가적인 방식에 사용될 수 있고, 효과적으로 필요한 시료 부피를 1/5로 감소시킨다.As used herein, the term “clinically relevant nucleic acid sequence” or “clinically relevant chromosomal region” (or tested region/segment) refers to a segment of a larger genomic sequence or larger genomic sequence for which a potential imbalance is being tested. It may refer to a polynucleotide sequence corresponding to the genome sequence itself. Examples include genomic segments that are deleted or amplified or potentially deleted or amplified (including simple duplications), or larger regions comprising subregions of segments. In some embodiments, a plurality of markers of a plurality of clinically relevant nucleic acid sequences, or equally clinically relevant nucleic acid sequences, can be used to provide data for detecting an imbalance at a site. For example, data from five non-contiguous sequences on a chromosome can be used in an additional way for the determination of possible imbalances, effectively reducing the required sample volume by one-fifth.
본 명세서에서 사용되는 바, 용어 "기준 핵산 서열 (reference nucleic acid sequence)" 또는 "기준 염색체 부위 (reference chromosomal region)"는 테스트 부위에 대해 정량적 프로파일 또는 크기 분포를 비교하는 데 사용되는 핵산 서열을 말한다. 기준 핵산 서열의 예들로는 결실 또는 증폭을 포함하지 않는 염색체 부위, 게놈 전부 (예로, 전체 서열결정된 태그 계수들에 의한 정상화를 통함), 정상이라고 알려진 하나 이상의 시료들로부터 나온 부위 (테스트되는 시료의 경우 동일한 부위일 수 있음), 또는 염색체 부위의 특정한 반수체형을 포함한다. 이러한 기준 핵산 서열들은 시료에 내인적으로 존재하거나, 시료 가공 또는 분석 동안 외인적으로 첨가될 수 있다. 일정 구현예들에서, 기준 염색체 부위는 질환이 없는 건강한 상태를 대표하는 크기 프로파일을 보여준다. 보다 다른 구현예들에서, 기준 염색체 부위는 질환이 없는 건강한 상태를 대표하는 정량적 프로파일을 보여준다.As used herein, the term "reference nucleic acid sequence" or "reference chromosomal region" refers to a nucleic acid sequence used to compare a quantitative profile or size distribution to a test site. . Examples of reference nucleic acid sequences include chromosomal regions that do not contain deletions or amplifications, the entire genome (e.g., via normalization by total sequenced tag coefficients), and regions from one or more samples known to be normal (for the sample being tested). may be the same region), or a particular haplotype of a chromosomal region. Such reference nucleic acid sequences may be present endogenously in the sample or may be added exogenously during sample processing or analysis. In some embodiments, the reference chromosomal region exhibits a size profile that is representative of a disease-free healthy state. In yet other embodiments, the reference chromosomal region exhibits a quantitative profile representative of a disease-free healthy state.
본 명세서에서 사용되는 바, 용어 "기초로 하는 (based on)"은 "적어도 부분적으로는 기초로 하는"을 의미하고, 방법의 입력정보 및 방법의 출력정보의 관계에서 발생하는 것과 같은 또 다른 수치의 결정에 사용되는 하나의 수치 (또는 결과)를 말한다. 본 명세서에서 사용되는 바, 용어 "유래하다 (derive)"는 유래가 공식의 계산일 때 발생하는 것과 같은 방법의 입력정보 및 방법의 출력정보의 관계도 역시 말한다.As used herein, the term "based on" means "based at least in part refers to a single numerical value (or result) used in the determination of As used herein, the term "derive" also refers to the relationship between the input information of a method and the output information of the method as occurs when the derivation is the calculation of a formula.
본 명세서에서 사용되는 바, 용어 "매개변수 (parameter)"는 정량적 데이타 집합 및/또는 정량적 데이타 집합들 간의 수적인 관계를 특징 분석하는 수적인 수치를 의미한다. 예를 들어, 첫 번째 핵산 서열의 첫 번째 양 및 두 번째 핵산 서열의 두 번째 양의 비율 (또는 비율의 함수)이 매개변수이다.As used herein, the term “parameter” means a numerical value that characterizes a quantitative data set and/or a numerical relationship between quantitative data sets. For example, a ratio (or a function of a ratio) of a first amount of a first nucleic acid sequence and a second amount of a second nucleic acid sequence is a parameter.
본 명세서에서 사용되는 바, 용어 "좌위 (locus)" 또는 그의 복수 형태 "좌위들 (loci)"은 게놈들을 통틀어 변이를 가질 수 있는 뉴클레오타이드들 (또는 염기쌍들)의 길이라면 모두의 위치 또는 주소이다.As used herein, the term “locus” or its plural form “loci” is the location or address of any length of nucleotides (or base pairs) that may have variation throughout genomes. .
본 명세서에서 사용되는 바, 용어 "서열 불균형 (sequence imbalance)" 또는 "이상 (aberration)"은 임상적으로 적절한 염색체 부위의 정량에서 적어도 하나의 컷오프 수치에 의해 정의되는 바와 같은 기준 정량으로부터 유의한 편차라면 모두를 의미한다. 서열 불균형은 염색체 용량 불균형, 대립인자 불균형, 돌연변이 용량 불균형, 사본수 불균형, 반수체 용량 불균형, 및 기타 유사한 불균형들을 포함할 수 있다. 한 가지 예로서, 대립인자 불균형은 종양이 게놈에서 결실된 유전자의 하나의 대립인자 또는 증폭된 유전자의 하나의 대립인자 또는 두 개의 대립인자들의 차별적인 증폭을 가지고, 이로 인해 시료에 있는 특정한 좌위에서 불균형을 생성할 때 발생할 수 있다. 또 다른 예로서, 환자는 종양 억제 유전자 (tumor suppressor gene)에서 유전된 돌연변이를 가질 수 있다. 그러면 환자는 종양 억제 유전자의 비-변이된 대립인자가 결실된 종양을 계속해서 발생시킬 수 있다. 따라서, 종양 내에서는 돌연변이 용량 불균형이 존재한다. 종양이 환자의 혈장 내로 그의 DNA를 방출할 때, 종양 DNA는 혈장에서 환자의 전신발현 DNA (정상 세포들로부터 나옴)와 혼합될 것이다. 본 명세서에서 기술된 방법들의 사용을 통하여, 혈장에 있는 본 DNA 혼합물의 변이성 용량 불균형은 검출될 수 있다.As used herein, the term “sequence imbalance” or “aberration” refers to a significant deviation from a reference quantitation as defined by at least one cutoff value in the quantification of a clinically relevant chromosomal region. Ramen means everything. Sequence imbalances may include chromosomal dose imbalances, allele imbalances, mutation dose imbalances, copy number imbalances, haploid dose imbalances, and other similar imbalances. As one example, an allelic disequilibrium is when the tumor has differential amplification of one allele of a deleted gene or one or both alleles of an amplified gene in the genome, thereby resulting in a specific locus in the sample. This can happen when creating an imbalance. As another example, a patient may have an inherited mutation in a tumor suppressor gene. The patient can then continue to develop tumors in which the non-mutated allele of the tumor suppressor gene is deleted. Thus, there is a mutational dose imbalance within the tumor. When a tumor releases its DNA into a patient's plasma, the tumor DNA will mix with the patient's systemically expressed DNA (from normal cells) in the plasma. Through the use of the methods described herein, variable dose imbalances of the present DNA mixture in plasma can be detected.
본 명세서에서 사용되는 바, 용어 "반수체형 (haplotype)"은 동일한 염색체 또는 염색체 부위 상에 다함께 전달되는 복수의 좌위들에 있는 대립인자들의 조합을 말한다. 반수체형은 한 쌍의 좌위들 만큼이나 작은 부위 또는 염색체 부위 또는 전체 염색체를 말한다. 용어 "대립인자들 (alleles)"는 서로 다른 표현형 형질들을 가져오거나 가져올 수 없는, 동일한 생리학적 게놈 좌위에서 대안의 DNA 서열들을 말한다. 각 염색체의 두 개 사본들 (수컷 인간 개체에서 성 염색체를 제외함)을 가진 특정한 이수성 (diploid) 유기체라면 모두에서, 각 유전자의 유전형은 동형접합체들에서는 동일하고 이형접합체들에서는 서로 다른, 해당 좌위에 존재하는 대립인자들의 쌍을 포함한다. 유기체들의 집단 또는 종은 전형적으로 다양한 개인들 중에 있는 각 좌위에서 복수의 대립인자들을 포함한다. 하나 이상의 대립인자가 집단에서 발견되는 게놈 좌위는 다형성 부위라고 말한다. 좌위에서 대립인자 다양성 (variation)는 존재하는 대입인자들의 수 (예로, 다형성의 정도), 또는 집단에서 이형접합들의 비율 (예로, 이형접합율)로서 측정가능하다. 본 명세서에서 사용되는 바, 용어 "다형성 (polymorphism)"은 그의 빈도와는 상관없이 인간 게놈에서 개인 간의 다양성이라면 모두를 말한다. 이러한 다양성의 예들로는, 이에 제한되는 것은 아니지만 단일 뉴클레오타이드 다형성, 단순 일렬 반복서열 다형성들, 삽입-결실 다형성들, 돌연변이들 (질환을 유발할 수 있음) 및 사본수 다양성들을 포함한다.As used herein, the term “haplotype” refers to a combination of alleles at multiple loci that are transmitted together on the same chromosome or chromosomal region. A haplotype refers to a region or chromosomal region or entire chromosome as small as a pair of loci. The term “alleles” refers to alternative DNA sequences at the same physiological genomic locus that may or may not result in different phenotypic traits. In any particular diploid organism with two copies of each chromosome (except the sex chromosome in male human individuals), the genotype of each gene is the same in homozygotes and different in heterozygous loci Includes pairs of alleles present in A population or species of organisms typically contains multiple alleles at each locus among various individuals. A genomic locus in which more than one allele is found in a population is said to be a polymorphic site. Allelic variation at a locus is measurable either as the number of alleles present (eg, degree of polymorphism), or as the proportion of heterozygotes in a population (eg, heterozygosity). As used herein, the term "polymorphism" refers to any variability between individuals in the human genome, regardless of its frequency. Examples of such diversity include, but are not limited to, single nucleotide polymorphisms, simple tandem repeat polymorphisms, indel polymorphisms, mutations (which can cause disease) and copy number diversity.
용어 "서열결정된 태그 (sequenced tag)"는 핵산 분자, 예로 DNA 단편의 전부 또는 일부로부터 결정된 서열을 말한다. 종종, 단편의 한쪽 말단만, 예로 약 30 bp가 서열결정된다. 다음으로 서열결정된 태그는 기준 게놈에 정렬될 수 있다. 임의적으로, 단편의 말단들 둘 다가 서열결정되어 두 개의 서열결정된 태그들이 생성될 수 있고, 이는 정렬에서 더 큰 정확도를 제공하고 단편의 길이도 역시 제공할 수 있다.The term "sequenced tag" refers to a sequence determined from all or part of a nucleic acid molecule, eg, a DNA fragment. Often, only one end of the fragment, eg about 30 bp, is sequenced. The sequenced tags can then be aligned to a reference genome. Optionally, both ends of the fragment may be sequenced to generate two sequenced tags, which may provide greater accuracy in alignment and may also provide the length of the fragment.
용어 "보편적 서열결정 (universal sequencing)"은 어댑터들이 단편의 말단에 첨가되고, 서열결정을 위한 프라이머들이 어댑터들에 부착되는 서열결정을 말한다. 따라서, 단편이라면 모두가 동일한 프라이머들로 서열결정될 수 있고, 따라서 서열결정은 무작위적일 수 있다.The term "universal sequencing" refers to sequencing in which adapters are added to the ends of fragments and primers for sequencing are attached to the adapters. Thus, all fragments can be sequenced with identical primers, and thus sequencing can be random.
용어 "크기 분포 (size distribution)"은 특정한 그룹에 해당하는 분자들 (특정한 반수체형으로부터 또는 특정한 염색체 부위로부터 나온 단편들)의 길이, 질량, 무게, 또는 크기의 척도를 대표하는 하나의 수치 또는 수치들의 집합이라면 모두를 말한다. 다양한 구현예들은 다양한 크기 분포들을 사용할 수 있다. 일정 구현예들에서, 크기 분포는 다른 염색체들의 단편들과 비교하여 하나의 염색체의 단편들의 크기들 (예로, 평균, 중앙값, 또는 평균값 (mean))의 순위매김에 관한 것이다. 다른 구현예들에서, 크기 분포는 염색체 단편들의 실제 크기들의 통계학적 수치에 관한 것일 수 있다. 한 가지 시행예에서, 통계학적 수치는 염색체 단편의 평균, 평균값 (mean), 또는 중앙값이라면 모두를 포함할 수 있다. 또 다른 시행예에서, 통계학적 수치는 컷오프 수치 미만의 단편들의 전체 길이를 포함할 수 있고, 이는 모든 단편들, 또는 적어도 더 큰 컷오프 수치 미만의 단편들의 전체 길이에 의해 구분될 수 있다.The term “size distribution” refers to a number or number representing a measure of the length, mass, weight, or size of molecules (fragments from a particular haplotype or from a particular chromosomal region) belonging to a particular group. If it is a set of , it means all. Various implementations may use various size distributions. In some embodiments, size distribution relates to ranking the sizes (eg, mean, median, or mean) of fragments of one chromosome compared to fragments of other chromosomes. In other embodiments, the size distribution may relate to a statistical measure of the actual sizes of chromosome fragments. In one embodiment, the statistical value may include the mean, mean, or median of chromosome fragments, if any. In another embodiment, the statistical value may include the total length of the fragments below the cutoff value, which may be distinguished by all fragments, or at least the total length of the fragments below the greater cutoff value.
본 명세서에서 사용되는 바, 용어 "분류 (classification)"는 시료의 특정한 특성과 연관된 수(들) 또는 기타 특징(들)이라면 모두를 말한다. 예를 들어, "+" 기호 (또는 단어 "양성")은 시료가 결실들 또는 증폭들을 가지는 것으로 분류되는 점을 의미할 수 있다. 분류는 이분적 (예로, 양성 또는 음성)이거나 더 많은 분류 수준들을 가질 수 있다 (예로, 1로부터 10까지 또는 0 내지 1의 규모). 용어 "컷오프 (cutoff)" 및 "역치 (threshold)"는 적용 (operation) 시 사용되는 선결정된 수를 말한다. 예를 들어, 컷오프 크기는 초과 시 단편들이 배제되는 크기를 말할 수 있다. 역치 수치는 초과 또는 미만 시 특정한 분류가 적용되는 수치일 수 있다. 이들 용어들의 둘 중 하나는 이들 문맥들의 둘 중 하나에서 사용될 수 있다.As used herein, the term “classification” refers to any number(s) or other characteristic(s) associated with a particular characteristic of a sample. For example, a “+” sign (or the word “positive”) can mean that the sample is classified as having deletions or amplifications. A classification may be dichotomous (eg, positive or negative) or have more classification levels (eg, on a scale of 1 to 10 or 0 to 1). The terms “cutoff” and “threshold” refer to a predetermined number used in an operation. For example, the cutoff size may refer to a size at which fragments are excluded when exceeded. The threshold value may be a value to which a specific classification is applied when it exceeds or falls below. Either of these terms may be used in either of these contexts.
용어 "암의 수준 (level of cancer)"은 암이 존재하는지 여부, 암의 단계, 종양의 크기, 염색체 부위의 결실들 또는 증폭들이 관여하는 횟수 (예로, 중복 또는 삼중복), 및/또는 기타 다른 암의 중증도의 척도를 말할 수 있다. 암의 수준은 수 또는 기타 특징들일 수 있다. 수준은 제로일 수 있다. 암의 수준은 결실들 또는 증폭들과 연관된 전악성 (premalignant) 또는 전암성 (precancerous) 병태도 역시 포함한다.The term “level of cancer” refers to whether cancer is present, the stage of the cancer, the size of the tumor, the number of times deletions or amplifications of the chromosomal region are involved (eg, duplicates or triplicates), and/or other It can be a measure of the severity of other cancers. The level of cancer may be a number or other characteristics. The level may be zero. The level of cancer also includes premalignant or precancerous conditions associated with deletions or amplifications.
암성 조직 (종양)은 염색체 부위의 결실 또는 증폭과 같은 이상들을 가질 수 있다. 종양은 신체에 있는 체액들 내로 DNA 단편들을 방출할 수 있다. 구현예들은 염색체 부위에서 DNA의 정상 (기대) 수치들과 대비하여 이상들을 확인하도록 DNA 단편들을 분석하여 종양을 확인할 수 있다.Cancerous tissue (tumor) may have abnormalities such as deletion or amplification of chromosomal regions. Tumors can release DNA fragments into body fluids. Embodiments can identify a tumor by analyzing DNA fragments to identify abnormalities against normal (expected) levels of DNA at a chromosomal region.
결실 또는 증폭의 정확한 크기뿐만 아니라 위치는 달라질 수 있다. 특정한 부위가 암들 또는 특정한 유형의 암에 대해 일반적으로 이상을 나타내는 것으로 (이로 인해 특정한 암의 진단을 유도함) 알려져 있는 시간대가 존재할 수 있다. 특정한 부위가 알려져 있지 않을 때, 게놈 전부 또는 게놈의 큰 부분들을 분석하는 체계적인 방법이 게놈 전체에 분산될 수 있고 크기가 (예로, 결실되거나 증폭된 염기들의 수)가 다양한 이상 (aberrant) 부위들을 검출하는 데 사용될 수 있다. 본 염색체 부위(들)은 이상의 중증도 또는 이상을 보이는 부위들의 수에서의 변화들을 확인하도록 계속 추적될 수 있다. 본 추적은 종양을 검색하고, 예후를 판단하고, 감시하는 (예로, 치료 이후 또는 재발 또는 종양 진행을 검출하는) 핵심 정보를 제공할 수 있다.The exact size as well as the location of the deletion or amplification may vary. There may be times when a particular site is known to be abnormal for cancers or certain types of cancer in general (thus leading to the diagnosis of a particular cancer). When a specific site is unknown, systematic methods to analyze the entire genome or large portions of the genome can be distributed throughout the genome and detect aberrant sites that vary in size (eg, number of deleted or amplified bases). can be used to The chromosomal region(s) may be continuously followed to identify changes in the severity of the abnormality or the number of regions exhibiting the abnormality. This follow-up can provide key information to detect tumors, determine prognosis, and monitor (eg, post-treatment or detect recurrence or tumor progression).
본 명세서는 먼저 암에서 염색체 이상들의 예들로 시작한다. 다음으로, 생물학적 시료에서 무세포 DNA를 검출하고 분석하여 염색체 이상을 검출하는 방식들의 예들이 논의된다. 일단 하나의 염색체 부위에서 이상을 검출하는 방법들이 확인되고 나면, 체계적인 방식으로 환자들을 검색 (진단)하고 예후를 판단하는 데 사용되는 많은 염색체 부위들에서 이상들을 검출하는 방법들이 기술된다. 본 명세서는 환자들을 검색하고 예후를 판단하고 감시하는 것을 계속 제공하도록 하나 이상의 부위들에서 염색체 이상에 대한 테스트들로부터 획득된 수적인 지시자들 (indicators)을 추적하는 방법들도 역시 기술하고 있다. 예들은 다음에 논의된다.This specification first begins with examples of chromosomal abnormalities in cancer. Next, examples of methods for detecting and analyzing cell-free DNA in a biological sample to detect chromosomal abnormalities are discussed. Once methods for detecting anomalies at one chromosomal site have been identified, methods for detecting abnormalities at many chromosomal sites used to search (diagnose) patients and determine prognosis in a systematic manner are described. Also described herein are methods of tracking numerical indicators obtained from tests for chromosomal aberrations at one or more sites to continue to provide for screening patients and determining and monitoring prognosis. Examples are discussed next.
I. 암에서I. In Cancer 염색체 이상들의 예들 Examples of chromosomal abnormalities
염색체 이상들은 암 세포들에서 보편적으로 검출된다. 게다가, 염색체 이상들의 특징적인 양상은 선택된 유형의 암에서 발견될 수 있다. 예를 들어, 염색체 팔들 1p, 1q, 7q, 15q, 16p, 17q 및 20q에서 DNA의 증가들 또한 3p, 4q, 9p 및 11q에서 DNA의 소실들은 간세포 암종 (HCC)에서 공통적으로 검출된다. 이전의 연구들은 이러한 유전적 이상들이 암 환자들의 순환 DNA에서도 역시 검출될 수 있는 점을 기술하여 왔다. 예를 들어, 이종접합 (LOH)의 소실이 폐, 및 두경부 암들을 앓고 있는 환자들의 순환 DNA 분자들에 있는 특정한 좌위에 대해 검출되었다 (Chen XQ, et al. Nat Med 1996; 2: 1033-5; Nawroz H,et al. Nat Med 1996; 2: 1035-7). 혈장 또는 혈청에서 검출되는 유전적 변경들이 종양 조직들에서 발견되는 것들과 부합하였다. 그러나, 종양-유래 DNA는 단지 전체 순환 무세포 DNA의 소수 분획에 기여하기 때문에, 종양 세포들의 LOH에 의해 초래되는 대립인자 불균형은 보통 작다. 많은 연구자들이 순환 DNA 분자들 중에서 좌위의 서로 다른 대립인자들의 정확한 정량을 위해 (Chang HW, et al. J Natl Cancer Inst. 2002; 94: 1697-703), 디지털 중합효소 연쇄반응 (PCR) 기술학을 개발하였다 (Vogelstein B, Kinzler KW. Proc Natl Acad Sci U S A. 1999; 96: 9236-41; Zhou W, et al. Nat Biotechnol 2001; 19: 78-81; Zhou W, et al. Lancet. 2002; 359: 219-25). 디지탈 PCR은 종양 DN에 있는 특정한 좌위에서 LOH에 의해 초래되는 작은 대립인자 불균형을 검출하는 실시간 PCR 또는 기타 DNA 정량 방법들보다 더욱 더 민감하다. 그러나 디지탈 PCR은 특정한 좌위에서 매우 작은 대립인자 불균형을 확인하는 데 여전히 어려움들을 가질 수 있고, 따라서 본 명세서에서 기술된 구현예들은 조합적 방식으로 염색체 부위들을 분석하고 있다.Chromosomal abnormalities are commonly detected in cancer cells. In addition, characteristic features of chromosomal abnormalities can be found in selected types of cancer. For example, increases in DNA in
본 명세서에서 기술된 기술학은 비악성 또는 비암성 병태의 검출을 위한 적용들도 역시 가진다. 이러한 병태의 예들로는 간의 경변 및 자궁경부 상피내종양을 포함한다. 전자의 병태는 간세포 암종의 비악성 병태인 한편 후자의 병태는 자궁경부 암종의 비악성 병태이다. 이러한 비악성 병태들은 악성 종양이 되도록 그들의 진화에서 여러 분자적 변경들을 이미 소유하는 것으로 보고되어 왔다. 예를 들어, 염색체 팔들 1p, 4q, 13q, 18q에서 LOH의 존재 및 3개 이상의 좌위에서 동시적인 소실들은 간경변을 가진 환자들에서 HCC 발달의 증가된 위험과 연관되어 있다 (Roncalli M et al. Hepatology 2000; 31: 846-50). 이러한 비악성 병변들은 더 낮은 농도들일 수는 있더라도 순환 내로 DNA도 역시 방출할 것이다. 기술학은 혈장에서 DNA 단편들을 분석하여 결실들 또는 증폭들의 검출을 허용하고, 혈장에서 순환하는 비악성 DNA의 농도 (분획 농도를 포함함)를 측정하도록 허용할 수 있다. 이러한 변경들이 검출되는 용이성 (예로, 서열결정의 깊이 또는 검출되는 이러한 변화들의 수) 및 농도들은 만기 충만 암성 병태로의 진행 가능성 또는 신속도를 예측할 것이다.The technology described herein also has applications for the detection of non-malignant or non-cancerous conditions. Examples of such conditions include cirrhosis of the liver and cervical intraepithelial tumors. The former condition is a non-malignant condition of hepatocellular carcinoma while the latter condition is a non-malignant condition of cervical carcinoma. It has been reported that these non-malignant conditions already possess several molecular alterations in their evolution to become malignant tumors. For example, the presence of LOH in
A. 염색체 부위의 결실A. Deletion of Chromosomal Regions
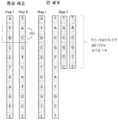
도 1은 결실의 이상을 보여주는 암세포의 염색체 부위를 도시한다. 정상 세포는 두 개의 반수체형들, Hap I 및 Hap Ⅱ로 관찰된다. 관찰된 바와 같이, Hap I 및 Hap Ⅱ 둘 다는 각 다수의 이종접합 좌위들 110에서 서열을 가진다 (단일 뉴클레오타이드 다형성 SNPs라고도 말함). 암과 연관된 세포에서, Hap Ⅱ은 결실된 염색체 부위 120을 가진다. 예로서, 암과 연관된 세포는 종양 (예로, 악성 종양)으로부터, 종양의 전이성 초점 (예로, 국부적 림프절, 또는 먼 기관에서)으로부터, 또는 비암성 또는 비악성 병변으로부터, 예로 상기 언급된 바와 같이 나올 수 있다.1 depicts chromosomal regions of cancer cells showing abnormalities in deletion. Normal cells are observed in two haplotypes, Hap I and Hap II. As observed, both Hap I and Hap II have sequences at each of multiple heterozygous loci 110 (also referred to as single nucleotide polymorphic SNPs). In cancer-associated cells, Hap II has a deleted chromosomal region 120. For example, cells associated with cancer can emerge from a tumor (eg, a malignant tumor), from a metastatic focus of a tumor (eg, in a regional lymph node, or distant organ), or from a noncancerous or nonmalignant lesion, eg, as noted above. can
두 개의 동종 반수체형들의 하나가 결실된 암세포의 염색체 부위 120에서, 모든 이종접합 SNPs 110은 해당하는 결실된 동종의 염색체 상에서 다른 대립인자의 소실 때문에 동종접합으로서 나타날 것이다. 따라서, 이러한 유형의 염색체 이상은 이종접합의 소실 (LOH)이라고 부른다. 부위 120에서, 이들 SNPs의 비-결실된 대립인자들은 정상 조직들에서 발견될 수 있는 두 개의 반수체형들의 하나를 대표할 수 있다. 도 1에 나타난 예에서, LOH 부위 120 에서 반수체형 I (Hap I)은 종양 조직을 유전형 분석하여 결정될 수 있다. 다른 반수체형 (Hap Ⅱ)은 정상 조직들 및 암 조직들의 외관상 유전형들을 비교하여 결정될 수 있다. Hap Ⅱ은 모든 결실된 대립인자들을 결합시켜서 제작될 수 있다. 즉, 암세포의 부위 120에서는 출현하지 않는 부위 120을 위한 정상 세포에서의 모든 대립인자들은 동일한 반수체형, 예로 Hap I 상에 있도록 결정된다. 본 분석을 통하여, 환자들 (예로, 간세포 암종 HCC 환자들)의 반수체형들은 종양 조직에서 LOH를 보이는 모든 염색체 부위들에 대해 결정될 수 있다. 이러한 방법은 개체가 암세포들을 가지는 경우에만 유용하고, 부위 120에서 반수체형을 결정하기 위해서만 작용하지만, 결실된 염색체 부위의 좋은 도시를 제공한다.At chromosomal region 120 of cancer cells in which one of the two homologous haplotypes is deleted, all
B. 염색체 부위의 증폭B. Amplification of chromosomal regions
도 2는 증폭의 이상을 보여주는 암세포의 염색체 부위를 도시한다. 정상 세포는 두 개의 반수체형들, Hap I 및 Hap Ⅱ로 관찰된다. 관찰된 바와 같이, Hap I 및 Hap Ⅱ 둘 다는 각 다수의 이종접합 좌위들 110에서 서열을 가진다. 종양 세포에서, Hap Ⅱ은 2배로 증폭된 (복제된) 염색체 부위 220을 가진다.Figure 2 depicts chromosomal regions of cancer cells showing abnormalities in amplification. Normal cells are observed in two haplotypes, Hap I and Hap II. As observed, both Hap I and Hap II have sequences at each of multiple
유사하게, 종양 조직들에서 단일-대립인자 증폭을 가지는 부위들의 경우 SNPs 210에서 증폭된 대립인자들은 마이크로어레이 (microarray) 분석과 같은 방법들에 의해 검출될 수 있다. 두 개 반수체형들의 하나 (도 2에서 나타낸 예에서 Hap Ⅱ)는 염색체 부위 220에 있는 모든 증폭된 대립인자들을 결합시켜서 결정될 수 있다. 특정한 좌위에서 증폭된 대립인자는 좌위에 있는 각 대립인자들의 수를 비교하여 결정될 수 있다. 다음으로, 다른 반수체형 (Hap I)은 비-증폭된 대립인자들을 결합시켜서 결정될 수 있다. 이러한 방법은 개체가 암세포들을 가지는 경우에만 유용하고, 부위 220에서 반수체형을 결정하기 위해서만 작용하지만, 증폭된 염색체 부위의 좋은 도시를 제공한다.Similarly, in the case of sites with single-allele amplification in tumor tissues, alleles amplified in
증폭은 2개 이상의 염색체들을 가지는 것 또는 하나의 염색체에서 유전자의 반복으로부터 유발될 수 있다. 하나의 부위는 일렬로 복제될 수 있거나, 부위가 해당 부위의 하나 이상의 사본들을 포함하는 미세한 염색체일 수 있다. 증폭은 복제되고 서로 다른 염색체 또는 동일한 염색체의 서로 다른 부위 내로 삽입된 염색체의 유전자로부터도 역시 유발될 수 있다. 이러한 삽입들은 증폭의 한 유형이다.Amplification can result from having two or more chromosomes or from repetition of a gene on one chromosome. A site may be replicated in tandem, or a site may be a microscopic chromosome containing one or more copies of that site. Amplification can also result from genes on chromosomes that are replicated and inserted into different chromosomes or different regions of the same chromosome. These insertions are a type of amplification.
Ⅱ. 염색체 부위의 선택II. selection of chromosomal regions
암 조직은 적어도 일정의 이들 무세포 DNA (및 잠재적으로 세포성 DNA)에 기여하기 때문에, 암 조직의 게놈 이상들은 혈장 및 혈청과 같은 시료에서 검출될 수 있다. 이상을 검출하는 데 문제점은 종양 또는 암이 매우 작을 수 있어, 암 세포들로부터 비교적 적은 DNA를 제공하는 것이다. 따라서 이상을 가진 순환 DNA의 양은 매우 적어, 검출을 매우 어렵게 만든다. 게놈의 단일 좌위에는 이상을 검출할만한 충분한 DNA가 존재하지 않을 수 있다. 본 명세서에서 기술된 방법들은 다수의 좌위 (반수체형)를 포함하는 염색체 부위에서 DNA를 분석하여 본 어려움을 극복할 수 있고, 따라서 한 좌위에서의 작은 변이가 반수체형 위로 모일 때 감지가능한 차이로 변화된다. 따라서, 부위의 다수의 좌위를 분석하는 것은 더 큰 정확도를 제공할 수 있고, 위양성 및 위음성을 감소시킬 수 있다.Because cancer tissue contributes at least some of these cell-free DNA (and potentially cellular DNA), genomic abnormalities in cancer tissue can be detected in samples such as plasma and serum. A problem with detecting anomalies is that the tumor or cancer can be very small, providing relatively little DNA from cancer cells. Therefore, the amount of circulating DNA with an abnormality is very small, making detection very difficult. There may not be enough DNA present at a single locus in the genome to detect the abnormality. The methods described herein can overcome this difficulty by analyzing DNA at chromosomal regions containing multiple loci (haploids), so that small variations at one locus change into detectable differences when clustered over haplotypes. do. Thus, analyzing multiple loci of a site can provide greater accuracy and reduce false positives and false negatives.
또한, 이상의 부위는 매우 작을 수 있어, 이상을 확인하는 것을 어렵게 만든다. 단 하나의 좌위 또는 특정한 좌위들이 사용되는 경우라면, 이들 좌위들이 아닌 이상들은 놓칠 것이다. 본 명세서에서 기술된 바와 같이, 일정 방법들은 부위의 소집합 내에서 이상을 찾도록 전체 부위들 조사할 수 있다. 분석된 부위들이 게놈으로 확장될 때, 향후 게놈 전부가 하기에 보다 자세하게 기술되는 바와 같이 다양한 길이 및 위치의 이상들을 찾도록 분석될 수 있다.Also, the site of the abnormality can be very small, making it difficult to identify the abnormality. If only one locus or specific loci are used, anomalies other than these loci will be missed. As described herein, certain methods can examine entire sites to look for anomalies within a subset of sites. When the analyzed regions are extended into the genome, the entire genome in the future can be analyzed to look for anomalies of various lengths and locations, as described in more detail below.
상기에서 나타난 바와 같이 이들 요점들을 설명하기 위하여, 부위는 이상을 가질 수 있다. 그러나, 부위는 분석을 위해 선택되어야 한다. 부위의 길이 및 위치는 결과들을 변경시켜서 분석에 영향을 줄 수 있다. 예를 들어, 도 1에서 첫 번째 부위가 분석되는 경우라면, 이상이 전혀 검출되지 않을 것이다. 두 번째 부위가 분석되는 경우라면, 이상이 예로 본 명세서에 기술된 방법들을 사용하여 검출될 수 있다. 첫 번째 및 두 번째 부위 둘 다를 포함하는 더 큰 부위가 분석되는 경우라면, 이상이라면 모두를 확인하는 것을 더욱 어렵게 만들 수 있는 더 큰 부위의 단지 일부가 이상을 가지는 어려움, 뿐만 아니라 이상의 정확한 위치 및 길이를 확인하는 문제점과 만난다. 다양한 구현예들이 이들 난점들의 일정 및/또는 모두를 해결할 수 있다. 부위를 선택하는 설명은 동일한 염색체 부위의 반수체형들을 사용하거나 두 개의 서로 다른 염색체 부위들을 사용하는 방법들에 동등하게 적용가능하다.To account for these points as indicated above, a region can have anomalies. However, sites should be selected for analysis. The length and location of the site can affect the analysis by altering the results. For example, if the first site in FIG. 1 was analyzed, no abnormality would be detected. If a second site is being analyzed, the abnormality can be detected, for example, using the methods described herein. The exact location and length of the anomaly, as well as the difficulty of having only some of the larger sites have the anomaly, which can make it more difficult to identify all of the anomalies if larger sites containing both the first and second sites are to be analyzed. encountered a problem to check. Various implementations may address some and/or all of these difficulties. The description of selecting a region is equally applicable to methods using haplotypes of the same chromosomal region or using two different chromosomal regions.
A. 특정한A. specific 염색체 부위를 선택하기 Choosing a Chromosomal Region
한 가지 구현예에서, 특정한 부위는 암 또는 환자의 지식을 기초로 하여 선택될 수 있다. 예를 들어, 부위는 많은 암들 또는 특정한 환자에서 공통적으로 이상을 나타내는 것으로 알려져 있을 수 있다. 부위의 정확한 길이 및 자리는 암 유형 또는 특정한 위험 요인들을 가진 환자들에게 잘 알려진 점에 관한 문헌을 참조하여 결정될 수 있다. 추가적으로, 환자의 종양 조직들이 획득되고 상기에서 기술된 바와 같이 이상들의 부위들을 확인하도록 분석될 수 있다. 현재 이러한 기법은 암세포를 획득하는 것을 (바로 진단된 환자들에게는 실용적이지 않을 수 있음) 요구할 것이지만, 이러한 기법은 동일한 환자에서 계속 감시하기 위해 (예로, 암성 조직을 제거하는 수술 이후, 또는 화학요법 또는 면역요법 또는 표적화 요법 이후, 또는 종양 재발 또는 진행의 검출을 위해) 부위들을 확인하는 데 사용될 수 있다.In one embodiment, a particular site may be selected based on the knowledge of the cancer or patient. For example, a site may be known to exhibit abnormalities in many cancers or in a particular patient. The exact length and location of the site can be determined by reference to the literature on what is well known to patients with cancer types or specific risk factors. Additionally, the patient's tumor tissues can be obtained and analyzed to identify sites of abnormalities as described above. Currently, these techniques would require obtaining cancer cells (which may not be practical for immediately diagnosed patients), but such techniques would require continued monitoring in the same patient (e.g., after surgery to remove cancerous tissue, or chemotherapy or after immunotherapy or targeted therapy, or for detection of tumor recurrence or progression).
하나 이상의 특정한 부위를 확인할 수 있다. 이러한 부위들의 각기 하나의 분석은 독립적으로 사용될 수 있거나, 서로 다른 부위들은 종합적으로 분석될 수 있다. 추가적으로, 부위는 이상을 위치시키는 데 더 큰 정확도를 제공하도록 소분활될 수 있다.One or more specific sites may be identified. One assay for each of these sites can be used independently, or different sites can be analyzed collectively. Additionally, sites may be subdivided to provide greater accuracy in locating abnormalities.
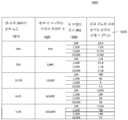
도 3은 서로 다른 유형들의 암들 및 연관된 부위들 또한 그들의 해당 이상들을 도시하는 표 300을 나타낸다. 컬럼 310은 서로 다른 암 유형들을 나열하고 있다. 본 명세서에서 기술된 구현예들은 이상이 관여하는 암 유형이라면 모두에 사용될 수 있고, 따라서 본 리스트는 단지 예시적이다. 컬럼 320은 증가 (증폭)이 동일한 행의 특정한 암과 연관된 부위들 (예로, 7p번와 같은 큰 부위들 또는 17q25번와 같은 더욱 특이적인 부위들)을 보여준다. 컬럼 330은 소실들 (결실들)이 발견될 수 있는 부위들을 보여준다. 컬럼 340은 특정한 암을 가진 이들 부위들의 연관성을 논의하는 참고문헌들을 나열하고 있다.3 presents Table 300 showing different types of cancers and associated sites as well as their corresponding abnormalities.
잠재적인 염색체 이상들을 가진 이들 부위들은 본 명세서에서 기술된 방법들에 따른 분석을 위한 염색체 부위(들)로서 사용될 수 있다. 암에서 변경되는 다른 게놈 부위들의 예들은 암 게놈 해부 프로젝트의 데이터베이스 (cgap.nci.nih.gov /Chromosomes/RecurrentAberrataions), 유전학의 아틀라스, 또한 종양학 및 혈액학의 세포유전학 (atlasgeneticsoncology.org Tumors/Tumorliste.html)에서 찾을 수 있다.These regions with potential chromosomal aberrations can be used as chromosomal region(s) for analysis according to the methods described herein. Examples of other genomic regions that are altered in cancer are the Cancer Genome Dissection Project's Database (cgap.nci.nih.gov/Chromosomes/RecurrentAberrataions), the Atlas of Genetics, and also the Cytogenetics of Oncology and Hematology (atlasgeneticsoncology.org Tumors/Tumorliste.html). ) can be found in
관찰할 수 있는 바와 같이, 확인된 부위들은 매우 클 수 있는 한편 다른 부위들은 더 특이적일 수 있다. 이상들은 표에서 확인되는 부위 전부를 포함할 수 없다. 따라서, 이상들의 유형에 대하여 이러한 단서들은 특정한 환자의 경우 이상이 실제로 존재하는 곳을 정확하게 겨낭하지는 못하지만, 분석을 위한 큰 부위들에 관한 대략적인 가이드로서 더 사용될 수 있다. 이러한 큰 부위들 (본 명세서에 상세한 설명이 기술됨)은 더 큰 부위에서 개별적뿐만 아니라 종합적으로 분석되는 많은 소부위들 (동등한 크기일 수 있음)을 포함할 수 있다. 따라서, 구현예들은 테스트될 암의 특정한 사항들을 기초로 하여 더 큰 부위를 선택하는 것의 관점들을 조합할 수 있지만, 다음에 기술된 바와 같이 더욱 일반적인 기법들 (예로, 소부위들을 테스트하는 것)을 사용할 수도 있다.As can be observed, the sites identified may be very large while others may be more specific. Abnormalities cannot cover all of the sites identified in the table. Thus, as to the type of abnormality, these clues do not pinpoint exactly where the abnormality actually exists in a particular patient, but can further be used as a rough guide to large areas for analysis. These large regions (the details of which are described herein) can include many small regions (which may be of equal size) that are analyzed collectively as well as individually in the larger region. Thus, embodiments may combine aspects of selecting a larger site based on the specifics of the cancer to be tested, but employ more general techniques (eg, testing small sites) as described below. can also be used.
B. 임의적B. Random 염색체 부위를 선택하기 Choosing a Chromosomal Region
또 다른 구현예에서, 분석되는 염색체 부위는 임의적으로 선택된다. 예를 들어, 게놈은 길이가 1 메가염기 (Mb)인 부위들 또는 500 Kb 또는 2 Mb와 같은 기타 선결정된 분절 길이들로 분리될 수 있다. 부위들이 1 Mb인 경우라면, 다음으로 반수체 인간 게놈에는 약 30억 개 염기들이 있기 때문에, 인간 게놈에는 대략 3,000개의 부위들이 존재하게 된다. 다음으로 이들 부위들은, 이후에 보다 자세하게 논의되는 바와 같이 각각 분석될 수 있다.In another embodiment, the chromosomal region to be analyzed is randomly selected. For example, the genome may be separated into
이러한 부위들은 암 또는 환자의 지식이라면 모두를 기초로 하지 않고 분석될 부위 내로 게놈의 체계적인 분배를 기초로 하여 결정될 수 있다. 한 가지 시행예에서, 염색체가 복수의 선결정된 분절이 되는 (1 백만 개 염기들로 분할가능하지 않음) 길이를 가지지 않을 때, 염색체의 마지막 부위는 선결정된 길이 이하 (예로, 1 MB 이하)일 수 있다. 또 다른 시행예에서, 각 염색체는 염색체의 전 길이 및 만들어질 분획들의 수 (전형적으로 염색체들 중에서 다양해짐)를 기초로 하여 동등한 길이 (또는 대략적으로 동등 - 주변 오차 이내)의 부위들로 분리될 수 있다. 이러한 시행예에서, 각 염색체의 분절들의 길이는 서로 다를 수 있다.These sites can be determined based on the systematic distribution of the genome into the site to be analyzed, not based on any knowledge of the cancer or the patient. In one embodiment, when the chromosome does not have a length that results in a plurality of predetermined segments (not divisible into 1 million bases), the last portion of the chromosome is less than or equal to the predetermined length (eg, less than 1 MB) can In another embodiment, each chromosome is to be separated into regions of equal length (or approximately equal - within marginal error) based on the total length of the chromosome and the number of fractions to be made (which typically varies among chromosomes). can In this embodiment, the segments of each chromosome may be of different lengths.
상기 언급된 바와 같이, 특정한 부위는 테스트된 특이적 암을 기초로 하여 확인될 수 있지만, 다음으로 특정한 부위는 더 작은 부위들로 소분할될 수 있다 (예로, 특정한 더 큰 부위로 확장되는 동등한 크기의 소부위들). 본 방식으로, 이상들은 지적 (pinpoint)될 수 있다. 하기 논의에서, 염색체 부위에 관한 일반적인 기준이라면 모두가 특이적으로 확인된 부위, 임의적으로 선택된 부위, 또는 이 둘의 조합일 수 있다.As noted above, a specific site can be identified based on the specific cancer tested, but then the specific site can be subdivided into smaller sites (eg, of equal size extending to a particular larger site). subparts of). In this way, anomalies can be pinpointed. In the discussion below, all general criteria for chromosomal regions may be specifically identified regions, arbitrarily selected regions, or a combination of the two.
Ⅲ. 특정한Ⅲ. Specific반수체형에서in the haplotype 이상들의 검출 detection of anomalies
본 섹션은 무세포 DNA를 포함하는 생물학적 시료를 분석하여 단일 염색체 부위에서 이상을 검출하는 방법들을 기술하고 있다. 본 섹션의 구현예들에서, 단일 염색체 부위는 부위에 있는 다수의 좌위들에서 이종접합 (서로 다른 대립인자)이고, 이로 인해 주어진 좌위에서 특정한 대립인자를 알아내어 구별될 수 있는 두 개의 반수체형을 제공한다. 따라서, 주어진 핵산 분자 (예로, 무세포 DNA의 단편)는 두 개의 반수체형들의 특정한 하나로부터 나온 것으로서 확인될 수 있다. 예를 들어, 단편은 염색체 부위에 정렬하는 서열 태그를 획득하도록 서열결정될 수 있고, 다음으로 대립인자가 속하는 이종접합 좌위에서 반수체형이 확인될 수 있다. 특정한 반수체형 (Hap)에서 이상들을 결정하는, 특이적으로 태그 계수 및 크기 분석을 위한 두 가지 일반적 유형들의 기법들이 하기에 기술된다.This section describes methods for detecting abnormalities at single chromosomal sites by analyzing biological samples containing cell-free DNA. In embodiments of this section, a single chromosomal region is heterozygous (different alleles) at multiple loci in the region, thereby generating two haplotypes that can be distinguished by identifying a particular allele at a given locus. to provide. Thus, a given nucleic acid molecule (eg, a fragment of cell-free DNA) can be identified as originating from a particular one of two haplotypes. For example, fragments can be sequenced to obtain sequence tags that align to chromosomal sites, and then haplotypes can be identified at the heterozygous locus to which the allele belongs. Two general types of techniques for determining anomalies in a particular haplotype (Hap), specifically for tag counting and size analysis, are described below.
A. 반수체형들을A. Haplotypes 결정하는 것 deciding
두 개의 반수체형들을 분간하기 위하여, 염색체 부위의 두 개 반수체형들이 먼저 결정된다. 예를 들어, 도 1의 정상 세포에서 관찰되는 두 개의 반수체형들 Hap I 및 Hap Ⅱ이 결정될 수 있다. 도 1에서, 반수체형들은 이종접합이고 두 개 반수체형들의 분간을 허용하는 첫 번째 다수의 좌위 110를 포함한다. 서로 다른 이종접합 좌위 상의 대립인자들 (hets)이 먼저 결정되고, 다음으로 환자의 반수체형들을 결정하도록 단계가 정해질 수 있다.In order to discriminate between the two haplotypes, the two haplotypes of the chromosomal region are first determined. For example, the two haplotypes Hap I and Hap II observed in the normal cell of FIG. 1 can be determined. In FIG. 1 , the haplotypes are heterozygous and contain the first
SNP 대립인자들의 반수체형이 단일 분자 분석 방법들에 의해 결정될 수 있다. 이러한 방법들의 예들은 팬 등 (Fan et al., Nat Biotechnol. 2011;29:51-7), 얀게트 등 (Yanget et al., Proc Natl Acad Sci U S A. 2011;108:12-7) 및 기츠마네트 등 (Kitzmanet et al., Nat Biotechnol. 2011 Jan;29:59-63)에 의해 기술되어 왔다. 임의적으로, 개인의 반수체형들은 가족 구성원들 (예로, 부모들, 형제자매들, 및 아이들)의 유전형들의 분석에 의해 결정될 수 있다. 예들로는 로취 등 (Roach et al., Am J Hum Genet. 2011;89(3):382-97) 및 로 등 (Lo et al., Sci Transl Med. 2010;2:61ra91)에 의해 기술된 방법들을 포함한다. 보다 또 다른 구현예에서, 개인들의 반수체형은 종양 조직들 및 게놈 DNA의 유전형분석 결과들을 비교하여 결정될 수 있다. 이들 개체들의 유전형은 애피매트릭스사 SNP 6.0, 일루미나사 인피니움 HD 플랫폼 또는 기타 SNP 유전형 분석 플랫폼들을 사용하는 것과 같은 마이크로어레이 분석에 의해 수행될 수 있다.The haplotype of SNP alleles can be determined by single molecule analysis methods. Examples of such methods include Fan et al. (Fan et al., Nat Biotechnol. 2011;29:51-7), Yanget et al. (Yanget et al., Proc Natl Acad Sci US A. 2011;108:12-7) and It has been described by Kitzmanet et al. (Nat Biotechnol. 2011 Jan;29:59-63). Optionally, an individual's haplotypes can be determined by analysis of the genotypes of family members (eg, parents, siblings, and children). Examples are the methods described by Roach et al. (Roach et al., Am J Hum Genet. 2011;89(3):382-97) and Lo et al., Sci Transl Med. 2010;2:61ra91). include those In yet another embodiment, the haplotype of individuals can be determined by comparing the results of genotyping of tumor tissues and genomic DNA. Genotyping of these individuals can be performed by microarray analysis, such as using Affymetrix SNP 6.0, Illumina Infineum HD platform or other SNP genotyping platforms.
반수체형들은 당업자라면 잘 숙지하고 있는 기타 방법들에 의해서도 역시 작성될 수 있다. 이러한 방법들의 예들로는 디지털 PCR (Ding C and Cantor CR. Proc Natl Acad Sci USA 2003; 100: 7449-7453; Ruano G et al. Proc Natl Acad Sci USA 1990; 87: 6296-6300), 염색체선별 또는 분리 (Yang H et al. Proc Natl Acad Sci U S A 2011; 108: 12-17; Fan HC et al. Nat Biotechnol 2011; 29: 51-57), 정자 반수체형 분석 (Lien S et al. Curr Protoc Hum Genet 2002; Chapter 1:Unit 1.6) 및 영상화 기법들 (Xiao M et al. Hum Mutat 2007; 28: 913-921)과 같은 단일 분자 분석을 기초로 하는 것들을 포함한다. 다른 방법들로는 대립인자-특이적인 PCR (Michalatos-Beloin S et al. Nucleic Acids Res 1996; 24: 4841-4843; Lo YMD et al. Nucleic Acids Res 19: 3561-3567), 클로닝 및 제한효소 소화 (Smirnova AS et al. Immunogenetics 2007; 59:93-8) 등을 기초로 하는 것들을 포함한다. 보다 다른 방법들은 개체의 반수체형이 통계학적 평가들로부터 추론되도록 허용하는 집단에서 반수체형 블록들의 분포 및 연관 불평형 구조를 기초로 한다 (Clark AG. Mol Biol Evol 1990; 7:111-22; 10:13-9; Salem RM et al. Hum Genomics 2005; 2:39-66).Haplotypes can also be created by other methods well known to those skilled in the art. Examples of such methods include digital PCR (Ding C and Cantor CR. Proc Natl Acad Sci USA 2003; 100: 7449-7453; Ruano G et al. Proc Natl Acad Sci USA 1990; 87: 6296-6300), chromosome selection or separation. (Yang H et al. Proc Natl Acad Sci USA 2011; 108: 12-17; Fan HC et al. Nat Biotechnol 2011; 29: 51-57), sperm haplotype analysis (Lien S et al. Curr Protoc Hum Genet 2002) ; Chapter 1:Unit 1.6) and imaging techniques (Xiao M et al.
LOH 부위의 반수체형을 결정하는 또 다른 방법은 종양성 조직들이 입수가능한 경우 개체의 정상 조직들 및 종양성 조직들을 유전형 분석하는 것에 의한다. LOH의 존재 시, 종양 세포들의 매우 높은 분획 농도를 가진 종양 조직들은 LOH를 보이는 부위 내의 모든 SNP 좌위들에 대해 외관상 동종접합을 보여줄 것이다. 이들 SNP 좌위들의 유전형들은 하나의 반수체형 (도 1에서 LOH 부위의 Hap I)을 포함할 것이다. 한편, 정상 조직들은 개체가 LOH 부위 내의 SNP 좌위에 대해 이종접합인 점을 가리킬 것이다. 정상 조직들에서는 존재하지만 종양 조직들에서는 아닌 대립인자들은 다른 반수체형 (도 1에서 LOH 부위의 Hap Ⅱ)를 포함할 것이다.Another method of determining the haplotype of the LOH site is by genotyping the normal and neoplastic tissues of an individual when tumorous tissues are available. In the presence of LOH, tumor tissues with a very high fractional concentration of tumor cells will show apparently homozygous for all SNP loci within the site showing LOH. The genotypes of these SNP loci will include one haplotype (Hap I at the LOH site in FIG. 1 ). On the other hand, normal tissues will indicate that the subject is heterozygous for the SNP locus within the LOH site. Alleles present in normal tissues but not in tumor tissues will include other haplotypes (Hap II of the LOH region in FIG. 1 ).
B. 상대적B. Relative반수체형haplotype 용량 ( Volume (RHDORHDO)분석)analysis
상기에 언급된 바와 같이, 염색체 부위의 반수체형들 하나의 증폭 또는 결실을 가진 염색체 이상들은 종양 조직들에 있는 염색체 부위의 두 개 반수체형들의 용량 불균형을 유도할 것이다. 종양성 성장을 가진 사람의 혈장에서, 순환 DNA의 분획은 종양 세포들로부터 유래한다. 암 환자들의 혈장에서 종양-유래 DNA의 존재로 인해, 이러한 불균형은 그들의 혈장에서도 역시 존재할 것이다. 두 개 반수체형들의 용량에서 불균형은 각 반수체형으로부터 나온 분자들의 수를 계수하여 검출될 수 있다.As mentioned above, chromosomal abnormalities with amplification or deletion of one haplotype of a chromosomal region will lead to a dose imbalance of the two haplotypes of a chromosomal region in tumor tissues. In the plasma of a person with neoplastic growth, a fraction of circulating DNA is derived from tumor cells. Due to the presence of tumor-derived DNA in the plasma of cancer patients, this imbalance will also exist in their plasma. An imbalance in the doses of the two haplotypes can be detected by counting the number of molecules from each haplotype.
LOH가 종양 조직들에서 관찰되는 염색체 부위들의 경우 (예로, 도 1의 부위 120), Hap I은 조직들로부터 나온 Hap Ⅱ의 기여가 부족하기 때문에 Hap Ⅱ와 비교될 때 순환 DNA 분자들 (단편들) 중에서 과다-발현될 것이다. 사본수 증폭이 관찰되는 염색체 부위들의 경우, Hap Ⅱ는 종양 조직들로부터 나온 Hap Ⅱ의 추가적인 용량 방출 때문에 Hap Ⅱ의 단일-대립인자 증폭에 의해 영향을 받는 부위들의 경우Hap I과 비교될 때 과다-발현될 것이다. 과다 또는 과소 발현을 결정하기 위하여, 시료에서 소정의 DNA 단편들은 Hap I 또는 Hap Ⅱ로부터 나온 것으로 결정되고, 이는 다양한 방법들에 의해, 예로 보편적인 서열결정 및 정렬을 수행하거나 디지털 PCR 및 서열-특이 탐침들을 사용하여 시행될 수 있다.For chromosomal regions where LOH is observed in tumor tissues (eg, region 120 in FIG. 1 ), Hap I contains circulating DNA molecules (fragments) when compared to Hap II because Hap I lacks the contribution of Hap II from tissues. ) will be over-expressed. For chromosomal regions where copy number amplification is observed, Hap II is over-compared to Hap I for regions affected by mono-allele amplification of Hap II due to additional dose release of Hap II from tumor tissues. will be manifested To determine over- or under-expression, predetermined DNA fragments in a sample are determined to be from Hap I or Hap II, which can be obtained by various methods, e.g., by performing universal sequencing and alignment or by digital PCR and sequence-specific This can be done using probes.
서열결정된 태그들을 생성하도록 암 환자들의 혈장 (또는 기타 생물학적 시료)로부터 다수의 DNA 단편들의 서열결정 이후에, 두 개의 반수체형들 상의 대립인자들에 해당하는 서열결정된 태그들이 확인되고 계수될 수 있다. 다음으로 각 두 개의 반수체형들에 해당하는 서열결정된 태그들의 수들이 두 개 반수체형들이 혈장에서 동등하게 발현되는지 여부를 결정하도록 비교될 수 있다. 한 가지 구현예에서, 연속적 확률 테스트 (SPRT)가 혈장에서 두 개 반수체형들의 발현들이 유의하게 서로 다른지 여부를 결정하는 데 사용될 수 있다. 통계학적으로 유의한 차이는 분석된 염색체 부위에서 염색체 이상의 존재를 제시한다. 또한, 혈장에서 두 개 반수체형들의 정량적 차이는 상기 기술된 바와 같이 혈장에서 종양-유래 DNA의 분획 농도의 추정에 사용될 수 있다.After sequencing of multiple DNA fragments from the plasma (or other biological sample) of cancer patients to generate sequenced tags, sequenced tags corresponding to alleles on the two haplotypes can be identified and counted. The number of sequenced tags corresponding to each of the two haplotypes can then be compared to determine whether the two haplotypes are equally expressed in plasma. In one embodiment, a continuous probability test (SPRT) can be used to determine whether the expression of two haplotypes in plasma are significantly different. Statistically significant differences suggest the presence of chromosomal abnormalities at the analyzed chromosomal sites. In addition, the quantitative difference between the two haplotypes in plasma can be used for estimation of fractional concentrations of tumor-derived DNA in plasma as described above.
본 출원에서 기술된 DNA 단편의 정체 (identity) (예로, 인간 게놈에서 그의 위치)를 결정하는 진단적 접근법들은 검출 플랫폼으로서 대규모 병렬 서열결정을 사용하는 것에 제한되지 않는다. 이들 진단적 접근법들은, 예를 들어 이에 제한되는 것은 아니지만 마이크로플루이딕스 (microfluidics) 디지털 PCR 시스템들 (예로, 플루이다임 (Fluidigm) 디지털 어레이 시스템), 마이크로드롭 (microdroplet) 디지털 PCR 시스템 (예로, 레인댄스사 (RainDance) 및 퀀타라이프사 (QuantaLife)로부터 출시된 제품들), BEAM-ing 시스템 (예로, 비드들, 현탁 PCR, 증폭 및 자석들) (Diehl et al. ProcNatlAcadSci USA 2005; 102: 16368-16373), 실시간 PCR, 질량 분광분석법 기초한 시스템들 (예로, the 시쿼노매스어레이 (SequenomMassArray) 시스템) 또한 복합체 라이게이션-의존성 탐침 증폭 (MLPA) 분석에도 역시 적용될 수 있다.The diagnostic approaches to determining the identity of a DNA fragment described herein (eg, its location in the human genome) are not limited to using massively parallel sequencing as a detection platform. These diagnostic approaches include, for example, but not limited to, microfluidics digital PCR systems (eg, Fluidigm digital array system), microdroplet digital PCR systems (eg, lanes). products from RainDance and QuantaLife), BEAM-ing systems (eg beads, suspension PCR, amplification and magnets) (Diehl et al. ProcNatlAcadSci USA 2005; 102: 16368- 16373), real-time PCR, mass spectrometry-based systems (eg, the SequenomMassArray system) can also be applied to complex ligation-dependent probe amplification (MLPA) analysis.
정상 부위들normal parts
도 4는 본 발명의 구현예들에 따라 혈장에서 시행된 측정들과 함께 이상을 보여주지 않는 암세포 내의 염색체 부위들을 도시한다. 염색체 부위 410은, 예로 테스트될 특이적 암을 기초로 하거나 게놈의 큰 절편들로 확장되는 선결정된 분절들을 사용하는 일반적인 검색을 기초로 하는 방법이라면 모두에 의해 선택될 수 있다. 두 개 반수체형들을 분간하기 위하여, 두 개의 반수체형들은 먼저 결정된다. 도 4는 염색체 부위 410에 대한 정상 세포의 두 개 반수체형들 (Hap I 및 Hap Ⅱ)을 보여준다. 반수체형들은 첫 번째 다수의 좌위들 420을 포함한다. 본 첫 번째 다수의 좌위들 420은 분석된 염색체 부위 410으로 확장된다. 나타난 바와 같이, 이들 좌위들은 정상 세포에서 이종접합이다. 암세포를 위한 두 개 반수체형들도 역시 관찰된다. 암세포에서 부위들은 전혀 결실되거나 증폭되지 않는다.4 depicts chromosomal regions in cancer cells that do not show abnormalities with measurements performed in plasma according to embodiments of the present invention.
도 4는 각 좌위들 420를 위한 각 반수체형 상의 대립인자 계수들의 수를 나타낸다. 누적 합계 (total)가 염색체 부위 410의 소정의 소부위들을 위해 제공된다. 대립인자 계수들의 수는 각 특정한 좌위에서 반수체형에 해당하는 DNA 단편들의 수에 해당한다. 예를 들어, 첫 번째 좌위 421를 포함하고 대립인자 A를 가지는 DNA 단편은 Hap I로 계수되게 될 것이다. 또한, 대립인자 T를 가지는 DNA 단편은 Hap Ⅱ로 계수되게 될 것이다. 단편이 정렬하는 곳 (예로, 이것이 특정한 좌위를 포함하는지 여부) 및 이것이 포함하는 대립인자의 종류의 결정은 본 명세서에서 언급된 바와 같이 다양한 방식으로 결정될 수 있다. 두 개 반수체형들 상의 계수들의 비율은 통계학적으로 유의한 차이가 존재하는지 여부를 결정하는 데 사용될 수 있다. 두 개 수치들 간의 차이도 역시 사용될 수 있고; 차이는 단편들의 전체 수에 의해 정상화될 수 있다. 비율 및 차이 (또한 그의 함수들)는 이상이 존재하는지 여부의 분류를 결정하도록 역치들과 비교되는 매개변수들의 예들이다.Figure 4 shows the number of allele coefficients on each haplotype for each
RHDO 분석이 혈장에서 두 개 반수체형들의 불균형이라면 모두가 존재하는지 여부를 결정하기 위해 동일한 반수체형 (예로, 누적 계수들) 상의 모든 대립인자들, 예로 상기 언급된 로 (Lo)의 특허 출원들 제 12/940,992호 및 제 12/940,993호에 기술된 바와 같이 모성의 혈장에서 시행될 수 있는 바와 같이 사용될 수 있다. 본 방법은 불균형이라면 모두가 존재하는 지 여부를 결정하는 데 사용된 DNA 분자들의 수를 유의하게 증가시킬 수 있고, 따라서 암의 존재로 인한 불균형을 암 또는 비악성 병태의 부재 시 대립인자 계수들의 확률적 분포와 분간하는 더 나은 통계학적 능력을 유도한다. 복수의 SNP 좌위들을 분리하여 분석하는 것과는 대조적으로, RHDO 접근법은 두 개 염색체들 상의 대립인자들의 상대적 자리 (반수체형 정보)를 사용할 수 있어 동일한 염색체 상에 위치하는 대립인자들이 다함께 분석될 수 있다. 반수체형 정보의 부재 시, 서로 다른 SNP 좌위들의 대립인자 계수들은 반수체형이 혈장에서 과다 또는 과소 발현되는지 여부를 통계학적으로 결정하도록 함께 첨가될 수 없다. 대립인자 계수들의 정량은, 이에 제한되는 것은 아니지만 대규모 병렬 서열결정 (예로, 합성 시스템에 의한 일루미나 (Illumina) 서열결정을 사용함), 라이프 테크놀로지사 (Life Technologies)에 의해 라이게이션 기술학에 의한 서열결정 (SOLiD), 이온 토렌트사 (Ion Torrent) 및 라이프 테크놀로지사에 의한 이온 토렌트 서열결정 시스템, 나노포아 서열결정 (nanoporetech.com), 및 454 서열결정 기술학 (로슈사 (Roche)), 디지탈 PCR (예로, 마이크로플루이딕스사 디지탈 PCR에 의함 (예를 들어, 플루이다임 (fluidigm.com)) 또는 BEAMing (비드들, 현탁 PCR, 증폭, 자석들 (inostics.com)) 또는 드롭 PCR (예로, 퀀티라이프사 (quantalife.com) 및 레인댄스사 (raindancetechnologies.com)에 의함) 또한 실시간 PCR에 의해 수행될 수 있다. 본 기술학의 다른 시행예에서, 용액-내 포획을 사용하는 강화된 표적 서열결정 (예로, 애질런트사 (Agilent) SureSelect 시스템, 일루미나사 TruSeq 맞춤 강화 키트를 사용함) (illumina.com/applications/sequencing/targeted_resequencing.ilmn)을 사용하거나, 마이제노스틱사 (MyGenostics) GenCap 맞춤 강화 시스템 (mygenostics.com/))또는 어레이-기초 포획 (예로, 로슈사 NimbleGen 시스템을 사용함)에 의해 사용될 수 있다.All alleles on the same haplotype (e.g., cumulative coefficients) to determine whether RHDO analysis is disequilibrium of two haplotypes in plasma, e.g.,
도 4에 나타난 예에서, 첫 번째 두 개 SNP 좌위들 (첫 번째 SNP의 경우 24 vs 26 및 두 번째 SNP의 경우 18 vs 20)은 약간의 대립인자 불균형이 관찰된다. 그러나, 대립인자 계수들의 수는 실제 대립인자 불균형이 존재하는지 여부를 결정하는 데 통계학적으로 충분하지 않다. 따라서, 동일한 반수체형 상의 대립인자의 계수들은 두 개 반수체형들에 대한 누적 대립인자 계수들이 두 개 반수체형들 간의 대립인자 불균형이 염색체 부위 410 (본 예의 경우 다섯 번째 SNP)에 전혀 존재하지 않는 것으로 통계학적으로 판단하는 데 충분할 때까지 첨가된다. 통계학적으로 유의한 분류에 도달한 이후, 누적 계수는 재설정된다 (본 예의 경우 여섯 번째 SNP). 다음으로 누적 계수는 두 개 반수체형들에 대한 누적 대립인자 계수들이 두 개 반수체형들 간의 대립인자 불균형이 부위 410의 특정한 소부위에 없는 것으로 통계학적으로 판단하는 데 다시 충분할 때까지 결정된다. 전체 누적 계수가 부위 전부에 마찬가지로 사용될 수 있지만, 이전의 방법은 서로 다른 소부위들이 테스트되도록 허용하고, 이는 부위 410 전부와 반대되는 이상의 위치를 결정하는 데 더 큰 정확성 (예로, 소부위)을 제공한다. 실제 대립인자 불균형이 존재하는지 여부를 결정하는 통계학적 테스트들의 예들로는, 이에 제한되는 것은 아니지만 연속적 확률 테스트 (Zhou W, et al. Nat Biotechnol 2001; 19: 78-81; Zhou W, et al. Lancet. 2002; 359: 219-25), t-테스트, 및 카이-제곱 테스트를 포함한다.In the example shown in FIG. 4 , a slight allele imbalance is observed for the first two SNP loci (24 vs 26 for the first SNP and 18
결실을 검출하는 것to detect a deletion
도 5는 본 발명의 구현예들에 따라 결실된 부위를 결정하도록 혈장에서 작성된 측정들과 함께 암세포 내의 염색체 부위 510의 결실을 도시한다. 도 5는 염색체 부위 510에 대한 정상 세포의 두 개 반수체형들 (Hap I 및 Hap Ⅱ)을 보여준다. 반수체형들은 분석된 염색체 부위 510를 확장시키는 첫 번째 다수의 이종접합 좌위520을 포함한다. 암세포의 두 개 반수체형들도 역시 관찰된다. 암세포에서, 부위 510은 Hap Ⅱ가 결실된다. 도 4에서와 같이, 도 5도 역시 각 좌위들 520을 위한 대립인자 계수들의 수를 보여준다. 누적 합계도 역시 염색체 부위 510 내의 소정의 소부위들을 위해 유지된다.5 depicts deletion of
종양 조직들은 전형적으로 종양 세포들 및 비종양 세포들의 혼합물을 포함하기 때문에, LOH는 부위 510 내의 좌위들에 있는 두 개 대립인자들의 양의 비율을 측정하여 표현될 수 있다. 이러한 상황에서, 부위 510에서 결실된 반수체형 Hap Ⅱ는 정상 조직들 상의 해당 좌위들과 비교될 때 DNA 양들의 상대적 감소를 보여주는 좌위들 520의 좌표들에 의해 결정될 수 있다. 더욱 자주 출현하는 단편들을 가진 반수체형은 Hap I이고, 이는 종양 세포들에서 보유된다. 소정의 구현예들에서, 결실된 및 보유된 반수체형들이 바로 결정되게 하도록, 종양 시료에서 종양 세포들의 비율을 강화할 절차를 수행하는 것이 바람직할 수 있다. 이러한 절차의 한 가지 예가 미세절개 (수작업 또는 레이저 포획 기법들에 의함)이다.Since tumor tissues typically contain a mixture of tumor cells and non-tumor cells, LOH can be expressed by measuring the ratio of the amounts of the two alleles at loci within
이론적으로, Hap I 상의 각 대립인자들은 종양 조직들에서 LOH를 보이는 염색체 부위의 경우 순환 DNA에서 과다-발현될 것이고 대립인자 불균형의 정도는 혈장에서 종양 DNA의 분획 농도에 의존할 것이다. 그러나 동시에, 순환 DNA 시료라면 모두에서 두 개 대립인자들의 상대적인 과다 (abundance)도 역시 포아송 분포에 의해 관리될 것이다. 통계학적 분석은 관찰된 대립인자 불균형이 암 조직들에서 LOH 존재로 인한 것 또는 기회로 인한 것인지 여부를 결정하도록 수행될 수 있다. 암에서 LOH와 연관된 실제 대립인자 불균형을 검출하는 능력은 분석되는 순환 DNA 분자들의 수 및 종양성 DNA의 분획 농도에 의존적이다. 종양성 DNA의 더 높은 분획 농도 및 분석되는 분자들의 더 많은 수는 실제 대립인자 불균형을 검출하는 더 높은 민감도 및 특이도를 생기게 할 것이다.Theoretically, each allele on Hap I would be over-expressed in circulating DNA for chromosomal regions exhibiting LOH in tumor tissues and the degree of allele imbalance would depend on the fractional concentration of tumor DNA in plasma. At the same time, however, the relative abundance of both alleles in both circulating DNA samples will also be governed by the Poisson distribution. Statistical analysis can be performed to determine whether the observed allele imbalance is due to chance or due to the presence of LOH in cancer tissues. The ability to detect the actual allelic imbalance associated with LOH in cancer is dependent on the number of circulating DNA molecules analyzed and the fractional concentration of oncogenic DNA. A higher fraction concentration of oncogenic DNA and a greater number of molecules analyzed will result in higher sensitivity and specificity to detect true allelic imbalances.
도 5에 나타난 예에서, 첫 번째 두 개 SNP 좌위들 (첫 번째 SNP의 경우 24 vs 22 및 두 번째 SNP의 경우 18 vs 15)의 경우 약간의 대립인자 불균형이 관찰된다. 그러나, 대립인자 계수들의 수는 실제 대립인자 불균형이 존재하는지 여부를 결정하는 데 통계학적으로 충분하지 않다. 따라서, 동일한 반수체형 상의 대립인자의 계수들은 두 개 반수체형들에 대한 누적 대립인자 계수들이 두 개 반수체형들 간의 대립인자 불균형이 염색체 부위 510 (본 예의 경우 다섯 번째 SNP)에 존재하지 것으로 통계학적으로 판단하는 데 충분할 때까지 함께 첨가된다. 일정 구현예들에서는, 불균형만이 알려져 있고 특이적 유형 (증폭의 결실)은 결정되지 않는다. 다음으로 누적 계수가 두 개 반수체형들에 대한 누적 대립인자 계수들이 부위 510의 특정한 소부위에 대한 두 개 반수체형들 간의 대립인자 불균형이 통계학적으로 판단하는 데 다시 충분할 때까지 결정된다. 전체 누적 계수가 부위 전부에 본 명세서에서 기술된 방법이라면 모두에서 시행될 수 있는 바와 같이 마찬가지로 사용될 수 있다.In the example shown in FIG. 5 , a slight allele imbalance is observed for the first two SNP loci (24 vs 22 for the first SNP and 18
염색체 부위의 증폭을 검출하는 것Detecting amplification of chromosomal regions
도 6은 본 발명의 구현예들에 따라 증폭된 부위를 결정하도록 혈장에서 작성된 측정들과 함께 암세포 내의 염색체 부위 610의 증폭을 도시한다. LOH에 추가하여, 염색체 부위들의 증폭도 역시 암 조직들에서 빈번하게 관찰된다. 도 6에 나타낸 예에서, 염색체 부위 610의 Hap Ⅱ는 암세포에서 세 개의 사본들로 증폭된다. 나타난 바와 같이, 부위 610은 이전의 도면들에서 관찰되는 더 긴 부위들과는 반대되는 바와 같이 6개의 이종접합 좌위들만을 포함한다. 증폭은 과다-발현이 통계학적으로 유의한 유의한 것으로 결정되는 여섯 번째 좌위들에서 통계학적으로 유의한 것으로서 검출되었다. 일정 구현예들에서, 하나의 불균형만이 알려져 있고 특이적 유형 (결실 또는 증폭)은 결정되지 않는다. 다른 구현예들에서, 암세포는 획득되고 분석될 수 있다. 이러한 분석은 불균형이 결실 (암세포가 결실된 부위에 대해 동종접합임) 또는 증폭 (암세포가 증폭된 부위에 대해 이종접합임)으로 인한 것인지 여부에 대한 정보를 제공한다. 다른 시행예들에서, 결실 또는 증폭이 존재하는지 여부는 부위 전부를 (예로, 개별적으로 반수체형들이 아님) 분석하도록 섹션 Ⅳ의 방법들을 사용하여 결정될 수 있다. 부위가 과다-발현된 경우라면, 이상은 증폭이고; 부위가 과소-발현된 경우라면, 이상은 결실이다. 부위 620도 역시 분석되고 누적 계수들은 불균형이 전혀 존재하지 않는 점을 입증한다.6 depicts amplification of
혈청serumRHDORHDO 분석을 위한 for analysisSPRTSPRT 분석 analysis
이종접합성 좌위들을 가진 염색체 부위들이라면 모두를 위해, RHDO 분석이 혈장에서 두 개 반수체형들의 용량 불균형이라면 모두가 있는지 여부를 결정하는 데 사용될 수 있다. 이들 부위들에서, 혈장에서 반수체형 용량 불규형의 존재는 혈장 시료에서 종양-유래 DNA의 존재를 제시하고 있다. 한 가지 구현예에서, SPRT 분석은 Hap I 및 Hap Ⅱ에 대한 서열결정된 해독 (reads)의 수에서 차이가 통계학적으로 유의한지 여부를 결정하는 데 사용될 수 있다. SPRT 분석의 본 예에서, 우리는 먼저 각 두 개의 반수체형들로부터 나온 서열결정된 해독의 수를 결정한다. 다음으로, 우리는 잠재적으로 과다-발현된 반수체형이 기여하는 서열결정된 해독의 비례적 양을 나타내는 매개변수 (예로, 분획)를 결정할 수 있다 (예로, 다른 반수체형의 해독 수로 나눈 반수체형의 해독 수의 분획). 잠재적으로 과다-발현된 반수체형은 LOH의 시나리오에서는 비-결실된 반수체형이고 염색체 부위의 단일-대립인자 증폭의 시나리오에서는 증폭된 반수체형일 것이다. 다음으로, 본 분획은 귀무가설, 예로 반수체형 용량 불균형의 부재 및 대안의 가설, 예로 반수체형 용량 불균형의 존재를 기초로 하여 구축된 두 개의 역치 수치들과 비교될 것이다. 분획이 상부 역치 이상인 경우라면, 이것은 혈장에서 두 개의 반수체형들의 통계학적으로 유의한 불균형의 존재를 가리킨다. 분획이 저부 역치 미만인 경우라면, 이것은 두 개의 반수체형들의 통계학적으로 유의한 불균형이 전혀 존재하지 않는 점을 가리킨다. 분획이 상부 및 저부 역치들 사이에 있는 경우라면, 이것은 판단하도록 충분한 통계학적 능력이 없는 점을 가리킨다. 분석되는 부위에 대한 이종접합성 좌위들의 수에서의 연속적 증가는 성공적인 SPRT 분류가 작성될 때까지 수행될 수 있다.For all chromosomal regions with heterozygous loci, RHDO analysis can be used to determine if there is any dose imbalance of the two haplotypes in plasma. At these sites, the presence of haplotype dose asymmetry in plasma suggests the presence of tumor-derived DNA in the plasma sample. In one embodiment, SPRT analysis can be used to determine whether a difference in the number of sequenced reads for Hap I and Hap II is statistically significant. In this example of SPRT analysis, we first determine the number of sequenced reads from each of the two haplotypes. Next, we can determine a parameter (e.g., fraction) that represents the proportional amount of sequenced translation contributed by a potentially over-expressed haplotype (e.g., translation of a haplotype divided by the number of translations of other haplotypes) fraction of numbers). A potentially over-expressed haplotype would be a non-deleted haplotype in the scenario of LOH and an amplified haplotype in the scenario of single-allele amplification of a chromosomal region. Next, this fraction will be compared with two threshold values built on the basis of the null hypothesis, eg the absence of haplotype dose imbalance, and the presence of an alternative hypothesis, eg haplotype dose imbalance. If the fraction is above the upper threshold, this indicates the presence of a statistically significant imbalance of the two haplotypes in plasma. If the fraction is below the lower threshold, this indicates that there is no statistically significant disparity between the two haplotypes. If the fraction is between the upper and lower thresholds, this indicates that there is not sufficient statistical power to judge. Successive increases in the number of heterozygous loci for the site being analyzed can be performed until a successful SPRT classification is established.
SPRT의 상부 및 저부 경계들을 계산하는 방정식들은:The equations for calculating the upper and lower boundaries of the SPRT are:
상부 역치 = [(In 8)/N - Inδ]/Lnγ; 저부 역치 = [(In 1/8)/N - Inδ]/Ln,upper threshold = [(In 8)/N - Inδ]/Lnγ; Bottom Threshold = [(In 1/8)/N - Inδ]/Ln,
여기에서 δ = (1 - θ1)/(1 - θ2) 및 γ =
LOH의 시나리오에서, θ1 = 1/(2 - F). 단일-대립인자 증폭의 시나리오에서, θ1 = (1 + zF)/(2 + zF), 여기에서 z는 종양에서 증폭되는 염색체 부위의 여분의 사본 수를 나타낸다. 예를 들어, 하나의 염색체가 복제되는 경우라면, 특정한 염색체의 하나의 여분의 사본이 있을 것이다. 그러면, z는 1과 같다.In the scenario of LOH, θ1 = 1/(2 - F). In the scenario of single-allele amplification, θ1 = (1 + zF)/(2 + zF), where z represents the number of extra copies of the chromosomal region being amplified in the tumor. For example, if one chromosome is being copied, there will be one extra copy of a particular chromosome. Then, z is equal to 1.
도 7은 본 발명의 구현예들에 따라 종양 조직에서 단일-대립인자 증폭을 보였던 염색체 1p에 위치하는 분절에 대한 간세포 암종 (HCC) 환자의 혈장 DNA의 RHDO 분석을 나타낸다. 녹색의 삼각형들은 환자의 데이타를 나타낸다. 서열결정된 해독의 전체 수는 분석되고 있는 SNPs의 증가하는 수와 함께 증가하였었다. 종양에서 증폭된 반수체형으로부터 나온 전체 서열결정된 해독의 분획은 분석된 서열결정된 해독의 전체 수와 함께 변화하였고 궁극적으로 상부 역치보다 더 높은 수치에 도달하였다. 이것은 유의한 반수체형 용량 불균형을 가리키고, 따라서 혈장에서 암-연관된 염색체 이상의 존재를 지지하고 있다.7 shows RHDO analysis of plasma DNA from hepatocellular carcinoma (HCC) patients for a segment located on chromosome 1p that showed single-allele amplification in tumor tissue according to embodiments of the present invention. Green triangles represent patient data. The total number of sequenced reads increased with the increasing number of SNPs being analyzed. The fraction of total sequenced translations from the amplified haplotypes in the tumor varied with the total number of sequenced translations analyzed and ultimately reached a number higher than the upper threshold. This indicates a significant haplotype dose imbalance, thus supporting the presence of cancer-associated chromosomal abnormalities in plasma.
SPRT를 사용하는 RHDO 분석은 종양 조직에서 증폭들 및 결실들을 보이는 HCC 환자의 모든 염색체 부위들을 위해 수행되었다. 결과들은 LOH를 가지는 것으로 알려진 922개 분절들 및 증폭을 가지는 것으로 알려진 105개 분절들의 경우 다음과 같다. LOH의 경우, 922개 분절들이 SPRT로 분류되었고, 분절들의 921개는 혈장에서 반수체형 용량 불균형을 가지는 것으로 정확하게 확인되어, 99.99%의 정확도를 제공하였다. 단일-대립인자 증폭의 경우, 105개 분절들이 SPRT로 분류되었고, 분절들의 105개는 혈장에서 반수체형 용량 불균형을 가지는 것으로 정확하게 확인되어, 100%의 정확도를 제공하였다.RHDO analysis using SPRT was performed for all chromosomal regions of HCC patients showing amplifications and deletions in tumor tissue. Results are as follows for 922 segments known to have LOH and 105 segments known to have amplification. For LOH, 922 segments were classified as SPRT, and 921 of segments were correctly identified as having haplotype dose imbalance in plasma, providing an accuracy of 99.99%. For single-allele amplification, 105 segments were classified as SPRT, and 105 of the segments were correctly identified as having haplotype dose imbalance in plasma, providing an accuracy of 100%.
C. 상대적C. Relative반수체형haplotype 크기 분석 size analysis
두 개의 반수체형들에 정렬된 단편들의 용량을 계수하는 것의 대안으로서, 각각의 반수체형들의 단편들의 크기가 사용될 수 있다. 예를 들어, 특정한 염색체 부위를 위해, 하나의 반수체형으로부터 나온 DNA 단편들의 크기가 다른 반수체형의 DNA 단편들의 크기와 비교될 수 있다. 부위의 첫 번째 반수체형의 이종접합 좌위들에서 대립인자들이라면 모두에 해당하는 DNA 단편들의 크기 분포를 분석하고, 이를 두 번째 반수체형의 이종접합 좌위들에서 대립인자들이라면 모두에 해당하는 DNA 단편들의 크기 분포와 비교한다. 크기 분포에서 통계학적으로 유의한 차이는 계수들의 수와 유사한 방식으로 이상을 확인하는 데 사용될 수 있다.As an alternative to counting the dose of fragments aligned to two haplotypes, the size of the fragments of each haplotype can be used. For example, for a particular chromosomal region, the size of DNA fragments from one haplotype can be compared to the size of DNA fragments from another haplotype. The size distribution of DNA fragments corresponding to all alleles at the heterozygous loci of the first haplotype of the site is analyzed, and the size of the DNA fragments corresponding to all alleles at the heterozygous loci of the second haplotype of the site is analyzed. Compare with the distribution. A statistically significant difference in the size distribution can be used to identify anomalies in a manner similar to the number of coefficients.
전체 (예로, 종양성과 비종양성을 더함) 혈장 DNA의 크기 분포는 암 환자들에서 증가하는 것으로 보고되어 왔다 (Wang BG, et al. Cancer Res. 2003; 63: 3966-8). 그러나, 종양-유래 DNA (DNA 전체량 (예로, 종양과 비종양을 더함) 대신에)를 상세하게 연구하고 있는 경우라면, 다음으로 종양-유래 DNA 분자들의 크기 분포가 비종양 세포들로부터 유래한 분자들의 분포보다 더 짧은 점이 관찰되었다 (Diehl et al. Proc Natl Acad Sci U S A. 2005;102:16368-73). 따라서, 순환 DNA의 크기 분포는 암-연관된 염색체 이상들이 존재하는지 여부를 결정하는 데 사용될 수 있다. 크기 분석의 원리는 도 8에 나타나 있다.The size distribution of total (eg, plus neoplastic and non-neoplastic) plasma DNA has been reported to increase in cancer patients (Wang BG, et al. Cancer Res. 2003; 63: 3966-8). However, if you are studying in detail tumor-derived DNA (instead of the total amount of DNA (eg, tumor plus non-tumor)), then the size distribution of tumor-derived DNA molecules is determined by A point shorter than the distribution of molecules was observed (Diehl et al. Proc Natl Acad Sci US A. 2005;102:16368-73). Thus, the size distribution of circulating DNA can be used to determine whether cancer-associated chromosomal abnormalities are present. The principle of size analysis is shown in FIG. 8 .
도 8은 본 발명의 구현예들에 따라 결실을 포함하는 종양이 존재할 때 염색체 부위의 두 개 반수체형들에 대한 단편들의 크기 분포에서 변화를 나타낸다. 도 8에 도시된 바와 같이, T 대립인자가 종양 조직들에서 결실된다. 그 결과로, 종양 조직들은 A 대립인자의 짧은 분자들만을 혈장으로 방출할 것이다. 종양-유래 짧은 DNA 분자들은 혈장에서 A 대립인자에 대한 크기 분포의 전반적인 단축화를 유도하여, 혈장에서 T 대립인자와 비교하여 더 짧은 A 대립인자의 크기 분포를 가져올 것이다. 이전의 섹션들에서 논의된 바와 같이, 동일한 반수체형 상에 위치하는 모든 대립인자들은 다함께 분석될 수 있다. 다른 말로 하면, 하나의 반수체형 상에 위치하는 대립인자들을 보유하는 DNA 분자들에 대한 크기 분포는 다른 반수체형 상에 위치하는 대립인자들을 보유하는 DNA 분자들에 대한 것과 비교될 수 있다. 종양조직들에서 결실된 분수체형은 혈장에서 더 긴 크기 분포를 보여줄 것이다.8 shows the change in the size distribution of fragments for two haplotypes of a chromosomal region in the presence of a tumor comprising a deletion according to embodiments of the present invention. As shown in Figure 8, the T allele is deleted in tumor tissues. As a result, tumor tissues will release only short molecules of the A allele into the plasma. Tumor-derived short DNA molecules will induce an overall shortening of the size distribution for the A allele in plasma, resulting in a shorter size distribution of the A allele compared to the T allele in plasma. As discussed in previous sections, all alleles located on the same haplotype can be analyzed together. In other words, the size distribution for DNA molecules carrying alleles located on one haplotype can be compared to that for DNA molecules carrying alleles located on another haplotype. Depleted fractions in tumor tissues will show a longer size distribution in plasma.
크기 분석은 암과 연관된 염색체 부위들의 증폭을 검출하는데도 역시 적용될 수 있다. 도 9는 본 발명의 구현예들에 따라 증폭을 포함하는 종양이 존재할 때 염색체 부위의 두 개 반수체형들에 대한 단편들의 크기 분포에서 변화를 나타낸다. 도 9에서 나타난 예에서, 대립인자 T를 보유하는 염색체 부위는 종양에서 복제된다. 그 결과로, A 대립인자의 크기 분포와 비교하여 T 대립인자의 크기 분포의 전반적인 단축화를 가져올 것이다. 크기 분석은 동일한 반수체형 상에 위치하는 모든 대립인자들에 종합적으로 적용될 수 있다. 다른 말로 하면, 종양 조직들에서 증폭된 반수체형에 대한 크기 분포는 종양에서 증폭되지 않은 반수체형에 대한 크기 분포보다 더 짧을 것이다.Size analysis can also be applied to detect amplification of chromosomal regions associated with cancer. 9 shows the change in the size distribution of fragments for two haplotypes of a chromosomal region in the presence of a tumor comprising amplification according to embodiments of the present invention. In the example shown in Figure 9, the chromosomal region carrying allele T is replicated in the tumor. As a result, it will result in an overall shortening of the size distribution of the T allele compared to the size distribution of the A allele. Size analysis can be applied comprehensively to all alleles located on the same haplotype. In other words, the size distribution for an amplified haplotype in tumor tissues will be shorter than the size distribution for a non-amplified haplotype in the tumor.
순환 DNA의 크기 분포의of the size distribution of circulating DNA단축화의shortened 검출 detection
두 개의 반수체형들, 즉 Hap I 및 Hap Ⅱ으로부터 나온 DNA 단편들의 크기는, 이에 제한되는 것은 아니지만 쌍을 이룬 말단 대규모 병렬 서열결정에 의해 결정될 수 있다. DNA 단편의 말단들을 서열결정한 이후에, 서열결정된 해독 (태그들)은 기준 인간 게놈에 정렬될 수 있다. 서열결정된 DNA 분자들의 크기는 각 말단에서 최외부 뉴클레오타이드의 좌표들로부터 추론될 수 있다. 분자의 서열결정된 태그들은 서열결정된 DNA 단편이 Hap I 또는 Hap Ⅱ로부터 나오는지를 결정하는 데 사용될 수 있다. 예를 들어, 서열결정된 태그들의 하나는 분석되고 있는 염색체 부위에서 이종접합 좌위들을 포함할 수 있다.The size of DNA fragments from two haplotypes, Hap I and Hap II, can be determined by, but not limited to, paired-terminal massively parallel sequencing. After sequencing the ends of the DNA fragment, the sequenced translations (tags) can be aligned to a reference human genome. The size of the sequenced DNA molecules can be inferred from the coordinates of the outermost nucleotide at each end. The sequenced tags of the molecule can be used to determine whether the sequenced DNA fragment is from Hap I or Hap II. For example, one of the sequenced tags may include heterozygous loci in the chromosomal region being analyzed.
따라서, 각 서열결정된 분자를 위해 우리는 크기 및 Hap I 또는 Hap Ⅱ로부터 나오는지 여부 둘 다를 결정할 수 있다. 각 반수체형에 정렬된 단편들의 크기를 기초로 하여, 컴퓨터 시스템은 Hap I 및 Hap Ⅱ 둘 다에 대한 크기 분포 프로파일들 (예로, 평균 단편 크기)를 계산할 수 있다. Hap I 및 Hap Ⅱ로부터 나온 DNA 단편들의 크기 분포는 크기 분포들이 이상을 확인하도록 충분하게 서로 다른 시점을 결정하도록 적절한 통계학적 분석을 사용하여 비교될 수 있다.Thus, for each sequenced molecule we can determine both the size and whether it comes from Hap I or Hap II. Based on the size of the fragments aligned to each haplotype, the computer system can calculate size distribution profiles (eg, average fragment size) for both Hap I and Hap II. The size distributions of DNA fragments from Hap I and Hap II can be compared using appropriate statistical analysis to determine time points at which the size distributions differ sufficiently to identify anomalies.
쌍을 이룬 말단 대규모 병렬 서열결정과는 별도로, 이에 제한되는 것은 아니지만 전체 DNA 단편들을 서열결정하는 것, 질량 분광분석법, 및 관찰된 DNA 분자들의 길이들을 관찰하고 표준과 비교하는 광학적 방법들을 포함하는 다른 방법들이 DNA 단편들의 크기를 결정하는 데 사용될 수 있다.Apart from paired-end massively parallel sequencing, other methods including, but not limited to, sequencing whole DNA fragments, mass spectrometry, and optical methods of observing and comparing the lengths of the observed DNA molecules to a standard Methods can be used to determine the size of DNA fragments.
다음, 우리는 종양들의 유전적 이상들과 연관된 순환 DNA의 단축화를 검출하는 방법들의 두 가지 예를 소개한다. 이들 두 방법들은 DNA 단편들의 두 개 집단들에 대한 크기 분포에서 차이의 정량적 측정을 제공하는 것을 목적으로 한다. DNA 단편들의 두 개 집단들은 Hap I 및 Hap Ⅱ에 해당하는 DNA 분자들을 말한다.Next, we introduce two examples of methods for detecting shortening of circulating DNA associated with genetic abnormalities in tumors. These two methods aim to provide a quantitative measure of the difference in size distribution for two populations of DNA fragments. The two groups of DNA fragments refer to the DNA molecules corresponding to Hap I and Hap II.
짧은 DNA 단편들의 분획에서 차이Differences in the fraction of short DNA fragments
한 가지 시행예에서, 짧은 DNA 단편들의 분획이 사용된다. 짧은 DNA 분자들을 정의하도록 컷오프 크기 (w)를 설정한다. 컷오프 크기는 서로 다른 진단적 목적들을 맞추도록 변화되고 선택될 수 있다. 컴퓨터 시스템은 크기 컷오프와 동등하거나 이보다 짧은 분자들의 수를 결정할 수 있다. 다음으로 DNA 단편들의 분획 (Q)가 짧은 DNA의 수를 DNA 단편들의 전체 수로 나누어 계산될 수 있다. Q의 수치는 DNA 분자들 집단의 크기 분포에 의해 영향을 받을 것이다. 더 짧은 전반적인 크기 분포는 DNA 분자들의 더 높은 비율이 짧은 단편들일 것이고, 따라서 더 높은 Q 수치를 주는 점을 의미한다.In one embodiment, fractions of short DNA fragments are used. Set the cutoff size (w) to define short DNA molecules. The cutoff size can be varied and selected to suit different diagnostic purposes. The computer system can determine the number of molecules equal to or shorter than the size cutoff. The fraction (Q) of DNA fragments can then be calculated by dividing the number of short DNA by the total number of DNA fragments. The value of Q will be affected by the size distribution of the population of DNA molecules. A shorter overall size distribution means that a higher proportion of DNA molecules will be short fragments, thus giving higher Q values.
짧은 DNA 단편들의 분획에서 Hap I 및 Hap Ⅱ 간의 차이가 다음으로 사용될 수 있다. Hap I 및 Hap Ⅱ로부터 나온 DNA 단편들의 크기 분포에서 차이는 Hap I 및 Hap Ⅱ (Q)에 대한 짧은 단편들의 분획에서 차이에 의해 반영될 수 있다. △Q = QHapI - QHapⅡ, 여기에서 QHapI은 Hap I DNA 단편들에 대한 짧은 단편들의 분획이고; QHapⅡ는 Hap Ⅱ 에 대한 DNA 단편들에 대한 짧은 단편들의 분획이다. QHapI 및 QHapⅡ은 각 반수체들로부터 나온 단편들의 크기 분포들의 두 개 그룹들의 통계학적 수치의 예들이다.The difference between Hap I and Hap II in the fraction of short DNA fragments can be used next. The difference in the size distribution of DNA fragments from Hap I and Hap II can be reflected by the difference in the fraction of short fragments for Hap I and Hap II (Q).ΔQ = Q HapI - QHapII , where QHapI is the fraction of short fragments to Hap I DNA fragments; QHapII is a fraction of short fragments to DNA fragments for Hap II. QHapI and QHapII are examples of statistical values of two groups of size distributions of fragments from respective haploids.
이전의 섹션에서 도시된 바와 같이, Hap Ⅱ가 종양 조직들에서 결실될 때 Hap I DNA 단편들의 크기 분포는 Hap Ⅱ DNA 단편들의 것보다 짧을 것이다. 그 결과로, △Q의 양성 수치가 관찰될 것이다. △Q의 양성 수치는 △Q가 결실이 존재하는 것으로 고려되기 충분하게 큰지를 결정하도록 역치 수치와 비교될 수 있다. Hap I의 증폭도 역시 △Q의 양성 수치를 나타낼 것이다. 종양 조직들에서 Hap Ⅱ의 복제가 존재할 때, Hap Ⅱ DNA 단편들의 크기 분포는 Hap I DNA 단편들의 크기 분포보다 짧을 것이다. 따라서, △Q의 수치는 음성이 될 것이다. 염색체 이상의 부재 시, 혈장/혈청에서 Hap I 및 Hap Ⅱ DNA 단편들의 크기 분포가 유사할 것이다. 따라서, △Q의 수치는 대략 제로일 것이다.As shown in the previous section, the size distribution of Hap I DNA fragments will be shorter than that of Hap II DNA fragments when Hap II is deleted in tumor tissues. As a result, a positive value of ΔQ will be observed. A positive value of ΔQ may be compared to a threshold value to determine if ΔQ is large enough to be considered a deletion present. Amplification of Hap I will also show a positive value of ΔQ. When there is replication of Hap II in tumor tissues, the size distribution of Hap II DNA fragments will be shorter than that of Hap I DNA fragments. Therefore, the value of ΔQ will be negative. In the absence of chromosomal abnormalities, the size distribution of Hap I and Hap II DNA fragments in plasma/serum will be similar. Thus, the value of ΔQ will be approximately zero.
환자의 △Q는 수치가 정상인지를 결정하도록 정상 개인들과 비교될 수 있다. 추가적으로 또는 임의적으로, 환자의 △Q 수치가 비정상인지를 결정하도록 유사한 암들을 가진 환자들로부터 획득된 수치들과 비교될 수 있다. 이러한 비교는 본 명세서에서 기술된 바와 같은 역치 수치들과 비교(들)이 관여할 수 있다. 질환의 감시의 문맥에서, 수치 △Q는 일련으로 계속 감시될 수 있다. △Q의 수치에서 변화는 혈장/혈청에서 종양성 DNA의 증가된 분획 농도를 가리킬 수 있다. 본 기술학의 선택된 시행예에서, 종양성 DNA의 증가된 농도는 종양 단계, 예후 판단 및 질환의 진행과 상관될 수 있다. 서로 다른 시간대에서의 측정들을 사용하는 이러한 시행예는 이후에 보다 자세하게 논의된다.A patient's ΔQ can be compared to normal individuals to determine if the level is normal. Additionally or optionally, the ΔQ level of the patient may be compared to values obtained from patients with similar cancers to determine if they are abnormal. Such comparison may involve comparison(s) with threshold values as described herein. In the context of monitoring a disease, the value ΔQ can be continuously monitored in series. A change in the value of ΔQ may indicate an increased fractional concentration of neoplastic DNA in plasma/serum. In selected implementations of the present technology, increased concentrations of oncogenic DNA may be correlated with tumor stage, prognostic judgment and disease progression. This implementation using measurements in different time zones is discussed in more detail later.
짧은 DNA 단편들이 기여하는 전체 길이 분획에서 차이Differences in total length fraction contributed by short DNA fragments
본 시행예에서, 짧은 DNA 단편들이 기여하는 전체 길이의 분획이 사용된다. 컴퓨터 시스템은 시료에서 DNA 단편들 그룹의 전체 길이를 결정할 수 있다 (예로, 주어진 부위의 특정한 반수체형으로부터 또는 주어진 부위로부터 바로 나온 단편들). DNA 단편들이 "짧은 단편들"로서 정의하는 것 미만의 컷오프 크기가 선택된다. 컷오프 크기는 서로 다른 진단적 목적들을 맞추도록 변화되고 선택될 수 있다. 다음으로, 컴퓨터 시스템은 짧은 DNA 단편들의 전체 길이를 컷오프 크기와 동등하거나 이보다 짧은 DNA 단편들의 무작위 선택의 길이를 합산하여 결정할 수 있다. 다음으로 짧은 DNA 단편들이 기여하는 전체 길이 분획이 다음과 같이 계산될 수 있다: F = ΣW길이 /ΣN길이, 여기에서 ΣW길이는 w (bp)와 동등하거나 이하의 길이를 가진 DNA 단편들의 길이들의 합을 나타내고; ΣN길이는 선결정된 길이 N과 동등하거나 이하의 길이를 가진 DNA 분자들의 길이들의 합계를 나타낸다. 한 가지 구현예에서, N은 600개 염기들이다. 그러나 다른 크기 한계들, 예로, 150개 염기들, 180개 염기들, 200개 염기들, 250개 염기들, 300개 염기들, 400개 염기들, 500개 염기들, 및 700개 염기들이 "전체 길이"를 계산하는 데 사용될 수 있다.In this example, the fraction of the full length contributed by short DNA fragments is used. The computer system can determine the overall length of a group of DNA fragments in a sample (eg, fragments from a particular haplotype at a given site or directly from a given site). A cutoff size less than what DNA fragments define as “short fragments” is selected. The cutoff size can be varied and selected to suit different diagnostic purposes. The computer system can then determine the total length of the short DNA fragments by summing the lengths of a random selection of DNA fragments equal to or shorter than the cutoff size. Next, the total length fraction contributed by the short DNA fragments can be calculated as: F = ΣW length / ΣN length, where ΣW length is a DNA fragment with a length equal to or less than w (bp). represent the sum of their lengths; ΣN length represents the sum of the lengths of DNA molecules having a length equal to or less than a predetermined length N. In one embodiment, N is 600 bases. However, other size limits, e.g., 150 bases, 180 bases, 200 bases, 250 bases, 300 bases, 400 bases, 500 bases, and 700 bases "total length" can be used to calculate
600개 염기들 미만의 수치가 일루미나사 게놈 분석기 시스템이 600개 염기들 이상의 DNA 단편들을 증폭시키고 서열결정하는 데 효과적이지 않기 때문에 선택될 수 있다. 또한, 분석을 600개 염기들 이하의 DNA 단편들로 제한하는 것은 게놈의 구조적 다양성들로부터 발생하는 편향들도 역시 피할 수 있다. 구조적 다양성들, 예를 들어 재배열들 (Kidd JM et al, Nature 2008; 453:56-64)의 존재 시, DNA 단편의 크기는 DNA 단편의 말단들을 기준 게놈에 맵핑하여 생물정보학적으로 추정될 때 과다추정될 수 있다. 또한, 성공적으로 서열결정되고 기준 게놈으로 맵핑된 모든 DNA 단편들의 > 99.9%가 600개 염기들 이하이고, 따라서 모든 600개 염기들과 동등하거나 더 짧은 단편들을 포함하는 것이 시료에서 DNA 단편들의 크기 분포의 대표적인 추정을 제공할 것이다.A value of less than 600 bases may be chosen because the Illumina Genome Analyzer system is not effective in amplifying and sequencing DNA fragments larger than 600 bases. In addition, limiting the analysis to DNA fragments of 600 bases or less also avoids biases arising from the structural diversity of the genome. In the presence of structural diversity, such as rearrangements (Kidd JM et al, Nature 2008; 453:56-64), the size of a DNA fragment can be estimated bioinformatically by mapping the ends of the DNA fragment to a reference genome. may be overestimated. In addition, > 99.9% of all DNA fragments that have been successfully sequenced and mapped to a reference genome are less than or equal to 600 bases, thus including fragments that are equal to or shorter than all 600 bases the size distribution of DNA fragments in a sample. We will provide a representative estimate of
따라서, Hap I 및 Hap Ⅱ 간의 짧은 DNA 단편들이 기여하는 전체 길이의 분획들에서 차이가 사용될 수 있다. Hap I 및 Hap Ⅱ DNA 단편들 간의 크기 분포에서 교란은 그들의 F 수치들에서 차이에 의해 반영될 수 있다. 여기에서 우리는 FHapI 및 FHapⅡ를 Hap I 및 Hap Ⅱ에 대한 짧은 DNA 단편들이 기여하는 전체 길이의 분획들로서 각각 정의한다. Hap I 및 Hap Ⅱ 간의 짧은 DNA 단편들이 기여하는 전체 길이의 분획들에서 차이는 다음과 같이 계산될 수 있다: △F = FHapI - FHapⅡ. FHapI 및 FHapⅡ는 각 반수체형들로부터 나온 단편들의 크기 분포들의 두 개 그룹들의 통계학적 수치의 예들이다.Thus, the difference in full-length fractions contributed by short DNA fragments between Hap I and Hap II can be used. Perturbations in the size distribution between Hap I and Hap II DNA fragments can be reflected by differences in their F values. Here wedefine F HapI and FHapII as the fractions of full length contributed by short DNA fragments to Hap I and Hap II, respectively. The difference in the full-length fractions contributed by the short DNA fragments between Hap I and Hap II can be calculated as follows:ΔF= F HapI - F HapII . FHapI and FHapII are examples of statistical values of two groups of size distributions of fragments from each haplotype.
이전의 섹션에서 도시된 구현예들과 유사하게, 종양 조직들에서 Hap Ⅱ의 결실은 Hap Ⅱ DNA 단편들과 비교할 때 Hap I DNA 단편들에 대한 크기 분포의 외관상 단축화를 유도할 것이다. 이것은 △F의 양성 수치를 유도할 것이다. Hap Ⅱ가 복제될 때, 음성 △F 수치가 관찰될 것이다. 염색체 이상의 부재 시, △F의 수치는 대략 제로일 것이다.Similar to the embodiments shown in the previous section, deletion of Hap II in tumor tissues will lead to an apparent shortening of the size distribution for Hap I DNA fragments when compared to Hap II DNA fragments. This will lead to a positive value of ΔF. When Hap II is replicated, negative ΔF values will be observed. In the absence of chromosomal abnormalities, the value of ΔF will be approximately zero.
환자의 △F는 수치가 정상인지를 결정하도록 정상 개인들과 비교될 수 있다. 이러한 비교는 본 명세서에서 기술된 바와 같은 역치 수치들과 비교(들)이 관여할 수 있다. 질환의 감시의 문맥에서, 수치 △Q는 일련으로 감시될 수 있다. △F의 수치에서 변화는 혈장/혈청에서 종양성 DNA의 증가된 분획 농도를 가리킬 수 있다.A patient's ΔF can be compared to normal individuals to determine if the level is normal. Such comparison may involve comparison(s) with threshold values as described herein. In the context of monitoring a disease, the value ΔQ can be monitored in series. A change in the value of ΔF may indicate an increased fractional concentration of neoplastic DNA in plasma/serum.
D. 일반적인 방법D. General method
도 10은 본 발명의 구현예들에 따라 염색체 부위가 결실 또는 증폭을 보여주는지 여부를 결정하도록 유기체의 생물학적 시료의 반수체형들을 분석하는 방법을 도시하는 흐름도이다. 생물학적 시료는 정상 세포들로부터, 잠재적으로는 암과 연관된 세포들로부터 기원한 핵산 분자들 (단편들이라고도 불림)을 포함한다. 이들 분자들은 생물학적 시료들에서 무세포일 수 있다. 유기체는 염색체의 하나 이상의 사본을 가지는 유형이라면 모두, 예로 적어도 이수체 유기체들일 수 있지만, 고등 다배수체 유기체들을 포함할 수 있다.10 is a flow diagram illustrating a method of analyzing haplotypes in a biological sample of an organism to determine whether a chromosomal region exhibits deletion or amplification in accordance with embodiments of the present invention. A biological sample contains nucleic acid molecules (also called fragments) originating from normal cells, potentially from cells associated with cancer. These molecules may be cell-free in biological samples. An organism may be any type having more than one copy of a chromosome, eg at least aneuploid organisms, but may include higher polyploid organisms.
본 방법 및 본 명세서에서 기술된 기타 방법이라면 모두의 한 가지 구현예에서, 생물학적 시료는 무세포 DNA 단편들을 포함한다. 혈장 DNA의 분석이 본 출원에 기술된 서로 다른 방법들을 설명하는 데 사용되었더라도, 이들 방법들도 역시 정상 및 종양-유래 DNA의 혼합물을 포함하는 시료들에서 종양-연관된 염색체 이상들을 검출하는 데 사용될 수 있다. 기타 동일한 유형들은 침, 눈물들, 흉막액, 복수액, 담즙, 소변, 혈청, 췌장액, 대변 및 경부 도말 시료들을 포함한다.In one embodiment of any of the methods herein and other methods described herein, the biological sample comprises cell-free DNA fragments. Although analysis of plasma DNA has been used to demonstrate the different methods described herein, these methods can also be used to detect tumor-associated chromosomal aberrations in samples containing a mixture of normal and tumor-derived DNA. have. Other identical types include saliva, tears, pleural fluid, ascites fluid, bile, urine, serum, pancreatic fluid, feces and cervical smear samples.
단계 1010에서, 첫 번째 및 두 번째 반수체형들은 첫 번째 염색체 부위에서 유기체의 정상 세포들을 위해 결정된다. 반수체형들은 본 명세서에서 언급된 것들과 같은 적합한 방법이라면 모두에 의해 결정될 수 있다. 염색체 부위는 방법이라면 모두, 예로 본 명세서에서 기술된 방법들에 의해 선택될 수 있다. 첫 번째 염색체 부위는 이종접합인 첫 번째 다수의 좌위들 (예로, 부위 410의 좌위들 420)을 포함한다. 이종접합 좌위들 (hets)는 서로로부터 멀리 떨어져 있고, 예로 좌위들은 첫 번째 다수의 좌위들의 또 다른 좌위로부터 500개 또는 1,000개 (또는 이상) 염기들이 떨어져 있다. 다른 hets는 첫 번째 염색체 부위에 존재할 수 있지만, 사용되지는 않는다.In
단계 1020에서, 생물학적 시료에서 다수의 핵산 분자들은 각 분자의 위치 및 대립인자에 관하여 특징 분석된다. 예를 들어, 유기체의 기준 게놈에서 핵산 분자의 위치는 확인될 수 있다. 본 위치 설정은, 분자의 하나 또는 두 개 (쌍을 이룬 말단) 서열결정된 태그들을 획득하도록 분자의 서열결정을 (예로, 보편적 서열결정에 의해) 수행한 다음 서열결정된 태그(들)을 기준 게놈에 정렬시키는 것을 포함하는 다양한 방식들로 수행될 수 있다. 이러한 정렬은 기본 로칼 정렬 탐색 도구 (BLAST)와 같은 도구들을 사용하여 수행될 수 있다. 위치는 염색체의 팔에 있는 수로서 확인될 수 있다. 이종접합 좌위들 (hets)의 하나에 있는 대립인자는 단편이 나온 반수체형을 결정하는 데 사용될 수 있다.In
단계 1030에서, 핵산 분자들의 첫 번째 그룹은 확인된 위치들 및 결정된 대립인자들을 기초로 하여 첫 번째 반수체형으로부터 나온 것으로서 확인된다. 예를 들어, 대립인자 A를 가지는 도 4의 좌위들 421을 포함하는 단편은 Hap I으로부터 나온 것으로서 확인될 것이다. 첫 번째 그룹은 각 첫 번째 다수의 좌위들에 위치하는 적어도 하나의 핵산 분자를 포함하여 첫 번째 염색체 부위로 확장될 수 있다.In
단계 1040에서, 핵산 분자들의 두 번째 그룹은 확인된 위치들 및 결정된 대립인자들을 기초로 하여 두 번째 반수체형으로부터 나온 것으로서 확인된다. 예를 들어, 대립인자 T를 가지는 도 4의 좌위들 421을 포함하는 단편은 Hap Ⅱ로부터 나온 것으로서 확인될 것이다. 두 번째 그룹은 각 첫 번째 다수의 좌위들에 위치하는 적어도 하나의 핵산 분자를 포함한다.In
단계 1050에서, 컴퓨터 시스템은 핵산 분자들의 첫 번째 그룹의 첫 번째 수치를 계산한다. 첫 번째 수치는 첫 번째 그룹의 핵산 분자들의 특성을 정의한다. 첫 번째 수치의 예들로는 첫 번째 그룹에서 분자들의 수의 태그 계수 및 첫 번째 그룹에서 분자들의 크기 분포를 포함한다.In
단계 1060에서, 컴퓨터 시스템은 핵산 분자들의 두 번째 그룹의 두 번째 수치를 계산한다. 두 번째 수치는 두 번째 그룹의 핵산 분자들의 특성을 정의한다.In
단계 1070에서, 첫 번째 수치는 첫 번째 염색체 부위가 결실 또는 증폭을 나타내는지 여부의 분류를 결정하도록 두 번째 수치와 비교된다. 결실 또는 증폭이 존재하는 것의 분류는 암과 연관된 세포들을 가지는 유기체에 관한 정보를 제공할 수 있다. 비교의 예들은 본 명세서에서 기술된 바와 같이 두 개 수치들의 차이 또는 비율을 취하여 하나 이상의 역치 수치들과 결과들을 비교하는 것을 포함한다. 예를 들어, 비율은 SPRT 분석에서 역치 수치들과 비교될 수 있다. 분류 예들은 양성 (예로, 검출된 증폭 또는 결실), 음성 및 미분류됨, 뿐만 아니라 양성 및 음성의 다양화 정도들 (예로, 1 및 10 사이의 정수들, 또는 0 및 1 사이의 실수를 사용함)을 포함할 수 있다. 증폭은 단순한 복제를 포함할 수 있다. 이러한 방법은 종양 DNA 및 전종양증식 병변들, 예로 암의 전구체들로부터 나온 DNA를 포함하는, 암-연관된 핵산들의 존재를 검출할 수 있다.In
E. 깊이E. Depth
분석의 깊이는 특정된 정확도 내의 분류 또는 기타 결정을 제공하도록 분석되는 것이 필요한 분자들의 양을 말한다. 한 가지 구현예에서, 깊이는 기지의 이상을 기초로 하여 계산될 수 있고, 다음으로 해당 깊이를 가진 측정 및 분석이 수행될 수 있다. 또 다른 구현예에서, 분석은 분류가 작성될 때까지 계속될 수 있고 분류가 작성되는 깊이는 암의 수준 (예로, 암의 단계 또는 종양의 크기)을 결정하는 데 사용될 수 있다. 다음은 깊이가 관여하는 일정 계산들의 예들을 제공한다.Depth of analysis refers to the amount of molecules that need to be analyzed to provide a classification or other determination within specified accuracy. In one embodiment, the depth may be calculated based on a known anomaly, and then measurements and analysis with that depth may be performed. In another embodiment, analysis can continue until a classification is built and the depth at which the classification is drawn can be used to determine the level of cancer (eg, the stage of the cancer or the size of the tumor). The following provides examples of certain calculations involving depth.
편차는 본 명세서에서 기술되는 바와 같이 차이 또는 비율이라면 모두를 말할 수 있다. 예로서, 편차는 본 명세서에서 기술되는 바와 같이 역치 또는 종양 농도로부터 나온 매개변수의 첫 번째 및 두 번째 수치 사이에 있을 수 있다. 편차가 두 배가 되는 경우라면, 측정될 필요가 있는 단편들의 수는 1/4로 감소된다. 보다 일반적으로, 편차가 팩터 N으로 증가되는 경우라면, 측정될 필요가 있는 단편들의 수는 1/N2이다. 그 결과로, 편차가 팩터 1/N으로 감소되는 경우라면, 테스트될 필요가 있는 단편들의 수는 N2이다. N은 실수 또는 정수일 수 있다.Deviation can refer to any difference or ratio as described herein. As an example, the deviation may be between the first and second values of a parameter derived from a threshold or tumor concentration as described herein. If the deviation is doubled, the number of fragments that need to be measured is reduced by one quarter. More generally, if the deviation is increased by a factor N, then the number of fragments that need to be measured is 1/N2 . As a result, if the deviation is reduced by a factor of 1/N, then the number of fragments that need to be tested is N2 . N may be a real number or an integer.
종양 DNA가 시료 (예로, 혈장)의 10%인 사례를 가정하고, 통계학적으로 유의한 차이가 1천만 개 단편들을 서열결정하여 관찰되는 것으로 추측하라. 다음으로 예를 들어, 농축 절차가 수행되어 현재 시료에 20%의 종양 DNA가 존재하고, 다음으로 필요한 단편들의 수는 2,500,000개 단편들이 될 것이다. 본 방식으로, 깊이는 시료에 있는 종양 DNA의 백분율과 상관될 수 있다.Assume that tumor DNA is 10% of the sample (eg plasma), and assume that a statistically significant difference is observed by sequencing 10 million fragments. Next, for example, an enrichment procedure will be performed so that 20% of the tumor DNA is present in the sample, and the next required number of fragments will be 2,500,000 fragments. In this way, the depth can be correlated with the percentage of tumor DNA in the sample.
증폭의 양도 역시 깊이에 영향을 줄 것이다. 부위에 두 배의 사본량을 가지는 부위를 위해 (예로, 정상 2개와 반대되는 4개), X 개수의 단편들이 분석되도록 요구되는 것으로 가정하라. 부위가 정상 사본량의 4배를 가지는 경우라면, 본 부위는 X/4 양의 단편들을 요구할 것이다.The amount of amplification will also affect the depth. Assume that for a site that has double the copy weight of the site (
F. 역치들F. Thresholds
정상 수치들로부터 매개변수의 편차의 양은 (예로, 각 반수체형을 위한 수치들의 차이 또는 비율) 상기에 기술된 바와 같이 진단을 제공하는 데 사용될 수 있다. 예를 들어, 편차는 부위의 하나의 반수체형으로부터 나온 단편들의 평균 크기대비 다른 반수체형으로부터 나온 단편들의 평균 크기의 차이가 될 수 있다. 편차가 소정의 양 (예로, 정상 시료들 및/또는 부위들로부터 결정된 역치) 초과인 경우라면, 결실 또는 증폭이 확인된다. 그러나, 역치를 초과하는 정도가 정보가 될 수 있고, 이는 복수의 역치들의 사용을 유도하고 각각은 암의 서로 다른 수준에 해당할 수 있다. 예를 들어, 정상으로부터 더 높은 편차는 암이 존재하는 단계를 제공할 수 있다 (예로, 제 4기는 제 3기보다 더 높은 정도의 불균형을 가질 것이다). 더 높은 편차는 커지고 있어 많은 단편들을 방출하는 종양의 결과, 및/또는 부위가 많은 횟수로 증폭된 점도 역시 될 수 있다.The amount of deviation of a parameter from normal values (eg, the difference or ratio of values for each haplotype) can be used to provide a diagnosis as described above. For example, the deviation can be the difference in the average size of fragments from one haplotype of a region compared to the average size of fragments from another haplotype. If the deviation is above a predetermined amount (eg, a threshold determined from normal samples and/or sites), then a deletion or amplification is identified. However, the extent to which thresholds are exceeded may be informative, leading to the use of multiple thresholds, each corresponding to a different level of cancer. For example, a higher deviation from normal may give a stage in which cancer is present (eg,
서로 다른 수준들의 암을 제공하는 것과 추가하여, 역치들을 다양화하는 것은 이상을 가진 부위들 또는 특이적 부위들의 효율적인 검출도 역시 허용할 수 있다. 예를 들어, 주로 3배 이상의 증폭을 찾는 높은 역치들을 설정할 수 있고, 이는 하나의 반수체형의 결실보다 큰 불균형을 줄 것이다. 부위의 두 개 사본들의 결실도 역시 검출될 수 있다. 또한, 저부 역치는 이상을 가질 수 있는 부위들을 확인하는 데 사용될 수 있고, 다음으로 이들 부위들은 좀 더 나아가 이상이 존재하는지 여부 및 위치를 입증하도록 분석될 수 있다. 예를 들어, 이중의 탐색 (또는 옥트리 (octree)와 같은 고차의 탐색)이 더 높은 역치들을 사용하는 체계에서 더 낮은 수준들로 수행될 수 있다.In addition to providing different levels of cancer, varying the thresholds may also allow efficient detection of regions with abnormalities or specific regions. For example, one can set high thresholds, primarily looking for more than 3-fold amplification, which will give greater disproportionate than deletion of one haplotype. Deletion of two copies of the site can also be detected. In addition, the bottom threshold can be used to identify sites that may have an abnormality, which can then be further analyzed to establish whether and where the abnormality is present. For example, a double search (or a higher order search, such as an octree) may be performed at lower levels in a scheme that uses higher thresholds.
도 11은 본 발명의 구현예들에 따라 결실된 부위를 결정하도록 혈장에서 작성된 측정들과 함께 암세포들에서 결실되고 있는 소부위 1130을 가진 부위 1110을 나타낸다. 염색체 부위 1110은 게놈을 동등한 크기의 분절들로 분열시키는 것과 같은 본 명세서에서 언급된 방법이라면 모두에 의해 선택될 수 있다. 도 11은 각 좌위들 1120에 대한 대립인자 계수들의 수도 역시 보여준다. 누적 합계도 역시 부위 1140 (정상 부위) 및 부위 1130 (결실된 부위)의 경우 각각 유지된다.11 shows
부위 1110은 분석을 위해 선택된 경우라면, 누적 계수의 수는 11개 좌위들 상의 18개 차이를 제공하는 Hap I의 경우 258개 및 Hap Ⅱ의 경우 240개이다. 이러한 차이는 결실된 소부위 1130이 분석된 경우보다 계수의 전체 수의 백분율과 같이 더 작다. 이것은 부위 1110의 약 절반이 정상인 한편 소부위 1130 모두는 암세포에서 결실되는 점과 일맥 상통한다. 따라서, 부위 1110에서 사용된 역치에 의존하여 이상은 놓칠 수 있다.If
소부위들의 결실의 검출을 허용하기 위하여, 구현예들은 상대적으로 큰 부위를 위한 저부 역치를 사용할 수 있다 (본 예의 경우 부위 1110은 확인될 결실된 부위들의 크기와 비교하여 상대적으로 큰 것으로 추측된다). 저부 역치는 더 많은 부위들을 확인할 것이고, 이는 일정 위양성들을 포함할 수 있지만 위음성들을 감소시킬 수 있다. 현재, 위양성들은 이상도 역시 지적할 수 있는 심화 분석을 통하여 제거될 수 있다.To allow detection of deletions of small regions, embodiments may use a lower threshold for relatively large regions (in this
일단 부위가 심화 분석을 위해 표지 (flagged)되었던 경우라면, 부위는 심화 분석을 위해 소부위들로 분할될 수 있다. 도 11에서, 6개 좌위들의 소부위들 1140 및 5개 좌위들의 소부위 1130을 제공하도록 11개 좌위들을 절반으로 (예로, 이중 트리를 사용하여) 분열시킬 수 있다. 이들 부위들은 동일한 역치 수치 또는 더 엄격한 역치 수치로 분석될 수 있다. 본 예에서, 소부위 1140은 다음으로 정상인 것으로서 확인되고 소부위 1130은 결실 또는 증폭을 포함하는 것으로서 확인될 것이다. 본 방식으로, 더 큰 부위들은 이상을 전혀 가지지 않는 것으로서 해결될 수 있고, 의심되는 부위들 (저부 역치의 초과 부위들)은 높은 신뢰도로 이상을 보이는 소부위들을 확인하도록 좀 더 분석하는 데 시간을 쓸 수 있다. 여기에서 RHDO가 사용되었더라도, 크기 기법들은 동등하게 적용가능하다.Once a site has been flagged for further analysis, the site can be divided into sub-regions for further analysis. 11 , 11 loci can be split in half (eg, using a double tree) to provide
첫 번째 탐색 수준을 위한 부위들의 크기 (및 트리에서 저부 수준들의 소부위들의 크기)는 검출될 이상들의 크기를 기초로 하여 선택될 수 있다. 암들은 10 Mb 길이의 이상들을 가지는 10개 부위들을 보여주는 것으로 확인되어 왔다. 환자들도 역시 이상을 나타내는 100 Mb 부위들을 가진다. 암의 나중 단계들은 이상의 더 긴 절편들을 가질 수 있다.The size of the sites for the first search level (and the size of the subregions of the bottom levels in the tree) can be selected based on the size of the anomalies to be detected. Cancers have been identified that show 10 sites with abnormalities of 10 Mb in length. Patients also have 100 Mb sites that exhibit abnormalities. Later stages of cancer may have longer segments of the anomaly.
G. 부위G. site 내에 이상의 위치 결정 Positioning of more than within
마지막 섹션에서, 트리 탐색을 기초로 하여 소부위들 내로 부위의 분할이 논의되었다. 여기에서, 우리는 부위 내의 이상을 지적하도록 소부위들을 분석하는 다른 방법들을 논의하고 있다.In the last section, the division of sites into subregions based on tree search was discussed. Here, we discuss different methods of analyzing subregions to point out anomalies within the site.
도 12는 본 발명의 구현예들에 따라 이상들의 위치가 RHDO 분석을 사용하여 맵핑될 수 있는 방식을 나타낸다. 염색체 부위는 Hap I 및 Hap Ⅱ로 표지된 비-암 세포들의 반수체형들로 수평적으로 나타낸다. 암세포들에서 Hap Ⅱ의 결실된 부위는 LOH로서 표시된다.12 illustrates how the location of anomalies may be mapped using RHDO analysis in accordance with implementations of the present invention. Chromosomal regions are shown horizontally as haplotypes of non-cancer cells labeled Hap I and Hap II. The deleted region of Hap II in cancer cells is denoted as LOH.
나타낸 바와 같이, RHDO 분석은 이론적인 염색체 부위 1202의 좌측면으로부터 시작되어 우측면까지 이어진다. 각 화살표들은 RHDO 분류 분절을 나타낸다. 각 분절은 그 자신의 부위, 상세하게는 더 큰 부위의 hets 소집합을 가진 소부위라고 고려될 수 있다. RHDO 분류 분절의 크기는 분류가 결정될 수 있기 이전에 좌위들의 수 (및 좌위들의 자리들)에 의존적이다. 각 RHDO 분절에 포함된 좌위들의 수는 각 분절에 대해 분석된 분자들의 수, 원하는 정확도 (예로, SPRT 분석에서 우위 비율), 및 시료에서 종양-유래 DNA의 분획 농도에 의존적이다. 분류는 분자들의 수가 도 4 및 도 5에 도시된 예에서와 같이 통계학적으로 유의한 차이가 두 개 반수체형들 간에 존재하는 것을 결정하도록 적절할 때 작성될 수 있다.As shown, the RHDO analysis starts from the left side of the theoretical
각 수평선 화살표들은 반수체형 용량 불균형이 DNA 시료에 부재한 것을 보여주는 RHDO 분류 분절을 나타낸다. 종양에서 LOH 없는 부위 내에, 6개의 RHDO 분류들이 작성되고 각각은 반수체형 용량 불균형의 부재를 가리킨다. 다음 RHDO 분류 분절 1210은 LOH가 있고 없는 부위들 간의 연접부 1205를 교차한다. 도 12의 저부 부분에서, RHDO 분절 1210에 대한 SPRT 곡선이 나타난다. 검은색 수직 화살표는 LOH가 있고 없는 부위들 간의 연접부를 가리킨다. LOH를 가진 부위로부터 얻은 증가하는 데이타의 축적으로, 본 분절의 RHDO 분류는 반수체형 용량 불균형의 존재를 가리킨다.Each horizontal arrow represents an RHDO classification segment showing the absence of haplotype dose imbalance in the DNA sample. Within the LOH-free region in the tumor, six RHDO classifications are constructed, each indicating the absence of haplotype dose imbalance. The next
각 흰색 수평 화살표들은 반수체형 용량 불균형의 존재를 가리키는 RHDO 분류 분절을 나타낸다. 우측면 상의 연속적 4개 RHDO도 역시 DNA 시료에서 반수체형 용량 불균형의 존재를 가리킨다. LOH가 있고 없는 부위들 간의 연접부 위치는 RHDO 분류에서 변화, 즉 반수체형 용량 불균형의 존재로부터 부재까지 또는 그 반대를 보여주는 첫 번째 RHDO 분절에 속하도록 추론될 수 있다.Each white horizontal arrow represents a RHDO classification segment indicating the presence of a haplotype dose imbalance. Four consecutive RHDOs on the right side also indicate the presence of a haplotype dose imbalance in the DNA sample. The junctional location between sites with and without LOH can be inferred to belong to the first RHDO segment showing a change in RHDO classification, i.e., from the presence to the absence of haplotype dose imbalance or vice versa.
도 13은 본 발명의 구현예들에 따라 또 다른 방향으로부터 시작된 RHDO 분류를 나타낸다. 도 13에서, 둘 다의 방향으로부터 나온 RHDO 분류가 관찰된다. 좌측면으로부터 시작되는 RHDO 분석으로부터, LOH가 있고 없는 부위들 간의 연접부는 반수체형 용량 불균형의 존재를 보여주는 첫 번째 RHDO 분절 1310에 속하도록 추론될 수 있다. 우측면으로부터 시작되는 RHDO 분석으로부터, 연접부는 반수체형 용량 불균형의 부재를 가리키는 첫 번째 RHDO 분절 1320에 속하도록 추론될 수 있다. 두 가지 방향으로 시행된 RHDO 분석으로부터 얻은 정보를 조합하여, LOH가 있고 없는 부위들 간의 연접부의 위치 1330이 추론될 수 있다.13 shows an RHDO classification starting from another direction according to embodiments of the present invention. In FIG. 13 , RHDO classifications from both directions are observed. From the RHDO analysis starting from the left side, the junction between the regions with and without LOH can be inferred to belong to the first RHDO segment 1310 showing the presence of haplotype dose imbalance. From the RHDO analysis starting from the right side, the junction can be inferred to belong to the first RHDO segment 1320 indicating the absence of haplotype dose imbalance. Combining information from RHDO analyzes conducted in two directions, the position 1330 of the junction between regions with and without LOH can be inferred.
Ⅳ. 이상들의 비특이적IV. non-specific반수체형haplotype 검출 detection
RHDO 방법은 이종접합 좌위들을 사용하는 것에 의존한다. 현재, 이수체 유기체의 염색체들은 두 개 반수체형들을 가져오는 일정 차이들을 가질 것이지만, 이종접합 좌위들의 수는 다양화할 수 있다. 일정 개인들은 상대적으로 적은 이종접합 좌위들을 가질 수 있다. 본 섹션에서 기술된 구현예는 역시 동일한 부위의 두 개 반수체형들이 아닌 두 개 부위들을 비교하여 동종접합이 되는 좌위들에 사용될 수 있다. 따라서, 일정의 장애들이 두 개의 서로 다른 염색체 부위들의 비교로부터 존재할 수 있더라도, 더 많은 데이타 요점들이 획득될 수 있다.The RHDO method relies on using heterozygous loci. Currently, the chromosomes of a haploid organism will have certain differences resulting in two haplotypes, but the number of heterozygous loci may vary. Some individuals may have relatively few heterozygous loci. Embodiments described in this section can also be used for loci that are homozygous by comparing two sites that are not two haplotypes of the same site. Thus, although certain disorders may exist from comparison of two different chromosomal regions, more data points can be obtained.
상대적 염색체 부위 용량 방법에서, 하나의 염색체 부위로부터 나온 단편들의 수는 (예로, 해당 부위에 정렬된 서열결정된 태그들을 계수하여 결정되는 바) 기대 수치 (예로, 기준 염색체 부위로부터 또는 건강한 것으로 알려진 또 다른 시료에 있는 동일한 부위로부터 나올 수 있음)와 비교된다. 본 방식으로, 단편은 서열결정된 태그가 나온 반수체형과는 상관없이 염색체 부위로 설명될 것이다. 따라서, hets를 전혀 포함하지 않는 서열결정된 태그들이 여전히 사용될 수 있다. 비교를 수행하기 위하여, 구현예는 비교 이전에 태그 수를 정상화할 수 있다. 각 부위는 적어도 두 개의 좌위들 (서로로부터 분리되어 있음)에 의해 정의되고, 이들 좌위들에서 단편들은 부위에 대하여 종합적 수치를 획득하는 데 사용될 수 있다.In the relative chromosomal site dose method, the number of fragments from one chromosomal site (eg, as determined by counting sequenced tags aligned to that site) is an expected value (eg, from a reference chromosomal site or another known healthy site). may come from the same site in the sample). In this way, fragments will be described as chromosomal regions irrespective of the haplotype from which the sequenced tag originated. Thus, sequenced tags that contain no hets can still be used. To perform comparisons, embodiments may normalize tag counts prior to comparison. Each site is defined by at least two loci (separate from each other), and fragments at these loci can be used to obtain a global figure for the site.
특정한 부위를 위한 서열결정된 해독 (태그)의 정상화된 수치는 해당 부위에 정렬한 서열결정된 해독의 수를 전체 게놈에 정렬가능한 서열결정된 해독의 전체 수로 나누어 계산될 수 있다. 본 정상화된 태그 계수는 한 시료로부터 나온 결과들을 또 다른 시료의 결과들과 비교하도록 허용한다. 예를 들어, 정상화된 수치는 상기에 진술된 바와 같이 특정한 부위로부터 나올 것으로 기대되는 서열결정된 해독의 비율 (예로, 백분율 또는 분획)일 수 있다. 그러나, 당업자에게는 자명할 바와 같이 많은 다른 정상화가 가능하다. 예를 들어, 한 부위를 위한 계수의 수를 기준 부위를 위한 계수의 수로 정상화할 수 있다 (상기 사례에서, 기준 분위는 바로 전체 게놈이다). 다음으로 본 정상화된 태그 계수는 암을 보이지 않는 하나 이상의 시료들로부터 결정될 수 있는 역치 수치에 대비하여 비교될 수 있다.The normalized number of sequenced reads (tags) for a particular site can be calculated by dividing the number of sequenced reads that align to that site by the total number of sequenced reads that are alignable to the entire genome. This normalized tag count allows results from one sample to be compared with results from another sample. For example, the normalized value may be the proportion (eg, percentage or fraction) of sequenced translations expected to come from a particular site as stated above. However, many other normalizations are possible, as will be apparent to those skilled in the art. For example, the number of coefficients for one site can be normalized to the number of coefficients for a reference site (in this case, the reference quantile is the whole genome). This normalized tag count may then be compared against a threshold value that may be determined from one or more samples that do not show cancer.
다음으로 테스트된 사례의 정상화된 태그 계수는 하나 이상의 기준 개체들, 예로 암이 없는 개체들의 정상화된 태그 계수와 비교될 것이다. 한 가지 구현예에서, 특정한 염색체 부위를 위한 사례의 z-점수를 계산하여 비교가 작성된다. z-점수는 다음의 방정식을 사용하여 계산된다: z-점수 = (사례의 정상화된 태그 계수 - 평균) /S.D., 여기에서 "평균값 (mean)"은 기준 시료들의 경우 특정한 염색체 부위에 정렬한 평균 정상화된 태그 계수이고; S.D.는 기준 시료들의 경우 특정한 부위에 정렬한 정상화된 태그 계수의 수의 표준 편차이다. 따라서, z-점수는 테스트된 시료들의 경우 부위의 정상화된 태그 계수가 하나 이상의 기준 개체들의 동일한 염색체 부위의 평균 정상화된 태그 계수로부터 벗어나는 표준 편차의 수치이다.The normalized tag count of the tested case will then be compared to the normalized tag count of one or more reference subjects, eg cancer-free subjects. In one embodiment, a comparison is made by calculating the z-score of an event for a particular chromosomal region. The z-score is calculated using the following equation: z-score = (normalized tag count of cases - mean) /SD, where "mean" is the mean aligned to a specific chromosomal region for reference samples normalized tag count; S.D. is the standard deviation of the number of normalized tag counts aligned to a specific site for reference samples. Thus, the z-score is the number of standard deviations from which the normalized tag count of a region for the tested samples deviates from the average normalized tag count of the same chromosomal region of one or more reference subjects.
테스트된 유기체가 암을 가지는 상황에서, 종양 조직들에서 증폭된 염색체 부위들은 혈장 DNA에서 과다-발현될 것이다. 이것은 z-점수의 양성 수치를 가져올 것이다. 한편, 종양 조직들에서 결실된 염색체 부위들은 혈장 DNA에서 과소-발현될 것이다. 이것은 z-점수의 음성 수치를 가져올 것이다. z-점수의 규모는 여러 요인들에 의해 결정된다.In a situation where the tested organism has cancer, chromosomal regions amplified in tumor tissues will be over-expressed in plasma DNA. This will result in a positive value of the z-score. On the other hand, chromosomal regions deleted in tumor tissues will be under-expressed in plasma DNA. This will result in a negative value of the z-score. The magnitude of the z-score is determined by several factors.
한 가지 요인은 생물학적 시료 (예로, 혈장)에서 종양-유래 DNA의 분획 농도이다. 시료 (예로, 혈장)에서 종양-유래 DNA의 분획 농도가 높을수록, 테스트된 사례 및 기준 사례들의 정상화된 태그 계수 간 차이가 커진다. 따라서, 더 큰 z-점수가 유도될 것이다.One factor is the fractional concentration of tumor-derived DNA in a biological sample (eg, plasma). The higher the fractional concentration of tumor-derived DNA in a sample (eg, plasma), the greater the difference between the normalized tag counts of the tested and reference cases. Thus, a larger z-score will be derived.
또 다른 요인은 하나 이상의 기준 사례들에서 정상화된 태그 계수의 다양성이다. 테스트된 사례의 생물학적 시료 (예로, 혈장)에서 염색체 부위의 과다-발현의 동일한 정도로, 기준 그룹에서 정상화된 태그 계수의 더 작은 다양성 (예로, 더 작은 표준 편차)은 더 높은 z-점수를 가져올 것이다. 유사하게, 테스트된 사례의 생물학적 시료 (예로, 혈장)에서 염색체 부위의 과소-발현의 동일한 정도로, 기준 그룹에서 정상화된 태그 계수의 더 작은 표준 편차는 더욱 음성의 z-점수를 가져올 것이다.Another factor is the variability of normalized tag counts in one or more reference cases. To the same extent of over-expression of chromosomal regions in the biological sample (eg, plasma) of tested cases, a smaller variability (eg, smaller standard deviation) of normalized tag counts in the reference group will result in a higher z-score . Similarly, to the same extent of under-expression of chromosomal regions in biological samples (eg, plasma) of tested cases, a smaller standard deviation of normalized tag counts in the reference group will result in a more negative z-score.
또 다른 요인은 종양 조직들에서 염색체 이상의 규모이다. 염색체 이상의 규모 특정한 염색체 부위를 위한 사본수 변화들 (증가 또는 소실 둘 중 하나)을 말한다. 종양 조직들에서 사본수 변화들이 더 높을수록, 혈장 DNA에서 특정한 염색체 부위의 과다- 또는 과소-발현의 정도가 더 높아질 것이다. 예를 들어, 염색체의 사본들 둘 다의 소실은 염색체의 두 개 사본들의 하나의 소실보다 혈장 DNA에서 염색체 부위의 더 큰 과소-발현을 가져오고, 따라서 더욱 음성의 z-점수를 가져올 것이다. 전형적으로, 암들에서는 복수의 염색체 이상들이 존재한다. 각 암에서 염색체 이상들은 그의 본질 (예로, 증폭 또는 결실), 그의 정도 (단일 또는 복수의 사본 증가 또는 소실) 및 그의 범위 (염색체 길이의 견지에서 이상의 크기)에 의해 좀 더 다양화할 수 있다.Another factor is the size of chromosomal abnormalities in tumor tissues. Chromosomal aberration scale Refers to copy number changes (either increase or loss) for a specific chromosomal region. The higher the copy number changes in tumor tissues, the higher the degree of over- or under-expression of a particular chromosomal region in plasma DNA will be. For example, loss of both copies of a chromosome will result in greater under-expression of a chromosomal region in plasma DNA than loss of one of two copies of a chromosome, and thus a more negative z-score. Typically, there are multiple chromosomal abnormalities in cancers. Chromosomal aberrations in each cancer may be more diversified by their nature (eg, amplification or deletion), their degree (single or multiple copy increase or loss) and their extent (the size of the abnormality in terms of chromosome length).
정상화된 태그 계수를 측정하는 정확도는 분석된 분자들의 수에 의해 영향을 받는다. 우리는 15,000개, 60,000개 및 240,000개 분자들이 분획 농도가 각각 대략 12.5%, 6.3% 및 3.2%일 때 하나의 사본 변화를 가진 염색체 이상들 (증가 또는 소실 둘 중 하나)을 검출하도록 분석하는 것이 필요할 것으로 예상한다. 서로 다른 염색체 부위들에 대한 암 검출을 위한 태그 계수법의 좀 더 상세한 설명들은 로 들에 의해 "대규모 병렬 게놈 서열결정을 사용하여 태아 염색체 비배수체를 진단하는 방법"이라는 명칭으로 된 미국 특허 공고번호 제 2009/0029377호에 기술되고 있고, 그의 내용 전부는 본 명세서에서 모든 목적들 위한 참고문헌으로 통합되어 있다.The accuracy of measuring the normalized tag count is affected by the number of molecules analyzed. We found that 15,000, 60,000 and 240,000 molecules were analyzed to detect chromosomal aberrations (either increase or loss) with one copy change when the fraction concentrations were approximately 12.5%, 6.3% and 3.2%, respectively. expected to be needed For more detailed descriptions of tag counting methods for cancer detection for different chromosomal regions, see U.S. Patent Publication No. "Method for Diagnosing Fetal Chromosomal Aploidy Using Massively Parallel Genome Sequencing by Law" 2009/0029377, the entire contents of which are incorporated herein by reference for all purposes.
구현예들은 태그 계수 방법 대신에 크기 분석도 역시 사용할 수 있다. 크기 분석은 정상화된 태그 계수 대신에도 역시 사용될 수 있다. 크기 분석은 본 명세서에서 또한 미국 특허출원 제 12/940,992호에서 언급된 바와 같이 다양한 매개변수들을 사용할 수 있다. 예를 들어, 상기로부터 나온 Q 또는 F 수치들이 사용될 수 있다. 이러한 크기 수치들은 이들 수치들이 해독의 수로 측정되지 않기 때문에 다른 부위들로부터 나온 계수들에 의한 정상화를 필요로 하지 않는다. 반수체형-특이적 방법들의 기법들은 마찬가지로 비특이적 방법들에 사용될 수 있다. 예를 들어, 부위의 깊이 및 위치 결정 (refinement)이 관여하는 기법들이 사용될 수 있다. 일정 구현예들에서, 특정한 부위에 대한 GC 편향은 두 개 부위들을 비교할 때 고려될 수 있다. RHDO 방법은 동일한 부위를 사용하기 때문에, 이러한 교정이 필요없다.Implementations may also use size analysis instead of tag counting methods. Size analysis can also be used instead of normalized tag counts. The size analysis may use various parameters as noted herein also in US Patent Application Serial No. 12/940,992. For example, Q or F values from the above may be used. These size values do not require normalization by coefficients from other sites as these values are not measured in the number of reads. The techniques of haplotype-specific methods can likewise be used for non-specific methods. For example, techniques involving depth and location refinement of a region may be used. In some embodiments, GC bias for a particular site may be taken into account when comparing two sites. Since the RHDO method uses the same site, no such correction is required.
V. 복수의 부위들V. Multiple Sites
소정의 암들이 전형적으로 특정한 염색체 부위들에서 이상들과 함께 존재할 수 있더라도, 이러한 암들은 항상 동일한 부위에서만 존재하지는 않는다. 예를 들어, 추가적인 염색체 부위들이 이상들을 보여줄 수 있고, 이러한 추가적인 부위들의 위치는 미지일 수 있다. 또한, 암의 초기 단계들을 확인하도록 환자들을 검색할 때, 게놈을 통틀어 존재하는 이상들을 보여줄 수 있는 광범위의 암들을 확인하도록 원할 수 있다. 이들 상황들을 겨낭하기 위하여, 구현예들은 이상을 보여주는 부위들을 결정하도록 체계적인 방식으로 다수의 부위들을 분석할 수 있다. 이상들의 수 및 그들의 위치 (예로, 그들이 근접하는지 여부)는, 예를 들어 이상들을 입증하고, 암의 단계를 결정하고, 암의 진단을 제공하고 (예로, 수가 역치 수치 이상인 경우), 또한 이상을 나타내는 다양한 부위들의 수 및 위치를 기초로 하여 예후를 제공하는 데 사용될 수 있다.Although certain cancers can typically be present with abnormalities at specific chromosomal sites, these cancers are not always present at the same site. For example, additional chromosomal regions may exhibit abnormalities, and the location of these additional regions may be unknown. Also, when screening patients to identify early stages of cancer, one may want to identify a wide range of cancers that may show abnormalities present throughout the genome. To address these situations, embodiments may analyze multiple sites in a systematic manner to determine sites exhibiting abnormalities. The number of anomalies and their location (e.g., whether they are in proximity) can, for example, establish anomalies, determine the stage of cancer, provide a diagnosis of cancer (e.g., if the number is above a threshold value), and also It can be used to provide a prognosis based on the number and location of the various sites present.
따라서, 구현예들은 이상을 나타내는 부위들의 수를 기초로 하여 유기체가 암을 가지는지 여부를 확인할 수 있다. 이상을 나타내는 부위들의 수를 확인하도록 다수의 부위들 (예로 3,000개)을 테스트할 수 있다. 부위들은 게놈 전부 또는 게놈의 단지 일부들 예로 비-반복서열 부위를 수용할 수 있다.Accordingly, embodiments can determine whether an organism has cancer based on the number of sites exhibiting the abnormality. Multiple sites (eg 3,000) can be tested to ascertain the number of sites exhibiting anomalies. Regions may accommodate non-repeated sequence regions, such as all of the genome or only parts of the genome.
도 14는 본 발명의 구현예들에 따라 다수의 염색체 부위들을 사용하여 유기체의 생물학적 시료를 분석하는 방법 1400의 흐름도를 나타낸다. 생물학적 시료는 핵산 분자들 (단편들이라고도 불림)을 포함한다.14 shows a flow diagram of a
단계 1410에서, 유기체의 다수의 비중복 염색체 부위들이 확인된다. 각 염색체 부위는 다수의 좌위들을 포함한다. 상기에서 언급된 바와 같이, 부위는 1 Mab, 또는 일정의 다른 동등-크기일 수 있다. 다음으로 전체 게놈은 각 선결정된 크기 및 위치인 약 3,000개의 부위들을 포함할 수 있다. 또한 상기에서 언급된 바와 같이, 이러한 선결정된 부위들은 특정한 염색체의 길이 또는 사용될 부위들의 특정된 수, 및 본 명세서에서 언급된 다른 판정기준이라면 모두를 수용하도록 다양화될 수 있다. 부위들이 서로 다른 길이들을 가지는 경우라면, 이러한 길이들은 예로 본 명세서에서 기술된 바와 같이 결과들을 정상화하는 데 사용될 수 있다.At
단계 1420에서, 유기체의 기준 게놈에서 핵산 분자의 위치는 각 다수의 핵산 분자들에 대해 확인된다. 위치는 본 명세서에서 언급된 방식들이라면 모두로, 예로 단편들을 서열결정하여 서열결정된 태그들을 획득하고 기준 게놈에 서열결정된 태그들을 정렬하여 결정될 수 있다. 분자의 특정한 반수체형도 역시 반수체형-특이적 방법들을 위해 결정될 수 있다.In
단계들 1430 내지 1450은 각 염색체 부위들을 위해 수행된다. 단계 1430에서, 핵산 분자들의 개별 그룹은 확인된 위치들을 기초로 하여 염색체 부위로부터 나온 것으로서 확인된다. 개별 그룹은 염색체 부위의 각 다수의 좌위들에 위치하는 적어도 하나의 핵산 분자를 포함한다. 한 가지 구현예에서, 본 그룹은 예로 상기 RHDO 방법에서와 같이, 염색체 부위의 특정한 반수체형에 정렬한 단편들일 수 있다. 또 다른 구현예에서, 본 그룹은 섹션 Ⅳ에서 기술된 방법들에서와 같이, 염색체 부위에 정렬한 단편이라면 모두일 수 있다.
단계 1440에서, 컴퓨터 시스템은 핵산 분자들의 개별 그룹의 개별 수치를 계산한다. 개별 수치는 개별 그룹의 핵산 분자들의 특성을 정의한다. 개별 수치는 본 명세서에서 언급된 수치들이라면 모두일 수 있다. 예를 들어, 본 수치는 본 그룹에 있는 단편들의 수 또는 본 그룹에 있는 단편들의 크기 분포의 통계학적 수치일 수 있다. 개별 수치는 역시 정상화된 수치, 예로 시료를 위한 태그 계수들의 전체 수 또는 기준 부위를 위한 태그 계수들의 수로 나눈 부위의 태그 계수일 수도 있다. 개별 수치는 역시 또 다른 수치로부터 차이 또는 비율일 수도 있고 (예로, RHDO에서), 이로 인해 부위에 대한 차이의 특성을 제공한다.In
단계 1450에서, 개별 수치는 첫 번째 염색체 부위가 결실 또는 증폭을 나타내는지 여부의 부류를 결정하도록 기준 수치와 비교된다. 본 기준 수치는 본 명세서에서 기술된 역치 또는 기준 수치라면 모두일 수 있다. 예를 들어, 기준 수치는 정상 시료들을 위해 결정된 역치 수치일 수 있다. RHDO를 위해, 개별 수치는 두 개 반수체형들 위한 태그 계수들의 차이 또는 비율일 수도 있고, 기준 수치는 통계학적으로 유의한 편차가 존재하는 것을 결정하는 역치일 수 있다. 또 다른 예로서, 기준 수치는 또 다른 반수체형 또는 부위를 위한 태그 계수 또는 크기 수치일 수 있고, 비교는 차이 또는 비율 (또는 이러한 함수)을 취한 다음 차이 또는 비율이 역치 수치 이상인지 여부를 결정하는 것을 포함할 수 있다.In
기준 수치는 다른 부위들의 결과를 기초로 하여 다양화할 수 있다. 예를 들어, 이웃하는 부위들도 역시 편차를 보이는 경우라면 (하나의 역치와 비교하여 작더라도, 예로 z-점수 3), 저부 역치가 사용될 수 있다. 예를 들어, 세 개의 연속적 부위들이 모두 첫 번째 역치 초과인 경우라면, 암은 더욱 가능성이 있을 수 있다. 따라서, 본 첫 번째 역치는 비-연속적 부위들로부터 나온 암을 확인하는 데 요구되는 또 다른 역치보다 낮을 수 있다. 작은 편차라도 가지는 세 개 (또는 세 개 이상) 부위들을 가지는 것은 민감도 및 특이도가 유지될 수 있는 기회 효과의 충분하게 낮은 확률을 가질 수 있다.Reference values may vary based on the results of other sites. For example, if neighboring regions also exhibit deviations (even if small compared to one threshold, eg z-score 3), the lower threshold may be used. For example, if all three consecutive sites are above the first threshold, cancer is more likely. Thus, this first threshold may be lower than another threshold required to identify cancer from non-contiguous sites. Having three (or more than three) sites with even small deviations can have a sufficiently low probability of a chance effect that sensitivity and specificity can be maintained.
단계 1460에서, 결실 또는 증폭을 나타내는 것으로서 분류된 염색체 부위들의 양이 결정된다. 계수되는 염색체 부위들은 한계들을 가질 수 있다. 예를 들어, 적어도 하나의 다른 부위와 근접한 부위들만이 계수될 수 있다 (또는 근접한 부위들은 소정의 크기, 예로 4개 이상의 부위들이 되도록 요구될 수 있다). 부위들이 동등하지 않은 구현예들을 위해, 수는 역시 개별 길이들도 설명할 수 있다 (예로, 수는 이상 부위들의 전 길이일 수 있다).In
단계 1470에서, 양은 시료의 분류를 결정하도록 역치 수치의 양과 비교된다. 예들로서, 분류는 유기체가 암을 가지는 여부, 암의 단계, 및 암의 예후일 수 있다. 한 가지 구현예에서, 모든 이상 부위들이 계수되고 단일 역치 수치가 부위들이 출현하는 곳과는 상관없이 사용된다. 또 다른 구현예에서, 역치 수치는 계수되는 부위들의 위치들 및 크기를 기초로 하여 다양화될 수 있다. 예를 들어, 특정한 염색체 또는 염색체의 팔 상의 부위들의 양은 해당 특정한 염색체 (또는 팔)에 대한 역치와 비교될 수 있다. 복수의 역치들이 사용될 수 있다. 예를 들어, 특정한 염색체 또는 염색체의 팔 상의 이상 부위들의 양은 첫 번째 역치 수치 이상이어야 하고, 게놈에서 이상 부위들의 전체량은 두 번째 역치 수치 이상이어야 한다.In
부위들의 양을 위한 본 역치 수치는 계수되는 부위들을 위한 불균형이 강한 정도에도 역시 의존할 수 있다. 예를 들어, 암의 분류를 결정하는 역치로서 사용되는 부위들의 양은 각 부위에서 이상을 검출하는 데 사용되는 특이도 및 민감도 (이상 역치)에 의존할 수 있다. 예를 들어, 이상 역치가 낮은 (z-점수 2) 경우라면, 양 역치는 낮도록 (예로, 150) 선택될 수 있다. 그러나, 이상 역치가 높은 (z-점수 3) 경우라면, 양 역치는 더 낮아질 수 있다 (예로, 50). 이상을 보이는 부위들의 양은 역시 평가된 수치 (weighted value)일 수도 있고, 예로 높은 불균형을 보이는 부위는 약간의 불균형만을 보이는 부위보다 높게 평가될 수 있다 (예로, 이상에 대해 단지 양성 및 음성인 것보다 더 많은 분류들이 존재한다).This threshold value for the amount of sites may also depend on the degree to which the imbalance for the sites being counted is strong. For example, the amount of sites used as a threshold to determine the classification of cancer may depend on the specificity and sensitivity (abnormality threshold) used to detect anomalies at each site. For example, if an abnormal threshold is low (z-score 2), both thresholds may be chosen to be low (eg, 150). However, if the aberration threshold is high (z-score 3), then both thresholds can be lower (eg 50). The amount of regions showing an abnormality may also be a weighted value, eg, a region showing a high imbalance may be evaluated higher than a region showing only a slight imbalance (eg, rather than just positive and negative for an abnormality) There are many more classifications).
따라서, 정상화된 태그 계수 (또는 그룹의 특성을 위한 다른 개별 수치)의 유의한 과다- 또는 과소-발현을 보여주는 염색체 부위들의 양 (수 및/또는 크기를 포함할 수 있음)이 질환의 중증도를 반영하는 데 사용될 수 있다. 이상 정상화된 태그 계수를 가진 염색체 부위들의 양은 두 가지 요인들, 즉 종양 조직들에서 염색체 이상들의 수 (또는 크기) 및 생물학적 시료 (예로, 혈장)에서 종양-유래 DNA의 분획 농도에 의해 결정될 수 있다. 더 진행된 암들은 더 많은 (및 더 큰) 염색체 이상들을 보이는 경향이 있다. 따라서, 더 많이 암-연관된 염색체 이상들은 시료 (예로, 혈장)에서 잠재적으로 검출가능할 것이다. 더 진행된 암을 가진 환자들에서, 더 높은 종양 부하는 혈장에서 종양-유래 DNA의 더 높은 분획 농도를 유도할 것이다. 그 결과로, 종양-연관된 염색체 이상들은 혈장 시료에서 더 쉽게 검출될 것이다.Thus, the amount (which may include number and/or size) of chromosomal regions showing significant over- or under-expression of normalized tag counts (or other individual values for characteristics of a group) reflects the severity of the disease. can be used to The amount of chromosomal regions with an aberrant normalized tag count can be determined by two factors: the number (or size) of chromosomal aberrations in tumor tissues and the fractional concentration of tumor-derived DNA in a biological sample (eg, plasma). . More advanced cancers tend to show more (and larger) chromosomal abnormalities. Thus, more cancer-associated chromosomal abnormalities would be potentially detectable in a sample (eg, plasma). In patients with more advanced cancer, higher tumor load will lead to higher fractional concentrations of tumor-derived DNA in plasma. As a result, tumor-associated chromosomal abnormalities will be more readily detected in plasma samples.
암 검색 또는 검출의 문맥에서, 정상화된 태그 계수 (또는 다른 수치)의 과다- 또는 과소-발현을 보이는 염색체 부위들의 양은 암을 가지는 테스트된 개체의 가능성을 결정하는 데 사용될 수 있다. 컷오프 ± 2를 사용하여 (예로, z-점수 > 2 또는 < -2), 테스트된 부위들의 대략 5%는 기회 단독으로 인해 대조군 개체들의 평균으로부터 유의하게 벗어난 z- 점수를 줄 것으로 예상될 것이다. 전체 게놈이 1 Mb 분절들로 분할될 때, 전체 게놈을 위해 대략 3,000개 분절들이 존재할 것이다. 따라서, 대략 150개 분절들이 z-점수 > 2 또는 < -2를 가질 것으로 예상될 것이다.In the context of cancer screening or detection, the amount of chromosomal regions exhibiting over- or under-expression of a normalized tag count (or other value) can be used to determine the likelihood of a tested individual having cancer. Using a cutoff ± 2 (eg, z-score > 2 or < -2), approximately 5% of the sites tested would be expected to give a z-score significantly deviating from the mean of control subjects due to chance alone. When the whole genome is divided into 1 Mb segments, there will be approximately 3,000 segments for the whole genome. Thus, approximately 150 segments would be expected to have a z-score >2 or <-2.
따라서, z-점수 > 2 또는 < -2를 가진 분절들의 수를 위한 150의 컷오프 (역치) 수치는 암이 존재하는지 여부를 결정하는 데 사용될 수 있다. 이상 z-점수 (예로, 100, 125, 175, 200, 250 및 300)을 가진 분절들의 수를 위한 다른 컷오프 수치들은 진단적 목적을 맞추도록 선택될 수 있다. 저부 컷오프 수치, 예로 100은 더 민감한 테스트를 유도할 것이지만 더 낮은 특이도 및 더 높은 컷오프 수치는 더욱 특이적이지만 덜 민감할 것이다. 위양성 분류들의 수는 z-점수의 컷오프 수치들을 증가시켜서 감소될 수 있다. 예를 들어, 컷오프 수치가 3으로 증가되는 경우라면, 분절들의 0.3%만이 위양성일 것이다. 본 상황에서, 이상 z-점수를 가지는 3개 이상의 분절들이 암의 존재를 가리키는 데 사용될 수 있다. 다른 컷오프 수치들도 역시 서로 다른 진단적 목적들을 맞추도록, 예로 1, 2, 4, 5, 10, 20 및 30이 선택될 수 있다. 그러나, 암-연관된 염색체 이상들을 검출하는 민감도는 진단하는 데 요구되는 이상 분절들의 수를 증가시키면서 감소될 것이다.Thus, a cutoff (threshold) value of 150 for the number of segments with a z-score >2 or <-2 can be used to determine whether cancer is present. Other cutoff values for the number of segments with abnormal z-scores (eg, 100, 125, 175, 200, 250 and 300) can be selected to serve diagnostic purposes. A lower cutoff number, eg 100, will lead to a more sensitive test, but lower specificity and higher cutoff values will be more specific but less sensitive. The number of false positive classifications can be reduced by increasing the cutoff values of the z-score. For example, if the cutoff value was increased to 3, only 0.3% of the segments would be false positives. In this context, three or more segments with an aberrant z-score can be used to indicate the presence of cancer. Other cutoff values may also be chosen to serve different diagnostic purposes,
특이도를 희생시키지 않고도 민감도를 개선하는 한 가지 가능한 접근법은 인접한 염색체 분절의 결과를 고려하는 것이다. 한 가지 구현예에서, z-점수를 위한 컷오프는 여전히 > 2 및 < -2가 된다. 그러나, 염색체 부위는 두 개의 연속적 분절들이 동일한 유형의 이상들을 보이는, 예로 둘 다의 분절들이 z-점수 > 2를 가질 때에만 잠재적 이상으로서 분류될 것이다. 정상화된 태그 계수의 편차가 무작위적 오류인 경우라면, 동일한 방향으로 위양성이 되는 두 개의 연속적 분절들을 가지는 확률은 0.125% (5% x 5%/2)일 것이다. 한편, 염색체 이상이 두 개 연속적 분절들을 둘러싸는 경우라면, 저부 컷오프 수치는 혈장 시료에서 분절들의 과다- 또는 과소-발현의 검출을 더욱 민감하게 만들 것이다. 대조군 개체들의 평균으로부터 정상화된 태그 계수 (또는 다른 계수)의 편차가 무작위 오류로 인하지 않기 때문에, 연속적 분류 요구 조건은 민감도에 유의한 역효과를 가지지 않을 것이다. 다른 구현예들에서, 이웃하는 분절들의 z-점수가 더 높은 컷오프 수치를 사용하여 다함께 첨가될 수 있다. 예를 들어, 세 개 연속적 분절들의 z-점수가 합산될 수 있고 컷오프 수치 5가 사용될 수 있다. 본 개념은 세 개 이상의 연속적 분절들로 확장될 수 있다.One possible approach to improving sensitivity without sacrificing specificity is to consider the consequences of adjacent chromosome segments. In one embodiment, the cutoff for the z-score is still >2 and <-2. However, a chromosomal region will be classified as a potential aberration only when two consecutive segments show the same type of anomaly, eg both segments have a z-score >2. If the deviation of the normalized tag count is a random error, the probability of having two consecutive segments with false positives in the same direction will be 0.125% (5% x 5%/2). On the other hand, if the chromosomal aberration encompasses two consecutive segments, the bottom cutoff value will make the detection of over- or under-expression of segments in the plasma sample more sensitive. Since the deviation of the normalized tag count (or other count) from the mean of control subjects is not due to random error, the continuous classification requirement will not have a significant adverse effect on sensitivity. In other implementations, the z-scores of neighboring segments can be added together using a higher cutoff value. For example, the z-scores of three consecutive segments may be summed and a cutoff value of 5 may be used. This concept can be extended to three or more consecutive segments.
양 및 이상 역치들의 조합은 분석의 목적, 및 유기체의 선행 지식이라면 모두 (또는 그의 결여)에도 역시 의존할 수 있다. 예를 들어, 암에 대해 정상의 건강한 집단을 검색하는 경우라면, 전형적으로 잠재적으로 부위들의 둘 다의 양에서 높은 특이도 (예로, 부위들의 수를 위한 높은 역치) 또한 부위가 이상을 가지는 것으로서 확인될 때를 위한 이상 역치를 사용할 것이다. 그러나, 더 높은 위험을 가진 환자 (예로, 종괴 (lump) 또는 가족력, 흡연자, HPV 바이러스, 간염 바이러스, 또는 기타 바이러스들을 호소하는 환자)에서, 다음으로 역치들은 더 높은 민감도 (더 적은 위음성들)를 가지도록 낮아질 수 있다.The combination of amounts and aberration thresholds may also depend on the purpose of the analysis and any (or lack thereof) prior knowledge of the organism. For example, when screening a normal healthy population for cancer, typically high specificity (eg, a high threshold for the number of sites) potentially in both amounts of sites also identifies the site as having an abnormality. We will use the ideal threshold for when However, in patients at higher risk (e.g., patients complaining of lumps or family history, smokers, HPV virus, hepatitis virus, or other viruses), the next thresholds are higher sensitivity (less false negatives). can be lowered to have
한 가지 구현예에서, 염색체 이상을 검출하기 위해 종양-유래 DNA의 1 Mab 해상도 및 6.3%의 저부 검출 한계를 사용하는 경우라면, 각 1 Mb 분절에서 분자들의 수는 60,000개가 되는 것이 필요할 것이다. 이것은 전체 게놈을 위한 정렬가능한 대략 180 백만 개 (60,000개 해독/Mb x 3,000 Mb)로 해석될 것이다.In one embodiment, if using 1 Mab resolution of tumor-derived DNA and a bottom detection limit of 6.3% to detect chromosomal aberrations, it would be necessary for the number of molecules in each 1 Mb segment to be 60,000. This would translate to approximately 180 million alignable for the entire genome (60,000 reads/Mb x 3,000 Mb).
도 15는 본 발명의 구현예들에 따라 종양-유래 단편들의 다양한 수들의 분절들 및 분획 농도를 위해 요구되는 깊이를 도시하는 표 1500을 나타낸 것이다. 컬럼 1510은 시료를 위해 종양 세포들로부터 나온 단편들의 농도를 제공한다. 농도가 높을수록, 이상을 검출하는 것이 더 쉽고, 그래서 더 적은 수의 분자들이 분석되도록 요구된다. 컬럼 1520은 깊이에 관하여 상기 본 섹션에서 기술된 방법을 통하여 계산될 수 있는 분절 당 요구되는 분자들의 추정된 수를 제공한다.15 shows Table 1500 showing the depth required for various numbers of segments and fraction concentrations of tumor-derived fragments in accordance with embodiments of the present invention.
분절 크기가 작을수록 더 작은 염색체 이상들을 검출하는 해상도가 더 높아질 것이다. 그러나, 이것은 전체적으로 분석되는 분자들의 수의 요구 조건을 증가시킬 것이다. 분절 크기가 커질수록 해상도를 희생하여 분석에 요구되는 분자들의 수를 감소시킬 것이다. 따라서, 더 큰 이상들만이 검출될 수 있다. 한 가지 시행예에서, 더 큰 부위들이 사용될 수 있고 이상을 보이는 분절들은 소분할되고 이들 소부위들은 더 나은 해상도를 (예로, 상기에 기술된 바와 같이) 획득하도록 분석될 것이다. 컬럼 1530은 각 분절의 크기를 제공한다. 컬럼 1540은 전체 게놈을 위해 분석되는 분자들의 수를 보여준다. 따라서, 추정치 (또는 검출될 최소의 농도)를 가지는 경우라면, 분석될 분자들의 수가 결정될 수 있다.The smaller the segment size, the higher the resolution will be to detect smaller chromosomal abnormalities. However, this will increase the requirement for the number of molecules to be analyzed as a whole. A larger segment size will reduce the number of molecules required for analysis at the expense of resolution. Thus, only larger anomalies can be detected. In one implementation, larger regions may be used and segments showing anomalies will be subdivided and these subregions will be analyzed to obtain better resolution (eg, as described above).
Ⅵ. 계속적인 진행Ⅵ. on-going
종양이 진행하면서, 종양 단편들의 양은 종양이 더 많은 DNA 단편들을 방출할 것이기 때문에 (예로, 종양의 성장, 더 많은 괴사, 또는 더 높은 증가할 것이다. 혈장 내로 종양 조직들로부터 나온 더 많은 DNA 단편들은 혈장에서 불균형 (예로, RHDO에서 두 개 반수체형들 간의 태그 계수들에서 차이)의 정도를 증가시킬 것이다. 추가적으로, 종양 단편들의 수가 증가하기 때문에 이상이 존재하는 부위들의 수는 더 쉽게 검출될 수 있다. 예를 들어, 부위에 대한 종양 DNA의 양이 매우 적을 수 있어, 종양이 작고 적은 양의 암 DNA 단편들의 방출하고 있을 때는 충분치 않은 단편들이 분석되기 때문에 통계학적으로 유의한 차이가 확립될 수 없어서 이상이 검출될 수 없다. 종양이 작을 때에라도 더 많은 단편들이 분석될 수 있지만, 더 큰 시료 (예로, 많은 혈장)를 요구할 수 있다.As the tumor progresses, the amount of tumor fragments will increase as the tumor will release more DNA fragments (eg, tumor growth, more necrosis, or higher. More DNA fragments from tumor tissues into the plasma will will increase the degree of imbalance in plasma (eg, difference in tag counts between two haplotypes in RHDO) In addition, the number of regions with abnormalities can be more easily detected because the number of tumor fragments increases For example, the amount of tumor DNA for a site may be very small, so that when the tumor is small and emitting small amounts of cancer DNA fragments, a statistically significant difference cannot be established because not enough fragments are analyzed. No abnormalities can be detected Even when the tumor is small, more fragments can be analyzed, but may require a larger sample (eg, more plasma).
암의 진행을 추적하는 것은 하나 이상의 부위들에서 이상의 양 (예로, 불균형 또는 요구되는 깊이에 의해) 또는 이상을 나타내는 염색체 부위들의 양 (수 및/또는 크기)를 사용할 수 있다. 한 가지 구현예에서, 하나의 부위 (또는 여러 부위들)의 이상의 양이 다른 부위들의 이상들보다 더 빠르게 증가하는 경우라면, 해당 부위(들)은 암을 감시하는 바람직한 마커로서 사용될 수 있다. 본 증가는 커지고 있어 많은 단편들을 방출하는 종양의 결과, 및/또는 부위가 많은 횟수로 증폭된 점일 수 있다. 수술 이후에 종양이 적절하게 제거되었던 점을 입증하도록 이상 수치 (예로, 이상의 양 또는 이상들을 보이는 부위들의 수, 또는 그들의 조합)도 역시 감시할 수 있다.Tracking the progression of cancer can use the amount (number and/or size) of chromosomal regions exhibiting an abnormality (eg, by imbalance or desired depth) or an abnormality in one or more regions. In one embodiment, if the amount of an abnormality in one site (or multiple sites) increases more rapidly than abnormalities in other sites, that site(s) can be used as a preferred marker for monitoring cancer. This increase may be the result of a tumor that is growing and releasing many fragments, and/or that the site is amplified a large number of times. Abnormalities (eg, the amount or number of sites exhibiting abnormalities, or a combination thereof) may also be monitored after surgery to demonstrate that the tumor has been adequately removed.
기술학의 다양한 시행예들에서, 종양성 DNA의 분획 농도는 암의 단계를 결정하거나, 예후를 판단하거나, 이의 진행을 감시하는 데 사용된다. 측정된 진행은 암의 현재 단계 및 암이 자라거나 퍼지는 속도에 관한 정보를 제공할 수 있다. 암의 "단계"는 다음의 모두 또는 일정과 관련된다: 종양의 크기, 조직학적 외관, 림프절 관여의 존재/부재, 및 먼 전이들의 존재/부재. 암의 "예후 판단"은 질환 진행의 기회 및/또는 암으로부터 생존의 기회를 추정하는 것이 관여한다. 이것은 환자가 임상적 진행이 안될 시간의 추정, 또는 생존의 지속기간도 역시 관여할 수 있다. 암의 "감시"는 암이 진행되었는지 (예로, 크기에서 증가하였는지, 림프절들의 관여가 증가하였는지, 또는 먼 기관으로 퍼졌는지, 예로 전이들) 여부를 관찰하도록 체크하는 것이 관여할 것이다. 감시는 종양이 치료에 의해 통제되었는지 여부를 검토하는 것도 역시 포함할 수 있다. 예를 들어, 치료가 효과적인 경우라면 종양의 크기에서 감소, 전이들 또는 림프절 관여에서의 퇴행, 환자의 일반적인 복지에서의 개선 (예로, 체중의 증가)을 보일 수 있다.In various implementations of technology, fractional concentrations of oncogenic DNA are used to determine the stage of a cancer, determine the prognosis, or monitor its progression. Measured progression can provide information about the current stage of the cancer and the rate at which the cancer is growing or spreading. A “stage” of cancer relates to all or a schedule of the following: tumor size, histological appearance, presence/absence of lymph node involvement, and presence/absence of distant metastases. "Determining the prognosis" of cancer involves estimating the chance of disease progression and/or survival from the cancer. This may also be involved in the estimation of how long the patient will not progress clinically, or the duration of survival. "Monitoring" of cancer will involve checking to see if the cancer has advanced (eg, increased in size, increased involvement of lymph nodes, or has spread to distant organs, eg metastases). Surveillance may also include reviewing whether the tumor has been controlled by treatment. For example, if the treatment is effective, it may show a decrease in the size of the tumor, a regression in metastases or lymph node involvement, and an improvement in the patient's general well-being (eg, an increase in body weight).
A. 암A. Cancer DNA의 분획 농도의 결정 Determination of Fractional Concentration of DNA
하나 이상의 부위들에 대한 이상에서 증가의 양을 추적하는 한 가지 방식은 부위(들)에 대한 암 DNA의 분획 농도를 결정하는 것이다. 다음으로 암 DNA의 분획 농도에서 변화는 계속 종양을 추적하는 데 사용될 수 있다. 본 추적은 진단하는 데 사용될 수 있고, 예로 첫 번째 측정은 (사람의 일반적인 이상의 수준에 해당할 수 있는) 기저 수준을 제공할 수 있고 이후 측정들은 종양 성장 (따라서 암)을 제시할 변화를 보여줄 수 있다. 암 DNA의 분획 농도에서 변화는 치료가 잘 시행되는 정도를 예후 판단하는 데도 역시 사용될 수 있다. 기술학의 다른 시행예들에서, 혈장에서 종양성 DNA의 분획 농도에서 증가는 환자에세 나쁜 예후 또는 종양 부하에서 증가를 가리킬 것이다.One way to track the amount of increase in abnormalities for one or more sites is to determine the fractional concentration of cancer DNA for the site(s). Changes in fractional concentrations of cancer DNA can then be used to continue tracking tumors. This follow-up may be used to diagnose, eg a first measurement may provide a baseline level (which may correspond to a level of general abnormality in a person) and subsequent measurements may show changes that would suggest tumor growth (and thus cancer). have. Changes in the fractional concentration of cancer DNA can also be used to determine the prognosis of the extent to which treatment is successful. In other implementations of the art, an increase in the fractional concentration of oncogenic DNA in plasma will indicate a poor prognosis or an increase in tumor burden in the patient.
암 DNA의 분획 농도는 다양한 방식들로 결정될 수 있다. 예를 들어, 하나의 반수체형으로부터 나온 태그 계수들에서 차이는 또 다른 것과 비교된다 (또는 하나의 부위가 또 다른 것과 비교됨). 또 다른 방법은 통계학적으로 유의한 차이가 관찰되기 이전의 깊이이다 (예로, 분석된 단편들의 수). 초기의 예의 경우, 반수체형 용량에서 차이는 이종접합의 소실을 가진 염색체 부위들을 분석하여 생물학적 시료 (예로, 혈장)에서 종양-유래 DNA의 분획 농도를 결정하는 데 사용될 수 있다.The fractional concentration of cancer DNA can be determined in a variety of ways. For example, a difference in tag counts from one haplotype is compared to another (or one site is compared to another). Another method is the depth before a statistically significant difference is observed (eg, number of fragments analyzed). For an initial example, differences in haplotype doses can be used to determine fractional concentrations of tumor-derived DNA in a biological sample (eg, plasma) by analyzing chromosomal regions with loss of heterozygosity.
종양-유래 DNA가 암 환자들에서 종양 부하와 양성적으로 상관되는 점이 확인되어 왔다 (Lo et al. Cancer Res. 1999; 59: 5452-5. 및 Chan et al. Clin Chem. 2005; 51: 2192-5). 따라서, RHDO 분석에 의해 생물학적 시료에서 종양-유래 DNA의 분획 농도의 일련의 감시는 환자의 질환 진행을 감시하는 데 사용될 수 있다. 예를 들어, 치료 이후에 일련으로 수집된 시료들 (예로, 혈장)에서 종양-유래 DNA의 분획 농도의 감시는 치료의 성공을 결정하는 데 사용될 수 있다.It has been shown that tumor-derived DNA correlates positively with tumor burden in cancer patients (Lo et al. Cancer Res. 1999; 59: 5452-5. and Chan et al. Clin Chem. 2005; 51: 2192). -5). Thus, serial monitoring of fractional concentrations of tumor-derived DNA in biological samples by RHDO analysis can be used to monitor disease progression in patients. For example, monitoring the fractional concentration of tumor-derived DNA in samples (eg, plasma) collected serially after treatment can be used to determine the success of treatment.
도 16은 본 발명의 구현예들에 따라 RHDO 분석에 의해 혈장에서 종양-유래 DNA의 분획 농도를 측정하는 원리를 나타낸다. 두 개 반수체형들 간의 불균형이 결정되고 불균형의 정도는 시료에서 종양성 DNA의 분획 농도를 결정하는 데 사용될 수 있다. Hap I 및 Hap Ⅱ는 비종양 조직들에서 두 개 반수체형들을 대표한다. 소부위 1610에 있는 Hap Ⅱ는 종양 조직들에서 부분적으로 결실된다. 따라서, 혈장에서 결실된 결실된 부위 1610에 해당하는 Hap Ⅱ-연관된 단편들은 비종양 조직이 기여한다. 한편, Hap I에서 부위 1610은 종양 및 비종양 조직들 둘 다에 존재한다. 따라서 Hap I 및 Hap Ⅱ의 해독 계수들 간의 차이는 혈장에서 종양-유래 DNA의 양을 나타낼 것이다.16 shows the principle of measuring the fractional concentration of tumor-derived DNA in plasma by RHDO analysis according to embodiments of the present invention. The imbalance between the two haplotypes is determined and the extent of the imbalance can be used to determine the fractional concentration of neoplastic DNA in a sample. Hap I and Hap II represent two haplotypes in non-tumor tissues. Hap II at
종양-유래 DNA의 분획 농도 (F)는 LOH에 의해 침범된 염색체 부위들을 위한 결실된 및 비결실된 염색체들로부터 나온 서열결정된 해독 (태그들)의 수로부터 다음의 공식을 사용하여 계산될 수 있다: F = (NHapI - NHap Ⅱ) / NHapI x 100%, 여기에서 NHapI는 LOH에 의해 침범된 염색체 부위들에 위치하는 이종접합 SNPs를 위한 Hap I 상의 대립인자들에 해당하는 서열결정된 해독의 수이고; NHap Ⅱ는LOH에 의해 침범된 염색체 부위 1610에 위치하는 이종접합 SNPs를 위한 Hap Ⅱ 상의 대립인자들에 해당하는 서열결정된 해독의 수이다.The fractional concentration (F) of tumor-derived DNA can be calculated from the number of sequenced translations (tags) from deleted and non-deleted chromosomes for chromosomal regions invaded by LOH using the formula : F = (NHapI - NHapII ) / NHapI x 100%, where NHapI is the sequenced sequence corresponding to alleles on Hap I for heterozygous SNPs located at chromosomal regions invaded by LOH is the number of detoxifications; NHapⅡ isNumber of sequenced translations corresponding to alleles on Hap II for heterozygous SNPs located at
상기 공식은 F = 1 - q/p로서 계산되는 시료 (F)에서 종양성 DNA의 분획 농도와 함께 p를 결실 (Hap I)을 포함하지 않는 염색체 부위 상에 위치하는 이종접합 좌위들에 대한 누적 태그 계수들로서, 또한 q를 결실 (Hap Ⅱ) 1610을 포함하는 염색체 부위에 대한 누적 태그 계수들로서 정의하는 것과 동등하다. 도 11에 도시된 예의 경우, 종양성 DNA의 분획 농도는 14% (1 - 104/121)이다.The above formula is the cumulative for heterozygous loci located on the chromosomal region that does not contain the deletion of p (Hap I) with the fractional concentration of oncogenic DNA in the sample (F) calculated as F = 1 - q/p. As tag coefficients, it is also equivalent to defining q as cumulative tag coefficients for the chromosomal region containing deletion (Hap II) 1610. For the example shown in FIG. 11, the fractional concentration of oncogenic DNA is 14% (1 - 104/121).
HCC 환자의 혈장 시료들에서 종양성 DNA의 분획 농도는 종양 절제 이전 및 이후에 수집되었다. 종양 절제 이전에 주어진 염색체 부위의 첫 번째 반수체형을 위한 NHapI는 30,443개이고, 염색체 부위의 두 번째 반수체형을 위한 NHapⅡ는 16,221개이고, 이는 46.7%의 F를 준다. 종양 절제 이후에 NHapI는 31,534개이고, NHapⅡ는 31,089개이고, 이는 1.4%의 F를 준다. 본 감시는 종양 절제가 성공적인 점을 보여준다.Fractional concentrations of neoplastic DNA in plasma samples from HCC patients were collected before and after tumor resection. NHapI numbered for the first haplotypes of the chromosomal region given prior to tumor resection is 30,443,HapⅡ N is numbered 16 221 for the second half body of the chromosomal region, which gives F of 46.7%. After tumor resection, NHapI was 31,534 and NHapII was 31,089, giving an F of 1.4%. This surveillance shows that tumor resection was successful.
순환 DNA 크기 프로파일에서 변화의 정도는 분획 농도를 결정하는 데도 역시 사용될 수 있다. 한 가지 시행예에서, 종양 및 비종양 조직들 둘 다로부터 유래한 혈장 DNA의 정확한 크기 분포가 결정될 수 있고 다음으로 두 개의 기지의 분포들 간에 속하는 측정된 크기 분포는 분획 농도를 (예로, 종양 및 비종양 조직들의 크기 분포들의 두 개 통계학적 수치들 간의 선형 모델을 사용하여) 제공할 수 있다. 임의적으로, 크기 변화들의 일련의 감시가 사용될 수 있다. 한 가지 관점에서, 크기 분포에서 변화는 혈장에서 종양성 DNA의 분획 농도에 비례적인 것으로서 결정된다.The degree of change in the circulating DNA size profile can also be used to determine the fraction concentration. In one embodiment, the exact size distribution of plasma DNA derived from both tumor and non-tumor tissues can be determined and then the measured size distribution that falls between the two known distributions determines the fraction concentration (e.g., tumor and using a linear model between the two statistical values of the size distributions of non-tumor tissues). Optionally, a series of monitoring of size changes may be used. In one aspect, the change in size distribution is determined as being proportional to the fractional concentration of tumorigenic DNA in plasma.
서로 다른 부위들 간의 차이도 역시 유사한 방식으로, 예로 상기 기술된 비특이적 반수체형 검출 방법들로 사용될 수 있다. 태그 계수 방법들에서, 여러 매개변수들이 질환 진행의 감시에 사용될 수 있다. 예를 들어, 염색체 이상들을 나타내는 부위들을 위한 z-점수의 규모는 생물학적 시료 (예로, 혈장)에서 종양-유래 DNA의 분획 농도를 반영하는 데 사용될 수 있다. 특정한 부위의 과다- 또는 과소-발현의 정도는 시료에서 종양-유래 DNA의 분획 농도 및 종양 조직들에서 사본수 변화의 범위 또는 수와 비례적이다. z-점수의 규모는 대조군 개체들과 대비하여 시료에서 특정한 염색체 부위의 과다- 또는 과소-발현의 정도의 측정이다. 따라서, z-점수의 규모는 시료에서 종양 DNA의 분획 농도, 또한 향후 환자의 종양 부하를 반영할 수 있다.Differences between different sites can also be used in a similar manner, eg with the nonspecific haplotype detection methods described above. In tag counting methods, several parameters can be used to monitor disease progression. For example, the scale of z-scores for sites exhibiting chromosomal aberrations can be used to reflect fractional concentrations of tumor-derived DNA in a biological sample (eg, plasma). The degree of over- or under-expression of a particular site is proportional to the fractional concentration of tumor-derived DNA in the sample and the extent or number of copy number changes in tumor tissues. The scale of the z-score is a measure of the degree of over- or under-expression of a particular chromosomal region in a sample compared to control subjects. Thus, the scale of the z-score may reflect the fractional concentration of tumor DNA in the sample, and also the tumor burden of the patient in the future.
B. 부위들의 수를 추적하는 것B. Tracking the number of parts
상기에서 언급된 바와 같이, 염색체 이상을 나타내는 부위들의 수는 암을 검색하는 데 사용될 수 있고, 이것은 마찬가지로 감시하고 예후를 판단하는 데 사용될 수 있다. 예들로서, 감시는 암의 현재 단계, 암이 재출현하는지 여부 및 치료가 작용하는지 여부를 결정하는 데 사용될 수 있다. 종양이 진행하면서, 종양의 게놈 작성이 더욱 해제될 것이다. 본 계속된 해체를 확인하기 위하여, 부위의 수 (예로, 1 Mb의 미리 정의된 부위들)를 추적하는 방법들은 종양의 진행을 확인하는 데 사용될 수 있다. 다음으로 더 진행된 암의 단계들에서 종양들은 이상을 나타내는 더 많은 부위들을 가질 것이다.As mentioned above, the number of sites exhibiting chromosomal abnormalities can be used to detect cancer, which can likewise be used to monitor and determine prognosis. As examples, monitoring can be used to determine the current stage of the cancer, whether the cancer is re-emerging, and whether treatment is working. As the tumor progresses, the genome writing of the tumor will be further unlocked. To confirm this continued dissolution, methods of tracking the number of sites (eg, predefined sites of 1 Mb) can be used to confirm tumor progression. In the next more advanced cancer stages, the tumors will have more sites displaying abnormalities.
C. 방법C. Method
도 17은 본 발명의 구현예들에 따라 핵산 분자들을 포함하는 생물학적 시료들을 사용하여 유기체에서 염색체 이상들의 진행을 결정하는 방법을 도시하는 흐름도를 나타낸다. 한 가지 구현예들에서, 적어도 일정의 핵산 분자들은 무세포이다. 예들로서, 염색체 이상들은 비악성 종양들 또는 전악성 병변들로부터 나올 수 있다. 또한, 이상들에서 증가는 염색체 이상들을 계속 포함하는 더욱 더 많은 세포들을 가지는 유기체로 인해, 또는 세포 당 이상들의 증가하는 수를 포함하는 세포들의 비율을 가지는 유기체로 인할 수 있다. 감소의 예로서, 치료 (예로, 수술 또는 화학요법)는 암과 연관된 세포들의 제거 또는 감소를 초래할 수 있다.17 shows a flow diagram illustrating a method for determining the progression of chromosomal abnormalities in an organism using biological samples comprising nucleic acid molecules in accordance with embodiments of the present invention. In one embodiment, at least some of the nucleic acid molecules are cell-free. As examples, chromosomal abnormalities may result from non-malignant tumors or pre-malignant lesions. Also, the increase in abnormalities may be due to an organism having more and more cells that continue to contain chromosomal abnormalities, or due to an organism having a proportion of cells containing an increasing number of abnormalities per cell. As an example of reduction, treatment (eg, surgery or chemotherapy) can result in the removal or reduction of cells associated with cancer.
단계 1710에서, 유기체의 하나 이상의 비중복 염색체 부위들이 확인된다. 각 염색체 부위는 다수의 좌위들을 포함한다. 부위들은 적합한 방법이라면 모두, 상기에서 기술된 것들에 의해 확인될 수 있다.At
단계들 1720 내지 1750는 각 다수의 시간대를 위해 수행된다. 각 시간대는 시료가 유기체로부터 획득되었던 서로 다른 시간에 해당한다. 현재 시료는 주어진 기간 동안 분석되고 있는 시료이다. 예를 들어, 시료는 6개월 동안 매월 취해질 수 있고, 분석은 시료가 획득된 이후 곧 시행될 수 있다. 임의적으로, 분석은 여러 번의 측정들이 여러 기간들의 시료로 취해진 이후에 시행될 수 있다.Steps 1720 - 1750 are performed for each of the plurality of time zones. Each time period corresponds to a different time at which the sample was obtained from the organism. The current sample is a sample being analyzed for a given period. For example, a sample may be taken monthly for six months, and the analysis may be performed soon after the sample is obtained. Optionally, the assay may be performed after multiple measurements have been taken with samples of multiple periods.
단계 1720에서, 유기체의 현재의 생물학적 시료가 유기체의 기준 게놈에서 핵산 분자의 위치를 확인하도록 분석된다. 위치는 본 명세서에서 언급된 방식들이라면 모두로, 예로 서열결정된 태그들을 획득하도록 단편들을 서열결정하고 기준 게놈에 서열결정된 태그들을 정렬하여 결정될 수 있다. 분자의 특정한 반수체형도 역시 반수체형-특이적 방법들을 위해 결정될 수 있다.In
단계들 1730 내지 1750은 하나 이상의 염색체 부위들을 위해 수행된다. 다수의 부위들이 사용될 때, 섹션 V로부터의 구현예들이 사용될 수 있다. 단계 1730에서, 핵산 분자들의 개별 그룹은 확인된 위치들을 기초로 하여 염색체 부위로부터 나온 것으로서 확인된다. 개별 그룹은 염색체 부위의 각 다수의 좌위들에 위치하는 적어도 하나의 핵산 분자를 포함한다. 한 가지 구현예에서, 본 그룹은 예로 상기 RHDO 방법에서와 같이, 염색체 부위의 특정한 반수체형에 정렬하는 단편들일 수 있다. 또 다른 구현예에서, 본 그룹은 섹션 Ⅳ에서 기술된 방법들에서와 같이, 염색체 부위에 정렬하는 단편이라면 모두일 수 있다.Steps 1730 - 1750 are performed for one or more chromosomal regions. When multiple sites are used, the implementations from section V may be used. At
단계 1740에서, 컴퓨터 시스템은 핵산 분자들의 개별 그룹의 개별 수치를 계산한다. 개별 수치는 개별 그룹의 핵산 분자들의 특성을 정의한다. 개별 수치는 본 명세서에서 언급된 수치들이라면 모두일 수 있다. 예를 들어, 본 수치는 본 그룹에 있는 단편들의 수 또는 본 그룹에 있는 단편들의 크기 분포의 통계학적 수치일 수 있다. 개별 수치는 역시 정상화된 수치, 예로 시료를 위한 태그 계수들의 전체 수 또는 기준 부위를 위한 태그 계수들의 수로 나눈 부위의 태그 계수일 수도 있다. 개별 수치는 역시 또 다른 수치로부터 차이 또는 비율일 수도 있고 (예로, RHDO에서), 이로 인해 부위에 대한 차이의 특성을 제공한다.In
단계 1750에서, 개별 수치는 첫 번째 염색체 부위가 결실 또는 증폭을 나타내는지 여부의 부류를 결정하도록 기준 수치와 비교된다. 본 기준 수치는 본 명세서에서 기술된 역치 또는 기준 수치라면 모두일 수 있다. 예를 들어, 기준 수치는 정상 시료들을 위해 결정된 역치 수치일 수 있다. RHDO를 위해, 개별 수치는 두 개 반수체형들 위한 태그 계수들의 차이 또는 비율일 수도 있고, 기준 수치는 통계학적으로 유의한 편차가 존재하는 것을 결정하는 역치일 수 있다. 또 다른 예로서, 기준 수치는 또 다른 반수체형 또는 부위를 위한 태그 계수 또는 크기 수치일 수 있고, 비교는 차이 또는 비율 (또는 이러한 함수)을 취한 다음 차이 또는 비율이 역치 수치 이상인지 여부를 결정하는 것을 포함할 수 있다. 기준 수치는 적합한 방법 및 판정기준이라면 모두에 따라, 예로 본 명세서에서 기술한 바와 같이 결정될 수 있다.In
단계 1760에서, 다수의 시간대에서 각 염색체 부위들의 분류들은 유기체에서 염색체 이상들의 진행을 결정하는 데 사용될 수 있다. 본 진행은 유기체가 암을 가지는지 여부, 암의 단계, 및 암의 예후를 결정하는 데 사용될 수 있다. 각 이들 결정은 본 명세서에서 기술된 바와 같이 암의 부류에 관여할 수 있다.At
본 암의 분류는 다양한 방식들로 수행될 수 있다. 예를 들어, 이상 부위들의 양은 계수되고 역치와 비교될 수 있다. 부위들을 위한 분류는 수적인 수치 (예로, 서로 다른 반수체형들 또는 서로 다른 부위들에 대한 수치가 되는 개별 및 기준 수치들로의 종양 농도) 및 농도에서의 변화가 결정될 수 있다. 농도의 변화는 유의한 증가가 일어났고 이로 인해 종양의 존재를 신호 전달하는 점을 결정하도록 역치와 비교될 수 있다.Classification of the present cancer can be performed in a variety of ways. For example, the amount of abnormal sites can be counted and compared to a threshold. Classification for sites can be determined by numerical values (eg, tumor concentrations to individual and reference values being numerical for different haplotypes or different sites) and changes in concentration. The change in concentration can be compared to a threshold to determine that a significant increase has occurred and thereby signals the presence of a tumor.
도 1은 결실의 이상을 보여주는 암세포의 염색체 부위를 나타낸 것이다.
도 2는 증폭의 이상을 보여주는 암세포의 염색체 부위를 나타낸 것이다.
도 3은 서로 다른 유형들의 암들 및 연관된 부위들 또한 그들의 해당 이상들을 도시하는 표 300을 나타낸 것이다.
도 4는 본 발명의 구현예들에 따라 혈장에서 작성된 측정들과 함께 이상을 보여주지 않는 암세포 내의 염색체 부위들을 나타낸 것이다.
도 5는 본 발명의 구현예들에 따라 결실된 부위를 결정하는 혈장에서 작성된 측정들과 함께 암세포 내의 염색체 부위 510의 결실을 나타낸 것이다.
도 6은 본 발명의 구현예들에 따라 증폭된 부위를 결정하는 혈장에서 작성된 측정들과 함께 암세포 내의 염색체 부위 610의 증폭을 나타낸 것이다.
도 7은 본 발명의 구현예들에 따라 종양 조직에서 단일-대립인자 증폭을 보였던 염색체 1p번에 위치하는 분절에 대한 간세포 암종 (HCC) 환자의 혈장 DNA의 RHDO 분석을 나타낸 것이다.
도 8은 본 발명의 구현예들에 따라 결실을 포함하는 종양이 존재할 때 염색체 부위의 두 개 반수체형들에 대한 단편들의 크기 분포에서 변화를 나타낸 것이다.
도 9는 본 발명의 구현예들에 따라 증폭을 포함하는 종양이 존재할 때 염색체 부위의 두 개 반수체형들에 대한 단편들의 크기 분포에서 변화를 나타낸 것이다.
도 10은 본 발명의 구현예들에 따라 염색체 부위가 결실 또는 증폭을 보여주는지 여부를 결정하도록 유기체의 생물학적 시료의 반수체형들을 분석하는 방법을 도시하는 흐름도를 나타낸 것이다.
도 11은 본 발명의 구현예들에 따라 결실된 부위를 결정하는 혈장에서 작성된 측정들과 함께 암세포들에서 결실되고 있는 소부위 1130을 가진 부위 1110을 나타낸 것이다.
도 12는 본 발명의 구현예들에 따라 이상들의 위치가 RHDO 분석을 사용하여 맵핑될 수 있는 방식을 나타낸 것이다.
도 13은 본 발명의 구현예들에 따라 또 다른 방향으로부터 시작된 RHDO 분류를 나타낸 것이다.
도 14는 본 발명의 구현예들에 따라 다수의 염색체 부위들을 사용하여 유기체의 생물학적 시료를 분석하는 방법 1400의 흐름도를 나타낸 것이다.
도 15는 본 발명의 구현예들에 따라 종양-유래 단편들의 다양한 수의 분절들 및 분획 농도를 위해 요구되는 깊이를 도시하는 표 1500을 나타낸 것이다. 도 15는 시료에서 서로 다른 백분율의 암-유래 DNA의 분획 농도를 위해 분석되는 분자들의 수의 추정을 제공한다.
도 16은 본 발명의 구현예들에 따라 혈장에서 종양-유래 DNA의 분획 농도를 상대적 반수체형 용량 (RHDO) 분석에 의해 측정하는 원리를 나타낸 것이다. 본 발명의 구현예들에 따라 Hap I 및 Hap Ⅱ는 비-종양 조직들에서 두 개의 반수체형들을 표시한다.
도 17은 본 발명의 구현예들에 따라 핵산 분자들을 포함하는 생물학적 시료들을 사용하여 유기체에서 염색체 이상들의 진행을 결정하는 방법을 도시하는 흐름도를 나타낸 것이다.
도 18A는 암을 가진 환자의 염색체 4번의 q 팔 상의 분절을 위한 RHDO 분석의 SPRT 곡선을 나타낸 것이다. 점들은 개별 이종접합 좌위들 이후에 누적 계수들의 비율을 표시한다. 도 18B는 치료 이후에 환자의 염색체 4번의 q 팔 상의 분절을 위한 RHDO 분석의 SPRT 곡선을 나타낸 것이다.
도 19는 HCC에서 발견되는 공통적인 염색체 이상들을 나타낸 것이다.
도 20A는 HCC 및 건강한 환자들을 위한 정상화된 태그 계수들의 결과들을 표적화 분석을 사용하여 나타낸 것이다. 도 20B는 3명의 HCC 환자들 및 4명의 건강한 대조군 개체들을 위한 표적 강화 및 대규모 병렬 서열결정 이후에 크기 분석의 결과들을 나타낸 것이다.
도 21은 본 발명의 구현예들에 따라 혈장 DNA의 서열결정된 태그 계수로부터 얻은 데이타를 보여주는 HCC 환자의 키르코스 좌표들을 나타낸 것이다.
도 22는 본 발명의 구현예들에 따라 HCC가 없는 만성 B형 간염 바이러스 (HBV) 보균자의 혈장 시료에 대한 서열결정된 태그 계수 분석을 나타낸 것이다.
도 23은 본 발명의 구현예들에 따라 제 3기 코인두 암종 (NPC)을 가진 환자의 혈장 시료에 대한 서열결정된 태그 계수 분석을 나타낸 것이다.
도 24는 본 발명의 구현예들에 따라 제 4기 NPC를 가진 환자의 혈장 시료에 대한 서열결정된 태그 계수 분석을 나타낸 것이다.
도 25는 본 발명의 구현예들에 따라 종양 조직에서 이종접합의 소실 (LOH)을 보이는 부위를 위해 크기에 대비한 혈장 DNA의 누적 빈도의 좌표를 나타낸 것이다.
도 26은 LOH 부위를 위해 서열결정된 혈장 DNA의 크기에 대비한 △Q를 나타낸 것이다. 본 발명의 구현예들에 따라 △Q는 130 bp 크기에서 0.2에 도달한다.
도 27은 본 발명의 구현예들에 따라 종양 조직에서 염색체 복제를 가진 부위의 크기에 대비한 혈장 DNA의 누적 빈도의 좌표를 나타낸 것이다.
도 28은 본 발명의 구현예들에 따라 증폭된 부위를 위해 서열결정된 혈장 DNA의 크기에 대비한 △Q를 나타낸 것이다.
도 29는 본 발명의 구현예들에 따른 시스템들 및 방법들로서 사용가능한 컴퓨터 시스템 900 예의 블록 도면을 나타낸 것이다.1 shows a chromosomal region of a cancer cell showing an abnormality of deletion.
Figure 2 shows a chromosome region of a cancer cell showing an abnormality of amplification.
3 presents Table 300 showing the different types of cancers and their associated sites as well as their corresponding abnormalities.
4 shows chromosomal regions in cancer cells that do not show abnormalities along with measurements made in plasma according to embodiments of the present invention.
5 depicts deletion of
6 shows the amplification of
7 shows RHDO analysis of plasma DNA from hepatocellular carcinoma (HCC) patients for the segment located on chromosome 1p that showed single-allele amplification in tumor tissue according to embodiments of the present invention.
8 shows the change in the size distribution of fragments for two haplotypes of a chromosomal region in the presence of a tumor comprising a deletion according to embodiments of the present invention.
9 shows the change in the size distribution of fragments for two haplotypes of a chromosomal region in the presence of a tumor comprising amplification according to embodiments of the present invention.
10 is a flowchart illustrating a method of analyzing haplotypes in a biological sample of an organism to determine whether a chromosomal region exhibits deletion or amplification in accordance with embodiments of the present invention.
FIG. 11 depicts
12 illustrates how the location of anomalies may be mapped using RHDO analysis in accordance with implementations of the present invention.
13 shows an RHDO classification starting from another direction according to embodiments of the present invention.
14 is a flowchart of a
15 shows Table 1500 showing the depth required for various numbers of segments and fraction concentrations of tumor-derived fragments in accordance with embodiments of the present invention. 15 provides an estimate of the number of molecules analyzed for fractional concentrations of different percentages of cancer-derived DNA in a sample.
16 shows the principle of determining the fractional concentration of tumor-derived DNA in plasma by relative haplotype dose (RHDO) analysis according to embodiments of the present invention. According to embodiments of the invention Hap I and Hap II display two haplotypes in non-tumor tissues.
17 is a flow diagram illustrating a method for determining the progression of chromosomal abnormalities in an organism using biological samples comprising nucleic acid molecules in accordance with embodiments of the present invention.
Figure 18A shows the SPRT curve of the RHDO analysis for the segment on the q arm of
19 shows common chromosomal abnormalities found in HCC.
20A shows the results of normalized tag counts for HCC and healthy patients using a targeted analysis. 20B shows the results of size analysis after target enrichment and massively parallel sequencing for 3 HCC patients and 4 healthy control subjects.
Figure 21 depicts the Circus coordinates of a patient with HCC showing data obtained from sequenced tag counts of plasma DNA in accordance with embodiments of the present invention.
22 shows a sequenced tag count analysis of a plasma sample from a chronic hepatitis B virus (HBV) carrier without HCC according to embodiments of the present invention.
23 shows a sequenced tag count analysis of a plasma sample from a patient with tertiary nasopharyngeal carcinoma (NPC) in accordance with embodiments of the present invention.
24 shows a sequenced tag count analysis of a plasma sample from a patient with stage IV NPC in accordance with embodiments of the present invention.
25 shows the coordinates of the cumulative frequency of plasma DNA versus size for sites exhibiting loss of heterozygosity (LOH) in tumor tissue in accordance with embodiments of the present invention.
Figure 26 shows ΔQ versus size of plasma DNA sequenced for LOH sites. According to embodiments of the present invention ΔQ reaches 0.2 at 130 bp size.
27 shows the coordinates of the cumulative frequency of plasma DNA versus the size of a region with chromosomal replication in tumor tissue according to embodiments of the present invention.
28 shows ΔQ versus size of plasma DNA sequenced for sites amplified according to embodiments of the present invention.
29 shows a block diagram of an example computer system 900 usable as systems and methods in accordance with implementations of the present invention.
Ⅶ.VII.실시예들Examples
A.A.SPRT를SPRT 사용하는 usingRHDORHDO
본 섹션에서, 우리는 간세포 암종 (HCC) 환자를 위해 SPRT를 사용하는 상대적 반수체형 용량 (RHDO) 분석을 사용하는 예를 보여주고 있다. 본 환자의 종양 조직에서, 염색체 4번 두 개 중 하나의 결실이 관찰되었다. 이것은 염색체 4번 상의 SNPs에 대한 이종접합의 소실을 가져온다. 본 환자의 반수체형 분석을 위해, 환자, 그의 아내, 및 그의 아들의 DNA가 분석되었고 3명 개인들의 유전형들이 결정되었다. 다음으로 환자의 전신적 반수체형들은 그들의 유전형들로부터 유래하였다. 대규모 병렬 서열결정이 수행되었고 염색체 4번의 두 개 반수체형들에 해당하는 SNP 대립인자들을 가지는 서열결정된 해독이 확인되고 계수되었다.In this section, we present an example of using a relative haplotype dose (RHDO) assay using SPRT for a patient with hepatocellular carcinoma (HCC). In the tumor tissue of this patient, a deletion of one of two
RHDO 및 SPRT의 공식들 및 원리들은 상기에 기술되었다. 한 가지 구현예에서, RHDO 분석은 예를 들어 두 개 반수체형들의 하나가 증폭되거나 결실될 때 종양-유래 DNA의 10%의 존재에 해당하고 있는 DNA 시료에서의 반수체형 용량들의 10% 차이를 검출하도록 프로그램될 것이다. 다른 구현예들에서, RHDO 분석의 민감도는 DNA 시료에서 종양-유래 DNA의 2%, 5%, 15%, 20%, 25%, 30%, 40% 및 50% 등을 검출하도록 설정될 수 있다. RHDO 분석의 민감도는 SPRT 분류 곡선들의 상부 및 저부 역치의 계산을 위한 매개변수에서 조정될 수 있다. 조정가능한 매개변수들은 검출 한계 (예로, 분석된 분자의 수에 영향을 주는 검출가능해야 하는 종양 농도의 백분율) 또한 예로 우위 비율 (다른 반수체형을 위한 태그 계수들과 대비한 하나의 반수체형을 위한 태그 계수들의 비율)을 사용하는 분류를 위한 역치의 원하는 수준일 수 있다.The formulas and principles of RHDO and SPRT have been described above. In one embodiment, the RHDO assay detects a 10% difference in haplotype doses in a DNA sample corresponding to the presence of 10% of tumor-derived DNA, for example when one of the two haplotypes is amplified or deleted. will be programmed to In other embodiments, the sensitivity of the RHDO assay can be set to detect 2%, 5%, 15%, 20%, 25%, 30%, 40%, 50%, etc. of tumor-derived DNA in a DNA sample. . The sensitivity of the RHDO assay can be adjusted in parameters for the calculation of the upper and lower thresholds of the SPRT classification curves. Tunable parameters may include detection limits (e.g., the percentage of tumor concentration that should be detectable that affects the number of molecules analyzed) and also e.g. the predominance ratio (for one haplotype versus tag coefficients for another haplotype). a desired level of threshold for classification using the ratio of tag coefficients).
본 RHDO 분석에서, 귀무가설은 염색체 4번을 위한 두 개 반수체형들이 동일한 용량으로 존재하는 점이다. 대안의 가설은 두 개 반수체형들의 용량이 생물학적 시료 (예로, 혈장)에서 10% 이상이 서로 다른 점이다. 두 개 반수체형들에 해당하는 SNP 대립인자들을 가지는 서열분석된 해독의 수가 서로 다른 SNPs로부터 얻은 데이타가 축적된 두 개 가설들에 대해 통계학적으로 비교되었다. SPRT 분류는 축적된 데이타가 두 개 반수체형 용량들이 동등한 양으로 존재하거나 적어도 10%가 통계학적으로 서로 다른지 여부를 결정하는 데 충분할 때 작성된다. 염색체 4번의 q 팔 상의 전형적인 SPRT 분류 블록은 도 18A에 나타낸다. 여기에서 10%의 역치는 설명적 목적으로만 사용된다. 기타 차이의 정도들 (예로, 0.1%, 1%, 2%, 5%, 15% 또는 20%)도 역시 검출될 수 있다. 일반적으로, 검출하기 원하는 차이의 정도가 낮아질수록 분석되는 데 필요한 DNA 분자들이 많아진다. 반대로, 검출하기 원하는 차이의 정도가 클수록 분석되고 통계학적으로 유의한 결과를 달성하는 데 필요한 DNA 분자들의 수가 적어진다. 본 분석을 위해, 우위 비율이 SPRT 분석에 사용되지만, z-점수 또는 p-수치와 같은 기타 매개변수들이 사용될 수 있다.In this RHDO analysis, the null hypothesis is that the two haplotypes for
진단 시점에 취해진 HCC 환자의 본 혈장 시료에서, 염색체 4번의 p 및 q 팔들을 위한 각각 76개 및 148개의 성공적인 RHDO 분류들이 존재하였다. 모든 RHDO 분류들은 진단 시점에 취해진 혈장 시료에서 반수체형 용량 불균형이 존재하는 점을 가리킨다. 비교로서, 종양의 수술적 절제 이후 취해진 환자의 혈장 시료도 역시 도 18B에 나타난 바와 같이 분석되었다. 치료후 시료들의 경우, 염색체 4번의 p 및 q 팔들을 위한 각각 4개 및 9개의 성공적인 RHDO 분류들이 존재하였다. 모두 네 개의 RHDO 분류들은 혈장 시료에서 > 10%의 관찰가능한 반수체형 용량 불균형이 전혀 존재하지 않은 점을 가리킨다. 염색체 4q번을 위한 9개 RHDO 분류들 중에서, 7개는 반수체형 용량 불균형의 부재를 가리키고 2개는 불균형의 존재를 가리킨다. > 10%의 용량 불균형을 보이는 RHDO 블록들의 수는 종양 절제 이후에 유의하게 감소되었고, > 10%의 용량 불균형을 보이는 염색체 부위의 크기가 치료전 시료에서보다 치료후 시료에서 유의하게 작은 점을 가르킨다. 이들 결과들은 혈장에서 종양 DNA의 분획 농도가 종양의 수술적 절제 이후에 감소되었던 점을 제시하고 있다.In this plasma sample of HCC patients taken at the time of diagnosis, there were 76 and 148 successful RHDO classifications for the p and q arms of
비-반수체형 특이적 방법들과 비교할 때, RHDO 분석은 종양성 DNA의 분획 농도의 더 정확한 추정을 제공할 수 있고 질환 진행의 감시에 특히 유용하다. 따라서, 질환 진행을 가진 사례들이 혈장에서 종양성 DNA의 분획 농도에서 증가를 나타낼 것인 한편; 안정한 질환을 가진 사례들 또는 종양이 퇴행되거나 크기가 감소되었던 사례들은 혈장에서 종양성 DNA의 분획 농도에서 감소를 가질 것이라고 예상할 것이다.Compared to non-haplotype specific methods, RHDO analysis can provide a more accurate estimate of the fractional concentration of neoplastic DNA and is particularly useful for monitoring disease progression. Thus, while cases with disease progression will show an increase in the fractional concentration of neoplastic DNA in plasma; Cases with stable disease or cases in which the tumor has regressed or has decreased in size would be expected to have a decrease in the fractional concentration of neoplastic DNA in plasma.
B. 표적화된B. Targeted 분석 analysis
선택된 구현예들에서, DNA 단편들의 보편적 서열결정은 표적 강화 접근법을 따라 수행될 수 있다. 이러한 접근법은 본 명세서에서 강화된 서열결정이라고도 말한다. 이러한 접근법의 한 가지 구현예는 용액 내 포획 시스템 (예로, Agilent SureSelect 시스템, 일루미나사 TruSeq Custom 강화 키트 (illumina.com/applications/sequencing/targeted_resequencing.ilmn))을 사용하거나, 마이게노스틱사의 GenCap Custom 강화 키트 (mygenostics.com/)에 의해 또는 마이크로어레이-기초 포획 시스템 (예로, 로슈사 NimbleGene 시스템)에 의한 단편들의 사전 선별이다. 일정 다른 부위들이 포획될 수 있더라도, 소정의 부위들이 선호적으로 포획된다. 이러한 방법들은 이러한 부위들이 더 큰 깊이로 (예로, 더 많은 단편들이 디지탈 PCR로 서열결정되거나 분석될 수 있다) 및/또는 더 낮은 비용으로 분석되도록 허용할 수 있다. 더 큰 깊이는 부위에서 민감도를 증가시킬 수 있다. 다른 강화 방법들이 단편들의 크기 및 메틸화 양상들을 기초로 하여 수행될 수 있다.In selected embodiments, universal sequencing of DNA fragments can be performed following a target enrichment approach. This approach is also referred to herein as enhanced sequencing. One embodiment of this approach uses an in-solution capture system (e.g., Agilent SureSelect System, Illumina TruSeq Custom Enrichment Kit (illumina.com/applications/sequencing/targeted_resequencing.ilmn)), or Mygenistic GenCap Custom Enrichment Preselection of fragments by kit (mygenostics.com/) or by microarray-based capture systems (eg Roche NimbleGene system). Certain sites are preferably captured, although certain other sites may be captured. Such methods may allow such sites to be analyzed with greater depth (eg, more fragments can be sequenced or analyzed with digital PCR) and/or at lower cost. A greater depth may increase the sensitivity at the site. Other enrichment methods can be performed based on the size and methylation aspects of the fragments.
따라서, 게놈 범위로 DNA 시료를 분석하는 것의 대안은 공통적인 염색체 이상들을 검출하기 위해 관심 있는 부위들을 표적화하는 것이다. 표적화된 접근법은 분석적 공정이 염색체 이상들이 잠재적으로 존재하는 부위들 또는 특정한 종양 유형에 특히 특징적일 변화들을 가진 부위들, 또는 특히 임상적으로 중요할 변화들을 가진 부위들에 주로 중점을 둘 것이기 때문에 본 접근법의 비용-효율성을 잠재적으로 개선시킬 수 있다. 후자의 예들로는 특정한 암 유형의 종양원형성에서 초기에 발생할 변화들 (예로, 1q 및 8q의 증폭, 또한 8q의 결실의 존재는 HCC에서 초기 염색체 변화들이다 - van Malenstein et al.Eur J Cancer 2011;47:1789-97); 또는 좋거나 나쁜 예후와 연관된 변화들 (예로, 6q 및 17q에서 증가, 또한 6p 및 9p에서 소실이 종양 진행 동안 관찰되고, 18q, 8p 및 17p에서 LOH의 존재는 결장직장암 환자들에서 더 낮은 생존율과 연관된다 - Westra et al. Clin Colorectal Cancer 2004;4:252-9); 또는 치료 반응의 예측하는 변화들 (예로, 7p에서 증가의 존재는 표피성장인자 수용체 돌연변이들을 가진 환자들에서 타이로신 키나제 저해제들에 대한 반응을 예측한다 - Yuan et al. J ClinOncol 2011;29:3435-42)을 포함한다. 암에서 변경되는 게놈 부위들의 다른 예들은 많은 온라인 데이타베이스 (예로, 암 게놈 해부 프로젝트 데이타베이스 (cgap.nci.nih.gov/Chromosomes/RecurrentAberrataions) 또한 유전학의 아틀라스 및 종양학 및 혈액학에서의 세포유전학 (atlasgeneticsoncology.org//Tumors/Tumorliste.html)에서 찾을 수 있다. 대조적으로, 비표적화된 게놈범위 접근에서는 염색체 이상들이 발생하지 않을 것 같은 부위들이 잠재적 이상들을 가진 부위들과 동일한 정도로 분석될 것이다.Thus, an alternative to analyzing DNA samples at genomic scale is to target regions of interest to detect common chromosomal aberrations. Targeted approaches are preferred because the analytical process will focus primarily on regions where chromosomal aberrations are potentially present, or regions with changes that will be particularly characteristic of a particular tumor type, or regions with changes that will be particularly clinically significant. It can potentially improve the cost-effectiveness of the approach. Examples of the latter include early chromosomal changes in HCC (eg, amplification of 1q and 8q, and also the presence of deletion of 8q - van Malenstein et al. Eur J Cancer 2011; 47:1789-97); or changes associated with a good or poor prognosis (e.g., an increase in 6q and 17q, and also a loss in 6p and 9p are observed during tumor progression, and the presence of LOH in 18q, 8p and 17p is associated with lower survival and lower survival in colorectal cancer patients associated - Westra et al. Clin Colorectal Cancer 2004;4:252-9); or predictive changes in therapeutic response (eg, the presence of an increase in 7p predicts response to tyrosine kinase inhibitors in patients with epidermal growth factor receptor mutations - Yuan et al. J ClinOncol 2011;29:3435- 42). Other examples of genomic regions that are altered in cancer are many online databases (eg, the Cancer Genome Dissection Project Database (cgap.nci.nih.gov/Chromosomes/RecurrentAberrataions)), also the atlas of genetics and cytogenetics in oncology and hematology. .org//Tumors/Tumorliste.html In contrast, in a non-targeted genome-wide approach, regions where chromosomal abnormalities are unlikely to occur will be analyzed to the same extent as regions with potential abnormalities.
우리는 3명의 HCC 환자들 및 4명의 건강한 대조군 개체들로부터 얻은 혈장 시료들을 분석하도록 표적-강화 전략을 적용하였다. 표적 강화는 애질런트사로부터 구입한 SureSelect 포획 시스템을 사용하여 수행되었다 (Gnirke et al. Nat. Biotechnol 2009.27:182-9). SureSelect 시스템은 가능한 표적 강화 기술학의 예로서 선택되었다. 다른 용액상 (IlluminaTruSeq Custom 강화 시스템) 또는 고체상 (예로, Roche-Nimblegen 시스템) 표적 포획 시스템들 및 증폭원점-기초 표적 강화 시스템 (예로, QuantaLife 시스템 및 RainDance 시스템)도 역시 사용될 수 있다. 포획 탐침들은 HCC에서 공통적으로 또한 현저하게도 이상들을 보여주는 염색체 부위들 상에 위치되도록 설계된다. 표적 포획 이후에, 다음으로 각 DNA 시료는 IlluminaGAIIx 분석기 상에서 유동 세포의 한 레인에 의해 서열결정되었다. 증폭 및 결실이 현저하게 발생하는 부위들은 증폭들 및 결실들이 더 공통적으로 존재하는 부위들과 비교하는 기준으로서 사용된다.We applied a target-enrichment strategy to analyze plasma samples from 3 HCC patients and 4 healthy control subjects. Target enrichment was performed using the SureSelect capture system purchased from Agilent (Gnirke et al. Nat. Biotechnol 2009.27:182-9). The SureSelect system was chosen as an example of a possible target enhancement technique. Other solution phase (IlluminaTruSeq Custom enrichment system) or solid phase (e.g., Roche-Nimblegen system) target capture systems and amplification origin-based target enrichment systems (e.g., QuantaLife system and RainDance system) can also be used. Capture probes are designed to be located on chromosomal regions that show abnormalities commonly and prominently in HCC. After target capture, each DNA sample was then sequenced by one lane of flow cells on an IlluminaGAIIx analyzer. Sites where amplifications and deletions occur predominantly are used as a basis for comparison with regions where amplifications and deletions are more common.
도 19에서, HCC에서 발견되는 공통적인 염색체 이상들이 관찰된다 (도면은 왕 등으로부터 응용된다 (Wong et al., Am J Pathol 1999;154:37-43)). 염색체 핵형도 (chromosome ideogram)의 우측면 상의 선들은 염색체 증가들을 나타내고 좌측면 상의 선들은 개별 환자 시료들의 염색체 소실을 나타낸다. 굵은 선들은 높은 수준 증가들을 나타낸다. 직사각형들은 표적 포획 탐침들의 위치들을 나타낸다. In FIG. 19 , common chromosomal aberrations found in HCC are observed (the figure is adapted from Wong et al. (Wong et al.,
표적화된targeted 태그 계수 분석 Tag Count Analysis
염색체 이상들의 검출을 위해, 우리는 먼저 잠재적인 이상들을 가진 부위들 및 기준 부위들을 위한 정상화된 태그 계수를 계산하였다. 다음으로 정상화된 태그 계수는 첸 등에 의해 이전에 기술된 바와 같이 부위의 GC 함량으로 교정되었다 (Chen et al., PLoS One 2011;6:e21791). 현재의 예에서, 염색체 8번의 p-팔이 잠재적인 이상의 부위로서 선택되었고 염색체 9번의 q-팔이 기준 부위로서 선택되었다. 세 명 HCC 환자들의 종양 조직들이 염색체 이상들에 대해 AffymetrixSNP 6.0를 사용하여 분석되었다. 종양 조직들에서 8p번 및 9q번에 대한 염색체 용량에서의 변화들이 하기 3명 환자들의 경우 하기에 관찰된다. 환자 HCC 013은 8p번의 소실 및 9q번의 무변화를 가졌다. 환자 HCC 027는 8p번의 증가 및 9q번의 무변화를 가졌다. 환자 HCC 028는 8p번의 소실 및 9q번의 무변화를 가졌다.For detection of chromosomal aberrations, we first calculated normalized tag counts for sites with potential aberrations and reference sites. The normalized tag counts were then corrected for the GC content of the site as previously described by Chen et al. (Chen et al., PLoS One 2011;6:e21791). In the present example, the p-arm of
다음으로 염색체 8p번 및 9q번 간의 정상화된 태그 계수의 비율이 세 명의 HCC 환자들 및 네 명의 건강한 대조군 개체들을 위해 표적화된 분석을 사용하여 계산되었다. 사례들 HCC 013 및 HCC 023의 경우, 감소된 8p번 및 9q번 간의 정상화된 태그 계수 비율이 관찰되었다. 이것은 종양 조직들에서 염색체 8p번의 소실의 연구와 부합한다. 사례 HCC 027의 경우, 증가된 비율이 관찰되었고 본 사례의 종양 조직들에서 염색체 8p번에서 증가와 부합한다. 점선들은 네 명의 정상 사례들의 평균 수치의 두 개 표준 편차들을 가진 부위를 나타낸다.The ratio of normalized tag counts between
표적화된targeted 크기 분석 size analysis
이전의 섹션들에서, 우리는 암-연관된 변경들을 검출하는 원리를 암 환자들에서 혈장 DNA 단편들의 크기 프로파일을 결정하여 기술하고 있다. 크기 변경들도 역시 표적-강화 접근법으로 검출될 수 있다. 세 명의 HCC 사례들 (HCC 013, HCC 027 및 HCC 023)의 경우, 각 서열결정된 DNA 단편의 크기는 둘 다의 말단들의 최외부 뉴클레오타이드들의 좌표들로부터 추론되었다. 다른 구현예들에서, 전체 DNA 단편이 서열결정될 것이고 다음으로 단편 크기가 서열결정된 길이로부터 직접 결정될 수 있다. 염색체 8p번에 정렬된 DNA 단편들의 크기 분포는 염색체 9p번에 정렬된 DNA 단편들의 크기 분포와 비교되었다. 두 개 집단들의 DNA의 크기 분포에서 차이의 검출을 위해, 150 bp보다 짧은 DNA 단편들의 비율이 현재의 사례에서 각 집단을 위해 먼저 결정되었다. 다른 구현예들에서, 다른 크기의 컷오프 수치들, 예로 80 bp, 110 bp, 100 bp, 110 bp, 120 bp, 130 bp, 140 bp, 160 bp 및 170 bp가 사용될 수 있다. 다음으로 △Q 수치들이 두 개 비율들의 차이로서 결정되었다. △Q = Q8p - Q9q, 여기에서 Q8p는 150 bp보다 짧은 염색체 8p번에 정렬한 DNA 단편들의 비율이고; Q9q는 150 bp보다 짧은 염색체 9p번에 정렬한 DNA 단편들의 비율이다.In previous sections, we describe the principle of detecting cancer-associated alterations by determining the size profile of plasma DNA fragments in cancer patients. Size changes can also be detected with a target-enhancing approach. For three HCC cases (
DNA 단편들의 더 짧은 크기 분포가 컷오프 수치 (예로, 현재의 예에서 150 bp)보다 짧은 DNA 비율의 더 높은 수치를 줄 것이기 때문에, △F의 더 높은 (더 양성) 수치는 염색체 9p번에 정렬한 것들과 대비하여 염색체 8p번에 정렬한 DNA 단편들의 더 짧은 분포를 나타낼 것이다. 반대로, 더 작은 (또는 더 음성) 결과는 염색체 9p번에 정렬한 것과 대비하여 염색체 8p번에 정렬한 DNA 단편들의 더 긴 분포를 표시할 것이다.Since a shorter size distribution of DNA fragments will give a higher number of short DNA fractions than a cutoff value (e.g., 150 bp in the present example), a higher (more positive) value of ΔF indicates that the will show a shorter distribution of DNA fragments aligned on
도 20B는 3명의 HCC 환자들 및 4명의 건강한 대조군 개체들을 위한 표적 강화 및 대규모 병렬 서열결정 이후에 크기 분석의 결과들을 나타낸다. 네 명의 건강한 대조군 개체들에서 △Q의 양성 수치들은 염색체 9p번에 정렬한 것들과 대비하여 염색체 8p번에 정렬한 DNA 단편들의 약간 더 짧은 크기 분포를 표시한다. 점선들은 네 명의 대조군 개체들에 대한 평균으로부터 두 개 표준 편차 내에 속하는 △Q의 간격을 나타낸다. 사례들 HCC 013 및 HCC 023은 대조군 개체들의 평균 수치 미만의 두 개 이상의 표준 편차들이었다. 이들 두 사례들은 종양 조직들에서 염색체 8p번의 결실을 가졌다. 종양에서 8p번의 결실은 본 염색체 부위의 경우 종양-유래 DNA의 혈장에 대한 감소된 기여를 가져올 것이다. 순환에서 종양 유래 DNA는 비종양 조직들로부터 유래한 DNA보다 짧기 때문에, 이것은 염색체 8p번에 정렬한 혈장 DNA 단편들의 경우 외관상 더 긴 크기 분포를 유도할 것이다. 이것은 이들 두 사례들에서 △Q의 더 낮은 (더 음성) 수치와 부합된다. 대조적으로, 사례 HCC 027에서 8p번의 증폭은 본 부위에 정렬한 DNA 단편들에 대한 외관상 더 짧은 분포를 유도할 것이다. 따라서, 8p번에 정렬한 혈장 DNA 단편들의 더 높은 비율이 짧은 것으로 고려될 것이다. 이것은 HCC 027의 △Q 수치가 건강한 대조군 개체들보다 양성이라는 관찰과 부합된다.20B shows the results of size analysis after target enrichment and massively parallel sequencing for 3 HCC patients and 4 healthy control subjects. Positive values of ΔQ in four healthy control subjects indicate a slightly shorter size distribution of the DNA fragments aligned on
C. 종양-유래 염색체 이상들의 검출을 위한 복수의 부위들C. Multiple sites for detection of tumor-derived chromosomal abnormalities
소정의 염색체 부위들의 결실 및 증폭을 포함하는 염색체 이상들은 종양 조직들에서 공통적으로 검출된다. 염색체 이상들의 특징적인 양상들은 서로 다른 유형들의 암들에서 관찰된다. 여기에서, 우리는 암 환자들의 혈장에서 이들 암-연관된 염색체 이상들을 검출하는 서로 다른 접근법들을 설명하도록 여러 예들을 사용하고 있다. 우리의 접근법은 암을 검색하고 질환 진행 및 치료에 대한 반응을 감시하는 데도 역시 유용하다. 한 명의 HCC 환자 및 두 명의 코인두 (NPC) 환자들로부터 얻은 시료들이 분석되었다. HCC 환자의 경우, 정맥혈 시료들이 종양의 수술절 절제 이전 및 이후에 수집되었다. 두 명의 NPC 환자의 경우 정맥형 시료들이 진단 시점에 수집되었다. 추가적으로, 한 명의 만성 B형 간염 보균자 및 혈장에 검출가능한 엡스타인-바 바이러스 DNA를 가진 한 명의 개체의 혈장 시료들이 분석되었다. 이들 두 명의 개체들은 암이라면 모두 가지지 않았다.Chromosomal abnormalities involving deletion and amplification of certain chromosomal regions are commonly detected in tumor tissues. Characteristic aspects of chromosomal abnormalities are observed in different types of cancer. Here, we use several examples to describe different approaches for detecting these cancer-associated chromosomal abnormalities in the plasma of cancer patients. Our approach is also useful for detecting cancer and monitoring disease progression and response to treatment. Samples from one HCC patient and two nasopharyngeal (NPC) patients were analyzed. For HCC patients, venous blood samples were collected before and after surgical node resection of the tumor. For two NPC patients, venous samples were collected at the time of diagnosis. Additionally, plasma samples from one chronic hepatitis B carrier and one subject with detectable Epstein-Barr virus DNA in their plasma were analyzed. None of these two individuals had cancer.
종양-유래 염색체 이상들의 검출은 마이크로어레이 분석으로 수행되었다. 상세하게, HCC 환자의 혈액 세포들 및 종양 시료로부터 추출된 DNA가 애피매트릭스사 SNP6.0 마이크로어레이 시스템을 사용하여 분석되었다. 혈액 세포들 및 종양 조직들의 유전형들이 애피매트릭스사 유전형분석 콘솔 v4.0을 사용하여 결정되었다. 증가들 및 결실들을 포함하는 염색체 이상들은 SNPs의 서로 다른 대립인자들의 강도들을 기초로 하는 Birdseed v2 알고리즘 및 마이크로어레이 상의 사본수 변화 (CNV) 탐침들을 사용하여 결정되었다.Detection of tumor-derived chromosomal aberrations was performed by microarray analysis. In detail, DNA extracted from blood cells and tumor samples of HCC patients was analyzed using the Affymetrix SNP6.0 microarray system. Genotypes of blood cells and tumor tissues were determined using Affymetrix Genotyping Console v4.0. Chromosomal aberrations, including increments and deletions, were determined using the Birdseed v2 algorithm based on the intensities of different alleles of SNPs and copy number change (CNV) probes on microarray.
계수-기초 분석Coefficient-Based Analysis
혈장에서 서열결정된 태그 계수 분석을 수행하기 위하여, 10 밀리리터의 정맥혈이 각 개체들로부터 수집되었다. 각 혈액 시료의 경우, 혈장이 시료의 원심분리 이후에 분리되었다. DNA는 QIAmp 혈액 미니키트 (퀴아젠사)를 사용하여 4 내지 6 mL의 혈장으로부터 추출되었다. 혈장 DNA 라이브러리는 이전에 기술된 바와 같이 제작되었고 (Lo YMD. Sci Transl Med 2010,2:61ra91), 다음으로 일루미나사 게놈 분석기 플랫폼을 사용하여 대규모 병렬 서열결정에 착수되었다. 각 분자는 50 bp씩 각 두 개 말단들에서, 합하여 분자 당 100 bp이 서열결정되었다. 각 서열의 두 개 말단들은 SOAP2 프로그램 (soap.genomics.org.cn/)을 사용하여 비-반복서열 차단된 인간 게놈 (UCSC genome.ucsc.edu로부터 다운로드되는 Hg18 NCBI.36)에 정렬되었다 (Li R et al. Bioinformatics 2009, 25:1966-7).To perform a sequenced tag count analysis in plasma, 10 milliliters of venous blood was collected from each subject. For each blood sample, plasma was isolated after centrifugation of the sample. DNA was extracted from 4-6 mL of plasma using a QIAmp blood mini-kit (Qiagen). Plasma DNA libraries were constructed as previously described (Lo YMD. Sci Transl Med 2010,2:61ra91) and then massively parallel sequencing was undertaken using the Illumina Genome Analyzer platform. Each molecule was sequenced at two ends by 50 bp, for a total of 100 bp per molecule. The two ends of each sequence were aligned to the non-repeat blocked human genome (Hg18 NCBI.36 downloaded from UCSC genome.ucsc.edu) using the SOAP2 program (soap.genomics.org.cn/) (Li R et al. Bioinformatics 2009, 25:1966-7).
다음으로 게놈은 복수의 1-메가염기 (1-Mb) 분절들로 분할되었고 각 1 Mb 분절에 정렬된 서열결정된 해독의 수가 결정되었다. 다음으로 각 bin의 태그 계수는 각 bin의 GC 함량에 따른 로칼 측정된 분산좌표 스무딩 (LOESS) 회귀분석을 기초로 하는 알고리즘으로 교정되었다 (Chen E et al. PLoS One 2011, 6:e21791). 본 교정은 서로 다른 게놈 분절들 간의 GC 함량에서 차이 때문에 일어나는 서열결정과 관련된 정량적 편차를 최소화하는 것을 목표로 한다. 상기 언급된 1 Mb 분절들로의 분할은 설명적 목적에 사용된다. 다른 분절 크기들, 예로 2 Mb, 10 Mb, 25 Mb, 또는 50 Mb 등도 역시 사용될 수 있다. 일반적으로 특정한 환자에서 특정한 종양 및 종양의 특정한 유형의 게놈적 특징들을 기초로 하여 분절 크기를 선택하는 것도 역시 가능하다. 또한, 서열결정 공정이 낮은 GC 편향을 가지는 것으로 관찰될 수 있는 경우라면, 예를 들어 헬리코스사 (Helicos) 시스템 (www.helicosbio.com) 또는 퍼시픽 바이오사이언스사 (Pacific Biosciences)의 단일 분자 실시간 시스템 (Single Molecular Real-Time system; www.pacificbiosciences.com)과 같은 단일 분자 서열결정 기법들의 경우 GC 교정 단계가 생략될 수 있다.The genome was then partitioned into multiple 1-megabase (1-Mb) segments and the number of sequenced reads aligned to each 1 Mb segment was determined. Next, the tag coefficients of each bin were corrected with an algorithm based on locally measured variance coordinate smoothing (LOESS) regression analysis according to the GC content of each bin (Chen E et al. PLoS One 2011, 6:e21791). This calibration aims to minimize sequencing-related quantitative deviations due to differences in GC content between different genome segments. The aforementioned division into 1 Mb segments is used for illustrative purposes. Other segment sizes may also be used, such as 2 Mb, 10 Mb, 25 Mb, or 50 Mb. It is also generally possible to select a segment size based on the genomic characteristics of a particular tumor and a particular type of tumor in a particular patient. Also, if the sequencing process can be observed to have low GC bias, for example the Helicos system (www.helicosbio.com) or the single molecule real-time system from Pacific Biosciences. For single molecule sequencing techniques such as (Single Molecular Real-Time system; www.pacificbiosciences.com), the GC calibration step can be omitted.
이전의 연구에서, 우리는 암이 없는 개체들로부터 57개 혈장 시료들을 서열분석하였다. 이들 혈장 서열분석 결과들은 각 1 Mb 분절을 위한 태그 계수들의 기준 범위를 결정하는 데 사용되었다. 각 1 Mb 분절을 위해, 57명 개인들의 태그 계수들의 평균값 및 표준 편차가 결정되었다. 다음으로, 연구 개체들의 결과들이 다음의 방정식을 사용하여 계산된 바와 이 z-점수로서 표현되었다: z-점수 = (사례의 서열결정된 태그의 수 - 평균) / S.D., 여기에서 "평균값 (mean)"은 기준 시료들을 위해 특정한 1 Mb에 정렬한 서열결정된 태그들의 평균 수이고; S.D.는 기준 시료들을 위해 특정한 1 Mb에 정렬한 서열결정된 태그들의 표준 편차이다.In a previous study, we sequenced 57 plasma samples from cancer-free individuals. These plasma sequencing results were used to determine a baseline range of tag counts for each 1 Mb segment. For each 1 Mb segment, the mean value and standard deviation of the tag coefficients of 57 individuals were determined. Next, ƒˆ was expressed as a z-score as the results of the study subjects were calculated using the following equation: z-score = (number of sequenced tags in cases - mean) / SD, where "mean value ( mean)" is the average number of sequenced tags aligned to a specific 1 Mb for reference samples; S.D. is the standard deviation of sequenced tags aligned to a specific 1 Mb for reference samples.
도 21 내지 도 24는 네 명의 연구 개체들의 서열결정된 태그 계수 분석의 결과들을 나타낸다. 1 Mab 분절들이 좌표들의 모서리에서 관찰된다. 인간 염색체 수들 및 핵형도들 (최외부 고리)은 시계 방향으로 pter-qter로 배치된다. 도 21에서, 내부 고리 2101은 종양을 분석하는 것으로부터 결정되는 바와 같은 이상 (결실 또는 증폭)의 부위들을 보여준다. 내부 고리 2101은 5개의 척도들과 함께 관찰된다. 척도는 -2 (최내부 선)으로부터 +2 (최외부 선)까지이다. 수치 -2는 해당하는 부위에 대한 염색체 사본들 둘 다의 소실을 나타낸다. 수치 -1은 두 개 염색체 사본들의 하나의 소실을 나타낸다. 수치 0은 염색체 증가 또는 소실이 없음을 나타낸다. 수치 +1은 한 개 염색체 사본의 증가를 나타내고, +2는 두 개 염색체 사본들의 증가를 나타낸다.21-24 show the results of sequenced tag count analysis of four study subjects. 1 Mab segments are observed at the corners of the coordinates. Human chromosome numbers and karyotypes (outermost ring) are arranged pter-qter in a clockwise direction. In FIG. 21 ,
중간 고리 2102는 혈장의 분석으로부터 나온 결과들을 보여준다. 관찰할 수 있는 바와 같이, 결과들은 내부 고리를 반영한다. 중간 고리 2102는 척도의 더 많은 선들이지만 진행은 동일하다. 외부 고린 2103는 치료 이후에 혈장을 분석하는 것으로부터 얻은 데이타 요점들을 보여주고 이들 데이타 요점들은 회색이다 (과다/과소 발현 없음 - 이상 없음을 입증함).
혈장에서 서열결정된 태그들의 과다-발현을 가진 염색체 부위들 (z-점수 > 3)은 녹색 점들 2110에 의해 나타낸다. 혈장에서 서열결정된 태그들의 과소-발현을 가진 부위들 (z-점수 < 3)은 적색 점들 2120에 의해 나타낸다. 혈장에서 검출되는 유의한 염색체 이상이 없는 부위들 (z-점수 -3 및 3 사이)는 회색 점들에 의해 나타낸다. 과다/과소 발현은 계수들의 전체 수에 의해 정상화된다. 서열결정 이전에 증폭으로, 정상화는 GC 편향을 고려할 수 있다.Chromosomal regions with over-expression of the sequenced tags in plasma (z-score > 3) are indicated by
도 21은 본 발명의 구현예들에 따라 혈장 DNA의 서열결정된 태그 계수로부터 얻은 데이타를 보여주는 HCC 환자의 키르코스 좌표들을 나타낸다. 내부로부터 외부까지의 궤적들: 마이크로어레이 분석에 의해 검출된 종양 조직의 염색체 이상들 (적색 및 녹색은 각각 결실 및 증폭을 나타낸다); 종양의 수술적 절제 이전 및 절제 1개월 이후에 획득된 혈장 시료에 대한 z-점수 분석. 종양 절제 이전에, 혈장에서 검출된 염색체 이상들은 마이크로어레이 분석에 의해 종양 조직에서 확인되는 것들과 잘 상관되어 있다. 종양 절제 이후에, 대다수의 암-연관된 염색체 이상들은 혈장에서 사라졌다. 이들 데이타는 질환 진행 및 치료요법 효능을 감시하는 이러한 접근법의 가치를 반영하고 있다. 21 depicts the Circus coordinates of a patient with HCC showing data obtained from sequenced tag counts of plasma DNA in accordance with embodiments of the present invention. Trajectories from inside to outside: chromosomal aberrations in tumor tissue detected by microarray analysis (red and green represent deletion and amplification, respectively); z-score analysis of plasma samples obtained before surgical resection of tumors and 1 month after resection. Prior to tumor resection, chromosomal aberrations detected in plasma correlate well with those identified in tumor tissue by microarray analysis. After tumor resection, the majority of cancer-associated chromosomal abnormalities disappeared in plasma. These data reflect the value of this approach for monitoring disease progression and therapeutic efficacy.
도 22는 본 발명의 구현예들에 따라 HCC가 없는 만성 HBV 보균자의 혈장 시료에 대한 서열결정된 태그 계수 분석을 나타낸다. HCC 환자와는 대조적으로 (도 21), 암-연관된 염색체 이상들이 본 환자의 혈장에서 검출되지 않았다. 이들 데이타는 암 검색, 진단 및 감시를 위한 접근법의 가치를 반영하고 있다.22 shows a sequenced tag count analysis of a plasma sample from a chronic HBV carrier without HCC according to embodiments of the present invention. In contrast to HCC patients ( FIG. 21 ), no cancer-associated chromosomal abnormalities were detected in the plasma of this patient. These data reflect the value of approaches for cancer detection, diagnosis and surveillance.
도 23은 본 발명의 구현예들에 따라 제 3기 코인두 암종 (NPC)을 가진 환자의 혈장 시료에 대한 서열결정된 태그 계수 분석을 나타낸다. 염색체 이상들이 치료 이전에 취해진 혈장 시료에서 검출되었다. 상세하게, 유의한 이상들이 염색체들 1번, 3번, 7번, 9번, 및 14번에서 확인되었다.23 shows a sequenced tag count analysis of a plasma sample from a patient with tertiary nasopharyngeal carcinoma (NPC) in accordance with embodiments of the present invention. Chromosomal abnormalities were detected in plasma samples taken prior to treatment. Specifically, significant abnormalities were identified on
도 24는 본 발명의 구현예들에 따라 제 4기 NPC를 가진 환자의 혈장 시료에 대한 서열결정된 태그 계수 분석을 나타낸다. 염색체 이상들이 치료 이전에 취해진 혈장 시료에서 검출되었다. 제 3기 질환을 가진 환자와 비교할 때 (도 23), 더 많은 염색체 이상들이 검출되었다. 서열결정된 태그 계수들도 역시 대조군들의 평균값으로부터 더욱 벗어났고, 예로 z-점수는 제로로부터 더욱 벗어나고 있다 (양성 또는 음성적으로 둘 중 하나). 대조군들과 대비하여 염색체 이상들의 증가된 수 및 서열결정된 태그 계수들의 편차의 더 높은 정도는 질환의 더욱 진행된 단계에서 게놈 변경들의 더 심각한 정도를 반영하고 있고, 따라서 암의 단계 결정, 예후판단 및 감시를 위한 이러한 접근법의 가치를 반영한다.24 shows a sequenced tag count analysis of a plasma sample from a patient with stage IV NPC in accordance with embodiments of the present invention. Chromosomal abnormalities were detected in plasma samples taken prior to treatment. When compared to patients with tertiary disease ( FIG. 23 ), more chromosomal aberrations were detected. The sequenced tag coefficients also deviate further from the mean of the controls, eg the z-score further deviates from zero (either positively or negatively). An increased number of chromosomal aberrations and a higher degree of deviation of sequenced tag coefficients compared to controls reflect a more severe degree of genomic alterations at a more advanced stage of the disease, thus staging, prognosing and monitoring cancer. reflects the value of this approach for
크기-기초 분석Size-Based Analysis
이전의 연구들에서는, 종양 조직들로부터 유래한 DNA의 크기 분포가 비종양 조직들부터 유래한 것들의 크기 분포보다 짧은 점을 보여주었다 (Diehl F et al. Proc Natl Acad Sci USA 2005, 102(45):16368-73). 이전의 섹션들에서, 우리는 혈장 DNA의 크기 분석에 의해 혈장 반수체형 불균형을 검출하는 접근법을 개괄하였다. 여기에서, 우리는 본 접근법을 좀 더 설명하도록 HCC 환자의 서열결정 데이타를 사용하였다.Previous studies have shown that the size distribution of DNA derived from tumor tissues is shorter than that of those derived from non-tumor tissues (Diehl F et al. Proc Natl Acad Sci USA 2005, 102 (45). ):16368-73). In previous sections, we outlined an approach for detecting plasma haplotype imbalances by size analysis of plasma DNA. Here, we used sequencing data from HCC patients to further elucidate our approach.
설명적 목적을 위해, 우리는 크기 분석을 위한 두 개 부위들을 확인하였다. 한 개 부위에서 (염색체 1번 (chr1); 좌표들: 159,935,347 내지 167,219,158), 두 개 상동 염색체들의 한 개의 복제가 종양 조직에서 검출되었다. 다른 부위에서 (염색체 10번 (chr10); 좌표들: 100,137,050 내지 101,907,356), 두 개 상동 염색체들의 한 개의 결실 (예로, LOH)가 종양 조직에서 검출되었다. 서열결정된 단편이 나온 반수체형을 결정하는 것과 추가하여, 서열결정된 단편의 크기도 역시 기준 게놈에 있는 서열결정된 단편의 최외부 뉴클레오타이드들의 좌표들을 사용하여 생물정보학적으로 결정되었다. 다음으로, 각 두 개의 반수체형들로부터 나온 단편들의 크기 분포들이 결정되었다.For illustrative purposes, we identified two sites for size analysis. At one site (chromosome 1 (chr1); coordinates: 159,935,347 to 167,219,158), one copy of two homologous chromosomes was detected in the tumor tissue. At another site (chromosome 10 (chr10); coordinates: 100,137,050 to 101,907,356), one deletion (eg, LOH) of two homologous chromosomes was detected in the tumor tissue. In addition to determining the haplotype from which the sequenced fragment was derived, the size of the sequenced fragment was also determined bioinformatically using the coordinates of the outermost nucleotides of the sequenced fragment in the reference genome. Next, the size distributions of fragments from each of the two haplotypes were determined.
Chr10의 LOH 부위의 경우, 하나의 반수체형이 종양 조직에서 결실되었다 (결실된 반수체형). 따라서, 본 결실된 반수체형에 정렬한 혈장 DNA 단편들 모두는 비-암 조직들로부터 유래하였다. 한편으로, 종양 조직들에서 결실되지 않았던 반수체형에 정렬한 단편들 (비-결실된 반수체형)은 종양 또는 비종양 조직들로부터 유래할 수 있다. 종양-유래 DNA의 크기 분포가 더 짧기 때문에, 우리는 결실된 반수체형으로부터 나온 것들과 비교할 때 비-결실된 반수체형으로부터 나온 단편들을 위한 더 짧은 크기 분포를 예상할 것이다. 두 개 크기 분포들에서의 차이는 DNA 단편들의 크기에 대비한 단편들의 누적 빈도들을 좌표 표시하여 결정될 수 있다. 더 짧은 크기 분포를 가진 DNA 집단은 더욱 풍부한 짧은 DNA를 가지고, 따라서 크기 스펙트럼의 짧은 말단에서 누적 빈도의 더 신속한 증가를 보일 것이다.For the LOH site of Chr10, one haplotype was deleted in the tumor tissue (deleted haplotype). Thus, all of the plasma DNA fragments aligned to this deleted haplotype were derived from non-cancerous tissues. Alternatively, haplotype-aligned fragments that were not deleted in tumor tissues (non-deleted haplotypes) may be derived from tumor or non-tumor tissues. Because the size distribution of tumor-derived DNA is shorter, we would expect a shorter size distribution for fragments from non-deleted haplotypes compared to those from deleted haplotypes. The difference in the two size distributions can be determined by plotting the cumulative frequencies of the fragments relative to the size of the DNA fragments. A population of DNA with a shorter size distribution will have more abundant short DNA and thus will show a more rapid increase in the cumulative frequency at the short end of the size spectrum.
도 25는 본 발명의 구현예들에 따라 종양 조직에서 LOH를 보이는 부위를 위해 크기에 대비한 혈장 DNA의 누적 빈도의 좌표를 나타낸다. X-축은 염기쌍들로의 단편의 크기이다. Y-축은 X-축 상의 수치 미만의 크기를 가지는 단편들의 백분율이다. 비-결실된 반수체형으로부터 나온 서열들은 결실된 반수체형으로부터 나온 서열들과 비교할 때 더 신속한 증가 및 170 bp 크기 미만의 더 높은 누적 빈도를 가진다. 이것은 비-결실된 반수체형으로부터 나온 짧은 DNA 단편들이 더욱 풍부한 점을 가리킨다. 이것은 결실된 반수체형으로부터 나온 짧은 종양-유래 DNA의 기여 때문에 상기 예측과 부합된다.25 shows the coordinates of the cumulative frequency of plasma DNA versus size for regions showing LOH in tumor tissue according to embodiments of the present invention. The X-axis is the size of the fragment in base pairs. The Y-axis is the percentage of fragments having a size less than the numerical value on the X-axis. Sequences from a non-deleted haplotype have a faster increase and a higher cumulative frequency of less than 170 bp in size when compared to sequences from a deleted haplotype. This indicates that short DNA fragments from non-deleted haplotypes are more abundant. This is consistent with this prediction because of the contribution of short tumor-derived DNA from the deleted haplotype.
한 가지 구현예에서, 크기 분포에서 차이는 DNA 분자들의 두 개 집단들의 누적 빈도들에서 차이에 의해 정량될 수 있다. 우리는 △Q를 두 개 집단들의 누적 빈도들에서 차이로서 정의한다. △Q = Q비결실 - Q결실, 여기에서 Q비결실은 비-결실된 반수체형으로부터 나온 서열결정된 DNA 단편들을 위한 누적 빈도를 나타내고; Q결실은 결실된 반수체형으로부터 나온 서열결정된 DNA 단편들을 위한 누적 빈도를 나타낸다.In one embodiment, the difference in size distribution can be quantified by the difference in the cumulative frequencies of two populations of DNA molecules. We define ΔQ as the difference in the cumulative frequencies of the two groups. △ Q = Qsecret room-Qdeletion, where Qsecret chamber is a non represents the cumulative frequency for the determined sequence DNA fragment derived from the deletion haplotypes; Qdeletion represents the cumulative frequency for sequenced DNA fragments from the deleted haplotype.
도 26은 LOH 부위를 위해 서열결정된 혈장 DNA의 크기에 대비한 △Q를 나타낸다. 본 발명의 구현예들에 따라 △Q는 130 bp 크기에서 0.2에 도달한다. 이것은 짧은 DNA를 정의하는 컷오프로서 130 bp를 사용하는 것이 상기 방정식들에서 사용에는 최적인 점을 가리킨다. 본 컷오프를 사용하여, 짧은 DNA 분자들이 결실된 반수체형으로부터 나온 집단과 비교할 때 비-결실된 반수체형으로부터 나온 집단에서 20% 더 풍부하다. 다음으로 본 백분율 차이 (또는 유사하게 유래된 수치)는 암이 없는 개인들로부터 유래한 역치 수치와 비교될 수 있다.26 shows ΔQ versus size of plasma DNA sequenced for LOH sites. According to embodiments of the present invention ΔQ reaches 0.2 at 130 bp size. This indicates that using 130 bp as the cutoff defining short DNA is optimal for use in the above equations. Using this cutoff, short DNA molecules are 20% more abundant in the population from the non-deleted haplotype compared to the population from the deleted haplotype. This percentage difference (or similarly derived value) can then be compared to a threshold value derived from individuals without cancer.
염색체 증폭을 가진 부위의 경우, 한 개의 반수체가 종양 조직에서 복제된다 (증폭된 반수체형). 본 증폭된 반수체형으로부터 나온 짧은 종양-유래 DNA 분자들의 여분의 양이 혈장 내로 방출될 것이기 때문에, 증폭된 반수체형으로부터 나온 단편들의 크기 분포는 비-증폭된 반수체형으로부터 나온 단편들의 크기 분포보다 더 짧을 것이다. LOH 시나리오와 유사하게, 크기 분포에서 차이는 DNA 단편들의 크기에 대비한 단편들의 누적 빈도들을 좌표 표시하여 결정될 수 있다. 더 짧은 크기 분포를 가진 DNA 집단은 더욱 풍부한 짧은 DNA를 가지고, 따라서 크기 스펙트럼의 짧은 말단에서 누적 빈도의 더 신속한 증가를 보일 것이다.For sites with chromosomal amplification, one haploid is replicated in the tumor tissue (amplified haplotype). Because an extra amount of short tumor-derived DNA molecules from this amplified haplotype will be released into the plasma, the size distribution of fragments from the amplified haplotype is larger than the size distribution of fragments from the non-amplified haplotype. will be short Similar to the LOH scenario, the difference in size distribution can be determined by plotting the cumulative frequencies of the fragments relative to the size of the DNA fragments. A population of DNA with a shorter size distribution will have more abundant short DNA and thus will show a more rapid increase in the cumulative frequency at the short end of the size spectrum.
도 27은 본 발명의 구현예들에 따라 종양 조직에서 염색체 복제를 가진 부위의 크기에 대비한 혈장 DNA의 누적 빈도의 좌표를 나타낸다. 증폭된 반수체형으로부터 나온 서열들은 비-증폭된 반수체형으로부터 나온 서열들과 비교할 때 더 신속한 증가 및 170 bp 크기 미만의 더 높은 누적 빈도를 가진다. 이것은 비-증폭된 반수체형으로부터 나온 짧은 DNA 단편들이 더욱 풍부하였던 점을 가리킨다. 이것은 증폭된 반수체형으로부터 나온 짧은, 많은 수의 종양-유래 DNA의 기여 때문에 하기 예측과 부합된다.27 shows the coordinates of the cumulative frequency of plasma DNA versus the size of a region with chromosomal replication in tumor tissue according to embodiments of the present invention. Sequences from amplified haplotypes have a faster increase and a higher cumulative frequency of less than 170 bp in size when compared to sequences from non-amplified haplotypes. This indicates that short DNA fragments from non-amplified haplotypes were more abundant. This is consistent with the following predictions because of the contribution of short, large numbers of tumor-derived DNA from the amplified haplotypes.
LOH 시나리오와 유사하게, 크기 분포에서 차이는 DNA 분자들의 두 개 집단들의 누적 빈도들에서 차이에 의해 정량될 수 있다. 우리는 △Q를 두 개 집단들의 누적 빈도들에서 차이로서 정의한다. △Q = Q증폭 - Q비증폭, 여기에서 Q증폭은 증폭된 반수체형으로부터 나온 서열결정된 DNA 단편들을 위한 누적 빈도를 나타내고; Q비증폭은 비-증폭된 반수체형으로부터 나온 서열결정된 DNA 단편들을 위한 누적 빈도를 나타낸다.Similar to the LOH scenario, the difference in size distribution can be quantified by the difference in the cumulative frequencies of two populations of DNA molecules. We define ΔQ as the difference in the cumulative frequencies of the two groups. ΔQ = Qamplification - Qunamplified , where Qamplification represents the cumulative frequency for sequenced DNA fragments from the amplified haplotype; Qnon-amplification is a non represents the cumulative frequency for the determined sequence DNA fragment derived from the amplified haplotypes.
도 28은 본 발명의 구현예들에 따라 증폭된 부위를 위해 서열결정된 혈장 DNA의 크기에 대비한 △Q를 나타낸다. 본 발명의 구현예들에 따라 △Q는 126 bp 크기에서 0.08에 도달한다. 이것은 짧은 DNA를 정의하는 컷오프로서 130 bp를 사용하는 것이 짧은 DNA 분자들이 비-증폭된 반수체형으로부터 나온 집단과 비교할 때 증폭된 반수체형으로부터 나온 집단에서 8% 더 풍부한 점을 가리킨다.28 shows ΔQ versus size of plasma DNA sequenced for sites amplified according to embodiments of the present invention. According to embodiments of the present invention ΔQ reaches 0.08 at a size of 126 bp. This indicates that using 130 bp as the cutoff defining short DNA is 8% more abundant in the population from the amplified haplotype compared to the population from the non-amplified haplotype in which the short DNA molecules are from the non-amplified haplotype.
D. 추가적인 기법들D. Additional Techniques
다른 구현예들에서, 서열-특이적 기법들이 사용될 수 있다. 예를 들어, 올리고뉴클레오타이드들이 특정한 부위의 단편들과 혼성화하도록 설계될 수 있다. 다음으로 올리고뉴클레오타이드들이 서열결정된 태그 계수들과 유사한 방식으로 계수될 수 있다. 본 방법은 특정한 이상들을 나타내는 암들에 사용될 수 있다.In other embodiments, sequence-specific techniques may be used. For example, oligonucleotides can be designed to hybridize with fragments at specific sites. Oligonucleotides can then be counted in a manner similar to sequenced tag counts. The method can be used for cancers presenting certain abnormalities.
Ⅷ. 컴퓨터 시스템Ⅷ. computer system
본 명세서에서 언급된 컴퓨터 시스템들이라면 모두는 적합한 수의 서브시스템들이라면 모두를 사용할 수 있다. 이러한 시스템들의 예들은 도 19에서 컴퓨터 장치 900으로 나타나 있다. 일정 구현예들에서, 컴퓨터 시스템은 서브시스템들이 컴퓨터 장치의 구성성분들일 수 있는 단일한 컴퓨터 장치를 포함한다. 다른 구현예들에서, 컴퓨터 시스템은 내부의 구성성분들을 가진, 각각이 서브시스템이 되는 복수의 컴퓨터 장치들을 포함할 수 있다.Any of the computer systems mentioned herein may use any suitable number of subsystems. Examples of such systems are shown in FIG. 19 as computer device 900 . In some implementations, the computer system includes a single computer device in which subsystems may be components of the computer device. In other implementations, a computer system may include a plurality of computer devices, each of which is a subsystem, having components therein.
도 29에 나타낸 부속시스템들은 시스템 버스 2975를 통하여 상호접속된다. 프린터 2974, 키보드 2978, 고정된 디스크 2979, 디스플레이 어댑터 2982와 연결된 모니터 2976와 같은 부수적인 서브시스템들 및 기타 다른 서브시스템들을 도시하고 있다. 주변 장치들 및 입력/출력 (I/O) 컨트롤러 2971와 연결된 I/O 장치들은 직렬 포트 2977와 같은 당해 기술분야에 알려진 수단들이라면 모두에 의해 컴퓨터 시스템에 연결될 수 있다. 예를 들어, 직렬 포트 2977 또는 외부 인터페이스 2981 (예로, 이더넷, Wi-Fi 등)는 컴퓨터 시스템 2900을 인터넷, 마우스 입력 장치, 또는 스캐너와 같은 광면적 네트워크로 연결하는 데 사용될 수 있다. 시스템 버스 2975를 통한 상호접속은 중앙 프로세서 2973을 각 서브시스템와 통신하고 시스템 메모리 2972 또는 고정된 디스크 2979로부터 명령들의 실행, 뿐만 아니라 서브시스템들 간의 정보의 교환을 통제하도록 허용한다. 본 시스템 메모리 2972 또는 고정된 디스크 2979는 컴퓨터 판독가능한 매체를 구현할 수 있다. 본 명세서에서 언급된 수치들이라면 모두는 하나의 구성성분으로부터 다른 구성성분까지 출력될 수 있고 사용자에게 출력될 수 있다.The subsystems shown in FIG. 29 are interconnected via a
컴퓨터 시스템은 예로 외부 인터페이스 2981에 의해 또는 내부 인터페이스에 의해 다함께 연결된 다수의 동일한 구성성분들 또는 서브시스템들을 포함할 수 있다. 일정 구현예들에서, 컴퓨터 시스템들, 서브시스템, 또는 장치들은 네트워크를 거쳐서 통신할 수 있다. 이러한 예들에서, 하나의 컴퓨터는 고객이라고 고려되고 또 다른 컴퓨터는 각각이 동일한 컴퓨터 시스템의 일부일 수 있는 서버로 고려될 수 있다. 고객 및 서버는 각각 복수의 시스템들, 서브시스템들, 또는 구성성분들을 포함할 수 있다.A computer system may include a number of identical components or subsystems connected together, for example, by an
본 발명의 구현예들이라면 모두가 모듈의 또는 통합된 방식으로 하드웨어 및/또는 컴퓨터 소프트웨어를 사용하는 컨트롤 로직의 형태로 시행될 수 있는 점으로 이해되어야 한다. 본 명세서에서 제공된 기재 및 가르침들을 기초로 하여, 당업자라면 하드웨어 또한 하드웨어 및 소프트웨어의 조합을 사용하여 본 발명의 구현예들을 시행하도록 다른 방식들 및/또는 방법들을 숙지하고 이해할 것이다.It should be understood that all implementations of the present invention may be implemented in the form of control logic using hardware and/or computer software in a modular or integrated manner. Based on the description and teachings provided herein, those skilled in the art will recognize and understand other ways and/or methods for practicing implementations of the present invention using hardware as well as a combination of hardware and software.
본 출원에서 기술된 소프트웨어 구성성분들 또는 기능들이라면 모두가, 예를 들어 자바, C++ 또는 Perl과 같은 적합한 컴퓨터 언어들이라면 모두를 사용하는 처리장치에 의해 실행되는 소프트웨어 코드로서 시행될 수 있다. 소프트웨어 코드는 저장 및/또는 전송을 위해 컴퓨터 판독가능한 매체에서 일련의 명령들 또는 명령어들로서 저장될 수 있고, 적합한 매체로는 무작위 접근 메모리 (RAM), 읽기 전용 메모리 (ROM), 하드 드라이브 또는 플로피 디스크와 같은 자기 매체, 또는 캠팩트 디스크 (CD) 또는 DVD (디지탈 다기능 디스크)와 같은 광학 매체, 플래쉬 메모리 등을 포함한다. 컴퓨터 판독가능한 매체는 이러한 저장 또는 전송 장치들의 조합이라면 모두일 수 있다.Any of the software components or functions described in this application may be implemented as software code executed by a processing unit using any suitable computer languages such as, for example, Java, C++ or Perl. The software code may be stored as a series of instructions or instructions on a computer readable medium for storage and/or transmission, suitable media including random access memory (RAM), read only memory (ROM), hard drive or floppy disk. magnetic media such as, or optical media such as compact discs (CDs) or DVDs (digital versatile discs), flash memories, and the like. The computer-readable medium may be any combination of such storage or transmission devices.
또한 이러한 프로그램은 인터넷을 포함하는 다양한 프로토콜들과 합치되는 유선 네트워크, 광학 네트워크 및/또는 무선 네크워크를 통한 전송에 적용되는 반송 신호들을 사용하여 코딩되고 전송될 수 있다. 이로써, 본 발명의 구현예에 따른 컴퓨터 판독가능한 매체는 이러한 프로그램들로 암호화된 데이타 신호를 사용하여 생성될 수 있다. 프로그램 코드로 암호화된 컴퓨터 판독가능한 매체는 호환 장치와 함께 패키지화될 수 있거나 다른 장치들로부터 (예로, 인터넷 다운로드를 통해) 별도로 제공될 수 있다. 이러한 컴퓨터 판독가능한 매체라면 모두가 단일 컴퓨터 프로그램 제품 (예로, 하드 드라이브, CD, 또는 전체 컴퓨터 시스템) 위에 또는 이의 내에 공존할 수 있고, 시스템 또는 네트워크 내의 다른 컴퓨터 프로그램 제품 위에 또는 내에 존재할 수 있다. 컴퓨터 시스템은 모니터, 프린터, 또는 본 명세서에서 언급된 결과들이라면 모두를 사용자에게 제공하는 다른 적합한 디스플레이를 포함할 수 있다.Such programs may also be coded and transmitted using carrier signals adapted for transmission over wired networks, optical networks, and/or wireless networks that are compatible with various protocols including the Internet. As such, a computer-readable medium according to an embodiment of the present invention can be created using data signals encrypted with these programs. The computer-readable medium encrypted with the program code may be packaged with a compatible device or provided separately from other devices (eg, via an Internet download). All of these computer readable media may coexist on or within a single computer program product (eg, a hard drive, CD, or an entire computer system), and may reside on or within other computer program products in a system or network. The computer system may include a monitor, printer, or other suitable display that provides the user with any of the results mentioned herein.
본 명세서에서 기술된 방법들이라면 모두는 단계들을 수행하도록 형성될 수 있는 프로세서를 포함하는 컴퓨터 시스템과 함께 전체적으로 또는 부분적으로 수행될 수 있다. 따라서, 구현예들은 잠재적으로 개별 단계들 또는 개별 그룹의 단계들을 수행하는 서로 다른 구성성분들과 함께, 본 명세서에서 기술된 방법들이라면 모두의 단계들을 수행하도록 형성된 컴퓨터 시스템들을 지향할 수 있다. 번호를 매긴 단계들로서 표현되더라도, 본 명세서에서 방법들의 단계들은 동시에 또는 서로 다른 순서로 수행될 수 있다. 추가적으로, 이들 단계들의 일부분들은 다른 방법들로부터 나온 다른 단계들의 일부분들과 함께 사용될 수 있다. 또한, 단계의 모두 또는 일부분들은 조건 선택적이다. 추가적으로, 방법들이라면 모두의 단계들이라면 모두는 모듈들, 회로들, 또는 이들 단계들을 수행하는 기타 수단들로 수행될 수 있다.Any of the methods described herein may be performed, in whole or in part, in conjunction with a computer system including a processor that may be configured to perform the steps. Accordingly, implementations may point to computer systems configured to perform all of the methods described herein, potentially with different components performing individual steps or individual groups of steps. Although expressed as numbered steps, the steps of the methods herein may be performed simultaneously or in a different order. Additionally, portions of these steps may be used with portions of other steps from other methods. Also, all or portions of the steps are conditionally optional. Additionally, all steps of any methods may be performed with modules, circuits, or other means for performing these steps.
특정한 구현예들의 자세한 내용은 본 발명의 구현예들의 정신 및 범위를 벗어나지 않는 적합한 방식이라면 모두로 조합될 수 있다. 그러나, 본 발명의 다른 구현예들은 각 개별적 관점, 또는 이들 개별적 관점들의 특정한 조합에 관한 특정한 구현예들을 지향할 수 있다.The details of specific embodiments may be combined in any suitable manner without departing from the spirit and scope of the embodiments of the present invention. However, other embodiments of the invention may be directed to specific embodiments directed to each individual aspect, or to a particular combination of individual aspects.
본 발명의 대표적인 구현예들의 상기 기재내용은 설명 및 기재의 목적들을 위해 기술되어 왔다. 이것은 본 발명을 기술된 정확한 형태로 나타내거나 제한하도록 의도되지 않고, 많은 변형들 및 변화들이 상기 가르침에 비추어 가능하다. 본 구현예들은 본 발명의 원리들 및 그의 실제적인 응용들을 가장 잘 설명하여 당업자들이라면 다양한 구현예들에서 또한 참작된 특정한 용도에 맞추어진 바와 같은 다양한 변형들과 함께 본 발명을 가장 잘 사용하도록 하기 위하여 선택되고 기술되었다.The foregoing description of exemplary embodiments of the invention has been presented for purposes of explanation and description. It is not intended to be exhaustive or to limit the invention to the precise form disclosed, and many modifications and variations are possible in light of the above teachings. These embodiments are intended to best explain the principles of the invention and its practical applications so that those skilled in the art may best use the invention in various embodiments and with various modifications as are suited to the particular use contemplated by those skilled in the art. selected and described.
"하나 (a)", "하나 (an)" 또는 "그 (the)"의 설명은 특정하게 반대로 표시되지 않은 경우라면 "하나 이상 (one or more)"를 의미하도록 의도된다. 상기 언급된 모든 특허들, 특허출원들, 공고들, 및 기재내용들은 본 명세서에서 그들의 전부가 모든 목적들을 위한 참고문헌으로 통합되어 있다.The description of “a”, “an” or “the” is intended to mean “one or more” unless specifically indicated to the contrary. All patents, patent applications, announcements, and disclosures mentioned above are incorporated herein by reference in their entirety for all purposes.
Claims (21)
Translated fromKorean하나 이상의 프로그램화된 프로세서를 포함하는 컴퓨터 시스템에 의하여, 유기체의 하나 이상의 제1 염색체 부위들을 확인하는 단계로서, 각각의 제1 염색체 부위는 제1 다수의 좌위들을 포함하고 암에서 사본 수 이상(copy number aberration)과 연관된 것인 단계;
하나 이상의 프로그램화된 프로세서를 포함하는 컴퓨터 시스템에 의하여, 유기체의 하나 이상의 제2 염색체 부위들을 확인하는 단계로서, 각각의 제2 염색체 부위는 제2 다수의 좌위들을 포함하고 암에서 사본 수 이상과 연관되지 않은 것인 단계;
하나 이상의 프로그램화된 프로세서를 포함하는 컴퓨터 시스템에 의하여, 하나 이상의 제1 염색체 부위들 및 하나 이상의 제2 염색체 부위들로부터 기원하는 핵산 분자들에 대해 생물학적 시료를 강화(enrich)하여, 강화된 생물학적 시료를 제공하는 단계;
유기체의 강화된 생물학적 시료 중 다수의 핵산 분자들 각각에 대하여:
하나 이상의 프로그램화된 프로세서를 포함하는 컴퓨터 시스템에 의하여, 유기체의 기준 게놈에서 핵산 분자의 위치를 확인하는 단계;
하나 이상의 제1 염색체 부위들의 각각의 제1 염색체 부위에 대하여:
하나 이상의 프로그램화된 프로세서를 포함하는 컴퓨터 시스템에 의하여, 확인된 위치들에 기초하여 핵산 분자들의 제1 그룹이 제1 염색체 부위로부터 나온 것으로서 확인하는 단계로서, 제1 그룹은 제1 염색체 부위의 제1 다수의 좌위들 각각에 위치한 하나 이상의 핵산 분자를 포함하는 것인 단계;
하나 이상의 프로그램화된 프로세서를 포함하는 컴퓨터 시스템에 의하여, 핵산 분자들의 제1 그룹의 제1 수치를 계산하는 단계로서, 제1 수치는 제1 그룹의 핵산 분자들의 수 또는 크기를 정의하는 것인 단계;
하나 이상의 프로그램화된 프로세서를 포함하는 컴퓨터 시스템에 의하여, 확인된 위치들에 기초하여 핵산 분자들의 제2 그룹이 하나 이상의 제2 염색체 부위들의 제2 염색체 부위로부터 나온 것으로서 확인하는 단계로서, 제2 그룹은 제2 염색체 부위의 제2 다수의 좌위들 각각에 위치한 하나 이상의 핵산 분자를 포함하는 것인 단계;
하나 이상의 프로그램화된 프로세서를 포함하는 컴퓨터 시스템에 의하여, 핵산 분자들의 제2 그룹의 제2 수치를 계산하는 단계로서, 제2 수치는 제2 그룹의 핵산 분자들의 수 또는 크기를 정의하는 것인 단계;
하나 이상의 프로그램화된 프로세서를 포함하는 컴퓨터 시스템에 의하여, 제1 수치 및 제2 수치를 사용하여 매개변수(parameter)를 결정하는 단계로서, 매개변수는 제1 수치와 제2 수치 간의 차이 또는 비율을 포함하는 것인 단계; 및
하나 이상의 프로그램화된 프로세서를 포함하는 컴퓨터 시스템에 의하여, 개별 수치를 기준 수치와 비교하여 제1 염색체 부위가 암과 연관된 임의의 세포에서 결실 또는 증폭을 나타내는지의 분류를 결정하는 단계
를 포함하는 분석 방법.A method of analyzing a biological sample from an organism, the biological sample comprising nucleic acid molecules originating from normal cells and from cells potentially associated with cancer, wherein at least some of the nucleic acid molecules are in a cell-free state in the biological sample; The method is
identifying, by a computer system comprising one or more programmed processors, one or more first chromosomal regions of an organism, each first chromosomal region comprising a first plurality of loci and in cancer number aberration);
identifying, by a computer system comprising one or more programmed processors, one or more second chromosomal regions of an organism, each second chromosomal region comprising a second plurality of loci and associated with a copy number abnormality in cancer step that has not been done;
Enriching the biological sample for nucleic acid molecules originating from one or more first chromosomal regions and one or more second chromosomal regions by means of a computer system comprising one or more programmed processors, the enriched biological sample providing;
For each of a plurality of nucleic acid molecules in an enriched biological sample of an organism:
identifying, by a computer system comprising one or more programmed processors, the location of a nucleic acid molecule in a reference genome of an organism;
For each first chromosomal region of the one or more first chromosomal regions:
identifying, by a computer system comprising one or more programmed processors, a first group of nucleic acid molecules as originating from a first chromosomal region based on the identified positions, wherein the first group is a second group of the first chromosomal region 1 comprising one or more nucleic acid molecules located at each of a plurality of loci;
calculating, by a computer system comprising one or more programmed processors, a first number of a first group of nucleic acid molecules, the first number defining a number or size of the first group of nucleic acid molecules; ;
identifying, by a computer system comprising one or more programmed processors, a second group of nucleic acid molecules based on the identified positions as originating from a second chromosomal region of one or more second chromosomal regions, the second group of comprises one or more nucleic acid molecules located at each of a second plurality of loci of a second chromosomal region;
calculating, by a computer system comprising one or more programmed processors, a second number of a second group of nucleic acid molecules, wherein the second number defines the number or size of the second group of nucleic acid molecules; ;
determining, by a computer system comprising one or more programmed processors, a parameter using a first numerical value and a second numerical value, the parameter representing a difference or ratio between the first numerical value and the second numerical value comprising the steps of; and
determining, by a computer system comprising one or more programmed processors, the classification of whether the first chromosomal region represents a deletion or amplification in any cell associated with cancer by comparing the individual values to a reference value;
An analysis method comprising a.
하나 이상의 프로그램화된 프로세서를 포함하는 컴퓨터 시스템에 의하여, 결실 또는 증폭을 나타내는 다수의 제1 염색체 부위들의 제1 수를 결정하는 단계; 및
하나 이상의 프로그램화된 프로세서를 포함하는 컴퓨터 시스템에 의하여, 상기 제1 수를 하나 이상의 역치 수치와 비교하여 유기체의 암의 수준을 결정하는 단계로서, 암의 수준은 암의 존재, 암의 단계, 종양의 크기, 염색체 부위의 결실 또는 증폭의 수, 및 암의 중증도의 다른 척도로부터 선택되는 것인 단계
를 추가로 포함하는 것인 분석 방법.The method of claim 1 , wherein the one or more first chromosomal regions comprises a plurality of first chromosomal regions, the method comprising:
determining, by a computer system comprising one or more programmed processors, a first number of first plurality of chromosomal regions indicative of deletion or amplification; and
determining, by a computer system comprising one or more programmed processors, the first number to one or more threshold values to determine a level of cancer in the organism, wherein the level of cancer is determined by the presence of the cancer, the stage of the cancer, the tumor is selected from the size of the chromosomal region, the number of deletions or amplifications of the chromosomal region, and other measures of the severity of the cancer.
An analysis method that further comprises a.
하나 이상의 프로그램화된 프로세서를 포함하는 컴퓨터 시스템에 의하여, 결실 또는 증폭을 나타내는 것으로 확인된 각각의 제1 염색체 부위에 대해 결실 또는 증폭의 양을 결정하는 단계; 및
하나 이상의 프로그램화된 프로세서를 포함하는 컴퓨터 시스템에 의하여, 상기 결실 또는 증폭의 양을 하나 이상의 역치 수치와 비교하여 유기체의 암의 수준을 결정하는 단계
를 추가로 포함하는 것인 분석 방법.13. The method of claim 12, wherein determining the level of cancer comprises:
determining, by a computer system comprising one or more programmed processors, the amount of deletion or amplification for each first chromosomal region identified as exhibiting deletion or amplification; and
determining, by a computer system comprising one or more programmed processors, the level of cancer in the organism by comparing the amount of deletion or amplification to one or more threshold values;
An analysis method that further comprises a.
하나 이상의 프로그램화된 프로세서를 포함하는 컴퓨터 시스템에 의하여, 제12항의 방법을 다수의 시간대에서 반복하는 단계; 및
하나 이상의 프로그램화된 프로세서를 포함하는 컴퓨터 시스템에 의하여, 상기 제1 수를 다수의 시간대에서 사용하여 유기체에서 암의 수준을 진단하거나, 단계를 결정하거나, 예후를 판단하거나, 또는 진행을 감시하는 단계
를 추가로 포함하는 것인 분석 방법.13. The method of claim 12,
repeating, by a computer system comprising one or more programmed processors, the method of claim 12 at a plurality of time points; and
diagnosing, staging, determining a prognosis, or monitoring progression of a cancer in an organism using the first number at a plurality of time points, by a computer system comprising one or more programmed processors;
An analysis method that further comprises a.
제1 수를 다수의 시간대에서 사용하여 유기체에서 암의 수준을 진단하거나, 단계를 결정하거나, 예후를 판단하거나, 또는 진행을 감시하는 단계는
전악성 상태의 존재 또는 진행을 결정하는 것을 포함하는 것인 분석 방법.15. The method of claim 14,
diagnosing, staging, determining a prognosis, or monitoring progression of a cancer in an organism using the first number at multiple time points comprises:
A method of analysis comprising determining the presence or progression of a pre-malignant condition.
하나 이상의 프로그램화된 프로세서를 포함하는 컴퓨터 시스템에 의하여, 다수의 제1 염색체 부위들 중 어느 것이 암과 연관된 사본 수 이상을 나타내는지 확인하는 단계; 및
하나 이상의 프로그램화된 프로세서를 포함하는 컴퓨터 시스템에 의하여, 다수의 제1 염색체 부위들 중 어느 것이 암과 연관된 사본 수 이상을 나타내는지에 기초하여 유기체가 암을 갖는지를 결정하는 단계
를 추가로 포함하는 것인 분석 방법.The method of claim 1 , wherein the one or more first chromosomal regions comprises a plurality of first chromosomal regions, the method comprising:
identifying, by a computer system comprising one or more programmed processors, which of the plurality of first chromosomal regions exhibits a copy number abnormality associated with cancer; and
determining, by a computer system comprising one or more programmed processors, that the organism has cancer based on which of the plurality of first chromosomal regions exhibits a copy number abnormality associated with the cancer;
An analysis method that further comprises a.
Priority Applications (1)
| Application Number | Priority Date | Filing Date | Title |
|---|---|---|---|
| KR1020217038741AKR102489749B1 (en) | 2010-11-30 | 2011-11-30 | Detection of genetic or molecular aberrations associated with cancer |
Applications Claiming Priority (6)
| Application Number | Priority Date | Filing Date | Title |
|---|---|---|---|
| US41839110P | 2010-11-30 | 2010-11-30 | |
| US61/418,391 | 2010-11-30 | ||
| US201161529877P | 2011-08-31 | 2011-08-31 | |
| US61/529,877 | 2011-08-31 | ||
| PCT/AU2011/001562WO2012071621A1 (en) | 2010-11-30 | 2011-11-30 | Detection of genetic or molecular aberrations associated with cancer |
| KR1020197032092AKR102185244B1 (en) | 2010-11-30 | 2011-11-30 | Detection of genetic or molecular aberrations associated with cancer |
Related Parent Applications (1)
| Application Number | Title | Priority Date | Filing Date |
|---|---|---|---|
| KR1020197032092ADivisionKR102185244B1 (en) | 2010-11-30 | 2011-11-30 | Detection of genetic or molecular aberrations associated with cancer |
Related Child Applications (1)
| Application Number | Title | Priority Date | Filing Date |
|---|---|---|---|
| KR1020217038741ADivisionKR102489749B1 (en) | 2010-11-30 | 2011-11-30 | Detection of genetic or molecular aberrations associated with cancer |
Publications (2)
| Publication Number | Publication Date |
|---|---|
| KR20200133825A KR20200133825A (en) | 2020-11-30 |
| KR102333664B1true KR102333664B1 (en) | 2021-12-01 |
Family
ID=46171096
Family Applications (6)
| Application Number | Title | Priority Date | Filing Date |
|---|---|---|---|
| KR1020137016780AActiveKR101891847B1 (en) | 2010-11-30 | 2011-11-30 | Detection of genetic or molecular aberrations associated with cancer |
| KR1020207033400AActiveKR102333664B1 (en) | 2010-11-30 | 2011-11-30 | Detection of genetic or molecular aberrations associated with cancer |
| KR1020237001326AActiveKR102723107B1 (en) | 2010-11-30 | 2011-11-30 | Detection of genetic or molecular aberrations associated with cancer |
| KR1020197032092AActiveKR102185244B1 (en) | 2010-11-30 | 2011-11-30 | Detection of genetic or molecular aberrations associated with cancer |
| KR1020187023415AActiveKR102040307B1 (en) | 2010-11-30 | 2011-11-30 | Detection of genetic or molecular aberrations associated with cancer |
| KR1020217038741AActiveKR102489749B1 (en) | 2010-11-30 | 2011-11-30 | Detection of genetic or molecular aberrations associated with cancer |
Family Applications Before (1)
| Application Number | Title | Priority Date | Filing Date |
|---|---|---|---|
| KR1020137016780AActiveKR101891847B1 (en) | 2010-11-30 | 2011-11-30 | Detection of genetic or molecular aberrations associated with cancer |
Family Applications After (4)
| Application Number | Title | Priority Date | Filing Date |
|---|---|---|---|
| KR1020237001326AActiveKR102723107B1 (en) | 2010-11-30 | 2011-11-30 | Detection of genetic or molecular aberrations associated with cancer |
| KR1020197032092AActiveKR102185244B1 (en) | 2010-11-30 | 2011-11-30 | Detection of genetic or molecular aberrations associated with cancer |
| KR1020187023415AActiveKR102040307B1 (en) | 2010-11-30 | 2011-11-30 | Detection of genetic or molecular aberrations associated with cancer |
| KR1020217038741AActiveKR102489749B1 (en) | 2010-11-30 | 2011-11-30 | Detection of genetic or molecular aberrations associated with cancer |
Country Status (18)
| Country | Link |
|---|---|
| US (4) | US8741811B2 (en) |
| EP (4) | EP4269623A3 (en) |
| JP (5) | JP6196157B2 (en) |
| KR (6) | KR101891847B1 (en) |
| CN (4) | CN108899091B (en) |
| AU (1) | AU2011335891B2 (en) |
| BR (1) | BR112013013421A2 (en) |
| CA (1) | CA2817370C (en) |
| DK (2) | DK2646579T3 (en) |
| EA (1) | EA038374B1 (en) |
| IL (3) | IL226272A (en) |
| MX (3) | MX349568B (en) |
| MY (1) | MY169852A (en) |
| NZ (1) | NZ611599A (en) |
| SG (3) | SG190344A1 (en) |
| TW (5) | TWI532843B (en) |
| WO (1) | WO2012071621A1 (en) |
| ZA (1) | ZA201304625B (en) |
Families Citing this family (150)
| Publication number | Priority date | Publication date | Assignee | Title |
|---|---|---|---|---|
| US9424392B2 (en) | 2005-11-26 | 2016-08-23 | Natera, Inc. | System and method for cleaning noisy genetic data from target individuals using genetic data from genetically related individuals |
| US11111544B2 (en) | 2005-07-29 | 2021-09-07 | Natera, Inc. | System and method for cleaning noisy genetic data and determining chromosome copy number |
| US10083273B2 (en) | 2005-07-29 | 2018-09-25 | Natera, Inc. | System and method for cleaning noisy genetic data and determining chromosome copy number |
| US10081839B2 (en) | 2005-07-29 | 2018-09-25 | Natera, Inc | System and method for cleaning noisy genetic data and determining chromosome copy number |
| US11111543B2 (en) | 2005-07-29 | 2021-09-07 | Natera, Inc. | System and method for cleaning noisy genetic data and determining chromosome copy number |
| SI2514842T1 (en) | 2007-07-23 | 2016-06-30 | The Chinese University Of Hong Kong Office of Research and Knowledge Transfer Services | Diagnosing fetal chromosomal aneuploidy using genomic sequencing |
| ES2620431T3 (en) | 2008-08-04 | 2017-06-28 | Natera, Inc. | Methods for the determination of alleles and ploidy |
| US20120185176A1 (en) | 2009-09-30 | 2012-07-19 | Natera, Inc. | Methods for Non-Invasive Prenatal Ploidy Calling |
| US9260745B2 (en) | 2010-01-19 | 2016-02-16 | Verinata Health, Inc. | Detecting and classifying copy number variation |
| WO2011091063A1 (en) | 2010-01-19 | 2011-07-28 | Verinata Health, Inc. | Partition defined detection methods |
| US20120100548A1 (en) | 2010-10-26 | 2012-04-26 | Verinata Health, Inc. | Method for determining copy number variations |
| US20120010085A1 (en) | 2010-01-19 | 2012-01-12 | Rava Richard P | Methods for determining fraction of fetal nucleic acids in maternal samples |
| PL3492601T3 (en) | 2010-01-19 | 2022-05-23 | Verinata Health, Inc. | Novel protocol for preparing sequencing libraries |
| US10388403B2 (en) | 2010-01-19 | 2019-08-20 | Verinata Health, Inc. | Analyzing copy number variation in the detection of cancer |
| US9323888B2 (en) | 2010-01-19 | 2016-04-26 | Verinata Health, Inc. | Detecting and classifying copy number variation |
| CA2786564A1 (en) | 2010-01-19 | 2011-07-28 | Verinata Health, Inc. | Identification of polymorphic sequences in mixtures of genomic dna by whole genome sequencing |
| US11339429B2 (en) | 2010-05-18 | 2022-05-24 | Natera, Inc. | Methods for non-invasive prenatal ploidy calling |
| US9677118B2 (en) | 2014-04-21 | 2017-06-13 | Natera, Inc. | Methods for simultaneous amplification of target loci |
| US11322224B2 (en) | 2010-05-18 | 2022-05-03 | Natera, Inc. | Methods for non-invasive prenatal ploidy calling |
| US12152275B2 (en) | 2010-05-18 | 2024-11-26 | Natera, Inc. | Methods for non-invasive prenatal ploidy calling |
| US11326208B2 (en) | 2010-05-18 | 2022-05-10 | Natera, Inc. | Methods for nested PCR amplification of cell-free DNA |
| US10017812B2 (en) | 2010-05-18 | 2018-07-10 | Natera, Inc. | Methods for non-invasive prenatal ploidy calling |
| US20190010543A1 (en) | 2010-05-18 | 2019-01-10 | Natera, Inc. | Methods for simultaneous amplification of target loci |
| US11332785B2 (en) | 2010-05-18 | 2022-05-17 | Natera, Inc. | Methods for non-invasive prenatal ploidy calling |
| US12221653B2 (en) | 2010-05-18 | 2025-02-11 | Natera, Inc. | Methods for simultaneous amplification of target loci |
| US10316362B2 (en) | 2010-05-18 | 2019-06-11 | Natera, Inc. | Methods for simultaneous amplification of target loci |
| EP2854057B1 (en) | 2010-05-18 | 2018-03-07 | Natera, Inc. | Methods for non-invasive pre-natal ploidy calling |
| US11408031B2 (en) | 2010-05-18 | 2022-08-09 | Natera, Inc. | Methods for non-invasive prenatal paternity testing |
| US11332793B2 (en) | 2010-05-18 | 2022-05-17 | Natera, Inc. | Methods for simultaneous amplification of target loci |
| US11939634B2 (en) | 2010-05-18 | 2024-03-26 | Natera, Inc. | Methods for simultaneous amplification of target loci |
| KR101891847B1 (en) | 2010-11-30 | 2018-08-24 | 더 차이니즈 유니버시티 오브 홍콩 | Detection of genetic or molecular aberrations associated with cancer |
| AU2011348100B2 (en) | 2010-12-22 | 2016-08-25 | Natera, Inc. | Methods for non-invasive prenatal paternity testing |
| WO2012109500A2 (en) | 2011-02-09 | 2012-08-16 | Bio-Rad Laboratories, Inc. | Analysis of nucleic acids |
| ES2692333T3 (en) | 2011-04-12 | 2018-12-03 | Verinata Health, Inc | Resolution of genome fractions using polymorphism count |
| CN110016499B (en) | 2011-04-15 | 2023-11-14 | 约翰·霍普金斯大学 | Safe sequencing system |
| US9411937B2 (en) | 2011-04-15 | 2016-08-09 | Verinata Health, Inc. | Detecting and classifying copy number variation |
| WO2013131021A1 (en) | 2012-03-02 | 2013-09-06 | Sequenom Inc. | Methods and processes for non-invasive assessment of genetic variations |
| US9892230B2 (en) | 2012-03-08 | 2018-02-13 | The Chinese University Of Hong Kong | Size-based analysis of fetal or tumor DNA fraction in plasma |
| WO2013138510A1 (en) | 2012-03-13 | 2013-09-19 | Patel Abhijit Ajit | Measurement of nucleic acid variants using highly-multiplexed error-suppressed deep sequencing |
| US11261494B2 (en)* | 2012-06-21 | 2022-03-01 | The Chinese University Of Hong Kong | Method of measuring a fractional concentration of tumor DNA |
| EP2875149B1 (en)* | 2012-07-20 | 2019-12-04 | Verinata Health, Inc. | Detecting and classifying copy number variation in a cancer genome |
| US20140100126A1 (en) | 2012-08-17 | 2014-04-10 | Natera, Inc. | Method for Non-Invasive Prenatal Testing Using Parental Mosaicism Data |
| ES2906714T3 (en) | 2012-09-04 | 2022-04-20 | Guardant Health Inc | Methods to detect rare mutations and copy number variation |
| US10876152B2 (en) | 2012-09-04 | 2020-12-29 | Guardant Health, Inc. | Systems and methods to detect rare mutations and copy number variation |
| US11913065B2 (en) | 2012-09-04 | 2024-02-27 | Guardent Health, Inc. | Systems and methods to detect rare mutations and copy number variation |
| US20160040229A1 (en) | 2013-08-16 | 2016-02-11 | Guardant Health, Inc. | Systems and methods to detect rare mutations and copy number variation |
| US9732390B2 (en) | 2012-09-20 | 2017-08-15 | The Chinese University Of Hong Kong | Non-invasive determination of methylome of fetus or tumor from plasma |
| LT3354747T (en) | 2012-09-20 | 2021-04-12 | The Chinese University Of Hong Kong | NON - INVASIVE DETERMINATION OF TUMOR METHYLOMA IN PLASMA |
| US10706957B2 (en) | 2012-09-20 | 2020-07-07 | The Chinese University Of Hong Kong | Non-invasive determination of methylome of tumor from plasma |
| US10482994B2 (en) | 2012-10-04 | 2019-11-19 | Sequenom, Inc. | Methods and processes for non-invasive assessment of genetic variations |
| CA2889937C (en) | 2012-10-29 | 2020-12-29 | The Johns Hopkins University | Papanicolaou test for ovarian and endometrial cancers |
| WO2014093330A1 (en) | 2012-12-10 | 2014-06-19 | Clearfork Bioscience, Inc. | Methods for targeted genomic analysis |
| US10643738B2 (en)* | 2013-01-10 | 2020-05-05 | The Chinese University Of Hong Kong | Noninvasive prenatal molecular karyotyping from maternal plasma |
| EP3597774A1 (en) | 2013-03-13 | 2020-01-22 | Sequenom, Inc. | Primers for dna methylation analysis |
| WO2014151117A1 (en)* | 2013-03-15 | 2014-09-25 | The Board Of Trustees Of The Leland Stanford Junior University | Identification and use of circulating nucleic acid tumor markers |
| US10699800B2 (en) | 2013-05-24 | 2020-06-30 | Sequenom, Inc. | Methods and processes for non-invasive assessment of genetic variations |
| EP3024948B1 (en) | 2013-07-25 | 2020-01-15 | Bio-rad Laboratories, Inc. | Genetic assays for detecting viral recombination rate |
| US9499870B2 (en) | 2013-09-27 | 2016-11-22 | Natera, Inc. | Cell free DNA diagnostic testing standards |
| US10262755B2 (en) | 2014-04-21 | 2019-04-16 | Natera, Inc. | Detecting cancer mutations and aneuploidy in chromosomal segments |
| US10577655B2 (en) | 2013-09-27 | 2020-03-03 | Natera, Inc. | Cell free DNA diagnostic testing standards |
| US10851414B2 (en)* | 2013-10-18 | 2020-12-01 | Good Start Genetics, Inc. | Methods for determining carrier status |
| KR102373647B1 (en)* | 2013-10-21 | 2022-03-11 | 베리나타 헬스, 인코포레이티드 | Method for improving the sensitivity of detection in determining copy number variations |
| ES2784450T3 (en) | 2013-12-28 | 2020-09-25 | Guardant Health Inc | Methods and systems to detect genetic variants |
| WO2015138774A1 (en) | 2014-03-13 | 2015-09-17 | Sequenom, Inc. | Methods and processes for non-invasive assessment of genetic variations |
| JP6659575B2 (en) | 2014-04-21 | 2020-03-04 | ナテラ, インコーポレイテッド | Mutation detection and chromosomal segment ploidy |
| WO2015164432A1 (en)* | 2014-04-21 | 2015-10-29 | Natera, Inc. | Detecting mutations and ploidy in chromosomal segments |
| IL249095B2 (en) | 2014-05-30 | 2023-10-01 | Verinata Health Inc | Detection of subchromosomal aneuploidy in the fetus and variations in the number of copies |
| US20180173845A1 (en) | 2014-06-05 | 2018-06-21 | Natera, Inc. | Systems and Methods for Detection of Aneuploidy |
| PT3543356T (en) | 2014-07-18 | 2021-10-04 | Univ Hong Kong Chinese | Methylation pattern analysis of tissues in dna mixture |
| US20170211143A1 (en) | 2014-07-25 | 2017-07-27 | University Of Washington | Methods of determining tissues and/or cell types giving rise to cell-free dna, and methods of identifying a disease or disorder using same |
| US11783911B2 (en) | 2014-07-30 | 2023-10-10 | Sequenom, Inc | Methods and processes for non-invasive assessment of genetic variations |
| US20160048608A1 (en) | 2014-08-15 | 2016-02-18 | Good Start Genetics, Inc. | Systems and methods for genetic analysis |
| US20160053301A1 (en) | 2014-08-22 | 2016-02-25 | Clearfork Bioscience, Inc. | Methods for quantitative genetic analysis of cell free dna |
| EP3502273B1 (en) | 2014-12-12 | 2020-07-08 | Verinata Health, Inc. | Cell-free dna fragment |
| US11242559B2 (en) | 2015-01-13 | 2022-02-08 | The Chinese University Of Hong Kong | Method of nuclear DNA and mitochondrial DNA analysis |
| US10364467B2 (en)* | 2015-01-13 | 2019-07-30 | The Chinese University Of Hong Kong | Using size and number aberrations in plasma DNA for detecting cancer |
| US10319463B2 (en)* | 2015-01-23 | 2019-06-11 | The Chinese University Of Hong Kong | Combined size- and count-based analysis of maternal plasma for detection of fetal subchromosomal aberrations |
| CN107771221B (en) | 2015-02-10 | 2021-11-02 | 香港中文大学 | Mutation Detection for Cancer Screening and Fetal Analysis |
| US10424396B2 (en)* | 2015-03-27 | 2019-09-24 | Sentieon Inc. | Computation pipeline of location-dependent variant calls |
| SG11201708301TA (en)* | 2015-04-10 | 2017-11-29 | Social Welfare Organization Saiseikai Imp Gift Foundation Inc | Method for discriminating symptom of hepatic disease |
| DK3294906T3 (en) | 2015-05-11 | 2024-08-05 | Natera Inc | Methods for determining ploidy |
| HUE059407T2 (en) | 2015-07-20 | 2022-11-28 | Univ Hong Kong Chinese | Methylation pattern analysis of haplotypes in tissues in dna mixture |
| EP3325664B1 (en) | 2015-07-23 | 2021-12-29 | The Chinese University Of Hong Kong | Analysis of fragmentation patterns of cell-free dna |
| JP6675164B2 (en)* | 2015-07-28 | 2020-04-01 | 株式会社理研ジェネシス | Mutation judgment method, mutation judgment program and recording medium |
| WO2017027653A1 (en) | 2015-08-11 | 2017-02-16 | The Johns Hopkins University | Assaying ovarian cyst fluid |
| WO2017025059A1 (en) | 2015-08-12 | 2017-02-16 | The Chinese University Of Hong Kong | Single-molecule sequencing of plasma dna |
| EP3889257A1 (en) | 2015-11-11 | 2021-10-06 | Resolution Bioscience, Inc. | High efficiency construction of dna libraries |
| CA3008651A1 (en) | 2015-12-17 | 2017-06-22 | Guardant Health, Inc. | Methods to determine tumor gene copy number by analysis of cell-free dna |
| US10095831B2 (en) | 2016-02-03 | 2018-10-09 | Verinata Health, Inc. | Using cell-free DNA fragment size to determine copy number variations |
| JP2019518223A (en) | 2016-03-24 | 2019-06-27 | バイオロジカル ダイナミクス,インク. | Disposable fluid cartridges and components |
| EP3443119B8 (en) | 2016-04-15 | 2022-04-06 | Natera, Inc. | Methods for lung cancer detection |
| KR20230164209A (en) | 2016-05-30 | 2023-12-01 | 더 차이니즈 유니버시티 오브 홍콩 | Detecting hematological disorders using cell-free dna in blood |
| CA3030890A1 (en) | 2016-07-27 | 2018-02-01 | Sequenom, Inc. | Genetic copy number alteration classifications |
| MX2019002093A (en) | 2016-08-25 | 2019-06-20 | Resolution Bioscience Inc | Methods for the detection of genomic copy changes in dna samples. |
| EP3518974A4 (en)* | 2016-09-29 | 2020-05-27 | Myriad Women's Health, Inc. | Noninvasive prenatal screening using dynamic iterative depth optimization |
| WO2018067517A1 (en) | 2016-10-04 | 2018-04-12 | Natera, Inc. | Methods for characterizing copy number variation using proximity-litigation sequencing |
| TWI874916B (en) | 2016-10-24 | 2025-03-01 | 美商格瑞爾有限責任公司 | Methods and systems for tumor detection |
| JP2020503003A (en) | 2016-11-30 | 2020-01-30 | ザ チャイニーズ ユニバーシティ オブ ホンコン | Analysis of cell-free DNA in urine and other samples |
| US10011870B2 (en) | 2016-12-07 | 2018-07-03 | Natera, Inc. | Compositions and methods for identifying nucleic acid molecules |
| IL267913B2 (en) | 2017-01-24 | 2025-08-01 | Sequenom Inc | Methods and processes for assessment of genetic variations |
| DK3574108T3 (en) | 2017-01-25 | 2024-09-16 | Univ Hong Kong Chinese | DIAGNOSTIC USE USING NUCLEIC ACID FRAGMENTS |
| AU2018225348A1 (en) | 2017-02-21 | 2019-07-18 | Natera, Inc. | Compositions, methods, and kits for isolating nucleic acids |
| US12421550B2 (en) | 2017-03-17 | 2025-09-23 | Sequenom, Inc. | Methods and processes for assessment of genetic mosaicism |
| US11342047B2 (en) | 2017-04-21 | 2022-05-24 | Illumina, Inc. | Using cell-free DNA fragment size to detect tumor-associated variant |
| EP3622084A4 (en) | 2017-05-08 | 2021-02-17 | Biological Dynamics, Inc. | METHODS AND SYSTEMS FOR PROCESSING ANALYTICAL INFORMATION |
| KR102145417B1 (en)* | 2017-05-24 | 2020-08-19 | 지니너스 주식회사 | Method for generating distribution of background allele frequency for sequencing data obtained from cell-free nucleic acid and method for detecting mutation from cell-free nucleic acid using the same |
| JP2020523009A (en)* | 2017-06-08 | 2020-08-06 | ナントミクス,エルエルシー | An integrated panoramic approach to pharmacogenomic screening |
| ES2959360T3 (en) | 2017-07-26 | 2024-02-23 | Univ Hong Kong Chinese | Improving cancer screening using acellular viral nucleic acids |
| WO2019067092A1 (en) | 2017-08-07 | 2019-04-04 | The Johns Hopkins University | Methods and materials for assessing and treating cancer |
| CN110021355B (en)* | 2017-09-22 | 2021-05-04 | 深圳华大生命科学研究院 | Method and device for haplotype typing and variant detection of diploid genome sequencing fragments |
| US11168356B2 (en) | 2017-11-02 | 2021-11-09 | The Chinese University Of Hong Kong | Using nucleic acid size range for noninvasive cancer detection |
| TWI669618B (en)* | 2017-11-24 | 2019-08-21 | 南韓商韓國美迪基因科技有限公司 | A method and an apparatus forpredicting disease, and a method for calculating the weighted score of risk of occurrence of eachdisease |
| CA3085933A1 (en) | 2017-12-14 | 2019-06-20 | Tai Diagnostics, Inc. | Assessing graft suitability for transplantation |
| JP2021509266A (en)* | 2017-12-19 | 2021-03-25 | バイオロジカル ダイナミクス,インク. | Methods and Devices for Detecting and Quantifying Cell-Free DNA Fragments |
| EP3727693A4 (en) | 2017-12-19 | 2021-08-25 | Biological Dynamics, Inc. | METHOD AND DEVICE FOR DETECTION OF MULTIPLE ANALYTES FROM A BIOLOGICAL SAMPLE |
| US12398389B2 (en) | 2018-02-15 | 2025-08-26 | Natera, Inc. | Methods for isolating nucleic acids with size selection |
| TW202434742A (en) | 2018-03-13 | 2024-09-01 | 美商格瑞爾有限責任公司 | Anomalous fragment detection and classification |
| CN119955906A (en) | 2018-03-15 | 2025-05-09 | 格瑞尔公司 | Tissue-specific methylation markers |
| US12154661B2 (en)* | 2018-03-22 | 2024-11-26 | The Regents Of The University Of Michigan | Method and apparatus for analysis of chromatin interaction data |
| WO2019195196A1 (en) | 2018-04-02 | 2019-10-10 | Biological Dynamics, Inc. | Dielectric materials |
| CN112204666A (en) | 2018-04-13 | 2021-01-08 | 格里尔公司 | Multiplex Assay Prediction Models for Cancer Detection |
| WO2019200228A1 (en) | 2018-04-14 | 2019-10-17 | Natera, Inc. | Methods for cancer detection and monitoring by means of personalized detection of circulating tumor dna |
| WO2019210873A1 (en) | 2018-05-03 | 2019-11-07 | The Chinese University Of Hong Kong | Size-tagged preferred ends and orientation-aware analysis for measuring properties of cell-free mixtures |
| TW202410055A (en) | 2018-06-01 | 2024-03-01 | 美商格瑞爾有限責任公司 | Convolutional neural network systems and methods for data classification |
| TW202013385A (en) | 2018-06-07 | 2020-04-01 | 美商河谷控股Ip有限責任公司 | Difference-based genomic identity scores |
| WO2019237230A1 (en)* | 2018-06-11 | 2019-12-19 | 深圳华大生命科学研究院 | Method and system for determining type of sample to be tested |
| US12234509B2 (en) | 2018-07-03 | 2025-02-25 | Natera, Inc. | Methods for detection of donor-derived cell-free DNA |
| KR20210073526A (en)* | 2018-10-08 | 2021-06-18 | 프리놈 홀딩스, 인크. | Transcription factor profiling |
| US11581062B2 (en) | 2018-12-10 | 2023-02-14 | Grail, Llc | Systems and methods for classifying patients with respect to multiple cancer classes |
| CN113366122B (en) | 2018-12-19 | 2024-01-12 | 香港中文大学 | Free DNA end characterization |
| EP3899953A1 (en) | 2018-12-21 | 2021-10-27 | Grail, Inc. | Source of origin deconvolution based on methylation fragments in cell-free-dna samples |
| CN113195741A (en)* | 2018-12-21 | 2021-07-30 | 豪夫迈·罗氏有限公司 | Identification of global sequence features in whole genome sequence data from circulating nucleic acids |
| WO2020186024A1 (en) | 2019-03-13 | 2020-09-17 | Grail, Inc. | Systems and methods for enriching for cancer-derived fragments using fragment size |
| US12098429B2 (en) | 2019-03-25 | 2024-09-24 | The Chinese University Of Hong Kong | Determining linear and circular forms of circulating nucleic acids |
| JP2022527316A (en)* | 2019-04-02 | 2022-06-01 | グレイル, インコーポレイテッド | Stratification of virus-related cancer risk |
| JP7518097B2 (en)* | 2019-05-10 | 2024-07-17 | バイエル・コシューマー・ケア・アクチェンゲゼルシャフト | Identification of candidate signatures of NTRK oncogenic fusions |
| US12305235B2 (en) | 2019-06-06 | 2025-05-20 | Natera, Inc. | Methods for detecting immune cell DNA and monitoring immune system |
| CN110825819A (en)* | 2019-09-24 | 2020-02-21 | 昆明理工大学 | Two-classification method for processing non-small cell lung cancer data with missing values and unbalance |
| EP4066245A1 (en) | 2019-11-27 | 2022-10-05 | Grail, LLC | Systems and methods for evaluating longitudinal biological feature data |
| US11475981B2 (en) | 2020-02-18 | 2022-10-18 | Tempus Labs, Inc. | Methods and systems for dynamic variant thresholding in a liquid biopsy assay |
| US11211144B2 (en) | 2020-02-18 | 2021-12-28 | Tempus Labs, Inc. | Methods and systems for refining copy number variation in a liquid biopsy assay |
| US11211147B2 (en) | 2020-02-18 | 2021-12-28 | Tempus Labs, Inc. | Estimation of circulating tumor fraction using off-target reads of targeted-panel sequencing |
| CN114093417B (en)* | 2021-11-23 | 2022-10-04 | 深圳吉因加信息科技有限公司 | Method and device for identifying chromosomal arm heterozygosity loss |
| CN115220623B (en)* | 2021-12-17 | 2023-12-05 | 深圳市瑞图生物技术有限公司 | Chromosome image analysis method, apparatus and storage medium |
| GB2636509A (en) | 2022-02-07 | 2025-06-18 | Centre For Novostics | Fragmentation for measuring methylation and disease |
| CN114525341A (en)* | 2022-02-24 | 2022-05-24 | 苏州宏元生物科技有限公司 | Kit for simultaneously detecting lung cancer and lung infection |
| EP4547869A1 (en) | 2022-06-29 | 2025-05-07 | Raman Govindarajan | Method for detecting cancer susceptibility, early detection and predicting cancer behaviour |
| CN114898802B (en)* | 2022-07-14 | 2022-09-30 | 臻和(北京)生物科技有限公司 | Terminal sequence frequency distribution characteristic determination method, evaluation method and device based on plasma free DNA methylation sequencing data |
| WO2024129712A1 (en)* | 2022-12-12 | 2024-06-20 | Flagship Pioneering Innovations, Vi, Llc | Phased sequencing information from circulating tumor dna |
| WO2024203348A1 (en)* | 2023-03-31 | 2024-10-03 | ソニーグループ株式会社 | Tumor analysis method, tumor analysis system, and tumor analysis data generation method |
Citations (2)
| Publication number | Priority date | Publication date | Assignee | Title |
|---|---|---|---|---|
| WO2005044086A2 (en) | 2003-10-30 | 2005-05-19 | Tufts-New England Medical Center | Prenatal diagnosis using cell-free fetal dna in amniotic fluid |
| WO2010075459A1 (en) | 2008-12-22 | 2010-07-01 | Celula, Inc. | Methods and genotyping panels for detecting alleles, genomes, and transcriptomes |
Family Cites Families (31)
| Publication number | Priority date | Publication date | Assignee | Title |
|---|---|---|---|---|
| JPH08503367A (en)* | 1992-11-13 | 1996-04-16 | カリフォルニア インスティテュート オブ バイオロジカル リサーチ | Identification of neoplasms by detection of gene insertions and deletions |
| CH686982A5 (en) | 1993-12-16 | 1996-08-15 | Maurice Stroun | Method for diagnosis of cancers. |
| AU726045B2 (en)* | 1996-08-28 | 2000-10-26 | Johns Hopkins University School Of Medicine, The | Method for detecting cell proliferative disorders |
| EP1158055A1 (en) | 2000-05-26 | 2001-11-28 | Xu Qi University of Teaxs Laboratoire de Leucémie Chen | Method for diagnosing cancers |
| US20030219802A1 (en)* | 2002-03-08 | 2003-11-27 | The Regents Of The University Of Michigan | Diagnosis and treatment of osteosarcoma |
| JP2006519977A (en)* | 2002-11-11 | 2006-08-31 | アフィメトリックス インコーポレイテッド | Method for identifying DNA copy number changes |
| US7704687B2 (en) | 2002-11-15 | 2010-04-27 | The Johns Hopkins University | Digital karyotyping |
| EP1531183A1 (en) | 2003-11-14 | 2005-05-18 | bioMérieux BV | Method for amplification of RNA sequences |
| JP2006094760A (en)* | 2004-09-29 | 2006-04-13 | Canon Inc | Cell screening method and oral cancer cell detection method |
| PL1712639T3 (en) | 2005-04-06 | 2009-02-27 | Maurice Stroun | Method for the diagnosis of cancer by detecting circulating DNA and RNA |
| CA2633339C (en)* | 2005-12-14 | 2019-03-19 | Cold Spring Harbor Laboratory | Methods for assessing probabilistic measures of clinical outcome using genomic profiling |
| EP1974056A2 (en)* | 2005-12-14 | 2008-10-01 | Michael H. Wigler | Use of roma for characterizing genomic rearrangements |
| FI20061136A0 (en)* | 2006-12-19 | 2006-12-19 | Sakari Knuutila | screening method |
| CN100533120C (en)* | 2007-03-24 | 2009-08-26 | 辽宁师范大学 | Multicolor Fluorescence Multiplex Amplification Kit of 11 SNP Loci Related to Susceptibility to Lung Cancer |
| WO2008156827A2 (en)* | 2007-06-20 | 2008-12-24 | Government Of The United States Of America, As Represented By The Secretary, Department Of Health And Human Services | Molecular grading methods for ductal carcinoma in situ |
| SI2514842T1 (en) | 2007-07-23 | 2016-06-30 | The Chinese University Of Hong Kong Office of Research and Knowledge Transfer Services | Diagnosing fetal chromosomal aneuploidy using genomic sequencing |
| US12180549B2 (en)* | 2007-07-23 | 2024-12-31 | The Chinese University Of Hong Kong | Diagnosing fetal chromosomal aneuploidy using genomic sequencing |
| US8093063B2 (en) | 2007-11-29 | 2012-01-10 | Quest Diagnostics Investments Incorporated | Assay for detecting genetic abnormalities in genomic nucleic acids |
| US20100041048A1 (en)* | 2008-07-31 | 2010-02-18 | The Johns Hopkins University | Circulating Mutant DNA to Assess Tumor Dynamics |
| GB2467704B (en)* | 2008-11-07 | 2011-08-24 | Mlc Dx Inc | A method for determining a profile of recombined DNA sequences in T-cells and/or B-cells |
| US20100136560A1 (en) | 2008-12-02 | 2010-06-03 | The Johns Hopkins University | Integrated Analyses of Breast and Colorectal Cancers |
| WO2010070366A1 (en)* | 2008-12-15 | 2010-06-24 | Debreceni Egyetem | Cytometric method for the comparative analysis of the length of pcr products and uses of this method |
| HUE034854T2 (en) | 2009-11-05 | 2018-03-28 | Univ Hong Kong Chinese | Fetal genomic analysis from maternal biological samples |
| CN107312844B (en) | 2009-11-06 | 2021-01-22 | 香港中文大学 | Size-based genomic analysis |
| PL3492601T3 (en) | 2010-01-19 | 2022-05-23 | Verinata Health, Inc. | Novel protocol for preparing sequencing libraries |
| CA2786564A1 (en) | 2010-01-19 | 2011-07-28 | Verinata Health, Inc. | Identification of polymorphic sequences in mixtures of genomic dna by whole genome sequencing |
| EP2536854B1 (en) | 2010-02-18 | 2017-07-19 | The Johns Hopkins University | Personalized tumor biomarkers |
| WO2011130751A1 (en)* | 2010-04-16 | 2011-10-20 | Chronix Biomedical | Breast cancer associated circulating nucleic acid biomarkers |
| KR102042253B1 (en)* | 2010-05-25 | 2019-11-07 | 더 리젠츠 오브 더 유니버시티 오브 캘리포니아 | Bambam: parallel comparative analysis of high-throughput sequencing data |
| US20120034603A1 (en)* | 2010-08-06 | 2012-02-09 | Tandem Diagnostics, Inc. | Ligation-based detection of genetic variants |
| KR101891847B1 (en) | 2010-11-30 | 2018-08-24 | 더 차이니즈 유니버시티 오브 홍콩 | Detection of genetic or molecular aberrations associated with cancer |
- 2011
- 2011-11-30KRKR1020137016780Apatent/KR101891847B1/enactiveActive
- 2011-11-30TWTW100144098Apatent/TWI532843B/enactive
- 2011-11-30SGSG2013038773Apatent/SG190344A1/enunknown
- 2011-11-30DKDK11845367.9Tpatent/DK2646579T3/enactive
- 2011-11-30EPEP23190213.1Apatent/EP4269623A3/enactivePending
- 2011-11-30CNCN201810817319.1Apatent/CN108899091B/enactiveActive
- 2011-11-30EAEA201300649Apatent/EA038374B1/enunknown
- 2011-11-30DKDK17168020.0Tpatent/DK3243910T3/enactive
- 2011-11-30CACA2817370Apatent/CA2817370C/enactiveActive
- 2011-11-30TWTW110101988Apatent/TWI786520B/enactive
- 2011-11-30MXMX2013006075Apatent/MX349568B/enactiveIP Right Grant
- 2011-11-30TWTW111126139Apatent/TW202242133A/enunknown
- 2011-11-30EPEP17168020.0Apatent/EP3243910B1/ennot_activeRevoked
- 2011-11-30TWTW105102252Apatent/TWI642786B/enactive
- 2011-11-30TWTW107129009Apatent/TWI719339B/enactive
- 2011-11-30CNCN202210291074.XApatent/CN114678128A/enactivePending
- 2011-11-30NZNZ611599Apatent/NZ611599A/enunknown
- 2011-11-30BRBR112013013421Apatent/BR112013013421A2/ennot_activeApplication Discontinuation
- 2011-11-30AUAU2011335891Apatent/AU2011335891B2/enactiveActive
- 2011-11-30SGSG10202008532PApatent/SG10202008532PA/enunknown
- 2011-11-30CNCN201510615900.1Apatent/CN105243295B/enactiveActive
- 2011-11-30EPEP19206273.5Apatent/EP3640346A1/enactivePending
- 2011-11-30JPJP2013541152Apatent/JP6196157B2/enactiveActive
- 2011-11-30KRKR1020207033400Apatent/KR102333664B1/enactiveActive
- 2011-11-30CNCN201180066175.7Apatent/CN103403182B/enactiveActive
- 2011-11-30KRKR1020237001326Apatent/KR102723107B1/enactiveActive
- 2011-11-30EPEP11845367.9Apatent/EP2646579B1/enactiveActive
- 2011-11-30MXMX2017009968Apatent/MX370249B/enunknown
- 2011-11-30MYMYPI2013001960Apatent/MY169852A/enunknown
- 2011-11-30SGSG10201509766YApatent/SG10201509766YA/enunknown
- 2011-11-30KRKR1020197032092Apatent/KR102185244B1/enactiveActive
- 2011-11-30KRKR1020187023415Apatent/KR102040307B1/enactiveActive
- 2011-11-30WOPCT/AU2011/001562patent/WO2012071621A1/enactiveApplication Filing
- 2011-11-30USUS13/308,473patent/US8741811B2/enactiveActive
- 2011-11-30KRKR1020217038741Apatent/KR102489749B1/enactiveActive
- 2013
- 2013-05-09ILIL226272Apatent/IL226272A/enactiveIP Right Grant
- 2013-05-30MXMX2019014657Apatent/MX2019014657A/enunknown
- 2013-06-21ZAZA2013/04625Apatent/ZA201304625B/enunknown
- 2014
- 2014-04-17USUS14/255,415patent/US9965585B2/enactiveActive
- 2016
- 2016-01-28ILIL243823Apatent/IL243823A/enactiveIP Right Grant
- 2017
- 2017-03-05ILIL250931Apatent/IL250931A0/enunknown
- 2017-04-19USUS15/491,507patent/US12002544B2/enactiveActive
- 2017-08-08JPJP2017153310Apatent/JP6487504B2/enactiveActive
- 2019
- 2019-02-20JPJP2019028674Apatent/JP6931013B2/enactiveActive
- 2021
- 2021-08-12JPJP2021131762Apatent/JP7351537B2/enactiveActive
- 2023
- 2023-09-07JPJP2023145456Apatent/JP2023179458A/enactivePending
- 2024
- 2024-05-24USUS18/674,702patent/US20250006299A1/enactivePending
Patent Citations (2)
| Publication number | Priority date | Publication date | Assignee | Title |
|---|---|---|---|---|
| WO2005044086A2 (en) | 2003-10-30 | 2005-05-19 | Tufts-New England Medical Center | Prenatal diagnosis using cell-free fetal dna in amniotic fluid |
| WO2010075459A1 (en) | 2008-12-22 | 2010-07-01 | Celula, Inc. | Methods and genotyping panels for detecting alleles, genomes, and transcriptomes |
Non-Patent Citations (2)
| Title |
|---|
| Genome Res. 2001 Jun;11(6):981-93 |
| Invest Ophthalmol Vis Sci. 2010 Oct;51(10):4884-91 |
Also Published As
Similar Documents
| Publication | Publication Date | Title |
|---|---|---|
| US20250006299A1 (en) | Detection of genetic or molecular aberrations associated with cancer | |
| AU2022202130A1 (en) | Detection of genetic or molecular aberrations associated with cancer | |
| HK40028054A (en) | Analysis of a biological sample of an organism for chromosomal deletions or amplifications associated with cancer | |
| HK1240278A1 (en) | Determination of progress of chromosomal aberrations in an organism | |
| HK1240278B (en) | Determination of progress of chromosomal aberrations in an organism | |
| HK1190435B (en) | Detection of genetic or molecular aberrations associated with cancer | |
| HK1190435A (en) | Detection of genetic or molecular aberrations associated with cancer |
Legal Events
| Date | Code | Title | Description |
|---|---|---|---|
| A107 | Divisional application of patent | ||
| PA0104 | Divisional application for international application | Comment text:Divisional Application for International Patent Patent event code:PA01041R01D Patent event date:20201119 Application number text:1020197032092 Filing date:20191029 | |
| PG1501 | Laying open of application | ||
| A201 | Request for examination | ||
| PA0201 | Request for examination | Patent event code:PA02012R01D Patent event date:20201203 Comment text:Request for Examination of Application | |
| E902 | Notification of reason for refusal | ||
| PE0902 | Notice of grounds for rejection | Comment text:Notification of reason for refusal Patent event date:20210112 Patent event code:PE09021S01D | |
| E701 | Decision to grant or registration of patent right | ||
| PE0701 | Decision of registration | Patent event code:PE07011S01D Comment text:Decision to Grant Registration Patent event date:20210825 | |
| PA0104 | Divisional application for international application | Comment text:Divisional Application for International Patent Patent event code:PA01041R01D Patent event date:20211126 Application number text:1020197032092 Filing date:20191029 | |
| PR0701 | Registration of establishment | Comment text:Registration of Establishment Patent event date:20211126 Patent event code:PR07011E01D | |
| PR1002 | Payment of registration fee | Payment date:20211129 End annual number:3 Start annual number:1 | |
| PG1601 | Publication of registration | ||
| PR1001 | Payment of annual fee | Payment date:20241016 Start annual number:4 End annual number:4 |