KR102288461B1 - Fractional abundance of polynucleotide sequences in a sample - Google Patents
Fractional abundance of polynucleotide sequences in a sampleDownload PDFInfo
- Publication number
- KR102288461B1 KR102288461B1KR1020207000871AKR20207000871AKR102288461B1KR 102288461 B1KR102288461 B1KR 102288461B1KR 1020207000871 AKR1020207000871 AKR 1020207000871AKR 20207000871 AKR20207000871 AKR 20207000871AKR 102288461 B1KR102288461 B1KR 102288461B1
- Authority
- KR
- South Korea
- Prior art keywords
- target
- analyte
- sample
- delete delete
- mixed
- Prior art date
- Legal status (The legal status is an assumption and is not a legal conclusion. Google has not performed a legal analysis and makes no representation as to the accuracy of the status listed.)
- Active
Links
Images


Classifications
- G—PHYSICS
- G01—MEASURING; TESTING
- G01N—INVESTIGATING OR ANALYSING MATERIALS BY DETERMINING THEIR CHEMICAL OR PHYSICAL PROPERTIES
- G01N27/00—Investigating or analysing materials by the use of electric, electrochemical, or magnetic means
- G01N27/26—Investigating or analysing materials by the use of electric, electrochemical, or magnetic means by investigating electrochemical variables; by using electrolysis or electrophoresis
- G01N27/416—Systems
- G01N27/447—Systems using electrophoresis
- G—PHYSICS
- G01—MEASURING; TESTING
- G01N—INVESTIGATING OR ANALYSING MATERIALS BY DETERMINING THEIR CHEMICAL OR PHYSICAL PROPERTIES
- G01N33/00—Investigating or analysing materials by specific methods not covered by groups G01N1/00 - G01N31/00
- G01N33/48—Biological material, e.g. blood, urine; Haemocytometers
- G01N33/483—Physical analysis of biological material
- G01N33/487—Physical analysis of biological material of liquid biological material
- G01N33/48707—Physical analysis of biological material of liquid biological material by electrical means
- G01N33/48721—Investigating individual macromolecules, e.g. by translocation through nanopores
- C—CHEMISTRY; METALLURGY
- C12—BIOCHEMISTRY; BEER; SPIRITS; WINE; VINEGAR; MICROBIOLOGY; ENZYMOLOGY; MUTATION OR GENETIC ENGINEERING
- C12Q—MEASURING OR TESTING PROCESSES INVOLVING ENZYMES, NUCLEIC ACIDS OR MICROORGANISMS; COMPOSITIONS OR TEST PAPERS THEREFOR; PROCESSES OF PREPARING SUCH COMPOSITIONS; CONDITION-RESPONSIVE CONTROL IN MICROBIOLOGICAL OR ENZYMOLOGICAL PROCESSES
- C12Q1/00—Measuring or testing processes involving enzymes, nucleic acids or microorganisms; Compositions therefor; Processes of preparing such compositions
- C12Q1/68—Measuring or testing processes involving enzymes, nucleic acids or microorganisms; Compositions therefor; Processes of preparing such compositions involving nucleic acids
- C12Q1/6806—Preparing nucleic acids for analysis, e.g. for polymerase chain reaction [PCR] assay
- C—CHEMISTRY; METALLURGY
- C12—BIOCHEMISTRY; BEER; SPIRITS; WINE; VINEGAR; MICROBIOLOGY; ENZYMOLOGY; MUTATION OR GENETIC ENGINEERING
- C12Q—MEASURING OR TESTING PROCESSES INVOLVING ENZYMES, NUCLEIC ACIDS OR MICROORGANISMS; COMPOSITIONS OR TEST PAPERS THEREFOR; PROCESSES OF PREPARING SUCH COMPOSITIONS; CONDITION-RESPONSIVE CONTROL IN MICROBIOLOGICAL OR ENZYMOLOGICAL PROCESSES
- C12Q1/00—Measuring or testing processes involving enzymes, nucleic acids or microorganisms; Compositions therefor; Processes of preparing such compositions
- C12Q1/68—Measuring or testing processes involving enzymes, nucleic acids or microorganisms; Compositions therefor; Processes of preparing such compositions involving nucleic acids
- C12Q1/6844—Nucleic acid amplification reactions
- C12Q1/6851—Quantitative amplification
- C—CHEMISTRY; METALLURGY
- C12—BIOCHEMISTRY; BEER; SPIRITS; WINE; VINEGAR; MICROBIOLOGY; ENZYMOLOGY; MUTATION OR GENETIC ENGINEERING
- C12Q—MEASURING OR TESTING PROCESSES INVOLVING ENZYMES, NUCLEIC ACIDS OR MICROORGANISMS; COMPOSITIONS OR TEST PAPERS THEREFOR; PROCESSES OF PREPARING SUCH COMPOSITIONS; CONDITION-RESPONSIVE CONTROL IN MICROBIOLOGICAL OR ENZYMOLOGICAL PROCESSES
- C12Q1/00—Measuring or testing processes involving enzymes, nucleic acids or microorganisms; Compositions therefor; Processes of preparing such compositions
- C12Q1/68—Measuring or testing processes involving enzymes, nucleic acids or microorganisms; Compositions therefor; Processes of preparing such compositions involving nucleic acids
- C12Q1/6869—Methods for sequencing
- C—CHEMISTRY; METALLURGY
- C12—BIOCHEMISTRY; BEER; SPIRITS; WINE; VINEGAR; MICROBIOLOGY; ENZYMOLOGY; MUTATION OR GENETIC ENGINEERING
- C12Q—MEASURING OR TESTING PROCESSES INVOLVING ENZYMES, NUCLEIC ACIDS OR MICROORGANISMS; COMPOSITIONS OR TEST PAPERS THEREFOR; PROCESSES OF PREPARING SUCH COMPOSITIONS; CONDITION-RESPONSIVE CONTROL IN MICROBIOLOGICAL OR ENZYMOLOGICAL PROCESSES
- C12Q1/00—Measuring or testing processes involving enzymes, nucleic acids or microorganisms; Compositions therefor; Processes of preparing such compositions
- C12Q1/68—Measuring or testing processes involving enzymes, nucleic acids or microorganisms; Compositions therefor; Processes of preparing such compositions involving nucleic acids
- C12Q1/6876—Nucleic acid products used in the analysis of nucleic acids, e.g. primers or probes
- G—PHYSICS
- G01—MEASURING; TESTING
- G01N—INVESTIGATING OR ANALYSING MATERIALS BY DETERMINING THEIR CHEMICAL OR PHYSICAL PROPERTIES
- G01N27/00—Investigating or analysing materials by the use of electric, electrochemical, or magnetic means
- G01N27/26—Investigating or analysing materials by the use of electric, electrochemical, or magnetic means by investigating electrochemical variables; by using electrolysis or electrophoresis
- G01N27/28—Electrolytic cell components
- G01N27/30—Electrodes, e.g. test electrodes; Half-cells
- G01N27/327—Biochemical electrodes, e.g. electrical or mechanical details for in vitro measurements
- G01N27/3275—Sensing specific biomolecules, e.g. nucleic acid strands, based on an electrode surface reaction
- G01N27/3278—Sensing specific biomolecules, e.g. nucleic acid strands, based on an electrode surface reaction involving nanosized elements, e.g. nanogaps or nanoparticles
- G—PHYSICS
- G01—MEASURING; TESTING
- G01N—INVESTIGATING OR ANALYSING MATERIALS BY DETERMINING THEIR CHEMICAL OR PHYSICAL PROPERTIES
- G01N27/00—Investigating or analysing materials by the use of electric, electrochemical, or magnetic means
- G01N27/26—Investigating or analysing materials by the use of electric, electrochemical, or magnetic means by investigating electrochemical variables; by using electrolysis or electrophoresis
- G01N27/416—Systems
- G01N27/447—Systems using electrophoresis
- G01N27/44756—Apparatus specially adapted therefor
- G01N27/44791—Microapparatus
- G—PHYSICS
- G01—MEASURING; TESTING
- G01N—INVESTIGATING OR ANALYSING MATERIALS BY DETERMINING THEIR CHEMICAL OR PHYSICAL PROPERTIES
- G01N33/00—Investigating or analysing materials by specific methods not covered by groups G01N1/00 - G01N31/00
- G01N33/48—Biological material, e.g. blood, urine; Haemocytometers
- G01N33/483—Physical analysis of biological material
- G01N33/487—Physical analysis of biological material of liquid biological material
- C—CHEMISTRY; METALLURGY
- C12—BIOCHEMISTRY; BEER; SPIRITS; WINE; VINEGAR; MICROBIOLOGY; ENZYMOLOGY; MUTATION OR GENETIC ENGINEERING
- C12Q—MEASURING OR TESTING PROCESSES INVOLVING ENZYMES, NUCLEIC ACIDS OR MICROORGANISMS; COMPOSITIONS OR TEST PAPERS THEREFOR; PROCESSES OF PREPARING SUCH COMPOSITIONS; CONDITION-RESPONSIVE CONTROL IN MICROBIOLOGICAL OR ENZYMOLOGICAL PROCESSES
- C12Q2565/00—Nucleic acid analysis characterised by mode or means of detection
- C12Q2565/60—Detection means characterised by use of a special device
- C12Q2565/607—Detection means characterised by use of a special device being a sensor, e.g. electrode
Landscapes
- Chemical & Material Sciences (AREA)
- Life Sciences & Earth Sciences (AREA)
- Health & Medical Sciences (AREA)
- Engineering & Computer Science (AREA)
- Physics & Mathematics (AREA)
- Organic Chemistry (AREA)
- Molecular Biology (AREA)
- Analytical Chemistry (AREA)
- Proteomics, Peptides & Aminoacids (AREA)
- Immunology (AREA)
- General Health & Medical Sciences (AREA)
- Biochemistry (AREA)
- Wood Science & Technology (AREA)
- Zoology (AREA)
- Biomedical Technology (AREA)
- Biophysics (AREA)
- General Physics & Mathematics (AREA)
- Pathology (AREA)
- Chemical Kinetics & Catalysis (AREA)
- Bioinformatics & Cheminformatics (AREA)
- Biotechnology (AREA)
- Microbiology (AREA)
- Genetics & Genomics (AREA)
- General Engineering & Computer Science (AREA)
- Spectroscopy & Molecular Physics (AREA)
- Nanotechnology (AREA)
- Medicinal Chemistry (AREA)
- Food Science & Technology (AREA)
- Urology & Nephrology (AREA)
- Electrochemistry (AREA)
- Hematology (AREA)
- Dispersion Chemistry (AREA)
- Measuring Or Testing Involving Enzymes Or Micro-Organisms (AREA)
- Investigating Or Analyzing Materials By The Use Of Electric Means (AREA)
- Investigating Or Analysing Biological Materials (AREA)
Abstract
Translated fromKoreanDescription
Translated fromKorean관련 출원에 대한 교차 참조CROSS REFERENCE TO RELATED APPLICATIONS
본 출원은 2016년 10월 24일에 출원된 미국 가출원 62/412,221 및 2017년 3월 31일에 출원된 국제 출원 PCT/US2017/025585의 이득을 주장하며, 이들의 내용은 각각 그 전체가 참조로서 본 명세서에 포함된다.This application claims the benefit of U.S. Provisional Application No. 62/412,221, filed October 24, 2016, and International Application PCT/US2017/025585, filed March 31, 2017, the contents of each of which are incorporated by reference in their entirety. incorporated herein.
기술분야technical field
본 발명은 고체상 나노포어를 사용하여 시료로부터 특정한 폴리뉴클레오타이드 서열의 분포 분율(fractional abundance)을 결정하는 방법 및 정밀하고 정확한 정량화를 위한 수학적 방법에 관한 것이다.The present invention relates to a method for determining the fractional abundance of a specific polynucleotide sequence from a sample using solid-phase nanopores and a mathematical method for precise and accurate quantification.
시료에 존재하는 구성성분들의 상대 존재비(relative abundance)의 결정에 의한 액체 시료의 특징화는 많은 과학 분야들 및 적용들을 위한 중요한 정보를 제공할 수 있다. 예를 들어, 순환하는 세포-무함유 DNA에서 점 돌연변이의 상대 존재비는 환자에서 암의 진행을 진단하거나 모니터링하는 데 사용될 수 있다. 또 다른 예로서, 예를 들어 종자 수합물(collection of seeds)로부터 수득된 게놈 DNA 내의 비-GMO 참조 서열에 대한 유전자 변형 유기체(GMO)의 유전자이식(transgenic) 서열의 부분량(fractional amount)의 결정은 규제 및 경제적 이유에서 중요하다.Characterization of liquid samples by the determination of the relative abundance of constituents present in the sample can provide important information for many scientific fields and applications. For example, the relative abundance of point mutations in circulating cell-free DNA can be used to diagnose or monitor the progression of cancer in a patient. As another example, the fractional amount of a transgenic sequence of a genetically modified organism (GMO) relative to a non-GMO reference sequence in genomic DNA obtained, for example, from a collection of seeds. Decisions are important for regulatory and economic reasons.
시료 내에서 표적 분석물의 부분량을 민감하게 검출하는 일부 방법들이 존재하지만, 이들 방법은 통상적으로 비용이 많이 들고 시간-소모적이거나 다른 제한들을 가진다. 예를 들어, 정량적 실시간 PCR(qPCR) 검정법이 시험 시료 내에서 불변 참조 서열에 대한 표적 핵산 서열의 상대량을 결정하는 데 사용되는 표준 방법으로 존재한다. 그러나, qPCR의 정량적 성능은 시료 당 및 앰플리콘(amplicon) 당 증폭 효율에서의 가변성에 의해 제한을 받는다. 증폭 효율에 영향을 미치는 인자들은 시료 기질 유래의 저해제와 캐리오버(carryover) 오염물 및 추출 시약 그 자체를 포함한다. 이들 인자는 시료 및 준비에 따라 다르며, 뿐만 아니라 이들 인자가 또 다른 서열과 비교하여 하나의 서열의 증폭 효율에 영향을 미치는 정도에 따라 다르다. 참조 앰플리콘과 비교하여 표적의 증폭 효율에서 약간의 가변적인 차이는 1.5x배 초과의 양 차이를 해결하기 위해 qPCR을 제한한다. 더욱이, 증폭 반응은 특수 시약 세트를 필요로 하고 적절하게 저장되어야 하며, 시간 소모적이고 반응 조건에 민감할 수 있다.Although some methods exist for sensitively detecting partial amounts of a target analyte in a sample, these methods are typically expensive, time-consuming, or have other limitations. For example, quantitative real-time PCR (qPCR) assays exist as standard methods used to determine the relative amount of a target nucleic acid sequence to a constant reference sequence in a test sample. However, the quantitative performance of qPCR is limited by variability in amplification efficiency per sample and per amplicon. Factors affecting amplification efficiency include inhibitors from the sample substrate, carryover contaminants, and the extraction reagents themselves. These factors depend on the sample and preparation, as well as on the extent to which these factors affect the amplification efficiency of one sequence compared to another sequence. Slightly variable differences in the amplification efficiency of the target compared to the reference amplicons limit qPCR to resolve greater than 1.5x-fold quantitative differences. Moreover, amplification reactions require special reagent sets, must be stored properly, and can be time consuming and sensitive to reaction conditions.
나노포어 장치의 사용은 단일 분자 식별을 위한 민감한 툴로서 출현하였으며, 여기서, 개별 분자는 인가된 전압 하에 나노포어를 통한 전위 시 식별된다. 나노포어 장치는 사용 적용점에 맞춰질 수 있고, 인간 건강, 농업 또는 다른 어떤 곳에서 충분히 저렴하고 일상적인 매일의 사용 사례에 효율적일 수 있다. 그러나, 나노포어 유래의 데이터의 사용에서는 오차가 생길 수 있으며, 이러한 오차는 시료 내 분석물의 정량적 추정치의 결정에 영향을 줄 수 있고, 따라서 이러한 데이터의 신뢰할 만한 사용은 실현 가능하지 않다.The use of nanopore devices has emerged as a sensitive tool for single molecule identification, where individual molecules are identified upon translocation through the nanopore under an applied voltage. Nanopore devices can be tailored to the point of use application, affordable enough for human health, agriculture or anywhere else, and efficient for everyday use cases. However, errors may arise in the use of data from nanopores, and such errors may affect the determination of quantitative estimates of analytes in a sample, and thus reliable use of such data is not feasible.
따라서, 요망되는 것은, 다재다능하며 저렴하고 사용하기 용이한, 시료 내 참조 분석물과 비교하여 표적 분석물의 분포 분율의 개선된 결정 방법이다.Accordingly, what is desired is an improved method for determining the fraction of distribution of a target analyte as compared to a reference analyte in a sample, which is versatile, inexpensive and easy to use.
일부 실시형태에 따르면, 나노포어 장치를 사용하여 혼합된 미공지 시료 내 표적 분석물의 참(true) 상대 존재비의 개선된 추정치의 결정 방법이 본원에 제공되며, 상기 방법은, 나노포어 장치에서 나노포어를 가로질러 전압을 인가하여, 참조 분석물과 비교하여 표적 분석물을 공지된 상대 존재비로 포함하는 대조군 시료, 및 상기 표적 분석물 및 상기 참조 분석물을 포함하는 혼합된 미공지 시료 각각에 대해 개별적으로 검출 가능한 전자 신호를 발생시키고 하전된 분석물의 전위를 유도하는 단계로서, 여기서, 상기 시료 내 상기 표적 분석물의 상대 존재비가 결정되어야 하는 단계; 각각의 시료에 대해 상기 나노포어를 통한 상기 표적 분석물 또는 상기 참조 분석물의 전위에 의해 발생된 복수의 이벤트 신호(event signature)들을 발생시키는 단계; 상기 복수의 이벤트 신호들로부터 상기 표적 분석물과 연관된 제1 이벤트 신호의 양 및 상기 참조 분석물과 연관된 제2 이벤트 신호의 양을 식별하여, 각각의 시료에 대해 제1 이벤트 신호 및 제2 이벤트 신호의 검출된 상대 존재비를 결정하는 단계; 및 상기 대조군 시료 내 상기 제1 이벤트 신호 및 상기 제2 이벤트 신호의 검출된 상대 존재비를 사용하여 상기 혼합된 미공지 시료 내 상기 제1 이벤트 신호 및 상기 제2 이벤트 신호의 검출된 상대 존재비를 조정하여, 검출된 상대 존재비에서 오차에 대해 보정하고, 이로써 상기 혼합된 미공지 시료 내 상기 표적 분석물의 참 상대 존재비의 개선된 추정치를 결정하는 단계를 포함한다. 일부 실시형태에서, 시료는 액체 시료이다.According to some embodiments, provided herein is a method of determining an improved estimate of the true relative abundance of a target analyte in a mixed unknown sample using a nanopore device, the method comprising: Applying a voltage across generating a detectable electronic signal and inducing a potential of a charged analyte, wherein the relative abundance of the target analyte in the sample is to be determined; generating a plurality of event signatures generated by translocation of the target analyte or the reference analyte through the nanopores for each sample; a first event signal and a second event signal for each sample by identifying an amount of a first event signal associated with the target analyte and an amount of a second event signal associated with the reference analyte from the plurality of event signals determining a detected relative abundance of ; and adjusting the detected relative abundances of the first event signal and the second event signal in the mixed unknown sample using the detected relative abundances of the first event signal and the second event signal in the control sample. , correcting for an error in the detected relative abundance, thereby determining an improved estimate of the true relative abundance of the target analyte in the mixed unknown sample. In some embodiments, the sample is a liquid sample.
일부 실시형태에서, 상기 대조군 시료는 상기 참조 분석물이 아니라 상기 표적 분석물을 포함하는 표적 대조군 시료이다. 일부 실시형태에서, 대조군 시료는 상기 표적 분석물이 아니라 상기 참조 분석물을 포함하는 참조 대조군 시료이다.In some embodiments, the control sample is a target control sample comprising the target analyte rather than the reference analyte. In some embodiments, the control sample is a reference control sample comprising the reference analyte rather than the target analyte.
일부 실시형태에서, 나노포어 장치를 사용하여 혼합된 미공지 시료 내 표적 분석물의 참 상대 존재비의 개선된 추정치를 결정하는 방법은 추가로 나노포어 장치에 전압을 인가하여 상기 참조 분석물이 아니라 상기 표적 분석물을 포함하는 표적 대조군 시료에 대해 나노포어 센서를 통해 하전된 분석물의 전위를 유도하는 단계를 포함한다.In some embodiments, the method of determining an improved estimate of the true relative abundance of a target analyte in a mixed unknown sample using a nanopore device further comprises applying a voltage to the nanopore device to determine the target rather than the reference analyte. inducing a potential of the charged analyte through the nanopore sensor with respect to a target control sample comprising the analyte.
일부 실시형태에서, 상기 미공지 시료 내 상기 제1 이벤트 신호 및 상기 제2 이벤트 신호의 상기 검출된 상대 존재비의 조정은 상기 표적 대조군 시료 및 상기 참조 대조군 시료 내 상기 제1 이벤트 신호 및 상기 제2 이벤트 신호의 검출된 상대 존재비를 사용하여, 검출된 상대 존재비에서의 상기 오차를 보정하는 단계를 포함한다. 일부 실시형태에서, 오차는 상기 표적 분석물의 위양성(false positive) 또는 위음성(false negative) 검출 오차를 포함한다.In some embodiments, the adjustment of the detected relative abundance of the first event signal and the second event signal in the unknown sample comprises the first event signal and the second event in the target control sample and the reference control sample. using the detected relative abundance of the signal to correct for the error in the detected relative abundance. In some embodiments, the error comprises a false positive or false negative detection error of the target analyte.
일부 실시형태에서, 나노포어 장치를 사용하여 혼합된 미공지 시료 내 표적 분석물의 참 상대 존재비의 개선된 추정치를 결정하는 방법은 추가로, 나노포어 장치에 전압을 인가하여, 상기 표적 분석물 및 상기 참조 분석물을 포함하는 혼합 대조군 시료에 대해 나노포어 센서를 통해 하전된 분석물의 전위를 유도하는 단계를 포함하며, 여기서, 상기 표적 분석물 및 상기 참조 분석물의 상대 존재비는 공지되어 있다.In some embodiments, the method of determining an improved estimate of the true relative abundance of a target analyte in a mixed unknown sample using a nanopore device further comprises applying a voltage to the nanopore device, the target analyte and the inducing a potential of a charged analyte through a nanopore sensor with respect to a mixed control sample comprising a reference analyte, wherein the relative abundance of the target analyte and the reference analyte is known.
일부 실시형태에서, 상기 미공지 시료 내 상기 제1 이벤트 신호 및 상기 제2 이벤트 신호의 상기 검출된 상대 존재비의 조정은 상기 표적 대조군 시료, 상기 참조 대조군 시료 및 상기 혼합 대조군 시료 내 상기 제1 이벤트 신호 및 상기 제2 이벤트 신호의 검출된 상대 존재비를 사용하여, 검출된 상대 존재비에서 상기 오차를 보정하는 단계를 포함한다.In some embodiments, the adjustment of the detected relative abundance of the first event signal and the second event signal in the unknown sample comprises the first event signal in the target control sample, the reference control sample and the mixed control sample. and correcting the error in the detected relative abundance using the detected relative abundance of the second event signal.
일부 실시형태에서, 오차는 위양성 표적 분석물 검출 오차, 위음성 표적 분석물 검출 오차, 상기 표적 분석물과 상기 참조 분석물 사이의 포착률 상수 차이(capture rate constant differential) 또는 이들의 임의의 조합을 포함한다.In some embodiments, the error comprises a false positive target analyte detection error, a false negative target analyte detection error, a capture rate constant differential between the target analyte and the reference analyte, or any combination thereof. .
일부 실시형태에서, 대조군 시료는 상기 표적 분석물 및 상기 참조 분석물을 포함하는 혼합 대조군 시료이며, 여기서, 상기 표적 분석물 및 상기 참조 분석물의 상대 존재비는 공지되어 있다. 일부 실시형태에서, 오차는 상기 표적 분석물과 상기 참조 분석물 사이의 포착률 상수 차이를 포함한다.In some embodiments, the control sample is a mixed control sample comprising the target analyte and the reference analyte, wherein the relative abundance of the target analyte and the reference analyte is known. In some embodiments, the error comprises a difference in capture rate constant between the target analyte and the reference analyte.
일부 실시형태에서, 혼합 대조군 시료는 상기 혼합된 미공지 시료에 비하여 1.2배 이하, 1.5배 이하, 2배 이하, 5배 이하 또는 10배 이하만큼 차이나는, 상기 참조 분석물에 대한 상기 표적 분석물의 상대 존재비를 포함한다.In some embodiments, a mixed control sample differs by no more than 1.2 fold, no more than 1.5 fold, no more than 2 fold, no more than 5 fold, or no more than 10 fold of the target analyte relative to the reference analyte, compared to the mixed unknown sample. Includes relative abundance.
일부 실시형태에서, 참 상대 존재비의 추정치는 상기 혼합된 미공지 시료에서 상기 참조 분석물에 대한 상기 표적 분석물의 참비율(true ratio)의 추정치이다. 일부 실시형태에서, 참비율의 추정치(R*혼합)는R*혼합=ρα에 의해 결정되며, 여기서, 파라미터 ρ는 위양성 검출 오차, 위음성 검출 오차 또는 둘 다를 보상할 수 있는 비율에 대한 추정치이고, 파라미터 α는 상기 표적 분석물과 상기 참조 분석물 사이의 포착률 상수 차이를 보상하는 데 사용될 수 있다. 일부 실시형태에서, 파라미터 α는 참조 분석물 포착률을 표적 분석물 포착률로 나눈 비율의 추정치이다.In some embodiments, the estimate of true relative abundance is an estimate of the true ratio of the target analyte to the reference analyte in the mixed unknown sample. In some embodiments, the estimate of the true ratio (R*mix ) isdetermined by R*mix =ρα , where the parameter ρ is an estimate for the ratio that can compensate for false positive detection error, false negative detection error, or both, The parameter α can be used to compensate for differences in capture rate constants between the target analyte and the reference analyte. In some embodiments, the parameter α is an estimate of the ratio of reference analyte capture divided by target analyte capture.
일부 실시형태에서, 참 상대 존재비의 추정치는 상기 혼합된 미공지 시료 내 상기 참조 분석물 및 상기 표적 분석물의 집단에서 상기 표적 분석물의 참분율(true fraction)의 추정치이다. 일부 실시형태에서, 참분율의 추정치(F*혼합)는
일부 실시형태에서, 파라미터


일부 실시형태에서, 미공지 또는 대조군 시료는 핵산 증폭에 의해 제조된다. 일부 실시형태에서, 미공지 또는 대조군 시료는 핵산 증폭에 의해 제조되지 않는다. 일부 실시형태에서, 시료는 실질적으로 참조 분자 및 표적 분자로 구성되도록 정제된다. 일부 실시형태에서, 시료는 정제되지 않는다.In some embodiments, the unknown or control sample is prepared by nucleic acid amplification. In some embodiments, the unknown or control sample is not prepared by nucleic acid amplification. In some embodiments, the sample is purified to consist substantially of a reference molecule and a target molecule. In some embodiments, the sample is not purified.
일부 실시형태에서, 상기 혼합된 미공지 시료 내 상기 참조 분석물의 양 또는 농도는 공지되어 있다. 일부 실시형태에서, 나노포어 장치를 사용하여 혼합된 미공지 시료 내 표적 분석물의 참 상대 존재비의 개선된 추정치를 결정하는 방법은 추가로 상기 혼합된 미공지 시료 내 상기 참조 분석물에 대한 상기 표적 분석물의 참 상대 존재비의 상기 추정치 및 상기 혼합된 미공지 시료 내 상기 참조 분석물의 상기 공지된 양 또는 농도를 사용하여 상기 혼합된 미공지 시료 내 상기 표적 분석물의 절대 양 또는 농도의 추정치를 결정하는 단계를 포함한다.In some embodiments, the amount or concentration of the reference analyte in the mixed unknown sample is known. In some embodiments, the method of determining an improved estimate of the true relative abundance of a target analyte in a mixed unknown sample using a nanopore device further comprises the target assay for the reference analyte in the mixed unknown sample. determining an estimate of the absolute amount or concentration of the target analyte in the mixed unknown sample using the estimate of the true relative abundance of water and the known amount or concentration of the reference analyte in the mixed unknown sample; include
일부 실시형태에서, 상기 표적 분석물과 연관된 제1 이벤트 신호의 양 및 상기 참조 분석물과 연관된 제2 이벤트 신호의 상기 양은 한정된 역치(defined threshold)에 따라 식별된다. 일부 실시형태에서, 나노포어 장치를 사용하여 혼합된 미공지 시료 내 표적 분석물의 참 상대 존재비의 개선된 추정치를 결정하는 방법은 추가로 Q-테스트, 서포트 벡터 머신(support vector machine) 또는 기댓값 최대화 알고리즘(expectation maximization algorithm)을 사용하여 상기 역치를 최적화하여 상기 참조 분석물 및/또는 상기 표적 분석물의 검출의 정확도를 증가시키는 단계를 포함한다. 일부 실시형태에서, 서포트 벡터 머신은 표적 분석물 및 참조 분석물을 공지된 양을 포함하는 대조군 시료로부터 전자 신호를 사용하여 트레이닝된다.In some embodiments, the amount of the first event signal associated with the target analyte and the amount of the second event signal associated with the reference analyte are identified according to a defined threshold. In some embodiments, the method of determining an improved estimate of the true relative abundance of a target analyte in a mixed unknown sample using a nanopore device further comprises a Q-test, a support vector machine, or an expected value maximization algorithm. and optimizing the threshold using an expectation maximization algorithm to increase the accuracy of detection of the reference analyte and/or the target analyte. In some embodiments, the support vector machine is trained using electronic signals from a control sample comprising known amounts of a target analyte and a reference analyte.
일부 실시형태에서, 한정된 역치는 이벤트 기간(event duration), 최대 δG, 중앙값 δG, 평균 δG, 이벤트 신호의 표준 편차, 50 Hz 미만의 이벤트의 노이즈 파워(noise power)의 평균 또는 중앙값, 상기 이벤트 신호에서의 독특한 패턴, 이벤트 면적(area of an event) 또는 이들의 임의의 조합으로 이루어진 군으로부터 선택되는 이벤트 신호의 하나 이상의 특징의 함수이다.In some embodiments, a defined threshold is an event duration, maximum δG, median δG, average δG, standard deviation of the event signal, mean or median noise power of events less than 50 Hz, the event signal is a function of one or more characteristics of the event signal selected from the group consisting of a unique pattern, area of an event, or any combination thereof.
일부 실시형태에서, 검출된 상대 존재비에서 상기 오차를 보정하기 위해 상기 혼합된 미공지 시료 내 상기 제1 이벤트 신호 및 상기 제2 이벤트 신호의 상기 검출된 상대 존재비의 조정은 Q-테스트, 서포트 벡터 머신 또는 기댓값 최대화 알고리즘을 사용하여 수행된다.In some embodiments, adjusting the detected relative abundances of the first event signal and the second event signal in the mixed unknown sample to correct for the error in the detected relative abundance is a Q-test, a support vector machine or using an expected value maximization algorithm.
일부 실시형태에서, 표적 분석물 및 상기 참조 분석물은 각각 폴리뉴클레오타이드를 포함한다. 일부 실시형태에서, 표적 분석물 폴리뉴클레오타이드 및 상기 참조 분석물 폴리뉴클레오타이드는 상이한 길이를 가진다. 일부 실시형태에서, 길이는 적어도 10개 뉴클레오타이드, 적어도 20개 뉴클레오타이드, 적어도 50개 뉴클레오타이드, 적어도 100개 뉴클레오타이드, 적어도 150개 뉴클레오타이드 또는 적어도 200개 뉴클레오타이드만큼 상이하다.In some embodiments, the target analyte and the reference analyte each comprise a polynucleotide. In some embodiments, the target analyte polynucleotide and the reference analyte polynucleotide have different lengths. In some embodiments, the lengths differ by at least 10 nucleotides, at least 20 nucleotides, at least 50 nucleotides, at least 100 nucleotides, at least 150 nucleotides, or at least 200 nucleotides.
일부 실시형태에서, 나노포어 장치를 사용하여 혼합된 미공지 시료 내 표적 분석물의 참 상대 존재비의 개선된 추정치를 결정하는 방법은 추가로 상기 대조군 또는 미공지 시료를 제1 페이로드(payload)에 결합된 제1 프로브와 접촉시키는 단계를 포함하며, 여기서, 상기 제1 프로브는 상기 제1 분석물에 특이적으로 결합되도록 구성된다. 일부 실시형태에서, 나노포어 장치를 사용하여 혼합된 미공지 시료 내 표적 분석물의 참 상대 존재비의 개선된 추정치를 결정하는 방법은 추가로 상기 대조군 또는 미공지 시료를 제2 페이로드에 결합된 제2 프로브와 접촉시키는 단계를 포함하며, 여기서, 상기 제2 프로브는 상기 제2 분석물에 특이적으로 결합되도록 구성된다.In some embodiments, the method of determining an improved estimate of the true relative abundance of a target analyte in a mixed unknown sample using a nanopore device further comprises binding said control or unknown sample to a first payload. contacting the first probe with the first probe, wherein the first probe is configured to specifically bind to the first analyte. In some embodiments, the method of determining an improved estimate of the true relative abundance of a target analyte in a mixed unknown sample using a nanopore device further comprises adding said control or unknown sample to a second second payload bound to a second payload. contacting the probe, wherein the second probe is configured to specifically bind to the second analyte.
일부 실시형태에서, 표적 분석물은 유전자 변형 유기체와 상관관계가 있다. 일부 실시형태에서, 표적 분석물은 환자에서 암의 존재 또는 부재와 연관된 마커를 포함한다.In some embodiments, the target analyte correlates with a genetically modified organism. In some embodiments, the target analyte comprises a marker associated with the presence or absence of cancer in the patient.
또한, 시료 내 표적 분석물의 상대 양을 결정하는 방법이 본원에 제공되며, 상기 방법은 나노포어 시스템에서, 참조 분석물을 포함하지만 표적 분석물은 포함하지 않는 제1 대조군 시료, 표적 분석물을 포함하지만 참조 분석물은 포함하지 않는 제2 대조군 시료, 상기 표적 분석물 및 상기 참조 분석물을 공지된 상대 존재비로 포함하는 제3 대조군 시료, 및 상기 표적 분석물 및 상기 참조 분석물을 미공지된 상대 존재비로 포함하는 실험 시료 각각을 개별적으로 진행시키는 단계; 각각의 시료에 대해 참조 분석물과 연관된 제1 이벤트 신호의 양 및 표적 분석물과 연관된 제2 이벤트 신호의 양을 검출하는 단계; 및 상기 실험 시료 유래의 제1 이벤트 신호 및 제2 이벤트 신호의 상기 양의 상대 존재비를 상기 제1 대조군 시료, 상기 제2 대조군 시료 및 상기 제3 대조군 시료 각각으로부터 유래한 제1 이벤트 신호 및 제2 이벤트 신호의 상기 양의 상대 존재비와 비교하여, 상기 실험 시료 내 상기 참조 분석물 및 상기 표적 분석물의 참 상대 존재비의 추정치를 결정하는 단계를 포함한다.Also provided herein is a method of determining the relative amount of a target analyte in a sample, the method comprising a first control sample comprising a reference analyte but no target analyte, a target analyte, in a nanopore system but a second control sample not comprising a reference analyte, a third control sample comprising the target analyte and the reference analyte in known relative abundances, and the target analyte and the reference analyte in an unknown relative individually running each of the test samples included in abundance; detecting for each sample an amount of a first event signal associated with a reference analyte and an amount of a second event signal associated with a target analyte; and the relative abundances of the amounts of the first event signal and the second event signal from the test sample are the first event signal and the second event signal from each of the first control sample, the second control sample and the third control sample. determining an estimate of the true relative abundance of the reference analyte and the target analyte in the test sample as compared to the relative abundance of the amount of event signal.
일부 실시형태에서, 이벤트 신호는 상기 나노포어를 통한 상기 참조 분석물의 전위에 의해 유도되는 전기 신호를 포함한다.In some embodiments, the event signal comprises an electrical signal induced by the potential of the reference analyte through the nanopore.
일부 실시형태에서, 표적 분석물 및 상기 참조 분석물은 각각 폴리뉴클레오타이드를 포함한다. 일부 실시형태에서, 참조 분석물 및 상기 표적 분석물은 길이에 의해 구별된다.In some embodiments, the target analyte and the reference analyte each comprise a polynucleotide. In some embodiments, the reference analyte and the target analyte are distinguished by a length.
일부 실시형태에서, 참조 분석물 및 상기 표적 분석물은 상기 나노포어 장치에서 상기 참조 분석물과 상기 표적 분석물 사이의 구별을 용이하게 하기 위해 페이로드를 포함하는 서열-특이적 프로브에 각각 결합된다.In some embodiments, the reference analyte and the target analyte are each bound to a sequence-specific probe comprising a payload to facilitate discrimination between the reference analyte and the target analyte in the nanopore device. .
일부 실시형태에서, 상대 존재비는 상기 시료 내 표적 분석물 및 참조 분석물의 총 집단과 비교하여 상기 표적 분석물의 부분량이다.In some embodiments, the relative abundance is the fractional amount of the target analyte compared to the total population of the target analyte and the reference analyte in the sample.
또한, 미공지 시료 내 표적 분석물의 상대 존재비를 결정하는 방법이 본원에 제공되며, 상기 방법은 복수의 참조 분석물 및 복수의 표적 분석물을 포함하는 미공지 시료를 제공하는 단계; 상기 미공지 시료를 제1 챔버와 제2 챔버 사이에 배치된 나노포어를 포함하는 나노포어 장치의 상기 제1 챔버 내로 로딩하는 단계; 상기 나노포어를 가로질러 전압을 인가하여, 상기 참조 분석물 및 상기 표적 분석물을 상기 나노포어를 통해 상기 제1 챔버로부터 상기 제2 챔버로 통과시키는 단계; 상기 나노포어를 통한 상기 참조 분석물의 전위와 연관이 있는 다수의 제1 전기 신호들 각각을 검출하는 단계; 상기 나노포어를 통한 상기 표적 분석물의 전위와 연관이 있는 다수의 제2 전기 신호들 각각을 검출하는 단계; 및 상기 전기 신호 상대 존재비와 연관된 적어도 하나의 오차를 설명하는 참조값을 사용하여, 검출된 제1 전기 신호의 수 및 검출된 제2 전기 신호의 수의 상대 존재비를 상기 미공지 시료 내 상기 표적 분석물의 참 상대 존재비의 추정치로 전환시키는 단계를 포함한다.Also provided herein is a method of determining the relative abundance of a target analyte in an unknown sample, the method comprising: providing an unknown sample comprising a plurality of reference analytes and a plurality of target analytes; loading the unknown sample into the first chamber of a nanopore device including nanopores disposed between the first chamber and the second chamber; applying a voltage across the nanopore to pass the reference analyte and the target analyte through the nanopore from the first chamber to the second chamber; detecting each of a plurality of first electrical signals associated with the potential of the reference analyte through the nanopores; detecting each of a plurality of second electrical signals associated with the potential of the target analyte through the nanopores; and the relative abundance of the number of detected first electrical signals and the number of detected second electrical signals using a reference value describing at least one error associated with the relative abundance of the electrical signal of the target analyte in the unknown sample. converting to an estimate of true relative abundance.
일부 실시형태에서, 참조값은 표적 분석물 및 참조 분석물을 공지된 양으로 포함하는 혼합 대조군 시료로부터 결정된 상기 제1 전기 신호의 분포 분율로부터 결정된다. 일부 실시형태에서, 참조값은 표적 분석물 및 참조 분석물을 공지된 양으로 포함하는 혼합 대조군 시료로부터 결정된 상기 제1 전기 신호의 분포 분율로부터 결정된다. 일부 실시형태에서, 참조값은 표적 분석물 및 참조 분석물을 공지된 양으로 포함하는 혼합 대조군 시료로부터 결정된 상기 제1 전기 신호의 분포 분율로부터 결정된다.In some embodiments, a reference value is determined from a distribution fraction of said first electrical signal determined from a mixed control sample comprising a target analyte and a reference analyte in known amounts. In some embodiments, a reference value is determined from a distribution fraction of said first electrical signal determined from a mixed control sample comprising a target analyte and a reference analyte in known amounts. In some embodiments, a reference value is determined from a distribution fraction of said first electrical signal determined from a mixed control sample comprising a target analyte and a reference analyte in known amounts.
일부 실시형태에서, 혼합 대조군 시료, 상기 표적 대조군 시료 또는 상기 참조 대조군 시료는 상기 미공지 시료로부터 상기 제1 및 제2 전기 신호들의 상기 검출 동안 상기 나노포어 장치에서의 조건과 실질적으로 동일한 조건 하에 상기 나노포어 장치에서 진행된다.In some embodiments, the mixed control sample, the target control sample, or the reference control sample is subjected to substantially the same conditions as in the nanopore device during the detection of the first and second electrical signals from the unknown sample. It proceeds in the nanopore device.
일부 실시형태에서, 나노포어 장치는 장치의 내부 공간을 제1 챔버 및 제2 챔버로 분리하는 막을 포함하며, 여기서, 상기 막은 상기 나노포어를 포함하고, 여기서, 상기 제1 챔버 및 상기 제2 챔버는 상기 나노포어를 통해 유체 소통(fluid communication)하고, 상기 장치는 상기 나노포어를 가로질러 전압을 인가하기 위해 각각의 챔버 내에 전극을 포함한다. 일부 실시형태에서, 전극은 상기 나노포어를 통해 전류를 모니터링하도록 구성된다. 일부 실시형태에서, 전극은 전원 장치(power supply)에 연결된다.In some embodiments, a nanopore device comprises a membrane separating an interior space of the device into a first chamber and a second chamber, wherein the membrane comprises the nanopore, wherein the first chamber and the second chamber is in fluid communication through the nanopores, and the device includes electrodes within each chamber for applying a voltage across the nanopores. In some embodiments, the electrode is configured to monitor a current through the nanopore. In some embodiments, the electrode is connected to a power supply.
일부 실시형태에서, 본원에 제공된 방법은 위양성 또는 위음성 검출 오차, 또는 상기 표적 분석물과 상기 참조 분석물 사이의 포착률 상수 차이를 설명함으로써 혼합된 미공지 시료 내 표적 분석물의 분포 분율의 추정치의 정확도를 개선한다. 일부 실시형태에서, 위양성 표적 분석물 검출 오차를 설명하기 위한 참조-단독 대조군, 위음성 표적 분석물 검출 오차를 설명하기 위한 표적-단독 대조군, 및 표적 분석물과 참조 분석물 사이의 포착률 상수 차이를 설명하기 위한 하나 이상의 혼합 대조군 시료를 포함하는 일련의 대조군들이 분포 분율의 추정치의 정확도를 개선하기 위해 진행(run)된다.In some embodiments, the methods provided herein determine the accuracy of an estimate of the fraction of distribution of a target analyte in a mixed unknown sample by accounting for false positive or false negative detection errors, or differences in capture rate constants between the target analyte and the reference analyte. improve In some embodiments, a reference-only control to account for false-positive target analyte detection error, a target-only control to account for false-negative target analyte detection error, and a difference in capture rate constant between the target analyte and the reference analyte. A series of controls comprising one or more mixed control samples to be run is run to improve the accuracy of the estimate of the fraction of distribution.
일부 실시형태에서, 혼합된 미공지 시료 내 표적 분석물과 참조 분석물 사이의 포착률은 비교적 일관적이며, 따라서, 혼합 대조군이 상대 존재비의 추정치를 개선하는 데 사용될 필요가 없다. 일부 실시형태에서, 혼합된 시료 내 표적 분석물과 참조 분석물 사이의 상대 포착률은 공지되어 있으며, 따라서 혼합 대조군 시료를 진행하는 일 없이 분포 분율의 추정치를 개선하기 위해 이러한 차이를 보상하기 위해 혼합된 미공지 시료 유래의 데이터에 보정항(correction term)이 적용될 수 있다. 일부 실시형태에서, 혼합된 미공지 시료에서와 동일한 표적 분석물 및 참조 분석물 종(species)을 사용하여 실질적으로 동일한 나노포어 조건 하에 진행된 혼합 대조군 시료 유래의 데이터는 혼합 대조군 시료를 이러한 방법의 일부로서 실제로 진행하는 일 없이 분포 분율의 추정치를 개선하는 데 사용된다.In some embodiments, the capture rate between the target analyte and the reference analyte in the mixed unknown sample is relatively consistent, and thus a mixed control need not be used to improve the estimate of relative abundance. In some embodiments, the relative capture rates between the target analyte and the reference analyte in the mixed sample are known and thus mixed to compensate for these differences to improve the estimate of the fraction of distribution without going through the mixed control sample. A correction term may be applied to data from an unknown sample. In some embodiments, data from a mixed control sample run under substantially the same nanopore conditions using the same target analyte and reference analyte species as in the mixed unknown sample is a mixed control sample as part of such a method. is used to improve the estimate of the distribution fraction without actually proceeding as
일부 실시형태에서, 역치값은 혼합된 미공지 시료 유래의 위양성 값이 무시할 만하도록 결정되고, 참조-단독 대조군은 상대 존재비의 추정치를 개선하는 데 사용될 필요가 없다. 일부 실시형태에서, 혼합된 시료 유래의 위양성 값은 공지되어 있으며, 따라서 보정항은 참조-단독 대조군 시료를 진행하는 일 없이 분포 분율의 추정치를 개선하기 위해 위양성 오차를 보상하기 위해 혼합된 미공지 시료 유래의 데이터에 적용될 수 있다. 일부 실시형태에서, 혼합된 미공지 시료에서와 동일한 참조 분석물 종을 사용하여 실질적으로 동일한 나노포어 조건 하에 진행된 참조-단독 대조군 시료 유래의 데이터는 참조-단독 대조군을 이러한 방법의 일부로서 실제로 진행하는 일 없이 분포 분율의 추정치를 개선하는 데 사용된다.In some embodiments, the threshold value is determined such that false positive values from mixed unknown samples are negligible, and a reference-only control need not be used to improve the estimate of relative abundance. In some embodiments, the false positive values from the mixed sample are known, so the correction term is the mixed unknown sample to compensate for false positive errors to improve the estimate of the distribution fraction without going through a reference-only control sample. It can be applied to derived data. In some embodiments, data from a reference-only control sample run under substantially the same nanopore conditions using the same reference analyte species as in the mixed unknown sample is a reference-only control sample that is actually run as part of such a method. It is used to improve the estimate of the distribution fraction without work.
일부 실시형태에서, 역치값은 혼합된 미공지 시료 유래의 위음성 값이 무시할 만하도록 결정되고, 표적-단독 대조군은 상대 존재비의 추정치를 개선하는 데 사용될 필요가 없다. 일부 실시형태에서, 혼합된 시료 유래의 위음성 값은 공지되어 있으며, 따라서 보정항은 표적-단독 대조군 시료를 진행하는 일 없이 분포 분율의 추정치를 개선하기 위해 위음성 오차를 보상하기 위해 혼합된 미공지 시료 유래의 데이터에 적용될 수 있다. 일부 실시형태에서, 혼합된 미공지 시료에서와 동일한 표적 분석물 종을 사용하여 실질적으로 동일한 나노포어 조건 하에 진행된 표적-단독 대조군 시료 유래의 데이터는, 표적-단독 대조군을 이러한 방법의 일부로서 실제로 진행하는 일 없이 분포 분율의 추정치를 개선하는 데 사용된다.In some embodiments, the threshold value is determined such that false negative values from mixed unknown samples are negligible, and target-only controls need not be used to improve the estimate of relative abundance. In some embodiments, the false-negative values from the mixed sample are known, so the correction term is the mixed unknown sample to compensate for false-negative errors to improve the estimate of the distribution fraction without going through a target-only control sample. It can be applied to derived data. In some embodiments, data from a target-only control sample that is run under substantially the same nanopore conditions using the same target analyte species as in the mixed unknown sample is the target-only control actually run as part of such a method. It is used to improve the estimate of the distribution fraction without doing anything.
일부 실시형태에서, 혼합된 시료 내 참조 분석물에 대한 표적 분석물의 상대 존재비의 추정치를 결정하는 방법이 본원에 제공되며, 상기 방법은, 나노포어 장치에 전압을 인가하여, 참조 분석물에 대해 표적 분석물을 공지된 상대 존재비로 포함하는 혼합 대조군 시료, 및 상기 표적 분석물 및 상기 참조 분석물을 포함하는 혼합된 미공지 시료 각각에 대해 개별적으로 나노포어 센서를 통해 하전된 분석물의 전위를 유도하는 단계로서, 여기서, 상기 참조 분석물에 대한 상기 표적 분석물의 상대 존재비가 미공지되어 있는 단계; 각각의 시료에 대해 상기 참조 분석물과 연관된 제1 이벤트 신호의 양 및 표적 분석물과 연관된 제2 이벤트 신호의 양을 검출하는 단계; 및 상기 혼합 대조군 시료 내 상기 제1 이벤트 신호 및 상기 제2 이벤트 신호의 검출된 상대 존재비 및 상기 혼합 대조군 시료 내 상기 참조 분석물에 대한 상기 표적 분석물의 참 상대 존재비를 사용하여 상기 혼합된 미공지 시료로부터 상기 제1 이벤트 신호 및 상기 제2 이벤트 신호의 검출된 상대 존재비를 조정함으로써, 상기 혼합된 미공지 시료 내 상기 참조 분석물에 대한 상기 표적 분석물의 참 상대 존재비의 추정치를 결정하는 단계를 포함한다.In some embodiments, provided herein is a method of determining an estimate of the relative abundance of a target analyte to a reference analyte in a mixed sample, the method comprising: applying a voltage to a nanopore device to determine a target relative to a reference analyte Inducing the potential of a charged analyte through a nanopore sensor for each of a mixed control sample comprising an analyte in a known relative abundance, and a mixed unknown sample comprising the target analyte and the reference analyte, respectively. a step wherein the relative abundance of said target analyte to said reference analyte is unknown; detecting, for each sample, an amount of a first event signal associated with the reference analyte and an amount of a second event signal associated with a target analyte; and the detected relative abundances of the first event signal and the second event signal in the mixed control sample and the true relative abundance of the target analyte to the reference analyte in the mixed control sample. determining an estimate of the true relative abundance of the target analyte to the reference analyte in the mixed unknown sample by adjusting the detected relative abundances of the first event signal and the second event signal from .
일부 실시형태에서, 혼합된 시료 내 참조 분석물에 대한 표적 분석물의 상대 존재비의 추정치의 결정 방법이 본원에 제공되며, 상기 방법은, 나노포어 장치에 전압을 인가하여, 참조 분석물이 아니라 표적 분석물을 포함하는 표적 대조군 시료, 표적 분석물이 아니라 참조 분석물을 포함하는 참조 대조군 시료, 및 상기 표적 분석물 및 상기 참조 분석물을 포함하는 혼합된 미공지 시료 각각에 대해 개별적으로 나노포어 센서를 통해 하전된 분석물의 전위를 유도하는 단계로서, 여기서, 상기 참조 분석물에 대한 상기 표적 분석물의 상대 존재비가 미공지되어 있는 단계; 각각의 시료에 대해 상기 참조 분석물과 연관된 제1 이벤트 신호의 양 및 표적 분석물과 연관된 제2 이벤트 신호의 양을 검출하는 단계; 및 상기 표적 대조군 시료 및 상기 참조 대조군 시료 내 상기 제1 이벤트 신호 및 상기 제2 이벤트 신호의 검출된 상대 존재비를 사용하여 상기 혼합된 미공지 시료 내 상기 제1 이벤트 신호 및 상기 제2 이벤트 신호의 검출된 상대 존재비를 조정함으로써, 상기 혼합된 미공지 시료 내 상기 참조 분석물에 대한 상기 표적 분석물의 참 상대 존재비의 추정치를 결정하는 단계를 포함한다. 일부 실시형태에서, 표적 대조군 시료는 상기 혼합된 미공지 시료 유래의 표적 분석물의 위음성 검출에 대한 보정항을 제공한다. 일부 실시형태에서, 참조 대조군 시료는 상기 혼합된 미공지 시료 내 표적 분석물의 위양성 검출에 대한 보정항을 제공한다.In some embodiments, provided herein is a method of determining an estimate of the relative abundance of a target analyte to a reference analyte in a mixed sample, the method comprising applying a voltage to the nanopore device to analyze the target but not the reference analyte Nanopore sensors were individually applied to each of the target control sample comprising water, the reference control sample comprising a reference analyte but not the target analyte, and the mixed unknown sample comprising the target analyte and the reference analyte. inducing a translocation of a charged analyte through the method, wherein the relative abundance of the target analyte to the reference analyte is unknown; detecting, for each sample, an amount of a first event signal associated with the reference analyte and an amount of a second event signal associated with a target analyte; and detecting the first event signal and the second event signal in the mixed unknown sample using the detected relative abundances of the first event signal and the second event signal in the target control sample and the reference control sample. determining an estimate of the true relative abundance of the target analyte to the reference analyte in the mixed unknown sample by adjusting the relative abundance. In some embodiments, the target control sample provides a correction term for false-negative detection of the target analyte from the mixed unknown sample. In some embodiments, the reference control sample provides a correction term for false-positive detection of the target analyte in the mixed unknown sample.
일부 실시형태에서, 혼합된 시료 내 참조 분석물에 대한 표적 분석물의 상대 존재비의 추정치의 결정 방법이 본원에 제공되며, 상기 방법은, 나노포어 장치에 전압을 인가하여, 참조 분석물에 대해 표적 분석물을 공지된 상대 존재비로 포함하는 혼합 대조군 시료, 참조 분석물이 아니라 표적 분석물을 포함하는 표적 대조군 시료, 표적 분석물이 아니라 참조 분석물을 포함하는 참조 대조군 시료, 및 상기 표적 분석물 및 상기 참조 분석물을 포함하는 혼합된 미공지 시료 각각에 대해 개별적으로 나노포어 센서를 통해 하전된 분석물의 전위를 유도하는 단계로서, 여기서, 상기 참조 분석물에 대한 상기 표적 분석물의 상대 존재비가 미공지되어 있는 단계; 각각의 시료에 대해 상기 참조 분석물과 연관된 제1 이벤트 신호의 양 및 표적 분석물과 연관된 제2 이벤트 신호의 양을 검출하는 단계; 상기 표적 대조군 시료 및 상기 참조 대조군 시료 내 상기 제1 이벤트 신호 및 상기 제2 이벤트 신호의 검출된 상대 존재비, 및 상기 혼합 대조군 시료 내 상기 제1 이벤트 신호 및 상기 제2 이벤트 신호의 검출된 상대 존재비 및 상기 혼합 대조군 시료 내 상기 참조 분석물에 대한 상기 표적 분석물의 참 상대 존재비를 사용하여 상기 혼합된 미공지 시료로부터 상기 제1 이벤트 신호 및 상기 제2 이벤트 신호의 검출된 상대 존재비를 조정함으로써, 상기 혼합된 미공지 시료 내 상기 참조 분석물에 대한 상기 표적 분석물의 참 상대 존재비의 추정치를 결정하는 단계를 포함한다.In some embodiments, provided herein is a method of determining an estimate of the relative abundance of a target analyte to a reference analyte in a mixed sample, the method comprising: applying a voltage to a nanopore device to assay a target for a reference analyte A mixed control sample comprising a known relative abundance of water, a target control sample comprising a target analyte but not a reference analyte, a reference control sample comprising a reference analyte but not a target analyte, and the target analyte and the inducing a potential of a charged analyte through a nanopore sensor individually for each of a mixed unknown sample comprising a reference analyte, wherein the relative abundance of the target analyte to the reference analyte is unknown; step in; detecting, for each sample, an amount of a first event signal associated with the reference analyte and an amount of a second event signal associated with a target analyte; the detected relative abundances of the first event signal and the second event signal in the target control sample and the reference control sample, and the detected relative abundances of the first event signal and the second event signal in the mixed control sample, and adjusting the detected relative abundances of the first event signal and the second event signal from the mixed unknown sample using the true relative abundance of the target analyte to the reference analyte in the mixed control sample; determining an estimate of the true relative abundance of the target analyte to the reference analyte in the unknown sample.
일부 실시형태에서, 혼합된 시료 내 참조 분석물에 대한 표적 분석물의 상대 존재비의 추정치의 결정 방법은 추가로 나노포어 장치에 전압을 인가하여, 상기 참조 분석물이 아니라 상기 표적 분석물을 포함하는 표적 대조군 시료에 대해 나노포어 센서를 통해 하전된 분석물의 전위를 유도하는 단계를 포함한다.In some embodiments, the method of determining an estimate of the relative abundance of a target analyte to a reference analyte in a mixed sample further comprises applying a voltage to the nanopore device, such that a target comprising the target analyte but not the reference analyte inducing a potential of the charged analyte through the nanopore sensor with respect to the control sample.
일부 실시형태에서, 혼합된 시료 내 참조 분석물에 대한 표적 분석물의 상대 존재비의 추정치의 결정 방법은 추가로 나노포어 장치에 전압을 인가하여, 상기 표적 분석물이 아니라 상기 참조 분석물을 포함하는 참조 대조군 시료에 대해 나노포어 센서를 통해 하전된 분석물의 전위를 유도하는 단계를 포함한다. 일부 실시형태에서, 상기 혼합된 미공지 시료 내 상기 참조 분석물에 대한 상기 표적 분석물의 참 상대 존재비의 상기 추정치의 결정 단계는, 상기 표적 대조군 시료, 상기 참조 대조군 시료 및 상기 혼합 대조군 시료 내 상기 제1 이벤트 신호 및 상기 제2 이벤트 신호의 검출된 상대 존재비, 및 상기 혼합 대조군 시료 내 상기 참조 분석물에 대한 상기 표적 분석물의 참 상대 존재비를 사용하여 상기 혼합된 미공지 시료 내 상기 제1 이벤트 신호 및 상기 제2 이벤트 신호의 검출된 상대 존재비를 조정하는 단계를 포함한다.In some embodiments, the method of determining an estimate of the relative abundance of a target analyte to a reference analyte in a mixed sample further comprises applying a voltage to the nanopore device, the reference comprising the reference analyte and not the target analyte. inducing a potential of the charged analyte through the nanopore sensor with respect to the control sample. In some embodiments, determining the estimate of the true relative abundance of the target analyte to the reference analyte in the mixed unknown sample comprises: the target control sample, the reference control sample and the second agent in the mixed control sample. the first event signal in the mixed unknown sample using the detected relative abundances of one event signal and the second event signal, and the true relative abundance of the target analyte to the reference analyte in the mixed control sample; and adjusting the detected relative abundance of the second event signal.
일부 실시형태에서, 혼합 대조군 시료는 상기 혼합된 미공지 시료와 비교하여 1.2배 이하, 1.5배 이하, 2배 이하, 5배 이하 또는 10배 이하만큼 상이한 상기 참조 분석물에 대한 상기 표적 분석물의 상대 존재비를 포함한다.In some embodiments, the mixed control sample comprises a relative of the target analyte to the reference analyte that differs by no more than 1.2 fold, no more than 1.5 fold, no more than 2 fold, no more than 5 fold, or no more than 10 fold compared to the mixed unknown sample. includes existence.
일부 실시형태에서, 상대 존재비는 표적 분석물 : 참조 분석물의 비율을 포함한다. 일부 실시형태에서, 상기 혼합된 미공지 시료 내 상기 참조 분석물에 대한 상기 표적 분석물의 참비율(R*혼합)의 추정치는R*혼합=ρα에 의해 결정되며, 여기서, 파라미터 ρ는 위양성 검출 오차, 위음성 검출 오차 또는 둘 다를 보상할 수 있는 비율에 대한 추정치이고, 파라미터 α는 상기 표적 분석물과 상기 참조 분석물 사이의 포착률 상수 차이를 보상하는 데 사용될 수 있다. 일부 실시형태에서, 파라미터 α는 참조 분석물 포착률을 표적 분석물 포착률로 나눈 비율의 추정치이다.In some embodiments, the relative abundance comprises a ratio of target analyte to reference analyte. In some embodiments, the estimate of the true ratio of the target analyte to the reference analyte (R*mix ) in themixedunknown sampleis determined by R* mix = pα , wherein the parameter p is the false positive detection error , an estimate for a rate that can compensate for false-negative detection error or both, and the parameter α can be used to compensate for differences in acquisition rate constants between the target analyte and the reference analyte. In some embodiments, the parameter α is an estimate of the ratio of reference analyte capture divided by target analyte capture.
일부 실시형태에서, 상대 존재비는 상기 표적 분석물 및 상기 참조 분석물의 집단에서 상기 표적 분석물의 분율을 포함한다. 일부 실시형태에서, 상기 혼합된 미공지 시료 내 상기 참조 분석물 및 상기 표적 분석물의 집단에서 상기 표적 분석물의 참분율의 추정치(F*혼합)는
일부 실시형태에서, 표적 분석물 및 참조 분석물을 공지된 상대 존재비로 포함하는 대조군 시료; 및 상기 대조군 시료, 및 상기 참조 분석물 및 상기 표적 분석물을 포함하는 미공지 시료를 나노포어 장치에서 진행(run)시켜, 상기 미공지 시료 내 상기 참조 분석물 및 상기 표적 분석물의 상대 존재비를 결정하는 데 사용하기 위한 설명서를 포함하는 키트가 본원에 제공된다.In some embodiments, a control sample comprising a target analyte and a reference analyte in known relative abundances; and running the control sample and an unknown sample including the reference analyte and the target analyte in a nanopore device to determine the relative abundance of the reference analyte and the target analyte in the unknown sample Provided herein are kits comprising instructions for use in
일부 실시형태에서, 표적 분석물을 포함하는 제1 대조군 시료로서, 상기 제1 대조군 시료는 참조 분석물을 함유하지 않는, 제1 대조군 시료; 상기 참조 분석물을 포함하는 제2 대조군 시료, 상기 제2 대조군 시료는 상기 표적 분석물을 함유하지 않는, 제2 대조군 시료; 상기 표적 분석물 및 상기 참조 분석물을 공지된 상대 존재비로 포함하는 제3 대조군 시료; 및 상기 제1 대조군 시료, 상기 제2 대조군 시료, 상기 제3 대조군 시료, 및 상기 참조 분석물 및 상기 표적 분석물을 포함하는 미공지 시료를 나노포어 장치에서 개별적으로 진행시켜, 상기 미공지 시료 내 상기 참조 분석물 및 상기 표적 분석물의 상대 존재비를 결정하는 데 사용하기 위한 설명서를 포함하는 키트가 본원에 제공된다.In some embodiments, a first control sample comprising a target analyte, wherein the first control sample does not contain a reference analyte; a second control sample comprising the reference analyte, the second control sample not containing the target analyte; a third control sample comprising the target analyte and the reference analyte in a known relative abundance; and separately processing the first control sample, the second control sample, the third control sample, and the unknown sample including the reference analyte and the target analyte in the nanopore device, Provided herein are kits comprising instructions for use in determining the relative abundance of the reference analyte and the target analyte.
일부 실시형태에서, 시료 내 표적 분석물의 참 분포 분율의 추정치를 결정하기 위한 컴퓨터-실행 방법이 본원에 제공되며, 상기 방법은 참조 분석물 대조군 또는 표적 분석물 대조군 중 적어도 하나로부터 유래된 데이터를 나노포어 센서로부터 수득하는 단계로서, 여기서, 상기 데이터는 상기 나노포어를 통해 전위하는 표적 분석물 또는 참조 분석물 유래의 복수의 이벤트 신호들을 포함하는 단계; 표적 분석물과 상관관계가 있는 것들 및 참조 분석물과 상관관계가 있는 것들을 구별하기 위해 이벤트 신호의 하나 이상의 특징을 식별하는 단계; 최적화된 역치를 식별하여 상기 제1 이벤트를 상기 제2 이벤트로부터 구분하고 시료 내 상기 참조 분석물 및 상기 표적 분석물의 참 상대 존재비의 추정치를 발생시키기 위해 상기 서포트 벡터 머신을 트레이닝하는 단계로서, 여기서, 상기 트레이닝은 참조 대조군 시료, 표적 대조군 시료 및 혼합 대조군 시료로 이루어진 군으로부터 선택되는 대조군의 사용을 포함하고, 트레이닝은 공지된 혼합된 시료를 사용하는 입증을 포함하는 단계; 및 상기 트레이닝된 서포트 벡터를 사용하여, 혼합된 시료로부터 나노포어 장치 상에 기록된 이벤트로부터 시료 내 표적 분석물의 분포 분율을 결정하는 단계를 포함한다.In some embodiments, provided herein is a computer-implemented method for determining an estimate of the fraction of true distribution of a target analyte in a sample, the method comprising: analyzing data derived from at least one of a reference analyte control or a target analyte control; obtaining from a pore sensor, wherein the data comprises a plurality of event signals from a target analyte or a reference analyte translocating through the nanopore; identifying one or more characteristics of the event signal to distinguish those correlated with a target analyte and those correlated with a reference analyte; training the support vector machine to identify an optimized threshold to distinguish the first event from the second event and to generate an estimate of the true relative abundance of the reference analyte and the target analyte in a sample, wherein: wherein the training comprises use of a control selected from the group consisting of a reference control sample, a target control sample and a mixed control sample, wherein the training comprises demonstrating using a known mixed sample; and determining a distribution fraction of a target analyte in the sample from events recorded on the nanopore device from the mixed sample, using the trained support vector.
일부 실시형태에서, 시료 내 표적 분석물의 참 분포 분율의 추정치를 결정하기 위한 컴퓨터-실행 방법이 본원에 제공되며, 상기 방법은 나노포어 장치로부터 데이터 세트를 수득하는 단계로서, 상기 데이터는 적어도 하나의 대조군 시료 및 적어도 하나의 미공지 시료 유래의 이벤트 신호를 포함하는 단계; 상기 참조 분석물과 상관관계가 있는 제2 이벤트 신호로부터 상기 표적 분석물과 상관관계가 있는 제1 이벤트 신호를 구분하기 위해 역치를 발생시키는 데 사용되는 특징 세트를 식별하는 단계; 및 트레이닝된 서포트 벡터 머신을 사용하여 상기 미공지 시료 내 분포 분율의 참값을 추정하는 단계를 포함한다.In some embodiments, provided herein is a computer-implemented method for determining an estimate of a true distribution fraction of a target analyte in a sample, the method comprising: obtaining a data set from a nanopore device, the data comprising at least one including event signals from a control sample and at least one unknown sample; identifying a feature set used to generate a threshold to distinguish a first event signal correlated with the target analyte from a second event signal correlated with the reference analyte; and estimating the true value of the distribution fraction in the unknown sample using a trained support vector machine.
상기 내용 및 다른 목적, 특징 및 이점들은 첨부된 도면에 예시된 바와 같이 본 발명의 특정한 실시형태의 하기 설명으로부터 명확해질 것이며, 도면에서 유사한 참조 특질은 상이한 도면들 전체에서 동일한 부분(part)을 지칭한다. 도면은 본질적으로 축척대로 되어 있지 않으며, 그 대신에 본 발명의 다양한 실시형태들의 원리를 예시할 때 강조되어 있다.
도 1a는 나노포어를 통과하는 dsDNA에 의해 유발된 단일-분자 이벤트의 전형적인 전자 신호를 보여주며, 이는 전위의 특징적인 기간이고 전위 동안 전류가 감소한다.
도 1b는 22 nm 직경 나노포어에 기록된 5.6 kb dsDNA에 대한 최대 δG 대 기간의 모든-이벤트 산점도를 보여준다.
도 2a는 727 bp DNA가 1 M LiCl 내 100 mV에서 25 nm 직경 고체상 나노포어를 통과할 때의 전형적인 이벤트를 보여준다. 벤트 영역(vent area)은 음영 처리되어 있다.
도 2b는 dsDNA 길이가 증가함에 따라 이벤트 기간의 증가를 보여주며, 한편, 이벤트 깊이는 보존된다.
도 2c는 나타난 각 길이에서 dsDNA에 대해 기록된 모든 이벤트들의 영역의 log10의 분포도를 보여준다.
도 3a는 유형 1 분석물(사각형) 유래 이벤트와 유형 2 분석물(원형) 유래 이벤트 사이에서 발생된 역치의 일례를 도시한 것이다.
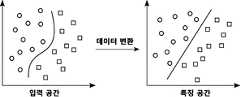
도 3b는 유형 1 분석물(사각형) 유래의 이벤트와 유형 2 분석물(원형) 유래 이벤트 사이에서 선형 역치의 정확도를 증가시키기 위해, 입력 특징들을 고차원 공간으로 변환시킨 결과의 일례를 보여준다.
도 4a는 참조 분석물 시료, 표적 분석물 시료 및 혼합된 시료 유래의 모든 이벤트들에 대한 확률 히스토그램을 이벤트 면적에 따라 보여준다.
도 4b는 참조 분석물 단독(Q참조), 표적 분석물 단독(Q표적) 및 표적 분석물과 참조 분석물의 혼합된 시료(Q혼합) 유래의 영역 역치 아래의 이벤트의 백분율에 대한 그래프를 도시한 것이다.
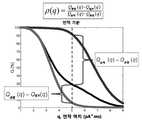
도 4c는 어떻게 부분량 파라미터ρ(q)가q 값에서 그래프적으로 나타나는지 보여준다.q = 5 pA*ms 역치(수직 파선)는 0.05의 위양성(즉,Q참조 = 0.05) 및 0.1의 위음성(즉,Q표적 = 0.9)에 상응한다.
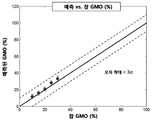
도 5a는 표적 유전자의 상대 존재비의 추정치의 결정 결과를 보여준다(GMO(%)(R*혼합) 대 표적 유전자의 참 상대 존재비(GMO(%)). 제로-오차 라인(기울기 = 1)보다 높고 낮은 10% 오차 경계(margin)가 비교를 위해 나타나 있다.
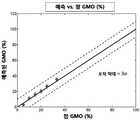
도 5b는 2개의 단리된 대조군들 및 6개의 공지된 혼합물들을 사용하여, 시료 내 유전자 변형 유기체의 참 상대 존재비의 추정치를 결정한 결과를 보여준다. 예측된 표적 존재비 백분율의 값들은 참 표적 존재비 백분율과 비교하여 도시되었다. 제로-오차 라인(기울기 = 1)보다 높고 낮은 10% 오차 경계가 비교를 위해 나타나 있다.
도 6은 이벤트 면적에 따라 참조 분석물로부터 표적 분석물을 구분하기 위한 역치 범위에 걸친 표적 분석물 존재비(GMO (%))의 추정치의 결과를 보여준다.
도 7은 표적 분석물 및 참조 분석물 유래의 이벤트 신호를 구분하기 위한 최적의 파라미터를 이용하여 트레이닝된 서포트 벡터 머신으로부터의 시험 데이터 세트에 걸친 정확도의 예측을 보여준다.
도 8은 동일한 포어 상에서 단리된 대조군으로서 순차적으로 진행된 2개의 분자 유형들(프로브/페이로드에 결합된 94 bp 표적 dsDNA 및 프로브/페이로드에 결합된 74 bp 참조 dsDNA)에 대한 이벤트 플롯을 보여준다.
도 9a는 오버레이된(overlaid) 100% 표적 분석물 대조군 시료(닫힌 원형) 및 100% 참조 분석물 대조군 시료(열린 사각형)에 대한 평균 δG 대 기간의 대표적인 이벤트 플롯을 보여준다. 표적 분석물은 3-분지(branch) PEG에 연결된 G12D-결합된 프로브(G12D-3bPEG로 지칭됨)가 있는 89 bp DNA다. 참조 분석물은 8-arm(-arm) PEG에 연결된 야생형 (c.35G)-결합된 프로브(WT-8-armPEG로 지칭됨)가 있는 89 bp DNA다. 나노포어를 통과하는 표적 분석물로부터 이벤트 신호를 식별하기 위한 역치(q1 = 1 msec, q2 = 0.4 nS 및 q3 = 0.65 nS)는 표적 태깅 박스(tagging box)(파선)를 생성한다.
도 9b는 도 9a 유래의 플롯을 보여주며, 이때 표적 분석물 및 참조 분석물을 포함하는 공지 시료 A(삼각형) 및 시료 B(별모양) 유래 데이터는 이러한 플롯 상에 오버레이된다.
도 10은 오버레이된 100% 표적 분석물 대조군 시료(닫힌 원형) 및 100% 참조 분석물 대조군 시료(열린 사각형)에 대한 평균 δG 대 기간의 대표적인 이벤트 플롯을 보여준다. 표적 분석물을 참조 분석물로부터 구분하기 위한 서포트 벡터 머신-식별된 결정 경계선(decision boundary)(즉, 역치)이 또한 플롯화되어 있다.
도 11은 최대 δG 대 기간의 모든-이벤트 산점도 상에서 플롯화된 50% 표적 / 50% 참조 혼합 시료로부터의 이벤트를 보여준다. 표적 도메인 박스는 프로브-결합된 돌연변이체 표적과 연관된 이벤트를 포함한다.
도 12는 표적(돌연변이체) 및 참조(야생형) 집단의 식별을 위한, 도 11에 도시된 50% 표적 / 50% 참조 혼합 시료 유래의 데이터에, 3-가우시안 혼합 모델을 사용하여 가우시안 혼합에 대한 기댓값 최대화 알고리즘(EMGM)을 적용한 결과를 보여준다.
도 13은 위양성 분율을 구축하기 위해 참조-단독 대조군 시료 유래의 데이터에 3-가우시안 혼합 모델을 사용하여 EMGM을 적용한 결과를 보여준다.
도 14는 미공지 시료 내 돌연변이체(표적) 분자의 상대 존재비를 식별하기 위해, 혼합된 미공지 시료 유래의 데이터에 3-가우시안 혼합 모델을 사용하여 EMGM을 적용한 결과를 보여준다.The foregoing and other objects, features and advantages will become apparent from the following description of specific embodiments of the present invention as illustrated in the accompanying drawings, in which like reference features refer to the same part throughout the different drawings. do. The drawings are not necessarily to scale, emphasis instead being placed upon illustrating the principles of various embodiments of the invention.
1A shows a typical electronic signal of a single-molecule event induced by a dsDNA passing through a nanopore, which is a characteristic period of translocation, during which the current decreases.
1B shows an all-event scatter plot of maximum δG versus duration for a 5.6 kb dsDNA recorded in 22 nm diameter nanopores.
Figure 2a shows typical events when 727 bp DNA passes through 25 nm diameter solid-phase nanopores at 100 mV in 1 M LiCl. The vent area is shaded.
Figure 2b shows an increase in event duration with increasing dsDNA length, while event depth is conserved.
Figure 2c shows the distributionof log 10 of the area of all events recorded for dsDNA at each length shown.
3A depicts an example of a threshold generated between a
3B shows an example of the result of transforming the input features into a high-dimensional space to increase the accuracy of the linear threshold between events from
4A shows probability histograms for all events from a reference analyte sample, a target analyte sample, and a mixed sample according to event area.
4B depicts a graph of the percentage of events below the area threshold from reference analyte alone (seeQ ), target analyte alone (Qtarget ), and a mixed sample of target analyte and reference analyte (Qmix). will be.
Figure 4c shows how the partial quantity parameterρ(q) is graphically represented at theq value.A q = 5 pA*ms threshold (vertical dashed line) corresponds to a false positive of 0.05 (ie,Qreference = 0.05) and a false negative of 0.1 (ie,Qtarget = 0.9).
Figure 5a shows the results of determination of the estimate of the relative abundance of the target gene (GMO (%) (R*mixed ) versus the true relative abundance (GMO (%)) of the target gene. It is higher than the zero-error line (slope = 1). A low 10% margin of error is shown for comparison.
5B shows the results of determining an estimate of the true relative abundance of genetically modified organisms in a sample using two isolated controls and six known mixtures. Values of predicted target abundance percentages are plotted compared to true target abundance percentages. The 10% error boundary above and below the zero-error line (slope = 1) is shown for comparison.
6 shows the results of estimates of target analyte abundance (GMO (%)) over a range of thresholds for differentiating target analytes from reference analytes according to event area.
7 shows prediction of accuracy across test data sets from a trained support vector machine using optimal parameters for discriminating event signals from target analytes and reference analytes.
8 shows an event plot for two molecular types (94 bp target dsDNA bound to probe/payload and 74 bp reference dsDNA bound to probe/payload) as controls isolated on the same pore.
9A shows representative event plots of mean δG versus duration for an overlaid 100% target analyte control sample (closed circles) and a 100% reference analyte control sample (open squares). The target analyte is 89 bp DNA with a G12D-conjugated probe (referred to as G12D-3bPEG) linked to a 3-branch PEG. The reference analyte is 89 bp DNA with a wild-type (c.35G)-bound probe (referred to as WT-8-armPEG) linked to an 8-arm (-arm) PEG.Thresholds (q 1 = 1 msec, q2 = 0.4 nS and q3 = 0.65 nS) for identifying event signals from target analytes that pass through the nanopores create target tagging boxes (dashed lines).
FIG. 9B shows a plot from FIG. 9A , wherein data from known Sample A (triangles) and Sample B (stars), including target analytes and reference analytes, are overlaid on these plots.
10 shows representative event plots of mean δG versus duration for an overlaid 100% target analyte control sample (closed circles) and a 100% reference analyte control sample (open squares). A support vector machine-identified decision boundary (ie, threshold) for differentiating the target analyte from the reference analyte is also plotted.
11 shows events from a 50% target / 50% reference mix sample plotted on an all-event scatterplot of maximum δG versus duration. The target domain box contains events associated with the probe-bound mutant target.
12 is a data from the 50% target / 50% reference mixed sample shown in FIG. 11, for identification of target (mutant) and reference (wild-type) populations, for Gaussian mixing using a 3-Gaussian mixture model. The result of applying the expected value maximization algorithm (EMGM) is shown.
13 shows the results of applying EMGM using a 3-Gaussian mixture model to data from a reference-only control sample to establish a false positive fraction.
14 shows the results of applying EMGM to data from a mixed unknown sample using a 3-Gaussian mixing model to identify the relative abundance of mutant (target) molecules in the unknown sample.
본 발명의 다양한 실시형태들의 상세한 사항들은 하기 설명에 나타나 있다. 본 발명의 다른 특징, 목적 및 이점들은 상세한 설명 및 도면, 및 청구항으로부터 명확해질 것이다.The details of various embodiments of the invention are set forth in the description below. Other features, objects and advantages of the present invention will become apparent from the detailed description and drawings, and from the claims.
정의Justice
본 출원 전체에서, 문맥은 본 영양소, 조성물 및 방법의 다양한 실시형태들을 지칭한다. 기재된 다양한 실시형태들은 여러 가지 예시적인 예들을 제공하는 것으로 의미되고, 대안적인 종의 설명으로서 간주되어서는 안 된다. 그보다는, 본원에 제공된 다양한 실시형태들의 설명은 중복되는 범위일 수 있음을 주지해야 한다. 본원에서 고찰된 실시형태는 단지 예시적이고, 본 발명의 범위를 제한하려는 의미가 아니다.Throughout this application, context refers to various embodiments of the present nutrients, compositions, and methods. The various embodiments described are meant to provide several illustrative examples, and should not be considered as alternative species descriptions. Rather, it should be noted that the descriptions of the various embodiments provided herein may be in overlapping scope. The embodiments contemplated herein are illustrative only and are not meant to limit the scope of the invention.
또한, 본 개시내용 전체에서, 다양한 공개, 특허 및 공개된 특허 명세서들은 식별 인용에 의해 참조된다. 이들 공개, 특허 및 공개된 특허 명세서들의 개시내용은, 본 발명이 속한 당업계를 보다 완전히 기재하기 위해 본 개시내용에 참조로서 포함된다.Also, throughout this disclosure, various publications, patents, and published patent specifications are referenced by identification citation. The disclosures of these publications, patents, and published patent specifications are incorporated herein by reference in order to more fully describe the art to which this invention pertains.
본 명세서 및 청구항에 사용된 바와 같이, 단수형("a," "an" 및 "the")은 문맥상 명확하게 다르게 가리키지 않는 한 복수형을 포함한다. 예를 들어, 용어 "일(an) 전극"은 이들의 혼합물을 포함하여 복수의 전극들을 포함한다.As used herein and in the claims, the singular forms "a," "an" and "the" include the plural unless the context clearly dictates otherwise. For example, the term “an electrode” includes a plurality of electrodes, including mixtures thereof.
본원에 사용된 바와 같이, 용어 "포함하는"은, 장치 및 방법이 언급된 구성성분들 또는 단계들을 포함하지만 다른 것들을 배제하지 않음을 의미하고자 한다.As used herein, the term “comprising” is intended to mean that the apparatus and method include the recited components or steps but do not exclude others.
"필수적으로 ~로 구성된"은 장치 및 방법을 정의하는 데 사용되는 경우, 조합에 임의의 필수적인 유의성의 다른 구성성분 또는 단계들을 배제함을 의미해야 한다. "~로 구성된"은 다른 구성성분 또는 단계를 배제함을 의미해야 한다. 이들 각각의 과도기 용어(transition term)에 의해 정의된 실시형태는 본 발명의 범위 내에 포함된다."Consisting essentially of," when used to define an apparatus and method, shall mean excluding other components or steps of any essential significance to the combination. "Consisting of" shall mean excluding other components or steps. Embodiments defined by each of these transition terms are included within the scope of the present invention.
모든 수명칭(numerical designation)들, 예를 들어 거리, 크기, 온도, 시간, 전압 및 농도는 범위를 포함하여, 파라미터의 측정에서 일상적인 실험적 변화를 포함하고자 하는 근사치이며, 이러한 변화는 기재된 실시형태의 범위 내에 포함되고자 한다. 항상 명쾌하게 언급되지는 않지만, 모든 수명칭들 앞에는 용어 "약"이 선행되는 것으로 이해된다. 또한, 항상 명쾌하게 언급되지는 않지만, 본원에 기재된 구성성분은 단지 예시적이고, 이의 등가물은 당업게에 공지되어 있는 것으로 이해된다.All numerical designations, e.g., distance, size, temperature, time, voltage, and concentration, are approximations intended to include routine experimental changes in the measurement of parameters, including ranges, and such changes are subject to the described embodiments. to be included within the scope of Although not always explicitly stated, it is understood that the term “about” is preceded by all life designations. Also, although not always explicitly stated, it is to be understood that the components described herein are exemplary only, and equivalents thereof are known in the art.
본원에 사용된 바와 같이 용어 "분석물(analyte)"은 임의의 분자, 화합물, 복합체 또는 다른 엔터티(entity)를 지칭하며, 이의 존재는 포어 내 분석물의 상대 존재비의 결정을 용이하게 하기 위해 나노포어 센서를 사용하여 검출될 수 있다. 표적 또는 참조 분석물을 지칭할 때, 용어 표적 또는 참조 분자는 상호교환적으로 사용될 수 있다.As used herein, the term “analyte” refers to any molecule, compound, complex or other entity, the presence of which is present in the nanopore to facilitate determination of the relative abundance of the analyte in the pore. It can be detected using a sensor. When referring to a target or reference analyte, the terms target or reference molecule may be used interchangeably.
본원에 사용된 바와 같이, 용어 "표적 분석물"은 시료 내 관심 분자 또는 복합체를 지칭한다. 일부 실시형태에서, 표적 분석물은 관심 핵산의 서열을 갖는 폴리뉴클레오타이드의 일부를 포함한다. 표적 분석물은, 본원에 기재된 바와 같이 나노포어 센서에서 표적 분석물의 검출을 용이하게 하기 위해 프로브에 의한 결합을 위해 특이적으로 표적화될 수 있다.As used herein, the term “target analyte” refers to a molecule or complex of interest in a sample. In some embodiments, the target analyte comprises a portion of a polynucleotide having a sequence of a nucleic acid of interest. A target analyte can be specifically targeted for binding by a probe to facilitate detection of the target analyte in a nanopore sensor as described herein.
본원에 사용된 바와 같이, 용어 "참조 분석물"은 시료 내 관심 분자 또는 복합체를 지칭하며, 이의 존재비는 표적 분석물에 대한 정량화의 상대 측정치로서 사용된다. 일부 실시형태에서, 참조 분석물은 관심 핵산의 서열을 갖는 폴리뉴클레오타이드의 일부를 포함한다. 참조 분석물은, 본원에 기재된 바와 같이 나노포어 센서에서 표적 분석물의 검출을 용이하게 하기 위해 프로브에 의한 결합을 위해 특이적으로 표적화될 수 있다.As used herein, the term “reference analyte” refers to a molecule or complex of interest in a sample, the abundance of which is used as a relative measure of quantification to a target analyte. In some embodiments, a reference analyte comprises a portion of a polynucleotide having a sequence of a nucleic acid of interest. A reference analyte can be specifically targeted for binding by a probe to facilitate detection of the target analyte in the nanopore sensor as described herein.
본원에 사용된 바와 같이, 용어 "특이적인 결합" 또는 "특이적으로 결합하다"는 표적 분석물 또는 참조 분석물에 대한 프로브의 표적화된 결합을 지칭한다.As used herein, the term “specific binding” or “specifically binds” refers to the targeted binding of a probe to a target analyte or reference analyte.
본원에 사용된 바와 같이, 용어 "프로브"는 표적 분석물 또는 이의 단편에 특이적으로 결합하는 분자를 지칭한다. 일부 실시형태에서, 프로브는 프로브-페이로드 분자 또는 복합체에 결합된 표적 또는 참조 분석물을 포함하는 복합체의 전위 시 발생되는 전자 신호에 영향을 주도록 구성된 페이로드 분자를 포함한다. 일부 실시형태에서, 프로브는 페이로드 분자에 결합하도록 적응된 페이로드 분자 결합 모이어티(moiety)를 포함한다.As used herein, the term “probe” refers to a molecule that specifically binds to a target analyte or fragment thereof. In some embodiments, a probe comprises a probe-payload molecule or a payload molecule configured to affect an electronic signal generated upon translocation of a complex comprising a target or reference analyte bound to the complex. In some embodiments, the probe comprises a payload molecule binding moiety adapted to bind to the payload molecule.
본원에 사용된 바와 같이, 용어 "페이로드 분자(payload molecule)"는, 상관관계가 있는 범위의 규모(dimension) 내에서 나노포어에 포착된 경우, 독특한 전기 신호의 발생을 용이하게 하는 물리적 규모를 갖는 분자를 지칭한다. 페이로드 분자는 나노포어 장치에서 표적 분석물 또는 참조 분석물의 검출을 용이하게 하기 위해 표적 분석물 또는 참조 분석물에 결합될 수 있다. 일부 실시형태에서, 페이로드 분자는 또한, 구동 분자(driver molecule)로서 작용하기 위해 하전될 수 있다. 일부 실시형태에서, 페이로드 분자는 프로브 분자에 특이적으로 결합할 수 있는 프로브 결합 모이어티를 포함하며, 이러한 프로브는 표적 분석물 또는 참조 분석물에 특이적으로 결합한다.As used herein, the term “payload molecule” refers to a physical scale that, when captured in a nanopore within a correlated range of dimensions, facilitates the generation of a unique electrical signal. refers to molecules with The payload molecule may be bound to a target analyte or reference analyte to facilitate detection of the target analyte or reference analyte in the nanopore device. In some embodiments, the payload molecule may also be charged to act as a driver molecule. In some embodiments, the payload molecule comprises a probe binding moiety capable of specifically binding a probe molecule, such probe specifically binding a target analyte or a reference analyte.
본원에 사용된 바와 같이 용어 "나노포어(nanopore)"(또는 단순히 "포어")는 2개의 부피를 분리하는 막 내의 단일 나노-규모 개구부(opening)를 지칭한다. 포어는 지질 이중층 막에 삽입된 단백질 채널일 수 있거나, 예를 들어, 얇은 고체상 기질, 예컨대 실리콘 니트라이드, 실리콘 디옥사이드 또는 그래핀 또는 이들 또는 다른 물질들의 조합의 층을 통해 드릴링 또는 에칭에 의해 또는 전압-펄스 방법을 사용함으로써 조작될 수 있다. 기하학적으로, 포어는 0.1 nm 이상의 직경 내지 1 미크론 이하의 직경의 치수(dimension)를 가지며; 포어의 길이는 서브-나노미터 두께, 또는 1 미크론 이하 또는 그 이상의 두께일 수 있는 막 두께에 의해 좌우된다. 수백 나노미터보다 두꺼운 막의 경우, 나노포어는 "나노 채널"로서 지칭될 수 있다.As used herein, the term “nanopore” (or simply “pore”) refers to a single nano-scale opening in a membrane that separates two volumes. The pore may be a protein channel embedded in a lipid bilayer membrane, for example by drilling or etching through a layer of a thin solid-phase substrate, such as silicon nitride, silicon dioxide or graphene or a combination of these or other materials, or by voltage - Can be manipulated by using the pulse method. Geometrically, the pores have a dimension of 0.1 nm or greater in diameter to 1 micron or less in diameter; The length of the pores is dictated by the film thickness, which can be sub-nanometer thick, or less than or equal to 1 micron thick. For membranes thicker than several hundred nanometers, the nanopores may be referred to as “nanochannels”.
본원에 사용된 바와 같이, 용어 "나노포어 장비" 또는 "나노포어 장치"는 하나 이상의 나노포어(병렬로 또는 직렬로)를 단일 분자 이벤트 감지용 회로와 조합하는 장치를 지칭한다. 해당 나노포어로 감지를 용이하게 하는 데 사용되는 챔버 및 전극을 포함하는 나노포어 장치 내의 각각의 나노포어는 본원에서 나노포어 센서로서 지칭된다. 구체적으로, 나노포어 장비는 이온 전류를 포어(들)를 통해 측정하면서도 특정된 전압을 포어 또는 포어들에 걸쳐 인가하기 위해 민감한 전압-클램프 증폭기를 사용한다. 단일 하전된 분자, 예컨대 이중 가닥 DNA(dsDNA)가 전기 영동에 의해 포어를 통해 포착되고 구동되는 경우, 포착된 이벤트(즉, 나노포어를 통한 분자의 전위, 또는 나노포어에서 분자의 포착)을 가리키는 측정된 전류 시프트(current shift) 및 이벤트의 시프트 양(전류 진폭(current amplitude)) 및 기간은 나노포어에 포착된 분자를 특징화하는 데 사용된다. 실험 동안 많은 이벤트들을 기록한 후, 이벤트의 분포는 이의 시프트 양(즉, 이의 전류 신호(current signature))에 따라 상응하는 분자를 특징화하기 위해 분석된다. 이러한 방식으로, 나노포어는 생체분자 감지를 위한 단순하며 표지-무함유의 순수하게 전기적 단일-분자 방법을 제공한다.As used herein, the term “nanopore device” or “nanopore device” refers to a device that combines one or more nanopores (in parallel or in series) with circuitry for sensing single-molecule events. Each nanopore within a nanopore device comprising an electrode and a chamber used to facilitate sensing with that nanopore is referred to herein as a nanopore sensor. Specifically, the nanopore instrument uses a sensitive voltage-clamp amplifier to apply a specified voltage across the pore or pores while measuring ion current through the pore(s). When a single charged molecule, such as double-stranded DNA (dsDNA), is captured and driven through a pore by electrophoresis, it points to a captured event (i.e., translocation of a molecule through a nanopore, or capture of a molecule at a nanopore). The measured current shift and the amount of shift (current amplitude) and duration of the event are used to characterize the molecules entrapped in the nanopores. After recording many events during the experiment, the distribution of events is analyzed to characterize the corresponding molecule according to its shift amount (ie, its current signature). In this way, nanopores provide a simple, label-free, purely electrical single-molecule method for biomolecular sensing.
본원에 사용된 바와 같이, 용어 "전기 신호"는 전자 회로의 구성에 따라 시간 경과에 걸쳐 전류, 임피던스 / 저항, 또는 전압 상에서 수합된 일련의 데이터를 포함한다. 통상적으로, 전류는 "전압 클램프" 구성(configuration) 내에서 측정되며; 전압은 "전류 클램프" 구성 내에서 측정되고, 저항 측정은 옴의 법칙 V = IR을 사용하여 구성 내에서 유도될 수 있다. 임피던스는 또한, 나노포어 장치로부터 수합된 전류 또는 전압 데이터로부터 측정되어 발생될 수 있다. 본원에서 지칭되는 전기 신호의 유형은 전류 신호 및 전류 임피던스 신호를 포함하지만, 다양한 다른 전기 신호들도 나노포어 내 입자를 검출하는 데 사용될 수 있다.As used herein, the term “electrical signal” includes a set of data collected over time, either in current, impedance/resistance, or voltage, depending on the configuration of an electronic circuit. Typically, the current is measured in a “voltage clamp” configuration; The voltage is measured in a "current clamp" configuration, and a resistance measurement can be derived in the configuration using Ohm's Law V = IR. Impedance can also be measured and generated from current or voltage data collected from the nanopore device. The types of electrical signals referred to herein include current signals and current impedance signals, although a variety of other electrical signals can also be used to detect particles in nanopores.
본원에 사용된 바와 같이, 용어 "이벤트(event)"는 나노포어를 통해 검출 가능한 분자 또는 분자 복합체의 전위, 및 시간 경과에 따른 나노포어를 통한 전기 신호, 예를 들어 전류의 변화를 통한 이의 연관된 측정을 지칭한다. 이벤트는 이의 전류, 기준치 개방 채널로부터의 전류의 변화, 기간 및/또는 나노포어에서의 분자 검출의 다른 특징들에 의해 정의될 수 있다. 유사한 특징들을 갖는 복수의 이벤트들은, 동일하거나 또는 유사한 특징들(예를 들어 벌크, 전하)을 갖는 분자 또는 복합체의 집단을 가리킨다.As used herein, the term “event” refers to the potential of a molecule or molecular complex detectable through the nanopore, and its associated electrical signal through the nanopore over time, eg, through a change in current. refers to measurement. An event may be defined by its current, change in current from a baseline open channel, duration, and/or other characteristics of molecular detection in the nanopore. A plurality of events with similar characteristics refers to a population of molecules or complexes having the same or similar characteristics (eg bulk, charge).
본원에 사용된 바와 같이, 이벤트의 "면적(area)"은 이벤트의 기간(즉, 전류가 개방 채널 전류 신호로부터 벗어나는 기간)을 이벤트의 기간에 걸친 개방 채널로부터의 평균 전류의 변화로 곱한 절대값(즉, pA*ms)을 지칭한다.As used herein, the “area” of an event is the absolute value multiplied by the duration of the event (ie, the period during which the current deviates from the open channel current signal) by the change in average current from the open channel over the duration of the event. (ie, pA*ms).
본원에 사용된 바와 같이, 용어 "상대 존재비(relative abundance)"는 그룹 내에서 관련된 아이템들의 총 수와 비교하여 아이템의 양을 지칭한다. 예를 들어, 시료 내 표적 분석물의 맥락에서, 표적 분석물의 상대 존재비는 참조 분석물과 비교하여 시료에 존재하는 표적 분석물의 양을 지칭한다. 이는 분포 분율(fractional abundance), 예를 들어 표적 분석물 및 참조 분석물의 총 집단과 비교하여 시료 내 표적 분석물의 백분율로서 표시될 수 있다. 상대 존재비는 또한, 예를 들어 표적 분석물 : 참조 분석물의 비율로서 표시될 수 있다. 전자 신호와 관련하여, 전자 신호의 그룹의 상대 존재비는, 참조 분석물과 상관관계가 있는 제2 전자 신호의 양과 비교하여 표적 분석물과 상관관계가 있는 제1 전자 신호의 양을 지칭할 수 있다. 시료 내 표적 분석물의 실제 상대 존재비(즉, 공지된 상대 존재비를 갖도록 이전에 측정되거나 제조됨)와 본원에 제공된 방법에 따라 결정된 상대 존재비 사이를 구분하기 위해, 본 발명자들은 실제 상대 존재비를 "참 상대 존재비"로서 지칭하고, 본원에 기재된 방법에 의해 결정된 상대 존재비를 "참 상대 존재비의 추정치"로서 지칭한다.As used herein, the term “relative abundance” refers to the amount of an item compared to the total number of related items within a group. For example, in the context of a target analyte in a sample, the relative abundance of the target analyte refers to the amount of the target analyte present in the sample as compared to a reference analyte. This can be expressed as fractional abundance, eg, the percentage of target analyte in a sample compared to the total population of target analytes and reference analytes. Relative abundance can also be expressed, for example, as a ratio of target analyte to reference analyte. With respect to an electronic signal, the relative abundance of a group of electronic signals may refer to an amount of a first electronic signal that correlates with a target analyte compared to an amount of a second electronic signal that correlates with a reference analyte. . To distinguish between the actual relative abundance of a target analyte in a sample (ie, previously measured or prepared to have a known relative abundance) and a relative abundance determined according to the methods provided herein, we define the actual relative abundance as "true relative abundance". Abundance", and the relative abundance determined by the methods described herein as "estimate of true relative abundance".
본원에 사용된 바와 같이, 용어 "대조군 시료"는 참조 분석물과 비교하여 표적 분석물을 공지된 상대 존재비로 함유하는 시료를 지칭한다. 대조군 시료, 예컨대 참조 대조군 시료, 표적 대조군 시료 및 혼합 대조군 시료는 미공지 시료 내 분포 분율의 추정치의 정확도를 개선하기 위해 본원에 사용된다. 일부 실시형태에서, 대조군 시료는 표적 분석물, 참조 분석물 또는 둘 다를 포함한다.As used herein, the term “control sample” refers to a sample that contains a known relative abundance of a target analyte compared to a reference analyte. Control samples, such as reference control samples, target control samples, and mixed control samples, are used herein to improve the accuracy of the estimate of the fraction of distribution in the unknown sample. In some embodiments, the control sample comprises a target analyte, a reference analyte, or both.
본원에 사용된 바와 같이, 용어 "미공지 시료", "미공지 혼합된 시료" 또는 "혼합된 미공지 시료"는 참조 분석물을 미공지된 상대 존재비로 함유하는 시료를 지칭한다. 참조 분석물의 상대 존재비는, 상대 존재비가 본원에 제공된 방법에 의해 결정되는 경우, 심지어 추정치의 일부 값이 이미 공지된 경우, 미공지인 것으로 간주된다. 일부 미공지 시료에 대해, 시료 내 참조 분석물의 양 또는 농도는 공지되어 있다.As used herein, the terms “unknown sample”, “unknown mixed sample” or “mixed unknown sample” refer to a sample containing a reference analyte in an unknown relative abundance. The relative abundance of a reference analyte is considered unknown when the relative abundance is determined by the methods provided herein, even if some value of the estimate is already known. For some unknown samples, the amount or concentration of the reference analyte in the sample is known.
본원에 사용된 바와 같이, 용어 "공지된 시료"는 참조 분석물과 비교하여 표적 분석물을 공지된 상대 존재비로 함유하는 시료를 지칭하며, 분포 분율 추정 모델, 또는 이러한 모델의 특징, 예컨대 역치의 정확도의 추정치를 트레이닝하거나, 입증하거나 또는 제공하기 위해 사용된다.As used herein, the term “known sample” refers to a sample that contains a known relative abundance of a target analyte compared to a reference analyte, and refers to a model for estimating the fraction of a distribution, or a characteristic of such a model, such as a threshold. Used to train, validate or provide an estimate of accuracy.
도입 / 개요Introduction / Overview
일부 실시형태에서, 본원에 제공된 발명은 시료에 존재하는 참조 분석물과 비교하여 표적 분석물의 참 상대 존재비의 추정치(예를 들어 부분량 또는 비율)의 결정 방법이다. 이러한 방법은 시료에서 표적 분석물과 참조 분석물을 검출하고 구분하기 위해 나노포어 단일 분자 계수기(즉, 나노포어 장치)를 이용한다.In some embodiments, the invention provided herein is a method of determining an estimate (eg, fractional amount or ratio) of the true relative abundance of a target analyte as compared to a reference analyte present in a sample. This method utilizes a nanopore single molecule counter (ie, a nanopore device) to detect and discriminate between a target analyte and a reference analyte in a sample.
시료 내 표적 분석물의 상대 존재비에 대한 추정치를 결정하기 위한 표적 분석물 및 참조 분석물과 상관관계가 있는 원(raw) 전자 이벤트 신호의 사용은 위양성 검출 오차, 위음성 검출 오차, 및 혼합된 시료 내 표적 분석물과 참조 분석물 사이의 포착률 상수 차이와 연관된 오차를 포함하여 몇 가지 이유들에서 부정확할 수 있다. 본원에서 일부 실시형태에 따르면, 본 발명자들은 시료 내 참조 분석물 및 표적 분석물의 참 분포 분율을 추정하는 정확도의 개선 방법법을 제공한다. 일부 실시형태에서, 이들 방법은 혼합된 시료 내 전자 신호 검출과 연관된 하나 이상의 오차를 보정하도록 특이적으로 디자인된 대조군 시료의 사용을 수반한다. 혼합된 시료가 공지된 양 또는 농도의 참조 분석물을 포함하는 경우, 상대 존재비의 개선된 추정치는 시료 내 표적 분석물의 참 양 또는 농도의 개선된 추정치를 제공하는 데 사용될 수 있다.The use of a raw electron event signal correlating with a target analyte and a reference analyte to determine an estimate of the relative abundance of the target analyte in a sample is a result of false positive detection error, false negative detection error, and target in the mixed sample. It can be inaccurate for several reasons, including errors associated with differences in capture rate constants between analytes and reference analytes. According to some embodiments herein, the inventors provide methods of improving the accuracy of estimating the true distribution fraction of a reference analyte and a target analyte in a sample. In some embodiments, these methods involve the use of a control sample specifically designed to correct for one or more errors associated with detecting an electronic signal in the mixed sample. Where the mixed sample includes a known amount or concentration of the reference analyte, the improved estimate of the relative abundance can be used to provide an improved estimate of the true amount or concentration of the target analyte in the sample.
일부 실시형태에서, 본원에 제공된 방법은 위양성 또는 위음성 검출 오차, 또는 상기 표적 분석물과 상기 참조 분석물 사이의 포착률 상수 차이를 설명함으로써 혼합된 미공지 시료 내 표적 분석물의 분포 분율의 추정치의 정확도를 개선한다. 일부 실시형태에서, 분포 분율의 추정치의 정확도를 개선하기 위해, 위양성 표적 분석물 검출 오차를 설명하기 위한 참조-단독 대조군, 위음성 표적 분석물 검출 오차를 설명하기 위한 표적-단독 대조군, 및 표적 분석물과 참조 분석물 사이의 포착률 상수 차이를 설명하기 위한 하나 이상의 혼합 대조군 시료를 포함하는 일련의 대조군이 진행(run)된다.In some embodiments, the methods provided herein determine the accuracy of an estimate of the fraction of distribution of a target analyte in a mixed unknown sample by accounting for false positive or false negative detection errors, or differences in capture rate constants between the target analyte and the reference analyte. improve In some embodiments, to improve the accuracy of the estimate of the fraction of distribution, a reference-only control to account for false-positive target analyte detection error, a target-only control to account for false-negative target analyte detection error, and target analyte A series of controls is run comprising one or more mixed control samples to account for differences in capture rate constants between and a reference analyte.
일부 실시형태에서, 혼합된 미공지 시료 내 표적 분석물과 참조 분석물 사이의 포착률은 비교적 일관적이어서, 혼합된 대조군은 상대 존재비의 추정치를 개선하는 데 사용될 필요가 없다. 일부 실시형태에서, 혼합된 시료 내 표적 분석물과 참조 분석물 사이의 상대 포착률은 공지되어 있어서, 혼합 대조군 시료를 진행하지 않으면서 분포 분율의 추정치를 개선하기 위해 이러한 차이를 보상하고자 혼합된 미공지 시료 유래의 데이터에 보정항이 적용될 수 있다. 일부 실시형태에서, 혼합된 미공지 시료에서와 동일한 표적 분석물 및 참조 분석물 종을 사용하여 실질적으로 동일한 나노포어 조건 하에 진행된 혼합 대조군 시료 유래의 데이터는, 혼합 대조군 시료를 이러한 방법의 일부로서 실제로 진행시키지 않으면서 분포 분율의 추정치를 개선하는 데 사용된다.In some embodiments, the capture rate between the target analyte and the reference analyte in the mixed unknown sample is relatively consistent, so that the mixed control need not be used to improve the estimate of relative abundance. In some embodiments, the relative capture rate between the target analyte and the reference analyte in the mixed sample is known, so as to compensate for this difference in order to improve the estimate of the fraction of distribution without proceeding to the mixed control sample. A correction term may be applied to the data from the sample. In some embodiments, data from a mixed control sample run under substantially the same nanopore conditions using the same target analyte and reference analyte species as in the mixed unknown sample can be determined by using the mixed control sample as part of such a method. It is used to improve the estimate of the fraction of a distribution without proceeding.
일부 실시형태에서, 역치값은 혼합된 미공지 시료 유래의 위양성 값이 무시할 만하도록 결정되고, 상대 존재비의 추정치를 개선하기 위해 참조-단독 대조군이 사용될 필요가 없다. 일부 실시형태에서, 혼합된 시료 유래의 위양성 값은 공지되어 있어서, 참조-단독 대조군 시료를 진행하지 않으면서 분포 분율의 추정치를 개선하기 위해 위양성 오차를 보상하고자 혼합된 미공지 시료 유래의 데이터에 보정항이 적용될 수 있다. 일부 실시형태에서, 혼합된 미공지 시료에서와 동일한 참조 분석물 종을 사용하여 실질적으로 동일한 나노포어 조건 하에 진행된 참조-단독 대조군 시료 유래의 데이터는, 참조-단독 대조군를 이러한 방법의 일부로서 실제로 진행시키지 않으면서 분포 분율의 추정치를 개선하는 데 사용된다.In some embodiments, the threshold value is determined such that false positive values from mixed unknown samples are negligible, and a reference-only control need not be used to improve the estimate of relative abundance. In some embodiments, the false positive values from the mixed sample are known, so that the data from the mixed unknown sample is corrected to compensate for false positive errors to improve the estimate of the distribution fraction without going through a reference-only control sample. clause may apply. In some embodiments, data from a reference-only control sample run under substantially the same nanopore conditions using the same reference analyte species as in the mixed unknown sample does not actually run the reference-only control as part of such a method. It is used to improve the estimate of the distribution fraction.
일부 실시형태에서, 역치값은 혼합된 미공지 시료 유래의 위음성 값이 무시할 만하도록 결정되고, 상대 존재비의 추정치를 개선하기 위해 표적-단독 대조군이 사용될 필요가 없다. 일부 실시형태에서, 혼합된 시료 유래의 위음성 값은 공지되어 있어서, 표적-단독 대조군 시료를 진행하지 않으면서 분포 분율의 추정치를 개선하기 위해 위음성 오차를 보상하고자 혼합된 미공지 시료 유래의 데이터에 보정항이 적용될 수 있다. 일부 실시형태에서, 혼합된 미공지 시료에서와 동일한 표적 분석물 종을 사용하여 실질적으로 동일한 나노포어 조건 하에 진행된 표적-단독 대조군 시료 유래의 데이터는, 표적-단독 대조군를 이러한 방법의 일부로서 실제로 진행시키지 않으면서 분포 분율의 추정치를 개선하는 데 사용된다.In some embodiments, the threshold value is determined such that false negative values from mixed unknown samples are negligible, and a target-only control need not be used to improve the estimate of relative abundance. In some embodiments, false-negative values from the mixed sample are known so that the data from the mixed unknown sample is corrected to compensate for false-negative errors in order to improve the estimate of the distribution fraction without proceeding to the target-only control sample. clause may apply. In some embodiments, data from a target-only control sample run under substantially the same nanopore conditions using the same target analyte species as in the mixed unknown sample does not actually run the target-only control as part of such a method. It is used to improve the estimate of the distribution fraction.
시료 용도Sample use
참조 핵산 분자와 비교하여 핵산 단편 내에서 표적 서열의 부분량을 결정하는 것은 많은 적용들을 가진다.Determining the partial amount of a target sequence within a nucleic acid fragment as compared to a reference nucleic acid molecule has many applications.
일례의 용도 경우에서, 본 발명자들은 예를 들어 종자 집합으로부터 수득된 게놈 DNA 내 비-GMO 참조 서열에 대한 유전자 변형 유기체(GMO)의 이식유전자 서열의 부분량을 결정하기 위해 본원의 방법을 사용한다. 이러한 결정은 규제 및 경제적 이유들에서 중요하다. 요망되는 형질을 갖는 종자의 구매자 및 판매자는, 가격 책정 및 거래를 공정하게 하기 위해 요망되는 형질을 포함하는 종자의 분율을 정밀하고 정확하게 알 필요가 있다.In an exemplary use case, we use the methods herein to determine the fractional amount of a transgene sequence of a genetically modified organism (GMO) relative to a non-GMO reference sequence in genomic DNA obtained, for example, from a seed set. . This decision is important for regulatory and economic reasons. Buyers and sellers of seeds with desired traits need to know precisely and accurately the fraction of seeds containing desired traits in order to make pricing and trading fair.
따라서 일부 실시형태에서, 본원에 제공된 방법은 1% 내지 100%의 GMO 함량을 함유하는 것으로 추정된 응집 종자, 낟알, 가루 및 피드(feed)로부터 %GMO 함량 결정을 제공한다. 종자 개발자, 재배자 및 규제 기관은 GMO 함량에서 10% 차이(1.1배)를 해결하기 위해 정밀한 측정 및 능력을 원한다. % GMO는 100x (GMO 이벤트 복제수) / (분류군(taxon)-특이적 게놈 참조 복제수)로서 정의된다.Thus, in some embodiments, the methods provided herein provide for determining % GMO content from agglomerated seeds, kernels, flours and feeds estimated to contain a GMO content of between 1% and 100%. Seed developers, growers and regulators want precise measurements and the ability to resolve 10% differences (1.1 times) in GMO content. % GMO is defined as 100x (GMO event copy number) / (taxon-specific genomic reference copy number).
또 다른 예의 용도 경우에서, 본 발명자들은 혈액 또는 소변 시료 유래의 세포-무함유 순환하는 DNA 내에서 비-돌연변이체(야생형) 서열에 대한 점 돌연변이를 포함하는 폴리뉴클레오타이드 서열의 상대 존재비를 모니터링하기 위해 본원에 기재된 방법을 사용한다. 특정한 게놈 유전자좌에서 점 돌연변이의 상대 존재비는 암 유형 및 치료 결과와 상관관계가 있어 왔다. 비-돌연변이체 서열과 비교하여 돌연변이체의 상대 존재비의 결정은 진단, 치료법 및 질병 진행 모니터링을 가이드하는 데 사용될 수 있다. 종양 이미징 결과가 수축/성장하는 덩어리를 드러내는 데 수주가 소요될 수 있긴 하지만, 본원에 기재된 방법은, 쉽게 접근 가능한 시료 유형을 사용함으로써 돌연변이 마커의 상대 존재비의 신속한 식별이 효율적이고 빈번한(예를 들어 매일의) 실험을 허용하는 것을 가능하게 한다. 중요하게는, 이러한 기술은, 재발의 조기 검출을 허용하면서도 질병 역학(disease dynamics)의 더 많은 시점들을 제공함으로써 치료 반응을 보다 효과적으로 보여줄 수 있을 것이다.In another example use case, the present inventors have used to monitor the relative abundance of polynucleotide sequences comprising point mutations to non-mutant (wild-type) sequences in cell-free circulating DNA from blood or urine samples. The methods described herein are used. The relative abundance of point mutations at specific genomic loci has been correlated with cancer type and treatment outcome. Determination of the relative abundance of mutants compared to non-mutant sequences can be used to guide diagnosis, therapy, and monitoring of disease progression. Although tumor imaging results can take weeks to reveal shrinking/growing masses, the methods described herein allow the rapid identification of the relative abundance of mutant markers by using readily accessible sample types to be efficient and frequent (e.g., daily ) makes it possible to allow experiments. Importantly, this technique could more effectively show therapeutic response by providing more points in the disease dynamics while allowing early detection of relapse.
일부 실시형태에서, 본원에 제공된 방법은 유전적 암 스크리닝 검정법에서 복제수 변이 확인(CNV)을 제공한다. 복제수 변이(CNV) 시험은 유전적 암 소인에 대한 것이다. 목표는 참조로부터 1.5배 미만의 차이에서 유전자 조절 요소의 결실 또는 중복을 검출하는 것이다. 예를 들어, BRCA1 유전자의 복제수에서 10% 차이(1.1배)는 임상 작용을 보증할 수 있다.In some embodiments, the methods provided herein provide for copy number variation identification (CNV) in a genetic cancer screening assay. The copy number variation (CNV) test is for genetic cancer predisposition. The goal is to detect deletions or duplications of gene regulatory elements at less than 1.5 fold difference from reference. For example, a 10% difference (1.1 fold) in copy number of the BRCA1 gene may warrant clinical action.
나노포어 검출Nanopore detection
나노포어는 고체상 실리콘-기반 기질에서 형성되고, 단일 분자 실험은 완충된 전해질 용액 내에서 포어를 가로질러 전압을 인가함으로써 수행된다.Nanopores are formed in a solid-state silicon-based substrate, and single-molecule experiments are performed by applying a voltage across the pores in a buffered electrolyte solution.
도 1a는 dsDNA가 나노포어를 통과함으로써 유발되는 전형적인 단일-분자 이벤트를 보여준다. 이벤트는 기간 폭 및 최대 전도도 깊이, 최대 δG에 의해 정량화된다. 최대 δG는 인가된 전압 V에 의해 나누어진 전류 감쇠 δI이다.도 1b는 22 nm 직경 나노포어를 이용하여 5분 이내에 기록된 5.6 kb dsDNA의 1072개 이벤트들에 대한 최대 δG 대 기간의 모든-이벤트 산점도를 보여준다(V = 100 mV, 1 nM DNA, 1 M LiCl, 10 mM Tris, 1 mM EDTA, pH=8.8).1A shows a typical single-molecule event triggered by the passage of dsDNA through a nanopore. Events are quantified by period width and maximum conductance depth, maximum δG. The maximum δG is the current attenuation δI divided by the applied voltage V.1B shows an all-event scatter plot of maximal δG versus duration for 1072 events of 5.6 kb dsDNA recorded within 5 min using 22 nm diameter nanopores (V = 100 mV, 1 nM DNA, 1 M LiCl). , 10 mM Tris, 1 mM EDTA, pH=8.8).
최대 δG 및 기간 외에도, 정량화될 수 있는 이벤트 프로파일의 다른 특징들은 이벤트 신호의 평균 δG, 중앙값 δG, 표준 편차, 및 다른 보다 고차원의 특징들이다. 또 다른 유용한 특징은 이벤트의 적분된 면적의 절대값이며, 이는 평균 δG X 기간으로서 계산될 수 있다(문헌[Storm, A J, J H Chen, H W Zandbergen, and C Dekker. "Translocation of Double-Strand DNA Through a Silicon Oxide Nanopore." Physical Review E 71, no. 5 (May 2005): 051903, doi:10.1103/PhysRevE.71.051903]). 적분된 면적 또는 단순히 "면적"은 또한, 전하 부족(electric charge deficit)으로서 공지되어 있다(문헌[Fologea, Daniel, Marc Gershow, Bradley Ledden, David S McNabb, Jene A Golovchenko, and Jiali Li. "Detecting Single Stranded DNA with a Solid State Nanopore."Nano Letters 5, no. 10 (October 2005): 1905-9. doi:10.1021/nl051199m]).In addition to the maximum δG and duration, other features of the event profile that can be quantified are the mean δG, median δG, standard deviation, and other higher-order features of the event signal. Another useful feature is the absolute value of the integrated area of the event, which can be calculated as the mean δG X duration (Storm, AJ, JH Chen, HW Zandbergen, and C Dekker. “Translocation of Double-Strand DNA Through a Silicon Oxide Nanopore." Physical Review E 71, no. 5 (May 2005): 051903, doi:10.1103/PhysRevE.71.051903]). The integrated area, or simply "area", is also known as an electric charge deficit (Fologea, Daniel, Marc Gershow, Bradley Ledden, David S McNabb, Jene A Golovchenko, and Jiali Li. "Detecting Single Stranded DNA with a Solid State Nanopore."
접힌 상태에서 나노포어를 통과하기에 충분히 긴(700 bp 초과) dsDNA의 경우, 이벤트는 1 초과의 진폭을 보여줄 수 있다. 도 1b는 이의 일례이며, 이때 완전히 접혀진 이벤트는 더 큰 최대 δG 값 및 더 짧은 기간을 나타내고, 접히지 않은 이벤트는 더 긴 기간 및 더 얕은 최대 δG 값을 나타낸다. 부분적으로 접힌 이벤트는, 더 깊은 수준에서 시작하고 더 얕은 수준에서 종료하며 접히지 않은 이벤트와 완전히 접힌 이벤트 사이에 존재하는 총 기간 폭을 갖는, 이벤트 내에서 2개의 진폭 수준을 나타낸다. δG 및 기간 분포가 접힐 수 있는 dsDNA에 대한 모드들의 혼합을 보여주긴 하지만, 이벤트 면적은, DNA가 나노포어를 통과할 때 접힐 정도로 충분히 긴지 아닌지의 여부와는 상관없이 dsDNA에 대해 단일 모드 분포를 가진다.For dsDNA long enough (greater than 700 bp) to pass through the nanopore in the folded state, the event may show an amplitude greater than one. 1B is an example of this, wherein a fully folded event exhibits a larger maximum δG value and shorter duration, and an unfolded event exhibits a longer duration and shallower maximum δG value. A partially collapsed event represents two amplitude levels within an event, starting at a deeper level, ending at a shallower level, and having a total duration width that exists between the unfolded and fully collapsed events. Although the δG and duration distributions show a mix of modes for foldable dsDNA, the event area has a unimodal distribution for dsDNA, whether or not the DNA is long enough to fold as it passes through the nanopore. .
나노포어를 사용한 표적 분석물과 참조 분석물의 구별은 나노포어를 통한 각각의 전위 시 신뢰할만하고 민감한 검출이 가능하게 할 정도로 충분히 상이한 이벤트 신호의 검출을 기반으로 한다. 평균 이벤트 신호의 차이는 신호 기간, 전류 변화, 신호 내에서의 특징들 또는 다른 구분 가능한 특징들 및 이들의 조합을 기반으로 할 수 있다. 사용되는 특징들은, 본원에 기재된 분포 분율 결정에 사용되기 위해 참조 분석물 및 표적 분석물과 상관관계가 있는 이벤트 신호의 식별 방법으로서 작용하는 역치의 결정을 위한 근거이다.Differentiation of target and reference analytes using nanopores is based on the detection of event signals that differ sufficiently to enable reliable and sensitive detection at each translocation through the nanopores. Differences in the average event signal may be based on signal duration, current change, characteristics within the signal, or other distinguishable characteristics, and combinations thereof. The features used are the basis for the determination of a threshold that serves as a method of identification of event signals that correlate with reference analytes and target analytes for use in determining the fraction of distribution described herein.
일부 실시형태에서, 표적 및 참조 단편들은 상이한 나노포어 이벤트 기간들을 생성할 정도로 충분히 상이한 길이의 dsDNA 분자들이다.In some embodiments, the target and reference fragments are dsDNA molecules of sufficiently different lengths to produce different nanopore event durations.
일부 실시형태에서, 표적 및 참조 분석물은 dsDNA이고, 별개의 이벤트 유형을 생성하는 특징은 표적 및 참조 분석물의 길이의 차이일 수 있을 것이다. 이러한 실시형태에서, 표적 및 참조 이벤트 면적의 차이는 표적 및 참조 분석물의 길이의 차이에 의해 생성되며, 표적 및 참조 이벤트 신호(즉, 이벤트 프로파일)을 구분하는 데 사용된다.In some embodiments, the target and reference analytes are dsDNA, and the characteristic that generates distinct event types may be a difference in length of the target and reference analytes. In such embodiments, the difference in target and reference event area is generated by the difference in length of the target and reference analytes and is used to differentiate the target and reference event signals (ie, event profiles).
dsDNA에 대한 이벤트 면적 분포는 단일 모드를 가진다. 이는 표적 및 참조 분석물이 충분히 상이한 길이의 dsDNA인 경우, 면적을 이벤트를 표적 유형 또는 참조 유형인 것으로 분류하기 위한 유용한 이벤트 특징으로 만든다. 충분히 상이한 면적 분포를 발생시키기 위해, 길이는 직경이 20 nm 초과인 나노포어에 대해 적어도 100 bp만큼 상이해야 한다. 예를 들어 조절된 절연 브레이크다운(controlled dielectric breakdown)에 의해 형성된 직경이 1 nm 내지 20 nm로 더 작은 나노포어의 경우(문헌[Yanagi, Itaru, Rena Akahori, Toshiyuki Hatano, and Ken-ichi Takeda. "Fabricating Nanopores with Diameters of Sub-1 Nm to 3 Nm Using Multilevel Pulse-Voltage Injection." Scientific Reports 4 (2014): 5000 doi:10.1038/srep05000]), 표적 및 참조에 대한 dsDNA가 길이가 적어도 20 bp만큼 상이해야 한다.The event area distribution for dsDNA has a single mode. This makes the area a useful event feature for classifying an event as being either a target type or a reference type when the target and reference analytes are dsDNA of sufficiently different lengths. To generate sufficiently different area distributions, the length should differ by at least 100 bp for nanopores greater than 20 nm in diameter. For nanopores smaller than 1 nm to 20 nm in diameter, for example formed by controlled dielectric breakdown (Yanagi, Itaru, Rena Akahori, Toshiyuki Hatano, and Ken-ichi Takeda. " Fabricating Nanopores with Diameters of Sub-1 Nm to 3 Nm Using Multilevel Pulse-Voltage Injection." Scientific Reports 4 (2014): 5000 doi:10.1038/srep05000]), dsDNA for target and reference differ by at least 20 bp in length Should be.
dsDNA 길이가 표적 분자 및 참조 분자에 대해 얼마나 상이할 수 있는지에 대해 분명한 상한은 존재하지 않는다.There is no clear upper limit on how different dsDNA lengths can be for target and reference molecules.
도 2a는 727 bp DNA가 1 M LiCl 내 100 mV에서 25 nm 직경 고체상 나노포어를 통과할 때의 전형적인 이벤트를 보여준다. 이벤트 면적은 음영이 생긴 영역으로 나타나 있다. 도 2b는 이벤트 면적이 dsDNA 길이에 따라 어떻게 증가하는지 보여준다. 주로, 이벤트 깊이가 보존된 채로 유지되는 동안 증가하는 것은 이벤트 기간이고, 이벤트 면적(평균 깊이 x 기간)이 이러한 길이-의존적 증가를 포착하는데, 이는 상기 증가가 기간에 비례하기 때문이다. 도 2c는 동일한 나노포어 상에서 순차적으로 진행된, 보여진 각각의 DNA 길이에 대해 기록된 모든 이벤트들의 면적(pA*ms)의 log-밑수(base)-10의 분포를 보여준다. 이벤트 면적의 log-밑수-10이 분포는 대략 정상적이다(가우시안). DNA가 길이에서 길어짐에 따라, 분포의 평균은 증가한다.Figure 2a shows a typical event when 727 bp DNA passes through a 25 nm diameter solid-phase nanopore at 100 mV in 1 M LiCl. The event area is shown as a shaded area. Figure 2b shows how the event area increases with dsDNA length. Primarily, it is the event duration that increases while the event depth remains conserved, and the event area (average depth x duration) captures this length-dependent increase because the increase is proportional to duration. Figure 2c shows the distribution of the log-base-10 of the area (pA*ms) of all events recorded for each DNA length shown, running sequentially on the same nanopore. The log-base-10 of the event area is approximately normal (Gaussian). As DNA increases in length, the mean of the distribution increases.
dsDNA를 포함하는 표적-서열 및 dsDNA를 포함하는 참조-서열을 생성하기 위해, 2개의 dsDNA 길이는 적어도 300 bp 길이, 100,000 bp 이하의 길이이다. 일부 실시형태에서, 표적 및 참조 dsDNA 분석물은 적어도 10 bp, 20bp, 30 bp, 40 bp, 50 bp, 60 bp, 70bp, 80 bp, 90 bp 100 bp, 150 bp, 200 bp 또는 300 bp의 길이 차이를 가진다. 일반적으로, 표적 및 참조 dsDNA 분석물 사이의 길이의 증가된 차이는, 크기에 의해 구분할 때 표적 및 참조 분석물과 상관관계가 있는 이벤트 신호의 결정의 더 큰 민감성 및 특이성을 가능하게 하며, 이는 시료에서 상대 존재비의 추정을 개선한다.To generate a target-sequence comprising dsDNA and a reference-sequence comprising dsDNA, the two dsDNAs are at least 300 bp in length and no more than 100,000 bp in length. In some embodiments, the target and reference dsDNA analytes are at least 10 bp, 20 bp, 30 bp, 40 bp, 50 bp, 60 bp, 70 bp, 80 bp, 90
일부 실시형태에서, 게놈 DNA(gDNA)로부터 절제된 폴리뉴클레오타이드 단편의 특성을 규명하는 것은 분포 분율 결정을 위한 작업 흐름의 일부이다. 이들 단편 사양은 예를 들어 이들 단편의 서열, 길이 및 2차 구조를 포함할 수 있다. 일부 실시형태에서, 단편 사양은 나노포어 장치에 의한 특정한 서열의 포착 및 검출을 증강시킨다.In some embodiments, characterizing the polynucleotide fragments excised from genomic DNA (gDNA) is part of the workflow for determining the fraction of distribution. These fragment specifications may include, for example, the sequence, length and secondary structure of these fragments. In some embodiments, fragment specification enhances capture and detection of specific sequences by the nanopore device.
일부 실시형태에서, 표적 및 참조 단편은 상이한 페이로드 분자들에 결합되며, 따라서 표적/페이로드 및 참조 페이로드 분자는 충분히 상이한 나노포어 이벤트 신호를 생성한다. 일부 실시형태에서, 상이한 이벤트 신호는 이벤트 기간, 이벤트 최대 깊이, 이벤트 평균 깊이, 및/또는 다른 이벤트 특성들의 조합이다.In some embodiments, the target and reference fragments bind to different payload molecules, such that the target/payload and reference payload molecules produce sufficiently different nanopore event signals. In some embodiments, the different event signals are combinations of event duration, event maximum depth, event average depth, and/or other event characteristics.
일부 실시형태에서, 표적 및 참조 분석물은, 각각의 분자 또는 복합체 유형(표적-페이로드, 참조-페이로드)이 포어를 통과할 때 독특한 나노포어 이벤트 신호가 발생되는 서열 특이적 페이로드에 의해 구별된다. 구별을 용이하게 하기 위해 각각의 분자 유형에 결합하는 페이로드에 결합된 프로브를 사용하는 방법은 국제 공개 WO/2015/171169, "나노포어를 이용한 표적 검출," 국제 공개 WO/2014/182634, "나노포어 및 융합 단백질 결합제를 사용하는 생물학적 표적 검출 방법," 국제 공개 WO/2016/049657, "합성 프로브의 나노포어 감지에 의한 표적 서열 검출," 국제 공개 WO/2016/126746, "시료 백그라운드로부터 표적 폴리뉴클레오타이드의 나노포어 검출" 및 국제 공개 WO/2017/173392, "단편화 및 페이로드 결합에 의한 시료 백그라운드로부터의 표적 뉴클레오타이드의 나노포어 구별"에 기재되어 있으며, 이들은 각각 그 전체가 참조로서 본 명세서에 포함된다.In some embodiments, the target and reference analytes are sequence-specific payloads in which a unique nanopore event signal is generated as each molecule or complex type (target-payload, reference-payload) passes through the pore. distinguished Methods of using probes bound to payloads that bind to each molecular type to facilitate differentiation are described in International Publication WO/2015/171169, "Target Detection Using Nanopores," International Publication WO/2014/182634, " Methods for detecting biological targets using nanopores and fusion protein binding agents, "International Publication WO/2016/049657, "Target Sequence Detection by Nanopore Detection of Synthetic Probes," International Publication WO/2016/126746, "Target from Sample Background" Nanopore Detection of Polynucleotides” and International Publication WO/2017/173392, “Distinguishing Nanopores of Target Nucleotides from Sample Background by Fragmentation and Payload Binding,” each of which is incorporated herein by reference in its entirety. Included.
일부 실시형태에서, 표적 및/또는 참조 분석물은 dsDNA이며, 이때, 독특한 페이로드-결합된 PNA는 각각의 dsDNA 유형(표적 및 참조)에 침범하여 나노포어를 이용하여 검출되는 2개의 거대분자 유형을 생성한다. 일부 실시형태에서, 표적 및/또는 참조 분석물은 DNA 또는 RNA를 포함하는 단일 가닥 핵산(ssNA)이다. 페이로드-결합된 상보적 핵산(예를 들어 LNA)은 ssNA 상의 영역에 혼성화하고, 하나 이상의 측면(flanking) 프라이머는 ssNA의 다른 영역에 혼성화하여, 페이로드가 결합된 이중 가닥 분자를 생성하고, 이러한 페이로드는 독특한 표적 및 참조 이벤트 프로파일을 생성하기 위해 표적 및 참조에 대해 독특하다.In some embodiments, the target and/or reference analyte is a dsDNA, wherein a unique payload-bound PNA invades each dsDNA type (target and reference) and two macromolecular types detected using nanopores create In some embodiments, the target and/or reference analyte is a single stranded nucleic acid (ssNA) comprising DNA or RNA. A payload-bound complementary nucleic acid (e.g., LNA) hybridizes to a region on the ssNA, and one or more flanking primers hybridize to another region of the ssNA, resulting in a double-stranded molecule to which the payload is bound; These payloads are unique to the target and reference to create a unique target and reference event profile.
분포 분율 프레임워크Distribution Fraction Framework
일부 실시형태에서, 분포 분율 프레임워크는 1) 표적 분석물 및 참조 유형 둘 다에 대해 시료 물질을 나노포어 감지 포맷으로 전환하기 위해 생화학 방법을 디자인하고 적용하는 것; 2) 특정한 나노포어 실험 프로토콜을 적용하는 것; 및 3) 참조 분석물에 대한 표적 분석물의 상대 존재비에 대한 정량적 추정치를 발생시키기 위해 분석 방법을 적용하는 것을 수반한다. 이 섹션은 프레임워크의 파트 1에 초점이 맞춰져 있다.In some embodiments, the fraction of distribution framework comprises: 1) designing and applying biochemical methods to convert a sample material into a nanopore sensing format for both a target analyte and a reference type; 2) applying a specific nanopore experimental protocol; and 3) applying the analytical method to generate a quantitative estimate of the relative abundance of the target analyte to the reference analyte. This section focuses on
나노포어 검출을 위한 시료 제조Sample preparation for nanopore detection
표적 서열을 포함하는 분자("표적 분석물" 또는 "표적 분자"로 지칭됨) 및 참조 서열을 포함하는 분자("참조 분석물" 또는 "참조 분자"로 지칭됨)는 물리적으로 유사할 수 있으며: 예를 들어 표적 분자 및 참조 분자는 유사한 분자량 또는 폴리뉴클레오타이드 길이를 가질 수 있고, 오로지 단일 뉴클레오타이드만큼 상이할 수 있다. 생화학 방법의 목표는 나노포어를 통한 전위 시 별개의 "표적" 또는 "참조" 이벤트 프로파일을 생성하기 위해 편견 없이 표적 분자 및 참조 분자를 제공하는 것이다. 이러한 방식으로, 나노포어 상에서 측정된 표적:참조 혼합물은 시료 내 표적:참조 농도 비율을 나타낸다.A molecule comprising a target sequence (referred to as a “target analyte” or “target molecule”) and a molecule comprising a reference sequence (referred to as a “reference analyte” or “reference molecule”) may be physically similar and : For example, a target molecule and a reference molecule may have similar molecular weights or polynucleotide lengths, and may differ only by a single nucleotide. The goal of biochemical methods is to provide target molecules and reference molecules without bias to generate distinct “target” or “reference” event profiles upon translocation through nanopores. In this way, the target:reference mixture measured on the nanopore represents the target:reference concentration ratio in the sample.
일부 용도 경우에서, 별개의 이벤트 프로파일을 발생시키기 위해 표적, 참조, 또는 두 분자 모두에 폴리뉴클레오타이드 서열을 첨가하는 것이 유리할 수 있다. 예를 들어, 혈액 또는 소변의 세포-무함유 순환하는 DNA 분율로부터 수득되는 대부분의 DNA 단편은 균일하게 짧은 150 bp 내지 200 bp 길이이다. PCR, 연결 및 직접적인 올리고뉴클레오타이드 혼성화를 포함하는 보편적인 방법들에 의한 폴리뉴클레오타이드 서열의 첨가는 나노포어 이벤트 구분을 최대화하기 위해 유연성(flexibility)을 허용한다. 다른 경우에서, 공유 결합된 중합체 페이로드를 운반하는 화학적으로 변형된 올리고뉴클레오타이드 프로브의 혼성화는, 폴리뉴클레오타이드 길이에 영향을 주지 않으면서 표적 또는 참조 분석물 전하 및 분자량을 변경시키는 데 사용된다. 모든 경우들에서, 목표는 표적 분자 및 참조 분자 그룹마다 구별되는 이벤트 프로파일이다.In some use cases, it may be advantageous to add polynucleotide sequences to the target, reference, or both molecules to generate distinct event profiles. For example, most DNA fragments obtained from cell-free circulating DNA fractions of blood or urine are uniformly short 150 bp to 200 bp in length. Addition of polynucleotide sequences by common methods including PCR, ligation and direct oligonucleotide hybridization allows flexibility to maximize nanopore event discrimination. In other cases, hybridization of chemically modified oligonucleotide probes carrying covalently linked polymeric payloads is used to alter target or reference analyte charge and molecular weight without affecting polynucleotide length. In all cases, the goal is a distinct event profile per target molecule and reference molecule group.
나노포어 감지 전에 PCR을 할 필요 없이 없이 풍부화(enrichment) 전략이 사용될 수 있는 충분한 출발 물질이 존재하는 GMO 예(GMO 표적 서열을 함유하는 대두 종자의 부분량)를 포함하는 용도 경우들이 존재한다. 혈액 또는 소변 시료가 유체 1 mL 당 10개 미만의 표적 서열을 함유할 수 있을 것이기 때문에, 풍부화의 일부로서 PCR이 요구되는 액체 생검을 포함하는 다른 경우들이 존재한다. 제안된 방법은 시료 수합, 정제 및 표적 및 참조의 농도를 포함하는 시료 프렙(prep) 필요조건에 아그노스틱(agnostic)하다. 나노포어 측정 및 후속적인 분포 분율 정량화는, 표적 및 참조가 백그라운드(< 1 pM)와 비교하여 충분히 풍부화되고(> 10 pM) 표적 및 참조 분석물이 서로, 및 백그라운드가 존재하는 경우 백그라운드로부터 구분될 수 있는 전기적 이벤트 신호를 생성하는 한, 실시될 수 있다.There are use cases involving GMO examples (partial amounts of soybean seeds containing GMO target sequences) where there is sufficient starting material that an enrichment strategy can be used without the need for PCR prior to nanopore detection. There are other cases involving liquid biopsies where PCR as part of the enrichment is required, as blood or urine samples may contain less than 10 target sequences per mL of fluid. The proposed method is agnostic to sample preparation requirements including sample collection, purification and concentration of target and reference. Nanopore measurements and subsequent quantification of the fraction of the distribution indicate that the target and reference are sufficiently enriched (>10 pM) compared to the background (< 1 pM) and that the target and reference analytes are distinct from each other and from the background if a background is present. As long as it generates an electrical event signal that can be implemented, it can be implemented.
일부 실시형태에서, 표적 또는 참조 분석물은 20 nt 내지 100,000 nt 길이의 폴리뉴클레오타이드 서열(이중 가닥 및 단일 가닥 DNA, RNA 및 합성 폴리뉴클레오타이드 포함)을 포함한다. 일부 실시형태에서, 표적 서열을 포함하는 폴리뉴클레오타이드는 식물, 인간, 동물, 곤충, 박테리아 또는 바이러스를 포함하는 유기체의 gDNA로부터 유래된다. 일부 실시형태에서, 표적 폴리뉴클레오타이드 서열은, 플라스미드, BAC, 선형 서열-입증된 유전자 블록, 발현 카세트를 포함한 공급원들로부터의 이중 또는 단일 가닥 RNA 또는 DNA를 포함하는 외인성 비-게놈 서열로부터 유래된다.In some embodiments, the target or reference analyte comprises a polynucleotide sequence (including double- and single-stranded DNA, RNA and synthetic polynucleotides) between 20 nt and 100,000 nt in length. In some embodiments, the polynucleotide comprising the target sequence is derived from the gDNA of an organism, including a plant, human, animal, insect, bacterium, or virus. In some embodiments, the target polynucleotide sequence is derived from an exogenous non-genomic sequence comprising double or single stranded RNA or DNA from sources including plasmids, BACs, linear sequence-proven gene blocks, expression cassettes.
일부 실시형태에서, 본 발명자들은 나노포어 장치에 의한 분포 분율(예를 들어 복제수 변이) 검출에 특이적인 풍부화를 제공한다. 일부 실시형태에서, 본 발명자들은 나노포어에 의한 검출을 위한 시료를 제조하기 위해 부위-특정 단편화 방법을 사용한다. 일부 실시형태에서, 본원에 제공된 검출 방법은 20 nt 내지 100,000 nt 크기 또는 염기쌍 길이로의 핵산 시료, 예를 들어 gDNA의 폴리뉴클레오타이드 단편화의 업스트림 단편화를 포함한다. 일부 실시형태에서, 핵산은 제한 효소를 사용하거나 Cas9/sgRNA, TALENS, 징크 핑거 단백질 / 뉴클레아제를 포함하는 부위-특정 뉴클레아제를 사용함으로써 또는 당업계에 공지된 또 다른 단편화 방법에 의해 서열-특이적으로 단편화된다.In some embodiments, we provide enrichment specific for detection of a distribution fraction (eg, copy number variation) by a nanopore device. In some embodiments, we use site-specific fragmentation methods to prepare samples for detection by nanopores. In some embodiments, the detection methods provided herein comprise upstream fragmentation of a polynucleotide fragmentation of a nucleic acid sample, eg, gDNA, from 20 nt to 100,000 nt in size or base pairs in length. In some embodiments, the nucleic acid is sequenced using restriction enzymes or by using site-specific nucleases, including Cas9/sgRNA, TALENS, zinc finger protein/nucleases, or by another fragmentation method known in the art. -specifically fragmented.
일부 실시형태에서, 표적 또는 참조 분석물 풍부화는 표적 단편 크기를 보유하며, 폐기하고 용출시키기 위해 양성 및 음성 크기 선별을 사용하여 수행된다. 예를 들어, 고분자량 폴리뉴클레오타이드 종(예를 들어 > 8,000 bp DNA)을 보유하고 폐기하기 위해 PEG의 존재 시 낮은 비율의 SPRI 비드:DNA(0.6), 후속해서 단편 크기(예를 들어 2000 bp 내지 8000 bp)를 결합하며, 세척하고 용출시키기 위해 SPRI 비드:DNA(1.5:1)를 사용한다. 일부 실시형태에서, 표적 또는 참조 핵산은 나노포어에서 검출을 용이하게 하기 위해 핵산 증폭을 수행할 수 있다.In some embodiments, target or reference analyte enrichment is performed using positive and negative size selection to retain, discard and elute the target fragment size. For example, a low ratio of SPRI beads:DNA (0.6) in the presence of PEG to retain and discard high molecular weight polynucleotide species (e.g. >8,000 bp DNA), followed by fragment size (e.g. 2000 bp to 8000 bp), use SPRI beads:DNA (1.5:1) for washing and eluting. In some embodiments, the target or reference nucleic acid may be subjected to nucleic acid amplification to facilitate detection in the nanopore.
나노포어 검출Nanopore detection
분포 분율 프레임워크는, 1) 표적 분석물 및 참조 유형 둘 다에 대해, 시료 물질을 나노포어 감지 포맷으로 전환시키기 위해 생화학 방법을 디자인하고 적용하는 단계; 2) 특정한 나노포어 실험 프로토콜을 적용하는 단계; 및 3) 참조 분석물에 대한 표적 분석물(표적: 참조)의 부분량에 대한 정량적 추정치를 발생시키기 위해 수학적 방법을 적용하는 단계를 수반한다. 이 섹션은 파트 2, 실험 프로토콜에 초점을 맞춘다.The fraction of distribution framework comprises the steps of: 1) designing and applying a biochemical method to convert a sample material into a nanopore sensing format, for both a target analyte and a reference type; 2) applying a specific nanopore experimental protocol; and 3) applying a mathematical method to generate a quantitative estimate of the partial amount of the target analyte (target: reference) relative to the reference analyte. This section focuses on
혼합된 미공지 시료 내 표적 분석물의 참 상대 존재비의 개선된 추정치를 제공하기 위해 나노포어에서 진행되는 시료의 반복(iteration)이 본원에 기재된다. 일부 실시형태에서, 표적 분석물 및 참조 분석물은 나노포어 센서를 사용하여 각각의 종들 사이에서 신뢰할 만한 구별을 보장하기 위해 제조된다. 일부 실시형태에서, 표적 서열을 포함하는 단편(즉, "표적 단편")의 특징 및 참조 서열을 포함하는 단편(즉, "참조 단편")의 특징은, 2개의 단편들이 하나 이상의 신호 특성에 의해 구별될 수 있는 나노포어 이벤트 신호를 생성하도록 선택된다.An iteration of a sample run in nanopores is described herein to provide an improved estimate of the true relative abundance of a target analyte in a mixed unknown sample. In some embodiments, target analytes and reference analytes are prepared using nanopore sensors to ensure reliable discrimination between the respective species. In some embodiments, characteristics of a fragment comprising a target sequence (i.e., a "target fragment") and a fragment comprising a reference sequence (i.e., a "reference fragment") are such that the two fragments are determined by one or more signal properties. selected to generate a distinguishable nanopore event signal.
일부 실시형태에서, 하나 이상의 대조군 혼합물(즉, 대조군 시료)은, 미공지 혼합물 내 참조에 대한 표적의 부분량의 추정치를 교정하기 위해 사용된다. 일부 실시형태에서, 교정은 표적 분자 유형과 참조 분자 유형 사이에서 나노포어 포착 효율의 차이를 보상한다.In some embodiments, one or more control mixtures (ie, control samples) are used to calibrate an estimate of the partial amount of target relative to a reference in an unknown mixture. In some embodiments, the calibration compensates for differences in nanopore capture efficiency between the target molecule type and the reference molecule type.
일부 실시형태에서, 표적 분석물과 참조 분석물의 미공지 혼합물은 나노포어 상에서 측정되고, 참조에 대한 표적의 분율 존재비는 수학적으로 정량화된다. 일부 실시형태에서, 동일한 시료로부터 유래되는 표적 분자와 참조 분자 유형의 하나 초과의 미공지 혼합물은 동일한 나노포어 상에서 순차적으로 측정된다. 일부 실시형태에서, 동일한 시료로부터 유래되는 표적 분자와 참조 분자 유형의 하나 초과의 미공지 혼합물은 상이한 나노포어 상에서 동시에 측정된다.In some embodiments, the unknown mixture of target analyte and reference analyte is measured on the nanopores and the fraction abundance of target relative to reference is quantified mathematically. In some embodiments, more than one unknown mixture of target molecule and reference molecule type derived from the same sample is sequentially measured on the same nanopore. In some embodiments, more than one unknown mixture of target molecule and reference molecule type derived from the same sample is measured simultaneously on different nanopores.
일부 실시형태에서, 100% 표적 단독, 100% 참조 단독, 및 표적 분자와 참조 분자의 공지된 혼합물을 포함하는 하나 이상의 대조군이 미공지 혼합물 이전 및/또는 이후에 나노포어 상에서 측정된다.In some embodiments, one or more controls comprising 100% target alone, 100% reference alone, and a known mixture of target and reference molecules are measured on the nanopores before and/or after the unknown mixture.
일부 실시형태에서, 실험 프로토콜은 미공지 혼합물을 나노포어 상에서 진행시키기 이전 또는 이후에, 또는 이전 및 이후에, 나노포어 상에서 하나 이상의 대조군을 순차적으로 진행시키는 단계를 수반한다. 대조군은 100% 표적 분석물 또는 100% 참조 분석물로 구성될 수 있고, 이들은 "단리된 대조군"으로 지칭된다. 대조군은 또한, "혼합물 대조군" 또는 "대조군 혼합물"로 지칭되는 표적 분석물과 참조 분석물의 임의의 공지된 혼합물일 수 있다. 대조군 혼합물은 1:1 비율의 표적:참조 분석물, 또는 임의의 다른 비율의 표적:참조 분석물, 0.01:1 내지 100:1, 또는 0.01:1 미만의 임의의 비율(예를 들어 0.001:1) 또는 100:1 초과의 임의의 비율(예를 들어 1000:1)의 표적:참조 분석물일 수 있을 것이다. 하나 이상의 대조군은 1회 초과로 진행될 수 있다. 대조군(단리된 대조군 및 혼합물 대조군) 및 미공지 혼합물은 동일한 나노포어 상에서 임의의 순서로 순차적으로 진행될 수 있다. 대조군과 미공지 시료 사이에서, 나노포어가 분자를 포착하는 유체 채널(즉, 챔버)이 플러싱(flush)된다.In some embodiments, the experimental protocol involves sequentially running one or more controls on the nanopores before or after, or before and after running the unknown mixture on the nanopores. Controls may consist of 100% target analyte or 100% reference analyte, referred to as “isolated controls”. A control may also be any known mixture of a target analyte and a reference analyte, also referred to as a “mixture control” or “control mixture”. The control mixture may be a 1:1 ratio of target:reference analyte, or any other ratio of target:reference analyte, from 0.01:1 to 100:1, or any ratio less than 0.01:1 (eg 0.001:1). ) or any ratio greater than 100:1 (eg 1000:1) of target:reference analyte. One or more controls may be run more than once. Control (isolated control and mixture control) and unknown mixture can be run sequentially in any order on the same nanopore. Between the control and unknown samples, the fluid channels (ie chambers) in which the nanopores trap molecules are flushed.
일부 실시형태에서, 어떠한 대조군도 진행되지 않고, 오로지 미공지 혼합물만 진행되고, 별개의 선행 실험에서 대조군을 진행시킴으로써 구축된 참조 표와 비교되고, 즉, 대조군은 사용 시점에 진행되지 않는다.In some embodiments, no controls are run, only unknown mixtures are run and compared to a reference table constructed by running controls in separate prior experiments, ie, no controls run at the time of use.
일부 실시형태에서, 하나 이상의 유체적으로 단리된 채널 및 나노포어 센서는 미공지를 측정하는 하나 이상의 유체적으로 단리된 채널 및 나노포어 센서와 동시에 대조군을 측정하고 있다. 1개 초과의 나노포어가 각각의 유체 채널에 접근할 수 있을 것이다. 동시화된 실행에서, 플러싱은 필요하지 않을 수 있으며, 그 이유는 각각의 포어가 오로지 1개의 시약 세트, 즉 대조군(단리된 또는 혼합물) 또는 미공지(1개 이상의 미공지 세트)를 보기 때문이다.In some embodiments, the one or more fluidly isolated channel and nanopore sensors are measuring controls simultaneously with the one or more fluidly isolated channels and nanopore sensors measuring unknowns. More than one nanopore may access each fluidic channel. In a synchronized run, flushing may not be necessary, since each pore sees only one set of reagents, either a control (isolated or mixture) or unknown (one or more unknown sets).
일부 실시형태에서, 대조군 혼합물 농도에서 표적 분석물에 대한 참조 분석물의 비율은 미공지 시료 내 표적 분석물에 대한 참조 분석물의 예상된 비율에 근접하며, 그렇긴 하지만 이것은 미리 공지되지 않을 수 있다.In some embodiments, the ratio of reference analyte to target analyte in the control mixture concentration approximates the expected ratio of reference analyte to target analyte in an unknown sample, although this may not be known in advance.
임의의 수의 미공지 혼합물이 동일한 나노포어 상에서 순차적으로 진행될 수 있으며, 각각의 새로운 미공지가 측정을 위해 첨가되기 전에 선행 미공지를 플러싱 아웃시킬 수 있다. 이는, 미공지 혼합물이 동일한 표적 및 참조 분석물 유형으로 구성될 것을 필요로 하며, 그렇긴 하지만 이들의 비율은 상이한 미공지에서 동일하거나 상이할 수 있다.Any number of unknown mixtures can be run sequentially on the same nanopore, and each new blank can be flushed out before each new blank is added for measurement. This requires that the unknown mixture be composed of the same target and reference analyte types, although their proportions may be the same or different in different unknowns.
각각의 기록 기간은 각각의 시약 유형에 대해 적어도 100개의 이벤트를 검출하기에 충분할 정도로 길어야 하고, 더 많은 이벤트들이 기록됨에 따라 성능이 개선되고, 여기서, 개선은 500개 초과의 이벤트가 기록되는 경우 유의하고, 1000개 초과의 이벤트가 기록되는 경우 매우 유의하다. 각각의 시약 세트에 대한 기록 기간은 동일하거나 상이할 수 있다. 적응 반응식(adaptive scheme)은 표적 수의 분자가 검출되는 경우 동적으로 기록하는 것을 중단할 수 있다. 본 발명자들은, 제시된 작업 흐름에서 임의의 시약 세트(대조군 또는 미공지)에 적용될 수 있는 요망되는 신뢰도 수준(예를 들어 95%, 98%, 99%, 99.9% 등)을 달성하는 데 필요한 분자의 수를 결정하기 위한 방법을 이전에 구축하였다(문헌[SI Section 10.2, Morin, Trevor J, Tyler Shropshire, Xu Liu, Kyle Briggs, Cindy Huynh, Vincent Tabard-Cossa, Hongyun Wang, and William B Dunbar. "Nanopore-Based Target Sequence Detection." Edited by Meni Wanunu. PloS One 11, no. 5 (May 5, 2016): e0154426-21. doi:10.1371/journal.pone.0154426]).Each recording period should be long enough to detect at least 100 events for each reagent type, and performance improves as more events are recorded, where the improvement is significant when more than 500 events are recorded. and is very significant if more than 1000 events are logged. The recording period for each reagent set may be the same or different. An adaptive scheme can stop recording dynamically when a target number of molecules is detected. The inventors have determined that the molecular weight required to achieve a desired level of confidence (eg 95%, 98%, 99%, 99.9%, etc.) can be applied to any set of reagents (control or unknown) in a given workflow. Methods for determining numbers have previously been constructed (SI Section 10.2, Morin, Trevor J, Tyler Shropshire, Xu Liu, Kyle Briggs, Cindy Huynh, Vincent Tabard-Cossa, Hongyun Wang, and William B Dunbar. "Nanopore." -Based Target Sequence Detection." Edited by Meni Wanunu.
일부 실시형태에서, 단일 나노포어를 이용한 실험 프로토콜은 1) 기록 기간 T에 대한 100% 표적, 2) 나노포어 챔버 플러쉬, 3) 기록 기간 T에 대한 100% 참조, 4) 나노포어 챔버 플러쉬, 5) 기록 기간 T에 대한 50:50 표적:참조 혼합물, 6) 나노포어 챔버 플러쉬, 7) 기록 기간 T에 대한 미공지 혼합물을 진행하는 것이다. 기록 기간 T는 15초, 30초, 45초, 1분, 5분, 10분, 또는 1초 내지 15초 또는 10분 내지 60분 사이의 임의의 기간일 수 있다.In some embodiments, the experimental protocol using single nanopores is 1) 100% target for writing period T, 2) nanopore chamber flush, 3) 100% reference for writing period T, 4) nanopore chamber flush, 5 ) 50:50 target:reference mixture for writing period T, 6) nanopore chamber flush, 7) unknown mixture for writing period T. The writing period T may be 15 seconds, 30 seconds, 45 seconds, 1 minute, 5 minutes, 10 minutes, or any period between 1 second and 15 seconds or 10 minutes and 60 minutes.
또 다른 보편적인 실험 프로토콜은 (1) 내지 (7)을 진행하고, 후속해서 8) 나노포어 챔버 플러쉬, 9) 기록 기간 T에 대한 100% 표적 반복, 10) 나노포어 챔버 플러쉬, 11) 기록 기간 T에 대한 100% 참조 반복, 12) 나노포어 챔버 플러쉬, 13) 기록 기간 T에 대한 50:50 표적:참조 혼합물의 반복을 진행하는 것이다.Another common experimental protocol is to proceed with (1) to (7) followed by 8) nanopore chamber flush, 9) 100% target repeat for recording period T, 10) nanopore chamber flush, 11)
또 다른 보편적인 실험 프로토콜은 (1) 내지 (7)을 진행하고, 후속해서 8) 나노포어 챔버 플러쉬, 9) 기록 기간 T에 대한 50:50 표적:참조 혼합물 반복, 10) 나노포어 챔버 플러쉬, 11) 기록 기간 T에 대한 100% 참조 반복, 12) 나노포어 챔버 플러쉬, 13) 기록 기간 T에 대한 100% 표적 반복을 진행하는 것이다.Another common experimental protocol is to proceed with (1) to (7) followed by 8) nanopore chamber flush, 9) 50:50 target:reference mixture repeat for recording period T, 10) nanopore chamber flush, 11) 100% reference repeat for writing period T, 12) nanopore chamber flush, 13) 100% target repeat for writing period T.
보다 또 다른 보편적인 실험 프로토콜은 1) 기록 기간 T에 대해, 미공지 혼합물 내 표적:참조 비율에 대략 근접한 것으로 의심되는 표적:참조 대조군 혼합물 비율, 2) 나노포어 챔버 플러쉬, 3) 기록 기간 T에 대한 미공지 혼합물을 진행하는 것이다.Another more common experimental protocol is 1) for a recording period T, a suspected target:reference control mixture ratio that approximates the target:reference ratio in the unknown mixture, 2) a nanopore chamber flush, 3) for a recording period T It is to proceed with an unknown mixture.
보다 또 다른 보편적인 실험 프로토콜은 1) 기록 기간 T에 대한 1:1 표적:참조 대조군 혼합물 비율, 2) 나노포어 챔버 플러쉬, 3) 기록 기간 T에 대한 미공지 혼합물을 진행하는 것이다.Another more common experimental protocol is to run 1) a 1:1 target:reference control mixture ratio for a recording period T, 2) a nanopore chamber flush, 3) an unknown mixture for a recording period T.
일부 실시형태에서, 단일 나노포어를 이용한 실험 프로토콜은 1) 기록 기간 T에 대한 100% 표적, 2) 나노포어 챔버 플러쉬, 3) 기록 기간 T에 대한 100% 참조, 4) 나노포어 챔버 플러쉬, 5) 기록 기간 T에 대한 미공지 혼합물을 진행하는 것이다.In some embodiments, the experimental protocol using single nanopores is 1) 100% target for writing period T, 2) nanopore chamber flush, 3) 100% reference for writing period T, 4) nanopore chamber flush, 5 ) to proceed with the unknown mixture for the recording period T.
일부 실시형태에서, 단일 나노포어를 이용한 실험 프로토콜은 1) 기록 기간 T에 대한 100% 표적, 3) 나노포어 챔버 플러쉬, 4) 기록 기간 T에 대한 미공지 혼합물을 진행하는 것이다.In some embodiments, the experimental protocol using single nanopores is 1) running 100% target for writing period T, 3) nanopore chamber flush, 4) unknown mixture for writing period T.
일부 실시형태에서, 단일 나노포어를 이용한 실험 프로토콜은 1) 기록 기간 T에 대한 100% 참조, 2) 나노포어 챔버 플러쉬, 3) 기록 기간 T에 대한 미공지 혼합물을 진행하는 것이다.In some embodiments, the experimental protocol with single nanopores is 1) 100% reference for writing period T, 2) flushing the nanopore chamber, 3) running unknown mixture for writing period T.
일부 실시형태에서, 단일 나노포어를 이용한 실험 프로토콜은 기록 기간 T에 대한 미공지 혼합물만 진행하고, 순람표(lookup table) 유래의 데이터 또는 100% 참조 대조군 시료, 100% 표적 대조군 시료, 공지된 표적:참조 대조군 혼합물, 또는 이들의 임의의 조합으로부터 유래되는 오차 보정 정보를 함유하는 이전의 데이터를 사용하여, 미공지 혼합물 내 표적 분석물의 분포 분율의 추정치를 개선하기 위해 기록 기간 T로부터 발생된 데이터에 적어도 하나의 보정항을 제공하는 것이고, 각각은 미공지 혼합물에 대한 실험 프로토콜과 실질적으로 유사한 조건 하에 진행된다.In some embodiments, experimental protocols using single nanopores run only unknown mixtures for a recording period T, data from a lookup table or 100% reference control sample, 100% target control sample, known target : Using previous data containing error correction information derived from a reference control mixture, or any combination thereof, to the data generated from the recording period T to improve the estimate of the fraction of distribution of the target analyte in the unknown mixture. At least one correction term is provided, each run under conditions substantially similar to the experimental protocol for the unknown mixture.
실험 프로토콜의 완료 시, 대조군(진행되는 경우)으로부터 기록된 이벤트 및 미공지(들)로부터 기록된 이벤트는 하나 이상의 미공지 내 참조에 대한 표적의 분율 양을 예측하기 위해 수학적으로 분석된다.Upon completion of the experimental protocol, events recorded from controls (if ongoing) and events recorded from unknown(s) are mathematically analyzed to predict the fractional amount of target relative to one or more unknowns in reference.
분포 분율 추정 및 역치 결정Estimating the distribution fraction and determining the threshold
분포 분율 프레임워크는: 1) 생화학 방법을 디자인하고 적용하여, 표적 분석물 및 참조 유형 둘 다에 대해 시료 물질을 나노포어 감지 포맷으로 전환시키는 단계; 2) 특정한 나노포어 실험 프로토콜을 적용하는 단계; 및 3) 수학적 방법을 적용하여, 참조 분석물에 대한 표적 분석물(표적:참조)의 부분량에 대한 정량적 추정치를 발생시키는 단계를 수반한다. 이 섹션은 프레임워크의 파트 3에 초점을 맞춘다.The fraction of distribution framework comprises the steps of: 1) designing and applying biochemical methods to convert sample materials into nanopore sensing formats for both target analytes and reference types; 2) applying a specific nanopore experimental protocol; and 3) applying a mathematical method to generate a quantitative estimate of the partial amount of the target analyte (target:reference) relative to the reference analyte. This section focuses on
일부 경우, 참조 서열 "r"에 대한 표적 서열 "t"의 추정된 농도비 R=[t]/[r]이 정량화된다. 이식유전자 백분율 또는 GMO%는 백분율로 전환된 R 비율이다. 일부 경우, 전체(표적 서열 + 참조 서열)에 대한 표적 서열의 추정된 부분량 F=[t]/([t]+[r])이 정량화된다. 비율 R과 분율 F 사이에 간단한 전환, 즉, F = R/(R+1) 또는 동등하게는 R = F/(1-F)가 존재한다.In some cases, the estimated concentration ratio R=[t]/[r] of the target sequence “t” to the reference sequence “r” is quantified. Percent transgene or % GMO is the ratio of R converted to a percentage. In some cases, the estimated partial amount of the target sequence F=[t]/([t]+[r]) relative to the whole (target sequence + reference sequence) is quantified. There is a simple conversion between the ratio R and the fraction F, ie F = R/(R+1) or equivalently R = F/(1-F).
분포 분율 방법은 참조에 대한 표적, 또는 전체(표적 및 참조의 합)에 대한 표적의 상대량을 예측한다. 일부 실시형태에서, 칼리브런트(calibrant) 분자가 부가되어, 표적 분자 또는 참조 분자의 절대 농도를 결정할 수 있다. 일부 실시형태에서, 단일 나노포어 이벤트 특징은 분포 분율을 계산하기 위해 표적 분석물 유형과 참조 분석물 유형 사이에서 비교된다. 일부 실시형태에서, 1개 초과의 나노포어 이벤트가 분포 분율을 계산하기 위해 표적 분석물 유형과 참조 분석물 유형 사이에서 비교된다.The fractional distribution method predicts a target relative to a reference, or a relative amount of a target to the whole (sum of target and reference). In some embodiments, a calibrant molecule may be added to determine the absolute concentration of the target molecule or reference molecule. In some embodiments, single nanopore event characteristics are compared between a target analyte type and a reference analyte type to calculate a distribution fraction. In some embodiments, more than one nanopore event is compared between a target analyte type and a reference analyte type to calculate a distribution fraction.
표적 분석물 및 참조 분석물과 상관관계가 있는 이벤트 신호를 구분하기 위해 역치 결정을 개선하고 분포 분율을 결정하며 나노포어로부터의 이벤트 신호의 사용으로부터 오차를 보정하기 위해 본 발명자들이 본원에 기재하고 있는 3가지 방법들이 존재한다: 1)Q-테스트 방법, 2) 서포트 벡터 머신(SVM) 및 3) 가우시안 혼합 방법에 대한 기댓값 최대화 알고리즘(EMGM).To improve threshold determination, determine distribution fractions, and correct for errors from the use of event signals from nanopores to discriminate event signals correlated with target and reference analytes, the inventors described herein Three methods exist: 1)Q -test method, 2) Support Vector Machine (SVM) and 3) Expected Value Maximization Algorithm (EMGM) for Gaussian Mixing Method.
하기의 일반적인 개념이 이러한 방법에 적용된다. 우선, 참조 분석물 "r"에 대한 표적 분석물 "t"의 참비율은 R=[t]/[r]로 지칭된다. 전체(표적 + 참조) 분석물에 대한 표적 분석물의 참분율은 F=[t]/([t]+[r])로 지칭된다. 비율 R 및 분율 F 사이에서의 간단한 전환은 F = R/(R+1) 또는 동등하게는 R = F/(1-F)이다. 미공지 혼합물의 참비율은 R혼합으로 지칭되고, 혼합물의 참분율은 F혼합으로 지칭된다. 수학적 방법은 F혼합 및 R혼합에 대한 추정치를 발생시키고, 이들은F*혼합 및R*혼합으로 지칭된다. 표적 및 참조 분자 구축물들은 별개의 나노포어 이벤트 신호를 제공하기 위해 디자인되고 생성된다.The following general concepts apply to this method. First, the true ratio of target analyte “t” to reference analyte “r” is referred to as R=[t]/[r]. The fraction of target analyte to total (target + reference) analyte is referred to as F=[t]/([t]+[r]). A simple conversion between the ratio R and the fraction F is F = R/(R+1) or equivalently R = F/(1-F). The true proportion of the unknownmixture is referred to as the R mixture, and the true proportion of themixture is referred to as the F mixture. Mathematical method to generate an estimate of the F and Rmixedblend, which are referred to asF* andR*mixedblend. Target and reference molecular constructs are designed and generated to provide distinct nanopore event signals.
Q-테스트 방법How to Q-Test
수학적 방법은 우선, 모든 기록된 이벤트들을 1개 또는 2개의 범주, 즉 표적 양성(동등하게는 참조 음성) 또는 표적 음성(동등하게는 참조 양성)으로 분류(binning)하기 위한 기준을 디자인한다. 이벤트 기준은 하나 이상의 이벤트 특징을 사용한다. 일부 실시형태에서, 단일 특징은 이벤트를 분류하기 위한 기준을 생성하는 데 사용된다. 기준이 주어지면, 모든 이벤트는 표적 이벤트 또는 참조 이벤트으로 태깅된다. 이들은 "표적-태깅된" 또는 "참조-태깅된"으로 지칭된다.The mathematical method first designs criteria for binning all recorded events into one or two categories: target positive (equivalently reference negative) or target negative (equivalently reference positive). An event criterion uses one or more event characteristics. In some embodiments, a single feature is used to generate criteria for classifying an event. Given a criterion, all events are tagged as either target events or reference events. These are referred to as “target-tagged” or “reference-tagged”.
표적-태깅된 이벤트의 분율은Q로 지칭되며, 이는 표적-태깅된 이벤트의 수를 이벤트의 총 수로 나눈 것과 동일하다. 참조-태깅된 이벤트의 분율은 1-Q이다. 태깅된 분율Q는 나노포어 상의 농도 분율 F의 함수이며,Q(F)로 기재된다.The fraction of target-tagged eventsis referred to as Q , which is equal to the number of target-tagged events divided by the total number of events. The fraction of reference-tagged events is 1-Q . The tagged fractionQ is a function of the concentration fraction F on the nanopores andis described as Q (F).
혼합물Q(F혼합) 내 표적-태깅된 이벤트의 분율은Q혼합으로 지칭되며; 100% 표적 대조군 내 표적-태깅된 이벤트Q(1)의 분율은Q표적으로 지칭되며; 100% 참조 대조군 내 표적-태깅된 이벤트Q(0)의 분율은Q참조로 지칭되며; 표적:참조 대조군 혼합물 내 표적-태깅된 이벤트의 분율은QX:Y로 지칭되고, 여기서, X:Y는 대조군 혼합물 내 표적-대-참조의 혼합물의 비율이다. 분율z = X / (X + Y)의 경우, 본 발명자들은Q(z) = QX:Y를 가진다. 일부 실시형태에서, 1:1 비율의 대조군 혼합물이 바람직하며, 이때z = 0.5이고, 태깅된 분율은Q1:1 또는Q50:50으로 기재된다.The fraction of target-tagged events in mixtureQ (mixing F) is referred to asmixingQ; The fraction of target-tagged eventsQ (1) in 100% target control is referred to as theQtarget; The fraction of target-tagged eventsQ (0) in the 100% reference control is referred to as theQreference; The fraction of target-tagged events in the target:reference control mixtureis referred to as QX:Y , where X:Y is the ratio of the target-to-reference mixture in the control mixture. For the fractionz = X / (X + Y) , we haveQ(z) = QX:Y . In some embodiments, a 1:1 ratio of the control mixture is preferred, wherez = 0.5 and the tagged fraction is described asQ1:1 orQ50:50.
전형적으로,Q표적은 1에 근접하고, 이때 1-Q표적은 위음성 분율을 나타낸다. 전형적으로,Q참조는 0에 근접하고, 이때Q참조는 위양성 분율을 나타낸다. 대조군들은Q표적>QX:Y>Q참조를 충족시킨다. 혼합물은Q표적>Q혼합>Q참조를 충족시킨다.Typically, theQtarget is close to 1, with the 1-Qtarget representing the false negative fraction. Typically, thereferenceQ is close to zero, at which timereferenceQ represents a false positive fraction. Controls satisfyQtarget>QX:Y>Qreference. The mixture satisfies theQtarget>Qmixture>Qreference.
일부 실시형태에서, 대조군들 유래의 표적-태깅된 분율(Q표적,Q참조,QX:Y)은 개별적으로 진행되고, 선람표는Q혼합을 측정하는 임의의 새로운 검정법에 대한 값을 지칭하는 데 사용된다. 일부 실시형태에서, (Q표적,Q참조,QX:Y)는 이러한 검정법의 일부로서 사용 시점에 구축된다. 일부 실시형태에서, (Q표적,Q참조)는 개별적으로 진행되고, 선람표는 이들의 값을 지칭하는 데 사용되며, 반면에 (QX:Y) 값은Q혼합을 측정하는 검정법의 일부로서 사용 시점에 구축된다.In some embodiments, target-tagged fractions from controls (Qtarget ,Q reference ,QX:Y ) are run separately, and thelookup table refers to the value for any new assay that measures theQmix. used to In some embodiments, (Qtarget ,Qreference ,QX:Y ) is built at the point of use as part of such an assay. In some embodiments, (Qtarget ,see Q) are run separately and a lookup table is used to refer to their values, while (QX:Y ) values are used as part of an assay to measureQmixing. It is built at the point of use.
일부 실시형태에서, 대조군들 유래의 표적-태깅된 분율(Q표적,Q참조,QX:Y)은 사용 시점에 1회 초과로 진행되고, 이들의 값은 하기 식에서 후속적인 사용을 위해 평균화된다.In some embodiments, target-tagged fractions from controls (Qtarget ,Qreference ,QX:Y ) are run more than once at the time of use, and their values are averaged for subsequent use in the formula .
참 부분량 F혼합에 대한 추정치F*혼합에 대한 식은 하기에 의해 주어진다:Estimate for true partial quantity FmixtureF* Theequation for mixture f is given by:

여기서,

참비율 R혼합에 대한 추정치R*혼합에 대한 식은 하기에 의해 주어진다:Estimate for the true proportion RmixtureR* Theequation for the mixture is given by:
R*혼합 = ρα(방정식 2)R*Mix= ρα (Equation 2)
이식유전자(GMO)에 대한 부분량을 예측하기 위한 실시예에서, GMO(%)는R*혼합x 100 (%)와 동일하다.In the example for predicting partial amount for transgene (GMO), GMO (%) isR*mixedx 100 (%).
파라미터ρ는 위양성 검출 오차, 위음성 검출 오차 또는 둘 다를 보상할 수 있는 비율에 대한 추정치이다. 일부 실시형태에서,Q참조의 값은 위양성 오차를 보상하는 데 사용될 수 있다. 위양성 오차에 대한 어떠한 보상도 사용되지 않는 경우,Q참조는 0으로 설정될 수 있다. 일부 실시형태에서,Q표적의 값은 위음성 오차를 보상하는 데 사용될 수 있다. 위음성 오차에 대한 어떠한 보상도 사용되지 않는 경우,Q표적은 0으로 설정될 수 있다.The parameterρ is an estimate of the rate at which false positive detection error, false negative detection error, or both can be compensated. In some embodiments,the value of Qreference may be used to compensate for false-positive errors. If no compensation for false positive error is used,Qreference may be set to zero. In some embodiments,the value of the Qtarget may be used to compensate for false negative errors. If no compensation for false negative error is used, theQtarget may be set to zero.
파라미터α는 비율 보상 배율기(ratio compensation multiplier)다. 분석적으로, 파라미터α는 2개의 포착률 상수들의 비율이다. 포착률 상수는, 주어진 분자 유형에 대한 농도로 나누어진 나노포어 이벤트 비율이다. 구체적으로, 파라미터α는 표적 분석물 포착률 상수로 나누어진 참조 분자 포착률 상수이다. 따라서, 배율기α는 표적 분자 유형과 참조 분자 유형 사이의 나노포어 포착 및 검출의 차이를 보상한다.The parameterα is a ratio compensation multiplier. Analytically, the parameterα is the ratio of the two capture rate constants. The capture rate constant is the ratio of nanopore events divided by the concentration for a given molecular type. Specifically, the parameterα is the reference molecule capture rate constant divided by the target analyte capture rate constant. Thus, the multiplierα compensates for the difference in nanopore capture and detection between the target molecule type and the reference molecule type.
대조군 혼합물이 1:1 비율인 경우,
표적 분석물과 참조 분석물 사이의 포착률 상수 차이에 대한 보상이 사용되지 않는 경우,α는 방정식 (1) 및 (2)에서 1과 동일하도록 설정되어, 각각F*혼합 및R*혼합에 대한 추정치를 제공한다.If no compensation for differences in capture rate constants between the target and reference analytes is used, thenα is set equal to 1 in equations (1) and (2), the estimates for theF*mix andR*mix, respectively. provides
방정식 (1) 및 (2)를 적용하는 것은 각각F*혼합 및R*혼합에 대한 추정치를 제공한다.F*혼합 및R*혼합에 대한 불확실성 추정치 또는 오차 막대가 또한, 계산될 수 있다. 단리된 대조군 및 혼합물 대조군에 대한 각각의Q는 이것과 연관된 표준 오차,
일부 실시형태에서, 이벤트 특징 기준에 매칭하거나 초과하는 이벤트들의 비율 또는 분율은 미공지 혼합물 내 참조에 대한 표적의 부분량을 추정하는 데 사용된다. 일부 실시형태에서, 기준은 역치이다.In some embodiments, a proportion or fraction of events that match or exceed an event characteristic criterion is used to estimate a partial amount of target relative to a reference in the unknown mixture. In some embodiments, the criterion is a threshold.
본 발명자들의 이전의 연구는, 단일 태깅 기준이Q 및 이의 오차 막대를 계산하는 데 어떻게 이용되는지를 기재하고 있다(문헌[Morin, Trevor J, Tyler Shropshire, Xu Liu, Kyle Briggs, Cindy Huynh, Vincent Tabard-Cossa, Hongyun Wang, and William B Dunbar. "Nanopore-Based Target Sequence Detection." Edited by Meni Wanunu. PloS One 11, no. 5 (May 5, 2016): e0154426-21. doi:10.1371/journal.pone.0154426]). 해당 연구에 상술된 바와 같이, 기준을 적용함으로써, 각각의 이벤트j는 이것에 할당된 변수Zj를 가진다. 이벤트j가 태깅되는 경우,Zj= 1이고; 그렇지 않으면,Zj= 0이다. 각각의 시약 세트(대조군 및 미공지)의 경우,Q = (∑jZj)/N이며, 여기서,N은 이벤트의 총 수이다. 동일한 기준이 모든 대조군, 단리물 및 혼합물 및 모든 미공지들에 적용되어, 상기 식에서 이용된 모든Q값들을 계산한다(방정식 (1) 내지 (2)).Our previous work hasdescribed how a single tagging criterion is used to calculate Q and its error bars (Morin, Trevor J, Tyler Shropshire, Xu Liu, Kyle Briggs, Cindy Huynh, Vincent Tabard). -Cossa, Hongyun Wang, and William B Dunbar. "Nanopore-Based Target Sequence Detection." Edited by Meni Wanunu.
이러한 기준은 1개 또는 1개 초과의 불균등 방정식(inequality equation)을 수반하고, 하나 이상의 이벤트 특징들의 선형 또는 비선형 함수일 수 있다. 각각의 불균등 방정식은 이와 연관된 역치 또는 역치 범위를 가진다. 따라서, 기준은 불균등 세트 및 상응하는 역치 세트에 의해 완전히 명시된다.This criterion involves one or more than one inequality equation, and may be a linear or non-linear function of one or more event characteristics. Each inequality equation has a threshold or threshold range associated with it. Thus, the criterion is fully specified by a set of inequalities and a corresponding set of thresholds.
일부 실시형태에서, 기준은 표적 분자 유형 및 참조 분자 유형의 부류에 대해 구축되고, 해당 부류에 대한 분자 유형을 사용하는 새로운 검정법이, 이미 구축된 기준을 이용할 것이다.In some embodiments, criteria are established for a class of target molecule types and reference molecule types, and new assays using molecular types for that class will use the criteria already established.
일부 실시형태에서, 기준은 임의의 새로운 검정법을 위해 수합된 대조군 데이터로부터 식별된다. 즉, 기준은 진행 시간에 분포 분율 프로토콜의 일부로서 구축된다.In some embodiments, a criterion is identified from control data pooled for any new assay. That is, the criteria are built as part of the time-to-run distribution fraction protocol.
일부 실시형태에서, 기준에 대한 불균등 세트는 유사한 표적 분자 유형 및 참조 분자 유형을 사용하여 이전의 실험 세트로부터 선험적으로 구축되는 한편, 하나 이상의 기준 불균등에 대한 역치 세트는 진행 시간에 대조군 데이터를 사용하여 구축된다.In some embodiments, a set of inequalities for a criterion is built a priori from a previous set of experiments using similar target molecule types and a reference molecule type, while a set of thresholds for one or more criterion inequalities is determined using control data at run time. is built
일부 실시형태에서, 단일 이벤트 특징은 이러한 기준을 구축하는 데 이용된다.In some embodiments, a single event characteristic is used to build this criterion.
"q"로 표지된 역치는 불균등을 기반으로 비-표적-태깅된(즉, 참조-태깅된) 이벤트으로부터 표적-태깅된 이벤트을 나눈 스칼라(scalar) 값이다. 1개 초과의 불균등이 기준에 사용되는 경우,q는 불균등 세트에 사용되는 역치값의 벡터를 나타낸다.The threshold labeled "q" is a scalar value divided by target-tagged events from non-target-tagged (ie, reference-tagged) events based on inequality. If more than one inequality is used for the criterion,q represents the vector of threshold values used for the inequality set.
표적 및 참조에 2개의 상이한 길이의 dsDNA들을 사용한 예를 고려한다. 보편적으로, 이벤트 면적을 사용한 단일 불균등은 실행 가능한 기준이다. 표적이 참조 dsDNA보다 긴 dsDNA인 경우, 면적이 역치를 초과한다면 이벤트이 태깅된다. 표적이 참조 dsDNA보다 짧은 dsDNA인 경우, 면적이 역치보다 작다면 이벤트이 태깅된다.Consider an example using dsDNAs of two different lengths for target and reference. In general, a single inequality using event area is a viable criterion. If the target is a dsDNA longer than the reference dsDNA, an event is tagged if the area exceeds a threshold. If the target is a dsDNA shorter than the reference dsDNA, an event is tagged if the area is less than the threshold.
q-역치값 또는 값들의 자동 선별에 상이한 방법들이 이용될 수 있으며, 여기서 1개의q 값은 기준에서 각각의 불균등에 의해 식별된다.Different methods may be used for automatic selection ofq-threshold values or values, where one q value is identified by each inequality in the criterion.
일부 실시형태에서,q-역치는Q참조에 대한 요망되는 위양성을 생성하는 값으로서 확인된다. 예를 들어,q-역치는 5%의 위양성을 생성하기 위해Q참조의 95 백분위수에서 설정될 수 있을 것이다. 해당 경우, 95%의 참조 분자 이벤트이q보다 작은 면적을 가진다. 대안적으로, SFTq-역치는Q표적에 대한 요망되는 위음성을 생성하는 값으로서 결정되며, 즉,q-역치는 5%의 위음성을 생성하기 위해Q표적의 5 백분위수에서 설정될 수 있을 것이다.In some embodiments, theq -threshold is identified as a value that produces a desired false positive for theQreference. For example, theq -threshold could be set at the 95th percentile ofthe Qreference to produce 5% false positives. In that case, 95% of the reference molecular events have an area less thanq. Alternatively, the SFTq -threshold is determined as a value that produces a desired false negative for theQtarget, i.e., the q -threshold could be set at the 5th percentile ofthe Qtarget to produce 5% false negatives. .
일부 실시형태에서, SFTq-역치는
일부 실시형태에서,q-역치 범위는Q참조에 대한 요망되는 위양성을 생성하는 값으로서 계산된다. 예를 들어,q-역치 범위는Q참조의 95 백분위수 내지 99 백분위수를 스패닝할 수 있을 것이다.In some embodiments, theq -threshold range is calculated as a value that produces a desired false positive for theQreference. For example, theq -threshold range may span the 95th to 99th percentileof the Qreference.
일부 실시형태에서,q-역치 범위가 이용되는 경우, 방정식 (1) 및 (2)는F*혼합(q) 및R*혼합(q) 값의 범위를 생성하고, 이들 범위의 평균은 예측된F*혼합 및R*혼합 값으로서 계산되고 기록된다.In some embodiments, when aq -threshold range is used, equations (1) and (2)produce a range of F*mixed(q) andR*mixed(q) values, the average of these ranges being the predicted Calculated and reported asF*mixed andR*mixed values.
표적 DNA 및 참조 DNA에 결합된 2개의 상이한 페이로드들을 사용하는 예를 고려한다. 보편적으로, 이벤트 평균 전도도 및 이벤트 기간을 사용한 3개의 불균등은 실행 가능한 기준이다. 구체적으로, 특정한 페이로드-표적 DNA 분자 구축물의 경우, 표적 이벤트은 평균 δG 대 기간의 2D 이벤트 플롯 상에서 독특한 부분 공간(subspace)을 생성하고, 기간이 역치보다 큰 경우, 및 평균 δG가 하나의 역치보다 크고 또 다른 역치보다 작은 경우 이벤트이 태깅된다. 이러한 경우, 태깅 기준은 2개의 이벤트 특징들(평균 δG, 기간)을 사용하여 3개의 선형 불균등 및 3개의 역치로 표시된다.Consider an example using two different payloads bound to a target DNA and a reference DNA. In general, the three inequalities using event mean conductance and event duration are viable criteria. Specifically, for a particular payload-target DNA molecule construct, the target event creates a unique subspace on a 2D event plot of mean δG versus duration, where duration is greater than a threshold, and average δG is greater than one threshold. An event is tagged if it is large and less than another threshold. In this case, the tagging criterion is represented by three linear inequalities and three thresholds using two event characteristics (mean δG, duration).
SVM 방법SVM method
일부 실시형태에서, 머신 러닝은 각각의 이벤트을 표적 분석물 이벤트 또는 참조 분석물 이벤트으로서 태깅하기 위한 특징들 및 특징 기준의 세트를 식별하는 데 사용된다. 일부 실시형태에서, 서포트 벡터 머신은 이벤트을 표적 분석물 또는 참조 분석물로서 분류하는 데 사용된다.In some embodiments, machine learning is used to identify a set of features and feature criteria for tagging each event as a target analyte event or a reference analyte event. In some embodiments, a support vector machine is used to classify events as target analytes or reference analytes.
일부 실시형태에서, 서포트 벡터 머신 작업 흐름의 개발은 하기 단계들: 1) 나노포어 데이터를 로딩하는 단계, 2) 이벤트을 구별하기 위해 나노포어 이벤트 특징들을 선별하는 단계, 3) 대조군을 사용한 모델 트레이닝 및 시험 단계, 4) 대조군을 사용한 데이터 교정 단계, 5) 미공지 표적:참조 혼합물의 예측 단계를 가진다. 일부 실시형태에서, 이미 개발되고 감소된 서포트 벡터 머신 작업 흐름은 자동화된 분포 분율 예측을 위해 실행된다.In some embodiments, development of a support vector machine workflow involves the following steps: 1) loading nanopore data, 2) selecting nanopore event features to differentiate events, 3) training the model using controls, and It has a test phase, 4) data calibration using controls, and 5) prediction of unknown target:reference mixture. In some embodiments, already developed and reduced support vector machine workflows are implemented for automated distribution fraction prediction.
일부 실시형태에서, 머신 러닝 툴은 이벤트 특징들의 선별, 불균등의 형태(선형 및/또는 비선형) 및 불균등에 사용된 역치값q를 포함하는 기준의 선별을 자동화하는 데 적용된다. 일부 실시형태에서, 분류 문제을 해결하는 슈퍼바이즈드 머신 러닝 방법, 서포트 벡터 머신(SVM)이 실행되어, 태깅 기준을 발생시킨다. SVM에 대한 참조는 문헌[Cortes, C. & Vapnik, V. Machine Learning (1995) 20: 273; and Boser, B. E., Guyon, I. M., and Vapnik, V. N. (1992). "A training algorithm for optimal margin classifiers," Proceedings of the fifth annual workshop on Computational learning theory]를 참조하며, 이들은 각각 그 전체가 참조로서 본 명세서에 포함된다.In some embodiments, the machine learning tool is applied to automate the selection of event features, the selection of the form of inequality (linear and/or non-linear), and the selection of criteria including athreshold value q used for inequality. In some embodiments, a supervised machine learning method for solving a classification problem, a support vector machine (SVM), is run to generate tagging criteria. References to SVM can be found in Cortes, C. & Vapnik, V. Machine Learning (1995) 20: 273; and Boser, BE, Guyon, IM, and Vapnik, VN (1992). "A training algorithm for optimal margin classifiers,"Proceedings of the fifth annual workshop on Computational learning theory , each of which is incorporated herein by reference in its entirety.
본 발명자들의 분포 분율 프레임워크에 SVM 방법을 적용한 일례는 하기에 제공된다:An example of applying the SVM method to our distribution fraction framework is provided below:
선형으로 분리 가능한 데이터의 경우, {x1,....,xn}을 데이터 세트로 두고,

모든 포인트들을 분류하는 경계를 최대화하기 위해, 분류 문제는 하기 최적화 문제가 된다:To maximize the boundary that classifies all points, the classification problem becomes the following optimization problem:


결정 경계선에 근접한 데이터 포인트는 서포트 벡터로 지칭된다.Data points close to the decision boundary are referred to as support vectors.
실제-단어 문제의 경우, 데이터는 통상적으로, 일부 아웃라이어(outlier) 또는 노이즈때문에 선형으로 분리 가능하지 않다. 분류를 최적화하기 위해, 몇몇 잘못 분류된 포인트들을 허용하기 위해 경계를 조정하였다. 한편, 잘못 분류된 경우들은 높은 비용이 소요되었다. 이러한 경계는 소프트 경계가 된다. 소프트 경계 분류화는 "슬랙(slack)" 변수를 비용 함수 내에 첨가함으로써 사용될 수 있다(도 3a):For real-word problems, the data are typically not linearly separable because of some outliers or noise. To optimize the classification, the boundary was adjusted to allow for some misclassified points. On the other hand, misclassified cases cost a lot of money. These boundaries become soft boundaries. Soft boundary classification can be used by adding a “slack” variable into the cost function (FIG. 3A ):


선형으로 분리 가능하지 않은 데이터를 다루는 제2 방식은 커널(kernel) 방법이다(상기 인용된 Boser, B. E. 등). 이는 입력 특징 공간을 고차원 공간으로 변환시킨다. 이렇게 함으로써, 데이터는 선형으로 분리 가능할 수 있다(도 3d). 맵핑 함수(mapping function)를 Φ(x)로서 지칭하며, 그러면 커널 함수 K는 하기와 같이 기재될 수 있다:A second way to deal with data that is not linearly separable is the kernel method (Boser, BE, et al, cited above). This transforms the input feature space into a high-dimensional space. By doing so, the data can be linearly separable (FIG. 3D ). We refer to the mapping function as Φ(x), then the kernel function K can be written as:

이용 가능한 커널 함수 유형 세트가 존재한다. 가장 보편적인 유형은 본원에 열거되어 있다:There is a set of kernel function types available. The most common types are listed herein:
선형 커널linear kernel

다항(polynomial) 커널polynomial kernel

가우시안(RBF) 커널Gaussian (RBF) kernel

통상적으로, 커널 트릭 및 소프트 경계는 둘 다 분류화 문제에 대한 보다 양호한 해결방안을 생성하기 위해 함께 사용된다.Typically, both kernel tricks and soft boundaries are used together to create a better solution to a classification problem.
SVM을 분포 분율용 나노포어 데이터에 적용하는 것은 하기 단계들을 가진다: 1) 대조군 및 미공지 데이터 세트를 로딩하며, 이들은 각각의 세트에 대한 모든 이벤트들을 포함하는 단계; 2) 특징 선별; 3) 모델 트레이닝 및 시험; 4) 데이터 교정; 및 5)F*혼합 및R*혼합의 예측. 제공된 실시예에서, 이들 5개 단계들의 적용은 보다 상세히 언급된다. 방정식 (3) 및 (4), 커널 유형을 포함하는 하이퍼-파라미터 그리드 검색, 소프트 경계 상수, 및 커널 함수가 의존할 수 있는 임의의 파라미터는 이러한 방법의 적용 일부로서 해결된다. 보편적인 결정 경계선 및 보편적인 교정비(calibration ratio)를 포함하는 SVM로부터 발생된 검정법-기반 일반화 모델은 대조군 데이터 세트의 필요 없이 미공지 혼합물에 적용될 수 있다.Applying the SVM to nanopore data for distribution fractions has the following steps: 1) loading control and unknown data sets, which contain all events for each set; 2) feature selection; 3) model training and testing; 4) data calibration; and 5) prediction ofF*mixing andR*mixing. In the examples provided, the application of these five steps is mentioned in more detail. Equations (3) and (4), hyper-parameter grid search including kernel type, soft boundary constants, and any parameters on which the kernel function may depend are solved as part of the application of this method. Assay-based generalization models generated from SVMs, including universal decision boundaries and universal calibration ratios, can be applied to unknown mixtures without the need for a control data set.
보편적인 결정 경계선 및 보편적인 교정비를 포함하는 SVM로부터 발생된 검정법-기반 일반화 모델은 대조군 데이터 세트의 필요 없이 미공지 혼합물에 적용될 수 있다. 결정 트레스(decision tress), 뉴럴 네트워크(neural network), 네이티브 바이어(Native Bayer), 로지스틱 회귀(Logistic regress), K-최근접 이웃(K-nearest neighbor) 및 부스팅(boosting)을 포함하는 다른 데이터 마이닝(mining) 방법들이 또한, 나노포어 데이터에 적용 가능한 방법으로 주장된다.Assay-based generalization models generated from SVMs containing universal decision boundaries and universal calibration ratios can be applied to unknown mixtures without the need for a control data set. Other data mining including decision tress, neural network, native Bayer, logistic regress, K-nearest neighbor and boosting Mining methods are also claimed as applicable methods for nanopore data.
EMGM 방법(가우시안 혼합에 대한 기댓값 최대화 알고리즘)EMGM Method (Expectation Maximization Algorithm for Gaussian Mixing)
일부 실시형태에서, 클러스터링 방법은 표적 이벤트 및 참조 이벤트을 태깅하기 위한 기준을 형성하는 데 적용된다. 각각의 이벤트은 표적 이벤트 또는 참조 이벤트으로서 태깅된다. 일부 실시형태에서, 분포 분율은 표적 이벤트 및 참조 이벤트의 합계와 비교하여 표적 이벤트의 비율이다. 보상 정보(compensatory information)를 제공하는 진행 대조군(running control)은 분포 분율의 추정치를 개선하는 조정을 가능하게 한다.In some embodiments, a clustering method is applied to form criteria for tagging target events and reference events. Each event is tagged as either a target event or a reference event. In some embodiments, the distribution fraction is the proportion of target events compared to the sum of target events and reference events. Running controls that provide compensatory information allow adjustments to improve estimates of the distribution fraction.
일부 실시형태에서, 클러스터링 방법은 하나 이상의 이벤트 파라미터의 분포의 파라미터화된 모델에 적용되는 최대우도법(maximum likelihood method)이다. 대조군 세트에 최우추정법(maximum likelihood estimation)을 반복적으로 적용하면, 피팅된 모델 파라미터를 초래하며, 이때 하나의 분포 세트는 표적 분석물 유형과 연관이 있고 다른 분포 세트는 참조 분석물 유형과 연관이 있다. 후속적으로, 파라미터화된 모델을 미공지 혼합물에 적용하면, 참조 분포(들)의 표적에 이벤트의 할당을 초래하고, 표적 + 참조 분포(들)에 할당된 이벤트들의 총 수에 대한 표적 분포(들)에 할당된 이벤트들의 비율은 부분량 추정치를 발생시키는 데 사용된다.In some embodiments, the clustering method is a maximum likelihood method applied to a parameterized model of the distribution of one or more event parameters. Iterative application of maximum likelihood estimation to the control set results in fitted model parameters, where one set of distributions is associated with the target analyte type and the other set of distributions is associated with the reference analyte type. . Subsequently, applying the parameterized model to the unknown mixture results in the assignment of an event to the target of the reference distribution(s), and the target distribution ( ), the proportion of events assigned to it is used to generate the partial quantity estimate.
로그 우도 함수(log likelihood function)는 알고리즘의 반복에서 진전(progress)을 추적하기 위한 측정 기준(metric)으로서 사용되고, 이는 대조군 데이터에서 각각의 이벤트의 멤버쉽 할당을 귀납적으로 업데이트하고 데이터에 대한 분포의 피트를 개선한다. 일부 실시형태에서, 데이터는 파라미터화된 가우시안 분포의 혼합을 사용하여 모델링된다. 수치 데이터를 특징화하기 위해 가우시안 혼합 모델을 포함하는 유한 혼합 모델을 사용하는 방법은 통계학 및 응용 수학에서 잘 특징화되어 있다(문헌[Hand, David J., Heikki Mannila, and Padhraic Smyth. Principles of data mining. MIT press, 2001]).A log likelihood function is used as a metric to track progress in iterations of the algorithm, which inductively updates the membership assignment of each event in the control data and fits the distribution to the data. to improve In some embodiments, the data is modeled using a mixture of parameterized Gaussian distributions. Methods of using finite mixture models, including Gaussian mixture models, to characterize numerical data are well characterized in statistics and applied mathematics (Hand, David J., Heikki Mannila, and Padhraic Smyth. Principles of data). mining. MIT press, 2001]).
일부 실시형태에서 가우시안 혼합(GM) 모델을 고려하면, 이러한 방법은 구성성분의 평균 및 공분산 및 혼합 계수를 포함하는 파라미터들에 대해 우도 함수를 최대화한다. 로그 우도에 대한 밀폐형(closed-form) 해결방안이 존재하지 않기 때문에, 데이터를 모드에 할당하기 위한 모드 파라미터 및 중량은 기댓값 최대화(EM; Expectation Maximization) 기술을 사용하여 반복적으로 계산된다(문헌[C.M. Bishop, Pattern Recognition and Machine Learning, Springer, 2006]).Considering a Gaussian mixture (GM) model in some embodiments, this method maximizes the likelihood function for parameters including the mean and covariance of the components and the mixing coefficient. Since no closed-form solution to log-likelihood exists, the mode parameters and weights for assigning data to modes are iteratively calculated using the Expectation Maximization (EM) technique (see CM Bishop, Pattern Recognition and Machine Learning, Springer, 2006]).
분율 존재비 추정치를 발생시킬 목적으로, GM 모델에 적용된 EM 알고리즘을 나노포어 데이터에 적용하는 방법은 EMGM으로 지칭된다. Q-테스트 방법과 마찬가지로, EMGM 방법은 표적 이벤트을 참조 이벤트으로부터 구분하는 데 사용될 수 있는 하나 이상의 나노포어 이벤트 신호에 대한 선행 지식을 사용한다.The method of applying the EM algorithm applied to the GM model to the nanopore data for the purpose of generating fraction abundance estimates is referred to as EMGM. Like the Q-test method, the EMGM method uses prior knowledge of one or more nanopore event signals that can be used to differentiate a target event from a reference event.
언급된 바와 같이, 표적 집단은 단일 분포, 또는 하나 초과의 분포로 표시될 수 있다. 마찬가지로, 참조 집단은 단일 분포, 또는 하나 초과의 분포로 표시될 수 있다. 표적 분포(들) 및 참조 분포(들)는 알고리즘을 하나 이상의 단리된 대조군 및 하나 이상의 대조군 혼합물에 적용함으로써 구축된다.As noted, the target population may be represented by a single distribution, or more than one distribution. Likewise, a reference population may be represented by a single distribution, or more than one distribution. The target distribution(s) and reference distribution(s) are constructed by applying the algorithm to one or more isolated controls and one or more control mixtures.
후속적으로, 표적 분포(들)가 구축된 후, 미공지 혼합물 내 이벤트은, 이것이 모델링된 표적 분포(들)와 연관이 있다면 표적 이벤트으로서 태깅된다.Subsequently, after the target distribution(s) is built, an event in the unknown mixture is tagged as a target event if it is associated with the modeled target distribution(s).
예로서, 총 3개의 가우시안 분포들은 1:1 대조군 혼합물 내에서 전체 데이터 세트를 피트할 수 있을 것이고, 이때 1개의 모드는 표적 유형과 연관이 있고 2개의 모드들은 참조 유형과 연관이 있다.As an example, a total of three Gaussian distributions may fit the entire data set within a 1:1 control mixture, with one mode associated with the target type and two modes associated with the reference type.
알고리즘은 EMGM의 적용을 위해 오로지 1개의 대조군 혼합물을 필요로 한다. 후속적으로, 결과적인 모델은 미공지 혼합물에 적용될 수 있다. 일부 실시형태에서, 추가의 단리된 참조 대조군은 위양성의 효과를 상쇄하는 데 사용된다. 구체적으로, EMGM 모델을 100% 참조 대조군에 적용하는 것은 위양성 분율을 구축하였으며, 이는 EMGM 모델을 미공지 혼합물에 적용함으로써 발생된 예측된 분율로부터 차감된다(subtracted). 이러한 차감은 위양성 보상(또는 "FP" 보상)으로 지칭될 수 있다.The algorithm requires only one control mixture for application of EMGM. Subsequently, the resulting model can be applied to the unknown mixture. In some embodiments, an additional isolated reference control is used to counteract the effect of false positives. Specifically, applying the EMGM model to a 100% reference control established a false positive fraction, which is subtracted from the predicted fraction generated by applying the EMGM model to the unknown mixture. This subtraction may be referred to as a false positive compensation (or “FP” compensation).
나노포어 장치nanopore device
제공된 바와 같은 나노포어 장치는 장치의 내부 공간을 2개의 부피로 분리하는 구조물 내에서 개구부를 형성하는 적어도 하나의 포어, 및 상기 포어를 통과하는 물체를 (예를 들어 물체를 가리키는 파라미터에서의 변화를 검출함으로써) 식별하도록 구성된 적어도 하나의 센서를 포함한다. 본원에 기재된 방법에 사용되는 나노포어 장치는 또한, PCT 공개 WO/2013/012881에 개시되어 있고, 이는 그 전체가 참조로서 본 명세서에 포함된다.Nanopore devices as provided include at least one pore forming an opening in a structure that separates the interior space of the device into two volumes, and an object passing through the pore (e.g., a change in parameters pointing to the object). by detecting) at least one sensor configured to identify. Nanopore devices used in the methods described herein are also disclosed in PCT Publication WO/2013/012881, which is incorporated herein by reference in its entirety.
나노포어 장치 내의 포어(들)는 나노 규모 또는 마이크로 규모이다. 일 양태에서, 각각의 포어는 작거나 큰 분자 또는 미생물이 통과할 수 있는 크기를 가진다. 일 양태에서, 각각의 포어의 직경은 적어도 약 1 nm이다. 대안적으로, 각각의 포어의 직경은 적어도 약 2 nm, 적어도 약 3 nm, 적어도 약 4 nm, 적어도 약 5 nm, 적어도 약 6 nm, 적어도 약 7 nm, 적어도 약 8 nm, 적어도 약 9 nm, 적어도 약 10 nm, 적어도 약 11 nm, 적어도 약 12 nm, 적어도 약 13 nm, 적어도 약 14 nm, 적어도 약 15 nm, 적어도 약 16 nm, 적어도 약 17 nm, 적어도 약 18 nm, 적어도 약 19 nm, 적어도 약 20 nm, 적어도 약 25 nm, 적어도 약 30 nm, 적어도 약 35 nm, 적어도 약 40 nm, 적어도 약 45 nm, 적어도 약 50 nm, 적어도 약 60 nm, 적어도 약 70 nm, 적어도 약 80 nm, 적어도 약 90 nm 또는 적어도 약 100 nm이다.The pore(s) within a nanopore device are either nanoscale or microscale. In one aspect, each pore is sized to allow passage of small or large molecules or microorganisms. In one aspect, each pore has a diameter of at least about 1 nm. Alternatively, each pore has a diameter of at least about 2 nm, at least about 3 nm, at least about 4 nm, at least about 5 nm, at least about 6 nm, at least about 7 nm, at least about 8 nm, at least about 9 nm, at least about 10 nm, at least about 11 nm, at least about 12 nm, at least about 13 nm, at least about 14 nm, at least about 15 nm, at least about 16 nm, at least about 17 nm, at least about 18 nm, at least about 19 nm, at least about 20 nm, at least about 25 nm, at least about 30 nm, at least about 35 nm, at least about 40 nm, at least about 45 nm, at least about 50 nm, at least about 60 nm, at least about 70 nm, at least about 80 nm, at least about 90 nm or at least about 100 nm.
일 양태에서, 포어의 직경은 약 100 nm 이하이다. 대안적으로, 포어의 직경은 약 95 nm 이하, 90 nm 이하, 85 nm 이하, 80 nm 이하, 75 nm 이하, 70 nm 이하, 65 nm 이하, 60 nm 이하, 55 nm 이하, 50 nm 이하, 45 nm 이하, 40 nm 이하, 35 nm 이하, 30 nm 이하, 25 nm 이하, 20 nm 이하, 15 nm 이하 또는 10 nm 이하이다.In one aspect, the diameter of the pores is about 100 nm or less. Alternatively, the diameter of the pores is about 95 nm or less, 90 nm or less, 85 nm or less, 80 nm or less, 75 nm or less, 70 nm or less, 65 nm or less, 60 nm or less, 55 nm or less, 50 nm or less, 45 nm or less. nm or less, 40 nm or less, 35 nm or less, 30 nm or less, 25 nm or less, 20 nm or less, 15 nm or less, or 10 nm or less.
일 양태에서, 포어는 약 1 nm 내지 약 100 nm, 또는 대안적으로 약 2 nm 내지 약 80 nm, 또는 약 3 nm 내지 약 70 nm, 또는 약 4 nm 내지 약 60 nm, 또는 약 5 nm 내지 약 50 nm, 또는 약 10 nm 내지 약 40 nm, 또는 약 15 nm 내지 약 30 nm의 직경을 가진다.In one aspect, the pores are from about 1 nm to about 100 nm, or alternatively from about 2 nm to about 80 nm, or from about 3 nm to about 70 nm, or from about 4 nm to about 60 nm, or from about 5 nm to about 50 nm, or from about 10 nm to about 40 nm, or from about 15 nm to about 30 nm.
일부 양태에서, 나노포어 장치는 포어를 가로질러 중합체 스캐폴드를 이동시키기 위한 수단 및/또는 포어를 통과하는 물체를 식별하기 위한 수단을 추가로 포함한다. 보다 상세한 사항은 하기에서 2-포어 장치의 맥락에 기재되어 제공된다.In some aspects, the nanopore device further comprises means for moving the polymer scaffold across the pore and/or means for identifying an object passing through the pore. More details are provided below in the context of a two-pore device.
단일-포어 나노포어 장치와 비교하여, 2-포어 장치는 포어를 가로질러 중합체 스캐폴드의 이동의 속도 및 방향의 양호한 조절을 제공하기 위해 보다 쉽게 구성될 수 있다.Compared to single-pore nanopore devices, two-pore devices can be more easily configured to provide good control of the speed and direction of movement of the polymer scaffold across the pores.
일 실시형태에서, 나노포어 장치는 복수의 챔버들을 포함하며, 각각의 챔버는 적어도 하나의 포어를 통해 인접 챔버와 소통한다. 이들 포어 중에서, 2개의 포어들, 즉 제1 포어 및 제2 포어는, 적어도 일부의 표적 폴리뉴클레오타이드가 제1 포어를 나와 제2 포어 내로 이동할 수 있도록 위치된다. 나아가, 이러한 장치는 각각의 포어에서 이동 중 표적 뉴클레오타이드를 식별할 수 있는 센서를 포함한다. 일 양태에서, 식별은 표적 폴리뉴클레오타이드의 개별 구성성분의 식별을 수반한다. 또 다른 양태에서, 식별은 표적 폴리뉴클레오타이드에 결합된 페이로드 분자의 식별을 수반한다. 단일 센서가 이용되는 경우, 이러한 단일 센서는 포어를 가로지르는 이온 전류를 측정하기 위해 상기 포어의 양 말단에 위치한 2개의 전극들을 포함할 수 있다. 또 다른 실시형태에서, 단일 센서는 전극 이외의 구성성분을 포함한다.In one embodiment, the nanopore device comprises a plurality of chambers, each chamber communicating with an adjacent chamber through at least one pore. Of these pores, two pores, a first pore and a second pore, are positioned such that at least a portion of the target polynucleotide can migrate out of the first pore and into the second pore. Furthermore, such devices include sensors capable of identifying target nucleotides during movement in each pore. In one aspect, identification involves identification of individual components of a target polynucleotide. In another aspect, identification involves identification of a payload molecule bound to a target polynucleotide. If a single sensor is used, this single sensor may include two electrodes located at both ends of the pore to measure the ionic current across the pore. In another embodiment, the single sensor includes components other than electrodes.
일 양태에서, 장치는 2개의 포어들을 통해 연결된 3개의 챔버들을 포함한다. 3개 초과의 챔버들을 갖는 장치는 3-챔버 장치의 어느 한 면 상에 또는 3개의 챔버들 중 임의의 2개의 챔버들 사이에 하나 이상의 추가의 챔버를 포함하도록 쉽게 디자인될 수 있다. 마찬가지로, 2개 초과의 포어들은 챔버를 연결하도록 장치에 포함될 수 있다.In one aspect, the apparatus includes three chambers connected via two pores. Devices having more than three chambers can readily be designed to include one or more additional chambers on either side of a three-chamber device or between any two of the three chambers. Likewise, more than two pores may be included in the device to connect the chamber.
일 양태에서, 다수의 중합체 스캐폴드들이 하나의 챔버로부터 다음 챔버로 동시에 이동할 수 있도록, 2개의 인접 챔버들 사이에 2개 이상의 포어들이 존재할 수 있다. 이러한 다중-포어 디자인은 장치 내에서 표적 폴리뉴클레오타이드 분석의 처리량을 증강시킬 수 있다. 멀티플렉싱의 경우, 하나의 챔버는 하나의 유형의 표적 폴리뉴클레오타이드를 가질 수 있을 것이고, 또 다른 챔버는 또 다른 표적 폴리뉴클레오타이드 유형을 가질 수 있을 것이다.In one aspect, there may be two or more pores between two adjacent chambers such that multiple polymer scaffolds can move simultaneously from one chamber to the next. This multi-pore design can enhance the throughput of targeted polynucleotide analysis within the device. In the case of multiplexing, one chamber may have one type of target polynucleotide and another chamber may have another target polynucleotide type.
일부 양태에서, 장치는 하나의 챔버로부터 또 다른 챔버로 표적 폴리뉴클레오타이드를 이동시키기 위한 수단을 추가로 포함한다. 일 양태에서, 이동은 제1 포어 및 제2 포어 둘 다에 걸쳐 표적 폴리뉴클레오타이드(예를 들어 표적 서열을 포함하는 증폭 생성물 또는 앰플리콘)의 로딩을 동시에 초래한다. 또 다른 양태에서, 이러한 수단은 추가로, 표적 폴리뉴클레오타이드를 2개의 포어 둘 다를 통해 동일한 방향으로 이동시킬 수 있다.In some aspects, the device further comprises means for moving the target polynucleotide from one chamber to another. In one aspect, the shift results in simultaneous loading of the target polynucleotide (eg, an amplification product or amplicon comprising the target sequence) across both the first pore and the second pore. In another aspect, such means may further move the target polynucleotide through both pores in the same direction.
예를 들어, 3-챔버 2-포어 장치("2-포어" 장치) 내에서, 각각의 챔버는 전원 장치에 연결하기 위한 전극을 함유할 수 있어서, 개별 전압이 챔버들 사이에서 각각의 포어를 가로질러 인가될 수 있다.For example, in a three-chamber two-pore device ("two-pore" device), each chamber may contain an electrode for connection to a power supply so that a separate voltage energizes each pore between the chambers. can be applied across.
본 개시내용의 일 실시형태에 따르면, 상부 챔버, 중간 챔버 및 하부 챔버를 포함하는 장치가 제공되며, 여기서, 상부 챔버는 제1 포어를 통해 중간 챔버와 소통하고, 중간 챔버는 제2 포어를 통해 하부 챔버와 소통한다. 이러한 장치는 발명의 명칭이 이중-포어 장치인 미국 공개 2013-0233709에서 이미 개시된 치수 또는 다른 특징들 중 임의를 가질 수 있으며, 이러한 문헌은 그 전체가 참조로서 본 명세서에 포함된다.According to an embodiment of the present disclosure, there is provided an apparatus comprising an upper chamber, an intermediate chamber and a lower chamber, wherein the upper chamber is in communication with the intermediate chamber through a first pore, and the intermediate chamber communicates with the intermediate chamber through a second pore. communicate with the lower chamber. Such a device may have any of the dimensions or other features previously disclosed in US Publication 2013-0233709 entitled Dual-pore Device, which is incorporated herein by reference in its entirety.
일 양태에서, 각각의 포어의 직경은 적어도 약 1 nm이다. 대안적으로, 각각의 포어의 직경은 적어도 약 2 nm, 적어도 약 3 nm, 적어도 약 4 nm, 적어도 약 5nm, 적어도 약 6 nm, 적어도 약 7 nm, 적어도 약 8 nm, 적어도 약 9 nm, 적어도 약 10 nm, 적어도 약 11 nm, 적어도 약 12 nm, 적어도 약 13 nm, 적어도 약 14 nm, 적어도 약 15 nm, 적어도 약 16 nm, 적어도 약 17 nm, 적어도 약 18 nm, 적어도 약 19 nm, 적어도 약 20 nm, 적어도 약 25 nm, 적어도 약 30 nm, 적어도 약 35 nm, 적어도 약 40 nm, 적어도 약 45 nm, 적어도 약 50 nm, 적어도 약 60 nm, 적어도 약 70 nm, 적어도 약 80 nm, 적어도 약 90 nm, 또는 적어도 약 100 nm이다.In one aspect, each pore has a diameter of at least about 1 nm. Alternatively, each pore has a diameter of at least about 2 nm, at least about 3 nm, at least about 4 nm, at least about 5 nm, at least about 6 nm, at least about 7 nm, at least about 8 nm, at least about 9 nm, at least about 10 nm, at least about 11 nm, at least about 12 nm, at least about 13 nm, at least about 14 nm, at least about 15 nm, at least about 16 nm, at least about 17 nm, at least about 18 nm, at least about 19 nm, at least about 20 nm, at least about 25 nm, at least about 30 nm, at least about 35 nm, at least about 40 nm, at least about 45 nm, at least about 50 nm, at least about 60 nm, at least about 70 nm, at least about 80 nm, at least about 90 nm, or at least about 100 nm.
일 양태에서, 각각의 포어의 직경은 약 100 nm 이하이다. 대안적으로, 포어의 직경은 약 95 nm 이하, 90 nm 이하, 85 nm 이하, 80 nm 이하, 75 nm 이하, 70 nm 이하, 65 nm 이하, 60 nm 이하, 55 nm 이하, 50 nm 이하, 45 nm 이하, 40 nm 이하, 35 nm 이하, 30 nm 이하, 25 nm 이하, 20 nm 이하, 15 nm 이하, 또는 10 nm 이하이다.In one aspect, each pore has a diameter of about 100 nm or less. Alternatively, the diameter of the pores is about 95 nm or less, 90 nm or less, 85 nm or less, 80 nm or less, 75 nm or less, 70 nm or less, 65 nm or less, 60 nm or less, 55 nm or less, 50 nm or less, 45 nm or less. nm or less, 40 nm or less, 35 nm or less, 30 nm or less, 25 nm or less, 20 nm or less, 15 nm or less, or 10 nm or less.
일 양태에서, 포어는 약 1 nm 내지 약 100 nm, 또는 대안적으로 약 2 nm 내지 약 80 nm, 또는 약 3 nm 내지 약 70 nm, 또는 약 4 nm 내지 약 60 nm, 또는 약 5 nm 내지 약 50 nm, 또는 약 10 nm 내지 약 40 nm, 또는 약 15 nm 내지 약 30 nm인 직경을 가진다.In one aspect, the pores are from about 1 nm to about 100 nm, or alternatively from about 2 nm to about 80 nm, or from about 3 nm to about 70 nm, or from about 4 nm to about 60 nm, or from about 5 nm to about 50 nm, or from about 10 nm to about 40 nm, or from about 15 nm to about 30 nm.
일부 양태에서, 포어는 실질적으로 둥근 모양을 가진다. 본원에 사용된 바와 같이 "실질적으로 둥근"은, 원통 형태에서 적어도 80% 또는 90%인 모양을 지칭한다. 일부 실시형태에서, 포어는 정사각형, 직사각형, 삼각형, 타원형 또는 육각형 모양이다.In some embodiments, the pores have a substantially round shape. "Substantially round" as used herein refers to a shape that is at least 80% or 90% of the cylindrical shape. In some embodiments, the pores are square, rectangular, triangular, oval or hexagonal in shape.
일 양태에서, 포어는 약 1 nm 내지 약 10,000 nm, 또는 대안적으로 약 2 nm 내지 약 9,000 nm, 또는 약 3 nm 내지 약 8,000 nm 등인 깊이를 가진다.In one aspect, the pores have a depth that is from about 1 nm to about 10,000 nm, or alternatively from about 2 nm to about 9,000 nm, or from about 3 nm to about 8,000 nm, or the like.
일부 양태에서, 나노포어는 막을 통해 확장된다. 예를 들어, 포어는 지질 이중층 막에 삽입된 단백질 채널일 수 있거나 고체상 기질, 예컨대 실리콘 디옥사이드, 실리콘 니트라이드, 그래핀 또는 이들 또는 다른 물질들의 조합으로 형성된 층을 통해 드릴링, 에칭 또는 포어의 형성에 의해 조작될 수 있다. 나노포어는 스캐폴드:융합:페이로드의 포어, 또는 효소 활성 후 이러한 분자의 생성물을 통과할 수 있는 크기를 가진다. 다른 실시형태에서, 포어의 일시적인 차단은 분자 유형의 구별에 바람직할 수 있다.In some embodiments, the nanopores extend through the membrane. For example, the pore may be a protein channel embedded in a lipid bilayer membrane or may be used for drilling, etching, or forming the pore through a layer formed of a solid phase substrate such as silicon dioxide, silicon nitride, graphene, or a combination of these or other materials. can be manipulated by Nanopores are sized to pass through the pore of the scaffold:fusion:payload, or the product of such a molecule after enzymatic activity. In other embodiments, temporary blockage of pores may be desirable for the differentiation of molecular types.
일부 양태에서, 나노포어의 길이 또는 깊이는 2개의 다른 별개의 부피들을 연결하는 채널을 형성할 정도로 충분히 크다. 일부 이러한 양태에서, 각각의 포어의 깊이는 100 nm 초과, 200 nm 초과, 300 nm 초과, 400 nm 초과, 500 nm 초과, 600 nm 초과, 700 nm 초과, 800 nm 초과, 또는 900 nm 초과이다. 일부 양태에서, 각각의 포어의 깊이는 2000 nm 또는 1000 nm 이하이다.In some aspects, the length or depth of a nanopore is large enough to form a channel connecting two different distinct volumes. In some such embodiments, the depth of each pore is greater than 100 nm, greater than 200 nm, greater than 300 nm, greater than 400 nm, greater than 500 nm, greater than 600 nm, greater than 700 nm, greater than 800 nm, or greater than 900 nm. In some embodiments, the depth of each pore is no more than 2000 nm or 1000 nm.
일 양태에서, 포어들은 약 10 nm 내지 약 1000 nm의 거리만큼 이격된다. 일부 양태에서, 포어들 사이의 거리는 1000 nm 초과, 2000 nm 초과, 3000 nm 초과, 4000 nm 초과, 5000 nm 초과, 6000 nm 초과, 7000 nm 초과, 8000 nm 초과, 또는 9000 nm 초과이다. 일부 양태에서, 포어들은 30000 nm 이하, 20000 nm 이하, 또는 10000 nm 이하만큼 이격된다. 일 양태에서, 이러한 거리는 적어도 약 10 nm, 또는 대안적으로, 적어도 약 20 nm, 적어도 약 30 nm, 적어도 약 40 nm, 적어도 약 50 nm, 적어도 약 60 nm, 적어도 약 70 nm, 적어도 약 80 nm, 적어도 약 90 nm, 적어도 약 100 nm, 적어도 약 150 nm, 적어도 약 200 nm, 적어도 약 250 nm, 또는 적어도 약 300 nm이다. 또 다른 양태에서, 이러한 거리는 약 1000 nm 이하, 900 nm 이하, 800 nm 이하, 700 nm 이하, 600 nm 이하, 500 nm 이하, 400 nm 이하, 300 nm 이하, 250 nm 이하, 200 nm 이하, 150 nm 이하, 또는 100 nm 이하이다.In one aspect, the pores are spaced apart by a distance of about 10 nm to about 1000 nm. In some aspects, the distance between the pores is greater than 1000 nm, greater than 2000 nm, greater than 3000 nm, greater than 4000 nm, greater than 5000 nm, greater than 6000 nm, greater than 7000 nm, greater than 8000 nm, or greater than 9000 nm. In some embodiments, the pores are spaced apart by no more than 30000 nm, no more than 20000 nm, or no more than 10000 nm. In one aspect, this distance is at least about 10 nm, or alternatively, at least about 20 nm, at least about 30 nm, at least about 40 nm, at least about 50 nm, at least about 60 nm, at least about 70 nm, at least about 80 nm , at least about 90 nm, at least about 100 nm, at least about 150 nm, at least about 200 nm, at least about 250 nm, or at least about 300 nm. In another aspect, such a distance is about 1000 nm or less, 900 nm or less, 800 nm or less, 700 nm or less, 600 nm or less, 500 nm or less, 400 nm or less, 300 nm or less, 250 nm or less, 200 nm or less, 150 nm or less. or less, or 100 nm or less.
보다 다른 양태에서, 포어들 사이의 거리는 약 20 nm 내지 약 800 nm, 약 30 nm 내지 약 700 nm, 약 40 nm 내지 약 500 nm, 또는 약 50 nm 내지 약 300 nm이다.In yet other aspects, the distance between the pores is from about 20 nm to about 800 nm, from about 30 nm to about 700 nm, from about 40 nm to about 500 nm, or from about 50 nm to about 300 nm.
2개의 포어들은, 이들 포어가 챔버들 사이에서 유체 소통을 허용하고 이들 사이에 예정된 크기 및 거리를 갖는 한 임의의 위치에 구성될 수 있다. 일 양태에서, 포어는, 이들 포어 사이에 직접적인 차단이 존재하지 않도록 놓인다. 또한 일 양태에서, 포어들은 실질적으로 동축(coaxial)이다.The two pores can be configured in any position as long as they allow fluid communication between the chambers and have a predetermined size and distance therebetween. In one aspect, the pores are placed such that there is no direct blockage between them. Also in one aspect, the pores are substantially coaxial.
일 양태에서, 장치는 하나 이상의 전원 장치에 연결된 챔버 내에 전극을 가진다. 일부 양태에서, 전원 장치는 전압-클램프 또는 패치-클램프를 포함하며, 이들 클램프는 각각의 포어를 가로질러 전압을 공급하고 각각의 포어를 통한 전류를 독립적으로 측정할 수 있다. 이러한 측면에서, 전원 장치 및 전극 배치는 중간 챔버를 2개의 전원 장치들 모두에 대한 보편적인 그라운드로 설정할 수 있다. 일 양태에서, 전원 장치 또는 장치들은 상부 챔버(챔버 A)와 중간 챔버(챔버 B) 사이에 제1 전압 V1, 및 중간 챔버와 하부 챔버(챔버 C) 사이에 제2 전압 V2를 인가하도록 구성된다.In one aspect, the device has electrodes in a chamber coupled to one or more power supplies. In some aspects, the power supply includes voltage-clamps or patch-clamps, which clamps can supply a voltage across each pore and independently measure the current through each pore. In this respect, the power supply and electrode placement can set the intermediate chamber as a universal ground for both power supplies. In one aspect, the power supply or devices are configured to apply a first voltage V1between the upper chamber (chamber A) and the middle chamber (chamber B) and a second voltage V 2 between the middle chamber and the lower chamber (chamber C). is composed
일부 양태에서, 제1 전압 V1 및 제2 전압 V2는 독립적으로 조정 가능하다. 일 양태에서, 중간 챔버는 2개의 전압들과 비교하여 그라운드인 것으로 조정된다. 일 양태에서, 중간 챔버는 이러한 중간 챔버 내에서 각각의 포어와 전극 사이에 전도도를 제공하기 위한 매질을 포함한다. 일 양태에서, 중간 챔버는 이러한 중간 챔버 내에서 각각의 포어와 전극 사이에 저항을 제공하기 위한 매질을 포함한다. 이러한 저항을 나노포어 저항과 비교하여 충분히 작게 유지하는 것은, 포어를 가로질러 2개의 전압 및 전류를 디커플링하는 데 유용하고, 이는 전압의 독립적인 조정에 유용하다.In some aspects, the first voltage V1 and the second voltage V2 are independently adjustable. In one aspect, the intermediate chamber is adjusted to be ground compared to the two voltages. In one aspect, the intermediate chamber contains a medium for providing conductivity between each pore and the electrode within the intermediate chamber. In one aspect, the intermediate chamber contains a medium for providing resistance between each pore and the electrode within the intermediate chamber. Keeping this resistance small enough compared to the nanopore resistance is useful for decoupling the two voltages and currents across the pore, which is useful for independent regulation of voltages.
전압의 조정은 챔버 내에서 하전된 입자의 이동을 조절하는 데 사용될 수 있다. 예를 들어, 2개의 전압이 모두 동일한 극성에서 설정되는 경우, 적절하게 하전된 입자가 상부 챔버로부터 중간 챔버로, 다시 하부 챔버로, 또는 그 반대의 순서로 순차적으로 이동될 수 있다. 일부 양태에서, 2개의 전압이 반대 극성으로 설정되는 경우, 하전된 입자가 상부 챔버 또는 하부 챔버로부터 중간 챔버로 이동되고, 그 곳에서 유지될 수 있다.Adjustment of the voltage can be used to control the movement of charged particles within the chamber. For example, if both voltages are set at the same polarity, suitably charged particles may move sequentially from the upper chamber to the middle chamber, back to the lower chamber, or vice versa. In some aspects, when the two voltages are set to opposite polarities, a charged particle can be moved from the upper chamber or lower chamber to the middle chamber and held there.
장치 내에서 전압의 조정은 특히, 큰 분자, 예컨대 하전된 중합체 스캐폴드, 즉 2개의 포어들을 동시에 가로지르기에 충분힌 긴 분자의 이동을 조절하는 데 유용할 수 있다. 이러한 양태에서, 분자의 이동 방향 및 속도는 하기에 기재되는 바와 같은 전압의 상대 크기 및 극성에 의해 조절될 수 있다.Adjustment of the voltage within the device can be particularly useful for regulating the movement of large molecules, such as charged polymer scaffolds, ie molecules long enough to cross two pores simultaneously. In this aspect, the direction and speed of movement of molecules can be controlled by the relative magnitude and polarity of the voltage as described below.
장치는 액체 시료, 특히 생물학적 시료를 보유하는 데 적합한 물질, 및/또는 나노제조(nanofabrication)에 적합한 물질을 함유할 수 있다. 일 양태에서, 이러한 물질은 유전 물질, 예컨대 비제한적으로 실리콘, 실리콘 니트라이드, 실리콘 디옥사이드, 그래핀, 탄소 나노튜브, TiO2, HfO2, Al2O3 또는 다른 금속층, 또는 이들 물질의 임의의 조합을 포함한다. 일부 양태에서, 예를 들어 약 0.3 nm 두께의 그래핀 막의 단일 시트는 포어-함유 막으로서 사용될 수 있다.The device may contain a material suitable for holding a liquid sample, particularly a biological sample, and/or a material suitable for nanofabrication. In one aspect, such material is a dielectric material such as, but not limited to, silicon, silicon nitride, silicon dioxide, graphene, carbon nanotubes, TiO2 , HfO2 , Al2 O3 or other metal layer, or any of these materials. include combinations. In some embodiments, a single sheet of graphene film, for example about 0.3 nm thick, can be used as the pore-containing film.
미세유체이고 2-포어 미세유체 칩 실행을 하우징하는(house) 장치는 여러 가지 수단 및 방법에 의해 제조될 수 있다. 2개의 평행한 막들로 구성된 미세유체 칩의 경우, 2개의 막들은 둘 다 단일 빔에 의해 동시에 드릴링되어서 2개의 동심(concentric) 포어를 형성할 수 있긴 하지만, 막의 각각의 면 상에 상이한 빔을 사용하는 것은 또한 임의의 적합한 정렬 기술과 협력하여 가능하다. 일반적으로, 하우징(housing)은 챔버 A-C의 밀봉 분리를 보장한다.Devices that are microfluidic and house a two-pore microfluidic chip implementation can be fabricated by a variety of means and methods. In the case of a microfluidic chip consisting of two parallel membranes, using a different beam on each side of the membrane, although both membranes can be simultaneously drilled by a single beam to form two concentric pores. This is also possible in cooperation with any suitable alignment technique. In general, the housing ensures sealing separation of chambers A-C.
일 양태에서, 장치는 스페이서에 의해 연결된 2개의 평행한 막들로 구성된 미세유체 칩("이중-포어 칩"으로 표지됨)을 포함한다. 각각의 막은 이러한 막의 중심을 통해 단일 빔에 의해 드릴링된 포어를 함유한다. 나아가, 장치는 바람직하게는, 칩을 위한 Teflon® 하우징 또는 폴리카르보네이트 하우징을 가진다. 하우징은 챔버 A-C의 밀봉 분리를 보장하고, 각각의 전압이 원칙적으로 각각의 포어를 가로질러 인가되는 것을 보장하기 위해 전극에게 최소 접근 저항(minimal access resistance)을 제공한다.In one aspect, the device comprises a microfluidic chip (labeled "dual-pore chip") composed of two parallel membranes connected by a spacer. Each membrane contains pores drilled by a single beam through the center of this membrane. Furthermore, the device preferably has a Teflon® housing or a polycarbonate housing for the chip. The housing ensures a hermetic separation of chambers A-C and provides the electrodes with minimal access resistance to ensure that a respective voltage is applied principally across each pore.
보다 구체적으로, 포어-함유 막은 5 nm 내지 100 nm 두께의 실리콘, 실리콘 니트라이드 또는 실리콘 디옥사이드 윈도우를 이용하여 투과 전자 현미경(TEM) 그리드를 이용하여 제조될 수 있다. 스페이서는 절연재(insulator), 예컨대 SU-8, 포토레지스트, PECVD 옥사이드, ALD 옥사이드, ALD 알루미나 또는 증발된 금속 물질, 예컨대 Ag, Au 또는 Pt를 사용하고 막들 사이에서 챔버 B의 수성 부분 내에 소량의 부피를 점유시켜, 막들을 분리하는 데 사용될 수 있다. 홀더는 챔버 B의 가장 큰 부피 분율로 구성된 수성 배쓰(bath) 내에 위치한다. 챔버 A 및 챔버 C는 막 밀봉을 초래하는 더 큰 직경 채널(낮은 접근 저항의 경우)에 의해 접근 가능하다.More specifically, pore-containing membranes can be prepared using transmission electron microscopy (TEM) grids using silicon, silicon nitride or silicon dioxide windows of 5 nm to 100 nm thickness. The spacer uses an insulator such as SU-8, photoresist, PECVD oxide, ALD oxide, ALD alumina or a vaporized metal material such as Ag, Au or Pt between the films and a small volume in the aqueous portion of chamber B. can be used to separate the membranes. The holder is placed in an aqueous bath consisting of the largest volume fraction of chamber B. Chamber A and chamber C are accessible by a larger diameter channel (for low access resistance) resulting in a membrane seal.
초점을 맞춘 전자 또는 이온 빔은 천연적으로 이들을 정렬하여 막을 통해 포어를 드릴링하는 데 사용될 수 있다. 포어는 또한, 올바른 빔을 각각의 층에 초점을 맞춰 적용함으로써 더 작은 크기로 절단(축소)될 수 있다. 임의의 단일 나노포어 드릴링 방법은 또한, 2개의 막들 내에서 포어 쌍을 드릴링하는 데 사용될 수 있으며, 이때, 주어진 방법 및 막의 두께에 가능한 드릴 깊이를 고려한다. 마이크로-포어를 예정된 깊이까지 프리드릴링하고 그런 다음 나노포어를 막의 나머지를 통해 프리드릴링하는 것은 또한, 막 두께를 더 개량하는 것이 가능하다.A focused electron or ion beam can be used to drill pores through the membrane by aligning them naturally. Pores can also be cut (reduced) to a smaller size by focusing and applying the correct beam to each layer. Any single nanopore drilling method can also be used to drill a pair of pores within two films, taking into account the drilling depth possible for a given method and film thickness. Pre-drilling the micro-pores to a predetermined depth and then pre-drilling the nano-pores through the remainder of the film is also possible to further refine the film thickness.
장치의 포어에 존재하는 전압으로 인해, 하전된 분자는 챔버들 사이에서 포어를 통해 이동될 수 있다. 이동 속도 및 방향은 전압의 크기 및 극성에 의해 조절될 수 있다. 나아가, 2개의 전압들이 각각 독립적으로 조정될 수 있기 때문에, 하전된 분자의 이동 방향 및 속도는 각각의 챔버 내에서 미세하게 조절될 수 있다.Due to the voltage present at the pores of the device, charged molecules can move through the pores between chambers. The speed and direction of movement can be controlled by the magnitude and polarity of the voltage. Furthermore, since the two voltages can each be adjusted independently, the moving direction and speed of the charged molecule can be finely adjusted within each chamber.
일례는, 2개의 포어들의 깊이 + 2개의 포어들 사이의 거리를 포함하는 조합된 거리보다 더 긴 길이를 갖는 표적 폴리뉴클레오타이드에 관한 것이다. 예를 들어, 1000 by dsDNA의 길이는 약 340 nm이고, 20 nm에 의해 분리된 2개의 10 nm-깊이 포어들에 의해 스패닝되는 40 nm보다 실질적으로 더 길 것이다. 제1 단계에서, 폴리뉴클레오타이드는 상부 챔버 또는 하부 챔버 내로 로딩된다. pH 약 7.4의 생리학적 조건 하에서 이의 음전하로 인해, 폴리뉴클레오타이드는 전압이 인가되는 포어를 가로질러 이동될 수 있다. 따라서, 제2 단계에서, 동일한 극성 및 동일하거나 유사한 크기에서 2개의 전압들이 포어에 인가되어, 폴리뉴클레오타이드를 2개의 포어들에 걸쳐 순차적으로 이동시킨다.One example relates to a target polynucleotide having a length greater than a combined distance comprising a depth of two pores plus a distance between the two pores. For example, 1000 by dsDNA is about 340 nm in length and will be substantially longer than 40 nm spanned by two 10 nm-deep pores separated by 20 nm. In a first step, polynucleotides are loaded into either the upper chamber or the lower chamber. Due to its negative charge under physiological conditions of pH about 7.4, the polynucleotide can migrate across the pore to which a voltage is applied. Thus, in a second step, two voltages at the same polarity and at the same or similar magnitude are applied to the pores to sequentially move the polynucleotide across the two pores.
폴리뉴클레오타이드가 제2 포어에 도달할 때즈음, 1개 또는 2개의 전압이 변할 수 있다. 2개의 포어들 사이의 거리가 폴리뉴클레오타이드의 길이보다 짧도록 선택되기 때문에, 폴리뉴클레오타이드가 제2 포어에 도달할 때, 이는 또한 제1 포어 내에 존재한다. 따라서, 제1 포어에서 전압의 극성의 즉각적인 변화는 폴리뉴클레오타이드를 제2 포어로부터 멀리 당기는 힘을 발생시킬 것이다.By the time the polynucleotide reaches the second pore, one or two voltages may change. Since the distance between the two pores is chosen to be shorter than the length of the polynucleotide, when the polynucleotide reaches the second pore, it is also within the first pore. Thus, an immediate change in the polarity of the voltage at the first pore will generate a force that pulls the polynucleotide away from the second pore.
2개의 포어들이 동일한 전압-힘 영향 및 |V1|=|V2|+δV을 가진다고 가정할 경우, 값δV> 0(또는 < 0)이 |V1|(또는V2) 방향에서 조정 가능한 이동을 위해 조정될 수 있다. 사실상, 각각의 포어에서 전압-유도 힘이V1 =V2와 일치하지 않을 것이라도, 교정 실험은 주어진 2-포어 칩에 대해 동일한 견인력을 초래할 적절한 바이어스 전압(bias voltage)을 식별할 수 있고; 그런 다음, 해당 바이어스 전압 부근으로 변화가 방향 조절(directional control)에 사용될 수 있다.Assuming that the two pores have the same voltage-force effect and |V1 |=|V2 |+δV, the value δV > 0 (or < 0) is tunable in the| V1 | (orV2 ) direction. Can be adjusted for movement. In fact, even though the voltage-induced force at each porewill not match V1 =V2 , a calibration experiment can identify an appropriate bias voltage that will result in the same pulling force for a given two-pore chip; A change in the vicinity of that bias voltage can then be used for directional control.
이때, 제1 포어에서 전압-유도 힘의 크기가 제2 포어에서 전압-유도 힘의 크기보다 작은 경우, 폴리뉴클레오타이드는 2개의 포어들을 가로질러 제2 포어 쪽으로 그렇지만 낮은 속도로 계속 향할 것이다. 이러한 측면에서, 폴리뉴클레오타이드의 이동 속도 및 방향은 2개의 전압 모두의 극성 및 크기에 의해 조절될 수 있음이 쉽게 이해된다. 하기에 더 기재될 바와 같이, 이동의 이러한 미세한 조절은 광범위한 적용을 가진다. 표적 폴리뉴클레오타이드를 정량화하기 위해, 2-포어 장치 실행의 이용성은, 조절된 전달 및 감지 동안 표적 폴리뉴클레오타이드 또는 페이로드-결합된 표적 폴리뉴클레오타이드가 반복적으로 측정될 수 있어서 검출 결과에 신뢰성을 부가한다는 것이다.At this time, if the magnitude of the voltage-induced force at the first pore is less than the magnitude of the voltage-induced force at the second pore, the polynucleotide will cross the two pores and continue towards the second pore but at a lower speed. In this respect, it is readily understood that the speed and direction of movement of a polynucleotide can be controlled by the polarity and magnitude of both voltages. As will be described further below, this fine control of movement has a wide range of applications. To quantify target polynucleotides, the utility of implementing a two-pore device is that the target polynucleotide or payload-bound target polynucleotide can be repeatedly measured during controlled delivery and detection, adding confidence to the detection results. .
이에 일 양태에서, 나노포어 장치를 통한 하전된 중합체 스캐폴드의 이동을 조절하는 방법이 제공된다. 이러한 방법은 (a) 상기 실시형태들 중 임의의 실시형태의 장치의 상부 챔버, 중간 챔버 또는 하부 챔버 중 하나에 표적 폴리뉴클레오타이드(예를 들어, 표적 폴리뉴클레오타이드 앰플리콘)를 포함하는 시료를 로딩하는 단계로서, 여기서, 장치는 상부 챔버와 중간 챔버 사이에 제1 전압 및 중간 챔버와 하부 챔버 사이에 제2 전압을 제공하기 위한 하나 이상의 전원 장치에 연결되는 단계; (b) 표적 폴리뉴클레오타이드가 챔버들 사이에서 이동하도록 초기 제1 전압 및 초기 제2 전압을 설정함으로써, 중합체 스캐폴드를 제1 포어 및 제2 포어 둘 다를 가로질러 위치시키는 단계; 및 (c) 제1 전압 및 제2 전압이 하전된 표적 폴리뉴클레오타이드를 중간 챔버로부터 멀리 견인시키기 위한 힘을 발생시키도록 2개의 전압을 조정하는 단계(전압-경쟁 모드)로서, 여기서, 2개의 전압들의 크기가 상이하여, 조절된 조건 하에서, 표적 폴리뉴클레오타이드 스캐폴드가 어느 방향으로나 조절된 방식으로 2개의 포어들을 가로질러 이동하는 단계를 포함한다.Accordingly, in one aspect, a method of modulating the movement of a charged polymer scaffold through a nanopore device is provided. The method comprises (a) loading a sample comprising a target polynucleotide (eg, a target polynucleotide amplicon) into one of the upper chamber, the middle chamber, or the lower chamber of the device of any of the above embodiments. 17. A method comprising: connecting the apparatus to one or more power supplies for providing a first voltage between the upper and middle chambers and a second voltage between the intermediate chamber and the lower chamber; (b) positioning the polymer scaffold across both the first pore and the second pore by setting an initial first voltage and an initial second voltage such that the target polynucleotide moves between the chambers; and (c) adjusting the two voltages (voltage-competition mode) such that the first voltage and the second voltage generate a force for pulling the charged target polynucleotide away from the intermediate chamber, wherein the two voltages their sizes are different so that under controlled conditions, the target polynucleotide scaffold moves across the two pores in a controlled manner in either direction.
일 양태에서, 표적 폴리뉴클레오타이드를 함유하는 시료는 상부 챔버 내에 로딩되고, 초기 제1 전압은 표적 폴리뉴클레오타이드를 상부 챔버로부터 중간 챔버로 견인하도록 설정되고, 초기 제2 전압은 표적 폴리뉴클레오타이드를 중간 챔버로부터 하부 챔버로 견인하도록 설정된다. 마찬가지로, 시료가 초기에 하부 챔버 내에 로딩될 수 있고, 표적 폴리뉴클레오타이드가 중간 챔버 및 상부 챔버로 견인될 수 있다.In one aspect, the sample containing the target polynucleotide is loaded into the upper chamber, the initial first voltage is set to pull the target polynucleotide from the upper chamber to the intermediate chamber, and the initial second voltage is the target polynucleotide from the intermediate chamber. It is set to tow into the lower chamber. Likewise, a sample may be initially loaded into the lower chamber, and the target polynucleotide may be drawn into the middle chamber and upper chamber.
또 다른 양태에서, 표적 폴리뉴클레오타이드를 함유하는 시료는 중간 챔버 내에 로딩되고; 초기 제1 전압은 하전된 중합체 스캐폴드를 중간 챔버로부터 상부 챔버로 견인하도록 설정되고, 초기 제2 전압은 표적 폴리뉴클레오타이드를 중간 챔버로부터 하부 챔버로 견인하도록 설정된다.In another embodiment, a sample containing a target polynucleotide is loaded into an intermediate chamber; The initial first voltage is set to pull the charged polymer scaffold from the middle chamber to the upper chamber, and the initial second voltage is set to pull the target polynucleotide from the middle chamber to the lower chamber.
일 양태에서, 단계 (c)에서 제1 전압 및 제2 전압에 대한 실시간 또는 온라인 조정은 전용 하드웨어 및 소프트웨어를 사용하여 수백 메가헤르츠 이하의 클록 속도(clock rate)에서 능동 조절 또는 피드백 조절에 의해 수행된다. 제1 전압, 제2 전압 또는 두 전압 모두의 자동화된 조절은 제1, 제2 또는 둘 다의 이온 전류 측정의 피드백을 기반으로 한다.In one aspect, the real-time or online adjustment of the first voltage and the second voltage in step (c) is performed by active adjustment or feedback adjustment at a clock rate of several hundred megahertz or less using dedicated hardware and software. do. The automated regulation of the first voltage, the second voltage, or both voltages is based on feedback of the first, second or both ion current measurements.
센서sensor
상기 고찰된 바와 같이, 다양한 양태에서, 나노포어 장치는 표적 폴리뉴클레오타이드의 검출을 수행하기 위해 하나 이상의 센서를 추가로 포함한다.As discussed above, in various embodiments, the nanopore device further comprises one or more sensors to effect detection of the target polynucleotide.
장치에 사용되는 센서는 페이로드 분자에 결합되거나 결합되지 않은 표적 폴리뉴클레오타이드 앰플리콘을 식별하는 데 적합한 임의의 센서일 수 있다. 예를 들어, 센서는 중합체와 연관된 전류, 전압, pH 값, 광학적 특징 또는 체류 시간을 측정함으로써 표적 폴리뉴클레오타이드를 식별하기 위해 구성될 수 있다. 다른 양태에서, 센서는 표적 폴리뉴클레오타이드의 하나 이상의 개별 구성성분 또는 표적 폴리뉴클레오타이드에 결합되거나 부착된 하나 이상의 구성성분을 식별하기 위해 구성될 수 있다. 센서는 측정 가능한 파라미터에서의 변화를 검출하도록 구성된 임의의 구성성분으로 형성될 수 있으며, 여기서 이러한 변화는 표적 폴리뉴클레오타이드, 표적 폴리뉴클레오타이드의 구성성분, 또는 바람직하게는 표적 폴리뉴클레오타이드에 결합되거나 부착된 구성성분을 가리킨다. 일 양태에서, 센서는, 분자 또는 다른 엔터티, 특히 표적 폴리뉴클레오타이드가 포어를 통해 이동할 때 이러한 포어를 가로지르는 이온 전류를 측정하기 위해 포어의 2개의 면에 위치된 한 쌍의 전극을 포함한다. 소정의 양태에서, 포어를 가로지르는 이온 전류는, 이러한 포어를 통과하는 표적 폴리뉴클레오타이드 절편이 페이로드 분자에 결합된 경우 측정 가능하게 변화한다. 이러한 전류 변화는 예를 들어 존재하는 표적 폴리뉴클레오타이드의 존재, 부재 및/또는 크기에 상응하는 예측 가능하며 측정 가능한 방식으로 다양할 수 있다.The sensor used in the device may be any sensor suitable for identifying a target polynucleotide amplicon bound to or not bound to a payload molecule. For example, a sensor can be configured to identify a target polynucleotide by measuring a current, voltage, pH value, optical characteristic, or residence time associated with the polymer. In other aspects, the sensor may be configured to identify one or more individual components of the target polynucleotide or one or more components bound to or attached to the target polynucleotide. The sensor may be formed of any component configured to detect a change in a measurable parameter, wherein such change is a target polynucleotide, a component of the target polynucleotide, or preferably a component bound to or attached to the target polynucleotide. refers to the ingredients. In one aspect, the sensor comprises a pair of electrodes positioned on two sides of the pore to measure the ionic current across the pore as a molecule or other entity, particularly a target polynucleotide, moves through the pore. In certain embodiments, the ionic current across a pore changes measurably when a target polynucleotide fragment passing through the pore is bound to a payload molecule. This change in current may vary in a predictable and measurable manner, eg corresponding to the presence, absence and/or size of the target polynucleotide present.
바람직한 실시형태에서, 센서는, 전압을 인가하고 나노포어를 가로지르는 전류를 측정하는 데 사용되는 전극을 포함한다. 나노포어를 통한 분자의 전위는 전기적 임피던스(electrical impedance)(Z)를 제공하며, 이는 옴의 법칙, V= IZ에 따라 나노포어를 통한 전류에 영향을 미치고, 여기서, V는 인가된 전압이며, I는 나노포어를 통한 전류이고, Z는 임피던스이다. 역으로, 전도도 G = I/Z는 나노포어 이벤트를 신호화하고 정량화하기 위해 모니터링된다. 분자가 전기장에서(예를 들어 인가된 전압 하에) 나노포어를 통해 전위할 때의 결과는, 전류 신호의 추가 분석 시 나노포어를 통과하는 분자와 상관관계가 있을 수 있는 전류 신호이다.In a preferred embodiment, the sensor comprises an electrode that is used to apply a voltage and measure the current across the nanopore. The potential of a molecule through the nanopore provides an electrical impedance (Z), which affects the current through the nanopore according to Ohm's law, V = IZ, where V is the applied voltage, I is the current through the nanopore and Z is the impedance. Conversely, the conductance G = I/Z is monitored to signal and quantify nanopore events. When a molecule translocates through a nanopore in an electric field (eg under an applied voltage), the result is a current signal that can be correlated with the molecule passing through the nanopore upon further analysis of the current signal.
전류 신호로부터의 체류 시간 측정이 사용되는 경우, 구성성분의 크기는, 감지 장치를 통과하는 데 소요되는 시간의 길이를 기반으로 특정한 구성성분과 상관관계가 있을 수 있다.When a dwell time measurement from a current signal is used, the size of the component may be correlated with a particular component based on the length of time it takes to pass through the sensing device.
일 실시형태에서, 센서는 중합체, 중합체의 구성성분(또는 단위), 또는 중합체에 결합되거나 부착된 구성성분의 광학적 특징을 측정하는 나노포어 장치에 제공된다. 이러한 측정의 일례는 적외선(또는 자외선) 분광법에 의해 특정 단위에 독특한 흡수 밴드의 식별을 포함한다.In one embodiment, a sensor is provided in a nanopore device that measures an optical characteristic of a polymer, a component (or unit) of a polymer, or a component bound to or attached to a polymer. An example of such a measurement involves the identification of an absorption band unique to a particular unit by infrared (or ultraviolet) spectroscopy.
일부 실시형태에서, 센서는 전기 센서이다. 일부 실시형태에서, 센서는 형광 신호을 검출한다. 포어의 유출구에서 방사선원은 해당 신호을 검출하는 데 사용될 수 있다.In some embodiments, the sensor is an electrical sensor. In some embodiments, the sensor detects a fluorescent signal. A radiation source at the outlet of the pore may be used to detect the signal of interest.
등가물 및 범위Equivalents and scope
당업자는, 일상적인 정도의 실험을 사용하여, 본원에 기재된 본 발명에 따른 특정한 실시형태에 대한 많은 등가물들을 인지하거나 확신할 수 있을 것이다. 본 발명의 범위는 상기 상세한 설명으로 제한되지 않고자 하며, 그보다는 첨부된 청구항에 나타난 바와 같다.Those skilled in the art will recognize, or be able to ascertain using no more than routine experimentation, many equivalents to the specific embodiments according to the invention described herein. It is not intended that the scope of the invention be limited to the above detailed description, but rather is as indicated in the appended claims.
청구항에서, 관사, 예컨대 "a," "an," 및 "the"는, 문맥으로부터 반대로 또는 다르게 명백하게 가리켜지지 않는 한, 1개 또는 1개 초과를 의미한다. 그룹의 하나 이상의 멤버들 사이에 "또는"을 포함하는 청구항 또는 상세한 설명은, 문맥으로부터 반대로 또는 다르게 명백하게 가리켜지지 않는 한, 그룹 멤버들 중 1개, 또는 1개 초과 또는 모두가 주어진 생성물 또는 과정에 존재하거나, 이용되거나 그렇지 않으면 관련이 있는 경우 충족되는 것으로 간주된다. 본 발명은, 그룹 중 정확하게 1개의 멤버가 주어진 생성물 또는 과정에 존재하거나 이용되거나 그렇지 않으면 관련이 있는 실시형태를 포함한다. 본 발명은, 그룹 중 1개 초과 또는 모든 멤버들이 주어진 생성물 또는 과정에 존재하거나 이용되거나 그렇지 않으면 관련이 있는 실시형태를 포함한다.In the claims, articles such as “a,” “an,” and “the” mean one or more than one, unless the context clearly dictates to the contrary or otherwise. A claim or detailed description that includes “or” between one or more members of a group indicates that one, or more than one, or all of the group members are in a given product or process, unless the context clearly dictates to the contrary or otherwise. It is considered satisfied if it exists, is used, or is otherwise relevant. The invention includes embodiments in which exactly one member of the group is present, utilized, or otherwise related to a given product or process. The invention includes embodiments in which more than one or all members of the group are present, utilized, or otherwise related to a given product or process.
또한, 용어 "포함하는"은 개방적인 것으로 의도되고 허용하지만 추가의 요소 또는 단계의 포함을 필요로 하지 않는 것이 주지된다. 용어 "포함하는"이 본원에 사용되는 경우, 따라서 용어 "~로 구성된"이 또한 포함되고 개시된다.It is also noted that the term “comprising” is intended to be open-ended and permitted but does not require the inclusion of additional elements or steps. Where the term “comprising” is used herein, therefore the term “consisting of” is also included and disclosed.
범위가 주어지는 경우, 종점이 포함된다. 더욱이, 문맥 및 당업자의 이해로부터 다르게 가리켜지거나 그렇지 않으면 명백하지 않는 한, 범위로서 표현된 값들은 문맥상 명백하게 다르게 가리키지 않는 한 본 발명의 상이한 실시형태들에서 언급된 범위 내의 임의의 특정한 값 또는 하위범위를 이러한 범위의 하한의 단위의 1/10까지 취할 수 있는 것으로 이해된다.Where ranges are given, endpoints are included. Moreover, unless otherwise indicated or otherwise apparent from the context and understanding of one of ordinary skill in the art, values expressed as ranges refer to any particular value or sub-range within the stated range in different embodiments of the invention, unless the context clearly dictates otherwise. It is understood that ranges can be taken to the tenth of the unit of the lower limit of such ranges.
모든 인용된 공급원, 예를 들어 참조, 공개, 데이터베이스, 데이터베이스 엔트리 및 본원에 인용된 기술은, 인용에서 표현적으로 언급되지 않더라도, 참조로서 본 출원에 포함된다. 인용된 공급원 및 본 출원의 언급들이 상충하는 경우, 본 출원의 언급이 좌우해야 한다.All cited sources, such as references, publications, databases, database entries, and technologies cited herein, are incorporated herein by reference, even if not expressly recited in the citation. In the event of a conflict between references to a cited source and this application, the reference to this application shall control.
섹션 및 표 머릿말은 제한하려는 것이 아니다.Section and table headings are not intended to be limiting.
실시예Example
본 발명을 수행하기 위한 특정한 실시형태들의 실시예가 하기에 존재한다. 실시예는 단지 예시를 목적으로 제공될 뿐이고, 본 발명의 범위를 어떠한 방식으로도 제한하려는 것이 아니다. 사용되는 숫자(예를 들어 양, 온도 등)에 대해 정확도를 보장하려고 노력하였으나, 일부 실험 오차 및 편차는 당연하게도 허용되어야 한다.Examples of specific embodiments for carrying out the present invention are presented below. The examples are provided for illustrative purposes only and are not intended to limit the scope of the present invention in any way. Efforts have been made to ensure accuracy with respect to numbers used (eg amounts, temperature, etc.), however, some experimental errors and deviations should be tolerated.
본 발명의 실시는 다르게 지시되지 않는 한, 당업계의 종래의 단백질 화학, 생화학, 재조합 DNA 기술 및 약학 방법을 이용할 것이다. 이러한 기술은 문헌에 완전히 설명되어 있다. 예를 들어, 문헌[T.E. Creighton, Proteins: Structures and Molecular Properties (W.H. Freeman and Company, 1993); A.L. Lehninger, Biochemistry (Worth Publishers, Inc., current addition); Sambrook, et al., Molecular Cloning: A Laboratory Manual (2nd Edition, 1989); Methods In Enzymology (S. Colowick and N. Kaplan eds., Academic Press, Inc.); Remington′s Ph-armaceutical Sciences, 18th Edition (Easton, Pennsylvania: Mack Publishing Company, 1990); Carey and Sundberg Advanced Organic Chemistry 3rd Ed. (Plenum Press) Vols A and B(1992)]를 참조한다.The practice of the present invention will employ, unless otherwise indicated, conventional protein chemistry, biochemistry, recombinant DNA techniques and pharmaceutical methods in the art. These techniques are fully described in the literature. For example, T.E. Creighton, Proteins: Structures and Molecular Properties (W.H. Freeman and Company, 1993); A.L. Lehninger, Biochemistry (Worth Publishers, Inc., current addition); Sambrook, et al., Molecular Cloning: A Laboratory Manual (2nd Edition, 1989); Methods In Enzymology (S. Colowick and N. Kaplan eds., Academic Press, Inc.); Remington's Ph-armaceutical Sciences, 18th Edition (Easton, Pennsylvania: Mack Publishing Company, 1990); Carey and Sundberg Advanced Organic Chemistry 3rd Ed. (Plenum Press) Vols A and B (1992)].
실시예 1 - 표적 및 참조에 대한 상이한 길이의 dsDNA를 사용하는 Q-테스트 기반 FAExample 1 - Q-test based FA using different lengths of dsDNA for target and reference
이러한 실시예는, 유전자이식(transgenic)(GMO) 표적 서열이 788 bp 표적 dsDNA(즉, 표적 분석물) 내에 존재하고 참조 서열(렉틴 하우스키핑 유전자)이 466 bp 참조 dsDNA(즉, 참조 분석물) 내에 존재하는 데이터에 분포 분율(FA) 프레임워크를 적용한 결과를 제시한다. 시료 내 이식유전자 표적의 부분량의 정량화는 하기에서, 우선 이벤트 면적을 기반으로 단일 특징 기준을 이용하는Q-테스트 방법을 적용하고 방정식 (1) 및 (2)를 사용하고, 둘째로 SVM 방법을 적용하고 방정식 (3) 및 (4)를 사용함으로써 달성된다.This example shows that a transgenic (GMO) target sequence is present in a 788 bp target dsDNA (ie, target analyte) and a reference sequence (lectin housekeeping gene) is present in a 466 bp reference dsDNA (ie, reference analyte) We present the results of applying the Fraction of Distribution (FA) framework to the data present within. Quantification of the fractional amount of the transgene target in the sample is performed in the following by firstapplying the Q- test method using a single feature criterion based on the event area, then using equations (1) and (2), and secondly applying the SVM method. and is achieved by using equations (3) and (4).
466 bp 참조 DNA 및 788 bp 표적 이식유전자 DNA 단편들을, 서열 특이적 올리고뉴클레오타이드 프라이머를 사용하여 종래의 게놈 DNA 시료와 이식유전자-함유 게놈 DNA 시료의 혼합물로부터 PCR에 의해 발생시켰다. PCR 생성물을 표준 실리카 막 컬럼을 사용하여 정제하고 농축시켰다. 2개의 앰플리콘들의 정밀한 분율 혼합물을 큰 부피의 개별적으로 발생된 앰플리콘으로부터 제조하고, 분율 혼합물 및 단일 앰플리콘의 분취물들을 모든 검정법에 대한 표준 참조 물질로서 사용하였다.466 bp reference DNA and 788 bp target transgene DNA fragments were generated by PCR from a mixture of a conventional genomic DNA sample and a transgene-containing genomic DNA sample using sequence specific oligonucleotide primers. The PCR product was purified and concentrated using a standard silica membrane column. Precise fractional mixtures of two amplicons were prepared from large volumes of individually generated amplicons, and aliquots of fractional mixtures and single amplicons were used as standard reference materials for all assays.
우선, 466 bp 참조 DNA를 함유하는 참조 대조군 시료를 나노포어 장치에서 측정하였다. 다음, 788 bp 이식유전자 DNA를 함유하는 표적 대조군 시료를 나노포어 장치에서 측정하였다. 표적 분석물(788 bp)과 참조 분석물(466 bp) 사이의 길이 차이는, 이벤트 신호의 면적을 기반으로 구별될 수 있는 나노포어를 통한 전위 시 독특한 이벤트 신호를 발생시킨다.First, a reference control sample containing 466 bp reference DNA was measured in the nanopore device. Next, a target control sample containing 788 bp transgene DNA was measured in the nanopore device. The difference in length between the target analyte (788 bp) and the reference analyte (466 bp) results in a unique event signal upon translocation through the nanopore that can be distinguished based on the area of the event signal.
도 4a는 2개의 단리된 대조군 진행들(runs)에 대한 모든 이벤트 면적 히스토그램들을 보여주며, 하나는 466 bp 참조 DNA에 대한 것이고 다른 하나는 788 bp 표적 유전자이식 DNA에 대한 것이다. 또한, 3:10 표적:참조 대조군 혼합물로부터의 면적 히스토그램이 나타나 있다. 도 4b는 대조군 혼합물(Q표적,Q참조) 및 공지된 혼합물(Q혼합) 트렌드를 면적 기준 역치q의 함수로서 보여주며,Q혼합= Q3:10이다. 도 4c는, 부분량 파라미터ρ(q)가q 값에서 어떻게 그래프적으로 나타나는지 보여준다.q = 5 pA*ms 역치(수직 파선)는 0.05의 위양성(즉,Q참조 = 0.05) 및 0.1의 위음성(즉,Q표적 = 0.9)에 상응한다.4A shows all event area histograms for two isolated control runs, one for 466 bp reference DNA and one for 788 bp target transgenic DNA. Also shown are area histograms from the 3:10 target:reference control mixture. 4B shows the control mixture (Qtarget ,seeQ ) and known mixture (Qmixing ) trends as a function of area-based thresholdq, Qmixing= Q3:10 . Figure 4c shows how the partial quantity parameterρ(q) is graphically represented at the value ofq.A q = 5 pA*ms threshold (vertical dashed line) corresponds to a false positive of 0.05 (ie,Qreference = 0.05) and a false negative of 0.1 (ie,Qtarget = 0.9).
R*혼합을 예측된 GMO(%)로서 발생시키기 위한 방정식 (2)의 적용은, 공지된 혼합물에 대한 분포 분율의 추정치를 발생시키기 위해 참조 단독 대조군 및 표적 단독 대조군을 사용하는 방법의 정확도 및 정밀도를 시험하기 위해, 대조군 혼합물을 사용하는 것이 본원에 수행된다. 방정식 (2)를 우선, 공지된 혼합물에 적용하였다.QX:Y)를 발생시키는 데에 어떠한 대조군 혼합 시료도 사용하지 않았기 때문에, 모델을 입증하기 위해 표적 분석물과 참조 분석물 사이의 포착률 상수 차이(즉, α = 1로 설정함)에 대한 보상을 사용하지 않으면서 추정치를 발생시켰다. 도 5a는 예측된 GMO(%)(R*혼합) 대 참 GMO(%)의 플롯을 보여주고, 비교를 위해 제로-오차 라인(기울기 = 1)보다 높고 낮은 10% 오차 경계(error margins)가 있다. 이들 결과를, 100% 표적 및 100% 참조(단리된) 대조군들, 및 후속해서 5개의 공지된 혼합물들을 단일 나노포어 상에서 순차적으로 진행시킴으로써 구축하였다. 표 1은 도 5a에 플롯화된 예측된 값 및 오차 막대, 및 각각의 혼합물에 대해 검출된 이벤트의 총 수를 기록한다.The application of equation (2) to generate R*mixture as predicted GMO (%) is the accuracy and precision of the method using the reference-only control and the target-only control to generate an estimate of the distribution fraction for a known mixture. To test for , it is performed herein using a control mixture. Equation (2) was first applied to known mixtures. Compensation for differences in capture rate constants between target and reference analytes (i.e., set α = 1) to validate the model, since no control mixture was used to generateQX:Y ). Estimates were generated without using Figure 5a shows a plot of predicted GMO (%) (R*mixed ) versus true GMO (%), with 10% error margins higher and lower than the zero-error line (slope = 1) for comparison. there is. These results were constructed by sequentially running 100% target and 100% reference (isolated) controls, followed by five known mixtures on a single nanopore. Table 1 records the predicted values and error bars plotted in FIG. 5A , and the total number of events detected for each mixture.
표 1. 도 5a 데이터에 대한 GMO 예측 결과Table 1. GMO prediction results for Figure 5a data
(예측. - 참)(prediction. - true)
유사한 프로토콜(2개의 단리된 대조군들 및 6개의 공지된 혼합물들)에 따른 별개의 나노포어 실험과 생성된 결과는 도 5b 및 표 2에 나타난다.Separate nanopore experiments according to a similar protocol (2 isolated controls and 6 known mixtures) and the resulting results are shown in Figure 5b and Table 2.
표 2. 도 5b 데이터에 대한 GMO 예측 결과Table 2. GMO prediction results for the data of Figure 5b
(예측. - 참)(prediction. - true)
도 5a 및 도 5b 및 표 1 및 표 2로부터의 결과들은, 5% 이내에서의 GMO% 예측 정확도가 단일 나노포어를 사용하여 2개의 DNA 길이들을 구분하는 데 가능함을 제시한다. 이들 결과는 표적 분석물과 참조 분석물 사이의 포착률 상수 차이에 대한 보상을 사용하지 않으면서 달성되었다(방정식 (2)에서 α = 1로 설정함). 포착률 상수 차이에 대한 보상은 결과를 더 개선하는 것으로 예상된다.The results from FIGS. 5A and 5B and Tables 1 and 2 suggest that % GMO prediction accuracy within 5% is possible to distinguish two DNA lengths using a single nanopore. These results were achieved without using compensation for differences in capture rate constants between the target and reference analytes (set α = 1 in equation (2)). Compensation for differences in capture rate constants is expected to further improve the results.
단일 값 대신에q-역치 범위가 이용되는 경우의 일례는 도 6에 나타나 있다. 구체적으로,q-역치 범위는Q참조의 75 백분위수 내지 99 백분위수를 스패닝(span)하도록 선택되었다. 결과적인R*혼합(q) 트렌드를q범위에 걸쳐 플롯화하였으며, 공지된 15% GMO와 비교하여 평균값 {R*혼합(q)} = 12.7%이었다. 이는, 심지어 역치가 최적화되지 않은 경우에도 본원에 제공된 분석 프레임워크가 역치 범위에 걸쳐 위양성 오차 및 위음성 오차를 보상하여, 시료 내 표적 분석물의 상대 존재비의 개선된 추정치를 제공할 수 있음을 보여준다.An example where a q -threshold range is used instead of a single value is shown in FIG. 6 . Specifically, theq -threshold range was chosen to span the 75th to 99th percentileof the Qreference. The resultingR*mixture(q) trendwas plotted over the qrange and averaged { R*mixture(q) } = 12.7% compared to the known 15% GMO. This shows that the analytical framework provided herein can compensate for false-positive and false-negative errors over a range of thresholds, even when the threshold is not optimized, providing an improved estimate of the relative abundance of the target analyte in the sample.
집단 내에서 표적 서열의 존재비를 정량화하기 위해 이러한 실시예에서 언급된 작업 흐름은 임의의 증폭, 정제, 농축 또는 완충제(buffer) 교환 단계를 필요로 하지 않았다. 이러한 작업 흐름은 저렴하며 폐기 가능한 시료 프렙 카트리지(prep cartridge)와 상용성이어서, 초소형(핸드헬드 또는 데스크탑) 유닛 내에서 시료-인 앤서-아웃(sample-in answer-out) 작업 흐름을 허용한다.The workflows mentioned in these examples for quantifying the abundance of target sequences within a population did not require any amplification, purification, concentration or buffer exchange steps. This workflow is compatible with inexpensive, disposable sample prep cartridges, allowing sample-in answer-out workflows within an ultra-compact (handheld or desktop) unit.
또 다른 실험 세트에서, 다양한 GMO% 시료들을 미공지로서 시험하였다. 각각의 나노포어 상에서의 프로토콜은 하기와 같았다: a) 100% 466 bp 참조를 5분 동안, 그런 다음 플러쉬(flush)하는 단계; b) 100% 788 bp 표적을 5분 동안, 그런 다음 플러쉬하는 단계; c) 1개 내지 4개의 미공지를 진행(run)시키는 단계로서, 각각을 5분 동안 진행시키고, 진행 사이에 플러쉬하는 단계; d) 대조군 혼합물을 진행시키는 단계. 면적 기준을 사용하였고,Q참조의 75 백분위수 내지 99 백분위수를 스패닝하는q-역치 범위를 실행하였으며, 평균R*혼합(q)을 예측된 GMO%로서 기록하였다. 방정식 (2)에서, 대조군 혼합물을 표적 분석물과 참조 분석물 사이의 포착률 상수 차이에 대한 보상에 사용하였다. 실험은 1:1, 0.75:1 또는 0.35:1의 표적:참조 대조군 혼합물을 사용하였다.In another set of experiments, various % GMO samples were tested as unknown. The protocol on each nanopore was as follows: a) 100% 466 bp reference for 5 min, then flush; b) 100% 788 bp target for 5 minutes, then flushing; c) running from one to four blanks, each running for 5 minutes, flushing between runs; d) running the control mixture. Area criteria were used anda q -threshold range spanning the 75th to 99th percentile of theQreference was run, and the meanR*mixture(q) was reported as the predicted % GMO. In equation (2), the control mixture was used to compensate for the difference in capture rate constants between the target and reference analytes. Experiments used 1:1, 0.75:1 or 0.35:1 target:reference control mixtures.
표 3은 보상을 위해 0.35:1(35% GMO)의 대조군 혼합물을 사용하여 4개의 "미공지" 혼합된 시료(S1 내지 S4)에 대한 하나의 나노포어 검정법으로부터의 예측 결과를 기록한 것이다. 미공지는 각각의 나노포어 검정법에서 맹검되었으며, 따라서, 백분율 오차는 표에 기록되어 있지 않다. 표는 또한, 각각 5분의 기간 내에 기록된 이벤트의 총 수를 기록한다.Table 3 reports the predicted results from one nanopore assay on four "unknown" mixed samples (S1-S4) using a control mixture of 0.35:1 (35% GMO) for compensation. Unknowns were blinded in each nanopore assay and, therefore, percentage errors are not reported in the table. The table also records the total number of events recorded within each 5-minute period.
표 3. 맹검 시료 S1 내지 S4에 대한 GMO 예측 결과Table 3. GMO prediction results for blinded samples S1 to S4
총 12개의 나노포어 실험을 상기 언급된 프로토콜에 따라 수행하였으며, 각각의 혼합된 시료를 2회 내지 5회 시험하였고, 항상 상이한 나노포어들 상에서, 상이한 실험자들에 의해 또는 상이한 날짜에 시험하였다. 나노포어 크기 범위는 25 nm 내지 35 nm 직경이었다. 총 11개의 혼합된 시료들(S1 내지 S11)을 검정하였다. 표 4는 조합된 추정치를 기록한 것이며, 가장 작은 예측된 GMO% 값으로부터 가장 큰 예측된 GMO% 값까지 순서대로 기록되어 있다. 기록된 평균 GMO% 값은, 단일-나노포어 예측들을 평균내어 계산한 것이다. 각각의 평균 추정치의 불확실성은 개별 추정치 분포의 반복된 무작위 시료화(sampling)로부터 계산된다(몬테 카를로 방법). 수치적으로 발생된 95-백분위수 신뢰 구간이 기록되어 있다. 각각의 시료를 시험한 횟수 및 각각의 시료에 대한 참 GMO%가 또한 기록되어 있다.A total of 12 nanopore experiments were performed according to the protocol mentioned above, each mixed sample tested 2 to 5 times, always on different nanopores, by different experimenters or on different days. The nanopore size ranged from 25 nm to 35 nm diameter. A total of 11 mixed samples (S1 to S11) were assayed. Table 4 records the combined estimates, in order from the smallest predicted % GMO value to the largest predicted % GMO value. The average GMO% value reported is calculated by averaging single-nanopore predictions. The uncertainty of each mean estimate is calculated from repeated random sampling of the distribution of the individual estimates (the Monte Carlo method). Numerically generated 95-percentile confidence intervals are recorded. The number of times each sample was tested and the % true GMO for each sample are also recorded.
표 4. 시료 S1 내지 S11에 대한 조합된 GMO% 예측(평균 ± 2 시그마))Table 4. Combined GMO % Predictions for Samples S1-S11 (mean ± 2 sigma))
[표 4][Table 4]

표 4의 결과는, 본 발명자들의 방법이 표적 분석물의 분포 분율(예를 들어 GMO%)을 높은 정확도로 예측할 수 있음을 보여준다. 범위 10-90% GMO 내에서, 정확도는 단일-나노포어 추정치들을 조합함으로써 2% 이내이다. 5-10%와 100% GMO 사이에서, 예측 오차가 포화 한계에 접근함으로써 증가할 것으로 예측될 수 있을 경우, 2개의 나노포어 추정치들을 조합하면 5% 미만의 오차를 초래하였다. 일반적으로, 표적 분석물과 참조 분석물 사이의 포착률 상수 차이에 대한 보상의 사용은 포착률 상수 차이에 대한 보상이 없는 경우(표 1 내지 2)와 비교하여 정확도를 개선한다. 전체 GMO% 예측 범위에 대해, 더 많은 나노포어 추정치들은 정확도 및 정밀도를 더 크게 개선할 것이다. 보편적인 툴로부터 각각 측정하는 어레이된 나노포어들이 또한, 본 연구의 일부로서 존재한 사람-대-사람 및 일-대-일(day-to-day), 및 시약 세트-대-세트 변이들을 제거함으로써 불확실성을 더 감소시킬 수 있다.The results in Table 4 show that our method can predict the distribution fraction (eg GMO%) of the target analyte with high accuracy. Within the range 10-90% GMO, the accuracy is within 2% by combining single-nanopore estimates. Combining the two nanopore estimates resulted in an error of less than 5%, where between 5-10% and 100% GMO, the prediction error could be predicted to increase by approaching the saturation limit. In general, the use of compensation for differences in acquisition rate constants between target and reference analytes improves accuracy compared to no compensation for differences in acquisition rate constants (Tables 1-2). For the full GMO% prediction range, more nanopore estimates will greatly improve accuracy and precision. Arrayed nanopores measuring each from a universal tool also eliminate human-to-human and day-to-day, and reagent set-to-set variations that were present as part of this study. This can further reduce uncertainty.
실시예 2 - 표적 및 참조에 대한 상이한 길이의 dsDNA를 사용하는 SVM-기반 FAExample 2 - SVM-based FA using different lengths of dsDNA for target and reference
실시예 1에 기록되고 분석된 것과 동일한 나노포어 데이터를, 이전에 제시된 SVM 방법을 사용하여 본원에서 재분석하였다(방정식 (3) 내지 (4)).The same nanopore data as recorded and analyzed in Example 1 were reanalyzed herein using the previously presented SVM method (Equations (3) to (4)).
단리된 대조군 세트를 우선, 초기 특징 선별에 사용하였다. 초기 선별은, 소정의 분류화 방법에 다중공선성(multicollinearity) 문제를 유발할 수 있는 고도로 상관관계가 있는 특징들을 제거하는 것을 목적으로 한다. 7개의 식별된 특징들은 하기와 같았다: (i) 이벤트 기간의 log10(드웰(dwell)), 또는 단순히 "드웰", 밑-10 로그; (ii) maxAmp: 최대 δG; (iii) sdAmpSub: 상승 및 하강 시간을 제거하는, 이벤트 신호의 표준 편차; (iv) medAmp: 중앙값 δG; (v) LFN평균: 50 Hz 미만의 이벤트의 노이즈 파워의 평균; (vi) LFN중앙값: 50 Hz 미만의 이벤트의 노이즈 파워의 중앙값; (vii) 면적: 실시예 1에 사용된 것과 동일한 이벤트 면적.The isolated control set was first used for initial feature selection. Initial screening aims to eliminate highly correlated features that can cause multicollinearity problems in a given classification method. The seven identified characteristics were: (i) log10 (dwell), or simply "dwell," of the duration of the event, the base-10 log; (ii) maxAmp: max δG; (iii) sdAmpSub: standard deviation of the event signal, eliminating rise and fall times; (iv) medAmp: median δG; (v) LFN average: average of the noise power of events below 50 Hz; (vi) LFN median: median noise power of events below 50 Hz; (vii) Area: the same event area as used in Example 1.
추가의 특징 추출을 수행하여, 데이터 차원(data dimension)을 제거하였다. 이 단계의 목적은, 계산 시간 및 분류화 정확도의 균형을 이루는 것이다. 2개의 알고리즘들을 실행하였다: 1) 단변량 특징 선별 방법. ANOVA F-값을 이벤트의 각각의 특징과 표지 사이에서 계산하였다. 역치를, 최고 F 점수를 가진 특징들의 일부를 선별하기 위해 수동으로 설정하였다. 2) 재귀 특징 제거법(RFE; recursive feature elimination). 추정자(estimator)(예컨대 SVM)는 초기 특징 세트 상에서 트레이닝되고, 각각의 특징의 중요성이 수득된다. 가장 덜 중요한 특징은 현재의 특징들 세트로부터 배제될 것이다. 이러한 절차는 요망되는 수의 특징 세트가 도달할 때까지 재귀적으로 반복된다.Additional feature extraction was performed to remove the data dimension. The purpose of this step is to balance computation time and classification accuracy. Two algorithms were run: 1) a univariate feature screening method. ANOVA F-values were calculated between each feature of the event and the marker. Thresholds were set manually to select some of the features with the highest F scores. 2) Recursive feature elimination (RFE). An estimator (eg SVM) is trained on an initial set of features, and the significance of each feature is obtained. The least important features will be excluded from the current feature set. This procedure is repeated recursively until the desired number of feature sets is reached.
실시예 1 데이터의 경우, 단변량 특징 선별 방법을 이용하였다. 특징의 백분율의 역치를 60%까지 수동으로 설정하였다. 알고리즘에 의해 선택된 4개의 최적 특징들은 하기와 같았다: (i) 드웰, (ii) sdAmpSub, (iii), medAmp, (iv) 면적.For Example 1 data, a univariate feature screening method was used. The threshold of the percentage of features was manually set to 60%. The four optimal features selected by the algorithm were: (i) dwell, (ii) sdAmpSub, (iii), medAmp, (iv) area.
이러한 방법에서 다음 단계는 모델 트레이닝 및 시험이다. 단리된 대조군에서 수합적으로 모든 이벤트들을 7:3 분할을 사용하여 트레이닝 데이터세트 및 시험 데이터세트로 무작위로 소팅하였다(sorted). SVM을, 분류화를 수행하기 위한 최적 파라미터를 찾기 위해 하이퍼-파라미터 검색 알고리즘과 함께 트레이닝 데이터세트를 기반으로 트레이닝하였다. 그리도 알고리즘에서 시험된 하이퍼-파라미터는 하기와 같다: 커넬 유형(선형, rbf), 조직화 파라미터(C) 및 커넬 계수(감마). ROC 곡선의 곡선 아래 면적(roc_auc)을 사용하여, 각각의 하이퍼-파라미터 조합의 성능을 평가하였다. 최고 roc_auc 점수를 갖는 모델을 다운-스트림 데이터 가공에 사용하였다. 최상의 파라미터 조합의 경우, 시험 데이터로부터의 각각의 부류의 평균 정밀도 및 재현(recall)을 계산하였다. 그런 다음, 최적 파라미터를 갖는 모델을, 데이터세트를 트레이닝함으로써 트레이팅하고 시험 데이터세트 상에서 시험하였다. 시험 데이터세트 상에서의 정확도의 예측이 발생되었으며, 도 7에 나타나 있다. 전체 세트에 걸친 정확도는 97.5% 초과였다.The next step in this method is model training and testing. Collectively, all events in the isolated control group were randomly sorted into the training dataset and the test dataset using a 7:3 split. The SVM was trained based on the training dataset together with a hyper-parameter search algorithm to find the optimal parameters for performing classification. The hyper-parameters tested in the algorithm are as follows: kernel type (linear, rbf), organization parameter (C) and kernel coefficient (gamma). The area under the curve (roc_auc) of the ROC curve was used to evaluate the performance of each hyper-parameter combination. The model with the highest roc_auc score was used for downstream data processing. For the best parameter combination, the average precision and recall of each class from the test data was calculated. The model with the optimal parameters was then trained by training the dataset and tested on the test dataset. Predictions of accuracy on the test dataset were generated and are shown in FIG. 7 . Accuracy across the entire set was greater than 97.5%.
이러한 방법에서 다음 단계는 데이터 교정이었다. 교정은, 단계 3에서 모델을 대조군 혼합물 데이터에 적용함으로써 달성될 수 있으며, 이는 보정비(correction ratio)를 발생시킨다. 그런 다음, 보정비에, 미공지 혼합물에 대한 각각의 예측된 양을 곱한다. 이는 방정식 (1) 및 (2)에서 파라미터 α에 의해 곱하는 것과 동등하다. 파라미터 α에 대한 값은, SVM 방법에서 이러한 모델을 대조군 혼합물에 적용함으로써 발생되며, 반면 (1) 및 (2)는 대조군 데이터세트Q 값으로부터 α의 직접적인 계산을 수반한다.The next step in this method was data calibration. Correction can be achieved in
표 5는 Q-테스트 방법과 SVM-기반 방법 사이에서 GMO% 예측의 비교를 보여준다.Table 5 shows a comparison of GMO% prediction between the Q-test method and the SVM-based method.
표 5. 단일 나노포어 GMO% 예측 비교, Q-테스트 대 SVMTable 5. Single Nanopore GMO% Prediction Comparison, Q-Test vs. SVM
[표 5][Table 5]

시료를 하기와 같이 나누었다: a) SVM 예측이 더 정확하였으며(1,5,6,8,9,16,19,20,21), b) Q-테스트 예측이 더 정확하였고(3,4,7,10,11,12,14,15,17), c) 상기 방법들의 정확도가 동등하였다(2,3,18,22). 이들 22개의 시료들에 대해, 2개의 방법들의 성능이 전반적으로 대체로 동등하였으며, 각각은 9/22개의 경우들에서 다른 것들을 능가하였다.The samples were divided as follows: a) the SVM prediction was more accurate (1,5,6,8,9,16,19,20,21), b) the Q-test prediction was more accurate (3,4, 7,10,11,12,14,15,17), c) the accuracy of the above methods was equivalent (2,3,18,22). For these 22 samples, the performance of the two methods was broadly equivalent overall, each outperforming the others in 9/22 cases.
SVM 방법의 값은, 데이터세트에 적용하도록 자동화될 수 있다는 점이며, 이는 선험적으로 Q-테스트 방법에 대한 필요조건인 적용될 수 있는 유한 기준을 가질 수 없다. 한편, Q-테스트 방법은 계산적으로 더 간단하고, Q-테스트 포맷에서 잘-특징화된 기준을 이용할 수 있는 분포 분율 적용에 바람직한 경향이 있다.The value of the SVM method is that it can be automated to apply to a dataset, which cannot have a finite criterion that can be applied, which is a prerequisite for a Q-test method a priori. On the other hand, Q-test methods tend to be computationally simpler and preferred for distribution fraction applications where well-characterized criteria in the Q-test format are available.
실시예 3 - 독특한 페이로드와 함께 짧은 DNA(74 bp 참조, 94 bp 표적 이식유전자)를 사용하는 Q-테스트 기반 FAExample 3 - Q-test based FA using short DNA (74 bp reference, 94 bp target transgene) with unique payload
GMO% 예측 적용의 맥락에서, 이러한 실시예는, 2개의 유사한 길이들이 표적 dsDNA 및 참조 dsDNA에 사용될 수 있으며, 여기서 나노포어 이벤트 신호의 구별은 2개의 별개의 서열-특이적 페이로드들을 사용함으로써 달성됨을 보여준다.In the context of % GMO prediction applications, this example shows that two similar lengths can be used for a target dsDNA and a reference dsDNA, wherein the differentiation of the nanopore event signal is achieved by using two distinct sequence-specific payloads. show that it is
방법: 입증된 qPCR 프라이머 세트(GM 식품 및 사료에 대한 유럽 연합 참조 실험실로부터 공개적으로 입수 가능함)를 사용함으로써, 본 발명자들은 종래의 게놈 DNA 시료와 이식유전자-함유 게놈 DNA 시료의 혼합물로부터 94 bp 이식유전자-특이적인 단편 및 74 bp 분류군-특이적인 단편을 둘 다 증폭시켰다. 나노포어 검출 이전에, 이들 앰플리콘을, PEG 중합체 프로브(그 전체가 참조로서 본 명세서에 포함된 국제 공개 WO/2016/187159, "표지된 중합체 스캐폴드를 사용한, 나노포어에서 표적 검출을 위한 방법 및 조성물")에 공유 연결된 서열-특이적 올리고뉴클레오타이드 프로브와 혼성화시켰다(Data Storage 특허 #5520281-v2-29517, 5/16/2016에 기재된 방법). 구체적으로, 이식유전자-표적화 프로브를 4-arm 40 kDa PEG에 연결하였고, 참조-표적화 프로브를 8-arm 40 kDa PEG에 연결하였다.Method: Using a validated qPCR primer set (publicly available from the European Union Reference Laboratory for GM Food and Feed), we transplanted a 94 bp from a mixture of a conventional genomic DNA sample and a transgene-containing genomic DNA sample. Both gene-specific fragments and 74 bp taxa-specific fragments were amplified. Prior to nanopore detection, these amplicons were prepared with a PEG polymer probe (International Publication WO/2016/187159, "Methods for Target Detection in Nanopores Using Labeled Polymer Scaffolds, which is incorporated herein by reference in its entirety"). and a sequence-specific oligonucleotide probe covalently linked to the composition") (method described in Data Storage Patent #5520281-v2-29517, 5/16/2016). Specifically, the transgene-targeting probe was linked to a 4-
모든 이벤트 산점도의 대표적인 예로서, 도 8은 동일한 포어 상에서 단리된 대조군으로서 순차적으로 진행된 2개의 분자 유형들에 대한 이벤트 플롯을 보여준다. 우선, 96 bp DNA/프로브-페이로드 복합체를 함유하는 시료를 제조하고, 나노포어 장치에서 측정하였다. 복합체는 표적 서열을 포함하고 프로브-페이로드에 결합된 단편에 대한 모델이다. 프로브-페이로드는 4-arm PEG 구조를 갖는 PNA-PEG이었다. 다음, 나노포어를 통한 전위 시 독특한 이벤트 신호를 발생시키기 위해 참조 서열을 포함하는 단편을 디자인하였으며, 이를 이용하여 분포 분율 계산을 달성할 수 있을 것이다. 참조 분자는 PNA-PEG가 결합된 74 bp DNA이고, 여기서 PEG는 8-arm 구조를 가진다. 주요점은, 참조/프로브-페이로드 분자가 표적/프로브-페이로드 분자와 구분되는 독특한 이벤트 하위집단을 발생시킨다는 것이고, 이들 분자는 둘 다 임의의 백그라운드 이벤트가 존재하는 경우 이러한 백그라운드 이벤트로부터 구분된다.As a representative example of all event scatterplots, FIG. 8 shows event plots for two molecular types run sequentially as controls isolated on the same pore. First, a sample containing a 96 bp DNA/probe-payload complex was prepared and measured in a nanopore device. The complex is a model for the fragment comprising the target sequence and bound to the probe-payload. The probe-payload was PNA-PEG with a 4-arm PEG structure. Next, a fragment containing a reference sequence was designed to generate a unique event signal upon translocation through the nanopore, which could be used to achieve distribution fraction calculation. The reference molecule is a 74 bp DNA bound to PNA-PEG, wherein the PEG has an 8-arm structure. The main point is that reference/probe-payload molecules give rise to a unique subpopulation of events that are distinct from target/probe-payload molecules, and both of these molecules are distinct from any background event if present. .
각각의 나노포어에 따른 프로토콜은 하기와 같았다: a) 100% 74 bp/페이로드-2 참조를 5분 동안, 그런 다음 플러쉬하는 단계; b) 100% p4 bp/페이로드-1 표적을 5분 동안, 그런 다음 플러쉬하는 단계; c) 1개 내지 4개의 미공지를 진행시키는 단계로서, 각각을 5분 동안 진행시키고, 진행 사이에 플러쉬하는 단계; d) 대조군 혼합물을 진행시키는 단계. 면적 기준을 사용하였고,Q참조의 75 백분위수 내지 99 백분위수를 스패닝하는q-역치 범위를 실행하였으며, 평균R*혼합(q)를 예측된 GMO%로서 기록하였다. 방정식 (2)에서, 1:1 대조군 혼합물을 표적 분석물과 참조 분석물 사이의 포착률 상수 차이에 대한 보상에 사용하였다.The protocol for each nanopore was as follows: a) 100% 74 bp/payload-2 reference for 5 min, then flushing; b) 100% p4 bp/payload-1 target for 5 min, then flushing; c) running one to four blanks, running each for 5 minutes, flushing between runs; d) running the control mixture. Area criteria were used anda q -threshold range spanning the 75th to the 99th percentile of theQreference was run, and the meanR*mixture(q) was reported as the predicted % GMO. In equation (2), a 1:1 control mixture was used to compensate for the difference in capture rate constants between the target and reference analytes.
나노포어 실험 세트를 상기 언급된 프로토콜에 따라 수행하였으며, 각각의 혼합된 시료를 2회 내지 4회 시험하였고, 항상 상이한 나노포어들 상에서, 상이한 실험자들에 의해 또는 상이한 날짜에 시험하였다. 나노포어 크기 범위는 25 nm 내지 35 nm 직경이었다. 총 6개의 혼합된 시료들(Sp1-Sp6)을 검정하였다. 표 6은 조합된 추정치를 기록한 것이며, 가장 작은 예측된 GMO% 값으로부터 가장 큰 예측된 GMO% 값까지 순서대로 기록되어 있다. 기록된 평균 GMO% 값은, 단일-나노포어 예측들을 평균내어 계산한 것이다. 각각의 평균 추정치의 불확실성은 계산되고, 95-백분위수 신뢰 구간이 기록된다. 각각의 시료를 시험한 횟수 및 각각의 시료에 대한 참 GMO%가 또한 기록되어 있다.A set of nanopore experiments was performed according to the protocol mentioned above, each mixed sample was tested 2 to 4 times, always on different nanopores, by different experimenters or on different days. The nanopore size ranged from 25 nm to 35 nm diameter. A total of six mixed samples (Sp1-Sp6) were assayed. Table 6 records the combined estimates, in order from the smallest predicted % GMO value to the largest predicted % GMO value. The average GMO% value reported is calculated by averaging single-nanopore predictions. The uncertainty of each mean estimate is calculated and a 95-percentile confidence interval is recorded. The number of times each sample was tested and the % true GMO for each sample are also recorded.
표 6. 표적/참조를 구분하기 위해 별개의 페이로드를 사용하는 조합된 GMO% 예측Table 6. Combined GMO % Prediction Using Separate Payloads to Differentiate Target/Reference
[표 6][Table 6]

2개의 페이로드들을 이용한 예측 성능은 dsDNA 길이 구별을 사용할 때(실시예 1, 2)만큼은 양호하지 않은 것으로 보인다. 임의의 경우, 정확도는 모든 경우들에서 6%보다 양호하고, 분자 풀을 병행하여 측정하고 결과적인 추정치들을 조합하는 더 많은 나노포어들을 가짐으로써 더 개선될 수 있다.Prediction performance with two payloads does not appear to be as good as when using dsDNA length discrimination (Examples 1 and 2). In any case, the accuracy is better than 6% in all cases and can be further improved by having more nanopores to measure the molecular pool in parallel and combine the resulting estimates.
실시예 4 - 짧은 DNA(89 bp) 및 2개의 독특한 페이로드들을 사용하여, 야생형과 비교하여 KRAS G12D SNP의 FA를 위한 Q-테스트 및 SVM 방법Example 4 - Q-test and SVM method for FA of KRAS G12D SNP compared to wild type, using short DNA (89 bp) and two unique payloads
본 발명자들은 고도로 단편화되고 세포-무함유의 순환하는 DNA로부터 인간 KRAS 유전자의 짧은(58 bp, 70 bp 또는 89 bp) 단편을 증폭시키기 위해 프라이머를 디자인하였다. cfDNA 프라이머 서열은 KRAS G12D SNP 서열(CosmicID 521)의 어느 면 상에나 어닐링되도록 디자인되었다. 앰플리콘을, 혈장으로부터 수득한 세포-무함유의 순환하는 DNA 분획으로부터 발생시키고, 야생형 및 돌연변이체 KRAS 대립유전자들을 둘 다 표적화하는 올리고뉴클레오타이드 프로브와 혼성화시키고, PEG 중합체 페이로드에 공유 연결하였으며: KRAS wt 대립유전자(c.35G)를 표적화하는 프로브를 40 kDa 8-arm 또는 80 kDa 2-branch PEG 중합체에 연결하였고, G12D(c.35G->A) 대립유전자를 표적화하는 프로브를 40 kDa 3-branch PEG 중합체에 연결하였다.We designed primers to amplify short (58 bp, 70 bp or 89 bp) fragments of the human KRAS gene from highly fragmented and cell-free circulating DNA. The cfDNA primer sequence was designed to anneal to either side of the KRAS G12D SNP sequence (CosmicID 521). Amplicons were generated from cell-free circulating DNA fractions obtained from plasma, hybridized with oligonucleotide probes targeting both wild-type and mutant KRAS alleles, and covalently linked to a PEG polymer payload: KRAS A probe targeting the wt allele (c.35G) was ligated to a 40 kDa 8-arm or 80 kDa 2-branch PEG polymer, and a probe targeting the G12D (c.35G->A) allele was linked to a 40 kDa 3-arm It was linked to a branched PEG polymer.
도 9a는 오버레이된 100% 표적 분석물 대조군 시료(청색 닫힌 원형) 및 100% 참조 분자 대조군 시료(검정색 열린 사각형)에 대한 평균 δG 대 기간의 대표적인 이벤트 플롯을 보여준다. 표적 분석물은 3-branch PEG에 연결된 G12D-결합된 프로브(G12D-3bPEG로 지칭됨)를 갖는 89 bp DNA이었다. 참조 분자는 8-arm PEG에 연결된 야생형(c.35G)-결합된 프로브(WT-8-armPEG로 지칭됨)를 갖는 89bp DNA이었다. 2개의 대조군들을 215 mV(1.0 M LiCl 10 mM tris 1 mM EDTA)에서 35 nm 직경 나노포어를 사용하여 순차적으로 진행시켰다. 시각적으로, 플롯은 표적 이벤트를 태깅하기 위해 3개의 불균등들을 기반으로 한 기준을 제시한다:9A shows a representative event plot of mean δG versus duration for an overlaid 100% target analyte control sample (closed circles in blue) and a 100% reference molecular control sample (open squares in black). The target analyte was 89 bp DNA with a G12D-bound probe (referred to as G12D-3bPEG) linked to a 3-branch PEG. The reference molecule was 89 bp DNA with a wild-type (c.35G)-bound probe (referred to as WT-8-armPEG) linked to an 8-arm PEG. Two controls were run sequentially using 35 nm diameter nanopores at 215 mV (1.0
기간 ≥ q1period ≥ q1
평균 ∂G ≥ q2mean ∂G ≥ q2
평균 ∂G ≤ q3.mean ∂G ≤ q3 .
역치 q1 = 1 msec, q2 = 0.4 nS 및 q3 = 0.65 nS는 또한 도 9a에 나타낸 표적 태깅 박스(파선)를 생성한다. 언급된 역치와 함께 3개의 불균등의 기준을 사용하여, 단리된 대조군은Q참조 = 0.006 및Q표적 = 0.795를 생성한다. 등몰 농도의 표적-페이로드 분자 및 참조-페이로드 분자는Q1:1= 0.274를 초래하였으며, 대조군 혼합물로서 사용되었다. 2개의 후속적인 미공지 시료들, A 및 B는QA = 0.066 및QB = 0.041을 등록하였다. 2개의 시료들을 도 9b에 나타낸 이벤트 플롯에서 2개의 단리된 대조군들 상에 오버레이한다. 시각적으로, 시료 A는 시료 B보다 높은 G12D 함량을 보여주지만, 둘 다 100% WT 대조군의 0.6% 위양성 비율과 비교하여 양성이다. 방정식 (1)을 적용하고 보상을 위해 대조군 혼합물을 사용한 후, 야생형에 대한 G12D 돌연변이체의 예측된 분율은 각각 시료 A 및 시료 B에 대해F*A = 11.1±0.9% 및F*B = 6.0±0.7%이다.Thresholds q1 =1 msec, q2 =0.4 nS and q3 =0.65 nS also produce the target tagging box (dashed line) shown in FIG. 9A . Using the three criteria of inequality with the stated thresholds, the isolated control produces aQreference = 0.006 and aQtarget = 0.795. Equal molar concentrations of target-payload molecules and reference-payload molecules areQ1:1= 0.274, used as control mixture. Two subsequent unknown samples, A and B, registered QA = 0.066 andQB = 0.041. Two samples are overlaid on two isolated controls in the event plot shown in FIG. 9B . Visually, sample A shows a higher G12D content than sample B, but both are positive compared to the 0.6% false positive rate of the 100% WT control. After applying equation (1) and using the control mixture for compensation, the predicted fractions of G12D mutants for wild-type wereF*A = 11.1 ± 0.9% andF*B = 6.0 ± for sample A and sample B, respectively. 0.7%.
표 7은 1열 및 2열에서 시료 A 및 시료 B에 대한 결과를 보여준다. 또한, 시험된 모든 환자 시료들에 대한 결과가 나타나 있다. 총 5개의 상이한 환자 시료들을 검정하였다. 시료 C 및 시료 C2를 동일한 환자 시료로부터 부시료화(subsample)하였으며; 마찬가지로, 시료 D, D2 및 E, E2에 대해서도 수행하였다. 동일한 환자 시료로부터 취해진 상이한 부시료들은 고려된 모든 3가지 경우들에서 서로 2% 이내에 존재하였다. 이는, 상이한 사람들에도 불구하고 상이한 나노포어 상에서 각각의 나노포어 실험을 진행하고 2가지 경우에는 상이한 날짜에 진행하는 것이다. 이는, 재현 가능한 작업 흐름 및 정량적 분포 분율 방법을 제시한다.Table 7 shows the results for Sample A and Sample B in
표 7. Q-테스트 방법을 사용하는 혈액 시료 내 예측된 G12D 돌연변이체 분율Table 7. Predicted fraction of G12D mutants in blood samples using the Q-test method
G12D의 참 양은 이들 시료에 대해 미공지되어 있다. 시료를, 암 치료(화학요법)의 개시 후 몇 주째에 환자로부터 수합하고, 이후, 각각의 환자의 DNA를 시퀀싱하였으며, G12D 돌연변이에 대해 양성인 것으로 확인하였다. 대조군 환자 유래의 비-양성 대조군 시료를 또한 검정하였으며, G12D의 예측된 분율은 2% 이하였고, 이는 총 작업 흐름 위양성이 2%임을 제시한다. 작업 흐름에서 추가의 최적화는 검출 한계를 더 감소시킬 수 있다.The true amount of G12D is unknown for these samples. Samples were collected from patients several weeks after initiation of cancer treatment (chemotherapy), and then each patient's DNA was sequenced and confirmed positive for the G12D mutation. Non-positive control samples from control patients were also assayed and the predicted fraction of G12D was less than 2%, suggesting a total workflow false positive of 2%. Further optimizations in the workflow can further reduce the detection limits.
SVM 방법을 비교에 적용하였다. 하나의 대표적인 실험(표 1에서 나노포어 NP4)을 사용하여, 데이터를 SVM 방법을 적용하는 데 기재된 단계들을 사용하여 가공하였다. 중앙값 δG 대 log10(기간) 의 이벤트 산점도는 오버레이된 100% 참조 대조군 및 100% 표적 대조군에 대해 도 10에 나타나 있다. 또한, SVM-식별된 결정 경계선이 플롯화되어 있다. 시료 C2에서 예측된 G12D 분율은 Q-테스트 및 SVM 방법 둘 다에 대해 표 8에 기록되어 있다. 2개의 방법들은 서로 5% 이내에 존재한다.The SVM method was applied for comparison. Using one representative experiment (Nanopore NP4 in Table 1), the data were processed using the steps described to apply the SVM method. Event scatter plots of median δG versus log10 (duration) are shown in FIG. 10 for 100% reference control and 100% target control overlaid. In addition, SVM-identified decision boundaries are plotted. The predicted G12D fraction in sample C2 is reported in Table 8 for both the Q-test and SVM methods. The two methods are within 5% of each other.
표 8. 최적화된 역치(q)를 결정하기 위해 Q-테스트 및 SVM을 사용하는 예측된 G12D 분율Table 8. Predicted G12D fraction using Q-test and SVM to determine the optimized threshold (q)
[표 8][Table 8]

실시예 5: 짧은 DNA(89 bp) 및 2개의 독특한 페이로드들을 사용하여, 야생형과 비교하여 KRAS G12D SNP의 FA에 대한 EMGMExample 5: EMGM for FA of KRAS G12D SNP compared to wild-type, using short DNA (89 bp) and two unique payloads
가우시안 혼합에 대한 기댓값 최대화 알고리즘(EMGM)을 대표적인 데이터 세트에 적용하는 것이 기재되어 있다. 표적 및 참조는 실시예 4에 기재된 바와 같이 페이로드-결합된 dsDNA 단편 내의 돌연변이체 KRASG12D SNP 및 야생형 서열이다. 대표적인 작업 흐름에서, 오로지 1:1 대조군 혼합물만 측정하였으며, 오로지 하나의 100% 참조 대조군을 측정하였고, 후속해서 미공지 혼합물을 측정하였다.The application of the Expected Value Maximization Algorithm (EMGM) for Gaussian Mixing to a representative data set is described. Targets and references are the mutant KRASG12D SNP and wild-type sequence in the payload-bound dsDNA fragment as described in Example 4. In a representative workflow, only 1:1 control mixtures were measured, only one 100% reference control was measured, followed by unknown mixtures.
단계 1: 50% 표적 및 50% 참조 혼합 시료의 드웰 시간의 log(log(드웰)) 및 중앙값 진폭(medAmp)을 EMGM 알고리즘을 위한 입력 데이터로서 사용하였다(도 11). 표적인 돌연변이체 KRASG12D SNP의 처음에 식별된 예상 영역을, 이러한 검정법에 대한 이전에 구축된 지식을 사용하여 플롯 내에서 직사각형 영역으로 표시한다. 선행 지식은, 개별 실험들에서 유사한 조건(동일한 완충제)에서 100% 표적 대조군을 시험으로써 구축되었다. 박스는 태깅에 사용되지 않는다. 그보다는, EMGM을 대조군 혼합물에 적용한 후, 박스 내의 가우시안 혼합과 연관된 임의의 이벤트를 표적 이벤트로서 태깅한다.Step 1: Log(log(dwell)) and median amplitude (medAmp) of dwell times of the 50% target and 50% reference mixed samples were used as input data for the EMGM algorithm ( FIG. 11 ). The initially identified predicted regions of the target mutant KRASG12D SNP are indicated as rectangular regions within the plots using previously established knowledge of this assay. Prior knowledge was built by testing a 100% target control under similar conditions (same buffer) in individual experiments. Boxes are not used for tagging. Rather, after applying the EMGM to the control mixture, any event associated with Gaussian mixing in the box is tagged as a target event.
단계 2: 집단을 기반으로, 3-가우시안 혼합 모델을 사용하여, 모델을 트레이닝하였다. 이러한 모델은 하나의 클러스터(다이아몬드) 내에서 돌연변이체(표적) 영역을 예측하였다. 다른 2개의 클러스터들(별모양 및 정사각형)은 야생형에 상응한다(도 12). 본 발명자들은, 초기 표적 도메인 박스(도 11) 내의 일부 이벤트들이 EMGM 알고리즘에 의한 참조 모드와 연관이 있음을 관찰한다. 이는 Q-테스트 방법과는 상이하며, 여기서 박스 그 자체는 표적 대 참조로서 태깅된 이벤트 집단을 정의한다.Step 2: Based on the population, the model was trained using a 3-Gaussian mixture model. This model predicted mutant (target) regions within one cluster (diamonds). The other two clusters (star and square) correspond to the wild type ( FIG. 12 ). We observe that some events in the initial target domain box (FIG. 11) are associated with the reference mode by the EMGM algorithm. This differs from the Q-test method, where the box itself defines a population of events tagged as target versus reference.
단계 3: 모델을 100% 야생형 (참조) 시료 상에 적용하였다. 이벤트들의 총 수에 대한 돌연변이체(표적) 영역 내의 이벤트들의 수의 비율은 위양성 분율을 구축하며(도 13), 이는 분포 분율 추정치를 개선하는 데 사용될 수 있다.Step 3: The model was applied on 100% wild-type (reference) samples. The ratio of the number of events in the mutant (target) region to the total number of events constructs a false positive fraction ( FIG. 13 ), which can be used to improve the distribution fraction estimate.
단계 4: 모델을 미공지 혼합물을 예측하는 데 사용하였다. 이벤트들의 총 수에 대한 돌연변이체 영역 내의 이벤트들의 수의 비율을 미공지 혼합물 내 돌연변이체 분자의 백분율의 예측자(predictor)로서 사용하였다(도 14).Step 4: The model was used to predict unknown mixtures. The ratio of the number of events in the mutant region to the total number of events was used as a predictor of the percentage of mutant molecules in the unknown mixture ( FIG. 14 ).
위양성 보상에 의한 성능 증강 시험으로서, 보정을 위해 단계 3의 위양성 분율을 단계 4에서 계산된 분율에서 차감하였다. 나노포어 실험 세트 내에서 다수의 혼합물들에 EMGM을 적용한 결과는 표 9에 기록되어 있다. 혼합물은 EMGM 결과가 어셈블리될 때까지 맹검이었고, 그런 다음 결과는 참 G12D 분포 분율 값과 비교되었다.As a performance enhancement test by false-positive compensation, the false-positive fraction of
표 9. 위양성(FP) 보상이 없고 보상이 있는 경우 EMGM을 비교하는 예측된 G12D 분율Table 9. Predicted G12D fractions comparing EMGM with no and no false positive (FP) reward.
[표 9][Table 9]

NP-a의 경우, 성능은 위양성 보상을 사용함으로써 20% 경우에서만 증강되었다. NP-b의 경우, 성능은 모든 경우들에서 증강되었다. 위양성 보상을 NP-c에 대해서는 시험하지 않았지만, 성능은 이미 양호하였고, 특히 50% 및 20% 추정치에 대해 양호하였다.For NP-a, performance was only enhanced in 20% of cases by using false-positive compensation. For NP-b, the performance was enhanced in all cases. Although false positive compensation was not tested for NP-c, the performance was already good, especially for the 50% and 20% estimates.
요약하자면, 오로지 대조군 혼합물만이, EMGM 모델을 분포 분율 추정을 위한 미공지 혼합물에 적용하기 전에, EMGM 방법을 적용하는 데 필요하다.In summary, only the control mixture is needed to apply the EMGM method before applying the EMGM model to the unknown mixture for distribution fraction estimation.
다른 실시형태another embodiment
사용된 단어들은 제한보다는 설명을 위한 단어이고, 본 발명의 참 범위 및 사상으로부터 벗어나지 않으면서 첨부된 청구항의 관점 내에서 변화가 이의 보다 넓은 양태들 내에서 이루어질 수 있는 것으로 이해된다.The words used are for the purpose of description rather than limitation, and it is to be understood that changes may be made within the scope of the appended claims and within their broader aspects without departing from the true scope and spirit of the invention.
본 발명이 몇몇 기재된 실시형태들과 관련하여 일부 길이 및 일부 특정성에서 기재되긴 하였지만, 이러한 임의의 특정성 또는 실시형태 또는 임의의 특정한 실시형태로 제한되어야 하는 것으로 의도되지 않고, 그보다는 첨부된 청구항을 참조로 하여 선행 기술의 관점에서 이러한 청구항의 가장 넓은 가능한 해석을 제공하고, 따라서 본 발명의 의도된 범위를 효과적으로 포함하는 것으로 여겨진다.Although the present invention has been described at some length and in some particularity with respect to several described embodiments, it is not intended to be limited to any particularity or embodiment or to any particular embodiment, rather, it is claimed in the appended claims. Reference to provides the broadest possible interpretation of these claims in light of the prior art and is therefore believed to effectively encompass the intended scope of the present invention.
본원에서 언급된 모든 공개, 특허 출원, 특허 및 다른 참조들은 이들 전체가 참조로서 본 명세서에 포함된다. 상충하는 경우, 정의를 포함하여 본 명세서가 좌우할 것이다. 또한, 섹션 머릿말, 물질, 방법 및 실시예는 단지 예시적일 뿐이고 제한하려는 것이 아니다.All publications, patent applications, patents and other references mentioned herein are incorporated herein by reference in their entirety. In case of conflict, the present specification, including definitions, will control. In addition, section headings, materials, methods, and examples are illustrative only and not intended to be limiting.
Claims (55)
Translated fromKorean상기 방법은,
나노포어 장치의 나노포어를 가로질러 전압을 인가하여 검출 가능한 전자 신호(electronic signature)을 발생시키고 나노포어를 통해 혼합된 미공지 시료에 대해 분석물의 전위(translocation)를 유도하는 단계로서, 상기 혼합된 미공지 시료 내 표적 분석물의 참 상대 존재비가 결정되는 단계;
상기 혼합된 미공지 시료에 대해 상기 나노포어를 통한 상기 표적 분석물 및 참조 분석물 중 적어도 하나의 단위를 포함하는 분석물의 전위에 의한 복수의 이벤트 신호(event signature)들을 발생시키는 단계로서, 상기 표적 분석물은 제1 폴리뉴클레오타이드를 포함하고 상기 참조 분석물은 제2 폴리뉴클레오타이드를 포함하며, 상기 제1 및 제2 폴리뉴클레오타이드는 합성 폴리뉴클레오타이드로부터 유래되거나 식물, 인간, 동물, 곤충, 박테리아, 및 바이러스 중 하나로부터의 유기체의 gDNA로부터 유래된 것인 단계;
상기 복수의 이벤트 신호들로부터 상기 표적 분석물과 연관된 제1 이벤트 신호의 양 및 상기 참조 분석물과 연관된 제2 이벤트 신호의 양을 식별하여, 상기 혼합된 미공지 시료에 대해 제1 및 제2 이벤트 신호의 검출된 상대 존재비를 결정하는 단계; 및
표적 대조군 시료, 참조 대조군 시료 및 혼합 대조군 시료로부터 결정된 대조군 상대 존재비 파라미터를 사용하여 상기 혼합된 미공지 시료 내의 검출된 상대 존재비를 조정하여, 검출된 상대 존재비에서 오차에 대해 보정하고, 이로써 상기 혼합된 미공지 시료에 대해 참 상대 존재비의 개선된 추정치를 결정하는 단계
를 포함하고,
상기 참 상대 존재비의 상기 추정치는 상기 혼합된 미공지 시료 내 상기 참조 분석물에 대한 상기 표적 분석물의 참비율(true ratio)의 추정치(R*혼합)이며,
상기 참비율의 상기 추정치(R*혼합)는R*혼합 = ρα 에 의해 결정되며,
여기서,


상기Q표적은 상기 표적 대조군 시료에서 관찰된 상기 제1 이벤트 신호의 분율이고, 상기Q참조는 상기 참조 대조군 시료에서 관찰된 상기 제1 이벤트 신호의 분율이며, 상기QX:Y는 상기 혼합 대조군 시료에서 관찰된 상기 제1 이벤트 신호의 분율이고 상기

The method is
A step of applying a voltage across the nanopores of the nanopore device to generate a detectable electronic signature and inducing the translocation of the analyte to the mixed unknown sample through the nanopores, the mixed determining the true relative abundance of the target analyte in the unknown sample;
generating a plurality of event signatures by translocation of an analyte comprising at least one unit of the target analyte and a reference analyte through the nanopores with respect to the mixed unknown sample, wherein the target analyte The analyte comprises a first polynucleotide and the reference analyte comprises a second polynucleotide, wherein the first and second polynucleotides are derived from synthetic polynucleotides or are plants, humans, animals, insects, bacteria, and viruses. from the gDNA of an organism from one of the
first and second events for the mixed unknown sample by identifying an amount of a first event signal associated with the target analyte and an amount of a second event signal associated with the reference analyte from the plurality of event signals determining a detected relative abundance of the signal; and
Control relative abundance parameters determined from the target control sample, reference control sample and mixed control sample are used to adjust the detected relative abundance in the mixed unknown sample to correct for error in the detected relative abundance, whereby the mixed determining an improved estimate of the true relative abundance for the unknown sample;
including,
wherein said estimate of said true relative abundance is an estimate of the true ratio of said target analyte to said reference analyte in said mixed unknown sample (R*mixture );
The estimate of the true ratio (R*mixed ) isdetermined by R*mixed = ρα,
here,
wherein theQtarget is the fraction of the first event signal observed in the target control sample, theQreference is the fraction of the first event signal observed in the reference control sample, and theQX:Y is the mixed control sample. is the fraction of the first event signal observed in
상기 표적 분석물은 유전자 변형 유기체와 관련된 것인, 방법.According to claim 1,
wherein the target analyte is associated with a genetically modified organism.
상기 참 상대 존재비는 종자 컬렉션으로부터 수득된, 게놈 DNA 내의 유전자 변형 유기체(GMO)의 유전자이식 서열 및 비-GMO 참조 서열과 관련하여 결정되는 것인, 방법.According to claim 1,
wherein said true relative abundance is determined in relation to a transgenic sequence of a genetically modified organism (GMO) in genomic DNA and a non-GMO reference sequence obtained from a seed collection.
상기 표적 분석물은 환자에서 암의 존재 또는 부재와 관련된 마커를 포함하는, 방법.According to claim 1,
wherein the target analyte comprises a marker associated with the presence or absence of cancer in the patient.
상기 표적 대조군 시료는 상기 참조 분석물 없이 상기 표적 분석물의 단위를 포함하는, 방법.According to claim 1,
wherein the target control sample comprises units of the target analyte without the reference analyte.
상기 검출된 상대 존재비의 조정이 상기 표적 대조군 시료로부터 결정된 상대 존재비의 값을 사용하여 상기 혼합 미공지 시료에 대하여 검출된 상대 존재비의 오차를 보정하는 단계를 포함하는, 방법.6. The method of claim 5,
wherein adjusting the detected relative abundance comprises correcting for an error in the detected relative abundance for the mixed unknown sample using the value of the relative abundance determined from the target control sample.
상기 참조 대조군 시료는 상기 표적 분석물 없이 상기 참조 분석물의 단위를 포함하는, 방법.According to claim 1,
wherein the reference control sample comprises units of the reference analyte without the target analyte.
상기 검출된 상대 존재비의 조정이 상기 참조 대조군 시료로부터 결정된 상대 존재비의 값을 사용하여 상기 혼합 미공지 시료에 대하여 검출된 상대 존재비의 오차를 보정하는 단계를 포함하는, 방법.8. The method of claim 7,
wherein adjusting the detected relative abundance comprises correcting for an error in the detected relative abundance for the mixed unknown sample using a value of the relative abundance determined from the reference control sample.
상기 혼합된 대조군 시료는 상기 표적 분석물 및 상기 참조 분석물의 단위를 공지된 비율로 포함하는, 방법.According to claim 1,
wherein the mixed control sample comprises units of the target analyte and the reference analyte in known proportions.
상기 혼합 대조군 시료가 상기 혼합된 미공지 시료에 비하여 10배 이하만큼 차이 나는 상기 참조 분석물에 대한 상기 표적 분석물의 상대 존재비를 포함하는, 방법.10. The method of claim 9,
wherein the mixed control sample comprises a relative abundance of the target analyte to the reference analyte that differs by no more than 10-fold compared to the mixed unknown sample.
상기 오차가 위양성(false positive) 표적 분석물 검출 오차, 위음성(false negative) 표적 분석물 검출 오차, 및 상기 표적 분석물과 상기 참조 분석물 사이의 포착률 상수 차이(capture rate constant differential) 중 하나 이상으로부터 유래된 것인, 방법.According to claim 1,
wherein the error is determined from one or more of a false positive target analyte detection error, a false negative target analyte detection error, and a capture rate constant differential between the target analyte and the reference analyte. derived, the method.
상기 혼합된 미공지 시료가 정제되지 않는, 방법.According to claim 1,
wherein the mixed unknown sample is not purified.
상기 혼합된 미공지 시료 내 참조 분석물에 대한 표적 분석물의 상기 참 상대 존재비의 상기 추정치 및 상기 혼합된 미공지 시료 내 참조 분석물의 공지된 양을 사용하여 상기 혼합된 미공지 시료 내 표적 분석물의 절대 양의 추정치를 결정하는 단계를 추가로 포함하는, 방법.According to claim 1,
The absolute of target analyte in the blended unknown sample using the estimate of the true relative abundance of target analyte to the reference analyte in the blended unknown sample and the known amount of the reference analyte in the blended unknown sample. The method further comprising determining an estimate of the quantity.
상기 제1 이벤트 신호의 양 및 상기 제2 이벤트 신호의 양이 식별되며, 상기 방법은 Q-테스트, 서포트 벡터 머신(support vector machine), 및 최적화 문제를 해결하기 위한 방법 중 하나를 사용하여, 역치를 최적화하여 이벤트 신호 식별의 정확도를 증가시키는 단계를 추가로 포함하는, 방법.According to claim 1,
An amount of the first event signal and an amount of the second event signal are identified, the method comprising: a threshold using one of a Q-test, a support vector machine, and a method for solving an optimization problem optimizing to increase accuracy of event signal identification.
상기 서포트 벡터 머신이 표적 분석물 및 참조 분석물을 공지된 양으로 포함하는 대조군 시료로부터 이벤트 신호와 연관된 전기 신호를 사용하여 트레이닝되는, 방법.15. The method of claim 14,
wherein the support vector machine is trained using an electrical signal associated with an event signal from a control sample comprising known amounts of a target analyte and a reference analyte.
한정된 역치가 이벤트 기간(event duration), 최대 δG, 중앙값 δG, 평균 δG, 이벤트 신호의 표준 편차, 50 Hz 미만의 이벤트의 노이즈 파워(noise power)의 평균 또는 중앙값, 상기 이벤트 신호에서의 독특한 패턴 및 이벤트 면적(area of an event)으로 이루어진 군으로부터 선택되는 이벤트 신호의 하나 이상의 특징의 함수인, 방법.15. The method of claim 14,
A defined threshold is the event duration, maximum δG, median δG, average δG, standard deviation of the event signal, mean or median noise power of events less than 50 Hz, a unique pattern in the event signal, and a function of one or more characteristics of the event signal selected from the group consisting of area of an event.
상기 표적 분석물은 상기 참조 분석물의 제2 길이와 상이한 제1 길이를 가지는, 방법.According to claim 1,
wherein the target analyte has a first length different from a second length of the reference analyte.
상기 제1 길이 및 제2 길이는 적어도 10개 뉴클레오타이드만큼 상이한, 방법.18. The method of claim 17,
wherein the first length and the second length differ by at least 10 nucleotides.
상기 혼합된 미공지 시료를 제1 페이로드(payload)에 결합된 제1 프로브와 접촉시키는 단계를 추가로 포함하고, 상기 제1 프로브가 상기 혼합된 미공지 시료의 제1 분석물에 특이적으로 결합되도록 구성되는, 방법.According to claim 1,
Further comprising the step of contacting the mixed unknown sample with a first probe bound to a first payload, wherein the first probe is specifically for a first analyte of the mixed unknown sample configured to be coupled.
Applications Claiming Priority (6)
| Application Number | Priority Date | Filing Date | Title |
|---|---|---|---|
| US201662412221P | 2016-10-24 | 2016-10-24 | |
| US62/412,221 | 2016-10-24 | ||
| USPCT/US2017/025585 | 2017-03-31 | ||
| PCT/US2017/025585WO2017173392A1 (en) | 2016-03-31 | 2017-03-31 | Nanopore discrimination of target polynucleotides from sample background by fragmentation and payload binding |
| PCT/US2017/058159WO2018081178A1 (en) | 2016-10-24 | 2017-10-24 | Fractional abundance of polynucleotide sequences in a sample |
| KR1020187034922AKR102137178B1 (en) | 2016-10-24 | 2017-10-24 | Distribution fraction of the polynucleotide sequence in the sample |
Related Parent Applications (1)
| Application Number | Title | Priority Date | Filing Date |
|---|---|---|---|
| KR1020187034922ADivisionKR102137178B1 (en) | 2016-10-24 | 2017-10-24 | Distribution fraction of the polynucleotide sequence in the sample |
Publications (2)
| Publication Number | Publication Date |
|---|---|
| KR20200007087A KR20200007087A (en) | 2020-01-21 |
| KR102288461B1true KR102288461B1 (en) | 2021-08-11 |
Family
ID=62023962
Family Applications (2)
| Application Number | Title | Priority Date | Filing Date |
|---|---|---|---|
| KR1020207000871AActiveKR102288461B1 (en) | 2016-10-24 | 2017-10-24 | Fractional abundance of polynucleotide sequences in a sample |
| KR1020187034922AActiveKR102137178B1 (en) | 2016-10-24 | 2017-10-24 | Distribution fraction of the polynucleotide sequence in the sample |
Family Applications After (1)
| Application Number | Title | Priority Date | Filing Date |
|---|---|---|---|
| KR1020187034922AActiveKR102137178B1 (en) | 2016-10-24 | 2017-10-24 | Distribution fraction of the polynucleotide sequence in the sample |
Country Status (12)
| Country | Link |
|---|---|
| US (1) | US11435338B2 (en) |
| EP (2) | EP3440456B1 (en) |
| JP (2) | JP6664011B2 (en) |
| KR (2) | KR102288461B1 (en) |
| CN (2) | CN112213372A (en) |
| AU (2) | AU2017348009B2 (en) |
| CA (1) | CA3021676C (en) |
| ES (1) | ES2848715T3 (en) |
| IL (2) | IL262360B (en) |
| MX (1) | MX2018013686A (en) |
| RU (1) | RU2018142223A (en) |
| WO (1) | WO2018081178A1 (en) |
Families Citing this family (11)
| Publication number | Priority date | Publication date | Assignee | Title |
|---|---|---|---|---|
| BR112014019168B1 (en) | 2012-02-03 | 2021-10-05 | California Institute Of Technology | METHOD CAPABLE OF DETECTING IN A NON-DEGENERATED PRESENCE OR ABSENCE OF ANALYTES IN A SINGLE SAMPLE VOLUME AND METHOD OF DETECTION OF THE PRESENCE OR ABSENCE OF EACH ANALYTE AMONG A PLURALITY OF ANALYTES |
| EP3901243A1 (en) | 2012-08-03 | 2021-10-27 | California Institute of Technology | Multiplexing and quantification in pcr with reduced hardware and requirements |
| WO2018207524A1 (en)* | 2017-05-07 | 2018-11-15 | 国立大学法人大阪大学 | Identification method, classification analysis method, identification device, classification analysis device, and storage medium |
| US12203129B2 (en) | 2018-07-03 | 2025-01-21 | ChromaCode, Inc. | Formulations and signal encoding and decoding methods for massively multiplexed biochemical assays |
| US20210292817A1 (en)* | 2018-07-11 | 2021-09-23 | ChromaCode, Inc. | Methods for quantitation of analytes in multiplexed biochemical reactions |
| CN112424592B (en)* | 2018-07-19 | 2024-06-25 | 国立大学法人大阪大学 | Virus detection method, virus detection device, virus determination program, pressure determination method, and pressure determination device |
| KR20220011639A (en)* | 2019-04-22 | 2022-01-28 | 온테라 인크. | Multipore Determination of the Distribution Fraction of a Polynucleotide Sequence in a Sample |
| US20200340943A1 (en)* | 2019-04-26 | 2020-10-29 | The University Of Ottawa | Calibrating Nanopore Capture Rates Using Controlled Counting |
| US12305242B2 (en) | 2020-04-24 | 2025-05-20 | The Johns Hopkins University | Methods and related aspects for quantitative polymerase chain reaction to determine fractional abundance |
| CN113416767B (en)* | 2021-06-18 | 2023-04-07 | 山东雷泽生物科技有限责任公司 | Method for detecting number of biomolecules |
| US20250230492A1 (en)* | 2023-08-28 | 2025-07-17 | California Institute Of Technology | Stochquant probabilistic detection and related methods and systems |
Citations (1)
| Publication number | Priority date | Publication date | Assignee | Title |
|---|---|---|---|---|
| WO2016126746A1 (en)* | 2015-02-02 | 2016-08-11 | Two Pore Guys, Inc. | Nanopore detection of target polynucleotides from sample background |
Family Cites Families (60)
| Publication number | Priority date | Publication date | Assignee | Title |
|---|---|---|---|---|
| US4446235A (en) | 1982-03-22 | 1984-05-01 | Genentech, Inc. | Method for cloning human growth hormone varient genes |
| US6287772B1 (en) | 1998-04-29 | 2001-09-11 | Boston Probes, Inc. | Methods, kits and compositions for detecting and quantitating target sequences |
| US6211956B1 (en) | 1998-10-15 | 2001-04-03 | Particle Sizing Systems, Inc. | Automatic dilution system for high-resolution particle size analysis |
| EP1130113A1 (en) | 2000-02-15 | 2001-09-05 | Johannes Petrus Schouten | Multiplex ligation dependent amplification assay |
| WO2002088379A2 (en) | 2001-04-26 | 2002-11-07 | Rosetta Inpharmatics, Inc. | Methods and compositions for utilizing changes of hybridization signals during approach to equilibrium |
| US20030104428A1 (en) | 2001-06-21 | 2003-06-05 | President And Fellows Of Harvard College | Method for characterization of nucleic acid molecules |
| JP4436672B2 (en)* | 2001-07-11 | 2010-03-24 | アプライド バイオシステムズ, エルエルシー | Internal calibration standard for electrophoretic analysis |
| AU2002359436A1 (en) | 2001-11-13 | 2003-06-23 | Rubicon Genomics Inc. | Dna amplification and sequencing using dna molecules generated by random fragmentation |
| WO2005056827A1 (en) | 2003-12-12 | 2005-06-23 | Infectio Recherche Inc. | System for charge-based detection of nucleic acids |
| US20060073489A1 (en) | 2004-10-05 | 2006-04-06 | Gangqiang Li | Nanopore separation devices and methods of using same |
| KR100745097B1 (en)* | 2004-12-22 | 2007-08-02 | 한국과학기술연구원 | Method of measuring blood concentration of methyl testosterone using gas chromatography / mass selection detector |
| WO2007041621A2 (en) | 2005-10-03 | 2007-04-12 | Xingsheng Sean Ling | Hybridization assisted nanopore sequencing |
| EP1954838B1 (en) | 2005-11-14 | 2014-02-26 | Life Technologies Corporation | Coded molecules for detecting target analytes |
| US7831417B2 (en)* | 2005-11-14 | 2010-11-09 | Gen-Probe Incorporated | Parametric calibration method |
| US20100291548A1 (en) | 2006-03-12 | 2010-11-18 | Applera Corporation | Methods of Detecting Target Nucleic Acids |
| US7777505B2 (en) | 2006-05-05 | 2010-08-17 | University Of Utah Research Foundation | Nanopore platforms for ion channel recordings and single molecule detection and analysis |
| US9434990B2 (en)* | 2012-04-02 | 2016-09-06 | Lux Bio Group, Inc. | Apparatus and method for molecular separation, purification, and sensing |
| WO2008124107A1 (en) | 2007-04-04 | 2008-10-16 | The Regents Of The University Of California | Compositions, devices, systems, and methods for using a nanopore |
| WO2009092035A2 (en) | 2008-01-17 | 2009-07-23 | Sequenom, Inc. | Methods and compositions for the analysis of biological molecules |
| WO2009140666A2 (en) | 2008-05-15 | 2009-11-19 | Ribomed Biotechnologies, Inc. | METHODS AND REAGENTS FOR DETECTING CpG METHYLATION WITH A METHYL CpG BINDING PROTEIN (MBP) |
| US20100099198A1 (en) | 2008-07-11 | 2010-04-22 | Board Of Regents, The University Of Texas System | Apparatus and system for pattern recognition sensing for biomolecules |
| CN102224259B (en)* | 2008-11-24 | 2014-08-27 | 塞昆纳姆股份有限公司 | Nucleic acid quantification products and processes |
| EP2376391A4 (en) | 2008-12-22 | 2012-09-12 | Univ Utah Res Found | Submerged system and method for removal of undesirable substances from aqueous media |
| US8455260B2 (en) | 2009-03-27 | 2013-06-04 | Massachusetts Institute Of Technology | Tagged-fragment map assembly |
| US8986928B2 (en) | 2009-04-10 | 2015-03-24 | Pacific Biosciences Of California, Inc. | Nanopore sequencing devices and methods |
| GB0921264D0 (en) | 2009-12-03 | 2010-01-20 | Olink Genomics Ab | Method for amplification of target nucleic acid |
| US9121823B2 (en) | 2010-02-19 | 2015-09-01 | The Trustees Of The University Of Pennsylvania | High-resolution analysis devices and related methods |
| EP3115468B1 (en)* | 2010-09-21 | 2018-07-25 | Agilent Technologies, Inc. | Increasing confidence of allele calls with molecular counting |
| US20120193231A1 (en) | 2011-01-28 | 2012-08-02 | International Business Machines Corporation | Dna sequencing using multiple metal layer structure with organic coatings forming transient bonding to dna bases |
| US11274341B2 (en) | 2011-02-11 | 2022-03-15 | NABsys, 2.0 LLC | Assay methods using DNA binding proteins |
| WO2012121756A1 (en) | 2011-03-04 | 2012-09-13 | Quantapore, Inc. | Apparatus and methods for performing optical nanopore detection or sequencing |
| EP3318872A1 (en) | 2011-07-20 | 2018-05-09 | The Regents of the University of California | Dual-pore device |
| JP5670278B2 (en) | 2011-08-09 | 2015-02-18 | 株式会社日立ハイテクノロジーズ | Nanopore analyzer |
| US20130040827A1 (en) | 2011-08-14 | 2013-02-14 | Stephen C. Macevicz | Method and compositions for detecting and sequencing nucleic acids |
| US9347900B2 (en) | 2011-10-14 | 2016-05-24 | Pacific Biosciences Of California, Inc. | Real-time redox sequencing |
| GB201120118D0 (en)* | 2011-11-22 | 2012-01-04 | Iti Scotland Ltd | Detecting analytes |
| CN104394853B (en) | 2012-02-19 | 2017-10-10 | 纳维基因股份有限公司 | Use of porous nanostructures for delivery |
| CN104364392B (en) | 2012-02-27 | 2018-05-25 | 赛卢拉研究公司 | For the composition and kit of numerator counts |
| US10344047B2 (en) | 2012-03-01 | 2019-07-09 | Atdbio Ltd. | Oligonucleotide ligation |
| US10401337B2 (en)* | 2012-04-02 | 2019-09-03 | Thermo Fisher Scientific (Bremen) Gmbh | Method and apparatus for improved quantitation by mass spectrometry |
| CN103451265A (en) | 2012-05-31 | 2013-12-18 | 凯晶生物科技(苏州)有限公司 | Method for capturing single molecular template DNA by microporous array solid-liquid phase under action of electric field |
| GB2557509A (en) | 2012-06-08 | 2018-06-20 | Pacific Biosciences California Inc | Modified base detection with nanopore sequencing |
| JP2014020837A (en)* | 2012-07-13 | 2014-02-03 | Panasonic Corp | Polynucleotide sequence determination method |
| CN103421896B (en)* | 2012-08-07 | 2015-10-28 | 上海仁度生物科技有限公司 | For the RNA constant-temperature amplification kit for detecting nucleic acid of Escherichia coli O 157 |
| US9944973B2 (en)* | 2012-11-26 | 2018-04-17 | The University Of Toledo | Methods for standardized sequencing of nucleic acids and uses thereof |
| WO2014085434A1 (en)* | 2012-11-27 | 2014-06-05 | Pontificia Universidad Catolica De Chile | Compositions and methods for diagnosing thyroid tumors |
| WO2014152937A1 (en) | 2013-03-14 | 2014-09-25 | Ibis Biosciences, Inc. | Nucleic acid control panels |
| US20140329225A1 (en) | 2013-05-06 | 2014-11-06 | Two Pore Guys, Inc. | Target detection with nanopore |
| WO2015171169A1 (en) | 2014-05-05 | 2015-11-12 | Two Pore Guys, Inc. | Target detection with nanopore |
| CN105283560B (en)* | 2013-05-24 | 2018-11-30 | 昆塔波尔公司 | Nanopore-based nucleic acid analysis by hybrid FRET detection |
| US11414695B2 (en) | 2013-05-29 | 2022-08-16 | Agilent Technologies, Inc. | Nucleic acid enrichment using Cas9 |
| US20170022546A1 (en) | 2014-03-10 | 2017-01-26 | Rashid Bashir | Detection and quantification of methylation in dna |
| US20170074855A1 (en) | 2014-05-15 | 2017-03-16 | Two Pore Guys, Inc. | Scaffold Data Storage and Target Detection in a Sample Using a Nanopore |
| IL251274B1 (en) | 2014-09-26 | 2025-09-01 | Ontera Inc | Target sequence detection by nanopore sensing of synthetic probes |
| KR20170109046A (en)* | 2015-02-02 | 2017-09-27 | 투 포어 가이즈, 인코포레이티드 | Unstable linker for biomarker detection |
| JP6560336B2 (en)* | 2015-02-26 | 2019-08-14 | 株式会社日立ハイテクノロジーズ | Method for constructing nucleic acid molecule |
| EP3295161A4 (en) | 2015-05-15 | 2018-10-03 | Two Pore Guys, Inc. | Methods and compositions for target detection in a nanopore using a labelled polymer scaffold |
| AU2016271384A1 (en) | 2015-06-02 | 2018-01-18 | Nanopore Diagnostics, Llc | Nucleic acid detection |
| CA3017982A1 (en) | 2016-03-31 | 2017-10-05 | Two Pore Guys, Inc. | Nanopore discrimination of target polynucleotides from sample background by fragmentation and payload binding |
| WO2018093976A1 (en) | 2016-11-16 | 2018-05-24 | Nanopore Diagnostics, Llc | Analysis of nucleic acids using probe with non-linear tag |
- 2017
- 2017-10-24MXMX2018013686Apatent/MX2018013686A/enunknown
- 2017-10-24WOPCT/US2017/058159patent/WO2018081178A1/ennot_activeCeased
- 2017-10-24JPJP2018562343Apatent/JP6664011B2/ennot_activeExpired - Fee Related
- 2017-10-24KRKR1020207000871Apatent/KR102288461B1/enactiveActive
- 2017-10-24KRKR1020187034922Apatent/KR102137178B1/enactiveActive
- 2017-10-24EPEP17865592.4Apatent/EP3440456B1/enactiveActive
- 2017-10-24CNCN202011111621.9Apatent/CN112213372A/enactivePending
- 2017-10-24CACA3021676Apatent/CA3021676C/ennot_activeExpired - Fee Related
- 2017-10-24RURU2018142223Apatent/RU2018142223A/ennot_activeApplication Discontinuation
- 2017-10-24EPEP20205185.0Apatent/EP3800469A1/ennot_activeWithdrawn
- 2017-10-24AUAU2017348009Apatent/AU2017348009B2/ennot_activeCeased
- 2017-10-24ESES17865592Tpatent/ES2848715T3/enactiveActive
- 2017-10-24CNCN201780031347.4Apatent/CN109564185A/enactivePending
- 2017-10-24USUS16/098,803patent/US11435338B2/enactiveActive
- 2018
- 2018-10-14ILIL262360Apatent/IL262360B/enactiveIP Right Grant
- 2020
- 2020-01-09AUAU2020200187Apatent/AU2020200187A1/ennot_activeAbandoned
- 2020-02-17JPJP2020023903Apatent/JP7012760B2/enactiveActive
- 2020-09-30ILIL277676Apatent/IL277676A/enunknown
Patent Citations (1)
| Publication number | Priority date | Publication date | Assignee | Title |
|---|---|---|---|---|
| WO2016126746A1 (en)* | 2015-02-02 | 2016-08-11 | Two Pore Guys, Inc. | Nanopore detection of target polynucleotides from sample background |
Also Published As
| Publication number | Publication date |
|---|---|
| RU2018142223A (en) | 2020-05-29 |
| IL277676A (en) | 2020-11-30 |
| MX2018013686A (en) | 2019-05-02 |
| EP3800469A1 (en) | 2021-04-07 |
| AU2020200187A1 (en) | 2020-01-30 |
| KR20190003720A (en) | 2019-01-09 |
| IL262360A (en) | 2018-11-29 |
| JP2019517664A (en) | 2019-06-24 |
| EP3440456B1 (en) | 2020-12-23 |
| RU2018142223A3 (en) | 2022-02-11 |
| EP3440456A4 (en) | 2019-02-20 |
| US11435338B2 (en) | 2022-09-06 |
| CN109564185A (en) | 2019-04-02 |
| AU2017348009A1 (en) | 2018-11-15 |
| US20200225210A1 (en) | 2020-07-16 |
| JP7012760B2 (en) | 2022-01-28 |
| JP2020106534A (en) | 2020-07-09 |
| AU2017348009B2 (en) | 2019-10-10 |
| JP6664011B2 (en) | 2020-03-13 |
| CN112213372A (en) | 2021-01-12 |
| CA3021676A1 (en) | 2018-05-03 |
| IL262360B (en) | 2020-10-29 |
| KR102137178B1 (en) | 2020-08-31 |
| ES2848715T3 (en) | 2021-08-11 |
| EP3440456A1 (en) | 2019-02-13 |
| CA3021676C (en) | 2021-03-09 |
| WO2018081178A1 (en) | 2018-05-03 |
| KR20200007087A (en) | 2020-01-21 |
Similar Documents
| Publication | Publication Date | Title |
|---|---|---|
| KR102288461B1 (en) | Fractional abundance of polynucleotide sequences in a sample | |
| US11486873B2 (en) | Multipore determination of fractional abundance of polynucleotide sequences in a sample | |
| KR20220011639A (en) | Multipore Determination of the Distribution Fraction of a Polynucleotide Sequence in a Sample | |
| CN105868545B (en) | A kind of Groundwater Ecosystem health assessment method | |
| HK1245348A1 (en) | Nanopore detection of target polynucleotides from sample background | |
| CN106257989B (en) | NGS system controls and methods involving the same | |
| Loh et al. | Electric single-molecule hybridization detector for short DNA fragments | |
| Yao et al. | Introducing Theoretical Principles of Semi-, Relative, and Absolute Quantification via Conventional, Real-Time, and Digital PCR to Graduate and Senior Undergraduate Students of Chemistry | |
| HK40034600A (en) | Fractional abundance of polynucleotide sequences in a sample | |
| HK40006240A (en) | Fractional abundance of polynucleotide sequences in a sample | |
| US20210180120A1 (en) | Devices and method for detecting an amplification event | |
| King | Nanopore Sensing of PCR-Amplified Pathogenic DNA | |
| Ivica | α-Hemolysin nanopore sensing of MicroRNA with electrolyte gradients | |
| SE1250380A1 (en) | Sensitive high-efficiency procedure for DNA damage and repair |
Legal Events
| Date | Code | Title | Description |
|---|---|---|---|
| A107 | Divisional application of patent | ||
| PA0104 | Divisional application for international application | St.27 status event code:A-0-1-A10-A18-div-PA0104 St.27 status event code:A-0-1-A10-A16-div-PA0104 | |
| PG1501 | Laying open of application | St.27 status event code:A-1-1-Q10-Q12-nap-PG1501 | |
| PN2301 | Change of applicant | St.27 status event code:A-3-3-R10-R13-asn-PN2301 St.27 status event code:A-3-3-R10-R11-asn-PN2301 | |
| E13-X000 | Pre-grant limitation requested | St.27 status event code:A-2-3-E10-E13-lim-X000 | |
| P11-X000 | Amendment of application requested | St.27 status event code:A-2-2-P10-P11-nap-X000 | |
| P13-X000 | Application amended | St.27 status event code:A-2-2-P10-P13-nap-X000 | |
| PA0201 | Request for examination | St.27 status event code:A-1-2-D10-D11-exm-PA0201 | |
| E902 | Notification of reason for refusal | ||
| PE0902 | Notice of grounds for rejection | St.27 status event code:A-1-2-D10-D21-exm-PE0902 | |
| P11-X000 | Amendment of application requested | St.27 status event code:A-2-2-P10-P11-nap-X000 | |
| P13-X000 | Application amended | St.27 status event code:A-2-2-P10-P13-nap-X000 | |
| E701 | Decision to grant or registration of patent right | ||
| PE0701 | Decision of registration | St.27 status event code:A-1-2-D10-D22-exm-PE0701 | |
| GRNT | Written decision to grant | ||
| PR0701 | Registration of establishment | St.27 status event code:A-2-4-F10-F11-exm-PR0701 | |
| PR1002 | Payment of registration fee | St.27 status event code:A-2-2-U10-U12-oth-PR1002 Fee payment year number:1 | |
| PG1601 | Publication of registration | St.27 status event code:A-4-4-Q10-Q13-nap-PG1601 | |
| PR1001 | Payment of annual fee | St.27 status event code:A-4-4-U10-U11-oth-PR1001 Fee payment year number:4 | |
| PR1001 | Payment of annual fee | St.27 status event code:A-4-4-U10-U11-oth-PR1001 Fee payment year number:5 |