KR101650110B1 - Failsafe mechanism for dynamic instrumentation of software using callbacks - Google Patents
Failsafe mechanism for dynamic instrumentation of software using callbacksDownload PDFInfo
- Publication number
- KR101650110B1 KR101650110B1KR1020110044255AKR20110044255AKR101650110B1KR 101650110 B1KR101650110 B1KR 101650110B1KR 1020110044255 AKR1020110044255 AKR 1020110044255AKR 20110044255 AKR20110044255 AKR 20110044255AKR 101650110 B1KR101650110 B1KR 101650110B1
- Authority
- KR
- South Korea
- Prior art keywords
- application
- computing device
- callback
- request
- connection
- Prior art date
- Legal status (The legal status is an assumption and is not a legal conclusion. Google has not performed a legal analysis and makes no representation as to the accuracy of the status listed.)
- Expired - Fee Related
Links
Images


Classifications
- G—PHYSICS
- G06—COMPUTING OR CALCULATING; COUNTING
- G06F—ELECTRIC DIGITAL DATA PROCESSING
- G06F11/00—Error detection; Error correction; Monitoring
- G06F11/36—Prevention of errors by analysis, debugging or testing of software
- G06F11/362—Debugging of software
- G06F11/3644—Debugging of software by instrumenting at runtime
- G—PHYSICS
- G06—COMPUTING OR CALCULATING; COUNTING
- G06F—ELECTRIC DIGITAL DATA PROCESSING
- G06F11/00—Error detection; Error correction; Monitoring
- G06F11/30—Monitoring
- G06F11/34—Recording or statistical evaluation of computer activity, e.g. of down time, of input/output operation ; Recording or statistical evaluation of user activity, e.g. usability assessment
- G06F11/3466—Performance evaluation by tracing or monitoring
- G06F11/3495—Performance evaluation by tracing or monitoring for systems
- G—PHYSICS
- G06—COMPUTING OR CALCULATING; COUNTING
- G06F—ELECTRIC DIGITAL DATA PROCESSING
- G06F11/00—Error detection; Error correction; Monitoring
- G06F11/07—Responding to the occurrence of a fault, e.g. fault tolerance
- G06F11/14—Error detection or correction of the data by redundancy in operation
- G06F11/1402—Saving, restoring, recovering or retrying
- G06F11/1415—Saving, restoring, recovering or retrying at system level
- G06F11/1438—Restarting or rejuvenating
- G—PHYSICS
- G06—COMPUTING OR CALCULATING; COUNTING
- G06F—ELECTRIC DIGITAL DATA PROCESSING
- G06F2201/00—Indexing scheme relating to error detection, to error correction, and to monitoring
- G06F2201/875—Monitoring of systems including the internet
Landscapes
- Engineering & Computer Science (AREA)
- Theoretical Computer Science (AREA)
- General Engineering & Computer Science (AREA)
- Computer Hardware Design (AREA)
- Physics & Mathematics (AREA)
- General Physics & Mathematics (AREA)
- Quality & Reliability (AREA)
- Debugging And Monitoring (AREA)
- Software Systems (AREA)
- Mathematical Physics (AREA)
- Stored Programmes (AREA)
Abstract
Translated fromKoreanDescription
Translated fromKorean본 발명은 컴퓨팅 환경에서 소프트웨어를 모니터링하는 기술에 관한 것이다.The present invention relates to techniques for monitoring software in a computing environment.
인터넷뿐만 아니라 다른 컴퓨터 네트워크(예를 들어, 인트라넷(intranets) 및 엑스트라넷(extranets)과 같은 것)의 성장은 전자 상거래(e-commerce), 교육, 및 다른 영역에서 새로운 애플리케이션을 출현시키고 있다. 조직체들은 사업 목적 혹은 다른 목적을 달성하기 위해 이러한 애플리케이션들에 점점 더 의존하고 있음과 아울러 기대하는 대로 업무가 확실히 수행되도록 하기 위해 상당량의 자원을 투자한다. 이러한 목적을 위해, 다양한 애플리케이션 관리 기술들이 개발되고 있다.The growth of the Internet as well as other computer networks (such as intranets and extranets) is leading to new applications in e-commerce, education, and other areas. Organizations are increasingly reliant on these applications to achieve business or other objectives, and they invest significant resources to ensure that their work is performed as expected. To this end, various application management technologies are being developed.
한가지 방법은, 애플리케이션에서 호출되는 개별 애플리케이션 컴포넌트들에 관한 애플리케이션 런타임 데이터(application runtime data)를 수집함으로써, 애플리케이션의 인프라스트럭처(infrastructure)를 모니터링하는 것을 포함한다. 이러한 방법은 모니터링되는 시스템에 기본적으로 상주하는 에이전트(agent)들을 사용할 수 있다. 예를 들어, 소프트웨어의 계측(instrumentation)을 사용하여, 쓰레드(thread) 혹은 프로세스(process)가 추적될 수 있어, 호출되는 각각의 컴포넌트가 식별될 수 있음과 아울러 각각의 컴포넌트의 실행 시간과 같은 런타임 데이터가 획득될 수 있다. 추적은 컴퓨터 프로그램이 실행하는 단계들의 세부적 레코드(record) 혹은 트레이스(trace)를 획득하는 것을 말한다. 트레이스의 일 타입은 스택 트레이스(stack trace)이다. 트레이스들은 디버깅(debugging)에 있어 보조로서 사용될 수 있다.One method involves monitoring the infrastructure of an application by collecting application runtime data for individual application components called in the application. This method can use agents that reside natively in the monitored system. For example, using instrumentation of software, a thread or process can be tracked so that each component being called can be identified, as well as runtime such as the execution time of each component Data can be obtained. Tracking refers to obtaining a detailed record or trace of the steps that a computer program executes. One type of trace is a stack trace. Traces can be used as an aid in debugging.
더욱이, 일부 경우에 있어서, 추가적인 계측이, 예를 들어, 특정 성능 문제를 진단하기 위한 것처럼, 애플리케이션에 부가될 수 있다. 그러나, 이러한 추가적인 계측을 설치 및 제거하기 위한 고장안전 메커니즘(failsafe mechanism)이 필요하다.Moreover, in some cases, additional metrics may be added to the application, such as, for example, to diagnose a particular performance problem. However, there is a need for a failsafe mechanism to install and remove such additional metrology.
본 발명은 애플리케이션의 런타임 동안 일시적 계측을 설치 및 제거하기 위한 고장안전 메커니즘을 제공한다.The present invention provides a fail-safe mechanism for installing and removing temporary instrumentation during run-time of an application.
일 실시예에서, 애플리케이션에 대해 고장안전 능력(failsafe capability)을 제공하는 컴퓨터로 구현되는 방법이 제공된다. 이 방법은, 일시적인 동적 계측(temporary dynamic instrumentation)을 상기 애플리케이션에 부가하기 위해 애플리케이션 서버에서 요청을 수신하는 것을 포함하며, 여기서 상기 요청은 컴퓨팅 디바이스로부터 상기 컴퓨팅 디바이스와 상기 애플리케이션 서버 간의 각각의 연결(720)을 통해 수신된다. 이 방법은 또한, 상기 요청에 응답하여, 상기 애플리케이션의 런타임(runtime) 동안 상기 일시적인 동적 계측을 상기 애플리케이션에 부가하고, 그리고 상기 각각의 연결을 통해 상기 컴퓨팅 디바이스로의 콜백(callback)을 구현하는 것을 포함하며, 상기 콜백은 상기 각각의 연결이 예기치 못하게 유실되었는지 여부를 결정한다. 이 방법은 또한, 상기 각각의 연결이 예치기 못하게 유실되었다고 상기 콜백이 결정하는 것에 응답하여, 상기 일시적인 동적 계측을 포함하지 않은 상태로 상기 애플리케이션을 복원시키는 것을 포함한다.In one embodiment, a computer implemented method is provided for providing failsafe capability for an application. The method includes receiving a request from an application server to add temporary dynamic instrumentation to the application, wherein the request is from a computing device to a
또 다른 실시예에서, 애플리케이션들에 대해 고장안전 능력을 제공하는 컴퓨터로 구현되는 방법이 제공되고, 이 방법은 제 1 컴퓨팅 디바이스(예를 들어, 수집기(collector)와 같은 것)에서 제 2 컴퓨팅 디바이스로부터의 요청을 수신하는 것을 포함하며, 여기서 상기 요청은 애플리케이션 서버를 식별하고, 아울러 상기 애플리케이션 서버에서 애플리케이션에, 관련된 일시적인 동적 계측을 부가하기 위한 적어도 하나의 지시어들을 포함한다. 이 방법은 또한, 상기 요청에 응답하여, 타이머를 구현하고, 그리고 제 1 연결을 통해 상기 제 1 컴퓨팅 디바이스로부터 상기 애플리케이션 서버로, 상기 애플리케이션에 상기 관련된 일시적인 동적 계측을 부가하기 위한 상기 지시어들 및 상기 제 1 컴퓨팅 디바이스로의 콜백을 구현하도록 하는 요청을 제공하는 것을 포함하며, 여기서 상기 콜백은 상기 제 1 연결이 예기치 못하게 유실되었는지 여부를 결정한다. 이 방법은 또한, 상기 타이머의 만료시, 만약 상기 제 1 연결이 예기치 못하게 유실되지 않았다면, 상기 관련된 일시적인 동적 계측이 부가되기 전에 존재했던 상태로 상기 애플리케이션을 복원시키도록 하는 요청을 상기 제 1 연결을 통해 상기 애플리케이션 서버에 제공하는 것을 포함한다.In yet another embodiment, a computer-implemented method is provided for providing fault-safe capabilities for applications, the method comprising: providing a first computing device (e.g., a collector) Wherein the request includes at least one directive for identifying an application server and for adding to the application an associated temporal dynamic metric at the application server. The method also includes the steps of: in response to the request, implementing a timer and applying the associated temporary dynamic metric to the application from the first computing device to the application server via a first connection; The method comprising: providing a request to implement a callback to a first computing device, wherein the callback determines whether the first connection has been unexpectedly lost. The method also includes the step of, upon expiration of the timer, sending a request to restore the application to a state that existed before the associated temporal dynamic metering was added, if the first connection was unexpectedly lost. To the application server.
또 다른 실시예에서, 애플리케이션 서버에, 유형의 컴퓨터 판독가능 저장소가 제공되고, 상기 유형의 컴퓨터 판독가능 저장소는 애플리케이션들에 대해 고장안전 능력을 제공하는 방법을 수행하도록 적어도 하나의 프로세서를 프로그래밍하는 컴퓨터 판독가능 소프트웨어가 수록된다. 이 방법은, 컴퓨팅 디바이스 디바이스와의 연결을 확립하는 것과, 상기 연결을 통해 상기 컴퓨팅 디바이스로부터 일시적인 동적 계측을 상기 애플리케이션에 부가함과 아울러 오브젝트(callback object)를 호출하도록 하는 요청을 수신하는 것을 포함한다. 이 방법은 또한, 상기 요청에 응답하여, 상기 애플리케이션의 런타임 동안 상기 일시적인 동적 계측을 상기 애플리케이션에 부가함과 아울러 상기 콜백 오브젝트를 호출하는 것을 포함하며, 여기서 상기 콜백 오브젝트는 상기 연결을 모니터링 함으로써 상기 컴퓨팅 디바이스로의 콜백을 구현한다. 이 방법은 또한, 만약 상기 연결이 종료되었다고 상기 콜백 오브젝트가 결정하는 경우, 상기 일시적인 동적 계측을 포함하지 않은 상태로 상기 애플리케이션을 복원시키는 것을 포함한다.In yet another embodiment, an application server is provided with a type of computer readable storage, wherein the type of computer readable storage is a computer readable storage medium having stored thereon a computer program for programming at least one processor to perform a method of providing fault- Readable software is stored. The method includes establishing a connection with a computing device device and receiving a request to invoke an object (callback object) while adding temporary dynamic metering from the computing device to the application via the connection . The method also includes, in response to the request, adding the temporary dynamic metering to the application during runtime of the application, and invoking the callback object, wherein the callback object is configured to monitor the connection, Implement a callback to the device. The method also includes restoring the application to a state that does not include the transient dynamic metering if the callback object determines that the connection has been terminated.
대응하는 방법, 시스템, 및 컴퓨터 판독가능 혹은 프로세서 판독가능 저장 디바이스가 제공될 수 있으며, 이러한 디바이스는 그 실행시 본 명세서에서 제공되는 방법을 수행하는 명령들로 인코딩된 저장 매체를 포함한다.A corresponding method, system, and computer readable or processor readable storage device may be provided, which includes a storage medium encoded with instructions that, when executed, perform the methods provided herein.
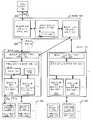
도 1은 피관리 애플리케이션을 포함하는 시스템을 도시한다.
도 2는 도 1의 네트워크의 컴퓨터 시스템을 도시한다.
도 3은 애플리케이션에 일시적 계측을 적용하는 예시적 고장안전 방법을 개관한 도면이다.
도 4a는 관리자 및 에이전트가 관련된 도 3의 단계(310)의 예시적 구현을 도시한다.
도 4b는 관리자들의 관리자(Manager Of Managers, MOM), 관리자, 및 에이전트가 관련된 도 3의 단계(310)의 예시적 구현을 도시한다.
도 5a는 관리자 및 애플리케이션 서버가 관련된 도 3의 단계(320)의 예시적 시나리오를 도시한다(여기서는 어떠한 고장도 검출되지 않음).
도 5b는 MOM, 관리자 및 애플리케이션 서버가 관련된 도 3의 단계(320)의 예시적 시나리오를 도시한다(여기서는 어떠한 고장도 검출되지 않음).
도 5c는 사용자 인터페이스, 관리자 및 애플리케이션 서버가 관련된 도 3의 단계(325)의 예시적 시나리오를 도시한다(여기서는 관리자와 애플리케이션 서버 간의 연결에서 고장이 검출됨).
도 5d는 사용자 인터페이스, 관리자 및 애플리케이션 서버가 관련된 도 3의 단계(325)의 예시적 시나리오를 도시한다(여기서는 관리자와 사용자 인터페이스 간의 연결에서 고장이 검출됨).
도 5e는 MOM, 사용자 인터페이스, 관리자 및 애플리케이션 서버가 관련된 도 3의 단계(325)의 예시적 시나리오를 도시한다(여기서는 관리자와 애플리케이션 서버 간의 연결에서 고장이 검출됨).
도 5f는 MOM, 사용자 인터페이스, 관리자 및 애플리케이션 서버가 관련된 도 3의 단계(325)의 예시적 시나리오를 도시한다(여기서는 관리자와 MOM 간의 연결에서 고장이 검출됨).
도 5g는 MOM, 사용자 인터페이스, 관리자 및 애플리케이션 서버가 관련된 도 3의 단계(325)의 예시적 시나리오를 도시한다(여기서는 사용자 인터페이스와 MOM 간의 연결에서 고장이 검출됨).
도 6은 도 3의 단계(330)의 예시적 구현을 도시한다.
도 7은 사용자 인터페이스, 관리자 및 에이전트가 관련된 도 3 및 도 4a의 프로세스의 예시적 구현을 도시한다.
도 8a는 하나의 에이전트가 관련된 일시적 계측의 하나의 아이템에 대해, MOM, 관리자 및 에이전트가 관련된 도 3의 프로세스에서의 콜백의 사용의 예시적 구현을 도시한다.
도 8b는 일시적 계측의 두 개의 아이템들에 대해, MOM, 관리자 및 하나의 에이전트가 관련된 도 3의 프로세스에서의 콜백의 사용의 예시적 구현을 도시한다.
도 8c는 하나의 에이전트가 관련된 일시적 계측의 두 개의 아이템들에 대해, MOM, 관리자 및 두 개의 에이전트들이 관련된 도 3의 프로세스에서의 콜백의 사용의 예시적 구현을 도시한다.
도 8d는 두 개의 에이전트들이 관련된 일시적 계측의 두 개의 아이템들에 대해, MOM, 두 개의 관리자들 및 두 개의 에이전트들이 관련된 도 3의 프로세스에서의 콜백의 사용의 예시적 구현을 도시한다.
도 9는 실행 경로에서의 컴포넌트들의 호출 관계를 도시한다.
도 10은 도 9의 호출 관계에 근거하는 호출 스택 위치 대 시간 그래프를 도시한다.
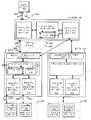
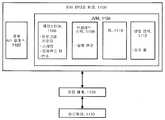
도 11은 자바(JAVA) 런타임 환경을 도시한다.
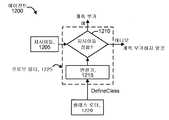
도 12a는 정적 계측을 위한 자바-기반의 예시적 프로세스 흐름을 도시한다.
도 12b는 정적 계측을 위한 .NET-기반의 예시적 프로세스 흐름을 도시한다.
도 13은 소프트웨어를 계측하는 예시적 프로세스 흐름을 도시한다.
도 14는 컴포넌트들 및 대응하는 성능 데이터 간의 계층적 관계를 나타내는 사용자 인터페이스 디스플레이를 도시한다.Figure 1 illustrates a system including a managed application.
Figure 2 shows a computer system of the network of Figure 1;
Figure 3 is an overview of an exemplary failure-safe method of applying transient metering to an application.
FIG. 4A illustrates an exemplary implementation of step 310 of FIG. 3, in which an administrator and an agent are involved.
FIG. 4B illustrates an exemplary implementation of step 310 of FIG. 3 in which the Manager of Managers (MOM), the manager, and the agent are involved.
5A illustrates an exemplary scenario of step 320 of FIG. 3 (where no failures are detected) where the administrator and application server are involved.
FIG. 5B illustrates an exemplary scenario of step 320 of FIG. 3 (where no malfunctions are detected) where the MOM, the administrator, and the application server are involved.
FIG. 5C shows an exemplary scenario of step 325 of FIG. 3 (where a failure is detected in the connection between the administrator and the application server) in which the user interface, administrator and application server are involved.
5D shows an exemplary scenario of step 325 of FIG. 3 (where a failure is detected in the connection between the administrator and the user interface) in which the user interface, administrator and application server are involved.
FIG. 5E shows an exemplary scenario of step 325 of FIG. 3 (where a failure is detected in the connection between the administrator and the application server) in which the MOM, user interface, administrator and application server are involved.
FIG. 5F shows an exemplary scenario of step 325 of FIG. 3 (where a failure is detected in the connection between the manager and the MOM) involving the MOM, the user interface, the administrator and the application server.
FIG. 5g shows an exemplary scenario of step 325 of FIG. 3 (where a failure is detected in the connection between the user interface and the MOM) with which the MOM, the user interface, the administrator and the application server are associated.
FIG. 6 illustrates an exemplary implementation of step 330 of FIG.
Figure 7 illustrates an exemplary implementation of the process of Figures 3 and 4A in which the user interface, manager and agent are involved.
8A illustrates an exemplary implementation of the use of a callback in the process of FIG. 3, in which one agent is associated with an MOM, an administrator, and an agent for one item of the interim metering.
8B shows an exemplary implementation of the use of callbacks in the process of FIG. 3 for MOM, an administrator, and one agent for two items of transient metering.
FIG. 8C illustrates an exemplary implementation of the use of callbacks in the FIG. 3 process in which an agent is associated with two items of interim metering, the MOM, the manager, and two agents.
8D shows an exemplary implementation of the use of a callback in the process of FIG. 3 in which two agents are associated with a MOM, two managers, and two agents for two items of a related metric.
Figure 9 shows the calling relationship of components in the execution path.
Figure 10 shows a call stack location versus time graph based on the call relationship of Figure 9;
11 shows a Java runtime environment.
Figure 12A illustrates an exemplary Java-based process flow for static metering.
Figure 12B illustrates an exemplary .NET-based process flow for static metering.
Figure 13 shows an exemplary process flow for measuring software.
Figure 14 shows a user interface display showing hierarchical relationships between components and corresponding performance data.
본 발명은 애플리케이션의 런타임 동안 일시적 계측을 설치 및 제거하는 고장안전 메커니즘을 제공한다.The present invention provides a fail-safe mechanism for installing and removing temporary instrumentation during run-time of an application.
초기에, 애플리케이션과 같은 소프트웨어는 계측되는 컴포넌트들(예를 들어 방법들과 같은 것)의 베이스라인 세트(baseline set)로 구성될 수 있다. 전형적으로, 계측은 간접비용(overhead costs)을 최소화시키기 위해 선택적으로 그리고 적절하게 애플리케이션에 적용된다. 개발자들은 최적의 계측 패키지를 개발하기 위해 이전의 경험에 의존한다. 시간이 흐름에 따라, 경험이 얻어지고 그리고 애플리케이션에 대해 개선해야 할 문제 혹은 영역이 식별될 수 있다. 추가적인 계측이, 성능 문제를 진단하기 위한 것과 같은, 다양한 상황에서 애플리케이션에 배치될 수 있다. 그러나, 애플리케이션에 대한 통신 링크에서의 인터럽트(interruption), 컴퓨팅 디바이스 고장, 소프트웨어 고장, 혹은 다른 타입의 고장이 존재하는 경우에도(이것은, 예를 들어 애플리케이션이 실행되는 애플리케이션 서버와 같은 컴퓨팅 디바이스로부터 원격 위치에 있는 원격 사용자 인터페이스로부터 수동으로 계측을 롤백하는 것을 불가능하게 함), 일시적으로 적용될 추가적인 계측이 자동으로 제거되는 것을 보장하는 고장안전 메커니즘이 필요하다. 이러한 고장안전 메커니즘이 없다면, 일시적인 계측이 예기치 못하게 그리고 심각하게 애플리케이션의 성능에 손상을 줄 수 있다. 예를 들어, 일시적인 계측은 모든 클래스드을 계측하기 위한 것과 같은 그러한 커맨드를 포함할 수 있고, 이것은 과도한 연산 부담을 일으킨다.Initially, software, such as an application, may be composed of a baseline set of components to be measured (such as methods, for example). Typically, metrology is applied selectively and appropriately to applications to minimize overhead costs. Developers rely on previous experience to develop optimal metering packages. As time goes by, problems or areas that experience is obtained and that need to be improved for the application can be identified. Additional metrology can be deployed to applications in a variety of situations, such as for diagnosing performance problems. However, even in the presence of an interruption in a communication link to an application, a computing device failure, a software failure, or other type of failure (which may occur, for example, from a computing device, such as an application server, To manually roll back the instrumentation from the remote user interface on the remote user interface), a failure safety mechanism is needed to ensure that additional instrumentation to be applied temporarily is automatically removed. Without these fail-safe mechanisms, transient metrology can unexpectedly and seriously compromise application performance. For example, transient metrics may include such commands as to measure all classes, which causes an excessive computational burden.
예시적 구현에서, 고장안전 메커니즘은, 하나의 컴퓨팅 디바이스 상의 애플리케이션의 에이전트와, 하나 이상의 관리자 컴퓨팅 디바이스들과, 그리고/또는 사용자 인터페이스/워크스테이션 간의 콜백을 사용하여 제공된다. 콜백은 컴퓨팅 디바이스들 간에 확립된 연결들을 모니터링한다. 만약 연결이 예기치 못하게 유실되는 경우(예를 들어, 통신 링크의 고장 혹은 다른 문제로 인해), 콜백은 종료된다. 유사하게, 연결의 계획된 폐쇄도 또한, 콜백이 종료되게 한다. 더욱이, 하나의 콜백은 하나 이상의 다른 콜백들로 종속 연결될 수 있어, 에이전트는 임의의 문제에 관한 정보를 궁극적으로 제공받게 된다. 에이전트로의 콜백이 종료되는 경우, 추가적인 계측이 부가되기 전에 존재했던 상태로 애플리케이션을 되돌리는 롤백 절차가 구현된다.In an exemplary implementation, a fail-safe mechanism is provided using a callback between an agent of an application on one computing device, one or more administrator computing devices, and / or a user interface / workstation. The callback monitors established connections between computing devices. If the connection is lost unexpectedly (for example due to a communication link failure or other problem), the callback is terminated. Similarly, the planned closure of the connection also causes the callback to terminate. Moreover, one callback can be cascaded to one or more other callbacks, so the agent is ultimately provided with information about any problem. When the callback to the agent is terminated, a rollback procedure is implemented that returns the application to the state it was in before additional metering was added.
도 1은 서로 다른 컴퓨터 시스템들이 관리자에 데이터를 제공하는 네트워크를 도시한다. 도면들에서 번호가 동일한 구성요소들 서로 대응하는 구성요소들이다. 컴퓨터 시스템들은 서로 다른 여러 방법으로 정렬될 수 있다. 한가지 방법으로, 애플리케이션 서버들의 세트는, 애플리케이션들을 실행시키고, 그리고 공통 관리자 컴퓨팅 디바이스로 보고를 하는 에이전트 소프트웨어를 실행시킨다. 또 다른 방법으로, 각각의 관리자 컴퓨팅 디바이스로 보고를 각각하는 애플리케이션 서버들의 복수의 세트들이 존재하며, 그리고 각각의 관리자 컴퓨팅 디바이스들은, 관리자들의 관리자(Manager Of Managers, MOM)로 언급되는, 더 높은 레벨의 관리자 컴퓨팅 디바이스에게 보고를 한다. 관리자들의 계층에서의 추가적인 레벨들이 또한 제공될 수 있다. 각각의 관리자 혹은 MOM 컴퓨팅 디바이스는, 예를 들어 정보를 제공함과 아울러 명령들을 수신하기 위해, 임의의 관련된 사용자 인터페이스/워크스테이션과 통신할 수 있다.Figure 1 illustrates a network in which different computer systems provide data to an administrator. In the drawings, the same components are denoted by the same reference numerals. Computer systems can be arranged in different ways. In one approach, a set of application servers runs agent software that runs applications and reports to a common manager computing device. Alternatively, there is a plurality of sets of application servers each of which is responsible for reporting to each manager computing device, and each manager computing device is associated with a higher level, referred to as Manager Of Managers (MOM) Lt; RTI ID = 0.0 > computing < / RTI > Additional levels in the hierarchy of managers may also be provided. Each manager or MOM computing device may communicate with any associated user interface / workstation, for example, to receive instructions as well as provide information.
예시적 시스템(100)은 애플리케이션 서버들(122, 124 및 126)을 포함하는 애플리케이션 서버들의 세트(120) 및 각각의 에이전트들을 포함한다. 애플리케이션 서버(122)의 에이전트(123)가 도시된다. 각각의 애플리케이션 서버는 하나 이상의 에이전트들을 가질 수 있다. 한가지 방법에서, 개별 에이전트가 애플리케이션의 각각의 인스턴스에 대해 제공된다. 애플리케이션 서버들은, 원하는 기능을 달성하기 위해 코드를 실행시키는 위한 프로세서를 구비한 임의 타입의 컴퓨터 시스템의 예이다. 애플리케이션 서버들은 서로 다른 애플리케이션들을 실행시킬 수 있거나, 혹은 동일한 애플리케이션의 개별 인스턴스들을 실행시킬 수 있다. 애플리케이션 서버들은 서로로부터 원격 위치에 있을 수 있거나 혹은 동일한 위치에 있을 수 있다. 애플리케이션 서버들의 세트(120)는 본 예에서 로컬 관리자 컴퓨터(108)와 통신한다. 대안적으로, 관리자 컴퓨터(108)는 애플리케이션 서버들의 세트(120)로부터 원격 위치에 있을 수 있고, 이 경우 이들 간의 통신은 네트워크 클라우드(network cloud)(130)를 통해 일어날 수 있다.
이러한 예시적 구현은 또한, 애플리케이션 서버들(142, 144 및 146)을 포함하는 애플리케이션 서버들의 세트(140) 및 각각의 에이전트들을 포함한다. 애플리케이션 서버(142)의 에이전트(143)가 도시된다. 애플리케이션 서버들의 세트(140)는 본 예에서 로컬 관리자 컴퓨터(114)와 통신한다.This exemplary implementation also includes a set of
예를 들어, 웨 기반의 전자 상거래 애플리케이션과 같은 엔터프라이즈 애플리케이션(enterprise application)을 운영하는 기업체는, 로드 균형(load balancing)을 위해 하나의 위치에 다수의 애플리케이션 서버들을 사용할 수 있고, 반면에, 고장안전 조치로서 서로 다른 위치에서 애플리케이션 서버들을 또한 사용할 수 있다. 개별 웹 브라우저들(152, 154 및 156)을 포함하는 웹 브라우저들의 세트(150)과 같은 사용자들로부터의 요청이, 인터넷과 같은 네트워크 클라우드(130)를 통해 수신되고, 그리고 세트들(120 혹은 140) 내의 애플리케이션 서버들 중 임의의 애플리케이션 서버로 라우팅될 수 있다.For example, an enterprise operating an enterprise application, such as a web-based e-commerce application, may use multiple application servers in one location for load balancing, while a fault- As a measure, application servers can also be used at different locations. Requests from users such as the set of
웹 브라우저들의 세트(150)는 전형적으로 인터넷 서비스 제공자(미도시)를 통해 네트워크 클라우드(130)에 액세스한다. 애플리케이션 서버들 상에서 실행되는 에이전트 소프트웨어는, 한 가지 가능한 방법으로서, 각각의 애플리케이션 서버들 상에서 실행되는, 애플리케이션, 미들웨어 혹은 다른 소프트웨어로부터 정보를 수집한다. 예를 들어, 이러한 정보는 계측을 사용하여 획득될 수 있는바, 그 하나의 예는 바이트 코드 측정이다. 그러나, 수집된 데이터는 또한 다른 방식으로 획득될 수도 있다. 에이전트들은 모니터링되는 컴퓨터 시스템 내에 기본적으로 상주한다. 에이전트들은 관리자들(108 및 114)에 전달된 데이터를 조직화 및 최적화한다.The set of
소프트웨어 실행을 모니터링하기 위해 소프트웨어를 계측하기 위한 다양한 방법들이 알려져 있다. 예를 들어, 처음부터 모니터링되는 바와 같이, 트레이싱(tracing)이 소프트웨어의 실행을 추적하기 위해 사용될 수 있다. 트레이싱의 일 예는, 참조로 본 명세서에 통합되는, 미국 특허 출원 공개 번호 제2004/0078691호(발명의 명칭: "Transaction Tracer", 공개일 :2004년 4월 22일)에 설명되어 있다. 본 명세서에서 설명되는 한가지 방법에서, 모니터링될 애플리케이션의 오브젝트 코드 혹은 바이트 코드가 프로브(probe)들로 계측(예를 들어, 수정)된다. 프로브들은 애플리케이션의 비즈니스 혹은 다른 로직을 변경시킴 없이 애플리케이션에 대한 여러 가지 특정 정보들을 측정한다. 프로브들이 애플리케이션의 바이트 코드에 설치되는 경우, 이 애플리케이션은 피관리 애플리케이션으로 언급된다. 에이전트 소프트웨어는 프로브들로부터 성능 데이터와 같은 정보를 수신하고, (예를 들어, 관리자(108 혹은 104)에서의) 또 다른 프로세서에 이러한 정보를 전달할 수 있거나, 또는 이러한 정보를 국부적으로 프로세싱하여, 예를 들어, 이러한 정보가 비정상 조건을 표시하는지 여부를 결정한다. 예를 들어, 프로브들로부터의 정보는, 트랜잭션 혹은 다른 실행 흐름의 시작 시간과 종료 시간 혹은 트랜잭션/실행 흐름 내의 개별 컴포넌트들의 시작 시간과 종료 시간과 같은, 성능 데이터를 표시할 수 있다. 이러한 정보는, 사전에 확립된 기준과 비교되어 일정 범위 내에 있는지 여부가 결정된다. 만약 정보가 일정 범위 내에 있지 않다면, 에이전트는 이 사실을 관리자에게 보고할 수 있고 이에 따라 적절한 문제해결법(troubleshooting)이 수행될 수 있게된다. 에이전트들은 전형적으로, 이들이 관련되어 있는 로컬 애플리케이션 서버들 상에서 실행되는 소프트웨어를 전형적으로 알고 있다.Various methods for measuring software to monitor software execution are known. For example, as initially monitored, tracing can be used to track the execution of the software. One example of tracing is described in U.S. Patent Application Publication No. 2004/0078691 entitled "Transaction Tracer, " issued April 22, 2004, which is incorporated herein by reference. In one method described herein, the object code or bytecode of the application to be monitored is measured (e.g., modified) by probes. Probes measure a number of specific information about an application without changing the application's business or other logic. When probes are installed in the bytecode of an application, this application is referred to as a managed application. The agent software may receive information, such as performance data, from the probes and may communicate such information to another processor (e.g., at the manager 108 or 104), or may process such information locally, For example, whether such information indicates an abnormal condition. For example, information from probes may indicate performance data, such as the start and end times of a transaction or other execution flow, or the start and end times of individual components in a transaction / execution flow. This information is compared with a previously established criterion to determine whether it is within a certain range. If the information is not within a certain range, the agent can report this fact to the manager and appropriate troubleshooting can be performed accordingly. Agents typically know software that runs on local application servers to which they are associated.
관리자들(108 및 114)은, 에이전트들로부터 수신된 데이터에 근거하여 정보를 디스플레이하기 위한 사용자 인터페이스(106 혹은 116)와 각각 통신하는 개별 컴퓨팅 디바이스들 상에 제공될 수 있다. 사용자 인터페이스는 또한 개별 컴퓨팅 디바이스들을 나타낼 수 있다. 도 10 및 도 11에서의 예시적 사용자 인터페이스 디스플레이들을 참조하기 바란다. 관리자들(108 및 114)은 또한, 에이전트들로부터 수신된 데이터를 저장하기 위한 데이터베이스들(110 및 112)에 각각 액세스할 수 있다. 제시된 예에서, 애플리케이션 서버들은 네트워크 클라우드(130)에 액세스함이 없이 각각의 관리자들과 통신할 수 있다. 예를 들어, 통신은 근거리 통신망(local area network)을 통해 일어날 수 있다. 다른 설계에 있어서, 관리자들은 네트워크 클라우드(130)를 xdh해 다수의 애플리케이션 서버들의 에이전트들로부터 데이터를 수신할 수 있다. 예를 들어, 일부 큰 조직체들은 중앙 네트워크 운영 센터(central network operations center)를 사용할 수 있고, 여기서는 하나 이상의 관리자들이 서로 다른 지리적 위치에서의 다수의 분산된 에이전트들로부터 데이터를 획득한다. 설명 목적으로, 웹 기반의 전자 상거래 기업은, 소비자 주문을 받는 서로 다른 지리적 위치에서의 서버들로부터, 비용지불을 처리하는 서버들로부터, 물품목록을 추적하고 주문을 전달하기 위한 창고에서의 서버들로부터, 및 기타 등등으로부터 에이전트 데이터를 획득할 수 있다. 도 9를 참조하기 바란다. 관리자들 및 사용자 인터페이스 디스플레이들은 기업체 본부의 위치에 제공될 수 있다. 반드시 웹 기반이 아닌 또는 소매 혹은 다른 영업을 포함하는 다른 애플리케이션들이 시스템 관리를 위해 에이전트들 및 관리자들을 유사하게 사용할 수 있다. 예를 들어, 은행은 수표 및 신용 계좌를 처리하기 위한 애플리케이션을 사용할 수 있다. 더욱이, 언급된 복수 컴퓨터 시스템 구성에 추가하여, 단일 컴퓨터 시스템이 또한, 하나 이상의 에이전트들로 모니터링될 수 있다.Administrators 108 and 114 may be provided on discrete computing devices in communication with a
MOM(104)은, 예를 들어, 커맨드들을 제공함과 아울러 데이터를 수신하기 위해, 관리자들(108 및 114)과 통신한다. MOM(104)은 또한, 예를 들어 개별 컴퓨팅 디바이스 상의 사용자 인터페이스(102)와 통신하여, 데이터를 제공함과 아울러 사용자 커맨드들을 수신할 수 있다. MOM은 하위 레벨의 관리자들에 대해 중앙 관리자로서 동작할 수 있어, 사용자 인터페이스(102)와 관리자들 간의 통신을 조정한다.The
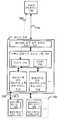
도 2는 도 1의 네트워크의 컴퓨터 시스템을 도시한다. 컴퓨터 시스템(200)은, 도 1과 연계되어 설명된 바와 같은, 웹 브라우저들, 애플리케이션 서버들, 관리자들, MOM 및/또는 사용자 인터페이스들 중 하나로서 사용될 수 있는, 시스템의 간략화된 표현이다. 컴퓨터 시스템(200)은 하드 디스크 혹은 휴대용 매체와 같은 저장 디바이스(210)와, 다른 컴퓨터 시스템들과 통신하기 위한 네트워크 인터페이스(220)와, 소프트웨어 명령들을 실행하기 위한 프로세서(230)와, 예를 들어, 소프트웨어 명령들을 저장 디바이스(210)로부터의 로딩된 이후 저장하기 위한 RAM과 같은 작업 메모리(240)와, 그리고 사용자 인터페이스 디스플레이(250)를 포함한다. 저장 디바이스(210)는, 본 명세서에서 설명되는 기능을 제공하기 위한 방법을 수행하도록 프로세서(230)를 프로그래밍하기 위한 프로세스 판독가능 코드가 수록되어 있는 프로세서 판독가능 저장 디바이스인 것으로 고려될 수 있다. 사용자 인터페이스 디스플레이(250)는 하나 이상의 에이전트들로부터 수신된 데이터에 근거하여 인간 운영자에게 정보를 제공할 수 있다. 사용자 인터페이스 디스플레이(250)는, 그래픽, 도표 등인지 여부에 상관없는, 임의의 공지된 디스플레이 방식을 사용할 수 있다. 온스크린 디스플레이(on-screen display)에 추가하여, 예를 들어 프린트로부터의 하드 카피와 같은 출력물이 제공될 수 있다.Figure 2 shows a computer system of the network of Figure 1;
더욱이, 본 명세서에서 설명되는 기능은 하드웨어, 소프트웨어, 혹은 하드웨어와 소프트웨어 양쪽 모두의 결합을 사용하여 구현될 수 있다. 소프트웨어에 있어서, 하나 이상의 프로세서들을 프로그래밍하기 위한 프로세서 판독가능 코드가 수록되어 있는 하나 이상의 유형의 프로세서 판독가능 저장 디바이스들이 사용될 수 있다. 유형의 프로세서 판독가능 저장 디바이스들은, 휘발성 및 비휘발성 매체들, 탈착가능 및 비탈착가능 매체들과 같은 컴퓨터 판독가능 매체들을 포함할 수 있다. 예를 들어, 유형의 컴퓨터 판독가능 매체들은, 컴퓨터 판독가능 명령들, 데이터 구조들, 프로그램 모듈들, 혹은 다른 데이터와 같은 정보의 저장을 위한 임의의 방법 혹은 기술로 구현되는 휘발성 및 비휘발성 매체들, 탈착가능 및 비탈착가능 매체들을 포함할 수 있다. 유형의 컴퓨터 판독가능 매체들의 예들은, 원하는 정보를 저장하는데 사용될 수 있고 컴퓨터에 의해 액세스될 수 있는,Moreover, the functions described herein may be implemented using hardware, software, or a combination of both hardware and software. In software, one or more types of processor readable storage devices having processor readable code for programming one or more processors may be used. Type of processor readable storage devices may include volatile and nonvolatile media, computer readable media such as removable and non-removable media. For example, computer readable media of the type may be volatile and nonvolatile media implemented in any method or technology for storage of information such as computer readable instructions, data structures, program modules, or other data , Removable and non-removable media. Examples of types of computer-readable media include, but are not limited to,
RAM, ROM, EEPROM, 플래시 메모리 혹은 다른 메모리 기술, CD-ROM, 디지털 다용도 디스크(Digital Versatile Disk, DVD) 혹은 다른 광학 디스크 저장체, 자기적 카세트, 자기 디스크 저장체, 혹은 다른 자기적 저장 디바이스들, 또는 임의의 다른 매체를 포함한다. 대안적 실시예에서, 소프트웨어의 일부 혹은 모두는, 커스텀 집적 회로(custom integrated circuit)들, 게이트 어레이들, FPGA들, PLD들, 및 특수 목적 프로세서들을 포함하는 전용 하드웨어로 대체될 수 있다. 일 실시예에서, 하나 이상의 실시예들을 구현하는 (저장 디바이스에 저장되는) 소프트웨어가 하나 이사의 프로세서들을 프로그래밍하기 위해 사용된다. 하나 이상의 프로세서들은 하나 이상의 유형의 컴퓨터 판독가능 매체들/저장 디바이스들, 주변기기들 및/또는 통신 인터페이스들과 통신할 수 있다.But is not limited to, RAM, ROM, EEPROM, flash memory or other memory technology, CD-ROM, Digital Versatile Disk (DVD) , Or any other medium. In an alternative embodiment, some or all of the software may be replaced with dedicated hardware, including custom integrated circuits, gate arrays, FPGAs, PLDs, and special purpose processors. In one embodiment, software (which is stored in a storage device) that implements one or more embodiments is used to program the processors of one director. One or more processors may communicate with one or more types of computer readable media / storage devices, peripherals, and / or communication interfaces.
도 3은 애플리케이션에 일시적인 동적 계측을 적용하는 예시적 고장안전 방법을 개관한 도면이다. 단계(300)는 애플리케이션에 정적 계측을 적용하는 것을 포함한다. 더 상세한 내용에 대해서는 예를 들어, 도 12a, 도 12b를 참조하기 바란다. 단계(305)는 정적 계측으로부터 애플리케이션의 성능 데이터를 획득하는 것을 포함한다. 애플리케이션이 실행됨에 따라, 계측은 각각의 관리자에게 보고를 하여 애플리케이션의 성능이 모니터링될 수 있다. 더 상세한 내용에 대해서는 예를 들어, 도 14를 참조하기 바란다. 단계(310)는 애플리케이션에 동적으로 일시적 계측을 적용하는 것을 포함한다. 언급된 바와 같이, 추가적인 계측이, 예를 들어 성능 문제를 진단하기 위해, 애플리케이션에 일시적으로 적용될 수 있다. 이러한 계측은 예를 들어, 애플리케이션의 런타임 동안 동적으로 적용될 수 있고, 이에 따라 애플리케이션의 정지시간은 존재하지 않게 된다. 더 상세한 내용에 대해서는 예를 들어, 도 4a 및 도 4b를 참조하기 바란다. 일시적 계측은, 수 분 혹은 수 시간과 같은 소정의 시간 기간 동안 적용될 수 있는바, 이것은 타이머 프로세스에 의해 실행된다. 시간 주기의 끝은, 일시적 계측이 자동으로 제거되는 만료 시간인바, 이러한 일시적 계측이 자동으로 제거되는 것은, 만약 일시적 계측이 여전히 애플리케이션에 존재하고 수동으로는 제거되지 않는 경우(만약 그렇지 않다면 이미 제거되었을것임)에 일어난다. 이것은 일시적 계측이 고장안전 메커니즘으로서, 특정 시간/날짜 이전에 연장되지 않도록 보장한다.Figure 3 is an overview of an exemplary failure-safe method of applying transient dynamic metering to an application. Step 300 includes applying static measurements to the application. For more details, see, for example, Figs. 12A and 12B. Step 305 includes obtaining performance data of the application from static metering. As the application runs, the metrics can be reported to each manager and the performance of the application can be monitored. For more details, see FIG. 14, for example. Step 310 includes dynamically applying temporary measurements to the application. As noted, additional metrics may be temporarily applied to the application, for example to diagnose performance problems. Such metrics can be applied dynamically, for example, during runtime of an application, so that there is no application downtime. For further details, see, for example, FIGS. 4A and 4B. The transient measurement can be applied for a predetermined period of time, such as a few minutes or a few hours, which is performed by a timer process. The end of the time period is the expiration time at which the transient instrumentation is automatically removed, so that this transient instrumentation is automatically removed if the transient instrumentation is still present in the application and not manually removed (if not, Lt; / RTI > This ensures that transient metering is a failure safety mechanism and does not extend before a specific time / date.
더욱이, 일부 경우에 있어서, 일시적 계측의 서로 다른 아이템들 혹은 유닛들이 동시에 또는 서로 다른 시간에 애플리케이션에 부가될 수 있고 서로 다른 만료 시간을 가질 수 있음에 유의해야 한다. 예를 들어, 애플리케이션의 클래스들의 일 세트는 일 시점에서 부가된 일시적 계측을 가질 수 있고 아울러 제 1 만료 시간을 가질 수 있는 반면, 애플리케이션의 클래스들의 또 다른 일 세트는 또 다른 일 시점에서 부가된 일시적 계측을 가질 수 있고 아울러 제 2 만료 시간을 가질 수 있다.Moreover, it should be noted that, in some cases, different items or units of temporary measurement may be added to the application at the same time or at different times and have different expiration times. For example, a set of classes of an application may have temporal metrics added at one time and may have a first expiration time, while another set of classes of applications may be transiently added at another point in time And can have a second expiration time.
단계(315)는 정적 및 동적 계측으로부터 성능 데이터를 획득하는 것을 포함한다. 일시적 계측이 적용되는 경우, 일시적 계측으로부터의 성능 데이터는 정적 계측으로부터의 이전의 이용가능한 성능 데이터에 추가되어 이용가능하게 된다.Step 315 includes obtaining performance data from the static and dynamic metrics. If temporary measurements are applied, the performance data from the temporary measurements are made available in addition to the previous available performance data from the static measurements.
이때, 두 가지 시나리오들 중 하나가 일어날 수 있다. 단계(320)에서, 시간 기간 동안 어떠한 고장도 검출되지 않는다. 이것은 예를 들어, (원격 사용자 인터페이스로부터 수동으로 애플리케이션의 계측을 롤백하는 것을 불가능하게 하는) 애플리케이션에 대한 통신 링크에서의 인터럽트, 컴퓨팅 디바이스 고장, 소프트웨어 고장, 혹은 어떤 다른 타입의 고장이 존재하지 않음을 표시할 수 있다. 고장은, 애플리케이션 서버, 관리자 컴퓨터, MOM 컴퓨터, 및 사용자 인터페이스/워크스테이션 컴퓨터를 포함하는 하나 이상의 컴퓨팅 디바이스들에 의해 검출될 수 있다. 더 상세한 내용에 대해서는 예를 들어, 도 5a 및 도 5b를 참조하기 바란다.At this point, one of two scenarios can happen. At step 320, no faults are detected during the time period. This may include, for example, an interrupt in the communication link to an application (which makes it impossible to manually roll back the instrumentation of the application from the remote user interface), a computing device failure, a software failure, or some other type of failure Can be displayed. The failure may be detected by one or more computing devices, including an application server, a manager computer, a MOM computer, and a user interface / workstation computer. For further details, see, for example, Figs. 5A and 5B.
두 번째 시나리오는 단계(325)에서 제시되는바, 여기서는 고장이 검출된다. 더 상세한 내용에 대해서는 예를 들어, 도 5c 내지 도 5g를 참조하기 바란다.The second scenario is presented in step 325, where a fault is detected. For further details, see, for example, Figs. 5C to 5G.
어느 경우에나, 단계(330)는 일시적 계측이 부가되기 전에 존재했던 상태로 애플리케이션을 되돌리는 것을 포함한다. 이러한 단계는 일시적 계측을 롤백 혹은 제거하는 것을 포함할 수 있다. 상태는 애플리케이션에 적용된 계측의 상태를 나타내며, 반드시 애플리케이션에 의해 유지되는 임의의 다른 구성 혹은 데이터를 나타내는 것은 아니다. 이것은 일시적 계측을 포함하지 않는 상태일 수 있다. 단계(330)는 고장이 검출되지 않는 경우보다 고장이 검출될 때 더 빨리 수행된다.In either case, step 330 includes returning the application to the state it was in before the temporary measurement was added. This step may involve rolling back or removing the temporary measurement. The state indicates the state of the measurement applied to the application and does not necessarily represent any other configuration or data maintained by the application. This may be a state that does not include transient measurements. Step 330 is performed faster when a failure is detected than if no failure is detected.
일시적 계측의 서로 다른 아이템들이 부가될 때, 고장은 모든 아이템들보다 더 적은 아이템들을 포함할 수 있어 롤백도 또한 모든 아이템들보다 더 적은 아이템들을 포함함에 유의해야 한다. 예를 들어, 만약 일시적 계측 아이템들 A 및 B(예를 들어, 여기서 A는 하나 이상의 클래스들의 제 1 세트를 나타내고, B는 하나 이상의 클래스들의 제 2 세트를 나타냄)가 부가되고, 고장이 단지 아이템 B만을 포함하면, 아이템 A가 여전히 애플리케이션에 포함되지만 아이템 B는 포함되지 않도록 계측은 롤백될 수 있다. 또한, 일시적으로 계측을 부가하는 것에 추가하여, 만료 시간에 관련되지 않도록 계측이 동적으로 그리고 영구히 부가되는 것이 가능하다. 이러한 경우에, 롤백은 영구적 계측을 적절한 곳에 놓을 수 있다.It should be noted that when different items of temporary measurement are added, the failure can include fewer items than all items, and rollback also includes fewer items than all items. For example, if temporary measurement items A and B (e.g., where A represents a first set of one or more classes and B represents a second set of one or more classes) is added, If only B is included, the measurement can be rolled back so that Item A is still included in the application but Item B is not. In addition to temporarily adding the measurement, it is also possible that the measurement is added dynamically and permanently so as not to be related to the expiration time. In this case, rollback can place permanent measurements in place.
도 4a는 관리자 및 에이전트가 관련된 도 3의 단계(310)의 예시적 구현을 도시한다. 도 7의 예시적 시나리오를 또한 참조하기 바란다. 일시적 계측, 즉 단지 제한된 시간의 기간 동안만 활성화되는 계측을 적용하기 위해, 단계(400)는, 사용자 인터페이스에 대한 콜백을 설정하도록 하는 요청과 함께, 사용자 인터페이스로부터 관리자로 일시적 계측에 대한 하나 이상의 지시어들을 제공하는 것을 포함한다. 예를 들어, 하나 이상의 지시어들은 애플리케이션 서버들(120)의 하나 이상의 애플리케이션들을 계측하기 위해 사용자 인터페이스(106)로부터 관리자(108)로 제공될 수 있거나, 또는 이 지시어들은 애플리케이션 서버들(140)의 하나 이상의 애플리케이션들을 계측하기 위해 사용자 인터페이스(116)로부터 관리자(114)로 제공될 수 있다(도 1). 지시어들은, 예를 들어, 사용자 인터페이스를 통해 사용자 커맨드에 의해 제공될 수 있다. 지시어들은 규칙들이며, 예를 들어, 계측을 위한 애플리케이션의 클래스들을 식별할 수 있고, 뿐만 아니라 계측을 수행해야하는 에이전트를 식별할 수 있다. 지시어들은, 에이전트의 명칭을 식별하는 파라미터를 포함하는 계측을 적용하도록 하는 요청 내에 있을 수 있다. 에이전트의 명칭은, 에이전트가 모니터링하는 에이전트 및 애플리케이션 서버의 IP 어드레스와 관련된 캐시된 정보에 대한 키(key)일 수 있다.FIG. 4A illustrates an exemplary implementation of step 310 of FIG. 3, in which an administrator and an agent are involved. See also the exemplary scenario of FIG. 7. In order to apply the metric that is only active for a period of time, i.e., only for a limited period of time, step 400 includes, from a user interface to a manager, one or more directives for temporal instrumentation, along with a request to set a callback to the user interface Lt; / RTI > For example, one or more directives may be provided from the
일반적으로, 두 개의 컴퓨팅 디바이스들이 통신하는 경우, 이들 간에는 지속적인 연결이 확립될 수 있다. 연결은 TCP와 같은 연결 지향 전송 프로토콜을 사용할 수 있다. 특히, 컴퓨팅 디바이스들 간의 연결은 컴퓨팅 디바이스들의 소켓들 간에 제공될 수 있다. 소켓은 컴퓨터 네트워크에 걸쳐 쌍방향의 프로세스간 통신 흐름의 엔드포인트(endpoint)일 수 있다. 더욱이, 소켓은, 로컬 및 원격 IP 어드레스들 및 포트 번호들의 결합에 근거하여, 입력되는 데이터 패킷들을 적절한 애플리케이션 프로세스 혹은 쓰레드로 전달할 수 있다. 소켓은, (a) 컴퓨팅 디바이스를 식별하는 IP 어드레스 및 (b) 애플리케이션 프로그램 프로세스 혹은 쓰레드(콜백과 같은 것)로 매핑되는 포트를 포함하는 소켓 어드레스를 가질 수 있다. 구체적으로, 소켓은, (a) 전송 프로토콜(예를 들어, TCP, UDP), 순수 IP(raw IP), 혹은 다른 것들과 같은 프로토콜, (b) 로컬 IP 어드레스 및 포트 번호를 포함하는 로컬 소켓 어드레스, 및 (c) TCP 서버가 복수의 클라이언트들에 동시에 서비스를 행할 때, 확립된 TCP 소켓들의 경우에서의 원격 소켓 어드레스의 결합에 의해 특징지어질 수 있다. 컴퓨팅 디바이스들이 연결을 통해 통신할 때, 이 연결은 TCP/IP, HTTP, HTTP 혹은 TCP 터널링(tunneling), 또는 임의의 다른 방법을 사용할 수 있다.In general, when two computing devices communicate, a persistent connection can be established between them. The connection may use a connection-oriented transport protocol such as TCP. In particular, connections between computing devices may be provided between sockets of computing devices. A socket may be an endpoint of a two-way inter-process communication flow across a computer network. Moreover, the socket can forward incoming data packets to the appropriate application process or thread, based on the combination of local and remote IP addresses and port numbers. The socket may have a socket address that includes (a) an IP address identifying the computing device and (b) a port mapped to an application program process or thread (such as a callback). Specifically, the socket may include a socket such as (a) a protocol such as a transport protocol (e.g., TCP, UDP), raw IP, or others, (b) a local socket address , And (c) a combination of remote socket addresses in the case of established TCP sockets when a TCP server services multiple clients concurrently. When computing devices communicate over a connection, the connection may use TCP / IP, HTTP, HTTP or TCP tunneling, or any other method.
더욱이, 일시적 계측의 서로 다른 아이템들에 대한 지시어들이 서로 다른 시간에 또는 그렇지 않다면 개별 요청에서 제공될 때, 개별적 연결 및 소켓이 각각의 아이템에 대해 컴퓨팅 디바이스에 의해 개별적으로 제공 및 모니터링될 수 있다.Moreover, when directives for different items of temporary measurement are provided at different times or otherwise in separate requests, individual connections and sockets can be separately provided and monitored by the computing device for each item.
단계(400)에 응답하여, 단계(405)에서, 관리자는 사용자 인터페이스로의 콜백을 설정한다. 콜백은, 관리자의 컴퓨팅 디바이스와 사용자 인터페이스의 컴퓨팅 디바이스 간의 연결을 모니터링하기 위해 관리자에서 실행되는 실행가능한 코드일 수 있다. 예를 들어, 컴퓨팅 디바이스에서의 콜백 코드는, 연결이 활성화 상태인지 또는 폐쇄 혹은 유실되었는지 여부를 결정하기 위해, 또 다른 컴퓨팅 디바이스와의 연결을 제공하기 위해 사용되는 소켓을 계속 모니터링할 수 있다. 콜백은 연결의 일 측 상의 콜백 핸들러(callback handler) 및 연결의 다른 측 상의 콜백 리스너(callback listener)와 같은 코드를 포함할 수 있다.In response to step 400, in step 405, the administrator sets up a callback to the user interface. The callback may be executable code that is executed in an administrator to monitor a connection between an administrator's computing device and a computing device in the user interface. For example, a callback code at a computing device may continue to monitor a socket used to provide a connection with another computing device to determine whether the connection is active or has been closed or lost. The callback may include code such as a callback handler on one side of the connection and a callback listener on the other side of the connection.
단계(410)에서, 관리자는, 관리자로의 콜백을 설정하도록 하는 요청과 함께, 하나 이상의 지시어들을 식별된 에이전트 및 애플리케이션 서버로 전달한다. 관리자는 또한, 사용자 인터페이스로부터의 요청에서 특정된 시간 기간 혹은 만료 날짜에 근거하여 타이머를 설정한다. 관리자와 에이전트 간의 통신은 앞서 설명된 바와 같이 소켓을 통해 연결을 확립하는 것을 포함할 수 있다.At step 410, the manager forwards one or more directives to the identified agent and application server, along with a request to set up a callback to the manager. The administrator also sets a timer based on the time period or expiration date specified in the request from the user interface. Communication between the manager and the agent may include establishing a connection through the socket as described above.
응답으로서, 단계(415)에서, 에이전트는, 단계(405)에서 관리자가 사용자 인터페이스로의 콜백을 설정하는 방식과 유사하게, 관리자로의 콜백을 설정한다. 단계(420)에서, 하나 이상의 지시어들에 근거하여, 예를 들어 도 13과 연계되어 더 설명되는 바와 같이, 에이전트는 애플리케이션의 런타임 동안 애플리케이션에 일시적 계측을 부가한다.As a response, in step 415, the agent sets up a callback to the manager, similar to the manner in which the manager sets up a callback to the user interface in step 405. [ At step 420, based on the one or more directives, the agent adds temporal instrumentation to the application during runtime of the application, for example as further described in connection with Figure 13.
도 4b는 관리자들의 관리자(MOM), 관리자, 및 에이전트가 관련된 도 3의 단계(310)의 예시적 구현을 도시한다. 도 4a의 예는 세 개의 컴퓨팅 디바이스들, 즉 사용자 인터페이스, 관리자 및 애플리케이션 서버를 포함한다. 도 4a와 비교하여, 본 예는 사용자 인터페이스와 관리자 간에 MOM 컴퓨팅 디바이스를 추가적으로 포함한다. 도 8a 내지 도 8d의 예시적 시나리오들을 참조하기 바란다. 단계(430)는 사용자 인터페이스로의 콜백을 설정하도록 하는 요청과 함께, (예를 들어, 계측을 위한 애플리케이션의 클래스들을 식별함으로써 그리고 에이전트를 식별함으로써) 사용자 인터페이스로부터 MOM으로 일시적 계측을 위한 하나 이상의 지시어들을 제공한다. 단계(435)에서, MOM은 사용자 인터페이스로의 콜백을 설정한다. 단계(440)에서, MOM은 MOM으로의 콜백을 설정하도록 하는 요청과 함께 하나 이상의 지시어들을 식별된 에이전트의 관리자에게 전달한다. 단계(445)에서, 관리자는 MOM으로의 콜백을 설정한다. 단계(450)에서, 관리자는 관리자로의 콜백을 설정하도록 하는 요청과 함께 하나 이상의 지시어들을 에이전트로 전달한다. 관리자는 또한 타이머를 설정한다. 단계(455)에서, 에이전트는 관리자로의 콜백을 설정한다. 단계(460)에서, 애플리케이션의 런타임 동안, 하나 이상의 지시어들에 근거하여, 애플리케이션에 일시적 계측을 부가한다.FIG. 4B illustrates an exemplary implementation of step 310 of FIG. 3, in which the managers of administrators (MOMs), administrators, and agents are involved. The example of Figure 4A includes three computing devices: a user interface, an administrator, and an application server. 4A, this example additionally includes a MOM computing device between the user interface and the manager. Please refer to the exemplary scenarios of FIGS. 8A-8D. Step 430 includes one or more directives for temporary instrumentation from the user interface to the MOM (e.g., by identifying classes of application for instrumentation and identifying the agent), along with a request to set up a callback to the user interface Lt; / RTI > At step 435, the MOM establishes a callback to the user interface. At step 440, the MOM passes one or more directives to the manager of the identified agent, along with a request to set up a callback to the MOM. At step 445, the manager sets up a callback to the MOM. At step 450, the manager forwards one or more directives to the agent with a request to set up a callback to the manager. The administrator also sets a timer. At step 455, the agent sets up a callback to the manager. At step 460, during the runtime of the application, it adds temporary measurements to the application based on the one or more directives.
예를 들어, 지시자들은, 애플리케이션 서버들(120)의 하나 이상의 애플리케이션들을 계측하기 위해, 사용자 인터페이스(106)로부터 MOM(104)으로, 그리고 MOM(104)으로부터 관리자(108)에게 전달될 수 있고, 그리고/또는 애플리케이션 서버들(140)의 하나 이상의 애플리케이션들을 계측하기 위해, 관리자(114)에게 전달될 수 있다(도 1).For example, the indicators may be communicated from the
도 5a는 관리자 및 애플리케이션 서버가 관련된 도 3의 단계(320)의 예시적 시나리오를 도시한다(여기서는 어떠한 고장도 검출되지 않음). 단계(500)에서, 관리자에서의 타이머가 만료되고, 여기서 관리자에 의해 어떠한 연결의 유실도 검출되지 않는다. 시간은 일시적 계측이 활성화 상태에 있는 시간 기간을 정의하는 것임을 상기해야 한다. 관리자가 제 1 연결을 통한 사용자 인터페이스로의 콜백을 갖고, 그리고 애플리케이션 서버가 제 2 연결을 통한 관리자로의 콜백을 갖는 경우에, 이러한 상황은, 일시적 계측이 활성화되도록 의도된 시간 기간에 걸쳐 양쪽 연결이 모두 활성화 상태를 유지할 때 일어난다.5A illustrates an exemplary scenario of step 320 of FIG. 3 (where no failures are detected) where the administrator and application server are involved. At step 500, the timer at the manager expires, where no loss of connection is detected by the administrator. It should be recalled that the time defines the time period during which the transient measurement is in the active state. In the case where an administrator has a callback to the user interface via the first connection and the application server has a callback to the manager via the second connection, this situation may occur when both connections All of which are active.
더욱이, 관리자 혹은 사용자 인터페이스의 고장과 같은 어떠한 다른 고장도 일어나지 않는다. 사용자 인터페이스 컴퓨팅 디바이스의 고장은 제 1 연결을 폐쇄시키고 그럼으로써 관리자가 제 1 연결의 유실을 검출함에 유의해야 한다. 유사하게, 애플리케이션 서버의 고장은 제 2 연결을 폐쇄시키고 그럼으로써 관리자가 제 2 연결의 고장을 검출한다.Moreover, no other failures occur, such as failure of the administrator or user interface. It should be noted that the failure of the user interface computing device closes the first connection and thereby the administrator detects the loss of the first connection. Similarly, a failure of the application server closes the second connection and thereby the manager detects a failure of the second connection.
시간의 만료시, 관리자는 단계(502)에서 사용자 인터페이스로의 연결을 폐쇄하고, 그리고 단계(504)에서 애플리케이션 서버로의 연결을 폐쇄한다. 연결은 서로 다른 방식으로 관리자에 의해 폐쇄될 수 있다. 한가지 방법으로, 단계(502)에서, TCP 연결이 사용될 때, 관리자에서의 프로세스는, 사용자 인터페이스와의 세션이 이제 더 이상 필요 없음을 표시하기 위해 TCP 층으로 신호를 보낼 수 있다. 관리자가 연결을 종료하기를 원한다는 것을 표시하는 메시지를 관리자가 사용자 인터페이스에 전송하고, 사용자 인터페이스는 이 메시지를 수신확인응답한다. 이 메시지에 응답하여, 사용자 인터페이스가 준비될 때, 사용자 인터페이스에서의 프로세스는 세션이 이제 더 이상 필요하지 않음을 표시하기 위해 TCP 층에 신호를 보낼 수 있고, 그리고 대응하는 메시지가 관리자에게 전송되며, 관리자는 이 메시지를 수신확인응답한다. 사용자 인터페이스는 이러한 수신확인응답 수신시 연결을 폐쇄하고, 그리고 관리자는 이러한 수신확인응답을 제공한 이후 특정 시간에 연결을 폐쇄한다. 연결의 폐쇄는 소켓을 폐쇄하는 것을 포함할 수 있다.At the end of the time, the manager closes the connection to the user interface at step 502 and closes the connection to the application server at step 504. The connection can be closed by the administrator in different ways. As an alternative, in step 502, when a TCP connection is used, the process at the manager may send a signal to the TCP layer to indicate that the session with the user interface is no longer needed. The administrator sends a message to the user interface indicating that the administrator wants to terminate the connection, and the user interface acknowledges the message. In response to this message, when the user interface is ready, the process at the user interface can signal the TCP layer to indicate that the session is no longer needed, and the corresponding message is sent to the manager, The administrator acknowledges this message. The user interface closes the connection upon receiving such an acknowledgment, and the administrator closes the connection at a specified time after providing such an acknowledgment. Closing of the connection may involve closing the socket.
유사하게, 단계(504)에서, 관리자에서의 프로세스는 애플리케이션 서버와의 세션이 이제 더 이상 필요하지 않음을 표시하기 위해 TCP 층에 신호를 보낼 수 있다. 관리자가 연결을 종료하기를 원한다는 것을 애플리케이션 서버에게 알리기 위한 관리자가 메시지를 전송하고, 그리고 애플리케이션 서버는 메시지를 수신확인응답한다. 응답으로서, 애플리케이션 서버가 준비될 때, 애플리케이션 서버에서의 프로세스는 세션이 이제 더 이상 필요하지 않음을 표시하기 위해 TCP 층에 신호를 보낼 수 있고, 그리고 대응하는 메시지가 관리자에게 전송되며, 관리자는 이 메시지를 수신확인응답한다. 애플리케이션 서버는 이러한 수신확인응답 수신시 연결을 폐쇄하고, 그리고 관리자는 이러한 수신확인응답을 제공한 이후 특정 시간에 연결을 폐쇄한다.Similarly, at step 504, the process at the manager may send a signal to the TCP layer to indicate that the session with the application server is no longer needed. The administrator sends a message to notify the application server that the administrator wants to terminate the connection, and the application server acknowledges the message. In response, when the application server is provisioned, the process at the application server can send a signal to the TCP layer to indicate that the session is no longer needed, and a corresponding message is sent to the manager, Acknowledges the message. The application server closes the connection upon receiving this acknowledgment, and the administrator closes the connection at a certain time after providing this acknowledgment.
단계(506)에서, 에이전트는 폐쇄된 연결을 검출한다. 예를 들어, 에이전트에서의 콜백 코드는, 애플리케이션 서버에서의 소켓이 언제 폐쇄되는지를 검출함으로써 연결이 언제 폐쇄되는지를 검출할 수 있다.At step 506, the agent detects a closed connection. For example, the callback code at the agent can detect when the connection is closed by detecting when the socket at the application server is closed.
단계(508)에서, 관리자에 대한 폐쇄된 연결을 검출하는 것에 응답하여, 도 3, 도 6 및 도 13의 단계(330)와 연계되어 설명되는 바와 같이, 에이전트는 일시적 계측의 롤백을 개시시킨다.In step 508, in response to detecting a closed connection to the manager, the agent initiates a rollback of transient metrics, as described in connection with step 330 of Figures 3, 6, and 13. [
고장 상태로 인한 연결의 예기치 못한 유실과 대조적으로, 연결의 폐쇄가 순서적으로 셧다운됨에 유의해야 한다.It should be noted that, in contrast to an unexpected loss of connection due to a fault condition, the closing of the connection is shut down in an orderly fashion.
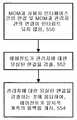
도 5b는 MOM, 관리자 및 애플리케이션 서버가 관련된 도 3의 단계(320)의 예시적 시나리오를 도시한다(여기서는 어떠한 고장도 검출되지 않음). 단계(510)에서, 관리자에 의한 연결의 유실 혹은 다른 고장이 검출되지 않았음을 표시하며, 관리자에서의 타이머가 만료된다. 단계(512)에서, 관리자는 MOM으로의 연결을 폐쇄한다. 연결의 폐쇄는 예를 들어 앞서 설명된 바와 같이 진행될 수 있다. 응답으로서, 단계(514)에서, MOM이 사용자 인터페이스의 연결을 폐쇄한다. 도 8a 내지 도 8d를 또한 참조하기 바란다. 유사하게, 단계(516)에서, 관리자는 애플리케이션 서버와의 연결을 폐쇄한다. 단계(518)에서, 에이전트는 폐쇄된 연결을 검출한다. 예를 들어, 에이전트에서의 콜백 코드는 애플리케이션 서버에서의 소켓이 언제 폐쇄되는지를 검출함으로써 연결이 언제 폐쇄되는지를 검출할 수 있다. 단계(520)에서, 관리자에 대한 폐쇄된 연결을 검출하는 것에 응답하여 에이전트가 일시적 계측의 롤백을 개시시킨다.FIG. 5B illustrates an exemplary scenario of step 320 of FIG. 3 (where no malfunctions are detected) where the MOM, the administrator, and the application server are involved. At step 510, a loss of connection or other failure by the administrator is not detected and the timer in the manager expires. At step 512, the manager closes the connection to the MOM. Closure of the connection may proceed, for example, as described above. As a response, at step 514, the MOM closes the connection of the user interface. See also Figures 8a-8d. Similarly, at step 516, the manager closes the connection with the application server. At step 518, the agent detects a closed connection. For example, the callback code at the agent can detect when the connection is closed by detecting when the socket at the application server is closed. In step 520, in response to detecting a closed connection to the manager, the agent initiates a rollback of transient metering.
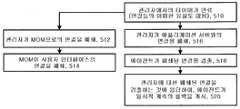
도 5c는 사용자 인터페이스, 관리자 및 애플리케이션 서버가 관련된 도 3의 단계(325)의 예시적 시나리오를 도시한다(여기서는 관리자와 애플리케이션 서버 간의 연결에서 고장이 검출됨). 단계(530)에서, 관리자와 사용자 인터페이스 간의 연결은 인터럽트되지 않는다. 그러나 단계(532)에서, 에이전트가 관리자에 대한 유실된 연결을 검출한다. 이것은 관리자에서의 타이머가 만료되기 전에 일어나고, 이에 따라 유실된 연결은 예기치 못한 것이고 그리고 어떤 타입의 고장으로 인한 것이다. 예를 들어, 에이전트에서의 콜백 코드는 애플리케이션 서버에서의 소켓이 언제 폐쇄되는지를 검출함으로써 연결이 언제 유실되는지를 검출할 수 있다. 연결이 예기치 못하게 유실되는 경우, 예외 이벤트 혹은 다른 에러가 연결과 관련된 하나 혹은 양쪽 컴퓨팅 디바이스들에 의해 검출될 수 있다. 예를 들어, 소켓이 각각의 연결이 유실되었음을 표시하는 이벤트를 발생시키는 지를 결정함으로써, 각각의 연결이 유실되었는 지를 결정하기 위해, 에이전트는 콜백을 사용할 수 있다.FIG. 5C shows an exemplary scenario of step 325 of FIG. 3 (where a failure is detected in the connection between the administrator and the application server) in which the user interface, administrator and application server are involved. At step 530, the connection between the manager and the user interface is not interrupted. However, at step 532, the agent detects a lost connection to the administrator. This happens before the timer in the manager expires, so the lost connection is unexpected and is due to some type of failure. For example, the callback code at the agent can detect when the connection is lost by detecting when the socket at the application server is closed. If a connection is unexpectedly lost, an exception event or other error may be detected by one or both computing devices associated with the connection. For example, the agent can use a callback to determine if each connection has been lost, by determining if the socket raises an event indicating that each connection has been lost.
단계(534)에서, 관리자에 대한 유실될 연결을 검출하는 것에 응답하여, 에이전트는, 도 3의 단계(330)와 연계되어 설명된 바와 같이, 일시적 계측의 롤백을 개시시킨다.In step 534, in response to detecting a connection to be lost to the administrator, the agent initiates a rollback of the temporal measurement, as described in conjunction with step 330 of FIG.
도 5d는 사용자 인터페이스, 관리자 및 애플리케이션 서버가 관련된 도 3의 단계(325)의 예시적 시나리오를 도시한다(여기서는 관리자와 사용자 인터페이스 간의 연결에서 고장이 검출됨). 이러한 시나리오에서, 관리자와 에이전트 간의 연결은 단계(540)에서 인터럽트되지 않는다. 그러나 단계(542)는 관리자가 사용자 인터페이스에 대한 유실된 연결을 검출하는 것을 포함한다. 이것은 일시적 계측을 위한 관리자에서의 타이머가 만료되기 전이다. 단계(542)에 응답하여, 관리자는 단계(544)에서 애플리케이션 서버와의 연결을 폐쇄한다. 에이전트는 546에서 폐쇄된 연결을 검출한다. 단계(548)에서, 관리자에 대한 폐쇄된 연결을 검출하는 것에 응답하여, 에이전트는, 도 3의 단계(330)와 연계되어 설명된 바와 같이, 일시적 계측의 롤백을 개시시킨다.5D shows an exemplary scenario of step 325 of FIG. 3 (where a failure is detected in the connection between the administrator and the user interface) in which the user interface, administrator and application server are involved. In this scenario, the connection between the manager and the agent is not interrupted at step 540. [ However, step 542 involves the administrator detecting a lost connection to the user interface. This is before the timer in the manager for temporary measurement expires. In response to step 542, the manager closes the connection with the application server at step 544. The agent detects a closed connection at 546. In step 548, in response to detecting a closed connection to the manager, the agent initiates a rollback of the temporal measurement, as described in conjunction with step 330 of FIG.
하나의 가능한 구현에서, 에이전트에 의해 검출되는 것이 폐쇄된 연결인지 혹은 유실된 연결인지 여부에 상관없이, 롤백은 기본적으로 동일하다.In one possible implementation, the rollback is basically the same regardless of whether the connection detected by the agent is a closed connection or a lost connection.
도 5e는 MOM, 사용자 인터페이스, 관리자 및 애플리케이션 서버가 관련된 도 3의 단계(325)의 예시적 시나리오를 도시한다(여기서는 관리자와 애플리케이션 서버 간의 연결에서 고장이 검출됨). 이러한 시나리오에서, MOM과 사용자 인터페이스 간의 연결 및 MOM과 관리자 간의 연결은 단계(550)에서 인터럽트되지 않는다. 그러나 단계(552)는 에이전트가 사용자 인터페이스에 대한 유실된 연결을 검출하는 것을 포함한다. 이것은 일시적 계측을 위한 관리자에서의 타이머가 만료되기 전이다. 단계(554)에서, 관리자에 대한 유실된 연결을 검출하는 것에 응답하여, 에이전트는, 도 3의 단계(330)와 연계되어 설명된 바와 같이, 일시적 계측의 롤백을 개시시킨다.FIG. 5E shows an exemplary scenario of step 325 of FIG. 3 (where a failure is detected in the connection between the administrator and the application server) in which the MOM, user interface, administrator and application server are involved. In this scenario, the connection between the MOM and the user interface and the connection between the MOM and the manager are not interrupted in step 550. However, step 552 includes the agent detecting a lost connection to the user interface. This is before the timer in the manager for temporary measurement expires. In step 554, in response to detecting a lost connection to the manager, the agent initiates a rollback of the temporal measurement, as described in conjunction with step 330 of FIG.
도 5f는 MOM, 사용자 인터페이스, 관리자 및 애플리케이션 서버가 관련된 도 3의 단계(325)의 예시적 시나리오를 도시한다(여기서는 관리자와 MOM 간의 연결에서 고장이 검출됨). 이러한 시나리오에서, MOM과 사용자 인터페이스 간의 연결 및 관리자와 애플리케이션 서버 간의 연결은 단계(560)에서 인터럽트되지 않는다. 그러나 단계(562)는 관리자가 MOM에 대한 유실된 연결을 검출하는 것을 포함한다. 이것은 일시적 계측을 위한 관리자에서의 타이머가 만료되기 전이다. 단계(564)에서, 유실된 연결을 검출하는 것에 응답하여, 관리자가 애플리케이션 서버와의 연결을 폐쇄한다. 응답으로서, 단계(566)에서, 애플리케이션 서버에서의 에이전트는 관리자에 대한 폐쇄된 연결을 검출한다. 단계(568)에서, 관리자에 대한 폐쇄된 연결을 검출하는 것에 응답하여, 에이전트는, 도 3의 단계(330)와 연계되어 설명된 바와 같이, 일시적 계측의 롤백을 개시시킨다.FIG. 5F shows an exemplary scenario of step 325 of FIG. 3 (where a failure is detected in the connection between the manager and the MOM) involving the MOM, the user interface, the administrator and the application server. In this scenario, the connection between the MOM and the user interface and the connection between the manager and the application server are not interrupted in step 560. However, step 562 involves the administrator detecting a lost connection to the MOM. This is before the timer in the manager for temporary measurement expires. In step 564, in response to detecting the lost connection, the manager closes the connection with the application server. As a response, at
도 5g는 MOM, 사용자 인터페이스, 관리자 및 애플리케이션 서버가 관련된 도 3의 단계(325)의 예시적 시나리오를 도시한다(여기서는 사용자 인터페이스와 MOM 간의 연결에서 고장이 검출됨). 이러한 시나리오에서, MOM과 관리자 간의 연결 및 관리자와 애플리케이션 서버 간의 연결은 단계(570)에서 인터럽트되지 않는다. 그러나 단계(572)는 MOM이 사용자 인터페이스에 대한 유실된 연결을 검출하는 것을 포함한다. 이것은 일시적 계측을 위한 관리자에서의 타이머가 만료되기 전이다. 단계(574)에서, 유실된 연결을 검출하는 것에 응답하여, MOM이 관리자와의 연결을 폐쇄한다. 응답으로서, 단계(576)에서, 관리자가 애플리케이션 서버와의 연결을 폐쇄한다. 단계(578)에서, 에이전트가 관리자에 대한 폐쇄된 연결을 검출한다. 단계(580)에서, 관리자에 대한 폐쇄된 연결을 검출하는 것에 응답하여, 에이전트는, 도 3의 단계(330)와 연계되어 설명된 바와 같이, 일시적 계측의 롤백을 개시시킨다.FIG. 5g shows an exemplary scenario of step 325 of FIG. 3 (where a failure is detected in the connection between the user interface and the MOM) with which the MOM, the user interface, the administrator and the application server are associated. In such a scenario, the connection between the MOM and the manager and the connection between the manager and the application server is not interrupted in step 570. [ However, step 572 involves the MOM detecting a lost connection to the user interface. This is before the timer in the manager for temporary measurement expires. In step 574, in response to detecting a lost connection, the MOM closes the connection with the manager. As a response, at step 576, the manager closes the connection with the application server. At step 578, the agent detects a closed connection to the manager. In step 580, in response to detecting a closed connection to the manager, the agent initiates a rollback of transient metrics, as described in connection with step 330 of FIG.
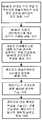
도 6은 도 3의 단계(330)의 예시적 구현을 도시한다. 일시적 계측이 부가되기 전에 존재했던 상태로 애플리케이션을 되돌리는 예시적 기술이 제공된다. 이 기술은, 일시적 계측이 애플리케이션으로부터 어떻게 롤백(예를 들어, 제거)되는 지를 나타낸다. 일시적 계측의 롤백은 일시적 계측을 적용하기 위한 지시어들을 제거하는 것을 포함할 수 있고, 이에 따라 에이전트는, 하나 이상의 일시적으로 계측된 클래스들의 바이트 코드를 다시 로딩함으로써, 그리고 일시적 계측이 부가되기 전에 이미 적용되었던 지시어들을 다시 적용함으로써, 에이전트가 계측의 이전 상태를 복원시킬 수 있게 된다. 롤백은 도 13과 연계되어 설명된 바와 같이, 애플리케이션의 하나 이상의 클래스들을 다시 정의하는 것을 포함할 수 있다. 애플리케이션에 적용되었던 계측의 이력 혹은 레코드는 에이전트 사이드에서 임의의 임베드된 데이터베이스에 지시어들의 시퀀스로서 저장될 수 있다.FIG. 6 illustrates an exemplary implementation of step 330 of FIG. An exemplary technique is provided for returning an application to a state that existed before temporary measurement was added. This technique indicates how transient metrics are rolled back (e.g., removed) from an application. The rollback of transient metrics may include removing directives to apply transient metrics so that the agent may be able to reapply the bytecodes of one or more transiently measured classes, , The agent can restore the previous state of the measurement. Rollback may include redefining one or more classes of the application, as described in connection with FIG. The history or record of instrumentation applied to the application can be stored as a sequence of directives in any embedded database on the agent side.
단계(600)에서, 에이전트가 계측되지 않은 바이트 코드에 액세스한다. 예를 들어, 이것은 .JAR 혹은 자바 아카이브 파일에 액세스하는 것을 포함할 수 있다. 이것은 복수의 자바 파일들을 포함하는 아카이브(archive)이다. 이것은 자바 클래스들 및 메타 데이터를 저장하고, 그리고 애플리케이션 서버와 같은 컴퓨팅 디바이스의 자바 런타임 환경(JAVA Runtime Environment, JRE™)에서 프로그램으로서 실행될 수 있다. 이것은 기본적으로 계측이 부가되기 전의 순수 바이트 코드이다. 단계(605)에서, 에이전트는 일시적 계측가 부가되기 전에 이미 적용되었던 계측 지시어들의 레코드 혹은 이력에 액세스한다. 단계(610)에서, 에이전트는 계측 지시어들의 레코드에 근거하여, 계측되지 않은 바이트 코드를 계측한다. 이러한 계측 지시어들은 일시적 계측과는 다른 계측을 갖는 애플리케이션을 측정하기 위한 규칙들을 포함할 수 있다. 예를 들어, 계측 지시어들은 계측돼야 하는 애플리케이션의 클래스들을 식별할 수 있다. 더 상세한 내용이 도 12a, 도 12b, 및 13과 연계되어 설명된다.In step 600, the agent accesses the unmeasured bytecode. For example, this may include accessing .JAR or Java archive files. This is an archive that contains multiple Java files. It stores Java classes and metadata, and can be run as a program in the Java Runtime Environment (JRE) of a computing device such as an application server. This is basically the raw byte code before the measurement is added. In step 605, the agent accesses the record or history of the measurement directives that have already been applied before the temporary measurement is added. In step 610, the agent measures the unmeasured byte code based on the record of the measurement directives. These measurement directives may include rules for measuring an application having measurements different from temporal measurements. For example, measurement directives can identify classes of applications that need to be measured. More details will be described in connection with Figs. 12A, 12B and 13.
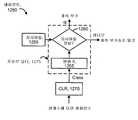
도 7은 사용자 인터페이스, 관리자 및 에이전트가 관련된 도 3 및 도 4a의 프로세스의 예시적 구현을 도시한다. 도 1의 사용자 인터페이스 컴퓨팅 디바이스(106), 관리자 컴퓨팅 디바이스(108), 및 애플리케이션 서버들의 세트(120)가 도시된다. 애플리케이션 서버들(122 및 124) 및 관련된 에이전트(123 및 125)가 또한, 각각 도시된다. 관리자(108)는 사용자 인터페이스(106)와의 인터페이스를 위한 소프트웨어(704)를 포함한다. 소프트웨어(704)는 에이전트들(123, 125, ...)에 대해 에이전트 동적 계측 프록시 서비스를 제공한다. 소프트웨어(706)는 프록시 서비스의 관리자 구현을 나타내고, 그리고 리스너(708) 및 타이머(710)를 포함한다. 소프트웨어(706)는 소프트웨어(704)와 인터페이스한다. 일시적 계측의 복수의 아이템들이 활성 상태일 때, 리스너와 타이머 쌍이 각각의 아이템에 대해 제공될 수 있다. 에이전트 동적 계측 서비스 형태의 소프트웨어가 각각의 에이전트에 대해 제공된다. 구체적으로, 소프트웨어(712)가 에이전트(123)와의 인터페이스를 위해 제공되고, 그리고 소프트웨어(714)가 에이전트(125)와의 인터페이스를 위해 제공된다. 소프트웨어(706)가 또한, 소프트웨어(712 및 714)와 인터페이스한다.Figure 7 illustrates an exemplary implementation of the process of Figures 3 and 4A in which the user interface, manager and agent are involved. A user
본 예에서, 쌍방향의 실선(718)은 사용자 인터페이스(106)와 관리자(108) 간의 개방된 연결을 나타내고, 그리고 쌍방향의 실선(720)은 애플리케이션 서버(122)와 관리자(108)(예를 들어, 관리자(108)의 프로세스(712)) 간의 개방된 연결을 나타낸다.In this example, a bidirectional
점선(720)은 사용자 인터페이스(106)와 관리자의 리스너(708) 간의 콜백을 나타낸다. 점선의 말단 원형은, 콜백 코드인 콜백 핸들러 프로세스를 나타내고, 반면 점선의 말단 화살표는, 역시 콜백 코드인 리스너 프로세스를 가리킨다. 따라서, 콜백(702)에 있어서, 콜백 핸들러는 사용자 인터페이스(106)에 있다. 유사하게, 점선(716)은 에이전트(123)와 관리자의 리스너(708) 간의 콜백을 나타내고, 여기서 콜백 핸들러는 에이전트(123)에 있다. 일시적 계측이 애플리케이션 서버(122)에서의 애플리케이션에 적용될 때, 타이머(710)는 일시적 계측이 활성 상태로 유지돼야하는 시간 기간을 추적한다. 더욱이, 콜백(716)은 연결(720)을 모니터링하고, 그리고 콜백(720)은 연결(718)을 모니터링한다. 본질적으로, 콜백의 양쪽 말단은 동일한 연결을 모니터링할 수 있다. 예를 들어, 애플리케이션 서버(122) 혹은 관리자(108)는 연결(720)이 유실되었는지 여부를 결정하기 콜백(716)을 사용할 수 있과, 그리고 사용자 인터페이스(106) 혹은 관리자(108)는 연결(718)이 유실되었는지 여부를 결정하기 콜백(702)을 사용할 수 있다.
도 8a는 하나의 에이전트가 관련된 일시적 계측의 하나의 아이템에 대해, MOM, 관리자 및 에이전트가 관련된 도 3의 프로세스에서의 콜백의 사용의 예시적 구현을 도시한다. 도 1의 사용자 인터페이스(102), MOM(104) 및 관리자(114)가 도시된다. MOM은, 사용자 인터페이스(106)와 인터페이스하는 에이전트 동적 계측 프록시 서비스를 위한 소프트웨어(804)와, 리스너(808)를 포함하는 프록시 서비스의 MOM 구현(806)과, 그리고 관리자들(108 및 114)과 같은 하나 이상의 관리자들과 인터페이스하는 관리자의 에이전트 동적 계측 프록시 서비스(810)를 포함한다. 쌍방향 실선 화살표(803)는 MOM(104)과 사용자 인터페이스(102) 간의 연결을 나타낸다.8A illustrates an exemplary implementation of the use of a callback in the process of FIG. 3, in which one agent is associated with an MOM, an administrator, and an agent for one item of the interim metering. The
관리자(114)는 관리자(108)와 유사한 컴포넌트들을 포함하는바, 에이전트 동적 계측 프록시 서비스를 위한 소프트웨어(824) 및 프록시 서비스의 관리자 구현을 위한 소프트웨어(826)를 포함한다. 본 예에서는 리스너 혹은 타이머가 제공되지 않는데, 왜냐하면 관리자(114)가 관련된 콜백이 도시되지 않았기 때문이다. 에이전트 동적 계측 서비스 소프트웨어(832 및 834)가 도 1의 애플리케이션 서버들(142 및 144)의 에이전트들(143 및 145)에 대해 각각 제공된다.The manager 114 includes components similar to the manager 108 and includes software 824 for the agent dynamic metrology proxy service and software 826 for the administrator implementation of the proxy service. In this example, no listener or timer is provided because the callback associated with the manager 114 is not shown. Agent dynamic
점선(802)은 사용자 인터페이스(102)와 MOM(104)의 리스너(808) 간의 콜백을 나타내고, 여기서 콜백 핸들러는 사용자 인터페이스(102)에 있다. 유사하게, 점선(812)은 관리자(108)와 MOM의 리스너(808) 간의 콜백을 나타내고, 여기서 콜백 핸들러는 리스너(808)에 있다. 점선(814)은 관리자(108)와 MOM의 리스너(808) 간의 콜백을 나타내고, 여기서 콜백 핸들러는 리스너(708)에 있다. 쌍방향 실선 화살표(805)는 MOM(104)과 관리자(108) 간의 연결을 나타낸다. 앞서 설명된 바와 같이, 점선(716)은 리스너(708)와 에이전트(123) 간의 콜백을 나타내고, 여기서 콜백 핸들러는 에이전트(123)에 있다.
일반적으로, 모든 콜백들은 쌍방향성일 수 있으며, 여기서 화살표는 콜백의 설정 방향을 표시한다. 즉, 콜백을 생성할 책임이 있는 컴퓨팅 디바이스 혹은 다른 엔티티는 화살표의 꼬리 상에 있고, 그리고 콜백을 수신하고 콜백을 통해 다시 결과들을 전달하기 위해 콜백을 사용하는 엔티티는 화살표의 머리에 있다.In general, all callbacks may be bidirectional, where the arrows indicate the direction in which the callback is set. That is, the computing device or other entity responsible for creating the callback is on the tail of the arrow, and the entity using the callback to receive the callback and pass the results back through the callback is at the head of the arrow.
콜백들의 제 1 시퀀스는, 1) 사용자 인터페이스/워크스테이션(102)에서 MOM(104)이고(콜백(802)), 그리고 2) MOM(104)에서 관리자(108)이다(콜백(812)). 이러한 두 개의 콜백들은, 결과 및 고장안전에 관해 관리자로부터 워크스테이션으로의 통신을 위한 것이다. 콜백들의 제 2 시퀀스는, 1) 에이전트(123)에서 관리자(108)이고(콜백(716)), 그리고 2) 관리자(108)에서 MOM(104)이다(콜백(814)). 이러한 것들은 관리자(108) 및 사용자 인터페이스(102)에 대한 동적 계측의 결과를 가져오는 고장안전 및 결과들의 콜백들이다. 리스너들(708 및 808)(그리고 아래에서 설명되는 도 8d에서의 828)은 콜백들이 동기화될 수 있도록 함으로써 "글루(glue)"를 제공한다. 콜백들(802), 및 아래에서 설명되는 도 8b에서의 콜백(807)은, 계측의 각각의 아이템에 대한, "병렬" 콜백들인 것으로 고려될 수 있다.The first sequence of callbacks is 1) the MOM 104 (callback 802) at the user interface /
애플리케이션 서버(122)에서의 애플리케이션에 일시적 계측이 적용될 때, 타이머(710)는 일시적 계측이 활성화 상태로 유지돼야 하는 시간 기간을 추적한다. 더욱이, 사용자 인터페이스(102) 혹은 MOM(104)은 연결(803)의 유실 여부를 결정하기 위해 콜백(802)을 사용할 수 있다. 유사하게, MOM(104) 및 관리자(108)는 연결(805)의 유실 여부를 결정하기 위해 콜백들(812 및 814)을 사용할 수 있다. 관리자(108) 혹은 에이전트(123)는 연결(720)의 유실 여부를 결정하기 위해 콜백(716)을 사용할 수 있다.When temporal metering is applied to an application at the application server 122, the
일시적 계측을 포함하지 않는 컴퓨팅 디바이스들 간의 다른 연결들이 확립될 수 있음에 유의해야 한다.It should be noted that other connections between computing devices that do not include transient measurements may be established.
도 8b는 일시적 계측의 두 개의 아이템들에 대해, MOM, 관리자 및 하나의 에이전트가 관련된 도 3의 프로세스에서의 콜백의 사용의 예시적 구현을 도시한다. 이러한 구현은, 에이전트(123)에 의해 사용된 계측의 추가적인 아이템에 대해 추가적인 콜백들 및 연결들을 제공함으로써 도 8a의 구현에 부가된 것이다. 특히, 추가적인 연결(811)이 사용자 인터페이스(102)와 MOM(104) 간에 제공되고, 추가적인 연결(809)이 MOM(104)과 관리자(108) 간에 제공되고, 그리고 추가적인 연결(823)이 관리자(108)와 에이전트(123) 간에 제공된다. 더욱이, 사용자 인터페이스(102) 및 MOM(104)은 계측의 추가적인 아이템에 대한 연결(811)을 모니터링하기 위해 추가적인 콜백(807)을 사용한다. (추가적인 리스너 프로세스(842)를 통한) MOM(104) 및 관리자(108)는 계측의 추가적인 아이템에 대한 연결(809)을 모니터링하기 위해 추가적인 콜백들(844 및 846)을 사용한다. 관리자(108) 및 에이전트(123)는 계측의 추가적인 아이템에 대한 연결(823)을 모니터링하기 위해 콜백(836)을 사용한다. 관리자(108)에서, 추가적인 리스너 프로세스(825) 및 관련된 타이머 프로세스(827)는 계측의 추가적인 아이템과 관련된다.8B shows an exemplary implementation of the use of callbacks in the process of FIG. 3 for MOM, an administrator, and one agent for two items of transient metering. This implementation is in addition to the implementation of Figure 8A by providing additional callbacks and connections for additional items of instrumentation used by the
이러한 예는 추가적인 연결들, 리스너들 및 콜백들을 사용함으로써 계측의 또 다른 아이템들로 확장될 수 있다.This example can be extended to other items of measurement by using additional connections, listeners and callbacks.
도 8c는 하나의 에이전트가 관련된 일시적 계측의 두 개의 아이템들에 대해, MOM, 관리자 및 두 개의 에이전트들이 관련된 도 3의 프로세스에서의 콜백의 사용의 예시적 구현을 도시한다. 본 구현은, 또 다른 에이전트, 즉 에이전트(125)에 계측의 추가적인 아이템을 제공함으로써 도 8b의 구현을 수정한 것이다. 이러한 경우에, 관리자(108)와 에이전트 프로세스(125)가 실행되는 애플리케이션 서버(124) 간의 제 2 연결(838)이 확립된다. 더욱이, 콜백(840)은 이러한 연결(838)을 모니터링하기 위해 관리자(108) 및 에이전트(125)에 의해 사용된다.FIG. 8C illustrates an exemplary implementation of the use of callbacks in the FIG. 3 process in which an agent is associated with two items of interim metering, the MOM, the manager, and two agents. This embodiment is a modification of the implementation of Figure 8B by providing an additional item of instrumentation to another agent, In this case, a
도 8d는 두 개의 에이전트들이 관련된 일시적 계측의 두 개의 아이템들에 대해, MOM, 두 개의 관리자들 및 두 개의 에이전트들이 관련된 도 3의 프로세스에서의 콜백의 사용의 예시적 구현을 도시한다. 본 구현은, 또 다른 에이전트, 즉 에이전트(143)(이것은 또 다른 관리자, 즉 관리자(114)와 관련됨)에 계측의 추가적인 아이템을 제공함으로써 도 8a의 구현을 수정한 것이다. 이러한 경우에, 연결(894)이 MOM(104)과 관리자(114) 간에 확립되고, 그리고 연결(848)이 관리자(114)의 프로세스(832)와 에이전트 프로세스(143)가 실행되는 애플리케이션 서버(124) 간에 확립된다. 타이머(830)가 리스너(828)와 관련된다. MOM(104) 및 관리자(114)가 연결(894)을 모니터링하기 위해 콜백들(896 및 898)을 사용하고, 그리고 관리자(114) 및 에이전트(143)가 연결(848)을 모니터링하기 위해 콜백(852)을 사용한다.8D shows an exemplary implementation of the use of a callback in the process of FIG. 3 in which two agents are associated with a MOM, two managers, and two agents for two items of the interim metering involved. This implementation is a modification of the implementation of Figure 8A by providing an additional item of instrumentation to another agent, i.e., the agent 143 (which is associated with another manager, i.e., the administrator 114). In this case, a
도 8a 내지 도 8d의 구현들의 결합이 또한 사용될 수도 있다. 이러한 예들은 추가적인 연결들, 리스너들 및 콜백들을 사용함으로써 계측의 또 다른 아이템들로 확장될 수 있다.A combination of implementations of Figures 8A-8D may also be used. These examples can be extended to other items of measurement by using additional connections, listeners and callbacks.
도 9는 실행 경로에서의 컴포넌트들의 호출 관계를 도시한다. 도 1에 도시된 바와 같은 애플리케이션 서버 상에서 실행될 수 있는 애플리케이션 내의 컴포넌트둘아 도시된다. 본 명세서에서 제공되는 컴포넌트들의 시퀀스는 하나의 가능한 실행 경로 타입의 예이다. 호출되는 각각의 컴포넌트는 실행 경로의 일부로서 고려될 수 있다. 애플리케이션이 계측될 때, 개발자의 애플리케이션의 이해 및 관심이 대상이 될 것으로 예측되는 컴포넌트들의 선택에 근거하여 전형적으로 단지 선택된 컴포넌트들만이 계측됨에 유의해야 한다. 따라서, 적어도 초기에, 관심의 대상이 될 것으로 고려되지 않는 많은 컴포넌트들은, 애플리케이션에서 호출은 될 수 있지만 계측되지는 않는다.Figure 9 shows the calling relationship of components in the execution path. Lt; RTI ID = 0.0 > 1 < / RTI > on an application server as shown in Fig. The sequence of components provided herein is an example of one possible execution path type. Each component that is invoked can be considered as part of the execution path. It should be noted that when an application is instrumented, typically only selected components are measured based on a selection of components that are expected to be of interest and interest to the developer's application. Thus, at least initially, many components that are not considered to be of interest can be called in the application, but not instrumented.
컴포넌트 지향 프로그래밍 모델들이, 컴포넌트들로 언급되는 블록들을 구축하는 것으로부터 프로그래머가 애플리케이션 혹은 다른 프로그램을 조립할 수 있게 함에 있어서 유용하다. 각각의 컴포넌트는 소프트웨어의 전체 기능과 어울리는 특정 기능을 수행할 수 있다. 더욱이, 컴포넌트는 다른 컴포넌트들을 호출할 수 있을뿐만 아니라, 재귀 호출로 자기 자신을 호출할 수 있고, 이에 따라 컴포넌트들의 시퀀스가 프로그램에서 호출되게 된다. 컴포넌트들은, 프로그램 실행시, 소비되는 컴퓨터 시스템에서의 자원들 혹은 완료된 작업의 예들이다. 컴포넌트 지향 프로그래밍 모델의 일 예는 J2EE인바, 이것은 자바 서버 페이지(Java Server Page), 엔터프라이드 자바 빈(Enterprise Java Bean), 서블릿(servlet), 및 자바 데이터베이스 연동 컴포넌트(Java Database Connectivity component)와 같은 컴포넌트들을 사용할 수 있다. 그러나, 마이크로소프트, .NET 컴포넌트들을 사용하는 것과 같은 다른 컴포넌트 지향 프로그래밍 모델들이 또한 사용될 수도 있다. 더욱이, 프로그래밍 모델은 객체 지향일 필요는 없다. 한가지 방법에서, 컴포넌트들은 방법들인 것으로 고려된다.Component-oriented programming models are useful in allowing programmers to build applications or other programs from building blocks that are referred to as components. Each component can perform a specific function that matches the full functionality of the software. Moreover, a component can call other components, as well as call itself in a recursive call, thereby causing a sequence of components to be called from the program. The components are examples of resources or completed tasks in the computer system being consumed when the program is executed. One example of a component-oriented programming model is the J2EE framework, which includes components such as a Java Server Page, an Enterprise Java Bean, a servlet, and a Java Database Connectivity component. Can be used. However, other component-oriented programming models such as Microsoft, .NET components may also be used. Moreover, the programming model need not be object oriented. In one method, the components are considered to be methods.
도시된 특정 예는, 사용자가 아이템들을 주문할 수 있는 웹 기반 전자 상거래 애플리케이션을 나타낸다. 컴포넌트들은 애플리케이션 내의 비즈니스 로직 혹은 전자 상거래 단계들에 대응한다. 특히, 컴포넌트 C1(912)은, 사용자로 하여금 구입할 아이템을 선택할 수 있게 하고 아울러 결재 방법과 같은 정보(예를 들어, 신용 카드의 타입, 신용 카드 번호) 및 선적 정보(예를 들어, 아이템이 선적돼야하는 어드레스 및 선적의 방법(예를 들어, 지상 배달 혹은 야간 항공 배달))를 입력할 수 있도록 하는 쇼핑 카드를 제공한다. C1(912)은, 선택된 아이템이 비축되어 있는지 여부를 결정하기 위해 물품목록을 점검하기 위해, C1A(914)를 호출한다. 선택된 아이템이 비축되어 있음이 결정되면, C1(912)은 컴포넌트 C2(922)를 호출하고, 컴포넌트 C2(922)는 해당 아이템을 예약하여 트랜잭션이 여전히 계류 중인 동안 또 다른 사용자에게 해당 아이템이 팔리지 않게 한다. 마무리되면, C2(922)는 컴포넌트 C3(924)를 호출하고, 컴포넌트 C3(924)는 사용자의 신용 카드 정보를 점검하여 구입을 허가하고 유효화시키게 되다. 이것은 전형적으로 신용 카드 클리어링하우스(credit card clearinghouse)에 의해 관리되는 외부 서버와 통신하는 것을 포함한다. 예를 들어, C3(924)는 신용 카드 서비스와 콘택하는 컴포넌트 C3A(926)를 호출할 수 있다.The specific example shown represents a web-based e-commerce application where a user can order items. Components correspond to business logic or e-commerce stages within an application. In particular, the
C3(924)가 성공적으로 마무리되면, 그럼으로써 구입이 승인되면, C4(930)가 호출되고, C4(930)는 구입된 아이템의 양을 감분시킴으로서 물품목록을 조정한다. C4(930)는 컴포넌트 C5(942)를 호출하고, C5(942)는, 예를 들어 창고에 연락함으로써, 선적될 아이템을 준비하는바, 여기서 선적 라벨이 프린트되고 운영자는 수작업으로 아이템의 위치를 알아내서 패킹하도록 요구받는다. 예를 들어, C5(942)는, 컴포넌트 C5A(944)(창고 A에 연락함) 및/또는 컴포넌트 C5B(946)(창고 B에 연락함)를 호출할 수 있다. If
컴포넌트들(C2-C5)이 실행된 경우, 실행 경로는 C1(912)로 다시 되돌아 오며, C1(912)은 주문 완료 컴포넌트 C6(916)을 호출하여, 예를 들어 확인 이메일 혹은 웹 페이지에서, 예를 들어 주문 확인 번호 및 추적 번호를 제공함으로써, 사용자에게 구입을 확인시킬 수 있다. 만약 C1A(914)에서 물품이 비축되어 있지 않은 경우, 혹은 C3(924)에서 신용 카드 결재가 성공하지 못한 경우, 실행 경로는 마찬가지로 C1(912)로 되돌아 간다. 한가지 가능한 구현에서, C1 및 C6은 자바 서버 페이지들이고, 그리고 C2-C5는 엔터프라이드 자바빈들이다.When the components C2-C5 are executed, the execution path is returned back to
첫 번째 컴포넌트가 또 다른 컴포넌트의 호출 이후 또 다른 컴포넌트가 실행을 시작한 이후에도 비동기적 복수 쓰레드 혹은 복수 프로세스 모드로 계속 실행될 수 있고, 혹은 호출된 컴포넌트가 실행을 마무리 지을 때까지 동기적 단일 쓰레드 혹은 단일 프로세스 모드로 일시적으로 중지될 수 있음에 유의해야 한다. 예를 들어, C1(912)는 컴포넌트들(C2-C5)이 실행되는 동안 잠시중지될 수 있다. 더욱이, 소정의 컴포넌트는 트랜잭션 동안 한번 이상 호출될 수 있다. 예를 들어, 사용자가 서로 다른 창고에 저장된 복수의 아이템들을 구입하는 경우를 가정할 수 있다. 이러한 경우에, C5(942)는 반복적으로 실행될 수 있고, 각각의 아이템에 대해 서로 다른 창고 및/또는 창고 부서와 콘택하게 된다.The first component may continue to run in asynchronous multiple threads or multiple process mode after another component has called after another component has started execution or until a called component has finished executing, Mode may be temporarily stopped. For example,
도 10은 도 9의 호출 관계에 근거하는 호출 스택 위치 대 시간 그래프를 도시한다. 시간 증분은 반드시 균등하게 이격될 필요는 없다. 이러한 표현, 트랜잭션 트레이스는 하나 이상의 호스트들에 의해 제공되는 실행 경로 정보의 타입의 예이다. 이것은 예를 들어 사용자 인터페이스 상의 보고서로서 제공되는 도식적 표현일 수 있고, 아울러 방법들과 같은 컴포넌트들의 실행 시간의 형태로 성능 데이터를 나타내는 도식적 표현일 수 있다. 실행 경로 정보는 애플리케이션의 어떤 방법들이 호출되었고 이들이 호출되는 시간을 보여준다. 수평 방향은 시간을 나타내고, 반면 수직 방향은 호출 스택 깊이 혹은 위치를 표시한다. 호출 스택은 하나 이상의 프로그램들 혹은 쓰레드들의 실행 동안 요구 혹은 호출되었던 방법들을 보여준다. 실행 경로는 전형적으로 일 초 내지 수 초의 일부분 동안 연장될 수 있다.Figure 10 shows a call stack location versus time graph based on the call relationship of Figure 9; Time increments do not necessarily have to be evenly spaced. This representation, transaction trace, is an example of the type of execution path information provided by one or more hosts. This may be, for example, a graphical representation provided as a report on the user interface, or it may be a graphical representation representing performance data in the form of execution times of components such as methods. The execution path information shows which methods of the application were called and the time at which they were called. Horizontal direction represents time, while vertical direction represents call stack depth or position. The call stack shows how requests were made or invoked during execution of one or more programs or threads. The execution path may typically be extended for a fraction of a second or a few seconds.
예시적 실행 경로는 C1(1012), C1A(1014), C1(1012), C2(1022), C3(1024), C3A(1026), C3(1024), C4(1030), C5(1042), C4(1030), C3(1024), C2(1022), C1(1012), C6(1016) 및 C1(1012)의 시퀀스를 포함한다. 호스트는 클라이언트로부터 요청을 수신하고 C1이 t1에서 실행을 시작하는 때를 기록한다. 시퀀스에서의 각각의 전이는 계측에 근거하여 에이전트에 의해 기록된다. C1은 t2에서 C1A를 호출한다. C1A이 t4에서 실행을 종료한다. C1이 t5에서 C2를 호출한다. C2가 t6에서 C3을 호출한다. C3이 t7에서 C3A를 호출한다. C3A가 t9에서 실행을 종료한다. C3이 t10에서 C4를 호출한다. C4가 t11에서 C5를 호출한다. C5가 t16에서 실행을 종료한다. C4가 t17에서 실행을 종료한다. t18에서 C3이 실행을 종료한다. C2가 t19에서 실행을 종료한다. C1가 t20에서 C6을 호출한다. C6이 t24에서 실행을 종료한다. 호스트가 클라이언트에 응답을 제공하고, 이 시간에 C1이 t25에서 실행을 종료한다. 호스트는 중앙 관리자에게 시간 및 트랜잭션 데이터를 주기적으로 보고한다.The exemplary execution path includes C1 1012, C1A 1014, C1 1012, C2 1022, C3 1024,
도 11은 자바(JAVA) 런타임 환경을 도시한다. 자바 런타임 환경(1100)이 운영 체계(1120) 상에 확립되고, 운영 체계(1120)는 하드웨어(1130) 상에 확립된다. 자바 런타임 환경은, 자바 API 클래스(1102) 및 JVM(1104)를 포함하는 다수의 가상 부분들을 포함한다. JVM은 레지스터들(1106), 오퍼랜드 스택(operand stack )(1108), 힙(haep)(1110) 및 방법 영역(1112)을 포함한다. JVM은 명령들의 시퀀스로서 바이트 코드들의 스트림을 처리한다. JVM 명령은 수행될 연산을 특정하는 오피코드(opcode) 및 그 뒤를 따르는 제로(0) 개 혹은 수 개의 오퍼랜드들(피연산 값들을 포함함)로 구성된다. 오퍼랜드 스택(1108), 힙(1110) 및 방법 영역(1112)은 어드레싱가능한 메모리 내에 있다. 어드레스의 크기는 32비트이고, 각각의 메모리 위치는 일 바이트를 포함하고, 그리고 각각의 레지스터는 하나의 32비트 어드레스를 저장한다. 방법 영역은 바이트 코드들을 포함하고, 그리고 바이트 경계들 상에 정렬되고, 오퍼랜드 스택은 및 힙은 워드(32비트) 경계들 상에 정렬된다.11 shows a Java runtime environment. Java runtime environment 1100 is established on operating system 1120 and operating system 1120 is established on hardware 1130. The Java runtime environment includes a plurality of virtual parts, including a
레지스터들은 프로그램 카운터(program counter, pc)를 포함하는바, 이것은 메모리에서 명령들을 실행해야하는 곳을 추적한다. 프로그램 카운터는 실행될 그 다음 바이트 코드를 식별한다. 프레임 레지스터는 오퍼랜드 스택에서 현재 방법의 실행 환경에 대한 포인터를 포함한다. 오퍼랜드 탑(operand top)(optop) 레지스터는 오퍼랜드 스택의 탑에 대한 포인터를 포함하고, 그리고 산술 표현들의 값을 구하는데 사용된다. 변수(variable)(vars) 레지스터는 로컬 변수들에 대한 포인터를 포함한다.The registers include a program counter (pc), which tracks where instructions should be executed in memory. The program counter identifies the next bytecode to be executed. The frame register contains a pointer to the execution environment of the current method in the operand stack. The operand top (optop) register contains a pointer to the top of the operand stack and is used to obtain the value of the arithmetic expressions. Variable (vars) The register contains pointers to local variables.
오퍼랜드 스택은 방법들 및 연산들에 파라미터들을 제공하고 그리고 이들로부터 다시 결과를 수신한다. 모든 바이트 코드 명령들은 스택으로부터 오퍼랜드들을 가져오고, 이들에 관한 연산을 수행하고, 그리고 결과를 스택에 반환한다. 오퍼랜드 스택은 실행 방법의 스택 프레임을 포함한다. 스택 프레임은, 방법의 특정 호출에 대해, 상태(예를 들어, 로컬 변수들)와, 그리고 계산의 중간 결과를 보유한다. 구체적으로, 각각의 JVM 쓰레드는, 쓰레드와 동시에 생성된, 프라이빗 JVM 스택(private JVM stack)을 갖는다. JVM 스택은 프레임들을 저장하고, 로컬 변수들 및 부분적 결과들을 보유하고, 그리고 방법 호출 및 반환에서 일부를 재연한다. 따라서, 프레임은 데이터 및 부분적 결과를 저장하는데 사용될 뿐만 아니라 동적 링크를 수행하기 위해, 방법들에 대한 값들을 반환하기 위해, 그리고 예외들을 디스패치하기 위해 사용된다. 새로운 프레임은 방법이 호출될 때마다 생성된다. 프레임은 그 방법 호출이 완료될 때, 그 완료가 정상적인지 아니면 갑작스러운 것인지에 상관없이, 파괴된다(이것은 미처리 예외(uncaught exception)를 쓰로우(throw)함). 프레임들은, 프레임을 생성하는 쓰레드의 JVM 스택으로부터 할당된다. 각각의 프레임은, 자기 자신의 로컬 변수들의 어레이, 자기 자신의 오퍼랜드 스택, 및 현재 방법의 클래스의 런타임 상수 풀(runtime constant pool)에 대한 레퍼런스(reference)를 갖는다.The operand stack provides parameters to methods and operations and receives results back from them. All bytecode instructions fetch operands from the stack, perform operations on them, and return the results to the stack. The operand stack contains a stack frame of execution methods. The stack frame holds state (e.g., local variables), and intermediate results of the computation, for a particular call of the method. Specifically, each JVM thread has a private JVM stack that is created concurrently with the thread. The JVM stack stores frames, holds local variables and partial results, and rewrites parts of method calls and returns. Thus, frames are used not only to store data and partial results, but also to perform dynamic linking, returning values for methods, and dispatching exceptions. A new frame is created each time a method is called. A frame is destroyed when the method call is completed, whether its completion is normal or abrupt (it throws an uncaught exception). The frames are allocated from the JVM stack of the thread generating the frame. Each frame has a reference to a runtime constant pool of its own array of local variables, its own operand stack, and the class of the current method.
힙 혹은 메모리 할당 풀은 가비지 수집(garbage collect)된다. 힙은 런타임 데이터 영역이고, 이로부터 모든 클래스 인스턴스들 및 어레이들에 대한 메모리가 할당된다. 힙은 가상 머신 시동시 생성되고, 그리고 오브젝트들을 위한 힙 저장은 가비지 수집기로서 알려진 자동 저장 관리 시스템에 의해 회수된다. 구체적으로, 자바 런타임 환경에서 실행되는 각각의 프로그램은 자신에게 할당된 가비지-수집된 힙을 갖는다. 더욱이, 힙에서의 각각의 클래스는 자신과 관련된 상수 풀을 갖는다. 상수들은 변하지 않기 때문에, 상수들은 대게 컴파일 시간(compile time)에 생성된다. 상수 풀에서의 아이템들은 특정 클래스에서의 임의의 방법에 의해 사용되는 모든 명칭들을 인코딩한다. 클래스는, 얼마나 많은 상수들이 존재하는지의 카운트와, 그리고 상수들의 특정 리스팅(listing)이 클래스 기술(class description) 내에서 시작하는 곳을 특정하는 오프셋(offset)을 포함한다.The heap or memory allocation pool is garbage collected. The heap is a runtime data region from which memory is allocated for all class instances and arrays. The heap is created at the start of the virtual machine, and heap storage for objects is retrieved by an automatic storage management system known as a garbage collector. Specifically, each program running in the Java runtime environment has a garbage-collected heap allocated to it. Moreover, each class in the heap has a constant pool associated with it. Because constants do not change, constants are usually created at compile time. Items in the constant pool encode all names used by any method in a particular class. The class includes a count of how many constants are present and an offset that specifies where a particular listing of constants starts within the class description.
방법 영역은, 컴파일된 코드에서 방법들과 관련된 바이트 코드 명령들과, 그리고 실행 환경이 동적 링크를 위해 필요한 심볼 테이블을 저장한다. 방법과 관련될 필요가 있을 수 있는 임의의 디버깅 혹은 추가적 정보가 또한 이러한 영역에 저장된다. 프로그램 카운터는 언제나 방법 영역에서의 일부 바이트를 가리킨다(예를 들어, 그 어드레스를 포함함). 프로그램 카운터는 실행의 쓰레드를 추적하기 위해 사용된다. 바이트 코드 명령이 실행된 이후, 프로그램 카운터는 실행할 그 다음 명령의 어드레스를 포함한다.The method area stores the bytecode instructions associated with the methods in the compiled code, and the symbol table that the execution environment needs for dynamic linking. Any debugging or additional information that may need to be associated with the method is also stored in this area. The program counter always points to some bytes in the method area (e.g., including that address). The program counter is used to track the thread of execution. After the bytecode instruction is executed, the program counter contains the address of the next instruction to execute.
방법 영역은 모든 JVM 쓰레드들 간에 공유되고, 그리고 클래스에 관한 구조, 예를 들어, 런타임 상수 풀, 필드 및 방법 데이터, 그리고 방법 및 생성자에 대한 코드를 저장하는바, 여기에는 클래스 및 인스턴스 초기화 및 인터페이스 타입 초기화에서 사용되는 특수 방법이 포함된다. 방법 영역은 가상 머신 시동시 생성된다. 런타임 상수 풀은, 클래스 파일에서의 상수 풀 테이블의 클래스에 관한 혹은 인터페이스에 관한 런타임 표현이다. 이것은, 컴파일 시간에 알려진 뉴메릭 리테랄(numeric literals)로부터 런 타임에서 분석돼야만 하는 방법 및 필드 레퍼런스에 이르는 범위에 걸쳐 몇 가지 상수들을 포함한다. 각각의 런타임 상수 풀은 JVM의 방법 영역으로부터 할당된다. 클래스 혹은 인터페이스에 대한 런타임 상수 풀은, 클래스 혹은 인터페이스가 JVM에 의해 생성될 때, 생성된다.The method area is shared among all JVM threads and stores structure for the class, for example, runtime constant pools, field and method data, and code for methods and constructors, including class and instance initialization and interface Includes special methods used in type initialization. The method area is created at the start of the virtual machine. A runtime constant pool is a runtime representation of a class or interface about a constant pool table in a class file. This includes some constants ranging from numeric literals known at compile time to methods that must be analyzed at runtime and field references. Each runtime constant pool is allocated from the method area of the JVM. A runtime constant pool for a class or interface is created when a class or interface is created by the JVM.
도 12a는 정적 계측을 위한 자바-기반의 예시적 프로세스 흐름을 도시한다. 프로세스는, 한가지 가능한 방법에서, 도 1에 도시된 바와 같은, 에이전트(1200)에 의해 구현될 수 있다. 계측을 위한 한 가지 방법은, 어떤 컴포넌트(예를 들어, 방법과 같은 것)가 계측돼야하는지를 결정하는 정적 규칙을 제공하는 것을 포함한다. 규칙은 컴포넌트들이 애플리케이션에 로딩될 때 액세스된다. 이러한 방법에서, 클래스 로더(class loader)(1220)는 애플리케이션 바이트 코드의 순수 데이터 바이트들을 변환기(transformer)(1215)에 제공하는데 사용되는바, 여기서 변환기(1215)는 예를 들어, 순수 바이트들을 클래스로 변환한다. 예를 들어, 자바에서, 이것은, 클래스들을 로딩하는 것에 대해 책임을 지고 있는, ClassLoader 오브젝트의 방법 defineClass를 사용하는 것을 포함할 수 있다. 클래스 ClassLoader는 추상 클래스(abstract class)이다. 클래스의 명칭이 주어지면, 클래스 로더는 클래스에 대한 정의를 구성하는 데이터의 위치를 찾아내려 하거나 혹은 이 데이터를 발생시키려고 한다. 전형적인 방식은, 명칭을 파일 명칭으로 변환하는 것, 그 다음에 파일 시스템으로부터 그 명칭의 "클래스 파일"을 판독하는 것이다. 방법 defineClass는 바이트들의 어레이를 클래스 Calss의 인스턴스로 변환시킨다. 클래스 Class의 인스턴스들은, 실행되는 자바 애플리케이션에서 클래스들 및 인터페이스들을 나타낸다. 따라서 변환기(1215)는, 계측을 부가하기 위해, 예를 들어, 클래스들을 변환시킴으로써, 바이트 코드를 변환시킬 수 있는 소프트웨어다. 한가지 방법에서, 변환기(1215)의 프로세싱의 최소 단위는 클래스 파일 및 바이트 어레이다.Figure 12A illustrates an exemplary Java-based process flow for static metering. The process may be implemented by the agent 1200, as shown in Figure 1, in one possible way. One method for metrology involves providing static rules that determine which components (e.g., methods, etc.) should be measured. Rules are accessed when components are loaded into an application. In this way, a
만약 애플리케이션 바이트 코드가 결정 블록(1210)에서 규칙들(지시어들)과 정합하는 경우, 변환기(1215)는 트레이서 바이트 코드의 형태로 프로브들을 부가한다. 만약 애플리케이션 바이트 코드가 결정 블록(1210)에서 규칙들(1205)과 정합하지 않는 경우, 변환기(1215)는 바이트 코드에 계측을 부가하지 않는다. 변환기(1215) 및 결정 블록(1210)은 프로브 빌더(probe builder)(1225)의 일부인 것으로서 고려될 수 있다.If the application bytecode matches the rules (directives) in
본 실시예에서, 규칙들(1205)은 계측돼야하는 피관리 애플리케이션의 부분들을 식별하는 전형적인 정적 규칙들의 세트이다. 규칙들은 일반적으로, 클래스가 처음 가상 머신에서 정의되는 경우 구현된다. 클래스는 단지 한번 정의되지만 여러번 로딩될 수 있다. 예를 들어, 동일한 클래스를 로딩하는 복수의 클래스 로더들이 있을 수 있다. 더욱이, 클래스들과 같은 컴포넌트들은, 이들에게 어떤 방식으로 명칭이 부여되는지 여부, 이들이 어떤 인터페이스를 구현하는지 여부, 이들이 어떤 서브클래스 혹은 수퍼 클래스를 연장시키는지 여부 등에 근거하여 구현될 수 있다. 이러한 컴포넌트들은 선택되어 구현될 수 있는데, 왜냐하면 이들이 유용한 혹은 그렇지 않다면 흥미 있는 성능 데이터를 제공할 수 있을 것으로 고려되기 때문이다.In this embodiment,
예를 들어, 규칙이 모든 서블릿들은 계측돼야 함을 표시할 수 있는데, 왜냐하면 서블릿들 중 적어도 일부가 재미있는 데이터를 제공할 수 있을 것으로 고려되기 때문이다. 이러한 경우에, 규칙들(1205)은 자바 클래스 HttpServlet 의 서브클래스들인 모든 컴포넌트들이 계측돼야 함을 표시할 수 있다. HttpServlet는 모든 서블릿들이 의존하는 추상 클래스이다. 그러나, 모든 컴포넌트들이 계측될 수 있는 것은 아니며, 과다 포함 계측(over-inclusive instrumentation)은 과도한 간접비용을 발생시키고, 가능하게는 애플리케이션의 연산에 손상을 주며, 반면 부족 포함 계측(under-inclusive instrumentation)은 중요한 성능 데이터를 누락시킨다는 점에서, 텐션(tension)이 존재한다.For example, a rule could indicate that all servlets should be instrumented, because at least some of the servlets are considered to be able to provide interesting data. In this case, rules 1205 may indicate that all components that are subclasses of the Java class HttpServlet should be instrumented. HttpServlet is an abstract class that all servlets depend on. However, not all components can be instrumented, and over-inclusive instrumentation can cause undue overhead and possibly compromise the operation of the application while under-inclusive instrumentation, There is a tension in that it misses important performance data.
도 12b는 정적 계측을 위한 .NET-기반의 예시적 프로세스 흐름을 도시한다. 또 다른 가능한 방법에서, 마이크로소프트사(MICROSOFT CORP.)의 ".NET" 프레임워크(Framework)에 따른, 피관리 애플리케이션의 컴포넌트들이 제공된다. 자바와 달리, .NET 프레임워크는 클래스 로더들을 사용하지 않는다. 대신에, .NET는 프레임워크에 대해 특정적으로 기입된 프로그램들의 실행을 관리하는 가상 머신(virtual machine)을 포함한다. .NET 프레임워크의 런타임 환경은 공통 언어 런타임(Common Language Runtime, CLR)으로서 알려져 있다. CLR은 애플리케이션 가상 머신의 외관을 제공하고, 이에 따라 프로그래머들은 프로그램을 실행시키는 특정 CPU의 능력을고려할 필요가 없게 된다. CLR은 또한, 보안, 메모리 관리, 및 예외 핸들링과 같은 다른 서비스들을 제공한다. 사전 코딩된 솔루션의 클래스 라이브러리 및 CLR은 함께 .NET 프레임워크를 구성한다.Figure 12B illustrates an exemplary .NET-based process flow for static metering. In another possible approach, components of the managed application are provided in accordance with the ".NET" framework of MICROSOFT CORP. Unlike Java, the .NET framework does not use class loaders. Instead, .NET includes a virtual machine that manages the execution of programs written specifically for the framework. The runtime environment of the .NET Framework is known as the Common Language Runtime (CLR). The CLR provides the appearance of an application virtual machine, so that programmers do not have to consider the capabilities of a particular CPU to run the program. The CLR also provides other services such as security, memory management, and exception handling. The class libraries and CLR of the pre-coded solution together make up the .NET framework.
더욱이, CLR은 공통 언어 인프라스트럭쳐(Common Language Infrastructure, CLI)의 구현인바, 이는 예외 핸들링, 가바지 수집, 보안, 및 상호운영성(interoperability)을 포함하는, 애플리케이션 개발 및 실행을 위한 언어 중립적 플랫폼(language-neutral platform)을 제공한다. CLI는 코어 클래스 라이브러리들, 공통 타입 시스템(Common Type System) 및 공통 중간 언어(Common Intermediate Language, CIL)를 포함한다. 자바 바이트 코드와 마찬가지로, CIL은 중간 바이트 코드의 또 다른 예이다. 자바 및 .NET은 단지 예시적 구현들만을 제공하는 것인데, 왜냐하면 다른 구현들도 가능하기 때문이다.Moreover, the CLR is an implementation of the Common Language Infrastructure (CLI), a language-neutral platform for application development and execution, including exception handling, garbage collection, security, and interoperability language-neutral platform. The CLI includes core class libraries, a Common Type System, and a Common Intermediate Language (CIL). Like Java bytecode, CIL is another example of intermediate byte code. Java and .NET provide only exemplary implementations, because other implementations are possible.
여기서, 프로세스는 가능한 일 방법에서 에이전트(1250)에 의해 구현될 수 있다. 한가지 가능한 시나리오에서, .NET 프레임워크에서의 일부 프로세스들은 클래스를 명칭에 의해 레퍼런스하고, 그리고 CLR(1270)은 클래스를 찾고, 이것을 변환기(1215)(만약 있다면)에 보여 주고, 그리고 결과적인 CIL을 사용한다. 특히, 만약 클래스가 결정 블록(1260)에서 규칙들(1255)과 정합한다면, 계측이 부가된다. 만약 클래스가 결정 블록(1260)에서 규칙들(1255)과 정합하지 않는다면, 계측이 부가되지 않는다. 변환기(1265) 및 결정 블록(1260)은 프로브 빌더(1275)의 일부인 것으로서 고려될 수 있다.Here, the process may be implemented by the agent 1250 in a possible way. In one possible scenario, some processes in the .NET framework refer to the class by name, and the
도 13은 소프트웨어를 계측하는 예시적 프로세스 흐름을 도시한다. 도 5a와 연계하여, 컴포넌트들의 정적 리스트(1310)가 클래스 로더(1302)에 제공될 수 있고, 클래스 로더(1302)는 계측된 바이트 코드를 제공하는 변환기/프로브 빌더(1300)에 의해 사용되도록 바이트 코드를 로딩한다. 예를 들어, 방법 defineClass는 바이트들의 어레이를 클래스 Class의 인스턴스로 변환한다. 더욱이, 일시적으로 계측돼야하는 방법 혹은 클래스와 같은 컴포넌트들의 동적 리스트(1306)가 계측될 수 있다. 한 가지 방법에서, 도 14에 도시된 바와 같이, 사용자 인터페이스(1308)는 사용자가 일시적으로 계측될 컴포넌트들을 지정할 수 있게 한다. 사용자는 또한 정적 리스트(1310)를 수정할 수 있다. 사용자 인터페이스는 성능 모니터(1312)(이것은 피관리 애플리케이션에서의 기존 계측으로부터 입력되는 성능 데이터를 모니터링함)에 응답할 수 있고, 그리고 예를 들어, 일부 컴포넌트들이 트랜잭션에서 문제(예를 들어, 실행에 너무 많은 시간이 걸리는 것과 같은 것)를 일으키고 있다는 사실을 식별할 수 있다. 성능 데이터는 하위 임계치 및 상위 임계치와 비교되어, 범위를 벗어났는지 여부가 결정될 수 있다.Figure 13 shows an exemplary process flow for measuring software. 5A, a static list 1310 of components may be provided to the
컴포넌트들의 동적 리스트(1306)는 계측돼야만 하는 클래스들의 동적으로 업데이트가능한 리스트를 포함할 수 있다. 이러한 리스트는 시간에 따라 변할 수 있고, 이에 따라 특정 방법들이 진단이 수행되는 제한된 시간 기간 동안 계측되게 된다. 사용자 인터페이스(1308)는 시간 기간을 특정할 수 있거나 혹은 디폴트 시간 기간이 사용될 수 있다. 따라서, 컴포넌트들은 다시 정의될 수 있고, 이에 따라, 예를 들어, 일 시점에서 일시적 계측을 갖지 않는 것으로부터 또 다른 일 시점에서 일시적 계측을 갖는 것으로 전이가 일어난다. 서로 다른 타입 혹은 레벨의 일시적 계측을 제공하는 것이 또한 가능하다. 따라서, 컴포넌트들을 다시 정의하는 것은 서로 다른 타입의 일시적 계측으로의 전이를 포함할 수 있다.A dynamic list of components 1306 may include a dynamically updatable list of classes that should be measured. Such a list may change over time, so that certain methods are measured for a limited time period during which the diagnosis is performed. The user interface 1308 may specify a time period or a default time period may be used. Thus, the components can be redefined, and thus a transition occurs, for example, from having no transient metrology at one point to having transient metrology at another point in time. It is also possible to provide temporary measurements of different types or levels. Thus, redefining components may include transitioning to different types of transient metrology.
계측은 많은 타입의 성능 메트릭(metrics)/데이터를 생성할 수 있는바, 여기에는 컴포넌트의 평균 실행 혹은 응답 시간, 초당 혹은 간격당 호출율, 호출의 카운트, 간격당 시작은 하지만 끝나지는 않는 호출들의 수를 표시하는 동시성 메트릭(concurrency metric), 그리고 간격당 특정 임계치를 초과하는 방법 호출 횟수로 시작하는 호출들의 수를 표시하는 정지 메트릭(stalled metric)이 포함된다. 더욱이, 데이터는 가비지 수집 힙 크기, 파일 및 소켓 활성화를 표시하는 대역폭 메트릭, 쓰레드들의 수, 시스템 로그들, 예외, 메모리 누설, 그리고 컴포넌트 상호작용을 식별할 수 있다. 데이터는 또한, 계측된 컴포넌트에 의해 어떤 컴포넌트들이 호출되었는지 또는 계측된 컴포넌트를 어떤 컴포넌트가 호출했는지를 식별할 수 있다. 예를 들어, 제어기 아키텍처에서, 어떤 컴포넌트들이 그 다음에 실행되는지에 관한 제어권을 가지며, 그리고 이들이 얼마나 자주 실행하는지 및 이들이 어떻게 수행하는지를 알고 있는 제어기 컴포넌트를 통해 제어가 흘러들어간다. 제어기 컴포넌트들은 계측을 통해 보고를 할 수 있고, 여기서 계측되지 않은 컴포넌트들은 빈번하게 호출되고, 따라서 대게는 관심의 대상이 되어 계측의 부가를 위해 다시 정의돼야 한다.Metrics can generate many types of performance metrics / data, including average execution or response time of components, call rate per second or interval, count of calls, beginning of interval, A concurrency metric that represents the number of calls per second, and a stalled metric that represents the number of calls that start with the number of calls that exceed a certain threshold per interval. Moreover, the data can identify the garbage collection heap size, the bandwidth metric that indicates file and socket activation, the number of threads, system logs, exceptions, memory leaks, and component interactions. The data may also identify which components were called by the instrumented component or which component called the instrumented component. For example, in a controller architecture, control flows through a controller component that has control over which components are to be executed next, and which knows how often they run and how they perform. Controller components can report via instrumentation, where unmeasured components are frequently called, and are therefore usually of interest and redefined for the purpose of instrumentation.
컴포넌트들의 동적 리스트(1306), 사용자 인터페이스(1308), 컴포넌트들의 정적 리스트(1310) 및 성능 모니터(1312)가 동일한 위치에 혹은 서로 다른 위치에 제공될 수 있음에 유의해야 한다. 예를 들어, 사용자 인터페이스(1308)가 사용자 인터페이스 컴퓨팅 디바이스에서 제공될 수 있고, 컴포넌트들의 동적 리스트(1306) 및 컴포넌트들의 정적 리스트(1310)가 애플리케이션 서버의 에이전트에 제공될 수 있고, 그리고 성능 모니터(1312)가, 하나 이상의 애플리케이션 서버들에서 하나 이상의 에이전트들로부터 성능 데이터를 수신하는, 관리자 컴퓨팅과 관련될 수 있다.It should be noted that a dynamic list of components 1306, a user interface 1308, a static list of components 1310, and a
성능 모니터(1312)는, 어떤 컴포넌트들이 문제 트랜잭션에 포함되는지에 관한 아이디어를 제공하고, 그리고 이러한 컴포넌트들이 문제를 일으킬 수 있는지 혹은 일으키고 있는지 여부를 결정할 수 있고, 그리고 이러한 정보를 사용자 인터페이스(1308) 상에 식별할 수 있다.The performance monitor 1312 may provide an idea as to what components are involved in the problematic transaction and may determine whether these components are causing or causing the problem and may provide such information to the user interface 1308 . ≪ / RTI >
사용자 인터페이스(1308)는 사용자로 하여금 예를 들어, 어떤 컴포넌트들이 일시적으로 계측돼야하는 지를 수동으로 선택할 수 있게 한다.The user interface 1308 allows the user to manually select, for example, which components are to be temporarily measured.
컴포넌트들의 정적 리스트(1310)는 애플리케이션이 실행되기 시작할 계측돼야하는 클래스들 혹은 다른 컴포넌트들을 포함할 수 있다. 이것은 중요한 데이터를 산출할 것으로 예측되는 컴포넌트들의 베이스라인 리스트일 수 있다.A static list of components 1310 may include classes or other components that should be monitored for an application to begin executing. This may be a baseline list of components expected to yield important data.
컴포넌트가 런타임에서 애플리케이션에 이미 통합되었는지 여부에 따라, 컴포넌트는 서로 다른 방식으로 다시 정의될 수 있다. 만약 컴포넌트가 애플리케이션에 이미 통합된 것이 아니라면, 가능한 일 구현에서, 컴포넌트는, 클래스 로더(1302)에 의해 예를 들어 JVM에 로딩됨으로써 정상적으로 통합될 수 있다. .NET 프레임워크을 사용하는 것과 같은 다른 구현에서, 클래스 로더는 사용되지 않는다.Depending on whether the component is already integrated into the application at runtime, the component can be redefined in a different way. If the component is not already integrated into the application, in a possible implementation, the component can be normally integrated by being loaded into the JVM, for example, by the
컴포넌트가 로딩될 때, 변환기/프로브 빌더(1300)는, 지시받은 경우, 예를 들어, 사용자 인터페이스(1308), 컴포넌트들의 동적 리스트(1306), 컴포넌트들의 정적 리스트(1310) 및 성능 모니터(1312)에 응답하여, 컴포넌트를 계측한다. 애플리케이션에 이미 통합되었지만 계측되지는 않은 컴포넌트는, 계측과 함께 애플리케이션에 다시 통합될 수 있다. 예를 들어, 컴포넌트는 애플리케이션으로부터 제거될 수 있고 그리고 가상 머신을 다시 개시시킴 없이 런타임 동안 다시 로딩될 수 있다. 이러한 목적을 달성하기 위해, 자바 redefineClass 커맨드가 컴포넌트를 갖는 클래스 로더(1302)에 제공된다. 자바 개발 키드(JAVA DEVELOPMENT KIT, JDK) 버전 1.5 혹은 그 이상은 이러한 커맨드를 사용하는 재정의 능력을 갖는다. 이러한 커맨드는 공급된 클래스 파일들을 사용하여 클래스들의 공급된 세트를 다시 정의한다. 이것은 동시에 하나 이상의 클래스로의 연동된 변경을 가능하게 하기 위해 세트에 관해 동작한다. 더욱이, 만약 재정의된 방법이 활성화된 스택 프레임들을 갖는다면, 이러한 활성화된 프레임들은 본래 방법의 바이트 코드들을 계속 실행시키고, 그리고 재정의된 방법은 새로운 호출시 사용될 수 있다.When the component is loaded, the translator /
클래스와 같은 컴포넌트를 다시 정의하는 것은 단지 해당 클래스에 대해서라는 것만 제외하고 가상 머신을 다시 개시시키는 것과 유사하다. 클래스가 다시 정의되는 경우, 만약 클래스가 이미 기존의 방법 스택에 있다면, 클래스는 거기서 머무른다. 그러나, 매 새로운 방법 호출에 대해서, 새로운 클래스가 사용된다. 즉, 재정의되는 경우, 새로운 버전이 선택된다.Redefining a component such as a class is similar to restarting a virtual machine, except that it is only for that class. If the class is redefined, the class stays there if the class is already in the old method stack. However, for every new method call, a new class is used. That is, if redefined, a new version is selected.
변환기/프로브 빌더(1300)가, 다시 정의된 컴포넌트를 수신하는 경우, 그 컴포넌트를 계측한다(만약 그렇게 하도록 지시받았다면). 변환기/프로브 빌더(1300)는 또한, 컴포넌트에 특정 타임의 계측을 부가할 수 있다.If the transducer /
컴포넌트가 일시적으로 계측되었고, 애플리케이션에 다시 통합되었으며, 그리고 계측이 이제 더 이상 진단을 위해 필요하지 않게 된 이후에, 컴포넌트는 애플리케이션에 다시 재통합될 수 있지만, 일시적 계측은 갖지 않는다. 계측의 제거는 사용자 커맨드, 특정 진단 기간 혹은 다른 어떤 다른 이벤트 이후의 타임 아웃에 근거를 둘 수 있다. 예를 들어, 성능 모니터(1312)는 컴포넌트의 성능 데이터가 일정 시간 기간에 대해 혹은 컴포넌트의 호출의 수에 대해, 수용가능한지를 결정할 수 있다. 즉, 성능 모니터(1312)는 계측된 방법들 중 적어도 하나의 방법의 성능 데이터가 이제 더 이상 임계 성능 레벨을 충족시키는데 실패하지 않는지를 결정할 수 있다. 응답으로서, 성능 모니터(1312)는 계측을 제거하기 위해 redefineClass와 같은 커맨드를 발행할 수 있다.After the component has been temporarily instrumented, reintegrated into the application, and the instrument is no longer needed for diagnosis, the component can be reintegrated back into the application, but has no transient measurement. Removal of the instrumentation can be based on a user command, a timeout after a particular diagnostic period or some other event. For example, the
계측의 부가 및 제거가 런타임에서 동적으로 수행될 수 있고, 이에 따라 바이트 코드가 실행되는 가상 머신의 레벨이 낮추어질 필요가 없으며, 그리고 계측된 컴포넌트들로부터의 데이터가 즉각적으로 액세스될 수 있다(계측의 부가의 경우에).The addition and removal of instrumentation can be performed dynamically at runtime so that the level of the virtual machine on which the bytecode is executed need not be lowered and the data from the instrumented components can be accessed immediately In the case of the addition of.
도 14는 컴포넌트들 및 대응하는 성능 데이터 간의 계층적 관계를 나타내는 사용자 인터페이스 디스플레이를 도시한다. 사용자 인터페이스(1400)는 하나 이상의 계측된 컴포넌트들의 명칭을 식별하는 디스플레이 영역(1404)을 포함한다. 사용자는 디스플레이 영역(1404)에서 하나 이상의 컴포넌트들을 선택하여, 계측에 근거를 둔 그 컴포넌트에 대한 성능 데이터(예를 들어, 트레이스)를 디스플레이 영역(1406)에 디스플레이할 수 있다.Figure 14 shows a user interface display showing hierarchical relationships between components and corresponding performance data. The
사용자가 일시적으로 계측돼야하는 클래스들/방법들 또는 다른 컴포넌트들을 특정할 수 있도록, 체크박스 혹은 다른 인터페이스 메커니즘이 제공될 수 있다. 사용자는, 예를 들어 문제해결을 경험하기 전에 어떤 컴포넌트들이 에러에 관련되어 있는지 혹은 자체적으로 에러를 발생시키고 있는지 및 다른 요인들의 관측에 근거하여 일정 컴포넌트들에 일시적으로 계측이 부가돼야만 함을 지시할 수 있다.A check box or other interface mechanism may be provided to allow the user to specify classes / methods or other components that need to be temporarily measured. The user may be instructed to temporarily add instrumentation to certain components based on observations of other components, for example, before experiencing problem solving, which components are related to the error or are generating errors in themselves .
디스플레이 영역(1404)은 트리와 같은 계층적 구조를 사용하여 애플리케이션에서의 컴포넌트들 각각으로 자동으로 채워질 수 있다(여기서 트리는 어떤 컴포넌트가 또 다른 컴포넌트 아래에 있는지 혹은 또 다른 컴포넌트에 의해 호출되는지를 보여줌). 디스플레이 영역(1406)은, 영역(1404)에서의 컴포넌트들 중 선택된 것들에 대해, 계측에 근거를 둔 계측된 컴포넌트들의 트랜잭션 트레이스와 같은 성능 데이터를 도시한다. 예를 들어, 컴포넌트 명칭 아래에 밑줄에 의해 표시된 바와 같이, 컴포넌트들(C1, C5 및 C5A)이 현재 사용자에 의해 선택되었고, 트랜잭션 트레이스와 같은 대응하는 성능 데이터가 영역(1406) 내에 곡선(1410, 1412 및 1414)에 의해 제공된다. 영역(1406)은 에이전트로부터 관리자로 제공되는 성능 데이터로 채워질 수 있다.The
본 발명의 앞서의 상세한 설명은 예시 및 설명 목적으로 제공되었다. 이러한 것이 본 발명의 모두를 설명하도록 의도되지 않았으며 혹은 본 발명이 이렇게 개시되는 특정 형태로만 한정되도록 의도되지도 않았다. 많은 수정 및 변형이 앞서의 가르침을 고려하는 경우 가능하다. 본 명세서에서 설명되는 실시예들은 본 발명의 원리 및 그 실제 응용을 가장 잘 설명하기 위해 선택되었는 바, 이로 인해 본 발명의 기술 분야에서 숙련된 기술을 가진 다른 사람들이 다양한 실시예로 그리고 고려하는 특정 용도에 적합하도록 다양하게 수정하여 본 발명을 가장 잘 사용할 수 있도록 하기 위한 것이다. 본 발명의 범위는 본 명세서에 첨부되는 특허청구범위에 의해 정의되도록 의도되었다.The foregoing detailed description of the invention has been presented for purposes of illustration and description. It is not intended to be exhaustive of the present invention or to limit the invention to the specific forms disclosed herein. Many modifications and variations are possible in light of the foregoing teachings. The embodiments described herein have been chosen to best explain the principles of the invention and its practical application so that others skilled in the art will readily appreciate that various embodiments are possible, And various modifications may be made to those skilled in the art to enable the best use of the present invention. The scope of the invention is intended to be defined by the claims appended hereto.
Claims (20)
Translated fromKorean애플리케이션 서버에서, 상기 애플리케이션 서버의 소켓과 컴퓨팅 디바이스의 소켓 사이의 지속적인 연결(persistent connection)을 확립하는 단계와;
상기 애플리케이션 서버에서 애플리케이션에 일시적인 동적 계측(temporary dynamic instrumentation)을 부가하도록 하는 요청을 상기 애플리케이션 서버에서 수신하는 단계 - 상기 요청은 각각의 연결을 통해 컴퓨팅 디바이스로부터 수신됨 - 와;
상기 일시적인 동적 계측을 부가하도록 하는 요청과 함께, 상기 컴퓨팅 디바이스로의 콜백(callback)을 확립하도록 하는 요청을 수신하는 단계와;
상기 일시적인 동적 계측을 부가하도록 하는 요청에 응답하여, 상기 애플리케이션의 런타임(runtime) 동안 상기 일시적인 동적 계측을 상기 애플리케이션에 부가하는 단계와;
상기 콜백을 확립하도록 하는 요청에 응답하여, 상기 지속적인 연결이 예기치 못하게 유실되었는지를 결정하기 위해 상기 애플리케이션 서버의 소켓을 모니터링하는 단계 - 상기 모니터링하는 단계는 상기 애플리케이션 서버에서 코드에 의해 수행됨 - 와; 그리고
상기 콜백이, 상기 지속적인 연결이 예기치 못하게 유실됨을 결정하는 경우, 상기 일시적인 동적 계측을 포함하지 않은 상태로 상기 애플리케이션을 복원시키는 단계를 포함하고, 상기 콜백은, 상기 어플리케이션 서버의 소켓이 상기 지속적인 연결이 예기치 못하게 유실됨을 나타내는 이벤트를 생성함을 결정함으로써 상기 지속적인 연결이 예기치 못하게 유실됨을 결정하는 것을 특징으로 하는 컴퓨터로 구현되는 방법.A computer-implemented method,
In an application server, establishing a persistent connection between a socket of the application server and a socket of a computing device;
Receiving at the application server a request to add temporary dynamic instrumentation to an application at the application server, the request being received from a computing device via a respective connection;
Receiving a request to establish a callback to the computing device with a request to add the temporal dynamic metering;
Adding the transient dynamic metric to the application during a runtime of the application in response to a request to add the transient dynamic metric;
Monitoring a socket of the application server to determine if the persistent connection has been unexpectedly lost, in response to a request to establish the callback, the monitoring being performed by code at the application server; And
And if the callback determines that the persistent connection is unexpectedly lost, restoring the application to a state that does not include the temporal dynamic metering, Determining that the persistent connection is unexpectedly lost by determining to generate an event indicating unexpected loss. ≪ Desc / Clms Page number 22 >
상기 일시적인 동적 계측을 부가하도록 하는 요청은 상기 애플리케이션의 클래스(class)에 상기 일시적인 동적 계측을 부가하기 위한 지시어(directive)를 포함하고, 그리고
상기 애플리케이션의 상기 클래스를 다시 정의함으로써 상기 일시적인 동적 계측이 상기 애플리케이션에 부가되는 것을 특징으로 하는 컴퓨터로 구현되는 방법.The method according to claim 1,
The request to add the temporal dynamic metrology includes a directive for adding the temporal dynamic metric to the class of the application,
Wherein the temporal dynamic metric is added to the application by redefining the class of the application.
상기 콜백은 상기 지속적인 연결이 예기치 못하게 유실되었는지를 자동으로 결정하고, 상기 애플리케이션은, 자동으로, 인간의 개입 없이, 상기 일시적인 동적 계측을 포함하지 않은 상태로 복원되는 것을 특징으로 하는 컴퓨터로 구현되는 방법.3. The method according to claim 1 or 2,
Wherein the callback automatically determines if the persistent connection has been unexpectedly lost and the application is automatically restored to a state that does not include the transient dynamic metrology without human intervention .
상기 어플리케이션이 복원되는 상태는 정적 계측을 포함하되 동적 계측을 포함하지 않는 것을 특징으로 하는 컴퓨터로 구현되는 방법.3. The method according to claim 1 or 2,
Wherein the state in which the application is restored includes static metrology but does not include dynamic metrology.
지시어들의 레코드를 유지하는 단계를 더 포함하고, 상기 일시적인 동적 계측이 부가되기 전에, 상기 지시어들은 관련된 계측이 부가되는 상기 애플리케이션의 클래스들을 식별하며, 상기 복원시키는 단계는, 상기 애플리케이션의 계측되지 않은 바이트 코드를 로딩(loading)하는 것과, 그리고 상기 계측되지 않은 바이트 코드에서의 상기 지시어들에 의해 식별되는 상기 클래스들에 상기 관련된 계측을 부가하는 것을 포함하는 것을 특징으로 하는 컴퓨터로 구현되는 방법.3. The method according to claim 1 or 2,
Further comprising maintaining a record of directives before said temporary dynamic metric is added, said directives identifying classes of the application to which the associated metric is appended, Loading the code and adding the associated metrics to the classes identified by the directives in the unmeasured bytecode. ≪ RTI ID = 0.0 > 31. < / RTI >
상기 애플리케이션의 상기 계측되지 않은 바이트 코드는 .JAR 파일로부터 액세스되는 것을 특징으로 하는 컴퓨터로 구현되는 방법.6. The method of claim 5,
Wherein the un-instrumented bytecode of the application is accessed from a .JAR file.
상기 지속적인 연결이 예기치 못하게 유실되지 않은 경우, 상기 컴퓨팅 디바이스에서 타이머의 만료시, 상기 일시적인 동적 계측이 부가되기 전에 존재했던 상태로 상기 애플리케이션을 복원시키도록 하는 요청을 상기 컴퓨팅 디바이스로부터 수신하는 단계와; 그리고
상기 애플리케이션을 복원시키도록 하는 요청에 응답하여, 상기 일시적인 동적 계측이 부가되기 전에 존재했던 상태로 상기 애플리케이션을 복원시키는 단계를 더 포함하고, 여기서 상기 일시적인 동적 계측이 부가되기 전에 존재했던 상태는 상기 일시적인 동적 계측과는 다른 계측을 포함하는 것을 특징으로 하는 컴퓨터로 구현되는 방법.3. The method according to claim 1 or 2,
Receiving, from the computing device, a request to restore the application to a state that existed before the temporal dynamic metering was added at the expiration of the timer at the computing device if the persistent connection was not unexpectedly lost; And
Further comprising the step of, in response to a request to restore the application, restoring the application to a state that existed before the temporal dynamic metric was added, Lt; RTI ID = 0.0 > a < / RTI > dynamic metrology.
상기 지속적인 연결이 예기치 못하게 유실되지 않은 경우, 상기 컴퓨팅 디바이스에서 타이머의 만료시, 상기 컴퓨팅 디바이스로의 상기 콜백을 종료하도록 하는 요청을 상기 컴퓨팅 디바이스로부터 수신하는 단계와; 그리고
상기 컴퓨팅 디바이스로의 상기 콜백을 종료하도록 하는 요청에 응답하여 상기 컴퓨팅 디바이스로의 상기 콜백을 종료하고, 그리고 상기 일시적인 동적 계측이 부가되기 전에 존재했던 상태로 상기 애플리케이션을 복원시키는 단계를 더 포함하며, 여기서 상기 일시적인 동적 계측이 부가되기 전에 존재했던 상태는 상기 일시적인 동적 계측과는 다른 계측을 포함하는 것을 특징으로 하는 컴퓨터로 구현되는 방법.3. The method according to claim 1 or 2,
Receiving a request from the computing device to terminate the callback to the computing device upon expiration of a timer at the computing device if the persistent connection has not been unexpectedly lost; And
Terminating the callback to the computing device in response to a request to terminate the callback to the computing device and restoring the application to a state that existed before the temporal dynamic metering was added, Wherein the state that existed before the temporary dynamic measurement was added includes measurement different from the temporal dynamic measurement.
제 1 컴퓨팅 디바이스에서 제 2 컴퓨팅 디바이스로부터의 요청을 수신하는 단계 - 상기 요청은 애플리케이션 서버를 식별하고, 상기 애플리케이션 서버에서 애플리케이션에 일시적인 동적 계측을 부가하기 위한 지시어를 포함함 - 와;
상기 요청에 응답하여, 타이머를 구현하고, 그리고 상기 제 1 컴퓨팅 디바이스의 소켓과 상기 애플리케이션 서버의 소켓과의 사이의 제 1 지속적인 연결을 확립하고, 상기 제 1 지속적인 연결을 통해 상기 제 1 컴퓨팅 디바이스로부터 상기 애플리케이션 서버로, 상기 애플리케이션에 상기 일시적인 동적 계측을 부가하기 위한 상기 지시어 및 상기 제 1 컴퓨팅 디바이스로의 콜백을 구현하도록 하는 요청을 제공하는 단계 - 상기 콜백은 상기 제 1 지속적인 연결이 예기치 못하게 유실되었는지를 결정하기 위해 상기 애플리케이션 서버의 소켓을 모니터링하고, 상기 콜백은, 상기 어플리케이션 서버의 소켓이 상기 지속적인 연결이 예기치 못하게 유실됨을 나타내는 이벤트를 생성하는지를 결정함으로써 상기 제 1 지속적인 연결이 예기치 못하게 유실되는지를 결정함 - 와; 그리고
상기 타이머의 만료시, 상기 제 1 지속적인 연결이 예기치 못하게 유실되지 않았다면, 상기 일시적인 동적 계측이 부가되기 전에 존재했던 상태로 상기 애플리케이션을 복원시키도록 하는 요청을 상기 제 1 지속적인 연결을 통해 상기 애플리케이션 서버에 제공하는 단계를 포함하는 것을 특징으로 컴퓨터로 구현되는 방법.A computer-implemented method,
The method comprising: receiving a request from a second computing device at a first computing device, the request comprising an indication to identify an application server and to add temporal dynamic metering to the application at the application server;
In response to the request, implementing a timer and establishing a first persistent connection between a socket of the first computing device and a socket of the application server, and establishing a first persistent connection from the first computing device Providing, by the application server, a request to implement the callback to the first computing device and the directive to add the transient dynamic metric to the application, the callback further comprising: determining whether the first persistent connection is unexpectedly lost , The callback determining if the socket of the application server generates an event indicating that the persistent connection is unexpectedly lost, thereby preventing the first persistent connection from being unexpectedly lost Must determine - as; And
At the expiration of the timer, a request to the application server via the first persistent connection to restore the application to a state that existed before the temporary dynamic metric was added, if the first persistent connection was unexpectedly lost. Said method comprising the steps of:
상기 제 1 컴퓨팅 디바이스에서, 상기 제 1 컴퓨팅 디바이스의 소켓과 상기 제 2 컴퓨팅 디바이스의 소켓과의 사이의 제 2 지속적인 연결을 확립하는 단계 - 상기 제 2 컴퓨팅 디바이스로부터 상기 제 1 컴퓨팅 디바이스에서 수신된 요청은 상기 제 2 지속적인 연결을 통해 상기 제 2 컴퓨팅 디바이스로의 콜백을 구현하도록 하는 요청을 포함하고, 상기 제 2 컴퓨팅 디바이스로의 콜백은 상기 제 2 지속적인 연결이 예기치 못하게 유실되는지를 결정하기 위해 상기 제 1 컴퓨팅 디바이스의 소켓을 모니터링함 - 와;
상기 제 1 컴퓨팅 디바이스에서, 상기 제 1 지속적인 연결이 예기치 못하게 유실되었는지를 결정하기 위해 상기 제 1 지속적인 연결을 리스닝(listening)하고, 그리고 상기 제 1 지속적인 연결이 예기치 못하게 유실되었다는 결정에 응답하여 상기 제 2 컴퓨팅 디바이스로의 콜백을 종료하는 단계를 더 포함하는 것을 특징으로 하는 컴퓨터로 구현되는 방법.10. The method of claim 9,
At the first computing device, establishing a second persistent connection between a socket of the first computing device and a socket of the second computing device, the method comprising: receiving a request from the second computing device Includes a request to implement a callback to the second computing device over the second persistent connection, and a callback to the second computing device includes a callback to the second computing device to determine whether the second persistent connection is unexpectedly lost 1 monitoring a socket of a computing device;
At the first computing device, listening to the first persistent connection to determine if the first persistent connection has been unexpectedly lost, and in response to determining that the first persistent connection has been unexpectedly lost, 2 < / RTI > computing device. ≪ Desc / Clms Page number 22 >
Applications Claiming Priority (2)
| Application Number | Priority Date | Filing Date | Title |
|---|---|---|---|
| US12/777,506US8782612B2 (en) | 2010-05-11 | 2010-05-11 | Failsafe mechanism for dynamic instrumentation of software using callbacks |
| US12/777,506 | 2010-05-11 |
Publications (2)
| Publication Number | Publication Date |
|---|---|
| KR20110124734A KR20110124734A (en) | 2011-11-17 |
| KR101650110B1true KR101650110B1 (en) | 2016-08-22 |
Family
ID=44260250
Family Applications (1)
| Application Number | Title | Priority Date | Filing Date |
|---|---|---|---|
| KR1020110044255AExpired - Fee RelatedKR101650110B1 (en) | 2010-05-11 | 2011-05-11 | Failsafe mechanism for dynamic instrumentation of software using callbacks |
Country Status (4)
| Country | Link |
|---|---|
| US (1) | US8782612B2 (en) |
| EP (1) | EP2386951B1 (en) |
| JP (1) | JP5723208B2 (en) |
| KR (1) | KR101650110B1 (en) |
Families Citing this family (28)
| Publication number | Priority date | Publication date | Assignee | Title |
|---|---|---|---|---|
| US20100275185A1 (en)* | 2009-04-24 | 2010-10-28 | Felix Burton | System and Method for High Performance Coverage Analysis |
| US8667472B1 (en)* | 2010-07-29 | 2014-03-04 | Disney Enterprises, Inc. | System and method of instrumenting code for in-production monitoring |
| US8745598B2 (en)* | 2010-12-14 | 2014-06-03 | Bmc Software, Inc. | Running injected code prior to execution of an application |
| US20120158661A1 (en)* | 2010-12-15 | 2012-06-21 | Microsoft Corporation | Context-specific rollback |
| US9471315B2 (en) | 2012-03-16 | 2016-10-18 | International Business Machines Corporation | Run-time instrumentation reporting |
| US9250902B2 (en) | 2012-03-16 | 2016-02-02 | International Business Machines Corporation | Determining the status of run-time-instrumentation controls |
| US9465716B2 (en) | 2012-03-16 | 2016-10-11 | International Business Machines Corporation | Run-time instrumentation directed sampling |
| US9411591B2 (en)* | 2012-03-16 | 2016-08-09 | International Business Machines Corporation | Run-time instrumentation sampling in transactional-execution mode |
| US9483268B2 (en) | 2012-03-16 | 2016-11-01 | International Business Machines Corporation | Hardware based run-time instrumentation facility for managed run-times |
| US9430238B2 (en) | 2012-03-16 | 2016-08-30 | International Business Machines Corporation | Run-time-instrumentation controls emit instruction |
| US9405541B2 (en) | 2012-03-16 | 2016-08-02 | International Business Machines Corporation | Run-time instrumentation indirect sampling by address |
| US9367316B2 (en) | 2012-03-16 | 2016-06-14 | International Business Machines Corporation | Run-time instrumentation indirect sampling by instruction operation code |
| US9280447B2 (en) | 2012-03-16 | 2016-03-08 | International Business Machines Corporation | Modifying run-time-instrumentation controls from a lesser-privileged state |
| US9158660B2 (en) | 2012-03-16 | 2015-10-13 | International Business Machines Corporation | Controlling operation of a run-time instrumentation facility |
| US9442824B2 (en) | 2012-03-16 | 2016-09-13 | International Business Machines Corporation | Transformation of a program-event-recording event into a run-time instrumentation event |
| US9454462B2 (en) | 2012-03-16 | 2016-09-27 | International Business Machines Corporation | Run-time instrumentation monitoring for processor characteristic changes |
| US9817656B2 (en)* | 2012-08-24 | 2017-11-14 | Ca, Inc. | Hot rollback of updated agent |
| US9798557B2 (en) | 2012-08-24 | 2017-10-24 | Ca, Inc. | Injection of updated classes for a java agent |
| US8938722B2 (en)* | 2012-10-17 | 2015-01-20 | International Business Machines Corporation | Identifying errors using context based class names |
| US9223681B2 (en)* | 2013-02-15 | 2015-12-29 | International Business Machines Corporation | Automated debug trace specification |
| US9021448B1 (en)* | 2013-02-28 | 2015-04-28 | Ca, Inc. | Automated pattern detection in software for optimal instrumentation |
| US9575864B2 (en)* | 2014-06-02 | 2017-02-21 | Microsoft Technology Licensing, Llc | Function-level dynamic instrumentation |
| US10095599B2 (en) | 2016-03-31 | 2018-10-09 | International Business Machines Corporation | Optimization for application runtime monitoring |
| US11151604B2 (en)* | 2016-06-10 | 2021-10-19 | International Business Machines Corporation | Revenue management using dynamic customer selection |
| US10558553B2 (en)* | 2016-11-30 | 2020-02-11 | International Business Machines Corporation | Enabling non-blocking runtime application debugging for a single threaded server environment |
| US10348604B2 (en)* | 2017-02-01 | 2019-07-09 | International Business Machines Corporation | Monitoring a resource consumption of an application |
| US11449407B2 (en)* | 2020-05-28 | 2022-09-20 | Bank Of America Corporation | System and method for monitoring computing platform parameters and dynamically generating and deploying monitoring packages |
| CN114297061A (en)* | 2021-12-27 | 2022-04-08 | 南京中孚信息技术有限公司 | Software project fault positioning method and device and electronic equipment |
Citations (3)
| Publication number | Priority date | Publication date | Assignee | Title |
|---|---|---|---|---|
| US20050261879A1 (en) | 2004-05-21 | 2005-11-24 | Sandeep Shrivastava | Diagnostic context |
| JP2006018710A (en) | 2004-07-05 | 2006-01-19 | Hitachi Ltd | Network service performance measurement method and program |
| US20080288962A1 (en) | 2007-05-15 | 2008-11-20 | Bernd Greifeneder | Method and System for Dynamic Remote injection of In-process Agents into Virtual Machine based Applications |
Family Cites Families (64)
| Publication number | Priority date | Publication date | Assignee | Title |
|---|---|---|---|---|
| US5515536A (en) | 1992-11-13 | 1996-05-07 | Microsoft Corporation | Method and system for invoking methods of an object through a dispatching interface |
| US6314558B1 (en)* | 1996-08-27 | 2001-11-06 | Compuware Corporation | Byte code instrumentation |
| JPH10320223A (en)* | 1997-05-16 | 1998-12-04 | Toshiba Corp | Checkpoint communication processing system, checkpoint communication processing method, and storage medium recording this method |
| CA2255042C (en) | 1998-11-30 | 2004-04-13 | Leonard W. Theivendra | Class loader |
| US7058928B2 (en)* | 1999-12-23 | 2006-06-06 | Identify Software Ltd. | System and method for conditional tracing of computer programs |
| US7577834B1 (en) | 2000-05-09 | 2009-08-18 | Sun Microsystems, Inc. | Message authentication using message gates in a distributed computing environment |
| US6954747B1 (en) | 2000-11-14 | 2005-10-11 | Microsoft Corporation | Methods for comparing versions of a program |
| US7047521B2 (en) | 2001-06-07 | 2006-05-16 | Lynoxworks, Inc. | Dynamic instrumentation event trace system and methods |
| US6993760B2 (en) | 2001-12-05 | 2006-01-31 | Microsoft Corporation | Installing software on a mobile computing device using the rollback and security features of a configuration manager |
| US7103878B2 (en) | 2001-12-13 | 2006-09-05 | Hewlett-Packard Development Company, L.P. | Method and system to instrument virtual function calls |
| US7017153B2 (en)* | 2001-12-13 | 2006-03-21 | Hewlett-Packard Development Company, L.P. | Uninstrumenting in-line code instrumentation via stack unwinding and cleanup |
| US6985909B2 (en) | 2001-12-28 | 2006-01-10 | Sap Ag | Modified class loaders and methods of use |
| US20030145309A1 (en) | 2002-01-18 | 2003-07-31 | Rajendra Inamdar | Probe description language |
| US20030163608A1 (en) | 2002-02-21 | 2003-08-28 | Ashutosh Tiwary | Instrumentation and workload recording for a system for performance testing of N-tiered computer systems using recording and playback of workloads |
| JP2004005230A (en)* | 2002-05-31 | 2004-01-08 | Omron Corp | Agent-utilizing maintenance system |
| US7058957B1 (en) | 2002-07-12 | 2006-06-06 | 3Pardata, Inc. | Cluster event notification system |
| US7870431B2 (en) | 2002-10-18 | 2011-01-11 | Computer Associates Think, Inc. | Transaction tracer |
| US7603664B2 (en)* | 2002-10-22 | 2009-10-13 | Sun Microsystems, Inc. | System and method for marking software code |
| US8418145B2 (en) | 2002-11-07 | 2013-04-09 | Ca, Inc. | Simple method optimization |
| US7206807B2 (en) | 2003-01-21 | 2007-04-17 | Bea Systems, Inc. | Asynchronous invoking a remote web service on a server by a client who passes on a received invoke request from application code residing on the client |
| US7114150B2 (en) | 2003-02-13 | 2006-09-26 | International Business Machines Corporation | Apparatus and method for dynamic instrumenting of code to minimize system perturbation |
| US7496903B2 (en) | 2003-08-12 | 2009-02-24 | Hewlett-Packard Development Company, L.P. | Synthesizing application response measurement (ARM) instrumentation |
| US7293260B1 (en) | 2003-09-26 | 2007-11-06 | Sun Microsystems, Inc. | Configuring methods that are likely to be executed for instrument-based profiling at application run-time |
| US7469262B2 (en) | 2003-12-29 | 2008-12-23 | Oracle International Corporation | Customizable metadata merging framework |
| EP1741038A4 (en) | 2004-04-26 | 2011-06-15 | Creo Inc | Systems and methods for comparing documents containing graphic elements |
| US7395458B2 (en) | 2004-05-21 | 2008-07-01 | Bea Systems, Inc. | Diagnostic instrumentation |
| US7562341B2 (en) | 2004-05-24 | 2009-07-14 | Sap Ag | Deploy callback system with bidirectional containers |
| US7546593B2 (en) | 2004-05-28 | 2009-06-09 | Sap Ag | Common class loaders |
| US7614045B2 (en) | 2004-09-24 | 2009-11-03 | Sap (Ag) | Sharing classes and class loaders |
| US20060174226A1 (en) | 2005-02-03 | 2006-08-03 | Sytex, Inc. | Methods, Test Systems And Computer-Readable Medium For Dynamically Modifying Flow Of Executable Code |
| US7788644B2 (en) | 2005-03-24 | 2010-08-31 | Sap Ag | Method and system for monitoring performance on a mobile device |
| US7926042B2 (en) | 2005-10-31 | 2011-04-12 | Hewlett-Packard Development Company, L.P. | System and method for dynamic instrumentation |
| US20070107057A1 (en)* | 2005-11-10 | 2007-05-10 | Docomo Communications Laboratories Usa, Inc. | Method and apparatus for detecting and preventing unsafe behavior of javascript programs |
| US7483927B2 (en) | 2005-12-01 | 2009-01-27 | International Business Machines Corporation | Method for merging metadata on files in a backup storage |
| US20070150870A1 (en) | 2005-12-22 | 2007-06-28 | International Business Machines Corporation | Method and apparatus for context oriented computer program tracing and visualization |
| US20070234307A1 (en) | 2006-03-06 | 2007-10-04 | Chi-Keung Luk | Methods and apparatus to inline conditional software instrumentation |
| US8984534B2 (en) | 2006-03-31 | 2015-03-17 | British Telecommunications Public Limited Company | Interfacing between a receiving component of a server application and a remote application |
| US7437359B2 (en) | 2006-04-05 | 2008-10-14 | Arcsight, Inc. | Merging multiple log entries in accordance with merge properties and mapping properties |
| US8261244B2 (en)* | 2006-06-02 | 2012-09-04 | Microsoft Corporation | Arbitrary runtime function call tracing |
| US20080005726A1 (en)* | 2006-06-29 | 2008-01-03 | Jean-Francois Collard | Methods and systems for modifying software applications to implement memory allocation |
| US20080034352A1 (en) | 2006-06-29 | 2008-02-07 | Mckinney Howard M | System and method for determining unimportant probe locations by examination of byte code to identify method by name pattern |
| US8464225B2 (en) | 2007-05-06 | 2013-06-11 | Dynatrace Software Gmbh | Method and system for adaptive, generic code instrumentation using run-time or load-time generated inheritance information for diagnosis and monitoring application performance and failure |
| US7957934B2 (en) | 2007-05-15 | 2011-06-07 | Dynatrace Software Gmbh | Method and system for processing application performance data ouside of monitored applications to limit overhead caused by monitoring |
| US20080148242A1 (en) | 2006-12-18 | 2008-06-19 | Computer Associates Think, Inc. | Optimizing an interaction model for an application |
| US8079020B2 (en) | 2007-03-05 | 2011-12-13 | Microsoft Corporation | Preferential path profiling |
| US9047412B2 (en) | 2007-05-06 | 2015-06-02 | Dynatrace Corporation | System and method for extracting instrumentation relevant inheritance relationships for a distributed, inheritance rule based instrumentation system |
| WO2008156782A2 (en)* | 2007-06-19 | 2008-12-24 | Sand Holdings, Llc | Devices and methods for automatic reset of monitored network network equipment |
| US8307343B2 (en)* | 2007-10-19 | 2012-11-06 | Microsoft Corporation | Application and database context correlation for database application developers |
| US20090112667A1 (en) | 2007-10-31 | 2009-04-30 | Ken Blackwell | Automated Business Process Model Discovery |
| US8826242B2 (en)* | 2007-11-27 | 2014-09-02 | Microsoft Corporation | Data driven profiling for distributed applications |
| US8464270B2 (en) | 2007-11-29 | 2013-06-11 | Red Hat, Inc. | Dependency management with atomic decay |
| US8359582B2 (en)* | 2007-12-31 | 2013-01-22 | Hewlett-Packard Development Company, L.P. | Compiling and inserting code snippets at runtime |
| WO2009095741A1 (en) | 2008-02-01 | 2009-08-06 | The Mathworks, Inc | Selective code instrumentation for software verification |
| US8019863B2 (en)* | 2008-03-28 | 2011-09-13 | Ianywhere Solutions, Inc. | Synchronizing events between mobile devices and servers |
| US8141056B2 (en) | 2008-04-03 | 2012-03-20 | International Business Machines Corporation | Just-in-time dynamic instrumentation |
| US8271959B2 (en)* | 2008-04-27 | 2012-09-18 | International Business Machines Corporation | Detecting irregular performing code within computer programs |
| JP5198154B2 (en)* | 2008-06-04 | 2013-05-15 | 株式会社日立製作所 | Fault monitoring system, device, monitoring apparatus, and fault monitoring method |
| US9104794B2 (en)* | 2008-07-15 | 2015-08-11 | Microsoft Technology Licensing, Llc | Automatic incremental application dependency discovery through code instrumentation |
| US20100131930A1 (en) | 2008-11-21 | 2010-05-27 | International Business Machines Corporation | Selective Code Coverage Instrumentation |
| US8271958B2 (en)* | 2008-12-12 | 2012-09-18 | Microsoft Corporation | Remapping debuggable code |
| US8245210B2 (en)* | 2009-05-22 | 2012-08-14 | Microsoft Corporation | Compile-time context for dynamically bound operations |
| US8555259B2 (en)* | 2009-12-04 | 2013-10-08 | International Business Machines Corporation | Verifying function performance based on predefined count ranges |
| US20110231819A1 (en) | 2010-03-19 | 2011-09-22 | Emdigo Inc. | Content Availability Determination, Representation And Acquisition System |
| US8752015B2 (en) | 2011-12-05 | 2014-06-10 | Ca, Inc. | Metadata merging in agent configuration files |
- 2010
- 2010-05-11USUS12/777,506patent/US8782612B2/ennot_activeExpired - Fee Related
- 2011
- 2011-05-09JPJP2011104690Apatent/JP5723208B2/ennot_activeExpired - Fee Related
- 2011-05-11EPEP20110250520patent/EP2386951B1/enactiveActive
- 2011-05-11KRKR1020110044255Apatent/KR101650110B1/ennot_activeExpired - Fee Related
Patent Citations (3)
| Publication number | Priority date | Publication date | Assignee | Title |
|---|---|---|---|---|
| US20050261879A1 (en) | 2004-05-21 | 2005-11-24 | Sandeep Shrivastava | Diagnostic context |
| JP2006018710A (en) | 2004-07-05 | 2006-01-19 | Hitachi Ltd | Network service performance measurement method and program |
| US20080288962A1 (en) | 2007-05-15 | 2008-11-20 | Bernd Greifeneder | Method and System for Dynamic Remote injection of In-process Agents into Virtual Machine based Applications |
Also Published As
| Publication number | Publication date |
|---|---|
| KR20110124734A (en) | 2011-11-17 |
| US8782612B2 (en) | 2014-07-15 |
| US20110283265A1 (en) | 2011-11-17 |
| EP2386951A1 (en) | 2011-11-16 |
| JP2011238234A (en) | 2011-11-24 |
| EP2386951B1 (en) | 2013-07-10 |
| JP5723208B2 (en) | 2015-05-27 |
Similar Documents
| Publication | Publication Date | Title |
|---|---|---|
| KR101650110B1 (en) | Failsafe mechanism for dynamic instrumentation of software using callbacks | |
| US8566800B2 (en) | Detection of method calls to streamline diagnosis of custom code through dynamic instrumentation | |
| US8473925B2 (en) | Conditional dynamic instrumentation of software in a specified transaction context | |
| JP5705084B2 (en) | 2-pass automatic application measurement | |
| US8752015B2 (en) | Metadata merging in agent configuration files | |
| US9411616B2 (en) | Classloader/instrumentation approach for invoking non-bound libraries | |
| US9021448B1 (en) | Automated pattern detection in software for optimal instrumentation | |
| EP3660684A1 (en) | Efficient and comprehensive source code fuzzing | |
| US7698691B2 (en) | Server application state | |
| US7757129B2 (en) | Generalized trace and log facility for first error data collection | |
| US20100115495A1 (en) | Intelligent engine for dynamic and rule based instrumentation of software | |
| US20130226526A1 (en) | Automated Performance Data Management and Collection | |
| US9588872B2 (en) | Discovery of code paths | |
| US11151020B1 (en) | Method and system for managing deployment of software application components in a continuous development pipeline | |
| US9069619B2 (en) | Self-testable HA framework library infrastructure | |
| Pham | CloudVal: a framework for failure validation of virtualization environment in cloud infrastructure | |
| CN120639662A (en) | Cloud service problem detection method, device, storage medium and program product | |
| CN117917646A (en) | Process control method, device, electronic device and storage medium |
Legal Events
| Date | Code | Title | Description |
|---|---|---|---|
| PA0109 | Patent application | St.27 status event code:A-0-1-A10-A12-nap-PA0109 | |
| PG1501 | Laying open of application | St.27 status event code:A-1-1-Q10-Q12-nap-PG1501 | |
| PN2301 | Change of applicant | St.27 status event code:A-3-3-R10-R11-asn-PN2301 | |
| R19-X000 | Request for party data change rejected | St.27 status event code:A-3-3-R10-R19-oth-X000 | |
| N231 | Notification of change of applicant | ||
| PN2301 | Change of applicant | St.27 status event code:A-3-3-R10-R13-asn-PN2301 St.27 status event code:A-3-3-R10-R11-asn-PN2301 | |
| R18-X000 | Changes to party contact information recorded | St.27 status event code:A-3-3-R10-R18-oth-X000 | |
| E13-X000 | Pre-grant limitation requested | St.27 status event code:A-2-3-E10-E13-lim-X000 | |
| P11-X000 | Amendment of application requested | St.27 status event code:A-2-2-P10-P11-nap-X000 | |
| P13-X000 | Application amended | St.27 status event code:A-2-2-P10-P13-nap-X000 | |
| PA0201 | Request for examination | St.27 status event code:A-1-2-D10-D11-exm-PA0201 | |
| PA0302 | Request for accelerated examination | St.27 status event code:A-1-2-D10-D17-exm-PA0302 St.27 status event code:A-1-2-D10-D16-exm-PA0302 | |
| E701 | Decision to grant or registration of patent right | ||
| PE0701 | Decision of registration | St.27 status event code:A-1-2-D10-D22-exm-PE0701 | |
| GRNT | Written decision to grant | ||
| PR0701 | Registration of establishment | St.27 status event code:A-2-4-F10-F11-exm-PR0701 | |
| PR1002 | Payment of registration fee | St.27 status event code:A-2-2-U10-U11-oth-PR1002 Fee payment year number:1 | |
| PG1601 | Publication of registration | St.27 status event code:A-4-4-Q10-Q13-nap-PG1601 | |
| PC1903 | Unpaid annual fee | St.27 status event code:A-4-4-U10-U13-oth-PC1903 Not in force date:20190817 Payment event data comment text:Termination Category : DEFAULT_OF_REGISTRATION_FEE | |
| R18-X000 | Changes to party contact information recorded | St.27 status event code:A-5-5-R10-R18-oth-X000 | |
| PC1903 | Unpaid annual fee | St.27 status event code:N-4-6-H10-H13-oth-PC1903 Ip right cessation event data comment text:Termination Category : DEFAULT_OF_REGISTRATION_FEE Not in force date:20190817 |