KR101423851B1 - Sample characterization based on ac measurement methods - Google Patents
Sample characterization based on ac measurement methodsDownload PDFInfo
- Publication number
- KR101423851B1 KR101423851B1KR1020127017600AKR20127017600AKR101423851B1KR 101423851 B1KR101423851 B1KR 101423851B1KR 1020127017600 AKR1020127017600 AKR 1020127017600AKR 20127017600 AKR20127017600 AKR 20127017600AKR 101423851 B1KR101423851 B1KR 101423851B1
- Authority
- KR
- South Korea
- Prior art keywords
- high frequency
- glucose concentration
- frequency response
- blood sample
- determining
- Prior art date
- Legal status (The legal status is an assumption and is not a legal conclusion. Google has not performed a legal analysis and makes no representation as to the accuracy of the status listed.)
- Expired - Fee Related
Links
Images


Classifications
- G—PHYSICS
- G01—MEASURING; TESTING
- G01N—INVESTIGATING OR ANALYSING MATERIALS BY DETERMINING THEIR CHEMICAL OR PHYSICAL PROPERTIES
- G01N27/00—Investigating or analysing materials by the use of electric, electrochemical, or magnetic means
- G01N27/26—Investigating or analysing materials by the use of electric, electrochemical, or magnetic means by investigating electrochemical variables; by using electrolysis or electrophoresis
- G01N27/28—Electrolytic cell components
- G01N27/30—Electrodes, e.g. test electrodes; Half-cells
- G01N27/327—Biochemical electrodes, e.g. electrical or mechanical details for in vitro measurements
- G01N27/3271—Amperometric enzyme electrodes for analytes in body fluids, e.g. glucose in blood
- G01N27/3274—Corrective measures, e.g. error detection, compensation for temperature or hematocrit, calibration
- G—PHYSICS
- G01—MEASURING; TESTING
- G01N—INVESTIGATING OR ANALYSING MATERIALS BY DETERMINING THEIR CHEMICAL OR PHYSICAL PROPERTIES
- G01N33/00—Investigating or analysing materials by specific methods not covered by groups G01N1/00 - G01N31/00
- G01N33/48—Biological material, e.g. blood, urine; Haemocytometers
- G01N33/483—Physical analysis of biological material
- G01N33/487—Physical analysis of biological material of liquid biological material
- G01N33/49—Blood
- G—PHYSICS
- G01—MEASURING; TESTING
- G01N—INVESTIGATING OR ANALYSING MATERIALS BY DETERMINING THEIR CHEMICAL OR PHYSICAL PROPERTIES
- G01N27/00—Investigating or analysing materials by the use of electric, electrochemical, or magnetic means
- G01N27/02—Investigating or analysing materials by the use of electric, electrochemical, or magnetic means by investigating impedance
- G01N27/22—Investigating or analysing materials by the use of electric, electrochemical, or magnetic means by investigating impedance by investigating capacitance
- G—PHYSICS
- G01—MEASURING; TESTING
- G01N—INVESTIGATING OR ANALYSING MATERIALS BY DETERMINING THEIR CHEMICAL OR PHYSICAL PROPERTIES
- G01N27/00—Investigating or analysing materials by the use of electric, electrochemical, or magnetic means
- G01N27/26—Investigating or analysing materials by the use of electric, electrochemical, or magnetic means by investigating electrochemical variables; by using electrolysis or electrophoresis
- G01N27/28—Electrolytic cell components
- G01N27/30—Electrodes, e.g. test electrodes; Half-cells
- G—PHYSICS
- G01—MEASURING; TESTING
- G01N—INVESTIGATING OR ANALYSING MATERIALS BY DETERMINING THEIR CHEMICAL OR PHYSICAL PROPERTIES
- G01N33/00—Investigating or analysing materials by specific methods not covered by groups G01N1/00 - G01N31/00
- G01N33/48—Biological material, e.g. blood, urine; Haemocytometers
- G01N33/50—Chemical analysis of biological material, e.g. blood, urine; Testing involving biospecific ligand binding methods; Immunological testing
- G01N33/66—Chemical analysis of biological material, e.g. blood, urine; Testing involving biospecific ligand binding methods; Immunological testing involving blood sugars, e.g. galactose
Landscapes
- Health & Medical Sciences (AREA)
- Life Sciences & Earth Sciences (AREA)
- Chemical & Material Sciences (AREA)
- Hematology (AREA)
- Immunology (AREA)
- Engineering & Computer Science (AREA)
- Physics & Mathematics (AREA)
- Pathology (AREA)
- Molecular Biology (AREA)
- General Health & Medical Sciences (AREA)
- General Physics & Mathematics (AREA)
- Analytical Chemistry (AREA)
- Biochemistry (AREA)
- Biomedical Technology (AREA)
- Electrochemistry (AREA)
- Chemical Kinetics & Catalysis (AREA)
- Urology & Nephrology (AREA)
- Food Science & Technology (AREA)
- Medicinal Chemistry (AREA)
- Diabetes (AREA)
- Biotechnology (AREA)
- Cell Biology (AREA)
- Microbiology (AREA)
- Ecology (AREA)
- Biophysics (AREA)
- Investigating Or Analyzing Materials By The Use Of Electric Means (AREA)
- Investigating Or Analysing Biological Materials (AREA)
Abstract
Translated fromKoreanDescription
Translated fromKorean본 발명은 AC 측정 방법들에 기초한 샘플 특성화에 관한 것이다.The present invention relates to sample characterization based on AC measurement methods.
당뇨병 치료는 통상적으로 기저 (basal) 및 식사시간 (meal-time) 의 2 가지 타입의 인슐린 요법을 수반한다. 기저 인슐린은 종종 취침 전에 측정되는 연속적인, 예를 들어, 지속적으로 방출되는 (time-relased) 인슐린을 지칭한다. 식사시간 인슐린 요법은 당분 및 탄수화물의 신진대사를 포함하는, 다양한 요인들에 의해 야기된 혈당의 변동을 조정하기 위해 속효성 (faster acting) 인슐린의 추가적인 도즈 (doses) 를 제공한다. 혈당 변동의 적절한 조정은 혈액 내 글루코오스의 농도의 정확한 측정을 요구한다. 정확한 측정의 실패는, 실명 및 말단의 순환 장애를 포함하는, 심각한 합병증을 초래할 수 있으며, 이는 결국 당뇨병 환자가 그 또는 그녀의 손가락, 손, 발 등의 사용을 못하게 할 수 있다.Diabetes therapy usually involves two types of insulin therapy: basal and meal-time. Basal insulin often refers to a continuous, e.g., time-relased, insulin that is measured prior to bedtime. Meal time insulin therapy provides additional doses of fast acting insulin to modulate blood glucose fluctuations caused by a variety of factors, including the metabolism of sugars and carbohydrates. Proper adjustment of blood glucose fluctuations requires accurate measurement of the concentration of glucose in the blood. Failure to make accurate measurements can lead to serious complications, including blindness and circulatory disturbances in the extremities, which can eventually prevent a diabetic patient from using his or her fingers, hands, feet, and the like.
예를 들어, 글루코오스와 같은 혈액 샘플 내 분석대상물들 (analytes) 의 농도를 측정하기 위한 다수의 방법들이 공지되어 있다. 이러한 방법들은 통상적으로 2 가지 카테고리들, 즉 광학적 방법들 및 전기화학적 방법들 중 하나로 귀결된다. 광학적 방법들은 일반적으로 반사 또는 흡수 분광법을 수반하여 시약에서의 스펙트럼 시프트를 관찰한다. 이러한 시프트들은, 분석대상물의 농도를 나타내는 색상 변화를 초래하는 화학 반응에 의해 야기된다.For example, a number of methods are known for measuring the concentration of analytes in blood samples such as glucose. These methods typically result in one of two categories: optical and electrochemical methods. Optical methods generally involve reflection or absorption spectroscopy to observe the spectral shift in the reagent. These shifts are caused by a chemical reaction that causes a color change indicating the concentration of the analyte.
종래의 전기화학적 방법들은 일반적으로 관심 반응을 개시하는데 필요한 정전위 (constant potential) 또는 전위 스텝 (potential step) 을 적용하는 단계 및 글루코오스 농도에 비례하는 결과의 전하 또는 전류를 측정하는 단계를 포함한다. 예를 들어, Columbus 의 미국 특허 제4,233,029호; Pace 의 미국 특허 제4,225,410호; Columbus 의 미국 특허 제4,323,536호; Muggli 의 미국 특허 제4,008,448호; Lilja 등의 미국 특허 제4,654,197호; Szuminsky 등의 미국 특허 제5,108,564호; Nankai 등의 미국 특허 제5,120,420호; Szuminsky 등의 미국 특허 제5,128,015호; White 의 미국 특허 제5,243,516호; Diebold 등의 미국 특허 제5,437,999호; Pollmann 등의 미국 특허 제5,288,636호; Carter 등의 미국 특허 제5,628,890호; Hill 등의 미국 특허 제5,682,884호; Hill 등의 미국 특허 제5,727,548호; Crismore 등의 미국 특허 제5,997,817호; Fujiwara 등의 미국 특허 제6,004,441호; Priedel 등의 미국 특허 제4,919,770호; 및 Shieh 의 미국 특허 제6,054,039호를 참조하며, 이들은 여기에 참조로 완전히 통합된다. Cotrell 등식에 따르면, 관심 분석대상물의 농도 이외에도, 온도, 전극 표면적, 및 확산 계수와 같은 인자들이 또한 결과의 전류에 기여한다. 그 결과, 반응 영역에서의 온도의 변화, 전극 표면적의 블록키지 (blockage), 또는 전극 표면으로의 반응물 확산의 장애에 의해 야기된 이들 파라미터들의 임의의 변화가 또한 결과의 전류에 영향을 미칠 것이다. 또한, 적용된 전위에서 또한 전기화학적으로 활성인 간섭 화합물들이 추가적인 DC 전류, 및 결과적으로는 양으로 바이어싱된 글루코오스 농도를 발생시킬 수 있다.Conventional electrochemical methods generally involve applying a constant potential or potential step necessary to initiate a response of interest and measuring the resultant charge or current proportional to the glucose concentration. See, for example, Columbus U.S. Pat. No. 4,233,029; U.S. Patent No. 4,225,410 to Pace; U.S. Patent No. 4,323,536 to Columbus; U.S. Patent No. 4,008,448 to Muggli; U.S. Patent No. 4,654,197 to Lilja et al .; U.S. Patent No. 5,108,564 to Szuminsky et al .; Nankai et al., U.S. Patent 5,120,420; Szuminsky et al., U.S. Patent No. 5,128,015; U.S. Patent No. 5,243,516 to White; U.S. Patent No. 5,437,999 to Diebold et al .; U.S. Patent No. 5,288,636 to Pollmann et al; U.S. Patent No. 5,628,890 to Carter et al .; Hill, et al., U.S. Patent No. 5,682,884; Hill, et al., U.S. Patent No. 5,727,548; U.S. Patent No. 5,997,817 to Crismore et al .; U.S. Patent No. 6,004,441 to Fujiwara et al .; U.S. Patent No. 4,919,770 to Priedel et al .; And US 6,054,039 to Shieh, which are fully incorporated herein by reference. According to the Cotrell equation, in addition to the concentration of the analyte of interest, factors such as temperature, electrode surface area, and diffusion coefficient also contribute to the resulting current. As a result, any change in these parameters caused by a change in temperature in the reaction zone, blockage of the electrode surface area, or impaired reactant diffusion to the electrode surface will also affect the resulting current. In addition, at the applied potential, the electrochemically active interfering compounds can also generate an additional DC current, and consequently a positively biased glucose concentration.
이러한 문제들 중 일부는 지금까지는 AC 임피던스를 이용하여 상기 설명된 인자들의 기여의 측정치를 획득하고 또한 정확한 글루코오스 농도 추정을 위해 DC 전류를 정정함으로써 회피되었다. 이들 AC-기반 방법들은 가변 주파수의 교번 전위 (alternative potential) 의 적용 및 셀 임피던스의 측정으로 이루어진다. 예를 들어, Kermani 등의 미국 특허 제6,797,150호, Vreeke 등의 미국 공개특허공보 제2004/0079652호, 및 Roche Diagnostics GmbH 의 유럽 특허 제1 639 355호를 참조하며, 이들은 여기에 완전히 참조로 통합된다. 그러나, 이들 방법론들은 AC 및 DC 신호들의 순차 적용 및 DC 전류의 정상 상태 특성 (steady-state nature) 으로 인해 측정 시간을 연장시킨다.Some of these problems have so far been avoided by using AC impedance to obtain measurements of the contributions of the factors described above and also by correcting the DC current for accurate glucose concentration estimation. These AC-based methods consist of applying an alternative potential of a variable frequency and measuring the cell impedance. See, for example, U.S. Patent No. 6,797,150 to Kermani et al., U.S. Patent Publication No. 2004/0079652 to Vreeke et al, and European Patent No. 1 639 355 to Roche Diagnostics GmbH, which are incorporated herein by reference in their entireties . However, these methodologies extend the measurement time due to the sequential application of AC and DC signals and the steady-state nature of the DC current.
따라서, 이 분야에는 개선의 필요성이 있다.Therefore, there is a need for improvement in this field.
일 양태는 혈액 또는 다른 체액 내 분석대상물 농도, 이를 테면 글루코오스 농도를 검출하기 위한 기법에 관한 것이다. 이 기법은 저전위에서 선형 유도 전류 응답 (linear faradic response) 을 발생시키는 매개체 시스템을 포함하는 전기화학적 테스트 스트립을 이용한다. 테스트 스트립 내 혈액에는 교류 여기 신호가 적용된다. 교류 여기 신호는 저주파수 신호, 및 저주파수 신호보다 더 높은 주파수를 갖는 고주파수 신호를 포함한다. 글루코오스 농도는 저주파수 신호에 대한 저주파수 응답을 측정하고, 고주파수 신호에 대한 고주파수 응답을 측정하고, 저주파수 응답에 기초하여 글루코오스 농도를 추정하며, 고주파수 응답에 기초하여 하나 이상의 에러 유발 (error-causing) 변수들에 대해 글루코오스 농도를 정정함으로써 결정된다.One aspect relates to techniques for detecting analyte concentrations in blood or other body fluids, such as glucose concentrations. This technique utilizes an electrochemical test strip that includes an intermediary system that generates a linear faradic response at low currents. An AC excitation signal is applied to the blood in the test strip. The AC excitation signal includes a low frequency signal and a high frequency signal having a higher frequency than the low frequency signal. The glucose concentration can be determined by measuring the low frequency response for the low frequency signal, measuring the high frequency response for the high frequency signal, estimating the glucose concentration based on the low frequency response, and determining one or more error- Lt; RTI ID = 0.0 > glucose < / RTI >
본 발명의 추가 형태들, 목적들, 특징들, 양태들, 이익들, 이점들 및 실시형태들은 상세한 설명 및 그와 함께 제공된 도면들로부터 명백해질 것이다.Additional aspects, objects, features, aspects, advantages, advantages and embodiments of the present invention will become apparent from the detailed description and the drawings provided therefor.
도 1 은 본 개시물의 일 실시형태에 따른 듀얼 매개 시스템을 그래픽적으로 예시한 도면이다.
도 2a 는 본 개시물의 일 실시형태에 따른 20480Hz, 10240Hz, 2048Hz, 1024Hz, 512Hz, 256Hz 및 128Hz 의 주파수에서의 AC 응답의 Zre 대 Zim 의 나이퀴스트 플롯이다.
도 2b 는 본 개시물의 일 실시형태에 따른 2 개의 상이한 여기 모델리티들 (excitation modalities) 에서의 2 개의 상이한 글루코오스 농도에 대한 20000Hz, 10000Hz, 2000Hz, 1000Hz, 512Hz 및 128Hz 의 주파수에서의 AC 응답의 Zre 대 Zim 의 나이퀴스트 플롯이다.
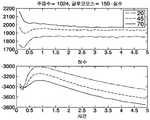
도 3a 는 본 개시물의 일 실시형태에 따른 150mg/dl 의 글루코오스 농도를 함유하는 혈액 용액이 테스트 스트립에 도즈되는 1024Hz 에서의 5초 측정 시간에 걸친 시간 대 임피던스의 플롯이다.
도 3b 는 본 개시물의 일 실시형태에 따른 120mg/dl 의 글루코오스 농도를 함유하는 혈액 용액이 테스트 스트립에 도즈되는 1024Hz 에서의 5초 측정 시간에 걸친 시간 대 임피던스의 플롯이다.
도 4 는 본 개시물의 일 실시형태에 따른 적용된 AC 여기 신호를 따르는 듀얼 매개 시스템에 대한 반응들의 시퀀스를 그래픽적으로 예시한 도면이다.
도 5 는 본 개시물의 일 실시형태에 따른 여러 글루코오스 농도에서의 10000Hz, 1000Hz, 562Hz, 316Hz, 177Hz, 100Hz, 46Hz, 21Hz, 10Hz 및 8Hz 의 주파수에서의 AC 응답의 Zre 대 Zim 의 나이퀴스트 플롯이다.
도 6 은 본 개시물의 일 실시형태에 따른 여러 글루코오스 농도에서의 10000Hz, 1000Hz, 562Hz, 316Hz, 177Hz, 100Hz, 46Hz, 21Hz, 10Hz 및 8Hz 의 주파수에서의 AC 응답의 Zre 및 Zim 대 주파수의 보드 플롯 (Bode plots) 이다.
도 7 은 본 개시물의 일 실시형태에 따른 AC 응답의 Zre 대 Zim 의 나이퀴스트 플롯이다.
도 8 은 본 개시물의 일 실시형태에 따른 임피던스 데이터를 피팅하는데 이용되는 등가 회로 모델의 블록도이다.
도 9 는 도 8 에 도시된 등가 회로 모델을 이용하여 임피던스 데이터를 피팅함으로써 획득된 등가 회로 값들을 그래픽적으로 예시한 도면이다.
도 10 은 본 개시물의 일 실시형태에 따른 AC 응답의 Zre 대 Zim 의 나이퀴스트 플롯이다.
도 11 은 도 8 에 도시된 등가 회로 모델을 이용하여 임피던스 데이터를 피팅함으로써 획득된 등가 회로 값들을 그래픽적으로 예시한 도면이다.
도 12 는 본 개시물의 일 실시형태에 따른 적용된 AC 여기 신호를 따르는 단일 매개 시스템에 대한 반응들의 시퀀스를 그래픽적으로 예시한 도면이다.
도 13 은 본 개시물의 일 실시형태에 따른 AC 응답의 Zre 대 Zim 의 나이퀴스트 플롯이다.1 is a graphical illustration of a dual-mediated system in accordance with an embodiment of the present disclosure.
2A is a Nyquist plot of Zre versus Zim of AC response at frequencies of 20480Hz, 10240Hz, 2048Hz, 1024Hz, 512Hz, 256Hz and 128Hz in accordance with an embodiment of the present disclosure.
Figure 2b illustrates the Zre of the AC response at frequencies of 20000 Hz, 10000 Hz, 2000 Hz, 1000 Hz, 512 Hz and 128 Hz for two different glucose concentrations in two different excitation modalities according to one embodiment of the disclosure. Vs. Zim's Nyquist plot.
Figure 3a is a plot of time versus impedance over a 5 second measurement time at 1024 Hz where a blood solution containing a glucose concentration of 150 mg / dl is dosed into a test strip according to one embodiment of the present disclosure.
Figure 3B is a plot of time versus impedance over a 5 second measurement time at 1024 Hz where a blood solution containing a glucose concentration of 120 mg / dl in accordance with one embodiment of the present disclosure is applied to a test strip.
4 is a graphical illustration of a sequence of responses to a dual-mediated system following an applied AC excitation signal in accordance with one embodiment of the present disclosure.
Figure 5 is a graph of the Nyquist plot of Zre versus Zim of the AC response at frequencies of 10000 Hz, 1000 Hz, 562 Hz, 316 Hz, 177 Hz, 100 Hz, 46 Hz, 21 Hz, 10 Hz and 8 Hz at various glucose concentrations according to an embodiment of the present disclosure to be.
Figure 6 is a plot of the Zre and Zim versus frequency of AC responses at frequencies of 10000 Hz, 1000 Hz, 562 Hz, 316 Hz, 177 Hz, 100 Hz, 46 Hz, 21 Hz, 10 Hz and 8 Hz at various glucose concentrations according to an embodiment of the present disclosure (Bode plots).
Figure 7 is a Nyquist plot of Zre versus Zim of the AC response in accordance with one embodiment of the present disclosure.
8 is a block diagram of an equivalent circuit model used to fit impedance data in accordance with one embodiment of the present disclosure.
9 is a graphical illustration of equivalent circuit values obtained by fitting impedance data using the equivalent circuit model shown in FIG.
10 is a Nyquist plot of Zre versus Zim of the AC response in accordance with one embodiment of the present disclosure.
11 is a graphical illustration of equivalent circuit values obtained by fitting impedance data using the equivalent circuit model shown in Fig.
Figure 12 is a graphical illustration of a sequence of responses to a single mediated system following an applied AC excitation signal in accordance with one embodiment of the present disclosure.
Figure 13 is a Nyquist plot of Zre versus Zim of the AC response in accordance with one embodiment of the present disclosure.
본 발명의 원리의 이해를 촉진할 목적으로, 이제 도면들에 예시된 실시형태들을 참조하게 될 것이며, 상기 실시형태들을 설명하는데 특정 용어가 사용될 것이다. 그럼에도 불구하고 그것에 의해 본 발명의 범위가 제한되는 것으로 의도되지 않는다는 것이 이해될 것이다. 본 발명과 관련되는 당업자에게 보통 발생할 수 있는 것으로서, 여기에 설명한 바와 같은 본 발명의 원리들의 임의의 추가 적용들, 및 설명된 실시형태들에서의 임의의 변경들 및 추가 변형들이 예상된다. 특히, 본 발명이 혈당 측정 방법의 관점에서 논의되지만, 본 발명이 다른 분석대상물들 및 다른 샘플 타입들을 측정하는 것이 예상된다. 이러한 대안의 실시형태들은 그 당업자에게 자명할 여기에 논의된 실시형태들에 대한 소정의 적응을 요구한다.For the purpose of promoting an understanding of the principles of the invention, reference will now be made to the embodiments illustrated in the drawings, and specific terminology will be used to describe the embodiments. It will nevertheless be understood that no limitation of the scope of the invention is thereby intended. Any additional applications of the principles of the invention as herein described, as well as any variations and further modifications in the described embodiments, are contemplated as would normally occur to those skilled in the art to which the invention relates. In particular, although the present invention is discussed in terms of blood glucose measurement methods, it is anticipated that the present invention will measure other analytes and other sample types. These alternative embodiments require some adaptation to the embodiments discussed herein that will be apparent to those skilled in the art.
이하 상세하게 설명되는 바와 같이, 저진폭 AC 파형이 바이오센서에서 체액 샘플에 적용되고, 임피던스 크기 (impedance magnitude), 위상각, 실수 또는 허수 임피던스, 또는 전기화학적 셀 특성들 또는 바이오센서에 상관되는 다른 저항 및 커패시턴스 항들 (terms) 이 측정된다. 적용된 파형의 선택은 관심 프로세스 (즉, 고속 프로세스 또는 저속 프로세스) 의 시간 상수에 의해 결정될 수도 있다. 그 후 측정된 가측치 (위상, 각도, 크기, 실수 또는 허수 임피던스) 는, 그들의 값들을 등가 회로를 이용하여 피팅함으로써 저항 및 정위상 (constant phase) 엘리먼트들로 컨버팅되고, 또한 샘플 글루코오스 농도, 헤마토크릿 (hematocrit), 및/또는 온도의 추정치를 제공하는데 이용될 수 있다. 일 예에서, 바이오센서는 비교적 낮은 적용된 전위차들에서의 선형 유도 전류 응답을 발생시키는 매개체 시스템을 포함한다. 적용된 AC 파형의 더 낮은 주파수들에서의 응답은 글루코오스 농도를 측정하는데 이용되고, 더 높은 주파수들에서의 응답은 온도 및 헤마토크릿의 효과를 검출하는데 이용된다.As will be described in greater detail below, a low amplitude AC waveform is applied to a bodily fluid sample in a biosensor, and the impedance magnitude, phase angle, real or imaginary impedance, or electrochemical cell characteristics or other The resistance and capacitance terms are measured. The selection of the applied waveform may be determined by the time constant of the process of interest (i. E., Fast process or slow process). The resulting measured values (phase, angle, magnitude, real or imaginary impedance) are then converted to resistive and constant phase elements by fitting their values using an equivalent circuit, and the sample glucose concentration, hematocrit hematocrit), and / or an estimate of the temperature. In one example, the biosensor includes an intermediary system that generates a linearly induced current response at relatively low applied potential differences. The response at lower frequencies of the applied AC waveform is used to measure the glucose concentration and the response at higher frequencies is used to detect the effect of temperature and hematocrit.
동작 시, 샘플이 바이오센서에서 검출되자마자, 저진폭 AC 여기 신호가 센서의 작업 전극과 상대 전극 사이의 전위차로서 적용된다. AC 여기 신호를 적용하는 상이한 모델리티들 (modalities) 이 예상된다. 일 경우에, AC 신호는 전체 테스트 시간에 걸쳐 연장되는 단일 주파수 파형으로서 적용될 수 있다. 적용된 AC 신호의 주파수는 1Hz 내지 20,000Hz 의 범위에서 선택될 수도 있다. 제 2 가능성은 고주파수로부터 저주파수로 스윕하거나 또는 저주파수로부터 고주파수로 스윕함으로써 다중 주파수들에서의 셀 임피던스를 측정하는 것이다. 게다가, AC 여기 신호는 또한 주파수들의 조합일 수도 있다 (즉, 6 개의 별개의 주파수들을 포함하는 파형). 일 가시적인 시나리오에서는, 시스템 임피던스의 상당한 변화 없음이 관찰될 때까지 주어진 주기 동안 (샘플 헤마토크릿 및/또는 온도에 민감한) 고주파수 AC 신호가 적용되며, 그 후 글루코오스 농도를 결정하기 위해 제 2 저주파수 AC 신호가 적용된다. 테스팅 시간을 줄이기 위해, 고주파수 신호와 저주파수 신호는 서로 중첩될 수 있다.In operation, as soon as the sample is detected at the biosensor, a low amplitude AC excitation signal is applied as a potential difference between the working electrode of the sensor and the counter electrode. Different modalities are expected to apply the AC excitation signal. , The AC signal can be applied as a single frequency waveform that extends over the entire test time. The frequency of the applied AC signal may be selected in the range of 1 Hz to 20,000 Hz. The second possibility is to measure the cell impedance at multiple frequencies by sweeping from a high frequency to a low frequency or by sweeping from a low frequency to a high frequency. In addition, the AC excitation signal may also be a combination of frequencies (i.e., a waveform comprising six distinct frequencies). In one visible scenario, a high frequency AC signal (sensitive to sample hematocrit and / or temperature) is applied for a given period until no significant change in system impedance is observed, and then a second low frequency AC signal Is applied. To reduce the testing time, the high frequency signal and the low frequency signal may overlap each other.
임피던스 데이터는 그것을 등가 회로 모델을 이용하여 피팅함으로써 프로세싱될 수 있다. 등가 회로의 선택은 실험 데이터에 대한 적합성 (fit) 의 퀄리티 (quality) 에 의해 결정된다. 이것은 유체 내 분석대상물의 정확한 측정을 용이하게 한다. 특히, 분석대상물의 측정은, 다르게는 에러를 야기할 간섭물들 (interferants) 의 존재에도 불구하고 정확하게 유지된다. 예를 들어, 이 기법을 이용하면, 혈당의 농도가 헤마토크릿 또는 샘플 온도의 변화에 의해 통상적으로 야기되는 에러 없이 측정된다. 혈당의 정확한 측정은 실명, 순환 장애, 및 당뇨병 환자의 혈당의 부적절한 조정으로 인한 다른 합병증의 예방에 매우 유용하다. 이 기법은 덜 복잡한 기기장치를 이용하여 보다 신속하게 측정되는 것을 허용하여, 당뇨병이 있는 사람이 그들의 혈당을 측정하기가 보다 편리해진다. 마찬가지로, 혈액, 소변, 또는 다른 생체액 (biological fluids) 내 다른 분석대상물들의 정확하고 신속한 측정이 다양한 질병의 개선된 진단 및 치료를 가능하게 한다.Impedance data can be processed by fitting it using an equivalent circuit model. The choice of the equivalent circuit is determined by the quality of the fit to the experimental data. This facilitates accurate measurement of the analyte in the fluid. In particular, the measurement of the analyte is accurately maintained despite the presence of interferents that otherwise would cause errors. For example, using this technique, the concentration of blood glucose is measured without errors that are typically caused by changes in hematocrit or sample temperature. Accurate measurement of blood glucose is very useful in preventing blindness, circulatory disturbances, and other complications due to improper adjustment of blood glucose in diabetic patients. This technique allows for more rapid measurement using less complex instrumentation, making it easier for people with diabetes to measure their blood sugar. Likewise, accurate and rapid measurement of other analytes in blood, urine, or other biological fluids enables improved diagnosis and treatment of various diseases.
글루코오스를 측정하기 위한 시스템의 맥락에서는, 전기화학적 혈당 계측기기는 통상적으로 (그러나 항상은 아님) 시약의 존재 시에 혈액 샘플의 전기화학적 응답을 측정한다는 것을 알게 될 것이다. 시약은 글루코오스와 반응하여 다르게는 혈액 내에 존재하지 않는 전하 캐리어 (charge carrier) 들을 생성한다. 그 결과, 주어진 신호의 존재 시에 혈액의 전기화학적 응답은 혈당의 농도에 주로 의존하는 것으로 의도된다. 그러나, 종속적으로는, 주어진 신호에 대한 혈액의 전기화학적 반응은 헤마토크릿 및 온도를 포함하는, 다른 인자들에 의존한다. 예를 들어, 미국 특허 제5,243,516호; 미국 특허 제5,288,636호; 미국 특허 제5,352,351호; 미국 특허 제5,385,846호; 미국 특허 제5,508,171호 및 미국 특허 제6,645,368호를 참조하며, 이들은 혈당의 측정에 대한 헤마토크릿의 교란 효과 (confounding effects) 를 논의하며, 이들은 여기에 완전히 참조로 통합된다. 또한, 예를 들어, 요산, 빌리루빈, 및 산소를 포함한 소정의 다른 화학물들이 혈액 샘플을 통한 전하 캐리어들의 이동에 영향을 줄 수 있으며, 이로써 글루코오스의 측정 시에 에러를 야기할 수 있다.In the context of a system for measuring glucose, it will be appreciated that an electrochemical blood glucose meter usually measures the electrochemical response of a blood sample in the presence of (but not always) a reagent. The reagent reacts with glucose to produce charge carriers that are otherwise not present in the blood. As a result, the electrochemical response of the blood in the presence of a given signal is intended to depend mainly on the concentration of blood glucose. Subsequently, however, the electrochemical response of the blood to a given signal depends on other factors, including hematocrit and temperature. See, for example, U.S. Patent Nos. 5,243,516; U.S. Patent No. 5,288,636; U.S. Patent No. 5,352,351; U.S. Patent No. 5,385,846; U.S. Patent No. 5,508,171 and U.S. Patent No. 6,645,368, which discuss confounding effects of hematocrit on the measurement of blood glucose, which are incorporated herein by reference in their entirety. In addition, certain other chemicals, including, for example, uric acid, bilirubin, and oxygen can affect the movement of charge carriers through the blood sample, thereby causing errors in the measurement of glucose.
여기에 개시된 여러 실시형태들은 교란 간섭물들 (그들은 헤마토크릿 및 온도 또는 다른 간섭물들) 에 대해 정정된 분석대상물 측정 (그것은 혈당 또는 다른 유체 샘플 분석대상물) 을 여전히 실시하면서 더 짧은 테스트 시간이 달성되는 것을 허용하는 방법들에 관한 것이다. 여기에 사용한 바와 같이, "테스트 시간" 은, 농도 결정 계산 시에 이용되는 마지막 측정의 취득을 위한 샘플에 제 1 전기 신호가 적용될 때 샘플 검출 (또는 샘플 도즈 충분성 (sample dose sufficiency), 양자가 검출된다면) 로부터의 시간으로서 정의된다. 여기에 사용한 바와 같이, 저전위 AC 여기는, 선형 응답을 발생시키기에 충분한 작업 전극과 상대 전극 간의 적용된 AC 전위차를 지칭한다. 일 실시형태에서는, 듀얼 매개체 시스템이 이용된다. 듀얼 매개체 시스템 및 글루코오스 특정 화학물질 (chemistry) 과 조합하여, 상기 개시된 방법은 조사된 샘플의 완전한 스펙트럼을 제공할 수 있다. 대안으로, 단일 매개체 시스템이 이용될 수도 있다.The various embodiments disclosed herein permit a shorter test time to be achieved while still performing a calibrated analyte measurement (that is, a blood glucose or other fluid sample analyte) against disturbance interferences (they are hematocrit and temperature or other interferences) And the like. As used herein, "test time" refers to a sample detection (or sample dose sufficiency) when the first electrical signal is applied to a sample for acquisition of the last measurement used in the concentration determination calculation, If so detected). As used herein, a low potential AC excitation refers to an applied AC potential difference between a working electrode and a counter electrode sufficient to generate a linear response. In one embodiment, a dual mediation system is used. In combination with a dual mediator system and glucose specific chemistry, the disclosed method can provide a complete spectrum of the irradiated sample. Alternatively, a single mediator system may be used.
이하 설명되는 선택된 실험에서는, Agilent 로부터의 VXI 컴포넌트들에 근거하여 구성되고, 요청된 조합들 및 시퀀스들 내의 센서들에 AC 전위들을 적용하고 그 센서들의 결과의 전류 응답들을 측정하도록 프로그램가능한 전기화학적 테스트 스탠드로 측정들이 수행되었다. 간편한 센서 레이아웃은 전기화학적 ACCU-CHEK® AVIVATM 혈당 스트립으로 나타내질 수 있으며, 이는 글루코오스 특정 화학물질로 코팅된 금 (gold) 작업 전극 및 상대 전극을 포함한다. 소정의 실시형태들에서, 이들 화학 시약들은, 구체적으로는 글루코오스를 산화시키고 금 전극들로의 전자 이동을 용이하게 할 수 있는 효소 및 매개체를 포함한다.In a selected experiment described below, a programmable electrochemical test, which is configured based on VXI components from Agilent and applied AC potentials to the sensors in the requested combinations and sequences and measures the current responses of the results of the sensors Measurements were performed with the stand. A simple sensor layout can be represented by an electrochemical ACCU-CHEK® AVIVA™ blood glucose strip, which includes a gold working electrode coated with a glucose-specific chemical and a counter electrode. In certain embodiments, these chemical reagents specifically include enzymes and mediators that can oxidize glucose and facilitate electron transfer to gold electrodes.
실험 중에, Microsoft® Excel® 을 이용한 분석을 위해 데이터가 전기화학적 분석기로부터 데스크탑 컴퓨터로 전송되었다. 다른 예들에서의 측정들은 적절한 주파수 응답 분석기 및 디지털 신호 취득 시스템을 가진 임의의 상업적으로 입수가능한 프로그램가능한 일정 전위기 (potentiostat) 에 의해 수행될 수 있다. 예를 들어, Gamry 및 CH Instruments 의 일정 전위기 및 멀티-채널 고속 테스트 스탠드가 이용될 수도 있다. 상업적 이용을 위해, 이 방법은 ACCU-CHEK® AVIVATM 혈당 계측기기와 같은 전용의 저가 핸드-헬드 측정 디바이스에서 수행될 수 있다. 이러한 경우에, 측정 파라미터들은 측정기기의 펌웨어에 포함되고/되거나 제공될 수도 있으며, 측정 시퀀스 및 데이터 평가는 사용자 상호작용 없이 자동적으로 실행된다.During the experiment, data was transferred from the electrochemical analyzer to the desktop computer for analysis using Microsoft® Excel®. Measurements in other examples may be performed by any commercially available programmable potentiostat with an appropriate frequency response analyzer and a digital signal acquisition system. For example, constant warping and multi-channel fast test stands of Gamry and CH Instruments may be used. For commercial use, this method can be performed in dedicated low-cost hand-held measurement devices such as the ACCU-CHEK® AVIVA™ blood glucose meter. In this case, the measurement parameters may be included and / or provided in the firmware of the measuring instrument, and the measurement sequence and data evaluation are performed automatically without user interaction.
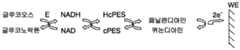
선택된 실시형태들에서, 매개체 시스템은 전자 셔틀 (shuttle)/매개체 쌍, 보조인자 (cofactor)/매개체 쌍, 또는 매개체1/매개체2 쌍 또는 이들의 다른 조합을 포함한다. 글루코오스의 존재 시에, 반응 시퀀스는 도 1 에 예시된 스킴에 의해 설명될 수 있다.In selected embodiments, the mediator system comprises an electronic shuttle / mediator pair, a cofactor / mediator pair, or a
도 1 에서, Ered 및 Eox 는, 구체적으로는 글루코오스를 산화시키는 효소들의 패밀리에서 선택된 효소의 환원 또는 산화된 형태들을 나타낸다 (예를 들어, GDH). Cofactorred 및 Cofactorox 는, 효소 활성 중심으로부터 매개체 시스템으로의 전자 이동을 용이하게 할 수 있는 보조인자의 환원 또는 산화된 형태들을 나타낸다 (예를 들어, NAD/NADH). Med1red, Med1ox, Med2red, 및 Med2ox 는, 전극들 투 (to) 다른 매개체 시스템으로의 전자 이동을 용이하게 하고 적용된 전위 하에서 재생성될 수 있으며, 고속 가역 산화환원 반응에 참여할 수 있는 화합물들의 패밀리에서 선택된, 매개체들의 환원 또는 산화된 형태들을 나타낸다 (예를 들어, 페나진 (phenazine), 퀴논 (quinones), 페리시안 화합물 (ferricyanide), 전이 금속 착물 (transitional metal complexes)). 도 1 에 도시된 화학물질을 이용함으로써, 글루코오스 농도는 전기화학적 스트립의 모세관 (capillary) 을 채우기에 충분한 양의 샘플의 적용 시에 액체 샘플 내에서 측정될 수 있다.In FIG. 1, Ered and Eox represent reduced or oxidized forms of the enzyme, specifically selected from the family of enzymes that oxidize glucose (for example, GDH). Cofactorred and Cofactorox represent reduced or oxidized forms of cofactors that can facilitate electron transfer from the enzyme active center to the mediator system (e.g., NAD / NADH). Med1red , Med1ox , Med2red , and Med2ox can facilitate the electron transfer to other mediator systems to the electrodes and can be regenerated under applied potentials, and the compounds capable of participating in the fast reversible redox reaction (E. G., Phenazine, quinones, ferricyanide, transitional metal complexes) of the intermediates selected in the family. By using the chemistry shown in Figure 1, the glucose concentration can be measured in a liquid sample upon application of a sufficient amount of sample to fill the capillary of the electrochemical strip.
테스팅은 글루코오스 용액 (수성 (aqueous), 혈액, 혈청) 으로 스트립을 도즈하는 것을 포함하였다. 일단 샘플이 검출되었다면, 저진폭 전위차 (12mV RMS 등) 의 AC 전위를 포함하는 여기 신호가 센서의 작업 전극에 적용되었다. AC 여기 신호의 적용에 대한 여러 모델리티들이 예상되어 있다. 일 실시형태에서, AC 여기 신호는 전체 테스트 시간 (예를 들어, 5초 이하) 에 걸쳐 또는 그의 일부 동안 연장되는 단일 주파수 파형으로서 적용된다. 적용된 AC 신호의 주파수는 20,000Hz 내지 1Hz 의 범위에서 선택된다. 추가 실시형태에서, 셀 임피던스는 상기 설명된 범위 중의 다중 주파수들에서 측정된다. 다중 주파수들은 고주파수로부터 저주파수로의 스윕 또는 저주파수로부터 고주파수로의 스윕으로서 적용될 수도 있다. 그 주파수들은 또한 테스트 시간을 따라 블록 단위로 그룹화될 수도 있다. 또 다른 실시형태에서, 여기 신호는 동시에 적용되도록 서로 중첩되는 별개의 주파수들의 조합이다. 예를 들어, 일 변화에서의 여기 신호는 6 개의 주파수들을 포함하는 파형을 포함한다. 다른 실시형태들에서, 파형은 더 적거나 더 많은 주파수들을 포함할 수도 있다.Testing included dosing the strip with a glucose solution (aqueous, blood, serum). Once the sample was detected, an excitation signal including the AC potential of a low amplitude potential difference (such as 12 mV RMS) was applied to the working electrode of the sensor. Several modelities for the application of the AC excitation signal are expected. In one embodiment, the AC excitation signal is applied as a single frequency waveform that extends over the entire test time (e.g., 5 seconds or less) or during a portion thereof. The frequency of the applied AC signal is selected in the range of 20,000 Hz to 1 Hz. In a further embodiment, the cell impedance is measured at multiple frequencies within the ranges described above. Multiple frequencies may be applied as a sweep from a high frequency to a low frequency or as a sweep from a low frequency to a high frequency. The frequencies may also be grouped in block units along the test time. In another embodiment, the excitation signal is a combination of distinct frequencies superimposed on each other to be applied simultaneously. For example, the excitation signal at one change includes a waveform comprising six frequencies. In other embodiments, the waveform may include fewer or more frequencies.
도 2a 는 572mg/dl 글루코오스를 함유하는 제어 용액 (control solution) 들로 ACCU-CHEK® AVIVATM 혈당 테스트 스트립들을 도즈함으로써 획득된 나이퀴스트 플롯이다. 적용된 AC 주파수들은 20480Hz, 10240Hz, 2048Hz, 1024Hz, 512Hz, 256Hz 및 128Hz 이었다. 도 2a 의 다이아몬드 형상의 포인트들은, AC 신호를 단일 주파수로서 적용하고 3 초에서의 데이터를 테스트로 분석함으로써 개개의 측정들로부터의 스펙트럼을 재구성함으로써 획득되었다. 정사각형 형상의 포인트들은, AC 신호를 20480Hz 로부터 1024Hz 로의 제 1 주파수 스윕으로서 적용한 후 주파수들 1024Hz 내지 128Hz 를 포함하는 제 2 블록으로서 적용함으로써 획득되었다.Figure 2a is a Nyquist plot obtained by dosing ACCU-CHEK® AVIVA™ blood glucose test strips with control solutions containing 572 mg / dl glucose. The applied AC frequencies were 20480 Hz, 10240 Hz, 2048 Hz, 1024 Hz, 512 Hz, 256 Hz and 128 Hz. The diamond shaped points in Figure 2a were obtained by applying the AC signal as a single frequency and reconstructing the spectrum from the individual measurements by analyzing the data at 3 seconds in a test. Square shaped points were obtained by applying the AC signal as a first frequency sweep from 20480 Hz to 1024 Hz and then applying it as a second block containing frequencies 1024 Hz to 128 Hz.
도 2b 는 57mg/dl 및 572mg/dl 글루코오스를 함유하는 제어 용액들로 ACCU-CHEK® AVIVATM 혈당 테스트 스트립들을 도즈함으로써 획득된 나이퀴스트 플롯이다. 도 2b 의 라인 2 ("Lin 2") 는 57mg/dl 글루코오스 용액에 대한 응답을 나타내고, 라인 6 ("Lin 6") 은 572mg/dl 용액에 대한 응답을 나타낸다. 적용된 AC 주파수들은 20000Hz, 10000Hz, 2000Hz, 1000Hz, 512Hz 및 128Hz 이었으며, 측정을 위해, 시약은 cPES/NA 화학물질을 포함하였다. 단일 주파수 또는 멀티-주파수 시퀀스를 이용하여 획득된 임피던스 응답의 비교가 도 2b 에 도시된다. 보여질 수 있는 바와 같이, 응답들은 단일 주파수나 다중 주파수들 중 어느 하나를 이용하여도 일반적으로 등가라는 것을 알게 되었다. 그 결과, 측정 시간은 주파수들 모두를 동시에 적용함으로써 감소될 수 있다는 것이 확인되었다.Figure 2b is a Nyquist plot obtained by dosing ACCU-CHEK® AVIVA™ blood glucose test strips with control solutions containing 57 mg / dl and 572 mg / dl glucose. Line 2 ("
시간에서의 임피던스 (impedance in time), 나이퀴스트 플롯, 및 보드 플롯과 같이, 시스템 응답이 나타내질 수도 있는 상이한 방법들이 존재한다는 것을 알아야 한다. 나이퀴스트 플롯, 이를 테면 도 2a 및 도 2b 는, 상이한 주파수들에서의 실수 및 허수 임피던스 컴포넌트들 (Zre 대 Zim) 을 디스플레이한다. 그래프의 형상은 반응 메커니즘, 용액 또는 전극 저항, 및 반응 속도 (reaction kinetics) 에 특정한 정보를 제공한다. 그러나, 이러한 타입의 표현이 가진 하나의 문제는, 그것이 명시적 주파수 정보를 포함하지 않는다는 것이다. 이 정보는 보드 플롯에서 보다 명백하며, 여기서 임피던스 크기 또는 위상각은 주파수의 로그 (logarithm) 에 대하여 플롯팅된다.It should be noted that there are different ways in which the system response may be represented, such as impedance in time, Nyquist plot, and board plot. The Nyquist plot, e.g., Figures 2a and 2b, displays the real and imaginary impedance components (Zre versus Zim) at different frequencies. The shape of the graph provides information specific to the reaction mechanism, solution or electrode resistance, and reaction kinetics. However, one problem with this type of representation is that it does not contain explicit frequency information. This information is more apparent in the board plot, where the impedance magnitude or phase angle is plotted against the logarithm of the frequency.
정확한 측정을 달성하기 위해, 시간의 경과에 따른 측정 시스템의 에볼루션이 이해될 필요가 있다. 그 측정 시스템의 에볼루션은 정확한 측정이 행해질 수 있는 때를 알기 위해 안정된 상태 (stable conditions) 가 발생하는 때를 알아보는데 도움이 된다. 예를 들면, 시스템 수화 필름 스웰링 (hydration film swelling) 이 중단되는 때를 이해하는데 유용하다. 이전에 언급한 바와 같이, 여기에 설명된 기법은 저주파수 AC 신호들로 글루코오스 레벨들을 측정하며, 고주파수 AC 신호들로 온도 및 헤마토크릿의 효과를 측정한다. 도 3a 는 일반적으로 시간의 경과에 따른 에볼루션을 헤마토크릿을 측정하는 것에 관하여 예시하며, 도 3b 는 일반적으로 이 에볼루션을 온도에 관하여 도시한다. 구체적으로, 도 3a 및 도 3b 는 1024Hz 에서의 5초 측정 시간에 걸친 AC 임피던스 응답을 플롯팅한다. 도 3a 에서, ACCU-CHEK® AVIVATM 혈당 테스트 스트립들은 20%, 45% 및 70% 헤마토크릿 레벨들을 가진 150mg/dl 글루코오스를 함유하는 혈액 용액들로 도즈되었다. 도 3b 의 경우, ACCU-CHEK® AVIVATM 혈당 테스트 스트립들은 4℃, 24℃ 및 40℃ 에서 1분 동안 평형을 유지한 후 공칭 헤마토크릿 및 120mg/dl 글루코오스를 함유하는 혈액 용액들로 도즈되었다. 일 접근법에 따르면, 헤마토크릿 및/또는 온도에 민감한 고주파수 AC 신호는 처음에, 시스템 임피던스의 상당한 변화가 없을 때까지 적용된다. 후에, 제 2 저주파수 AC 여기 신호가 적용된다. 이 여기 저주파수 AC 신호에 대한 응답은 샘플의 글루코오스 농도를 나타낸다. 일 예에서, 임피던스 데이터는 또한 등가 회로 모델을 이용하여 피팅함으로써 프로세싱된다. 등가 회로의 선택은 실험 데이터의 적합성의 퀄리티에 의해 결정된다. 게다가, 회로 내의 엘리먼트들의 타입 및 시퀀스가 측정 동안 발생하는 프로세스들 및 샘플 물리적 특성들과 관련된다.In order to achieve an accurate measurement, the evolution of the measurement system over time needs to be understood. The evolution of the measurement system helps to identify when stable conditions occur to know when an accurate measurement can be made. For example, it is useful to understand when the hydration film swelling of the system is interrupted. As previously mentioned, the technique described herein measures glucose levels with low frequency AC signals and measures the effect of temperature and hematocrit on high frequency AC signals. FIG. 3A illustrates an evolution over time generally with respect to measuring a hematocrit, and FIG. 3B generally illustrates this evolution with respect to temperature. Specifically, Figures 3A and 3B plot the AC impedance response over a 5 second measurement time at 1024 Hz. In FIG. 3A, ACCU-CHEK® AVIVA™ blood glucose test strips were dosed with blood solutions containing 150 mg / dl glucose with 20%, 45% and 70% hematocrit levels. In the case of FIG. 3B, ACCU-CHEK® AVIVA™ blood glucose test strips were equilibrated for 1 minute at 4 ° C., 24 ° C. and 40 ° C. and were dosed with blood solutions containing nominal hematocrit and 120 mg / dl glucose. According to one approach, the hematocrit and / or temperature sensitive high frequency AC signals are applied initially until there is no significant change in the system impedance. Later, a second low frequency AC excitation signal is applied. The response to this excitation low frequency AC signal represents the glucose concentration of the sample. In one example, the impedance data is also processed by fitting using an equivalent circuit model. The choice of the equivalent circuit is determined by the suitability of the experimental data. In addition, the types and sequences of elements in the circuit are related to the processes and sample physical properties that occur during the measurement.
이하 설명된 실시예들은, AC 여기에만 기초한 측정이 상이한 매개체 시스템들을 이용하여 수성 및 생체 샘플들의 글루코오스 농도를 결정하는데 이용되는 일부 특정 경우들을 포함한다.
The embodiments described below include some specific cases where measurements based on AC excitation are used to determine the glucose concentration of aqueous and biological samples using different media systems.
실시예 1 : 수용액에서의 글루코오스 농도의 측정Example 1: Measurement of Glucose Concentration in Aqueous Solution
실시예 1 의 목표는 액체 샘플에서의 글루코오스의 진단을 위한 관련 주파수 범위를 식별하는 것이었다. 이 실시예에 대해 이용된 글루코오스 테스트 스트립들은 도 1 에 예시된 스킴에 따라 반응하는 듀얼 매개체 시스템을 포함하였고, 이 특정 실시예의 경우에는 도 4 에 예시된 스킴을 상세화하였다. 제 1 매개체는 효소 보조인자 (NAD) 로부터 전자들을 받아들일 수 있는 치환된 페나진 (cPES) 이다. 이 매개체는 또한 고속 가역 반응에 참여하는 것이 가능하다. 이해되어야 하는 바와 같이, 이것은, 단지 저전위 AC 여기 신호만을 적용함으로써, 고주파수 측정과 연관된 시간 스케일들에서도, 매개체의 산화 및 환원된 형태 (cPES 대 HcPES) 간의 컨버전을 달성할 수 있고, 셀 임피던스의 대응 변화를 발생시킬 수 있다는 것을 의미한다. 제 2 매개체는 니트로소아닐린 (NA) 이며, 이는 효소 반응의 존재 시에, 퀴논디아민 형태로 컨버팅되고 적용된 전위 하에서 전극들을 금 전극들과 교환하는 것이 가능하다.The goal of Example 1 was to identify the relevant frequency range for the diagnosis of glucose in a liquid sample. The glucose test strips used for this example included a dual mediated system that responded in accordance with the scheme illustrated in FIG. 1, and in the case of this particular embodiment, the scheme illustrated in FIG. 4 was elaborated. The first mediator is a substituted phenazine (cPES) that can accept electrons from an enzyme cofactor (NAD). This mediator is also capable of participating in high-speed reversible reactions. As can be appreciated, this can achieve conversion between the oxidized and reduced form of the medium (cPES versus HcPES), even at time scales associated with high frequency measurements, by applying only a low potential AC excitation signal, It is possible to generate a corresponding change. The second mediator is nitrosoaniline (NA), which, in the presence of an enzymatic reaction, can be converted to quinonediamine form and exchange electrodes with gold electrodes under the applied potential.
실시예 1 은 2 개의 매개체 타입 시스템과 관련하여 설명되었지만, 다른 실시예들에서는 더 적거나 더 많은 매개체들 (예를 들어, 하나 또는 3 개의 매개체들) 이 이용될 수 있다는 것이 인식되어야 한다. 일반적으로, 선택된 매개체(들)는 고속, 가역, 저전위 전자 교환을 나타낸다. NA 를 제거함으로써, 화학물질 매트릭스가 단순화될 것이며, 전체 테스트 스트립 비용이 저감될 것이다. 그러나, NA 의 매개 시스템에의 포함은 양-전류측정 시스템 (bi-amperometric system) 에서의 전극 전위를 설정 및 유지할 뿐만 아니라 테스트될 수 있는 글루코오스 범위를 확대하는데 도움이 된다.It should be appreciated that although Example 1 has been described in terms of two mediation type systems, fewer or more medias (e.g., one or three medias) may be used in other embodiments. Generally, the selected mediator (s) exhibit high-speed, reversible, low-potential electron exchange. By eliminating NA, the chemical matrix will be simplified and the overall test strip cost will be reduced. However, inclusion of NA in the mediated system helps to establish and maintain the electrode potential in a bi-amperometric system as well as to widen the range of glucose that can be tested.
실시예 1 에 대해 수행된 테스팅은 다음의 단계들을 포함하였다.The testing performed for Example 1 included the following steps.
단계 1 : 전기화학적 스트립은 129 (lin 3), 524 (lin 5), 및 1000 (lin 1000) mg/dl 글루코오스를 함유하는 제어 용액으로 도즈되었다.Step 1: The electrochemical strip was dosed with a control solution containing 129 (lin 3), 524 (lin 5), and 1000 (lin 1000) mg / dl glucose.
단계 2 : 샘플이 검출되자마자, 12mV RMS 전위차 AC 신호가 스트립 상의 작업 전극과 상대 전극 사이에 적용되었다. AC 여기가 종래 방식에서, 고주파수로부터 저주파수로의 스윕으로서 적용되었다면, 예를 들어 20000Hz 내지 10Hz 의 주파수 범위를 커버하는데 필요한 측정 시간이 10초를 넘어설 것이다. 그러나, 이 시간 프레임에서 다른 프로세스들, 이를 테면 필름 수화 및 스웰링이 발생하였고, 임피던스 응답에 기여하였다. 효소 반응을 이러한 시간-의존 이벤트들과 분리하기 위하여, AC 신호는 5초의 주기 동안, 그리고 주어진 글루코오스 스트립에 대해 단일 주파수로서 적용되었다. 측정은 선택된 주파수 범위 내의 원하는 수의 주파수들에 대해 반복되었다. 그 후 나이퀴스트 및 보드 플롯들은 드롭 검출 후 주어진 시간 (예를 들어, 3초) 에서 개개의 측정들로부터의 임피던스를 고려함으로써 재구성된다.Step 2: Immediately upon detection of the sample, a 12mV RMS potential difference AC signal was applied between the working electrode and the counter electrode on the strip. If the AC excursion was applied as a sweep from high to low frequencies in a conventional manner, the measurement time required to cover the frequency range of, for example, 20000 Hz to 10 Hz would exceed 10 seconds. However, other processes, such as film hydration and swelling, occurred in this time frame and contributed to the impedance response. In order to separate the enzyme reaction from these time-dependent events, the AC signal was applied as a single frequency for a period of 5 seconds and for a given glucose strip. The measurements were repeated for the desired number of frequencies within the selected frequency range. Nyquist and board plots are then reconstructed by considering the impedance from the individual measurements at a given time (e.g., 3 seconds) after drop detection.
단계 3 : 적용된 AC 입력 하에서, 도 4 에 예시된 반응들의 시퀀스가 발생하였다.Step 3: Under the applied AC input, a sequence of the reactions illustrated in FIG. 4 occurred.
도 5 는 AC 측정 중의 3 초에서 129 (lin 3), 524 (lin 5), 및 1000 (lin 1000) mg/dl 글루코오스 제어 용액으로 도즈할 때 cPES/NA 화학물질에 대해 획득된 나이퀴스트 플롯을 예시한다. 적용된 AC 여기 신호는 10000Hz, 1000Hz, 562Hz, 316Hz, 177Hz, 100Hz, 46Hz, 21Hz, 10Hz 및 8Hz 를 가졌다. 2 개의 별개의 주파수 범위가 도 5 의 나이퀴스트 플롯에서 식별될 수 있다 : 1) 고주파수들에서, 키네틱 범위는 글루코오스 농도에 민감한 직경을 가진 오픈 세미서클 (open semicircle) 로 이루어진다; 2) 저주파수들에서, 확산 범위는 Zre 및 Zim 의 선형 상관으로 이루어진다.Figure 5 shows the Nyquist plot obtained for the cPES / NA chemistry when dosed with 129 (lin 3), 524 (lin 5), and 1000 (lin 1000) mg / . The applied AC excitation signals had 10000 Hz, 1000 Hz, 562 Hz, 316 Hz, 177 Hz, 100 Hz, 46 Hz, 21 Hz, 10 Hz and 8 Hz. Two distinct frequency ranges can be identified in the Nyquist plot of FIG. 5: 1) At high frequencies, the kinetic range consists of an open semicircle with a diameter sensitive to glucose concentration; 2) At low frequencies, the spread range consists of a linear correlation of Zre and Zim.
도 6 은 AC 측정 중의 3 초에서 129 (lin 3), 524 (lin 5), 및 1000 (lin 1000) mg/dl 글루코오스 제어 용액으로 도즈할 때 cPES/NA 화학물질에 대해 획득된 AC 응답의 Zre 및 Zim 대 주파수의 보드 플롯이다. 적용된 AC 여기 신호는 10000Hz, 1000Hz, 562Hz, 316Hz, 177Hz, 100Hz, 46Hz, 21Hz, 10Hz 및 8Hz 를 가졌다. 도 6 에 도시된 보드 플롯은, 글루코오스 검출에 대한 관련 주파수 범위가 1000Hz 내지 100Hz 인 것을 제안한다. 1000Hz 보다 더 높은 주파수들에서, 임피던스 데이터는 글루코오스 농도에 덜 민감하다. 또한, 100Hz 보다 더 낮은 주파수들에서, 증가된 측정 시간의 희생으로 글루코오스 도즈 응답에는 개선이 없다.
Figure 6 shows the Zre of AC response obtained for the cPES / NA chemistry when dosed with 129 (lin 3), 524 (lin 5), and 1000 (lin 1000) mg / And Zim versus frequency. The applied AC excitation signals had 10000 Hz, 1000 Hz, 562 Hz, 316 Hz, 177 Hz, 100 Hz, 46 Hz, 21 Hz, 10 Hz and 8 Hz. The board plot shown in Figure 6 suggests that the associated frequency range for glucose detection is 1000 Hz to 100 Hz. At frequencies higher than 1000Hz, the impedance data is less sensitive to glucose concentration. Also, at frequencies lower than 100 Hz, there is no improvement in the glucose dose response at the expense of increased measurement time.
실시예 2 : 가변 온도 및 헤마토크릿의 혈액 샘플들에서의 글루코오스 검출Example 2: Detection of Glucose in Blood Samples of Variable Temperature and Hematocrit
실시예 2 는 드롭 검출 후 5초 동안 20000Hz 내지 100Hz 를 커버하는 상이한 주파수들에서 단일 저진폭 (12mV RMS) 전위차 AC 여기 신호를 적용하는 것을 포함하였다. 단순화를 위해, 실시예 2 는 2 개의 파트들로 나뉘었다. 제 1 파트는 글루코오스 농도 및 헤마토크릿 효과를 조사하는데 초점을 두었다. 제 1 파트의 경우, 실온에서 조정된 20%, 45% 및 70% 의 타겟 헤마토크릿 값들 및 50mg/dl, 150mg/dl 및 500mg/dl 의 타겟 글루코오스 농도들을 이용하여 9 개의 용액들이 준비되었다. 제 2 파트는 헤마토크릿 및 온도 효과를 조사하는 것에만 초점을 두었다. 제 2 파트의 경우, 스트립들이 4℃, 24℃ 또는 40℃ 에서 평형을 유지한 후 측정된, 20%, 45% 또는 70% 의 헤마토크릿 값들 및 120mg/dl 의 혈당 농도를 함유하는 9 개의 용액들이 각각 준비되었다.
Example 2 included applying a single low amplitude (12mV RMS) potential difference AC excitation signal at different frequencies covering 20000Hz to 100Hz for 5 seconds after drop detection. For simplicity, Example 2 was divided into two parts. The first part focused on investigating the glucose concentration and the hematocrit effect. For the first part, nine solutions were prepared using target hematocrit values of 20%, 45% and 70% adjusted at room temperature and target glucose concentrations of 50 mg / dl, 150 mg / dl and 500 mg / dl. The second part focused exclusively on investigating the hematocrit and temperature effects. For the second part, nine solutions containing hematocrit values of 20%, 45% or 70% and 120 mg / dl, measured after the strips were equilibrated at 4 캜, 24 캜 or 40 캜 Each prepared.
실시예 2.1 : 글루코오스/헤마토크릿 연구Example 2.1: Glucose / hematocrit study
도 7 은 실온에서 조정된 20%, 45% 및 70% 로 조정된 헤마토크릿 및 50mg/dl, 150mg/dl 및 500mg/dl 글루코오스를 함유하는 혈액 용액들로 도즈할 때 cPES/NA 화학물질에 대해 획득된 9 개의 나이퀴스트 플롯을 포함한다. 나이퀴스트 플롯은, 헤마토크릿 및 글루코오스 농도의 영향이 대부분 Zre 축을 따르는 것을 제안한다.FIG. 7 is a graph showing the effect of cPES / NA chemistry on hematocrit adjusted to 20%, 45% and 70% adjusted at room temperature and blood doses containing 50 mg / dl, 150 mg / dl and 500 mg / dl glucose Lt; RTI ID = 0.0 > Nyquist plot < / RTI > The Nyquist plot suggests that the effects of hematocrit and glucose concentration are mostly along the Zre axis.
이 응답의 더 나은 이해를 얻기 위하여, 임피던스 데이터는 또한 도 8 의 등가 회로를 이용하여 피팅되었다. 등가 회로 내의 엘리먼트들은 다음의 것을 나타낸다 :To obtain a better understanding of this response, the impedance data was also fitted using the equivalent circuit of FIG. The elements in the equivalent circuit represent the following:
Rs : 용액 저항Rs : solution resistance
Rct : 전하 이동에 대한 저항 : 반응 속도의 측정치를 나타낸다 : 반응이 빠를수록 또는 표면 농도가 높을수록, Rct 는 작아진다.Rct : resistance to charge transfer: indicates the measurement of the reaction rate: the faster the reaction or the higher the surface concentration, the smaller the Rct .
CPEW : 확산 커패시턴스CPEW : Diffusion Capacitance
CPEdl : 비동종의 인터페이스에 대한 이중 레이어의 커패시턴스CPEdl : Dual layer capacitance for non-homogeneous interfaces
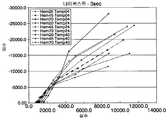
도 9 는 도 8 에 도시된 모델을 이용하여 임피던스 데이터를 피팅함으로써 획득된 등가 회로 엘리먼트 값들을 그래픽적으로 예시한다. 임피던스 데이터는 공지된 통계적 방법들 (이를 테면 카이-제곱 또는 제곱합 기법들, 그러나 이들은 2 가지 예들일 뿐이다) 은 물론 조사되는 시스템의 정보에 기초하여 등가 회로에 피팅된다. 상기 언급한 바와 같이, 등가 회로는 데이터를 해석 및 분석하기 더 쉽게 만든다. 추가적으로, 등가 회로 엘리먼트들은 주어진 주파수 범위에 걸친 정보를 포함한다. 그 결과, 각 엘리먼트는 단일 주파수 포인트보다 노이즈에 의해 덜 영향을 받을 수도 있다.FIG. 9 graphically illustrates equivalent circuit element values obtained by fitting the impedance data using the model shown in FIG. The impedance data is fitted to an equivalent circuit based on information of the system being examined, as well as known statistical methods (such as chi-square or square-sum techniques, but these are only two examples). As mentioned above, the equivalent circuit makes the data easier to interpret and analyze. Additionally, equivalent circuit elements include information over a given frequency range. As a result, each element may be less affected by noise than a single frequency point.
임피던스 데이터는, 20%, 45% 및 70% 로 조정된 헤마토크릿 및 50mg/dl, 150mg/dl 및 500mg/dl 글루코오스를 함유하는 혈액 용액들로 도즈할 때 cPES/NA 화학물질로부터 결정되었다. 도 9 를 분석한 후, 헤마토크릿 값이 저항 항들에 영향을 미쳐, 혈액 셀 함유량에 따라 저항의 증가를 나타내는 것이 명백해진다. 동시에, 높은 헤마토크릿은 글루코오스 확산에 대한 장애로서의 역할을 하여, 감소된 확산 커패시턴스를 발생시킨다.The impedance data was determined from cPES / NA chemicals when dosed with hematocrit adjusted to 20%, 45% and 70% and blood solutions containing 50 mg / dl, 150 mg / dl and 500 mg / dl glucose. After analyzing Figure 9, it is clear that the hematocrit value affects the resistance terms and shows an increase in resistance depending on the blood cell content. At the same time, the high hematocrit serves as a barrier to glucose diffusion, resulting in a reduced diffusion capacitance.
글루코오스 도즈는 Rct 및 CPEW 엘리먼트들을 따라 보여질 수 있지만, Rs 및 CPEdl 항들에 영향을 미치지 않는다. 이런 시스템의 경우, Rs 는 글루코오스 농도에 관계없이 샘플 헤마토크릿의 측정치를 제공한다.
Glucose dose can be seen along Rct and CPEW elements, but does not affect Rs and CPEdl terms. For such a system, Rs provides a measure of the sample hematocrit regardless of the glucose concentration.
실시예 2.2 : 헤마토크릿/온도 연구Example 2.2: Hematocrit / temperature study
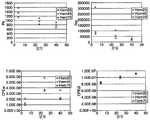
유사한 분석이 실시예 2.2 를 위해 수행되었다. 도 10 은 4℃, 24℃ 또는 40℃ 에서 1분 동안 평형을 유지한 후 20%, 45% 또는 70% 로 조정된 헤마토크릿, 및 120mg/dl 글루코오스를 함유하는 혈액 용액들로 도즈할 때 cPES/NA 화학물질에 대해 획득된 9 개의 나이퀴스트 플롯을 포함한다.A similar assay was performed for Example 2.2. Figure 10 shows that when dosed with hematocrit adjusted to 20%, 45% or 70% and blood solutions containing 120 mg / dl glucose after 1 minute equilibration at 4, 24 or 40 ° C, cPES / Includes nine Nyquist plots obtained for NA chemicals.
도 10 에 도시된 임피던스 데이터는 등가 회로 엘리먼트들에 대한 일정한 글루코오스 농도에서의 헤마토크릿 및 온도의 영향을 결정하기 위해 상기 설명한 바와 같은 모델을 이용하여 피팅되었다. 알고리즘 적합성의 결과는 도 11 에 도시된다. 용액 저항 (글루코오스 독립 항) 및 전하 이동 저항 값들이 온도의 증가에 따라 감소되었고, 이는 헤마토크릿과 비교하여 반대의 트렌드 (reversed trend) 를 따른다는 것이 중요하다. 이중 레이어 커패시턴스는 샘플 온도의 변화에 민감하다. 따라서, 그것은 헤마토크릿 및 글루코오스 농도에 관계없이 반응 영역의 온도의 측정치를 제공한다.
The impedance data shown in FIG. 10 was fitted using a model as described above to determine the effect of hematocrit and temperature at a constant glucose concentration on equivalent circuit elements. The results of the algorithm suitability are shown in Fig. It is important that the solution resistance (glucose independent term) and charge transfer resistance values decrease with increasing temperature, which is inversely trended compared to hematocrit. The double-layer capacitance is sensitive to changes in the sample temperature. Thus, it provides a measure of the temperature of the reaction zone regardless of hematocrit and glucose concentration.
실시예 3 : 새로운 매개체 시스템을 이용한 글루코오스 검출Example 3: Detection of Glucose using a New Mediator System
상기 실시예들에서 제시된 글루코오스 검출은 전극 표면에 전자들을 추가 전달할 수 있을 뿐만 아니라 글루코오스 농도에 비례하는 셀 임피던스의 변화를 야기할 수 있는 2 개의 매개체들과 커플링된 특정 효소 반응에 기초하였다. 화학물질은 또한 매개체들 중 하나를 제거함으로써 단순화될 수 있다. 이 경우에, 도 4 에 도시된 반응 스킴은 도 12 에 예시된 스킴으로 바뀔 것이다.The glucose detection presented in the above examples was based on a specific enzyme reaction coupled with two mediators capable of further transferring electrons to the electrode surface as well as causing a change in cell impedance proportional to the glucose concentration. The chemical may also be simplified by removing one of the mediators. In this case, the reaction scheme shown in Fig. 4 will be replaced by the scheme illustrated in Fig.
적용된 AC 신호 하에서, 효소 반응의 결과로서 매개체 산화 상태의 변화가 모니터링될 수 있다. 도 13 은 글루코오스 없음, 57mg/dl, 572mg/dl 및 1200mg/dl 글루코오스 농도를 함유하는 용액들로 도즈할 때 cPES 화학물질 기반 스트립에 대해 획득된 나이퀴스트 플롯을 예시한다. 테스트된 주파수들은 20000Hz, 10000Hz, 2000Hz 및 1000Hz 이었다. 그 주파수들은 고주파수로부터 저주파수로의 스윕으로서 적용되었고, 이로써 측정 시간을 3초 아래로 감소시켰다. 실시예 3 의 결과는, 글루코오스 농도가 대부분 2000Hz 및 1000Hz 에서의 임피던스에 영향을 준다는 것을 나타낸다.Under applied AC signals, changes in the mediated oxidation state as a result of the enzymatic reaction can be monitored. Figure 13 illustrates the Nyquist plot obtained for cPES chemical-based strips when dosed with solutions containing no glucose, 57 mg / dl, 572 mg / dl and 1200 mg / dl glucose concentrations. The frequencies tested were 20000 Hz, 10000 Hz, 2000 Hz and 1000 Hz. The frequencies were applied as a sweep from high to low frequency, thereby reducing the measurement time to three seconds or less. The results of Example 3 indicate that the glucose concentration mostly affects the impedance at 2000 Hz and 1000 Hz.
적용된 신호의 주파수의 적절한 선택에 의해, AC-기반 측정은 분석될 샘플의 완전한 스펙트럼을 제공할 수 있다.By appropriate selection of the frequency of the applied signal, the AC-based measurement can provide a complete spectrum of the sample to be analyzed.
그 후, 결과의 샘플 응답이 측정될 수 있고, 각각의 여기 주파수 컴포넌트로부터의 기여가 이산 푸리에 변환 (DFT) 과 같은 푸리에 변환 기법들의 이용에 의해 추정될 수 있다. 여기에 개시된 여러 실시예들은 멀티-사인 여기 파형들을 이용하지만, 당업자는, 멀티-주파수 파형이 몇가지만 제한이 아닌 예를 들자면, 삼각형, 정사각형, 톱니, 델타 등과 같은 임의의 원하는 형상을 갖는 개개의 파형들을 이용하여 구성될 수도 있다는 것을 인식할 것이다. 멀티-주파수 파형을 생성하는데 이용되는 컴포넌트 AC 파형들은 각각 임의의 원하는 주파수 및 임의의 원하는 진폭을 가질 수도 있다. 멀티-주파수 기법들의 이용은 (순차적이라기 보다는 동시에 AC 측정들이 행해지기 때문에) 원하는 데이터를 수집하는데 필요한 시간을 단축시킬 뿐만 아니라, 각 적용된 주파수에 대응하는 데이터 수집 동안 샘플이 덜 변하기 때문에 정정의 경우 더 많이 상관된다.The resulting sample response can then be measured and the contribution from each excitation frequency component can be estimated by using Fourier transform techniques such as discrete Fourier transform (DFT). While the various embodiments disclosed herein utilize multi-sine excitation waveforms, those skilled in the art will appreciate that the multi-frequency waveform may be of any desired shape, including but not limited to triangular, square, sawtooth, delta, It will be appreciated that they may be constructed using waveforms. The component AC waveforms used to generate the multi-frequency waveform may each have any desired frequency and any desired amplitude. The use of multi-frequency techniques not only shortens the time required to acquire the desired data (since AC measurements are made at the same time rather than sequential), but also reduces the time required for the correction It is much correlated.
본 발명은 도면들 및 전술한 설명에서 상세하게 예시 및 설명되었지만, 동일한 것이 특성상 제한이 아닌 예시인 것으로 간주될 것이며, 단지 바람직한 실시형태만이 도시 및 설명되었고 다음의 청구항들에 의해 정의된 본 발명의 사상의 범위 안에 드는 모든 변화물들, 등가물들, 및 변형물들이 보호되는 것이 바람직하다는 것이 이해된다. 본 명세서에서 인용된 모든 공개물들, 특허들 및 특허 출원들은, 마치 각 개개의 공보, 특허 또는 특허 출원이 참조로 통합되고 여기에 완전히 기술되는 것으로 구체적으로 그리고 개별적으로 나타내진 것처럼, 여기에 참조로 통합된다.While the invention has been illustrated and described in detail in the drawings and foregoing description, it is to be understood that the same is by way of illustration only and is not to be taken by way of example, and that only the preferred embodiments are shown and described, It is understood that all changes, equivalents, and modifications that fall within the scope of the present invention are desirably protected. All publications, patents, and patent applications cited herein are hereby incorporated by reference in their entirety for all purposes to the same extent as if each individual publication, patent or patent application was specifically and individually indicated to be incorporated by reference and fully described herein. .
Claims (19)
Translated fromKorean상기 방법은,
최대 12 mV RMS (Root Mean Square) 의 낮은 전위차에서 선형 유도 전류 응답 (linear faradic response) 을 발생시키고, 페나진 (phenazine), 퀴논 (quinones), 페리시안 화합물 (ferricyanide) 및 전이 금속 착물 (transitional metal complexes) 로 구성된 그룹으로부터 선택된 매개체를 포함하는 매개체 시스템을 전기화학적 테스트 스트립에 제공하는 단계;
상기 매개체 시스템에, 상기 테스트 스트립의 전극들과 접촉하여 상기 혈액 샘플을 도입하는 단계;
상기 혈액 샘플을 통해, 그리고 상기 테스트 스트립의 전극들 간의 전위차로서 교류 여기 신호를 적용하는 단계로서, 상기 교류 여기 신호는 다중의 최대 12 mV RMS 의 낮은 전위이고 2,000 Hz 보다 낮은 저주파수 신호들, 및 최대 12 mV RMS 의 낮은 전위이고 2,000 Hz 보다 높은 고주파수 신호를 포함하는, 상기 교류 여기 신호를 적용하는 단계; 및
상기 혈액 샘플의 상기 글루코오스 농도를 결정하는 단계를 포함하며,
상기 글루코오스 농도를 결정하는 단계는,
상기 저주파수 신호들에 대한 저주파수 응답을 측정하는 단계,
상기 고주파수 신호에 대한 고주파수 응답을 측정하는 단계,
상기 저주파수 응답에 기초하여 상기 혈액 샘플의 추정된 글루코오스 농도를 획득하는 단계, 및
상기 고주파수 응답에 기초하여 하나 이상의 에러 유발 변수들에 대해 상기 혈액 샘플의 상기 추정된 글루코오스 농도를 정정하는 단계를 포함하며,
상기 방법은, 상기 저주파수 신호들 및 상기 고주파수 신호를 중첩하여 상기 교류 여기 신호를 생성하는 단계를 더 포함하는, 혈액 샘플에서 글루코오스 농도를 결정하기 위한 방법.A method for determining glucose concentration in a blood sample,
The method comprises:
It generates a linear faradic response at a low potential difference of up to 12 mV RMS (Root Mean Square), and generates phenazine, quinones, ferricyanide, and transitional metal complexes; providing to the electrochemical test strip an intermediate system comprising an agent selected from the group consisting of:
Introducing into the media system the blood sample in contact with the electrodes of the test strip;
Applying an AC excitation signal across the blood sample and as a potential difference between the electrodes of the test strip, the AC excitation signal comprising a plurality of low potentials of up to 12 mV RMS and lower frequency signals of less than 2,000 Hz, Applying the alternating excitation signal comprising a low potential of 12 mV RMS and a high frequency signal higher than 2,000 Hz; And
Determining the glucose concentration of the blood sample,
Wherein the step of determining the glucose concentration comprises:
Measuring a low frequency response to the low frequency signals,
Measuring a high frequency response for the high frequency signal,
Obtaining an estimated glucose concentration of the blood sample based on the low frequency response, and
Correcting the estimated glucose concentration of the blood sample for one or more error inducing parameters based on the high frequency response,
The method further comprising: superimposing the low frequency signals and the high frequency signal to generate the alternating excitation signal.
상기 하나 이상의 에러 유발 변수들은 헤마토크릿 (hematocrit) 및/또는 온도를 포함하며;
상기 글루코오스 농도를 정정하는 단계는, 상기 고주파수 응답에 기초하여 상기 헤마토크릿 및/또는 상기 온도에 대해 정정하는 단계를 포함하는, 혈액 샘플에서 글루코오스 농도를 결정하기 위한 방법.The method according to claim 1,
Wherein the one or more error inducing parameters include hematocrit and / or temperature;
Wherein correcting the glucose concentration comprises correcting for the hematocrit and / or the temperature based on the high frequency response.
상기 고주파수 신호 및 상기 저주파수 신호들은 동일한 진폭을 갖는, 혈액 샘플에서 글루코오스 농도를 결정하기 위한 방법.3. The method according to claim 1 or 2,
Wherein the high frequency signal and the low frequency signals have the same amplitude.
일 변화에서의 상기 교류 여기 신호는 적어도 6 개의 주파수들을 포함하는 파형을 포함하는, 혈액 샘플에서 글루코오스 농도를 결정하기 위한 방법.3. The method according to claim 1 or 2,
Wherein the alternating excitation signal in a day change comprises a waveform comprising at least six frequencies.
상기 글루코오스 농도를 결정하는 단계는, 상기 고주파수 신호로부터 상기 저주파수 신호들로 스윕 (sweep) 함으로써 또는 상기 저주파수 신호들로부터 상기 고주파수 신호로 스윕함으로써 다중 주파수들에서의 셀 임피던스를 측정하는 단계를 포함하는, 혈액 샘플에서 글루코오스 농도를 결정하기 위한 방법.3. The method according to claim 1 or 2,
Wherein determining the glucose concentration comprises measuring cell impedance at multiple frequencies by sweeping from the high frequency signal to the low frequency signals or by sweeping from the low frequency signals to the high frequency signal. A method for determining glucose concentration in a blood sample.
상기 방법은,
최대 12 mV RMS (Root Mean Square) 의 낮은 전위차에서 선형 유도 전류 응답 (linear faradic response) 을 발생시키고, 페나진 (phenazine), 퀴논 (quinones), 페리시안 화합물 (ferricyanide) 및 전이 금속 착물 (transitional metal complexes) 로 구성된 그룹으로부터 선택된 매개체를 포함하는 매개체 시스템을 전기화학적 테스트 스트립에 제공하는 단계;
상기 매개체 시스템에, 상기 테스트 스트립의 전극들과 접촉하여 상기 혈액샘플을 도입하는 단계;
상기 혈액 샘플을 통해, 그리고 상기 테스트 스트립의 전극들 간의 전위차로서 교류 여기 신호를 적용하는 단계로서, 상기 교류 여기 신호는 다중의 최대 12 mV RMS 의 낮은 전위이고 2,000 Hz 보다 낮은 저주파수 신호들, 및 최대 12 mV RMS 의 낮은 전위이고 2,000 Hz 보다 높은 고주파수 신호를 포함하는, 상기 교류 여기 신호를 적용하는 단계; 및
상기 혈액 샘플의 상기 글루코오스 농도를 결정하는 단계를 포함하며,
상기 글루코오스 농도를 결정하는 단계는,
상기 저주파수 신호들에 대한 저주파수 응답을 측정하는 단계,
상기 고주파수 신호에 대한 고주파수 응답을 측정하는 단계,
상기 저주파수 응답에 기초하여 상기 혈액 샘플의 추정된 글루코오스 농도를 획득하는 단계, 및
상기 고주파수 응답에 기초하여 하나 이상의 에러 유발 변수들에 대해 상기 혈액 샘플의 상기 추정된 글루코오스 농도를 정정하는 단계를 포함하며,
상기 글루코오스 농도를 결정하는 단계는,
상기 고주파수 응답에서 임피던스의 소정의 변화 없음이 관찰될 때까지 상기 고주파수 신호를 적용하는 단계;
상기 고주파수 응답의 상기 임피던스의 소정의 변화 없음을 관찰하는 단계; 및
상기 고주파수 응답의 상기 임피던스의 소정의 변화 없음을 관찰한 후에 상기 저주파수 신호들을 적용하는 단계를 포함하는, 혈액 샘플에서 글루코오스 농도를 결정하기 위한 방법.A method for determining glucose concentration in a blood sample,
The method comprises:
It generates a linear faradic response at a low potential difference of up to 12 mV RMS (Root Mean Square), and generates phenazine, quinones, ferricyanide, and transitional metal complexes; providing to the electrochemical test strip an intermediate system comprising an agent selected from the group consisting of:
Introducing into the media system the blood sample in contact with the electrodes of the test strip;
Applying an AC excitation signal across the blood sample and as a potential difference between the electrodes of the test strip, the AC excitation signal comprising a plurality of low potentials of up to 12 mV RMS and lower frequency signals of less than 2,000 Hz, Applying the alternating excitation signal comprising a low potential of 12 mV RMS and a high frequency signal higher than 2,000 Hz; And
Determining the glucose concentration of the blood sample,
Wherein the step of determining the glucose concentration comprises:
Measuring a low frequency response to the low frequency signals,
Measuring a high frequency response for the high frequency signal,
Obtaining an estimated glucose concentration of the blood sample based on the low frequency response, and
Correcting the estimated glucose concentration of the blood sample for one or more error inducing parameters based on the high frequency response,
Wherein the step of determining the glucose concentration comprises:
Applying said high frequency signal until no predetermined change in impedance is observed in said high frequency response;
Observing no change in said impedance of said high frequency response; And
And applying said low frequency signals after observing no change in said impedance of said high frequency response. ≪ Desc / Clms Page number 20 >
상기 고주파수 신호는 최소 2000Hz 인, 혈액 샘플에서 글루코오스 농도를 결정하기 위한 방법.The method according to claim 1, 2, or 6,
Wherein the high frequency signal is at least 2000 Hz.
상기 저주파수 응답을 측정하는 단계 또는 상기 고주파수 응답을 측정하는 단계는, 위상각, 크기 (magnitude), 저항, 커패시턴스 및 임피던스 중 적어도 하나를 측정하는 단계를 포함하는, 혈액 샘플에서 글루코오스 농도를 결정하기 위한 방법.The method according to claim 1, 2, or 6,
Wherein measuring the low frequency response or measuring the high frequency response comprises measuring at least one of a phase angle, a magnitude, a resistance, a capacitance, and an impedance to determine a glucose concentration in a blood sample Way.
상기 글루코오스 농도를 결정하는 단계는, 상기 저주파수 응답 및 상기 고주파수 응답을 등가 회로에 피팅하는 단계를 포함하는, 혈액 샘플에서 글루코오스 농도를 결정하기 위한 방법.The method according to claim 1, 2, or 6,
Wherein the step of determining the glucose concentration comprises fitting the low frequency response and the high frequency response to an equivalent circuit.
상기 매개체 시스템은 단일 매개체 타입 시스템 또는 듀얼 매개체 타입 시스템을 포함하는, 혈액 샘플에서 글루코오스 농도를 결정하기 위한 방법.The method according to claim 1, 2, or 6,
Wherein the mediator system comprises a single mediator type system or a dual mediator type system.
상기 적용하는 단계 및 상기 결정하는 단계는, 다중 AC 주파수들에서의 측정들을 포함하는 측정 시퀀스를 이용하는 단계를 포함하는, 혈액 샘플에서 글루코오스 농도를 결정하기 위한 방법.The method according to claim 1, 2, or 6,
Wherein the applying and determining comprises using a measurement sequence comprising measurements at multiple AC frequencies. ≪ Desc / Clms Page number 19 >
상기 측정 시퀀스를 이용하는 단계는, 상기 다중 AC 주파수들을 동시에 적용하는 단계를 포함하는, 혈액 샘플에서 글루코오스 농도를 결정하기 위한 방법.15. The method of claim 14,
Wherein the step of using the measurement sequence comprises concurrently applying the multiple AC frequencies.
상기 측정 시퀀스를 이용하는 단계는, 다중 주파수 블록들을 가진 상기 다중 AC 주파수들을 순차적으로 적용하는 단계를 포함하는, 혈액 샘플에서 글루코오스 농도를 결정하기 위한 방법.15. The method of claim 14,
Wherein the step of using the measurement sequence comprises sequentially applying the multiple AC frequencies with multiple frequency blocks.
상기 글루코오스 농도를 결정하는 단계는, 다중 주파수들의 모델-기반 데이터 평가를 이용하는 단계를 포함하며,
상기 글루코오스 농도 및 상기 하나 이상의 에러 유발 변수들을 추정하기 위해 모델 컴포넌트들이 이용되는, 혈액 샘플에서 글루코오스 농도를 결정하기 위한 방법.The method according to claim 1, 2, or 6,
Wherein determining the glucose concentration comprises using a model-based data evaluation of multiple frequencies,
Wherein the model components are used to estimate the glucose concentration and the one or more error inducing parameters.
Applications Claiming Priority (3)
| Application Number | Priority Date | Filing Date | Title |
|---|---|---|---|
| US12/684,277 | 2010-01-08 | ||
| US12/684,277US20110168575A1 (en) | 2010-01-08 | 2010-01-08 | Sample characterization based on ac measurement methods |
| PCT/EP2010/007990WO2011082820A1 (en) | 2010-01-08 | 2010-12-30 | Sample characterization based on ac measurement methods |
Publications (2)
| Publication Number | Publication Date |
|---|---|
| KR20120102749A KR20120102749A (en) | 2012-09-18 |
| KR101423851B1true KR101423851B1 (en) | 2014-07-25 |
Family
ID=43640210
Family Applications (1)
| Application Number | Title | Priority Date | Filing Date |
|---|---|---|---|
| KR1020127017600AExpired - Fee RelatedKR101423851B1 (en) | 2010-01-08 | 2010-12-30 | Sample characterization based on ac measurement methods |
Country Status (7)
| Country | Link |
|---|---|
| US (1) | US20110168575A1 (en) |
| EP (1) | EP2521912B1 (en) |
| JP (1) | JP5597262B2 (en) |
| KR (1) | KR101423851B1 (en) |
| CN (1) | CN102687008B (en) |
| CA (1) | CA2785704C (en) |
| WO (1) | WO2011082820A1 (en) |
Cited By (1)
| Publication number | Priority date | Publication date | Assignee | Title |
|---|---|---|---|---|
| US10966689B2 (en) | 2016-05-09 | 2021-04-06 | Samsung Electronics Co., Ltd. | Method and apparatus for predicting concentration of analyte |
Families Citing this family (22)
| Publication number | Priority date | Publication date | Assignee | Title |
|---|---|---|---|---|
| EP2392921B1 (en) | 2009-01-30 | 2018-11-14 | PHC Holdings Corporation | Method for measuring temperature of biological sample, method for measuring concentration of biological sample and biosensor system |
| GB201005359D0 (en) | 2010-03-30 | 2010-05-12 | Menai Medical Technologies Ltd | Sampling plate |
| GB201005357D0 (en) | 2010-03-30 | 2010-05-12 | Menai Medical Technologies Ltd | Sampling plate |
| WO2013030375A1 (en)* | 2011-09-02 | 2013-03-07 | Lifescan Scotland Limited | Hematocrit Corrected Glucose Measurements for Electrochemical Test Strip Using Time Differential of the Signals |
| WO2013030369A1 (en)* | 2011-09-02 | 2013-03-07 | Lifescan Scotland Limited | Hematocrit corrected glucose measurements using phase angles and impedance for electrochemical test strip |
| US9903830B2 (en) | 2011-12-29 | 2018-02-27 | Lifescan Scotland Limited | Accurate analyte measurements for electrochemical test strip based on sensed physical characteristic(s) of the sample containing the analyte |
| GB2501128B (en)* | 2012-04-13 | 2017-11-29 | Tape Specialities Ltd | Sampling Apparatus and Method for Sampling |
| GB2551943B (en) | 2012-04-13 | 2018-08-01 | Smartcare Tech Limited | Improvements in and relating to sample measurement |
| US9632060B2 (en) | 2012-06-08 | 2017-04-25 | Medtronic Minimed, Inc. | Application of electrochemical impedance spectroscopy in sensor systems, devices, and related methods |
| KR20160009619A (en)* | 2013-06-10 | 2016-01-26 | 에프. 호프만-라 로슈 아게 | Method and system for detecting an analyte in a body fluid |
| US9459231B2 (en) | 2013-08-29 | 2016-10-04 | Lifescan Scotland Limited | Method and system to determine erroneous measurement signals during a test measurement sequence |
| US9243276B2 (en) | 2013-08-29 | 2016-01-26 | Lifescan Scotland Limited | Method and system to determine hematocrit-insensitive glucose values in a fluid sample |
| US10638947B2 (en) | 2013-12-16 | 2020-05-05 | Medtronic Minimed, Inc. | Use of electrochemical impedance spectroscopy (EIS) in intelligent diagnostics |
| GB2521481B (en)* | 2013-12-23 | 2016-05-25 | Lifescan Scotland Ltd | Hand-held test meter with an operating range test strip simulation circuit block |
| CA2947000C (en)* | 2014-05-23 | 2018-12-11 | Nova Biomedical Corporation | Hemolysis detection method and system |
| KR20160014212A (en)* | 2014-07-28 | 2016-02-11 | 주식회사 아이센스 | Portable Blood Glucose Tester |
| GB201419472D0 (en) | 2014-10-31 | 2014-12-17 | Inside Biometrics Ltd | Method of using and electrochemical device |
| GB2533418A (en)* | 2014-12-19 | 2016-06-22 | Salunda Ltd | Measurement of sugar in solution |
| JP6876920B2 (en)* | 2015-02-20 | 2021-05-26 | ソニーグループ株式会社 | An electrical characteristic measuring device, an electrical characteristic measuring system, an electrical characteristic measuring method, and an electrical characteristic measuring program for realizing the method in a computer. |
| MX2019013197A (en)* | 2017-05-05 | 2020-01-21 | Trividia Health Inc | Methods and systems for hematocrit measurement. |
| WO2019077099A1 (en) | 2017-10-19 | 2019-04-25 | Sanofi | Analyte measurement device |
| US11666253B2 (en)* | 2019-02-22 | 2023-06-06 | Ascensia Diabetes Care Holdings Ag | Methods and apparatus for analyte concentration monitoring using harmonic relationships |
Citations (2)
| Publication number | Priority date | Publication date | Assignee | Title |
|---|---|---|---|---|
| US20040256248A1 (en) | 2003-06-20 | 2004-12-23 | Burke David W. | System and method for analyte measurement using dose sufficiency electrodes |
| US20070264721A1 (en) | 2003-10-17 | 2007-11-15 | Buck Harvey B | System and method for analyte measurement using a nonlinear sample response |
Family Cites Families (35)
| Publication number | Priority date | Publication date | Assignee | Title |
|---|---|---|---|---|
| US4008448A (en)* | 1975-10-03 | 1977-02-15 | Polaroid Corporation | Solenoid with selectively arrestible plunger movement |
| US4233029A (en)* | 1978-10-25 | 1980-11-11 | Eastman Kodak Company | Liquid transport device and method |
| US4225410A (en)* | 1978-12-04 | 1980-09-30 | Technicon Instruments Corporation | Integrated array of electrochemical sensors |
| US4323536A (en)* | 1980-02-06 | 1982-04-06 | Eastman Kodak Company | Multi-analyte test device |
| DE3228542A1 (en)* | 1982-07-30 | 1984-02-02 | Siemens AG, 1000 Berlin und 8000 München | METHOD FOR DETERMINING THE CONCENTRATION OF ELECTROCHEMICALLY IMPLEMENTABLE SUBSTANCES |
| US5509410A (en)* | 1983-06-06 | 1996-04-23 | Medisense, Inc. | Strip electrode including screen printing of a single layer |
| US5682884A (en)* | 1983-05-05 | 1997-11-04 | Medisense, Inc. | Strip electrode with screen printing |
| SE8305704D0 (en)* | 1983-10-18 | 1983-10-18 | Leo Ab | Cuvette |
| US5108564A (en)* | 1988-03-15 | 1992-04-28 | Tall Oak Ventures | Method and apparatus for amperometric diagnostic analysis |
| US5128015A (en)* | 1988-03-15 | 1992-07-07 | Tall Oak Ventures | Method and apparatus for amperometric diagnostic analysis |
| DE68924026T3 (en)* | 1988-03-31 | 2008-01-10 | Matsushita Electric Industrial Co., Ltd., Kadoma | BIOSENSOR AND ITS MANUFACTURE. |
| US5508171A (en) | 1989-12-15 | 1996-04-16 | Boehringer Mannheim Corporation | Assay method with enzyme electrode system |
| US5243516A (en)* | 1989-12-15 | 1993-09-07 | Boehringer Mannheim Corporation | Biosensing instrument and method |
| EP0505494B1 (en)* | 1989-12-15 | 1995-07-12 | Boehringer Mannheim Corporation | Redox mediator reagent and biosensor |
| US5385846A (en) | 1993-06-03 | 1995-01-31 | Boehringer Mannheim Corporation | Biosensor and method for hematocrit determination |
| US5352351A (en) | 1993-06-08 | 1994-10-04 | Boehringer Mannheim Corporation | Biosensing meter with fail/safe procedures to prevent erroneous indications |
| US5437999A (en)* | 1994-02-22 | 1995-08-01 | Boehringer Mannheim Corporation | Electrochemical sensor |
| GB9415499D0 (en)* | 1994-08-01 | 1994-09-21 | Bartlett Philip N | Electrodes and their use in analysis |
| US5628890A (en)* | 1995-09-27 | 1997-05-13 | Medisense, Inc. | Electrochemical sensor |
| JP3365184B2 (en)* | 1996-01-10 | 2003-01-08 | 松下電器産業株式会社 | Biosensor |
| US6054039A (en)* | 1997-08-18 | 2000-04-25 | Shieh; Paul | Determination of glycoprotein and glycosylated hemoglobin in blood |
| US5997817A (en)* | 1997-12-05 | 1999-12-07 | Roche Diagnostics Corporation | Electrochemical biosensor test strip |
| US7390667B2 (en)* | 1997-12-22 | 2008-06-24 | Roche Diagnostics Operations, Inc. | System and method for analyte measurement using AC phase angle measurements |
| US7407811B2 (en)* | 1997-12-22 | 2008-08-05 | Roche Diagnostics Operations, Inc. | System and method for analyte measurement using AC excitation |
| US7494816B2 (en)* | 1997-12-22 | 2009-02-24 | Roche Diagnostic Operations, Inc. | System and method for determining a temperature during analyte measurement |
| US6645368B1 (en)* | 1997-12-22 | 2003-11-11 | Roche Diagnostics Corporation | Meter and method of using the meter for determining the concentration of a component of a fluid |
| US20080202927A1 (en)* | 2000-11-03 | 2008-08-28 | Clinical Micro Sensors, Inc. | Devices and methods for biochip multiplexing |
| US6797150B2 (en)* | 2001-10-10 | 2004-09-28 | Lifescan, Inc. | Determination of sample volume adequacy in biosensor devices |
| DE10228260A1 (en)* | 2002-06-25 | 2004-01-22 | Bayer Ag | Method and device for the impedimetric detection of one or more analytes in a sample |
| AU2003234944A1 (en)* | 2002-08-27 | 2004-03-18 | Bayer Healthcare, Llc | Methods of Determining Glucose Concentration in Whole Blood Samples |
| KR100539272B1 (en)* | 2003-02-24 | 2005-12-27 | 삼성전자주식회사 | Semiconductor device and Method of manufacturing the same |
| US7413645B2 (en)* | 2004-05-05 | 2008-08-19 | Mine Safety Appliances Company | Devices, systems and methods for testing gas sensors and correcting gas sensor output |
| TW200639396A (en)* | 2005-05-13 | 2006-11-16 | Univ Nat Central | Non-destructive measurement for porous material and measurement method for diffusion coefficient thereof |
| US20090017197A1 (en)* | 2007-07-12 | 2009-01-15 | Sharp Laboratories Of America, Inc. | IrOx nanowire protein sensor |
| CN101214152A (en)* | 2008-01-22 | 2008-07-09 | 天津市先石光学技术有限公司 | Method for micro-wounded dynamically and continuously detecting blood sugar concentration of human body |
- 2010
- 2010-01-08USUS12/684,277patent/US20110168575A1/ennot_activeAbandoned
- 2010-12-30CNCN201080060828.6Apatent/CN102687008B/enactiveActive
- 2010-12-30CACA2785704Apatent/CA2785704C/enactiveActive
- 2010-12-30KRKR1020127017600Apatent/KR101423851B1/ennot_activeExpired - Fee Related
- 2010-12-30JPJP2012547455Apatent/JP5597262B2/ennot_activeExpired - Fee Related
- 2010-12-30EPEP10800895.4Apatent/EP2521912B1/enactiveActive
- 2010-12-30WOPCT/EP2010/007990patent/WO2011082820A1/enactiveApplication Filing
Patent Citations (2)
| Publication number | Priority date | Publication date | Assignee | Title |
|---|---|---|---|---|
| US20040256248A1 (en) | 2003-06-20 | 2004-12-23 | Burke David W. | System and method for analyte measurement using dose sufficiency electrodes |
| US20070264721A1 (en) | 2003-10-17 | 2007-11-15 | Buck Harvey B | System and method for analyte measurement using a nonlinear sample response |
Cited By (1)
| Publication number | Priority date | Publication date | Assignee | Title |
|---|---|---|---|---|
| US10966689B2 (en) | 2016-05-09 | 2021-04-06 | Samsung Electronics Co., Ltd. | Method and apparatus for predicting concentration of analyte |
Also Published As
| Publication number | Publication date |
|---|---|
| WO2011082820A1 (en) | 2011-07-14 |
| CA2785704C (en) | 2015-04-28 |
| KR20120102749A (en) | 2012-09-18 |
| JP2013516615A (en) | 2013-05-13 |
| CN102687008A (en) | 2012-09-19 |
| EP2521912B1 (en) | 2016-10-12 |
| HK1175844A1 (en) | 2013-07-12 |
| CN102687008B (en) | 2015-01-28 |
| CA2785704A1 (en) | 2011-07-14 |
| EP2521912A1 (en) | 2012-11-14 |
| JP5597262B2 (en) | 2014-10-01 |
| US20110168575A1 (en) | 2011-07-14 |
Similar Documents
| Publication | Publication Date | Title |
|---|---|---|
| KR101423851B1 (en) | Sample characterization based on ac measurement methods | |
| JP4964552B2 (en) | Method and apparatus for rapid electrochemical analysis | |
| JP6448504B2 (en) | Slope-based correction | |
| US8083925B2 (en) | Analyte determination methods and devices | |
| RU2292841C2 (en) | Metod of determining adequacy of sample's volume in biological detector devices | |
| EP2193367B1 (en) | Method for correcting erroneous results of measurement in biosensors and apparatus using the same | |
| JP4573400B2 (en) | Sample detection to initiate the timing of electrochemical measurements | |
| CN102667476B (en) | Systems and methods for determining the concentration of an analyte in a sample fluid | |
| JP2011506966A5 (en) | ||
| CN101432620A (en) | Underfill detection system for an electrochemical biosensor | |
| US11353417B2 (en) | Risk factor monitoring | |
| US20170038331A1 (en) | System and method for compensating sample-related measurements based on polarization effects of test strips | |
| KR20190112731A (en) | Determination of Analyte Concentrations in Physiological Fluids with Interferences | |
| JP2011506967A (en) | Method and system for producing a reagent with reduced background current | |
| HK1175844B (en) | Sample characterization based on ac measurement methods | |
| HK1175536B (en) | System and method for determining the concentration of an analyte in a sample fluid | |
| HK1187985A (en) | System and method for improved stability of electrochemical sensors |
Legal Events
| Date | Code | Title | Description |
|---|---|---|---|
| A201 | Request for examination | ||
| E13-X000 | Pre-grant limitation requested | St.27 status event code:A-2-3-E10-E13-lim-X000 | |
| P11-X000 | Amendment of application requested | St.27 status event code:A-2-2-P10-P11-nap-X000 | |
| P13-X000 | Application amended | St.27 status event code:A-2-2-P10-P13-nap-X000 | |
| PA0105 | International application | St.27 status event code:A-0-1-A10-A15-nap-PA0105 | |
| PA0201 | Request for examination | St.27 status event code:A-1-2-D10-D11-exm-PA0201 | |
| PG1501 | Laying open of application | St.27 status event code:A-1-1-Q10-Q12-nap-PG1501 | |
| E902 | Notification of reason for refusal | ||
| PE0902 | Notice of grounds for rejection | St.27 status event code:A-1-2-D10-D21-exm-PE0902 | |
| T11-X000 | Administrative time limit extension requested | St.27 status event code:U-3-3-T10-T11-oth-X000 | |
| E13-X000 | Pre-grant limitation requested | St.27 status event code:A-2-3-E10-E13-lim-X000 | |
| P11-X000 | Amendment of application requested | St.27 status event code:A-2-2-P10-P11-nap-X000 | |
| P13-X000 | Application amended | St.27 status event code:A-2-2-P10-P13-nap-X000 | |
| E701 | Decision to grant or registration of patent right | ||
| PE0701 | Decision of registration | St.27 status event code:A-1-2-D10-D22-exm-PE0701 | |
| GRNT | Written decision to grant | ||
| PR0701 | Registration of establishment | St.27 status event code:A-2-4-F10-F11-exm-PR0701 | |
| PR1002 | Payment of registration fee | St.27 status event code:A-2-2-U10-U12-oth-PR1002 Fee payment year number:1 | |
| PG1601 | Publication of registration | St.27 status event code:A-4-4-Q10-Q13-nap-PG1601 | |
| PR1001 | Payment of annual fee | St.27 status event code:A-4-4-U10-U11-oth-PR1001 Fee payment year number:4 | |
| FPAY | Annual fee payment | Payment date:20180628 Year of fee payment:5 | |
| PR1001 | Payment of annual fee | St.27 status event code:A-4-4-U10-U11-oth-PR1001 Fee payment year number:5 | |
| PR1001 | Payment of annual fee | St.27 status event code:A-4-4-U10-U11-oth-PR1001 Fee payment year number:6 | |
| PR1001 | Payment of annual fee | St.27 status event code:A-4-4-U10-U11-oth-PR1001 Fee payment year number:7 | |
| PR1001 | Payment of annual fee | St.27 status event code:A-4-4-U10-U11-oth-PR1001 Fee payment year number:8 | |
| PR1001 | Payment of annual fee | St.27 status event code:A-4-4-U10-U11-oth-PR1001 Fee payment year number:9 | |
| PR1001 | Payment of annual fee | St.27 status event code:A-4-4-U10-U11-oth-PR1001 Fee payment year number:10 | |
| PC1903 | Unpaid annual fee | St.27 status event code:A-4-4-U10-U13-oth-PC1903 Not in force date:20240722 Payment event data comment text:Termination Category : DEFAULT_OF_REGISTRATION_FEE | |
| R18-X000 | Changes to party contact information recorded | St.27 status event code:A-5-5-R10-R18-oth-X000 | |
| PC1903 | Unpaid annual fee | St.27 status event code:N-4-6-H10-H13-oth-PC1903 Ip right cessation event data comment text:Termination Category : DEFAULT_OF_REGISTRATION_FEE Not in force date:20240722 |