JP7658099B2 - Driver State Estimation Device - Google Patents
Driver State Estimation DeviceDownload PDFInfo
- Publication number
- JP7658099B2 JP7658099B2JP2021017185AJP2021017185AJP7658099B2JP 7658099 B2JP7658099 B2JP 7658099B2JP 2021017185 AJP2021017185 AJP 2021017185AJP 2021017185 AJP2021017185 AJP 2021017185AJP 7658099 B2JP7658099 B2JP 7658099B2
- Authority
- JP
- Japan
- Prior art keywords
- driver
- average value
- head
- feature vector
- behavior
- Prior art date
- Legal status (The legal status is an assumption and is not a legal conclusion. Google has not performed a legal analysis and makes no representation as to the accuracy of the status listed.)
- Active
Links
- 239000013598vectorSubstances0.000claimsdescription168
- 238000001514detection methodMethods0.000claimsdescription67
- 230000005856abnormalityEffects0.000claimsdescription45
- 230000000737periodic effectEffects0.000claimsdescription39
- 239000002243precursorSubstances0.000claimsdescription5
- 210000003128headAnatomy0.000description71
- 230000006399behaviorEffects0.000description50
- 238000004364calculation methodMethods0.000description23
- 238000004458analytical methodMethods0.000description15
- 238000000034methodMethods0.000description15
- 238000010586diagramMethods0.000description11
- 238000005516engineering processMethods0.000description11
- 230000002159abnormal effectEffects0.000description10
- 208000037265diseases, disorders, signs and symptomsDiseases0.000description8
- 201000010099diseaseDiseases0.000description7
- 230000013632homeostatic processEffects0.000description6
- 230000010365information processingEffects0.000description6
- 230000007423decreaseEffects0.000description5
- 230000008859changeEffects0.000description4
- 238000002474experimental methodMethods0.000description4
- 230000006870functionEffects0.000description4
- 238000012545processingMethods0.000description4
- 238000011160researchMethods0.000description4
- 230000008569processEffects0.000description3
- 230000009467reductionEffects0.000description3
- 230000004044responseEffects0.000description3
- 206010010904ConvulsionDiseases0.000description2
- 230000004886head movementEffects0.000description2
- 208000024891symptomDiseases0.000description2
- 230000007704transitionEffects0.000description2
- 206010008025Cerebellar ataxiaDiseases0.000description1
- 241000282412HomoSpecies0.000description1
- 208000003443UnconsciousnessDiseases0.000description1
- 210000004556brainAnatomy0.000description1
- 238000011161developmentMethods0.000description1
- 208000035475disorderDiseases0.000description1
- 229940079593drugDrugs0.000description1
- 239000003814drugSubstances0.000description1
- 206010015037epilepsyDiseases0.000description1
- 239000000284extractSubstances0.000description1
- 230000005484gravityEffects0.000description1
- 238000012423maintenanceMethods0.000description1
- 238000012986modificationMethods0.000description1
- 230000004048modificationEffects0.000description1
- 230000008447perceptionEffects0.000description1
- 238000007637random forest analysisMethods0.000description1
- 230000004083survival effectEffects0.000description1
- 230000032258transportEffects0.000description1
Images


Landscapes
- Measurement Of The Respiration, Hearing Ability, Form, And Blood Characteristics Of Living Organisms (AREA)
- Traffic Control Systems (AREA)
- Control Of Driving Devices And Active Controlling Of Vehicle (AREA)
Description
Translated fromJapaneseここに開示された技術は、移動体を運転するドライバの状態を推定するドライバ状態推定装置に関する技術分野に属する。The technology disclosed herein belongs to the technical field of driver state estimation devices that estimate the state of a driver operating a moving object.
昨今、国家的に自動運転システムの開発が推進されている。本願出願人は、現時点において、自動運転システムには、大きく分けると2つの方向性があると考えている。Recently, the development of autonomous driving systems has been promoted nationwide. The applicant believes that at present, autonomous driving systems can be broadly divided into two directions.
第1の方向性は、自動車が主体となってドライバの操作を要することなく乗員を目的地まで運ぶシステムであり、いわゆる自動車の完全自動走行である。一方、第2の方向性は、自動車の運転を楽しみたい等、あくまで人間が運転をすることを前提とした自動運転システムである。The first direction is a system in which the car takes the initiative and transports passengers to their destination without the need for driver operation, known as fully automated driving. On the other hand, the second direction is an automated driving system that assumes that a human will still be driving, for example, for the enjoyment of driving a car.
第2の方向性の自動運転システムでは、例えば、ドライバに疾患等が発生し正常な運転が困難な状況が発生した場合等に、自動車が自動的に乗員に変わって自動運転を行うことが想定される。このため、ドライバに異常が発生したこと、特に、ドライバに機能障害や疾患が発生したことをいかに早期にかつ精度良く発見できるかが、ドライバの救命率の向上や周囲を含めた安全を確保する観点から極めて重要となる。In the second direction of autonomous driving systems, for example, if the driver develops an illness that makes normal driving difficult, the vehicle is expected to automatically take over from the occupant and perform autonomous driving. For this reason, in terms of improving the driver's survival rate and ensuring the safety of those around the vehicle, it is extremely important to be able to detect driver abnormalities, particularly functional disorders or illnesses, as early and accurately as possible.
特許文献1には、ドライバの頭部の揺れ幅に基づいてドライバの運転不能状態を検出したり、ドライバの目の白目度合いに基づいてドライバの運転不能状態を検出したりする状態検出装置が開示されている。
特許文献1,2に示されているように、ドライバの頭部の動きや眼球の状態に基づいてドライバの運転不能や異常を判定する技術は、すでに知られている。しかしながら、特許文献1では、集中力の低下や肉体的な疲労については検出できたとしても、運転者に生じている疾患については事前に予測できない。また、特許文献2は、ドライバに疾患が発現してから運転不能になった状態を検出するものである。ドライバの異常発生時において、より安全に緊急停車等を行うためには、ドライバが運転不能になってしまう前に、その予兆をいち早く捉えることが好ましい。As shown in
本願発明者らは、ドライバの異常予兆を推定するために、ドライバが運転不能になる直前に見られる、ドライバの頭部挙動に周期性に着目した。具体的には、本願発明者らは、ドライバの頭部挙動の規則性に対して時系列変動パターンを求めることで、ドライバの異常予兆を推定することを提案している。しかしながら、ドライバの頭部挙動の規則性に対して時系列変動パターンを求めるには、演算量が膨大になる。このため、移動体内で演算を完了させるのが困難になり、ドライバの異常予兆を早期に検知しにくくなるおそれがある。In order to estimate signs of abnormality in the driver, the inventors of the present application focused on the periodicity of the driver's head behavior that is observed immediately before the driver becomes unable to drive. Specifically, the inventors of the present application propose estimating signs of abnormality in the driver by determining a time-series variation pattern for the regularity of the driver's head behavior. However, determining a time-series variation pattern for the regularity of the driver's head behavior requires an enormous amount of calculation. This makes it difficult to complete the calculations within the moving body, and there is a risk that it will be difficult to detect signs of abnormality in the driver at an early stage.
ここに開示された技術は斯かる点に鑑みてなされたものであり、その目的とするところは、移動体を運転するドライバの異常予兆を推定する際の演算量を出来る限り小さくして、ドライバの異常予兆を出来る限り早期に検知することにある。The technology disclosed here has been developed in light of these points, and its purpose is to minimize the amount of calculation required when estimating signs of abnormality in the driver of a moving vehicle, and to detect signs of abnormality in the driver as early as possible.
前記課題を解決するために、ここに開示された技術では、移動体を運転するドライバの状態を推定するドライバ状態推定装置を対象として、センサを用いて前記ドライバの頭部のピッチ方向の挙動及びロール方向の挙動を検出する頭部挙動検出部と、前記頭部挙動検出部によって検出された各頭部挙動から、前記ドライバの異常予兆を検知する検知部と、を備え、前記検知部は、前記ドライバのピッチ方向の頭部の挙動及びロール方向の頭部の挙動を示す時系列データに対して、周期性特徴量をそれぞれ演算し、演算した各周期性特徴量に対して特徴ベクトルをそれぞれ演算し、演算したピッチ方向の特徴ベクトル及び演算したロール方向の特徴ベクトルに対して、該ピッチ方向及びロール方向の各特徴ベクトル全体の平均値がドライバの頭部挙動が規則的であると判定できる程度の大きさに設定された第1所定値以下である第1条件を満たし、かつ、前記ピッチ方向の特徴ベクトルの平均値と前記ロール方向の特徴ベクトルの平均値との差が、正常状態における、ピッチ方向の特徴ベクトルの平均値とロール方向の特徴ベクトルの平均値との差よりは大きく、疾患状態における、ピッチ方向の特徴ベクトルの平均値とロール方向の特徴ベクトルの平均値との差よりは小さく設定されている所定範囲である第2条件とを満たすときに前記ドライバが異常予兆状態であると推定する、というものとした。 In order to solve the above-mentioned problems, the technology disclosed herein is directed to a driver state estimation device that estimates the state of a driver driving a moving object, and includes a head behavior detection unit that uses a sensor to detect behavior in a pitch direction and behavior in a roll direction of the head of the driver, and a detection unit that detects a sign of an abnormality in the driver from each head behavior detected by the head behavior detection unit, and the detection unit calculates periodic feature amounts for time series data indicating the behaviorof the head of the driver in the pitch direction and the behaviorof the head in the roll direction, calculates feature vectors for each calculated periodic feature amount, and calculates the calculated pitch direction feature vector and the calculated roll direction feature vector.The driver is presumed to be in an abnormality precursor state when a first condition is satisfied, that is, the average value of all of the feature vectors in the pitch and roll directions is equal to or less than a first predetermined value set to a magnitude sufficient to determine that the behavior of the driver's head is regular, and a second condition is satisfied, that is, the difference between the average value of the feature vectors in the pitch direction and the average value of the feature vectors in the roll direction is within a predetermined range set to be greater than the difference between the average value of the feature vectors in the pitch direction and the average value of the feature vectors in the roll direction in a normal state and smaller than the difference between the average value of the feature vectors in the pitch direction and the average value of the feature vectors in the roll direction in a diseased state .
本願発明者らは、まず、ドライバの頭部のピッチ方向の挙動及びロール方向の挙動の時系列データに対して周期性特徴量を演算し、演算した周期性特徴量の時系列変動パターンを次元圧縮手法により演算した。そして、本願発明者らは、演算結果の時系列変動パターンから周期性特徴量を再現する逆解析を行うことで、周期性特徴量の時系列変動パターンを演算する際に考慮されている要素を算出した。これにより、本願発明者らは、頭部のピッチ方向の特徴ベクトルであるピッチ方向の特徴ベクトル及びロール方向の特徴ベクトルであるロール方向の特徴ベクトルに関する複数のパラメータのうち、ピッチ方向及びロール方向の特徴ベクトル全体の平均値、ピッチ方向の特徴ベクトルの平均値、並びに、ロール方向の特徴ベクトルの平均値が重要な要素であることを見出した。 The inventors of the present application first calculated periodic feature values for time series data of the behavior of the driver's head in the pitch direction and the behavior of the driver's head in the roll direction, and calculated the time series fluctuation pattern of the calculated periodic feature values using a dimension reduction method.The inventors of the present application then performed an inverse analysis to reproduce the periodic feature values from the time series fluctuation pattern of the calculation result, thereby calculating the factors considered when calculating the time series fluctuation pattern of the periodic feature values.As a result, the inventors of the present application found that, among a plurality of parameters related to the pitch direction feature vector, which is a feature vector in the pitch direction of the head, and the roll direction feature vector, which is a feature vector inthe roll direction , the average value of all the pitch direction and roll direction feature vectors, the average value of the pitch direction feature vector, and the average value of the roll direction feature vector are important factors.
そこで、本開示に係る技術では、検知部は、ピッチ方向及びロール方向の各特徴ベクトル全体の平均値、ピッチ方向の特徴ベクトルの平均値、並びに、ロール方向の特徴ベクトルの平均値を少なくとも考慮して、ドライバの異常予兆の有無を検知するようにした。これにより、周期性特徴量の時系列変動パターンによりドライバの異常予兆を検知する際に利用する要素が限定されるため、演算量を小さくすることができる。この結果、ドライバの異常予兆を出来る限り早期に検知することができるようになる。Therefore, in the technology disclosed herein, the detection unit detects the presence or absence of signs of abnormality in the driver by taking into consideration at least the average value of all feature vectors in the pitch direction and roll direction, the average value of feature vectors in the pitch direction, and the average value of feature vectors in the roll direction. This limits the elements used when detecting signs of abnormality in the driver based on the time-series fluctuation pattern of the periodic feature amount, making it possible to reduce the amount of calculations. As a result, it becomes possible to detect signs of abnormality in the driver as early as possible.
本願発明者らが更に研究を進めたところ、ピッチ方向及びロール方向の各特徴ベクトル全体の平均値と、ピッチ方向の特徴ベクトルの平均値とロール方向の特徴ベクトルの平均値との差とにより異常予兆を検知するようにすれば、周期性特徴量の時系列変動パターンを用いた場合の検知結果を精度良く再現できることが分かった。これにより、演算量を効果的に削減して、ドライバの異常予兆を出来る限り早期に検知することができるようになる。As the inventors of the present application conducted further research, they found that by detecting signs of abnormality using the average value of all feature vectors in the pitch and roll directions and the difference between the average value of feature vectors in the pitch direction and the average value of feature vectors in the roll direction, it is possible to accurately reproduce the detection results obtained when using the time-series fluctuation pattern of periodic features. This effectively reduces the amount of calculations and makes it possible to detect signs of abnormality in the driver as early as possible.
前記ドライバ状態推定装置において、前記検知部は、前記第1条件および前記第2条件に加えて、前記ピッチ方向の特徴ベクトルの平均値がドライバの頭部挙動が規則的であると判定できる程度の大きさに設定された第2所定値以下で、かつ、前記ロール方向の特徴ベクトルの平均値がドライバの頭部挙動が規則的であると判定できる程度の大きさに設定された第3所定値以下であるときに前記ドライバが異常予兆状態であると推定する、という構成でもよい。 In the driver state estimation device, the detection unitmay be configured to estimate that the driver is in a pre-abnormal state when,in addition to the first condition and the second condition, an average value of the pitch direction feature vector is equalto or less than a second predetermined value set to a magnitude sufficient to determine that the driver's head behavior is regular, and an average value of the roll directionfeature vector is equal to or less than a third predetermined valueset to a magnitude sufficient to determine that the driver's head behavior is regular.
この構成によると、ドライバの異常予兆をより精度良く検知することができる。結果として、ドライバの異常予兆を出来る限り早期に検知することができるようになる。This configuration allows for more accurate detection of signs of driver abnormalities. As a result, it becomes possible to detect signs of driver abnormalities as early as possible.
以上説明したように、ここに開示された技術によると、移動体を運転するドライバの異常予兆を推定する際の演算量を出来る限り小さくして、ドライバの異常予兆を出来る限り早期に検知することができる。As described above, the technology disclosed herein makes it possible to minimize the amount of calculation required to estimate abnormal signs in the driver of a moving object, and to detect abnormal signs in the driver as early as possible.
以下、例示的な実施形態について、図面を参照しながら詳細に説明する。An exemplary embodiment will be described in detail below with reference to the drawings.
図1は本開示に係る技術の位置づけを表す概念図である。ドライバが運転不能に陥る状態変容は3つのパターンに集約される。ケースAは、知覚、判断、運動のうち一部機能から低下するパターン、ケースBは、全般機能が徐々に低下するパターン、ケースCは急に意識を喪失するパターンである。このうち、ケースA,Bの場合は、図1に示すように、疾患が発症してから、ドライバの運転能力レベルが徐々に低下していき、やがて運転不能状態に至る。したがって、この運転能力の低下状態を検出できれば、ドライバの運転不能の予兆を検知することができる。運転不能の予兆を検知することができたら、その後は例えばドライバの意思確認を行い、自動走行制御によって車両を路肩に退避させる等の緊急対応が可能になる。また、ケースCの場合であっても、意識を喪失する前の予兆を検知することができれば、緊急対応が可能になる。Figure 1 is a conceptual diagram showing the positioning of the technology disclosed herein. The state changes that cause a driver to become unable to drive are summarized into three patterns. Case A is a pattern in which some of the functions of perception, judgment, and movement decline, Case B is a pattern in which the overall functions decline gradually, and Case C is a pattern in which consciousness is suddenly lost. Of these, in the cases of Cases A and B, as shown in Figure 1, the driver's driving ability level gradually declines after the onset of the disease, and eventually leads to a state of being unable to drive. Therefore, if this state of decline in driving ability can be detected, it is possible to detect the signs of the driver's inability to drive. If the signs of being unable to drive can be detected, then, for example, the driver's intention can be confirmed and emergency measures such as pulling the vehicle to the shoulder by automatic driving control can be taken. Even in the case of Case C, if the signs before loss of consciousness can be detected, emergency measures can be taken.
本開示に係る技術は、人の恒常性維持機能に着目し、ドライバの頭部挙動から運転不能の予兆(以下、異常予兆という)を検知するものである。The technology disclosed herein focuses on the human homeostasis maintenance function and detects signs of inability to drive (hereinafter referred to as abnormal signs) from the driver's head behavior.
図2は頭部挙動の恒常性と疾患との関係を示す(非特許文献1,2参照)。図2の各グラフは上方から見た頭部の動きを表している。図2の(a)は恒常性が維持された正常状態であり、図2の(b)は正常と疾患との間の臨界減速という状態であり、図2の(c)は疾患状態である。尚、図2(a),(c)のグラフは非特許文献1から引用したものである。Figure 2 shows the relationship between homeostasis of head behavior and disease (see
人間は、外乱に対して状態を一定に保とうとする恒常性という機能を持っている。頭部挙動の恒常性とは、運転中に頭部姿勢を維持しようとする性質のことをいう。図2(a)に示すように、正常状態では、恒常性維持のために、頭部は不規則に変動する。一方、図2(c)に示すように、疾患時には、頭部の変動は小さくなり、挙動が安定する。そして図2(b)に示すように、正常状態から疾患状態に遷移する間の臨界減速状態では、頭部は、周期性(自己相関)を持って変動する、と考えられる(非特許文献2参照)。Humans have a function called homeostasis, which tries to keep their state constant against external disturbances. Head behavior homeostasis refers to the tendency to maintain the head posture while driving. As shown in Figure 2(a), in a normal state, the head moves irregularly to maintain homeostasis. On the other hand, as shown in Figure 2(c), in an ill state, the head movement becomes smaller and the behavior becomes stable. And as shown in Figure 2(b), in the critical deceleration state during the transition from a normal state to an ill state, the head is thought to move with periodicity (autocorrelation) (see Non-Patent Document 2).
本願発明者らは、上述した知見に着目し、ドライバの頭部挙動から、臨界減速状態への状態遷移を捉えることができれば、異常の予兆を検知することができる、と考えた。そして、ドライバの異常予兆の検知のために、頭部挙動の周期性特徴量を利用できる、と考えた。The inventors of the present application focused on the above findings and believed that if it were possible to capture the state transition to a critical deceleration state from the driver's head behavior, it would be possible to detect signs of abnormality. They also believed that the periodic feature amount of head behavior could be used to detect signs of abnormality in the driver.
本願発明者らは、異常予兆が生じる場合の頭部挙動を取得するために、実際にケースCの疾患を有する被験者に、ドライブシミュレータによる運転をさせる実験を行った。実験では、被験者の頭部挙動を示すデータとして、センサにより頭部のピッチ角(前後方向の角度)とロール角(左右方向の角度)とを取得した。また、実験では、被験者の脳波を取得することで、実際にてんかんが生じたか否かを判定した。The inventors of the present application conducted an experiment in which a subject with Case C's disease was asked to drive using a driving simulator in order to obtain head behavior when abnormal symptoms occur. In the experiment, a sensor was used to obtain the head's pitch angle (angle in the forward/backward direction) and roll angle (angle in the left/right direction) as data indicating the subject's head behavior. In the experiment, the subject's brain waves were also obtained to determine whether or not epilepsy had actually occurred.
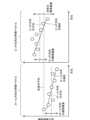
図3の上図は、実際に頭部挙動を取得した結果である。図3に示す、正常区間、予兆区間、及び発作区間は、脳波の解析結果から判別している
本願発明者らの行った実験により、図3に示すように、正常状態では、頭部がランダムに小さく移動し、予兆状態において微小な振動が生じ、発作状態では、ランダムに大きく移動することが分かった。特に、予兆状態では、時折大きな動きがありつつも、基本的には周期的な振動が継続することが分かった。そこで、本願発明者らは、この周期的な変化を検出するために、頭部のピッチ角およびロール角の時系列データに対して、DFA(Detrended Fluctuation Analysis)により、自己相関指標(スケーリング指数α)を求めた。DFAは、非常にゆっくりと変化する成分、いわゆるトレンドを除去してスケーリングを調べる手法である。自己相関指標(スケーリング指数α)は、データの周期性を示す特徴量の一例である。 The upper diagram in FIG. 3 shows the results of actually acquiring head behavior. The normal section, premonition section, and seizure section shown in FIG. 3 are determined from the analysis results of the electroencephalogram. Experiments conducted by the inventors of the present application have revealed that, as shown in FIG. 3, in the normal state, the head moves randomly and slightly, in the premonition state, minute vibrations occur, and in the seizure state, the head moves randomly and significantly. In particular, in the premonition state, although there are occasional large movements, periodic vibrations are basically continued. Therefore, in order to detect this periodic change, the inventors of the present application have obtained an autocorrelation index (scaling exponent α) for the time series data of the pitch angle and roll angle of the head by DFA (Detrended Fluctuation Analysis). DFA is a method of investigating scaling by removing components that change very slowly, so-called trends. The autocorrelation index (scaling exponent α) is an example of a feature value that indicates the periodicity of data.
図3の下図は頭部のピッチ角及びロール角の自己相関指標を示すグラフである。自己相関指標の値は、小さいほど自己相関が強く、大きいほど自己相関が弱いことを表す。The bottom graph in Figure 3 shows the autocorrelation index of the head pitch angle and roll angle. The smaller the autocorrelation index value, the stronger the autocorrelation, and the larger the value, the weaker the autocorrelation.
図3の下図に示すように、予兆区間では、自己相関指標が低下する傾向にあり、規則的な変化をすることが分かる。この実験結果は、正常状態では頭部は不規則に変動し、臨界減速状態では頭部は周期性を持って変動する、という上述した知見に合致している。一方で、図3の下図に示すように、正常区間であっても予兆区間と同程度の自己相関指標となる場合がある。As shown in the lower diagram of Figure 3, in the warning zone, the autocorrelation index tends to decrease and changes regularly. This experimental result is consistent with the above-mentioned findings that in a normal state, the head moves irregularly, and in a critical deceleration state, the head moves periodically. On the other hand, as shown in the lower diagram of Figure 3, even in normal zones, there are cases where the autocorrelation index is at the same level as in warning zones.
そこで、本願発明者らは、自己相関指標の時系列変動パターンに注目した。本願発明者らは、時系列変動パターンを求めるために、自己相関指標の時系列データの規則性を示す特徴ベクトルを演算して、パターン分類を行った。本願発明者らは、まず、パターン分類の手法として、演算した特徴ベクトルに対して、非線形次元圧縮手法(UMAP:Uniform Manifold Approximation and Projection)を行った。The inventors of the present application therefore focused on the time series fluctuation patterns of the autocorrelation index. To determine the time series fluctuation patterns, the inventors of the present application calculated feature vectors that indicate the regularity of the time series data of the autocorrelation index and performed pattern classification. As a pattern classification method, the inventors of the present application first performed a nonlinear dimensionality reduction method (UMAP: Uniform Manifold Approximation and Projection) on the calculated feature vectors.
図6は、UMAPにより2次元に圧縮した時系列変動パターンである。図6に示すように、異常予兆が現れる際には、時系列変動パターンに特異な変化が見られることが分かる。つまり、UMAPにより自己相関指標の特徴ベクトルを次元圧縮することにより、異常予兆を検知可能であることが分かった。Figure 6 shows a time series fluctuation pattern compressed into two dimensions by UMAP. As shown in Figure 6, when signs of an abnormality appear, a peculiar change is observed in the time series fluctuation pattern. In other words, it was found that signs of an abnormality can be detected by compressing the dimensions of the feature vector of the autocorrelation index using UMAP.
しかしながら、本願発明者らが解析したところ、UMAPを用いる方法では、演算量が膨大になることが分かった。このため、メモリの使用量が膨大になり、一般的なパソコンを用いれば十分に演算可能である一方で、自動車などの移動体に搭載される演算装置により演算することは困難であることが分かった。However, the inventors of the present application analyzed the method using UMAP and found that the amount of calculation required would be enormous. This would result in a huge amount of memory usage, and while the calculations are sufficiently possible using a general personal computer, it was found that it would be difficult to perform the calculations using a calculation device installed in a moving object such as an automobile.
そこで、本願発明者らは、パターン分類方法をUMAPから他の方法に置き換えることを検討した。具体的には、図5に示すように、UMAPにより得られた2次元データに対して逆解析を行い、図3に示すような自己相関指標の結果を得るために必要な要素を抽出した。ここでは、ランダムフォレスト法により逆解析を行うことで分類規則を示す要素を抽出した。The inventors of the present application therefore considered replacing the pattern classification method from UMAP with another method. Specifically, as shown in Figure 5, they performed inverse analysis on the two-dimensional data obtained by UMAP and extracted the elements necessary to obtain the results of the autocorrelation index as shown in Figure 3. Here, they performed inverse analysis using the random forest method to extract elements that indicate classification rules.
本願発明者らが逆解析を行った結果、要素しては、図6に示すように、
・特徴ベクトル全体の平均値
・ピッチ方向の特徴ベクトルの平均値
・ロール方向の特徴ベクトルの平均値
・ピッチ方向の特徴ベクトルの平均値とロール方向の特徴ベクトルの平均値との差
・ピッチ方向の特徴ベクトルの傾き
・ロール方向の特徴ベクトルの傾き
・ピッチ方向の特徴ベクトルの傾きとロール方向の特徴ベクトルの傾きとの差
・特徴ベクトル全体の傾きとピッチ方向の特徴ベクトルの傾きとの差
・特徴ベクトル全体の傾きとロール方向の特徴ベクトルの傾きとの差
・ピッチ方向の特徴ベクトルの標準偏差
・ロール方向の特徴ベクトルの標準偏差
・ピッチ方向の特徴ベクトルの標準偏差とロール方向の特徴ベクトルの標準偏差との差
の12の要素によりUMAPの2次元データから自己相関指標の時系列変化を説明できることが分かった。尚、図6に示す各特徴ベクトルは、ピッチ角及びロール角の周期性特徴量の時系列データを時間順に区切って算出されるものである。図6の縦軸は、前述のようにDFAにて演算される自己相関指標であり、特徴ベクトルの量を表す。 As a result of the inverse analysis carried out by the present inventors, the elements are as follows, as shown in FIG.
It was found that the time series change of the autocorrelation index can be explained from the two-dimensional data of UMAP by the following 12 elements: average value of all feature vectors average value of feature vectors in pitch direction average value of feature vectors in roll direction difference between average value of feature vectors in pitch direction and average value of feature vectors in roll direction slope of feature vector in pitch direction slope of feature vector in roll direction difference between slope of feature vectors in pitch direction difference between slope of all feature vectors and slope of feature vector in roll direction standard deviation of feature vector in pitch direction standard deviation of feature vector in roll direction difference between standard deviation of feature vector in pitch direction and standard deviation of feature vector in roll direction. Each feature vector shown in FIG. 6 is calculated by dividing the time series data of the periodic feature amount of the pitch angle and the roll angle in chronological order. The vertical axis of FIG. 6 is the autocorrelation index calculated by the DFA as described above, and represents the amount of the feature vector.
また、本願発明者らが解析を進めたところ、12要素全てを考慮しなくとも特定の数要素のみで自己相関指標の時系列変化をほとんど説明できることが分かった。図7には、発明者らの解析結果を示す。縦軸の説明指数は、自己相関指標の時系列変化の再現度合いとみなすことができ、1であれば、自己相関指標の時系列変化を完全に再現できることを意味している。Furthermore, as the inventors of the present application continued their analysis, they found that the time series changes in the autocorrelation index could be explained almost entirely by a specific number of elements, without having to consider all 12 elements. Figure 7 shows the results of the inventors' analysis. The explanatory index on the vertical axis can be regarded as the degree of reproduction of the time series changes in the autocorrelation index, and a value of 1 means that the time series changes in the autocorrelation index can be perfectly reproduced.
最も右の1要素(1)は、「ピッチ方向の特徴ベクトルの平均値とロール方向の特徴ベクトルの平均値との差」のみを考慮した場合であり、1要素(2)は、「特徴ベクトル全体の平均値」のみを考慮した場合である。図7に示すように、ピッチ方向の特徴ベクトルの平均とロール方向の特徴ベクトルの平均値との差のみを考慮した場合には、説明指数が0であるが、特徴ベクトル全体の平均値のみを考慮した場合には説明指数が少し上昇することが分かる。これは、特徴ベクトルの差のみでは、ピッチ方向の特徴ベクトルとロール方向の特徴ベクトルの相対的な位置関係を示すのみであって、各特徴ベクトルの絶対値が反映されないためである。一方で、特徴ベクトル全体の平均値を考慮した場合には、各特徴ベクトルの絶対値が反映されるため、説明指数が上昇すると考えられる。The rightmost element (1) is the case where only the "difference between the average value of the feature vectors in the pitch direction and the average value of the feature vectors in the roll direction" is taken into consideration, and the element (2) is the case where only the "average value of all feature vectors" is taken into consideration. As shown in Figure 7, when only the difference between the average value of the feature vectors in the pitch direction and the average value of the feature vectors in the roll direction is taken into consideration, the explanation index is 0, but when only the average value of all feature vectors is taken into consideration, the explanation index increases slightly. This is because the difference between the feature vectors alone only indicates the relative positional relationship between the feature vectors in the pitch direction and the feature vectors in the roll direction, and does not reflect the absolute value of each feature vector. On the other hand, when the average value of all feature vectors is taken into consideration, the explanation index is thought to increase because the absolute value of each feature vector is reflected.
図7の2要素は、「特徴ベクトル全体の平均値」に加えて、「ピッチ方向の特徴ベクトルの平均とロール方向の特徴ベクトルの平均値との差」を考慮した場合である。図7に示すように、この場合、説明指数が0.9を超えることが分かる。これは、各特徴ベクトルの絶対値に関する情報に、ピッチ方向の特徴ベクトルとロール方向の特徴ベクトルの相対的な位置関係を示す情報が加えられるためである。The two elements in Figure 7 are the case where "the difference between the average of the feature vectors in the pitch direction and the average of the feature vectors in the roll direction" is taken into consideration in addition to "the average of all feature vectors." As shown in Figure 7, in this case, it can be seen that the explanation index exceeds 0.9. This is because information indicating the relative positional relationship between the feature vectors in the pitch direction and the feature vectors in the roll direction is added to information regarding the absolute value of each feature vector.
図7の4要素は、「特徴ベクトル全体の平均値」及び「ピッチ方向の特徴ベクトルの平均値とロール方向の特徴ベクトルの平均値との差」に加えて、「ピッチ方向の特徴ベクトルの平均値」と「ロール方向の特徴ベクトルの平均値」とを考慮した場合である。図7に示すように、この場合、説明がほぼ1になり、12要素全てを考慮したときと同程度の説明指数になることが分かる。これは、ピッチ方向の特徴ベクトルのみの絶対値とピッチ方向の特徴ベクトルのみの絶対値とが考慮されるようになるためである。The four elements in Figure 7 are the case where the "average value of feature vectors in the pitch direction" and "average value of feature vectors in the roll direction" are taken into consideration in addition to the "average value of all feature vectors" and the "difference between the average value of feature vectors in the pitch direction and the average value of feature vectors in the roll direction". As shown in Figure 7, in this case, the explanation is almost 1, and it can be seen that the explanation index is about the same as when all 12 elements are taken into consideration. This is because the absolute value of only the feature vectors in the pitch direction and the absolute value of only the feature vectors in the pitch direction are taken into consideration.
尚、図示は省略するが、前述の12要素のうち、「ピッチ方向の特徴ベクトルの傾き」や「ロール方向の特徴ベクトルの標準偏差」のみを1要素として考慮した場合には、説明指数は0になると考えられる。傾きや標準偏差は、特徴ベクトル毎の相対的な位置関係を示すのみであり、特徴ベクトルの絶対値が考慮されないためである。また、2要素を考慮する場合に、「特徴ベクトル全体の平均値」に加えて、「ピッチ方向の特徴ベクトルの傾き」や「ロール方向の特徴ベクトルの標準偏差」を考慮したとしても、「特徴ベクトル全体の平均値」及び「ピッチ方向の特徴ベクトルの平均とロール方向の特徴ベクトルの平均値との差」を2要素として採用したときよりも説明指数は低いと考えられる。これは、「ピッチ方向の特徴ベクトルの平均とロール方向の特徴ベクトルの平均値との差」は、「特徴ベクトル全体の平均値」と組み合わせることで、ピッチ方向の特徴ベクトル全体とロール方向の特徴ベクトル全体の相対的な位置関係を説明することができる一方で、傾きや標準偏差は、「特徴ベクトル全体の平均値」と組み合わせたとしても、ピッチ方向の特徴ベクトル全体とロール方向の特徴ベクトル全体の相対的な位置関係を表すことができないためである。Although not shown, if only the "tilt of the feature vector in the pitch direction" or the "standard deviation of the feature vector in the roll direction" is considered as one element among the 12 elements mentioned above, the explanatory index is considered to be 0. This is because the tilt and standard deviation only indicate the relative positional relationship of each feature vector, and the absolute value of the feature vector is not considered. In addition, when considering two elements, even if the "tilt of the feature vector in the pitch direction" or the "standard deviation of the feature vector in the roll direction" is considered in addition to the "average value of the entire feature vector", the explanatory index is considered to be lower than when the "average value of the entire feature vector" and the "difference between the average value of the feature vector in the pitch direction and the average value of the feature vector in the roll direction" are adopted as two elements. This is because, while the "difference between the average value of the feature vector in the pitch direction and the average value of the feature vector in the roll direction" can explain the relative positional relationship of the entire feature vector in the pitch direction and the entire feature vector in the roll direction by combining it with the "average value of the entire feature vector", the tilt and standard deviation cannot express the relative positional relationship of the entire feature vector in the pitch direction and the entire feature vector in the roll direction, even when combined with the "average value of the entire feature vector".
これらの解析結果から、周期性特徴量から算出される特徴ベクトルに対して、少なくとも特徴ベクトル全体の平均値、ピッチ方向の特徴ベクトルの平均値、及びロール方向の特徴ベクトルの平均値を考慮して、ドライバの異常予兆を検知するようにした。具体的には、「特徴ベクトル全体の平均値」及び「ピッチ方向の特徴ベクトルの平均値とロール方向の特徴ベクトルの平均値との差」の2要素、好ましくは、更に「ピッチ方向の特徴ベクトルの平均値」及び「ロール方向の特徴ベクトルの平均値」を加えた4要素により、自己相関指標の時系列変動パターンをほぼ説明できることが分かった。そこで、本願発明者らは、「特徴ベクトル全体の平均値」、「ピッチ方向の特徴ベクトルの平均値とロール方向の特徴ベクトルの平均値との差」、「ピッチ方向の特徴ベクトルの平均値」、及び「ロール方向の特徴ベクトルの平均値」の4要素に基づいて、ドライバの異常予兆を検知するようにした。From these analysis results, it was found that the driver's abnormal signs are detected by considering at least the average value of the entire feature vector, the average value of the feature vector in the pitch direction, and the average value of the feature vector in the roll direction for the feature vector calculated from the periodic feature amount. Specifically, it was found that the time series fluctuation pattern of the autocorrelation index can be almost explained by two elements, "average value of the entire feature vector" and "difference between the average value of the feature vector in the pitch direction and the average value of the feature vector in the roll direction", and preferably by adding "average value of the feature vector in the pitch direction" and "average value of the feature vector in the roll direction" for four elements. Therefore, the inventors of the present application have detected the driver's abnormal signs based on the four elements, "average value of the entire feature vector", "difference between the average value of the feature vector in the pitch direction and the average value of the feature vector in the roll direction", "average value of the feature vector in the pitch direction", and "average value of the feature vector in the roll direction".
図8は本実施形態に係るドライバ状態推定装置を含む車載システムの構成例を示すブロック図である。図8の車載システムにおいて、カメラ10、スピーカ11、情報提示部12、スイッチ13、及びマイク14は、車室内に搭載されている。情報処理装置20は、例えば、プロセッサ及びメモリを備えた単一のICチップ、あるいは、プロセッサ及びメモリを備えた、複数のICチップ等によって構成される。車両停止制御部40は、情報処理装置20からの指示を受けて、車両を自動的に路肩退避させて停止させる制御を行う。Figure 8 is a block diagram showing an example of the configuration of an in-vehicle system including a driver state estimation device according to this embodiment. In the in-vehicle system of Figure 8, the
カメラ10は、例えばフロントガラスの内側に設置されており、ドライバを含む車内の状況を撮影する。カメラ10によって撮影された画像は、例えば車載ネットワークを介して、情報処理装置20に送信される。カメラ10は、ドライバの微少な頭部の変動を計測可能な高性能のカメラである。尚、カメラ10に換えて、ドライバが装着する形式のセンサにより頭部挙動を計測するようにしてもよい。The
情報処理装置20において、頭部挙動検出部21は、カメラ10によって撮影された画像から、ドライバの頭部の挙動を検出する。例えば、画像からドライバの頭部を認識し、頭部の傾斜角、例えばピッチ角とロール角を求める。頭部挙動検出部21における処理は、既存の画像処理技術によって実現することができる。頭部挙動検出部21による処理によって、図4に示すような頭部挙動の時系列データを得ることができる。頭部挙動の時系列データは、ドライバの異常予兆を検知する検知部30に送られる。In the information processing device 20, the head
検知部30は、周期性特徴量演算部31、特徴ベクトル演算部32、異常判定部33、及び異常判定データベース34を備える。周期性特徴量演算部31は、頭部挙動検出部21によって得られた頭部挙動の時系列データから、周期性特徴量を演算する。具体的には例えば、DFA(Detrended Fluctuation Analysis)により、自己相関指標(スケーリング指数α)を周期性特徴量として求める。周期性特徴量演算部31によって、図5の中図に示すような周期性特徴量の時系列データを得ることができる。The
特徴ベクトル演算部32は、周期性特徴量演算部31によって得られた周期性特徴量の時系列データを、時間順に切り出し、切り出した時系列データから特徴ベクトルを演算する。The feature
異常判定部33は、特徴ベクトル演算部32によって得られたデータから、「特徴ベクトル全体の平均値」、「ピッチ方向の特徴ベクトルの平均値とロール方向の特徴ベクトルの平均値との差」、「ピッチ方向の特徴ベクトルの平均値」、及び「ロール方向の特徴ベクトルの平均値」の4要素を求める。異常判定部33は、求めた前記4要素について、異常判定データベース34に格納された所定値と比較し、ドライバに異常予兆が発生したか否かを判定する。The
検知部30は、ドライバの異常予兆状態であるときを含む時系列変動パターンを蓄積し、該蓄積した前記時系列変動パターンに基づいて、異常判定データベース34に格納された特定パターンに関するデータを修正する。The
検知部30は、異常判定部33が、異常予兆が発生したと判定したときは、ドライバへの問いかけ要求を問いかけ部22に出力する。When the
問いかけ部22は、検知部30からドライバへの問いかけ要求を受けたとき、ドライバに対して問いかけを行う。この問いかけは、車両を自動運転により緊急待避させてよいかどうか、ドライバの意思を確認するためのものである。問いかけは、例えば、スピーカ11を介して音声により行ったり、モニタ等の情報提示部12を介した表示により行ったりする。When the
応答検出部23は、問いかけ部22による問いかけに対するドライバの応答を検出する。ドライバの応答は、例えば、スイッチ13の操作や、マイク14を介した発声によって行われる。ドライバの意思が確認できたとき、あるいは、ドライバの応答がないとき、情報処理装置20は、車両停止制御部40に、車両を自動的に路肩退避させて停止させるよう指示する。The
本実施形態に係るドライバ状態推定装置は、情報処理装置20内の、頭部挙動検出部21及び検知部30を、少なくとも含む構成である。また、本開示に係るドライバ状態推定装置は、カメラ10を含む場合もある。The driver state estimation device according to this embodiment is configured to include at least a head
図9及び10は、ドライバ異常推定装置により異常予兆を検知するための処理動作を示すフローチャートである。Figures 9 and 10 are flowcharts showing the processing operations for detecting abnormality signs by the driver abnormality estimation device.
まず、ステップS1において、頭部挙動検出部21は、カメラ10によって撮影された画像から、ドライバの頭部を画像認識し、認識した頭部について、傾斜角、ここではピッチ角及びロール角を演算する。この演算は、例えば、100ms毎に行われる。First, in step S1, the head
次に、ステップS2において、検知部30は、頭部の傾斜角データが規定数以上蓄積されたか否かを判定する。検知部30は、頭部の傾斜角データが規定数以上蓄積されたYESのときには、ステップS3に進む。一方で、検知部30は、頭部の傾斜角データが規定数以上蓄積されていないNOのときには、ステップS1に戻る。Next, in step S2, the
前記ステップS3では、検知部30は、頭部の傾斜角の時系列データに対して、周期性特徴量を演算する。検知部30は、例えば、DFAにより、自己相関指標(スケーリング指数α)が、周期性特徴量として求められる。周期性特徴量の演算は、対象となる傾斜角データの時間範囲をずらしながら、例えば100ms毎に、例えば256個の傾斜角データを用いて、行われる。In step S3, the
次に、ステップS4において、検知部30は、周期性特徴量のデータが規定数以上蓄積されたか否かを判定する。検知部30は、データが規定数以上蓄積されたYESのときにはステップS5に進む。一方で、検知部30は、データが規定数以上蓄積されていないNOのときにはステップS1に戻る。Next, in step S4, the
前記ステップS5では、検知部30は、周期性特徴量に対して、特徴ベクトルを演算する。特徴ベクトルの演算は、対象となる周期性特徴量のデータの時間範囲をずらしながら、例えば100ms毎に、例えば256個の周期性特徴量のデータに対して行われる。In step S5, the
次に、ステップS6において、検知部30は、異常判定データベース34に保持されている各種所定値を取得する。Next, in step S6, the
そして、ステップS7において、検知部30は、前記ステップS5で求めた各要素の値と、ステップS6で取得した各所定値とをそれぞれ比較する。Then, in step S7, the
検知部30の判定は、図10に示す。検知部30は、ステップS71において、特徴ベクトル全体の平均値が第1所定値以下であるか否かを判定する。検知部30は、特徴ベクトル全体の平均値が第1所定値以下であるYESのときには、ステップS72に進む。一方で、検知部30は、特徴ベクトル全体の平均値が第1所定値よりも大きいNOのときには、ステップS1に戻る。The determination by the
前記ステップS72では、検知部30は、ピッチ方向の特徴ベクトルの平均値が第2所定値以下であるか否かを判定する。検知部30は、ピッチ方向の特徴ベクトルの平均値が第2所定値以下であるYESのときには、ステップS73に進む。一方で、検知部30は、ピッチ方向の特徴ベクトルの平均値が第2所定値よりも大きいNOのときには、ステップS1に戻る。In step S72, the
前記ステップS73では、検知部30は、ロール方向の特徴ベクトルの平均値が第3所定値以下であるか否かを判定する。検知部30は、ロール方向の特徴ベクトルの平均値が第3所定値以下であるYESのときには、ステップS74に進む。一方で、検知部30は、ロール方向の特徴ベクトルの平均値が第3所定値よりも大きいNOのときには、ステップS1に戻る。In step S73, the
前記ステップS74では、検知部30は、ピッチ方向の特徴ベクトルの平均値とロール方向の特徴ベクトルの平均値との差が所定範囲内であるか否かを判定する。検知部30は、前記差が所定範囲内であるYESのときには、リターンしてステップS8に進む。一方で、検知部30は、前記差が所定範囲外であるNOのときには、ステップS1に戻る。In step S74, the
前記ステップS8では、検知部30は、ドライバへの問いかけ要求を問いかけ部22に出力する。ステップS8の後は処理を終了する。In step S8, the
第1所定値、第2所定値、及び第3所定値は、ドライバの頭部挙動が規則的であると判定できる程度の大きさにそれぞれ設定されている。特徴ベクトルに関する各平均値が各所定値よりも小さいことは、自己相関指標が小さいことを表すため、頭部挙動が規則的であることを意味する。所定範囲は、従来の研究結果に基づいて、正常状態における、ピッチ方向の特徴ベクトルの平均値とロール方向の特徴ベクトルの平均値との差よりは大きく、疾患状態における、ピッチ方向の特徴ベクトルの平均値とロール方向の特徴ベクトルの平均値との差よりは小さく設定されている。例えば、従来の研究結果(非特許文献2参照)では、健常者の頭部揺動における周期性は、ロール方向に対してピッチ方向が約6%小さくなり、小脳失調者の頭部揺動における周期性は、ロール方向に対してピッチ方向が約11%大きくなるといわれている。The first, second, and third predetermined values are each set to a value large enough to determine that the driver's head behavior is regular. The fact that each average value for the feature vector is smaller than each predetermined value indicates that the autocorrelation index is small, and therefore means that the head behavior is regular. Based on the results of previous research, the predetermined range is set to be larger than the difference between the average value of the feature vector in the pitch direction and the average value of the feature vector in the roll direction in a normal state, and smaller than the difference between the average value of the feature vector in the pitch direction and the average value of the feature vector in the roll direction in a diseased state. For example, in the results of previous research (see Non-Patent Document 2), it is said that the periodicity of the head sway of a healthy person is about 6% smaller in the pitch direction than in the roll direction, and the periodicity of the head sway of a person with cerebellar ataxia is about 11% larger in the pitch direction than in the roll direction.
尚、前述のフローチャートにおいて、ステップS71~ステップS74は、順番を適宜入れ替えてもよい。また、ステップS71~ステップS74を同時進行で処理してもよい。In the above-mentioned flowchart, the order of steps S71 to S74 may be changed as appropriate. Also, steps S71 to S74 may be processed simultaneously.
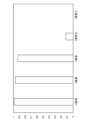
図11は、UMAPによる解析と本実施形態の手法による解析との消費メモリをそれぞれ示す。図11に示すように、UMAPを利用する場合には、100M程度必要であったメモリが10の7乗オーダーで削減されて、10程度になることが分かる。したがって、本実施形態により、消費メモリがかなり削減されて、移動体に搭載される演算装置であっても演算可能になることが分かった。Figure 11 shows the memory consumption for analysis using UMAP and analysis using the method of this embodiment. As shown in Figure 11, when UMAP is used, the memory required, which was about 100 MB, is reduced by an order of 10 to the power of 7, to about 10. Therefore, it was found that this embodiment significantly reduces memory consumption, making it possible to perform calculations even on a calculation device mounted on a moving object.
したがって、本実施形態では、センサを用いて前記ドライバの頭部のピッチ方向の挙動及びロール方向の挙動を検出する頭部挙動検出部21と、頭部挙動検出部21によって検出された各頭部挙動から、ドライバの異常予兆を検知する検知部30と、検知部30は、ドライバのピッチ方向の挙動及びロール方向の挙動を示す時系列データに対して、周期性特徴量をそれぞれ演算し、演算した各周期性特徴量に対して特徴ベクトルをそれぞれ演算し、演算したピッチ方向の特徴ベクトル及び演算したロール方向の特徴ベクトルに対して、特徴ベクトル全体の平均値、ピッチ方向の特徴ベクトルの平均値、並びに、ロール方向の特徴ベクトルの平均値、を少なくとも考慮してドライバの異常予兆の有無を検知する。Therefore, in this embodiment, a head
特に、本実施形態では、検知部30は、特徴ベクトル全体の平均値が第1所定値以下で、かつ、ピッチ方向の特徴ベクトルの平均値とロール方向の特徴ベクトルの平均値との差が所定範囲であり、ピッチ方向の特徴ベクトルの平均値が第2所定値以下で、かつ、ロール方向の特徴ベクトルの平均値が第3所定値以下である、ときにドライバが異常予兆状態であると推定するように構成されている。In particular, in this embodiment, the
これにより、周期性特徴量の時系列変動パターンによりドライバの異常予兆を検知する際に利用する要素が限定されるため、演算量を小さくすることができる。この結果、ドライバの異常予兆を出来る限り早期に検知することができるようになる。This limits the elements used when detecting signs of driver abnormalities based on the time-series fluctuation pattern of the periodic feature, thereby reducing the amount of calculations. As a result, it becomes possible to detect signs of driver abnormalities as early as possible.
(その他の実施形態)
ここに開示された技術は、前述の実施形態に限られるものではなく、請求の範囲の主旨を逸脱しない範囲で代用が可能である。 Other Embodiments
The technology disclosed herein is not limited to the above-described embodiment, and may be substituted without departing from the spirit and scope of the claims.
例えば、前述の実施形態では、頭部挙動の時系列データに対して、DFAにより、自己相関指標(スケーリング指数α)を周期性特徴量として求めるものとしたが、DFA以外の手法により周期性特徴量を求めてもよい。For example, in the above embodiment, the autocorrelation index (scaling exponent α) is calculated as a periodic feature value by DFA for time series data of head behavior, but the periodic feature value may be calculated by a method other than DFA.
また、前述の実施形態では、「特徴ベクトル全体の平均値」、「ピッチ方向の特徴ベクトルの平均値とロール方向の特徴ベクトルの平均値との差」、「ピッチ方向の特徴ベクトルの平均値」、及び「ロール方向の特徴ベクトルの平均値」の4要素を考慮してドライバの異常予兆を検知した。これに限らず、少なくとも「特徴ベクトル全体の平均値」、及び「ピッチ方向の特徴ベクトルの平均値とロール方向の特徴ベクトルの平均値との差」の2要素を考慮すればよい。また、「特徴ベクトル全体の平均値」、「ピッチ方向の特徴ベクトルの平均値」、及び「ロール方向の特徴ベクトルの平均値」の3要素によりドライバの異常予兆を検知する構成でもよい。In the above embodiment, the driver's abnormal signs were detected by considering four elements: "average value of all feature vectors," "difference between the average value of feature vectors in the pitch direction and the average value of feature vectors in the roll direction," "average value of feature vectors in the pitch direction," and "average value of feature vectors in the roll direction." This is not limiting, and it is sufficient to consider at least two elements: "average value of all feature vectors" and "difference between the average value of feature vectors in the pitch direction and the average value of feature vectors in the roll direction." In addition, the driver's abnormal signs may be detected by three elements: "average value of all feature vectors," "average value of feature vectors in the pitch direction," and "average value of feature vectors in the roll direction."
また、前述の実施形態では、移動体として自動車を例示したが、自動車以外の、例えば電車等の移動体において、前述のドライバ状態推定装置100を採用してもよい。In addition, in the above-described embodiment, an automobile is used as an example of a moving body, but the driver
前述の実施形態は単なる例示に過ぎず、本開示の範囲を限定的に解釈してはならない。本開示の範囲は請求の範囲によって定義され、請求の範囲の均等範囲に属する変形や変更は、全て本開示の範囲内のものである。The above-described embodiments are merely examples and should not be interpreted as limiting the scope of the present disclosure. The scope of the present disclosure is defined by the claims, and all modifications and variations that fall within the scope of equivalence of the claims are within the scope of the present disclosure.
ここに開示された技術は、移動体を運転するドライバの状態を推定するドライバ状態推定装置として有用である。The technology disclosed herein is useful as a driver state estimation device that estimates the state of a driver operating a mobile vehicle.
10 カメラ(センサ)
21 頭部挙動検出部
30 検知部
100 ドライバ状態推定装置10 Camera (sensor)
21 Head
Claims (3)
Translated fromJapaneseセンサを用いて前記ドライバの頭部のピッチ方向の挙動及びロール方向の挙動を検出する頭部挙動検出部と、
前記頭部挙動検出部によって検出された各頭部挙動から、前記ドライバの異常予兆を検知する検知部と、を備え、
前記検知部は、
前記ドライバのピッチ方向の頭部の挙動及びロール方向の頭部の挙動を示す時系列データに対して、周期性特徴量をそれぞれ演算し、
演算した各周期性特徴量に対して特徴ベクトルをそれぞれ演算し、
演算したピッチ方向の特徴ベクトル及び演算したロール方向の特徴ベクトルに対して、該ピッチ方向及びロール方向の各特徴ベクトル全体の平均値がドライバの頭部挙動が規則的であると判定できる程度の大きさに設定された第1所定値以下である第1条件を満たし、かつ、前記ピッチ方向の特徴ベクトルの平均値と前記ロール方向の特徴ベクトルの平均値との差が、正常状態における、ピッチ方向の特徴ベクトルの平均値とロール方向の特徴ベクトルの平均値との差よりは大きく、疾患状態における、ピッチ方向の特徴ベクトルの平均値とロール方向の特徴ベクトルの平均値との差よりは小さく設定されている所定範囲である第2条件とを満たすときに前記ドライバが異常予兆状態であると推定する、
ことを特徴とするドライバ状態推定装置。 A driver state estimation device that estimates a state of a driver who drives a moving object, comprising:
a head behavior detection unit that detects a behavior of the driver's head in a pitch direction and a behavior of the driver's head in a roll direction using a sensor;
a detection unit that detects an abnormality sign of the driver from each head behavior detected by the head behavior detection unit,
The detection unit is
calculating a periodicity feature amount for each of time series data indicatinga head behavior in a pitch direction anda head behavior in a roll direction of the driver;
A feature vector is calculated for each calculated periodic feature amount,
The driver is presumed to be in an abnormality precursor state when the calculated pitch direction feature vector and the calculated roll direction feature vector satisfy a first condition that an average value of all of the pitch direction and roll direction feature vectors is equal to or less than a first predetermined value set to a magnitude that allows the driver's head behavior to be determined to be regular, and when the difference between the average value of the pitch direction feature vector and the average value of the roll direction feature vector is within a predetermined range that is set to be larger than the difference between the average value of the pitch direction feature vector and the average value of the roll direction feature vector in a normal state and smaller than the difference between the average value of the pitch direction feature vector and the average value of the roll direction feature vector in a diseased state.
A driver state estimating device comprising:
前記検知部は、
前記第1条件および前記第2条件に加えて、
前記ピッチ方向の特徴ベクトルの平均値がドライバの頭部挙動が規則的であると判定できる程度の大きさに設定された第2所定値以下で、かつ、前記ロール方向の特徴ベクトルの平均値がドライバの頭部挙動が規則的であると判定できる程度の大きさに設定された第3所定値以下であるときに前記ドライバが異常予兆状態であると推定する、ことを特徴とするドライバ状態推定装置。 2. The driver state estimating device according to claim1 ,
The detection unit is
In addition to the first and second conditions,
a driver state estimation device which estimates that the driver is in an abnormality precursor state when an average value of the feature vectors in the pitch direction is equalto or less than a second predetermined valueset to a magnitude sufficient to determine that the driver's head behavior is regular, and when an average value of the feature vectors in the roll direction is equal to or less than a third predetermined value set to a magnitude sufficient todetermine that the driver's head behavior is regular.
センサを用いて前記ドライバの頭部のピッチ方向の挙動及びロール方向の挙動を検出する頭部挙動検出部と、a head behavior detection unit that detects a behavior of the driver's head in a pitch direction and a behavior of the driver's head in a roll direction using a sensor;
前記頭部挙動検出部によって検出された各頭部挙動から、前記ドライバの異常予兆を検知する検知部と、を備え、a detection unit that detects an abnormality sign of the driver from each head behavior detected by the head behavior detection unit,
前記検知部は、The detection unit is
前記ドライバのピッチ方向の頭部の挙動及びロール方向の頭部の挙動を示す時系列データに対して、周期性特徴量をそれぞれ演算し、calculating a periodicity feature amount for each of time series data indicating a head behavior in a pitch direction and a head behavior in a roll direction of the driver;
演算した各周期性特徴量に対して特徴ベクトルをそれぞれ演算し、A feature vector is calculated for each calculated periodic feature amount,
演算したピッチ方向の特徴ベクトル及び演算したロール方向の特徴ベクトルに対して、該ピッチ方向及びロール方向の各特徴ベクトル全体の平均値がドライバの頭部挙動が規則的であると判定できる程度の大きさに設定された第1所定値以下で、かつ、前記ピッチ方向の特徴ベクトルの平均値がドライバの頭部挙動が規則的であると判定できる程度の大きさに設定された第2所定値以下で、かつ、前記ロール方向の特徴ベクトルの平均値がドライバの頭部挙動が規則的であると判定できる程度の大きさに設定された第3所定値以下であるとき前記ドライバが異常予兆状態であると推定する、ことを特徴とするドライバ状態推定装置。a driver state estimation device which estimates that the driver is in an abnormality precursor state when, for a calculated pitch direction feature vector and a calculated roll direction feature vector, an average value of all of the pitch direction and roll direction feature vectors is equal to or less than a first predetermined value set to a magnitude that allows the driver's head behavior to be determined to be regular, the average value of the pitch direction feature vectors is equal to or less than a second predetermined value set to a magnitude that allows the driver's head behavior to be regular, and the average value of the roll direction feature vectors is equal to or less than a third predetermined value set to a magnitude that allows the driver's head behavior to be regular.
Priority Applications (1)
| Application Number | Priority Date | Filing Date | Title |
|---|---|---|---|
| JP2021017185AJP7658099B2 (en) | 2021-02-05 | 2021-02-05 | Driver State Estimation Device |
Applications Claiming Priority (1)
| Application Number | Priority Date | Filing Date | Title |
|---|---|---|---|
| JP2021017185AJP7658099B2 (en) | 2021-02-05 | 2021-02-05 | Driver State Estimation Device |
Publications (2)
| Publication Number | Publication Date |
|---|---|
| JP2022120347A JP2022120347A (en) | 2022-08-18 |
| JP7658099B2true JP7658099B2 (en) | 2025-04-08 |
Family
ID=82848908
Family Applications (1)
| Application Number | Title | Priority Date | Filing Date |
|---|---|---|---|
| JP2021017185AActiveJP7658099B2 (en) | 2021-02-05 | 2021-02-05 | Driver State Estimation Device |
Country Status (1)
| Country | Link |
|---|---|
| JP (1) | JP7658099B2 (en) |
Citations (5)
| Publication number | Priority date | Publication date | Assignee | Title |
|---|---|---|---|---|
| JP2012068841A (en) | 2010-09-22 | 2012-04-05 | Toyoda Gosei Co Ltd | Awakening device for vehicle |
| US20120169503A1 (en) | 2009-06-23 | 2012-07-05 | Riheng Wu | Drowsy driver detection system |
| WO2017065241A1 (en) | 2015-10-14 | 2017-04-20 | 国立大学法人東京工業大学 | Automated diagnostic device |
| JP2018032337A (en) | 2016-08-26 | 2018-03-01 | マツダ株式会社 | Driver's physical condition detecting device and method |
| WO2020255238A1 (en) | 2019-06-18 | 2020-12-24 | 三菱電機株式会社 | Information processing device, program, and information processing method |
- 2021
- 2021-02-05JPJP2021017185Apatent/JP7658099B2/enactiveActive
Patent Citations (5)
| Publication number | Priority date | Publication date | Assignee | Title |
|---|---|---|---|---|
| US20120169503A1 (en) | 2009-06-23 | 2012-07-05 | Riheng Wu | Drowsy driver detection system |
| JP2012068841A (en) | 2010-09-22 | 2012-04-05 | Toyoda Gosei Co Ltd | Awakening device for vehicle |
| WO2017065241A1 (en) | 2015-10-14 | 2017-04-20 | 国立大学法人東京工業大学 | Automated diagnostic device |
| JP2018032337A (en) | 2016-08-26 | 2018-03-01 | マツダ株式会社 | Driver's physical condition detecting device and method |
| WO2020255238A1 (en) | 2019-06-18 | 2020-12-24 | 三菱電機株式会社 | Information processing device, program, and information processing method |
Also Published As
| Publication number | Publication date |
|---|---|
| JP2022120347A (en) | 2022-08-18 |
Similar Documents
| Publication | Publication Date | Title |
|---|---|---|
| Kang | Various approaches for driver and driving behavior monitoring: A review | |
| EP3588372B1 (en) | Controlling an autonomous vehicle based on passenger behavior | |
| US11603104B2 (en) | Driver abnormality determination system, method and computer program | |
| Abbas et al. | Hypo-driver: a multiview driver fatigue and distraction level detection system | |
| Ma et al. | Wearable driver drowsiness detection using electrooculography signal | |
| US12263847B2 (en) | Driver abnormality determination apparatus, method and computer program | |
| CN106889983A (en) | Safe driving system | |
| US20210316736A1 (en) | Driver abnormality determination apparatus, method and computer program | |
| Pinto et al. | A deep learning approach to detect drowsy drivers in real time | |
| JP2008512153A (en) | Method and apparatus for generating personal alert level indications | |
| JP2021105958A (en) | Driver state estimation device and driver state estimation method | |
| JP7658099B2 (en) | Driver State Estimation Device | |
| Koohestani et al. | Drivers performance evaluation using physiological measurement in a driving simulator | |
| JP6772775B2 (en) | Driving support device and driving support method | |
| Arslan et al. | Vision-based drowsiness detection system using convolutional neural networks | |
| JP7631853B2 (en) | Driver State Estimation Device | |
| JP7420000B2 (en) | Condition determination device, condition determination system, and control method | |
| JP2021138310A (en) | Driver condition estimation device and driver condition estimation method | |
| US20240112337A1 (en) | Vehicular driver monitoring system with health monitoring | |
| Chiou et al. | Abnormal driving behavior detection using sparse representation | |
| JP6947556B2 (en) | On-board equipment, processing equipment and programs | |
| JP7631852B2 (en) | Driver State Estimation Device | |
| Hachisuka et al. | Drowsiness detection using facial expression features | |
| Kumar et al. | Driver Drowsiness Detection and Alert System Using Computer Vision | |
| Voinea et al. | Vision-based system for driver posture tracking to prevent musculoskeletal disorders |
Legal Events
| Date | Code | Title | Description |
|---|---|---|---|
| A621 | Written request for application examination | Free format text:JAPANESE INTERMEDIATE CODE: A621 Effective date:20231219 | |
| A977 | Report on retrieval | Free format text:JAPANESE INTERMEDIATE CODE: A971007 Effective date:20240917 | |
| A131 | Notification of reasons for refusal | Free format text:JAPANESE INTERMEDIATE CODE: A131 Effective date:20241105 | |
| A521 | Request for written amendment filed | Free format text:JAPANESE INTERMEDIATE CODE: A523 Effective date:20241219 | |
| TRDD | Decision of grant or rejection written | ||
| A01 | Written decision to grant a patent or to grant a registration (utility model) | Free format text:JAPANESE INTERMEDIATE CODE: A01 Effective date:20250225 | |
| A61 | First payment of annual fees (during grant procedure) | Free format text:JAPANESE INTERMEDIATE CODE: A61 Effective date:20250310 | |
| R150 | Certificate of patent or registration of utility model | Ref document number:7658099 Country of ref document:JP Free format text:JAPANESE INTERMEDIATE CODE: R150 |