JP7472413B2 - Generating and reading signal-bearing art using pointillism, Voronoi, and Delaunay methods - Google Patents
Generating and reading signal-bearing art using pointillism, Voronoi, and Delaunay methodsDownload PDFInfo
- Publication number
- JP7472413B2 JP7472413B2JP2020567888AJP2020567888AJP7472413B2JP 7472413 B2JP7472413 B2JP 7472413B2JP 2020567888 AJP2020567888 AJP 2020567888AJP 2020567888 AJP2020567888 AJP 2020567888AJP 7472413 B2JP7472413 B2JP 7472413B2
- Authority
- JP
- Japan
- Prior art keywords
- optical code
- signal
- image
- tiles
- payload
- Prior art date
- Legal status (The legal status is an assumption and is not a legal conclusion. Google has not performed a legal analysis and makes no representation as to the accuracy of the status listed.)
- Active
Links
Images


Classifications
- G—PHYSICS
- G06—COMPUTING OR CALCULATING; COUNTING
- G06T—IMAGE DATA PROCESSING OR GENERATION, IN GENERAL
- G06T1/00—General purpose image data processing
- G06T1/0021—Image watermarking
- G06T1/005—Robust watermarking, e.g. average attack or collusion attack resistant
- H—ELECTRICITY
- H04—ELECTRIC COMMUNICATION TECHNIQUE
- H04N—PICTORIAL COMMUNICATION, e.g. TELEVISION
- H04N1/00—Scanning, transmission or reproduction of documents or the like, e.g. facsimile transmission; Details thereof
- H04N1/32—Circuits or arrangements for control or supervision between transmitter and receiver or between image input and image output device, e.g. between a still-image camera and its memory or between a still-image camera and a printer device
- H04N1/32101—Display, printing, storage or transmission of additional information, e.g. ID code, date and time or title
- H04N1/32144—Display, printing, storage or transmission of additional information, e.g. ID code, date and time or title embedded in the image data, i.e. enclosed or integrated in the image, e.g. watermark, super-imposed logo or stamp
- H04N1/32149—Methods relating to embedding, encoding, decoding, detection or retrieval operations
- H04N1/32309—Methods relating to embedding, encoding, decoding, detection or retrieval operations in colour image data
- G—PHYSICS
- G06—COMPUTING OR CALCULATING; COUNTING
- G06T—IMAGE DATA PROCESSING OR GENERATION, IN GENERAL
- G06T1/00—General purpose image data processing
- G06T1/0021—Image watermarking
- G06T1/0028—Adaptive watermarking, e.g. Human Visual System [HVS]-based watermarking
- G—PHYSICS
- G06—COMPUTING OR CALCULATING; COUNTING
- G06T—IMAGE DATA PROCESSING OR GENERATION, IN GENERAL
- G06T1/00—General purpose image data processing
- G06T1/0021—Image watermarking
- G06T1/005—Robust watermarking, e.g. average attack or collusion attack resistant
- G06T1/0064—Geometric transfor invariant watermarking, e.g. affine transform invariant
- H—ELECTRICITY
- H04—ELECTRIC COMMUNICATION TECHNIQUE
- H04N—PICTORIAL COMMUNICATION, e.g. TELEVISION
- H04N1/00—Scanning, transmission or reproduction of documents or the like, e.g. facsimile transmission; Details thereof
- H04N1/32—Circuits or arrangements for control or supervision between transmitter and receiver or between image input and image output device, e.g. between a still-image camera and its memory or between a still-image camera and a printer device
- H04N1/32101—Display, printing, storage or transmission of additional information, e.g. ID code, date and time or title
- H04N1/32144—Display, printing, storage or transmission of additional information, e.g. ID code, date and time or title embedded in the image data, i.e. enclosed or integrated in the image, e.g. watermark, super-imposed logo or stamp
- H04N1/32149—Methods relating to embedding, encoding, decoding, detection or retrieval operations
- H04N1/3232—Robust embedding or watermarking
- G—PHYSICS
- G06—COMPUTING OR CALCULATING; COUNTING
- G06T—IMAGE DATA PROCESSING OR GENERATION, IN GENERAL
- G06T2201/00—General purpose image data processing
- G06T2201/005—Image watermarking
- G06T2201/0061—Embedding of the watermark in each block of the image, e.g. segmented watermarking
- G—PHYSICS
- G06—COMPUTING OR CALCULATING; COUNTING
- G06T—IMAGE DATA PROCESSING OR GENERATION, IN GENERAL
- G06T2201/00—General purpose image data processing
- G06T2201/005—Image watermarking
- G06T2201/0062—Embedding of the watermark in text images, e.g. watermarking text documents using letter skew, letter distance or row distance
- G—PHYSICS
- G06—COMPUTING OR CALCULATING; COUNTING
- G06T—IMAGE DATA PROCESSING OR GENERATION, IN GENERAL
- G06T2201/00—General purpose image data processing
- G06T2201/005—Image watermarking
- G06T2201/0202—Image watermarking whereby the quality of watermarked images is measured; Measuring quality or performance of watermarking methods; Balancing between quality and robustness
- G—PHYSICS
- G06—COMPUTING OR CALCULATING; COUNTING
- G06T—IMAGE DATA PROCESSING OR GENERATION, IN GENERAL
- G06T2201/00—General purpose image data processing
- G06T2201/005—Image watermarking
- G06T2201/0601—Image watermarking whereby calibration information is embedded in the watermark, e.g. a grid, a scale, a list of transformations
Landscapes
- Engineering & Computer Science (AREA)
- Multimedia (AREA)
- Signal Processing (AREA)
- Physics & Mathematics (AREA)
- General Physics & Mathematics (AREA)
- Theoretical Computer Science (AREA)
- Editing Of Facsimile Originals (AREA)
- Image Processing (AREA)
- Compression Or Coding Systems Of Tv Signals (AREA)
Description
Translated fromJapanese本技術は、一般的には、(任意選択的にホスト画像コンテンツとの統合後に)印刷用のマシン可読光学コードを生成するための画像処理、光学コードを最適化するための補足的な堅牢性測定、及び物体からそのようなコードを確実且つ効率的に読み取るための光学コードリーダに関する。The technology generally relates to image processing to generate machine-readable optical codes for printing (optionally after integration with host image content), supplemental robustness measurements to optimize the optical codes, and optical code readers for reliably and efficiently reading such codes from objects.
部分的には、本出願は、参照により本明細書に組み込まれる、出願者らの特許第9,635,378号及び公開第20170024840号に詳述されている、スパースシグナリング技術に対する強化及び改善に関係する。In part, this application relates to enhancements and improvements to sparse signaling techniques detailed in applicants' Patent No. 9,635,378 and Publication No. 20170024840, which are incorporated herein by reference.
米国において、本出願は、2018年6月8日に出願された仮出願第62/682,731号の優先権を主張するものである。In the United States, this application claims priority to Provisional Application No. 62/682,731, filed June 8, 2018.
本出願は、参照により本明細書に組み込まれる、2019年5月7日に提出された米国出願第16/405,621号、並びに2018年12月7日に提出された国際出願PCT/US18/64516号、及び2019年2月25日に提出されたPCT/US19/19410に関連する。This application is related to U.S. Application No. 16/405,621, filed May 7, 2019, and International Application Nos. PCT/US18/64516, filed December 7, 2018, and PCT/US19/19410, filed February 25, 2019, which are incorporated herein by reference.
よく知られている一次元及び二次元バーコードなどの光学コードは、至る所に存在し、様々な自動データ収集用途において非常に重要である。実際、バーコードは広く普及しているため、今では、異なるタイプのデータを担持するため、又は物体の異なる部分において同じデータを冗長的に符号化することによって可読性を改善するため、単一の物体に様々なバーコードタイプを目にするのが普通である。Optical codes, such as the familiar one-dimensional and two-dimensional barcodes, are ubiquitous and of great importance in a variety of automated data collection applications. In fact, barcodes have become so widespread that it is now common to see a variety of barcode types on a single object, either to carry different types of data or to improve readability by redundantly encoding the same data on different parts of the object.
このようなバーコードの使用増加は、包装及びラベルデザインにいくつかの難題をもたらす。第一に、各バーコードは、それが確実に読み取られ得ることを確実にするために全く異なる空間を占有しなければならない。これは、ユーザにとっての物体の価値及び魅力を増強する製品情報及び美的デザイン要素などのより重要な情報のために使用され得る貴重な空間を消費する。第二に、これは、急速にレーザスキャナに取って変わっている画像ベースのスキャナの画像処理における混乱及び複雑性の可能性を生み出す。レーザスキャナは、一度に1つずつ、特定のバーコードを対象とし得るが、画像ベースのスキャナは、光学コードのうちの1つ又は複数の部分又はすべてを含み得る画像フレームを捕捉する。第三に、これらのコードの視覚的影響を低減するために、これらのコードは、多くの場合、サイズが低減され、物体上での見つけることが難しい場所に限定されている。このことが、これらのコードの信頼性を低くし、ユーザ及び機械視覚設備が場所を特定して確実に読み取ることを難しくする。The increased use of such bar codes poses several challenges to packaging and label design. First, each bar code must occupy a completely different space to ensure that it can be reliably read. This consumes valuable space that could be used for more important information, such as product information and aesthetic design elements that enhance the value and appeal of the object to the user. Second, this creates the potential for confusion and complexity in the image processing of image-based scanners, which are rapidly replacing laser scanners. While laser scanners may target specific bar codes one at a time, image-based scanners capture image frames that may include one or more parts or all of the optical code. Third, to reduce the visual impact of these codes, they are often reduced in size and confined to hard-to-find locations on the object. This makes these codes less reliable and harder for users and machine vision equipment to locate and reliably read.
堅牢なデジタル透かしなど、他のタイプの光学コードは、これらの難題に様々な方法で対処する、従来のバーコードに代わるものを提供する。デジタル透かしは、物体上の他の画像内に隠され得、したがって貴重な専用の空間を占有しない。デジタル透かしはまた、それらが担持するデジタルデータコード(ペイロード、又はメッセージと称される)の場所を特定して確実に読み取ることの容易さを改善するために、物体表面の上に冗長的に符号化され得る。これにより、デジタル透かしペイロードが確実に復号され得る画像フレームを獲得するように物体をイメージングするタスクを単純化する。透かし技術はまた、様々な使用シナリオにおける計算効率及び自動データ収集の信頼性を改善する。そうであるのは、透かし技術が、物体又はラベルの恣意的且つ部分的な視野から、たとえ破れたり、にじんだり、又はしわくちゃになっていたとしても、信頼性の高いデータ収集を促進するためである。Other types of optical codes, such as robust digital watermarks, offer alternatives to traditional barcodes that address these challenges in a variety of ways. Digital watermarks can be hidden within other images on an object, and thus do not occupy valuable dedicated space. Digital watermarks can also be redundantly encoded onto an object's surface to improve the ease of locating and reliably reading the digital data code (called the payload, or message) they carry. This simplifies the task of imaging an object to acquire image frames from which the digital watermark payload can be reliably decoded. Watermarking techniques also improve the computational efficiency and reliability of automated data collection in a variety of usage scenarios. This is because watermarking techniques facilitate reliable data collection from arbitrary and partial views of an object or label, even if it is torn, smudged, or crumpled.
デジタル透かしは、これらの向上をもたらすが、美的要件、堅牢性要件、及びデータ容量要件を満たす改善された光学データ担持能力の必要性がある重要な用途が存在する。While digital watermarking provides these improvements, important applications exist where there is a need for improved optical data carrying capabilities that meet aesthetic, robustness, and data capacity requirements.
1つの課題は、光学コードをマスクすることができるか、又は画像コードのキャリアとして機能することさえできる画像コンテンツのないホスト画像領域のための、低侵襲の光学コードの形成である。これらの領域では、マシン可読データを担持する微細な濃淡を生成することが可能である。加えて、場合によっては、標準的な可視光スキャンの信頼性を維持しながら人間にとっては光学コードの可視性を低減するように、インク色、又はインクの組み合わせを選択することが可能である。視覚的品質の理由から、一般的には、より高い空間解像度で光学コードを生成すること、及び、コードの図形要素(例えば、ドット)が目立たないように、それらを互いから距離をとって離間することが好ましい。One challenge is the creation of minimally invasive optical codes for host image areas without image content that can mask the optical code or even act as a carrier for the image code. In these areas it is possible to generate fine shades that carry machine-readable data. In addition, in some cases it is possible to select ink colors, or ink combinations, that reduce the visibility of the optical code to humans while maintaining the reliability of standard visible light scanning. For visual quality reasons, it is generally preferable to generate optical codes with a higher spatial resolution and to space the graphical elements of the code (e.g. dots) at a distance from each other so that they are less noticeable.
しかしながら、多くの場合、これらの選択肢を不可能にする、色選択及び解像度に対する制限が存在する。多くの物体は、色選択を許さない、及び最小ドットサイズ未満でドットを確実にマークしない技術を用いて印刷又はマークされる。低解像度の感熱プリンタを使用して、時に高い印刷速度で、小さいラベル上に光学コードを印刷することが一例である。他の例としては、高解像度及び小ドットサイズで高品質及び一貫性を伴ってレンダリングすることができないドライオフセット又はフレキソ印刷のような技術を使用する、小さい包装の商業印刷が挙げられる。さらには、多くの場合、追加のインクを使用することのデザイン及び費用制約に基づいた制限が存在する。最後に、たとえレンダリング設備がより高い解像度及びより小さいドットマーキング並びに様々なカラーインクを利用することができるとしても、画像捕捉インフラストラクチャ又は画像捕捉のモードが、より高い解像度又は色情報を捕捉することができない場合がある。However, there are often limitations on color selection and resolution that preclude these options. Many objects are printed or marked using technologies that do not allow color selection and do not reliably mark dots below a minimum dot size. Printing optical codes on small labels using low resolution thermal printers, sometimes at high print speeds, is one example. Other examples include commercial printing of small packages using technologies such as dry offset or flexography that cannot render high resolution and small dot sizes with high quality and consistency. Furthermore, there are often limitations based on design and cost constraints to the use of additional inks. Finally, even if the rendering equipment can utilize higher resolution and smaller dot markings and a variety of color inks, the image capture infrastructure or mode of image capture may not be able to capture the higher resolution or color information.
別の持続的課題は、ますます小さくなる空間領域からデータを確実に読み取る必要性である。データ容量増大に対する需要は、基本的には、制限された領域からのそのデータの確実な回収と相いれない。Another persistent challenge is the need to reliably read data from increasingly small spatial regions. The demand for increasing data capacity is fundamentally at odds with the reliable retrieval of that data from limited regions.
本明細書で詳述されるように、本発明者らは、様々な用途のためにこれらの課題及び他の課題に対処するいくつかの発明的な光学コード技術を開発した。1つの発明的な技術は、視覚的品質及び堅牢性(信頼性)制約のためにパラメータを最適化する光学コードを生成するための方法である。これらのパラメータは、空間密度、ドット配置(例えば、凝集を回避するための間隔)、ドットサイズ、及び光学コード構成要素の優先度を含む。後者において、参照(同期)信号及びペイロード構成要素などのコード構成要素の優先度は、改善された堅牢性及び視覚的品質を達成するために最適化される。As detailed herein, the inventors have developed several inventive optical code techniques that address these and other challenges for a variety of applications. One inventive technique is a method for generating optical codes that optimize parameters for visual quality and robustness (reliability) constraints. These parameters include spatial density, dot placement (e.g., spacing to avoid clumping), dot size, and optical code component priorities. In the latter, the priorities of code components such as reference (synchronization) signals and payload components are optimized to achieve improved robustness and visual quality.
本発明の技術は、光学コード構成要素をシグナルリッチアートに変換するための方法を含む。これらの方法は、光学コードの優先順位付けされた構成要素を強調するように線画を描くための技術を含む。それらはまた、光学コード構成要素から、点描パターン、ボロノイ(Voronoi)パターン、及びドロネー(Delaunay)パターンを生成するための方法を含む。The techniques of the present invention include methods for converting optical code components into signal rich art. These methods include techniques for line drawing to highlight prioritized components of an optical code. They also include methods for generating pointillist, Voronoi, and Delaunay patterns from optical code components.
さらなる発明的な技術は、光学コード挿入及び復号方法である。光学コード挿入方法は、包装又はラベルデザインなどのホスト画像コンテンツ内に光学コードを統合する。挿入方法のいくつかの実施形態は、視覚的品質及び堅牢性を改善するためにホスト画像の属性を考慮及び利用する。復号方法の実施形態は、マーク付き物体の捕捉される劣化画像からペイロードを効率的且つ確実に復号する。A further inventive technique is an optical code insertion and decoding method. The optical code insertion method integrates an optical code into host image content, such as a packaging or label design. Some insertion method embodiments consider and utilize attributes of the host image to improve visual quality and robustness. Decoding method embodiments efficiently and reliably decode the payload from a captured degraded image of the marked object.
これらの発明的な方法は、光学コードジェネレータ、インサータ、オプティマイザ、及びデコーダ構成要素に実装される。これらの構成要素は、様々な種類の感熱ラベルプリンタ、プリプレスワークステーション、モバイルデバイス、及び画像ベースのバーコードスキャナに使用されるものなど、様々な種類のプロセッサによって実行されるソフトウェアモジュールに実装される。ソフトウェア命令はまた、特定用途向け集積回路、プログラマブルゲートアレイ、又はそれらの組み合わせなどの論理回路に変換され得る。These inventive methods are implemented in optical code generator, inserter, optimizer, and decoder components. These components are implemented in software modules executed by various types of processors, such as those used in various types of thermal label printers, prepress workstations, mobile devices, and image-based barcode scanners. The software instructions may also be translated into logic circuits, such as application specific integrated circuits, programmable gate arrays, or combinations thereof.
さらなる発明的な特徴は、以下の詳細な説明及び添付の図面において明らかになる。Further inventive features will become apparent from the following detailed description and accompanying drawings.
本明細書は、フロー図及び解説文を参照して本技術の実施形態について詳述する。図面及び説明は、プログラム可能なハードウェアデバイスを構成するためのソフトウェア命令によって最も一般的に実現される処理モジュールを用いて実施される。いくつかの実施形態において、そのようなソフトウェア命令は、プリンタ及びスキャナへの統合のためにファームウェアに変換されるか、又はデジタル論理回路へと変換される。This specification details embodiments of the technology with reference to flow diagrams and explanatory text. The figures and descriptions are implemented with processing modules that are most commonly implemented with software instructions to configure programmable hardware devices. In some embodiments, such software instructions are converted into firmware for integration into printers and scanners or converted into digital logic circuits.
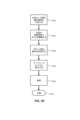
図1は、コードを視覚的品質及び信頼性制約に適合させるように、可変空間密度を有する光学コードを生成する方法を示す図である。目的は、光学コードのパラメータが最適化されるように、画像又は他のキャリア内への挿入のための光学コードを生成することである。これらのパラメータは、堅牢性及び視覚的品質を含む。本方法は、光学コード要素の所望の空間密度及び間隔も提供しながら、堅牢性メトリックに達する、又はそれを超える、光学メッセージ構成要素の優先度を決定することによって、改善された堅牢性を達成する。密度及び間隔(ドット凝集を回避するため)制約は、本方法が、視覚的品質制約を満足しながら光学コード信頼性を最適化することを可能にする。FIG. 1 illustrates a method for generating an optical code with variable spatial density to conform the code to visual quality and reliability constraints. The objective is to generate an optical code for insertion into an image or other carrier such that the parameters of the optical code are optimized. These parameters include robustness and visual quality. The method achieves improved robustness by prioritizing optical message components that meet or exceed a robustness metric while also providing a desired spatial density and spacing of the optical code elements. The density and spacing (to avoid dot clumping) constraints allow the method to optimize optical code reliability while satisfying visual quality constraints.
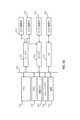
本方法は、可変ペイロード配列10及び参照(登録)信号パラメータ11の入力で始まる。これらの入力から、本方法は、光学コードの構成要素を構築する(12)。これらの構成要素は、ペイロード構成要素及び参照信号構成要素からなる。以下にさらに詳述されるように、これらの構成要素は、必ずしも明確に異なるわけではないが、これらがレンダリングされた出力に適用される堅牢性、信号容量、及び単位面積あたりの視覚的品質を提供するために最適化される必要がある。このレンダリングされた出力は、エッチング、彫刻、焼成(感熱印刷を含む)、エンボス加工(型又はエンボスプレートによる)などの他の手段によって出力画像を基材にマークすることを含め、コードを担持する画像(「出力画像」)を印刷することによってなど、光学コードでマークされる物体である。The method begins with the input of a variable payload array 10 and reference (registered) signal parameters 11. From these inputs, the method constructs (12) the components of the optical code. These components consist of payload components and reference signal components. As described in more detail below, these components are not necessarily distinct, but need to be optimized to provide the robustness, signal capacity, and visual quality per unit area that they apply to the rendered output. This rendered output is an object that is marked with the optical code, such as by printing an image bearing the code (the "output image"), including by marking the output image onto a substrate by other means such as etching, engraving, baking (including thermal printing), embossing (with a mold or embossing plate), etc.
本方法は、構成要素に適用されるべき優先度を決定する(14)。この優先度は、ドットサイズ、空間密度、及び要素(例えば、ドット又は穴)の間隔などの制約内で堅牢性を最適化する光学コードのパラメータを決定することによって導出される。The method determines (14) priorities to be applied to the components. The priorities are derived by determining parameters of the optical code that optimize robustness within constraints such as dot size, spatial density, and spacing of elements (e.g., dots or holes).
優先度を用いて、本方法は、視覚的品質制約内で光学コードを出力画像にマッピングすることに進む(16)。次いで、出力画像は、包装又はラベル材料の紙又はプラスチック基材などの物理的形態にレンダリングされる(18)。Using the priorities, the method proceeds to map the optical code to an output image within visual quality constraints (16). The output image is then rendered onto a physical form, such as a paper or plastic substrate for packaging or labeling materials (18).
図2は、光学コードのパラメータを最適化するための方法の図である。この方法は、光学コード構成要素のドット密度、ドット間隔、及び相対的優先度を最適化する。特定の用途のための光学コードを最適化するため、本方法は、その用途の画像のタイプを表すテスト画像のセットに対して動作する。例えば、生鮮食品(ベーカリー商品、肉及びデリ商品、惣菜など)への接着のために感熱プリンタによって典型的には印刷されるものなど、ラベル上で使用される光学コードの場合、テスト画像は、ラベル画像のセットである。これらのラベル画像は、テキスト、図形、及び従来の一次元又は二次元バーコードなどの視覚要素からなる。テスト画像は、通常の使用においてラベル画像の大半で見られることが予期されるテキスト、図形、及び従来の可視バーコードの混合からなる。Figure 2 is an illustration of a method for optimizing parameters of an optical code. The method optimizes dot density, dot spacing, and relative priority of optical code components. To optimize an optical code for a particular application, the method operates on a set of test images that represent the type of images for that application. For example, for an optical code used on a label, such as those typically printed by a thermal printer for application on fresh produce (bakery items, meat and deli items, prepared foods, etc.), the test images are a set of label images. These label images consist of visual elements such as text, graphics, and conventional one- or two-dimensional bar codes. The test images consist of a mix of text, graphics, and conventional visible bar codes that are expected to be found on the majority of label images in normal use.
同様に、包装の場合、テスト画像は、製品製造業者のスタイルガイドに準拠し、特定のフォント、サイズ、及び間隔のテキスト、画像、ロゴ、配色(インク及びスポットカラーを含む)、包装材料に基づいて金属、プラスチック、及び紙を含む基材タイプ、並びに好ましい印刷技術(オフセット、ドライオフセット、デジタルオフセット、インクジェット、感熱、フレキソ、及びグラビア)からなる、画像のセットである。この場合、テスト画像は、レンダリング、使用、及びスキャンに起因して画像が被る様々な形態の劣化をシミュレートする特定の包装デザインの訓練画像のセットであってもよい。Similarly, for packaging, test images are a set of images that conform to the product manufacturer's style guide and consist of text, images, logos, color schemes (including inks and spot colors) in specific fonts, sizes, and spacing, substrate types including metal, plastic, and paper based on packaging materials, and preferred printing technologies (offset, dry offset, digital offset, inkjet, thermal, flexo, and gravure). In this case, the test images may be a set of training images of a particular packaging design that simulates various forms of degradation that images undergo due to rendering, use, and scanning.
テスト画像の各々について、本方法は、挿入された光学コードを有する出力画像を生成する(20)。光学コードは、以下にさら詳述される技術を使用して、ペイロード構成要素及び参照信号構成要素から構築される。テスト画像のためのコードを構築することの出力は、空間的位置に光学コード要素のアレイをもつテスト画像である。説明を容易にするため、本発明者らは、これらの要素を「ドット」と呼び、ドットの特定の幾何学的構造は、様々な形状をとり得る。画像の形式は、その画素が、マーク信号又はマークなし信号の二進値に対応するという点で、二値である。インクで印刷する場合、マーク又はマークなしは、特定の色分解(例えば、プロセスカラーCMY若しくはK、又はスポットカラー)についてのその画素の場所におけるインク又はインクなしを指す。出力画像の画素は、テスト画像要素、光学コード要素、又は両方の混合に対応し得る。しかしながら、いくつかの実装形態において、ラベル上の画像要素(テキストを含む)から最小距離に光学コード要素の間隔を維持するか、又は、要素が現れることのない場所を別の方法で指定することが好ましい。For each of the test images, the method generates an output image with an inserted optical code (20). The optical code is constructed from payload and reference signal components using techniques described in more detail below. The output of constructing the code for the test images is a test image with an array of optical code elements at spatial locations. For ease of explanation, we refer to these elements as "dots", and the particular geometric configuration of the dots can take a variety of shapes. The format of the image is binary in that its pixels correspond to the binary value of a mark or no mark signal. When printing with ink, mark or no mark refers to ink or no ink at that pixel location for a particular color separation (e.g., process colors CMY or K, or spot color). The pixels of the output image may correspond to test image elements, optical code elements, or a mixture of both. However, in some implementations, it is preferable to keep the spacing of the optical code elements at a minimum distance from image elements (including text) on the label, or to otherwise specify locations where the elements will not appear.
各出力画像について、パラメータのセットは、各パラメータ値を、そのパラメータの値の許容可能な範囲からサンプリングすることによって、選択される。1つの実装形態において、パラメータは、光学コードのドット密度、光学コード要素の最小相互間隔、及び光学コード構成要素の優先度である。1つの実装形態において、優先度値は、光学コード要素の相対的優先度、具体的には、参照構成要素及び符号化されたデジタルペイロード構成要素の相対的重み付けとして適用される。For each output image, a set of parameters is selected by sampling each parameter value from the allowable range of values for that parameter. In one implementation, the parameters are the dot density of the optical code, the minimum inter-spacing of the optical code elements, and the priority of the optical code components. In one implementation, the priority values are applied as the relative priorities of the optical code elements, specifically the relative weighting of the reference components and the encoded digital payload components.
出力画像を生成した後、本方法は、出力画像内の光学コードの堅牢性を測定する(22)。堅牢性は、出力画像から検出メトリックを計算して、レンダリング、使用、及びスキャンに起因する劣化をシミュレートする堅牢性予測プログラムによって測定される。これらの検出メトリックは、参照により組み込まれる、米国特許第9,690,967号、同第10,217,182号、及び国際公開第2018165667号に詳述される技術を使用して計算される。同様に参照により本明細書に組み込まれる、2018年3月12日に提出された米国出願第15/918,924号も参照されたい。After generating the output image, the method measures the robustness of the optical code in the output image (22). The robustness is measured by a robustness prediction program that calculates detection metrics from the output image to simulate degradation due to rendering, use, and scanning. These detection metrics are calculated using techniques detailed in U.S. Pat. Nos. 9,690,967, 10,217,182, and WO 2018165667, which are incorporated by reference. See also U.S. Application Serial No. 15/918,924, filed March 12, 2018, which is also incorporated by reference herein.
検出メトリックは、光学コードの参照信号を測定するメトリック、及びデジタルペイロード(例えば、予期されるペイロードと一致している)からのメトリックを含む。参照信号のための1つの検出メトリックは、既知の参照信号とテスト下の画像内の参照信号との相関を測定する相関メトリックである。周波数領域において規定される参照信号のための別のメトリックは、参照信号の正弦波に対応する周波数領域位置についての隣接する値に対する周波数の大きさ値の平均である。この測度は、参照信号が、テスト画像内の他の画像要素を含め、雑音に対してどれくらい強いかを反映する。デジタルペイロードのための1つの検出メトリックは、抽出されたビットを特定のペイロードについての予期されるビットと比較することに基づいた、予期される値に一致するペイロードビット又は符号化されたビットの数の測度である。光学コードは、出力画像の連続タイル内で繰り返される。加えて、タイル内には空間的冗長性が存在する。したがって、検出メトリックは、単位面積あたりに計算され得、面積の単位は、コードが検出され得る最小面積から、水平及び垂直次元にあるいくつかの連続タイルの面積に及ぶ。Detection metrics include metrics that measure the reference signal of the optical code and metrics from the digital payload (e.g., matching the expected payload). One detection metric for a reference signal is a correlation metric that measures the correlation between a known reference signal and a reference signal in the image under test. Another metric for a reference signal defined in the frequency domain is the average of the frequency magnitude values over neighboring values for frequency domain locations corresponding to the sine wave of the reference signal. This measure reflects how robust the reference signal is to noise, including other image elements in the test image. One detection metric for a digital payload is a measure of the number of payload bits or encoded bits that match the expected value, based on comparing the extracted bits to the expected bits for a particular payload. The optical code is repeated in successive tiles of the output image. In addition, there is spatial redundancy within the tiles. Thus, the detection metric may be calculated per unit area, with the units of area ranging from the smallest area in which the code can be detected to the area of several successive tiles in the horizontal and vertical dimensions.
堅牢性を測定するプロセスは、好ましくは、レンダリング、使用、及びスキャンにおける光学コードの予期される劣化を考慮する。そうするために、劣化は、堅牢性を測定する前に出力画像上でシミュレートされる。光学コードは、スワイプ動作によって、又は提示モードによって読み取られ得るため、スキャンモードもまた、シミュレートされる。提示モードにおいて、物体は、撮像素子に提示されることが予期され、これは、撮像素子及び物体が実質的に静的であるように行われる。スキャンのモードは、光学コードの堅牢性に関わりがある。スワイプの1つの関わりは、スキャンがぼやけをもたらし得ることである。もう1つは、光学コードがスワイプの経路内の複数のタイルから読み取られ得ることである。提示モードの関わりは、撮像素子が、物体の一部、例えば、片側の部分のみを捕捉し得ることである。したがって、いくつかの異なる潜在的な物体の視点における信頼性は、全体的な堅牢性スコアで考えられる必要がある。スワイプモードの場合、堅牢性測度は、スワイプスキャンの1つ又は複数の経路に沿って検出メトリックから合計され得る。The process of measuring robustness preferably takes into account the expected degradation of the optical code in rendering, use, and scanning. To do so, the degradation is simulated on the output image before measuring robustness. Since the optical code may be read by a swipe motion or by a presentation mode, the scan mode is also simulated. In the presentation mode, the object is expected to be presented to the imager, such that the imager and the object are substantially static. The mode of scanning has implications for the robustness of the optical code. One implication of swiping is that the scan may introduce blurring. Another is that the optical code may be read from multiple tiles in the path of the swipe. An implication of the presentation mode is that the imager may only capture a portion of the object, e.g., a portion on one side. Therefore, the reliability of several different potential object viewpoints needs to be considered in the overall robustness score. In the case of swipe mode, the robustness measure may be summed from the detection metrics along one or more paths of the swipe scan.
光学コードを生成し、堅牢性を測定するプロセスは、各テスト画像について、及び最適化される各パラメータ(例えば、あるタイルについての光学コード密度における最小光学コード要素間隔、光学コード要素サイズ、及び光学コード構成要素優先度)について実行される。次いで、本方法は、パラメータ空間サンプリングあたりの堅牢性測度を伴う、堅牢性測定値のアレイを生成する(24)。パラメータ空間は、パラメータ空間座標が、パラメータ候補、例えば、優先度値、ドット間隔、ドットサイズ、ドット密度、又はこれらの候補のいくつかの部分的組み合わせである、多次元空間を指す。The process of generating the optical code and measuring the robustness is performed for each test image and for each parameter to be optimized (e.g., minimum optical code element spacing, optical code element size, and optical code component priority in the optical code density for a tile). The method then generates an array of robustness measurements with a robustness measure per parameter space sampling (24). Parameter space refers to a multidimensional space in which the parameter space coordinates are parameter candidates, e.g., priority values, dot spacing, dot size, dot density, or some subcombination of these candidates.
次に、本方法は、堅牢性測定値から最適パラメータを決定する。そうするために、本方法は、パラメータ空間内の堅牢性測定値のアレイを分析して、堅牢性測定値が所望の堅牢性制約を超えるパラメータ空間内の領域を見出す(26)。この領域は、所望の堅牢性を提供することが予期される光学コード要素間隔及び優先度のためのパラメータのセットを規定する。1つの手法において、本方法は、各テスト画像の堅牢性スコア内の最大値までの距離を最小限にする、パラメータ空間内の場所を見出す。The method then determines optimal parameters from the robustness measurements. To do so, the method analyzes the array of robustness measurements in parameter space to find a region in parameter space where the robustness measurements exceed a desired robustness constraint (26). This region defines a set of parameters for optical code element spacing and priorities that are expected to provide the desired robustness. In one approach, the method finds a location in parameter space that minimizes the distance to the maximum value in the robustness score of each test image.
光学コードのパラメータを最適化するプロセスを説明してきたが、これより、テキスト及び図形を有するラベル又は包装上にコードを一体化するのに有用な可変密度を有する光学コードの実施形態について説明する。Having described the process of optimizing the parameters of an optical code, we now describe an embodiment of an optical code with variable density that is useful for integrating a code onto a label or package having text and graphics.
図3は、光学コードを構築するためのプロセスを例証する。これは、光学コードジェネレータの実施形態である。この実施形態では、別個の可変ペイロード構成要素及び参照信号構成要素が生成され、次いで結合される。ペイロードは、各々が2つ以上の(2値又はM値)メッセージシンボル値を表すデータシンボルの配列である。用語ではM値という、整数値Mは、シンボル要素あたりの可能なシンボル値の数である。例えば、M=3の場合、シンボル値は、1、0、及び-1などの3つの状態のうちの1つを有するか、又は3つの異なる量子化ビンの信号特徴値に対応する。後者は、ホスト画像の特徴値がシンボル値に対応する量子化ビンのうちの1つに量子化される変調スキームを指す。ペイロードをより堅牢にするため、ペイロードは、誤り訂正、誤り検出、反復、及びキャリア信号の組み合わせを使用して冗長的に符号化される。Figure 3 illustrates a process for constructing an optical code. This is an embodiment of an optical code generator. In this embodiment, separate variable payload and reference signal components are generated and then combined. The payload is an array of data symbols, each representing two or more (2-ary or M-ary) message symbol values. The integer value M, referred to in terminology as M-ary, is the number of possible symbol values per symbol element. For example, if M=3, the symbol values have one of three states, such as 1, 0, and -1, or correspond to signal feature values of three different quantization bins. The latter refers to a modulation scheme in which the host image feature values are quantized into one of the quantization bins that correspond to the symbol values. To make the payload more robust, it is redundantly encoded using a combination of error correction, error detection, repetition, and carrier signals.
ブロック30における処理は、ペイロードを堅牢な符号化されたペイロード構成要素に変換し、ペイロードのシンボルは、符号化されたペイロード構成要素の複数の要素内で伝達される。これらの要素は、ある空間的配置及び振幅を有するペイロード信号波形を形成する。本処理は、ペイロードシンボルの可変ユーザデータストリングから誤り検出シンボル(2値又はM値)を計算すること、可変ユーザデータストリングを表すシンボルに誤り検出シンボルを付加すること、及び結果として生じるシンボルのシーケンスを誤り訂正して、誤り訂正符合化されたペイロードを形成することを含む。ペイロードシンボルのシーケンスは、図6と関連して説明されるように、誤り訂正符号化される。The processing in block 30 converts the payload into a robust coded payload component, where the symbols of the payload are conveyed in multiple elements of the coded payload component. These elements form a payload signal waveform having a spatial arrangement and amplitude. The processing includes computing an error detection symbol (binary or M-ary) from the variable user data string of the payload symbols, appending the error detection symbol to the symbols representing the variable user data string, and error correcting the resulting sequence of symbols to form an error correction coded payload. The sequence of payload symbols is error correction coded as described in connection with FIG. 6.
このペイロードのシンボルは、さらなる堅牢性のためにキャリア信号上に変調され得る。符合化されたペイロードは、次いで、光学コードの堅牢な符合化されたペイロード構成要素を形成するための空間的位置へマッピングされる。This payload symbol can be modulated onto a carrier signal for further robustness. The encoded payload is then mapped to spatial locations to form the robust encoded payload component of the optical code.
参照信号構成要素は、出力画像内の光学コードを検出し、幾何学的同期を実施するために使用される信号である。ブロック32における処理は、参照信号構成要素を、その空間的配置及び振幅などのその信号波形特性を指定することによって生成する。参照信号構成要素の1つのタイプは、疑似ランダム位相を有する正弦波(周波数領域内のピーク)の集まりである。空間領域において、この参照信号の画像形式は、雑音パターンに似ている。符号化されたペイロード及び参照信号を有する、このタイプの光学コードの例は、参照により組み込まれる、米国特許第6,590,996号に説明される。The reference signal component is a signal used to detect the optical code in the output image and perform geometric synchronization. The process in block 32 generates the reference signal component by specifying its signal waveform characteristics, such as its spatial location and amplitude. One type of reference signal component is a collection of sine waves (peaks in the frequency domain) with pseudorandom phase. In the spatial domain, the image form of this reference signal resembles a noise pattern. An example of this type of optical code with an encoded payload and reference signal is described in U.S. Pat. No. 6,590,996, which is incorporated by reference.
例示的な参照信号は、各々が、典型的には異なる位相で、水平及び垂直方向に3~50サイクルの間で2D空間ブロックに広がる、数十の空間正弦波からなる。整数周波数は、複合信号がブロックの両端で連続的であることを保証する。連続信号は、例えば、64×64又は128×128の参照信号を獲得するために、均一に離間した2D点においてサンプリングされる。An exemplary reference signal consists of several tens of spatial sine waves, each typically with a different phase, spanning a 2D spatial block between 3 and 50 cycles in the horizontal and vertical directions. The integer frequencies ensure that the composite signal is continuous at both ends of the block. The continuous signal is sampled at uniformly spaced 2D points to obtain, for example, a 64x64 or 128x128 reference signal.
ブロック34において、本実施形態は、符号化されたペイロード構成要素及び参照信号構成要素の要素に優先度を割り当てる。これは、割り当てられた優先度に従って重み付けを要素に適用することによって実施される。例えば、本方法は、信号要素の振幅値に、それらの要素の光学コード構成要素の優先度に比例する重み付け因子を掛ける。In block 34, the present embodiment assigns priorities to the elements of the encoded payload and reference signal components. This is accomplished by applying weights to the elements according to their assigned priorities. For example, the method multiplies the amplitude values of the signal elements by a weighting factor proportional to the priority of the optical code component of those elements.
次いで、図3の実施形態は、ブロック36において、光学コードを二次元空間画像表現へと構築する。The embodiment of FIG. 3 then constructs the optical code into a two-dimensional spatial image representation in block 36.
図4は、光学コードを構築するための別のプロセスを例証する。これは、図3の変異形であり、参照信号構成要素は、符号化されたペイロード構成要素の構成で形成される。ブロック40において、この実施形態は、符号化されたペイロード構成要素を生成する。この手法は、図3の実施形態と類似した、キャリア信号に対する誤り訂正コーディング及び変調を使用し得る。次いで、ブロック42において、この実施形態は、符号化されたペイロード要素を、参照信号構成要素を形成するパターン内へ配置する。この手法の例は、参照により組み込まれる米国特許第9,747,656号に説明される。この手法の変異形において、符号化されたペイロード要素は、固定の参照信号要素と空間的に交互にされる。固定の要素は、参照信号構成要素のパターンを形成する。Figure 4 illustrates another process for constructing an optical code. This is a variant of Figure 3, where the reference signal components are formed with a configuration of encoded payload components. In block 40, this embodiment generates the encoded payload components. This approach may use error correction coding and modulation on a carrier signal similar to the embodiment of Figure 3. Then, in block 42, this embodiment arranges the encoded payload elements into a pattern that forms the reference signal components. An example of this approach is described in U.S. Patent No. 9,747,656, which is incorporated by reference. In a variant of this approach, the encoded payload elements are spatially alternated with fixed reference signal elements. The fixed elements form the pattern of the reference signal components.
ブロック44において構成要素に優先度を割り当てるため、本実施形態は、符号化されたペイロードの信号要素及び固定の要素を重み付けする。この手法は、参照信号を形成するように配置される、重み付けされた要素の空間パターンを作り出す(46)。To assign priorities to the components in block 44, the present embodiment weights the signal and fixed elements of the encoded payload. This technique produces a spatial pattern of weighted elements that are arranged to form a reference signal (46).
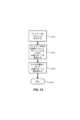
図5は、光学コードを構築するための別のプロセスを例証する図である。これは、図3の別の変異形であり、参照信号構成要素は、符号化されたペイロード信号要素のキャリアとして機能する。ブロック50において、この実施形態は、図3のブロック30について上に説明され、図6においてさらに詳述されるものと同様の様式で、符合化されたペイロード構成要素を生成する。FIG. 5 illustrates another process for constructing an optical code. This is another variant of FIG. 3, in which the reference signal components act as carriers for the encoded payload signal elements. In
ブロック52において、本実施形態は、符号化されたペイロード信号の要素で参照信号の構成要素を変調する。1つの実装形態において、参照信号は、各々が位相値を有する空間正弦波の集合を含む。ペイロードは、符号化されたペイロード信号要素の値に従って正弦波の位相をシフトすることによって符号化される。1つのプロトコルにおいて、符号化されたペイロード要素は2値であり、それらが、要素あたり2つの異なる値のうちの一方を有することを意味する。一方の2進値は、ゼロ位相シフトで表され、他方は、対応する正弦波のπ(180度)の位相シフトによって表される。他のプロトコル変異形において、符号化されたペイロード信号は、M>2のM値である。M値は、堅牢性制約によって制限され、それが高くなるほど、画像特徴部内で符号化される異なるシンボル値を区別するのは難しくなる。符号化されたペイロードは、位相をM個の対応する位相シフト状態(例えば、0、π/2、π、又は3π/2ラジアン)のうちの1つにシフトすることによって参照信号キャリア構成要素上に変調される。これは、量子化ベースの変調の形態で実施され得、参照信号構成要素の位相は、符号化されたペイロードシンボルに対応する位相シフトビン内に入るように量子化される。At block 52, the present embodiment modulates a component of a reference signal with an element of the encoded payload signal. In one implementation, the reference signal includes a collection of spatial sine waves, each having a phase value. The payload is encoded by shifting the phase of the sine waves according to the value of the encoded payload signal element. In one protocol, the encoded payload elements are binary, meaning that they have one of two different values per element. One binary value is represented by a zero phase shift, and the other is represented by a π (180 degrees) phase shift of the corresponding sine wave. In other protocol variants, the encoded payload signal is M-ary, where M>2. The M value is limited by robustness constraints, and the higher it is, the more difficult it is to distinguish different symbol values encoded within an image feature. The encoded payload is modulated onto the reference signal carrier component by shifting the phase to one of M corresponding phase shift states (e.g., 0, π/2, π, or 3π/2 radians). This may be implemented as a form of quantization-based modulation, where the phase of the reference signal components is quantized to fall within phase shift bins that correspond to the encoded payload symbols.
参照信号のすべての構成要素がペイロード信号で変調される必要はない。むしろ、参照信号のいくつかのサブセットは、変調されないままであってもよく、この変調されていない構成要素は、検出の第1の段階のための信頼性の高い信号として機能する。例えば、参照信号は、サブセット(例えば、40~60)が固定されたままであり、その他は対応するペイロード信号要素による変調に利用可能である200個の正弦波からなり得る。Not all components of the reference signal need to be modulated with the payload signal. Rather, some subset of the reference signal may remain unmodulated, with the unmodulated components serving as a reliable signal for the first stage of detection. For example, the reference signal may consist of 200 sinusoids, of which a subset (e.g., 40-60) remain fixed and the others are available for modulation with corresponding payload signal elements.
参照信号を変調するための別の手法は、参照信号構成要素のオンオフキーイングである。この手法において、参照信号正弦波のサブセットは固定され、残りは、オンオフキーイングを使用してデータを伝達するために変調される。このオンオフキーイングにおいて、符号化されたペイロードシンボルは、既定の周波数位置に正弦波を含むか、又は含まないことによって、符号化され得る。各々の符号化されたペイロード要素は、画像タイル内の周波数位置にマッピングされる。ペイロード要素が第1の2進値(例えば、0又は-1)である場合、その要素の正弦波は含まれない。逆に、ペイロード要素が第2の2進値(例えば、1)である場合、その要素の正弦波は含まれる。Another technique for modulating the reference signal is on-off keying of the reference signal components. In this technique, a subset of the reference signal sinusoids is fixed and the remainder is modulated to convey data using on-off keying. In this on-off keying, the encoded payload symbols may be encoded by including or not including a sinusoid at a predefined frequency location. Each encoded payload element is mapped to a frequency location within an image tile. If a payload element is a first binary value (e.g., 0 or -1), the sinusoid for that element is not included. Conversely, if a payload element is a second binary value (e.g., 1), the sinusoid for that element is included.
ブロック54において、本実施形態は、光学コード信号構成要素に優先度を割り当てる。これは、例えば、優先度に従って、選択された正弦波成分に倍率を適用することによって実施される。優先度が高いほど、信号構成要素は、より大きい倍率を掛けることによってより大きい重みが与えられる。加えて、異なる倍率が、固定の参照信号構成要素と変調された参照信号構成要素とに適用されて、より大きい相対的優先度を変調又は固定される参照信号の部分に提供する。In block 54, the present embodiment assigns priorities to the optical code signal components. This is done, for example, by applying scaling factors to selected sinusoidal components according to the priority. The higher the priority, the more weight the signal component is given by multiplying it by a larger scaling factor. In addition, different scaling factors are applied to the fixed reference signal components and the modulated reference signal components to provide a greater relative priority to the portions of the reference signal that are modulated or fixed.
ブロック56において、本実施形態は、変調された参照信号構成要素を有する光学コードの空間パターンを生成する。正弦波実施形態の場合、空間パターンを生成する代替の方法が存在する。1つの代替策は、逆高速フーリエ変換(FFT)など、逆周波数領域変換を周波数領域内の複合構成要素に適用することである。別の代替策は、各正弦波成分の空間領域波形から始めて、それらを一緒にして空間パターンを形成することである。正弦波の代替として、良好な自己相関を有するが低いクロス相関である、直交アレイなどの他のキャリア信号が使用されてもよい。これらの直交アレイは、二次元画像タイル内の場所にマッピングする。In block 56, the present embodiment generates a spatial pattern of the optical code with the modulated reference signal components. For the sinusoidal embodiment, there are alternative ways to generate the spatial pattern. One alternative is to apply an inverse frequency domain transform, such as an inverse Fast Fourier Transform (FFT), to the composite components in the frequency domain. Another alternative is to start with the spatial domain waveforms of each sinusoidal component and combine them together to form the spatial pattern. As an alternative to sinusoids, other carrier signals, such as orthogonal arrays, may be used that have good autocorrelation but low cross-correlation. These orthogonal arrays map to locations within the two-dimensional image tiles.
図3~5の光学コードジェネレータの各々の出力は、空間領域画像ブロックである。ブロックの画素値は、多値化され、例えば、画素あたり8ビットである。この画像ブロックは、信号タイルとして使用され得、この信号タイルが繰り返され、ホスト画像のホスト画像コンテンツと統合されて出力画像を形成する。出力画像は、プリンタ又は他のマーキング設備(エンボッサ、彫刻機、エッチング装置、又は同様のもの)によって基材上にレンダリングされるラベル又は包装デザインである。信号構成要素は、割り当てられた優先度に従って優先順位が付けられる。この優先度は、光学コードが、堅牢性及び視覚的品質制約を最適化する信号優先度並びにドット密度及び間隔に従って、ホスト画像デザインの空間領域に書き込まれることを可能にする。The output of each of the optical code generators of Figures 3-5 is a spatial domain image block. The pixel values of the block are multi-valued, e.g., 8 bits per pixel. This image block can be used as a signal tile that is repeated and integrated with the host image content of the host image to form the output image. The output image is a label or packaging design that is rendered onto a substrate by a printer or other marking equipment (embosser, engraver, etcher, or the like). The signal components are prioritized according to assigned priorities. This priority allows the optical code to be written into the spatial domain of the host image design according to signal priorities and dot density and spacing that optimize robustness and visual quality constraints.
誤解を避けるために、本文書で使用される場合「多値化」は、3つ以上の潜在的な状態を有する要素/画素を指す。例えば、それらは、グレースケール要素(例えば、8ビット表現)であってもよく、又はそれらは、浮動小数点値を有してもよい。For the avoidance of doubt, "multi-valued" as used in this document refers to elements/pixels that have more than two potential states. For example, they may be grayscale elements (e.g., 8-bit representation) or they may have floating point values.
これより、図3~図5の光学コードジェネレータの部分構成要素について詳述する。We will now provide a more detailed description of the components of the optical code generator shown in Figures 3 to 5.
図6は、光学コード内で伝達されるべき可変デジタルペイロードを符号化する方法を例証する図である。この章は、先に論じた実施形態における符号化されたペイロード構成要素をどのように生成するかのさらなる例を説明する。Figure 6 is a diagram illustrating a method for encoding a variable digital payload to be conveyed in an optical code. This section describes further examples of how to generate the encoded payload components in the embodiments discussed above.
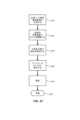
処理モジュール60において、データペイロードは、例えば、巡回冗長検査、パリティ、チェックサムなどの誤り検出メッセージシンボルなど、誤り検出ビットを計算するために処理される。同期信号など、ペイロード形式を識別し、検出を促進することに使用されるさらなる固定及び可変のメッセージが、この段階又は後続の段階で追加される。In the processing module 60, the data payload is processed to calculate error detection bits, e.g. error detection message symbols such as cyclic redundancy check, parity, checksum, etc. Further fixed and variable messages, such as synchronization signals, used to identify the payload type and facilitate detection, are added at this stage or at subsequent stages.
誤り訂正符合化モジュール62は、誤り訂正法を使用して、メッセージシンボルを符号化されたメッセージ要素(例えば、2値又はM値要素)のアレイに変換する。例としては、ブロックコード(例えば、BCH、リードソロモン、又は同様のもの)、畳み込みコード、ターボコードなどが挙げられる。Error correction encoding module 62 converts the message symbols into an array of encoded message elements (e.g., binary or M-ary elements) using an error correction method. Examples include block codes (e.g., BCH, Reed-Solomon, or the like), convolutional codes, turbo codes, etc.
反復符合化モジュール64は、堅牢性を改善するために前のステージからのシンボルのストリングを繰り返す。反復符合化は、除去され、誤り訂正コーディングで完全に置き換えられ得る。例えば、畳み込み符号化(例えば、1/3レートで)及びこれに続く反復(例えば、3回反復する)を適用するのではなく、これらの2つは、ほぼ同じ長さを有するコーディングされたペイロードを生成するために畳み込み符号化によって置き換えられ得る。The repetitive coding module 64 repeats strings of symbols from the previous stage to improve robustness. The repetitive coding may be removed and replaced entirely with error correction coding. For example, rather than applying convolutional coding (e.g., at 1/3 rate) followed by iteration (e.g., repeating three times), the two may be replaced by convolutional coding to produce a coded payload having approximately the same length.
次に、キャリア変調モジュール66が、前の段階のメッセージ要素を得て、それらを対応するキャリア信号上に変調する。例えば、キャリアは、等しい数の正及び負の要素(例えば、16、32、64個の要素)を有する疑似ランダム信号要素のアレイ、又は正弦波若しくは直交アレイなどの波形であり得る。正及び負の要素の場合、ペイロード信号は、2値対蹠信号の形態である。それはまた、3値(-1、0、1の3レベルの)又はM値信号(Mレベルの)に形成され得る。これらのキャリア信号は、空間領域位置又は空間周波数領域位置にマッピングされ得る。キャリア信号の別の例は、変調スキーム様の位相シフト、位相量子化、及び/又はオン/オフキーイングを使用して変調される、上に説明される正弦波である。Next, the carrier modulation module 66 takes the message elements of the previous stage and modulates them onto a corresponding carrier signal. For example, the carrier can be an array of pseudo-random signal elements with an equal number of positive and negative elements (e.g., 16, 32, 64 elements), or a waveform such as a sine wave or a quadrature array. In the case of positive and negative elements, the payload signal is in the form of a binary antipodal signal. It can also be made into a ternary (three levels: -1, 0, 1) or M-ary signal (M levels). These carrier signals can be mapped to spatial domain locations or spatial frequency domain locations. Another example of a carrier signal is the sine wave described above, modulated using a modulation scheme like phase shifting, phase quantization, and/or on/off keying.
キャリア信号は、符号化されたメッセージシンボルをキャリアにわたって拡散することから、さらなる堅牢性を提供する。そのようなものとして、より大きいキャリアアレイの使用は、誤り訂正に用いられる冗長性及び/又は反復コードの必要性を低減する。したがって、誤り訂正コード、反復及びキャリア信号は、所望の堅牢性及びタイルあたりの信号担持能力を達成するタイルの符号化されたペイロード信号を生成するために様々な組み合わせで使用され得る。The carrier signals provide additional robustness since they spread the encoded message symbols across the carriers. As such, the use of larger carrier arrays reduces the need for redundancy and/or repetition codes used for error correction. Thus, error correction codes, repetitions and carrier signals may be used in various combinations to generate tile encoded payload signals that achieve the desired robustness and signal carrying capacity per tile.
マッピングモジュール68は、符号化されたペイロード信号の信号要素を画像ブロック内の場所にマッピングする。これらは、画像タイル内の空間的位置であってもよい。それらはまた、空間周波数位置であってもよい。この場合、信号要素は、周波数領域値(大きさ又は位相など)を変調するために使用される。結果として生じる周波数領域値は、空間領域信号タイルを作成するために空間領域へと逆変換される。The mapping module 68 maps the signal elements of the encoded payload signal to locations within the image block. These may be spatial locations within the image tile. They may also be spatial frequency locations. In this case, the signal elements are used to modulate frequency domain values (such as magnitude or phase). The resulting frequency domain values are transformed back to the spatial domain to create spatial domain signal tiles.
マッピングモジュール68はまた、参照信号を画像ブロック内の場所にマッピングする。これらの場所は、ペイロードの場所と重複する場合と、そうでない場合とがある。符号化されたペイロード及び参照信号は、信号構成要素である。これらの構成要素は、重み付けされて、一緒に光学コード信号を形成する。The mapping module 68 also maps the reference signals to locations within the image blocks. These locations may or may not overlap with the payload locations. The encoded payload and reference signals are signal components. These components are weighted and together form the optical code signal.
ペイロードを正確に回復するため、光学コードリーダは、符号化されたデータペイロード信号要素の、画像内のそれらの場所における推定値を抽出することができなければならない。これは、リーダが、分析下の画像を同期させて、タイルの場所、及びタイル内のデータ要素の場所を決定することを必要とする。場所は、各タイルを形成する二次元ブロック内に配置される。同期装置が、各タイルの回転、スケール、及び平行移動(起源)を決定する。To accurately recover the payload, the optical code reader must be able to extract estimates of the encoded data payload signal elements at their locations within the image. This requires the reader to synchronize the image under analysis to determine the location of the tiles, and the locations of the data elements within the tiles. The locations are located within the two-dimensional blocks that form each tile. A synchronizer determines the rotation, scale, and translation (origin) of each tile.
光学コード信号は、明示的及び/又は暗黙的な参照(登録)信号を含む。明示的な参照信号は、符号化されたペイロードと一緒に、例えば、同じタイル内に含まれる、符号化されたペイロードとは別個の信号構成要素である。暗黙的な参照信号は、符号化されたペイロードで形成され、幾何学的同期を促進する構造をもつ信号である。幾何学的同期におけるその役割が理由で、本発明者らは、時に、参照信号を、同期信号、較正信号、格子信号、又は登録信号と呼ぶ。これらは同義語である。明示的及び暗黙的な同期信号の例は、参照により本明細書に組み込まれる、本発明者らの特許第6,614,914号及び同第5,862,260号に提供される。The optical code signal includes explicit and/or implicit reference (registration) signals. An explicit reference signal is a separate signal component that is included with the encoded payload, e.g., in the same tile. An implicit reference signal is a signal that is formed with the encoded payload and has a structure that facilitates geometric synchronization. Because of its role in geometric synchronization, we sometimes refer to the reference signal as a synchronization signal, a calibration signal, a grid signal, or a registration signal, which are synonymous terms. Examples of explicit and implicit synchronization signals are provided in our patents 6,614,914 and 5,862,260, which are incorporated herein by reference.
特に、明示的な同期信号の1つの例は、疑わしい信号のフーリエ領域内のピークとして現れる、疑似ランダム位相を有する正弦波のセットからなる信号である。例えば、堅牢なデータ信号と併せた同期信号の使用について説明している米国特許第6,590,996号及び同6,614,914号、並びに第5,862,260号を参照されたい。参照により組み込まれる米国特許第7,986,807号も参照されたい。In particular, one example of an explicit synchronization signal is a signal consisting of a set of sine waves with pseudorandom phases that appear as peaks in the Fourier domain of the suspect signal. See, for example, U.S. Patent Nos. 6,590,996 and 6,614,914, and 5,862,260, which describe the use of synchronization signals in conjunction with robust data signals. See also U.S. Patent No. 7,986,807, which is incorporated by reference.
同じく参照により組み込まれる本発明者らの米国公開第20120078989号及び同第20170193628号は、このタイプの構造を有する参照信号を検出し、回転、スケール、及び平行移動を決定するためのさらなる方法を提供する。米国第20170193628号は、射影歪が存在する場合にさえも、光学コードリーダを同期させること、及び、検出フィルタでデジタルペイロードを抽出することのさらなる教示を提供する。Our US Publication Nos. 20120078989 and 20170193628, also incorporated by reference, provide further methods for detecting reference signals having this type of structure and determining rotation, scale, and translation. US Publication No. 20170193628 provides further teachings of synchronizing optical code readers and extracting digital payloads with detection filters even in the presence of perspective distortion.
暗黙的な同期信号の例、及びそれらの使用は、参照により組み込まれる米国特許第6,614,914号、同5,862,260号、同6,625,297号、同7,072,490号、及び同9,747,656号に提供される。Examples of implicit synchronization signals and their uses are provided in U.S. Patent Nos. 6,614,914, 5,862,260, 6,625,297, 7,072,490, and 9,747,656, which are incorporated by reference.
図7は、光学コード構成要素の画像タイルの部分70を例証する図である。この部分は、各々がここではグレースケール値として描写される値を有する、画素のアレイ(例えば、72)からなる。タイルのこの部分は、15×15画素を有する。光学コードのために使用されるタイルサイズ及び寸法のさらなる例を下に提供する。Figure 7 is a diagram illustrating a
この構成要素は、参照信号構成要素、符号化されたペイロード構成要素、又はペイロードで符号化される参照信号として使用され得る。これはまた、参照信号構造内に配置される符号化されたペイロード信号として使用され得る。This component may be used as a reference signal component, an encoded payload component, or a reference signal encoded in the payload. It may also be used as an encoded payload signal placed within a reference signal structure.
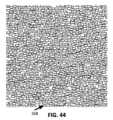
例証の目的のため、この部分70が参照信号構成要素である例を提供する。後の図に例証されるこの例を通じて、参照構成要素及びペイロード構成要素がどのようにして形成され、優先順位が付けられ、結合されて高密度光学コード信号タイルを形成するかを説明する。光学コードのこのような状態を「高密度」と呼ぶが、これは、よりスパースである可変空間密度での変換バージョン(所望のドット密度でのスパースコード信号)を生成するためにそれを使用するという意図のためである。所望のドット密度を達成するため、この高密度光学コード信号タイルは、次いで、コード信号要素の優先度に基づいて空間パターン内にマッピングされる。この例では、参照信号は、図7に描写されるように、空間領域画像に変換される正弦波を含む。これらの正弦波は、空間周波数領域内でピークを形成する。同様の効果は、同じく空間周波数領域内にピークを形成する冗長性を有する、固定又は符号化されたペイロード要素の空間パターンを使用することによって達成され得る。For illustrative purposes, an example is provided in which this
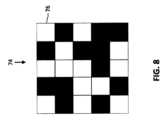
図8は、符号化されたペイロード信号のタイルの部分74を例証する図である。この部分74は、画素値が黒又は白のいずれかの2値である画素のアレイ(76)である。これらの値は、キャリア上に誤り訂正コーディングされたペイロードの2進値の各々を変調し(例えば、PN配列)、結果として生じる変調されたキャリア信号要素を画素の場所にマッピングすることによって伝達される符号化されたペイロード信号に対応する。その結果が、符号化されたペイロード信号であり、その一部が図8に描写される。Figure 8 is a diagram illustrating a
図9は、図7の光学コード構成要素の空間解像度に変換される、図8の符号化されたペイロード信号74の図である。参照信号と結合する前に、符号化されたペイロード構成要素74は、光学コードがホスト画像内に挿入される目標解像度に空間的にスケーリングされる。この目標解像度はまた、ホスト画像が物体上にレンダリングされる解像度であり得る。この例では、参照信号は、ホスト画像内への挿入のための目標解像度で生成され、符号化されたペイロード信号は、同じ目標解像度にスケーリングされる。この解像度は、例えば、多くの感熱ラベルプリンタでは1インチあたり203ドットであるか、又は、他の商用印刷機では1インチあたり300ドット若しくはそれ以上である。これらは単に例であり、目標解像度は、用途及び用いられる印刷技術により様々である。共一次若しくは三次補間、ランチョスリサンプリング、又は同様のものなど、サイズ変更のために使用される様々な技術が存在する。符号化されたペイロード信号のこの空間スケーリングは、目標のインチあたり要素解像度で画素を有する図9の右に示されるものなどの画像76をもたらす。画像76の15×15画素アレイ内の画素のグレースケール描写は、画素がもはや2値化されないことを反映する。9 is a diagram of the encoded
図10は、高密度複合コード信号78を得るための参照信号構成要素70及び符号化されたペイロード(メッセージ)構成要素76の組み合わせを例証する図である。Figure 10 is a diagram illustrating the combination of a
この例では、参照信号要素70は、レンダリングシステムの目標解像度で、対応する符号化されたペイロード信号要素76に追加される。これは、ペイロード構成要素をアップサンプリングすることを必要とし、これにより、黒又は白ではなく、中間値、即ち、グレーのいくつかの画素要素をもたらす。(同様に、ここでは双三次補間アルゴリズムによって行われるアップサンプリングは、信号値のいくらかのオーバーシュートをもたらし、結果として+1超及び-1未満のいくつか値を生じる。)要素の優先順位付けを行うため、参照構成要素又はペイロード構成要素のうちの一方に、参照信号の符号化されたペイロード信号に対する相対的な重み付けを表す重み付け因子を掛ける。この例では、ペイロード構成要素76は、0.1253の係数によって重み付けされ、参照構成要素70と合計されて、高密度の複合光学コード信号78を形成する。結果として生じる値の大きさは、光学コード信号78の個々の要素の優先度を確立する。In this example, the
図10は、浮動小数点形式で構成要素及び複合信号値を示す。ブロック70、76、及び78の各々の右側は、対応する要素値を示すグラフ尺度である。Figure 10 shows the component and composite signal values in floating point format. To the right of each of
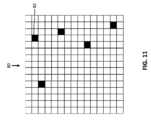
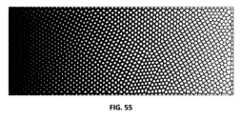
図11は、高密度複合光学コード信号の、その光学コード要素の優先度及び空間制約(例えば、要素間隔及び信号密度)に従った、出力画像80へのマッピングの図である。このマッピングでは、マッピング方法は、要素の優先度に従って出力画像80の画素の場所を充填し、最も高い優先度要素がまず充填され、その後に次に高い優先度の要素を充填する。加えて、充填プロセスは、ドット間の最小距離などの間隔(配置)制約を順守する。構成要素の優先度及び配置の両方は、図2を参照して上に説明される方法を使用して、特定のドット密度のために最適化される。マッピングの出力は、目標解像度での2値化画素からなる、光学コードの空間パターンである。2値化画素は、光学コードを基材に適用するために基材にマークされるドットに対応する。高密度光学コードの冗長的に符号化された信号内において、高密度信号のピークが、堅牢性及び信頼性を達成するためにスパースな信号内に保持するのに最も重要であるということが分かった。正及び負のピークが存在する。これらが画像の輝度において伝達されるとき、これらの正及び負のピークは、高い輝度値及び低い輝度値に対応する。同じことは、光学コードが、カラー画像又はスポットカラーの色又は彩度成分(例えば、CMY)などの色チャネルにおいて伝達される場合においても当てはまる。1つの手法では、マッピングは、相対的により高い輝度基材上の暗い画素(低輝度)に対応するピークを保持する。この手法は、図11に反映されており、暗い画素(例えば、82)は、負のピークに対応する。11 is a diagram of a mapping of a high density composite optical code signal to an
この手法は、相対的により高い輝度領域の周りの暗い画素の構成により形成される「穴」として、正のピークを符号化することによってさらに増強され得る。より高い輝度基材上では、穴は、正のピークに位置する空の画素の周りに暗い画素をマークすることによって形成される。この空の画素は、より明るい基材又はインク層が露出されることを可能にし、その結果として、イメージングされるとき、この空の画素が、その近隣の画素値に対してピークを反映する。This technique can be further enhanced by encoding the positive peaks as "holes" formed by the configuration of dark pixels around the relatively higher brightness areas. On higher brightness substrates, holes are created by marking dark pixels around the empty pixels located at the positive peaks. The empty pixels allow the lighter substrate or ink layer to be exposed, so that when imaged, the empty pixels reflect the peak relative to its neighboring pixel values.
これより、光学コードパラメータを最適化するための図2のプロセスをさらに詳述する。図12は、特定のドット密度にある光学コードのためのドット間隔及び信号構成要素優先度を最適化するためのプロセスの例を例証する図である。所望のドット密度のために最適化され得る追加のパラメータは、ドットサイズである。この例では、ドット間隔は、ドット距離として表される。優先度は、信号構成要素の相対的優先度として表される。この優先度の例は、図10と関連して説明される構成要素の相対的重み付けである。これらの優先度及び間隔パラメータは、優先度及び間隔パラメータのいくつかのパラメータ空間座標の各々における光学コードを生成して、テスト画像のセット内の各テスト画像内に挿入する訓練プロセスにおいて導出される。2 for optimizing optical code parameters. FIG. 12 is a diagram illustrating an example of a process for optimizing dot spacing and signal component priority for an optical code at a particular dot density. An additional parameter that may be optimized for a desired dot density is dot size. In this example, dot spacing is represented as dot distance. Priority is represented as the relative priority of the signal components. An example of this priority is the relative weighting of the components described in connection with FIG. 10. These priority and spacing parameters are derived in a training process that generates an optical code at each of several parameter space coordinates of the priority and spacing parameters and inserts it into each test image in a set of test images.
図12は、これらのテスト画像の堅牢性測定値のプロットを例証する。縦軸は、光学コードのドット間の最小距離であるドット距離である。横軸は、信号構成要素の、具体的には参照構成要素及び符号化されたペイロード信号構成要素の、相対的優先度である。テスト画像の堅牢性測定値は、円(例えば、84)として示され、堅牢性測定値は、グレースケール値で描写される低値(黒)から高値(白)に及ぶ。図2及び参照特許文献と関連して記されるように、堅牢性予測プログラムは、所与のレンダリング及びスキャンプロセスについてテスト画像の堅牢性を予測するために使用される。これらの参照文献は、単位面積あたりの予測されるコード検出、スコアと称される包装及びラベルのための堅牢性測定値、並びにシミュレートされた劣化及びスキャンモードに応じた堅牢性を予測するためのメトリックに関するさらなる詳細を提供する。Figure 12 illustrates plots of robustness measurements of these test images. The vertical axis is dot distance, which is the minimum distance between dots in the optical code. The horizontal axis is the relative priority of the signal components, specifically the reference components and the encoded payload signal components. The robustness measurements of the test images are shown as circles (e.g., 84), with robustness measurements ranging from low (black) to high (white) depicted in grayscale values. As noted in connection with Figure 2 and the referenced patent documents, robustness prediction programs are used to predict the robustness of the test images for a given rendering and scanning process. These reference documents provide further details regarding the predicted code detection per unit area, robustness measurements for packaging and labels referred to as scores, and metrics for predicting robustness in response to simulated degradation and scanning modes.
堅牢性予測プログラムは、それがテスト画像内で作製する検出測定の複合である、テスト画像のための堅牢性測度をもたらす。挿入プロセスは、テスト画像内に光学コードのタイルを再現する。この信号の再現及びタイル内の信号冗長性は、堅牢性プログラムが、信号タイルよりも小さい画像ブロック領域内の検出メトリックを計算することを可能にする。参照信号相関及びペイロード回復メトリックを含む、これらの検出メトリックは、空間領域ごとに計算され、画像捕捉(例えば、スワイプ動作又はマーク付き物体のカメラへの静的提示)を考慮する関数に従って、合算されて堅牢性スコアになる。ここでは、光学コードは、米国特許第9,690,967号に参照されるデジタル透かし信号技術と互換性がある。これは、これらの文書に説明される透かし信号の信号検出が、本明細書に説明される光学コードにも適用するという意味で互換性がある。光学コードは、より明るい領域ではスパースなドット、及び/又は、包装若しくはラベルデザインの空の領域若しくは濃い領域では穴の形態で、互換性のある信号を伝達する。この光学コードを包装又はラベルデザインに適用するためのプロセスは、所望のドット密度にある光学コード要素を有するデザインで領域を充填する。The robustness prediction program produces a robustness measure for the test image that is a composite of the detection measurements it makes in the test image. The insertion process reproduces tiles of the optical code in the test image. This signal reproduction and signal redundancy within the tiles allows the robustness program to calculate detection metrics in image block areas smaller than the signal tiles. These detection metrics, including reference signal correlation and payload recovery metrics, are calculated for each spatial region and summed into a robustness score according to a function that takes into account image capture (e.g., a swipe motion or static presentation of a marked object to a camera). Here, the optical code is compatible with the digital watermark signal technology referenced in U.S. Pat. No. 9,690,967. This is compatible in the sense that the signal detection of the watermark signal described in these documents also applies to the optical code described herein. The optical code conveys a compatible signal in the form of sparse dots in lighter areas and/or holes in empty or dark areas of the packaging or label design. The process for applying this optical code to a packaging or label design fills the area with a design having optical code elements at the desired dot density.
図13は、テスト画像から測定される堅牢性メトリックに基づいて、図12の例における最適なパラメータの選択を例証する図である。この例では、最適化方法は、ドット距離=4、0.7の相対的優先度の座標における、パラメータ空間内の場所(86)を、この場所が信頼性のしきい値を超える堅牢性測度を有することから、選択する。特に、この例では、この場所は、訓練プロセスで使用されるパラメータ範囲について、測定された堅牢性スコア内の最大値を提供する。Figure 13 is a diagram illustrating the selection of optimal parameters in the example of Figure 12 based on a robustness metric measured from test images. In this example, the optimization method selects a location (86) in parameter space at coordinates of dot distance = 4, relative priority of 0.7, because this location has a robustness measure that exceeds the confidence threshold. In particular, in this example, this location provides the maximum value in the robustness scores measured for the parameter range used in the training process.
1つの実装形態は、最適な堅牢性を提供するパラメータ空間内の場所を検索する。それは、テスト画像の訓練セット内の各画像についての最大堅牢性を提供する、パラメータ空間内の場所を計算することによってこれを行う。パラメータ空間は、座標が、ドット距離、ドットサイズ、ドット密度、及び信号構成要素の相対的優先度など、画像に対して変化するパラメータの値である空間として規定される。次いで、最適化方法は、テスト画像の各々の最大堅牢性の場所までの距離を最小限にする、パラメータ空間内の場所を見出す。One implementation searches for a location in parameter space that provides optimal robustness. It does this by calculating the location in parameter space that provides maximum robustness for each image in a training set of test images. The parameter space is defined as the space whose coordinates are the values of parameters that vary over the image, such as dot distance, dot size, dot density, and relative priority of signal components. An optimization method then finds the location in parameter space that minimizes the distance to the location of maximum robustness for each of the test images.
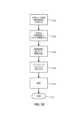
図14は、所望のドット密度を達成するように空間領域内に光学コードの要素を形成する方法を例証するフロー図である。この方法は、優先順位付けされた構成要素を有する、図10に描写されるもの(例えば、78)などの高密度の複合光学コードで始まる。この例では、優先度は、光学コード内の要素値の振幅によって指定される。本方法は、目標空間密度を達成するように光学コードの要素を出力画像の空間的位置にマッピングすることに進む。マッピングプロセスは、振幅に基づいて出力画像内の光学コードの要素の形成を優先順位付けする。より明るい領域に暗いドットを置く場合、プロセスは、光学コード内の最も暗い要素値から最も明るい要素値の順に進む。逆に、より暗い近隣領域に穴を形成する場合、プロセスは、最も明るい要素から最も暗い要素の順に進む。したがって、一般化するために、本説明では両方の場合を網羅するために最大値(max)という用語を使用し、プロセスが振幅に基づいて決定される優先度順に要素値をステップスルーする際、最大値(maxima(maxと略される))は、最も暗い又は最も明るい残りの要素値を指し得るという見方を伴う。14 is a flow diagram illustrating a method of forming elements of an optical code in a spatial region to achieve a desired dot density. The method begins with a high density composite optical code, such as that depicted in FIG. 10 (e.g., 78), with prioritized components. In this example, the priority is specified by the amplitude of the element values in the optical code. The method proceeds to map the elements of the optical code to spatial locations of the output image to achieve the target spatial density. The mapping process prioritizes the formation of the elements of the optical code in the output image based on the amplitude. When placing dark dots in lighter regions, the process proceeds from the darkest element value to the lightest element value in the optical code. Conversely, when forming holes in darker neighboring regions, the process proceeds from the lightest element to the darkest element. Thus, for generalization, the description uses the term maximum value (max) to cover both cases, with the view that the maximum value (maxima (abbreviated as max)) may refer to the darkest or lightest remaining element value as the process steps through the element values in the priority order determined based on the amplitude.
ブロック90において、マッピング方法は、高密度光学コード内の多値画素値の中から最大値を見出すことによって始まる。優先度順の発見を実施する効率的な方式は、光学コードの画素値を振幅によってソートし、次いで振幅の順にステップスルーすることである。プロセスの反復内で訪問されている値は、図14では現在の最大値と呼ばれる。現在の最大値について、プロセスは、出力画像内で以前に形成された最も近い要素との現在の最大値の場所の間隔をチェックする(92)。In block 90, the mapping method begins by finding the maximum value among the multi-valued pixel values in the dense optical code. An efficient way to perform the priority finding is to sort the pixel values of the optical code by amplitude and then step through in amplitude order. The value being visited in an iteration of the process is called the current maximum in FIG. 14. For the current maximum, the process checks the distance of the location of the current maximum with the closest element previously formed in the output image (92).
この場所が最小相互間隔距離を満足する場合(94)、プロセスは、出力画像内の場所にドットを形成する(96)。ドットは、出力画像の目標空間解像度にある光学コードのためのドットサイズ及び形状パラメータセットに従って置かれる。現在の最大値の場所が最小間隔要件を満足しない場合(94)、本方法は、高密度光学コード内の残りの要素の中から次の最大値に進み(98)、ドットは現在の最大値の場所に形成されない。配置プロセスは、目標空間密度が満たされるまでこの様式でドットを置き続ける。If this location satisfies the minimum inter-spacing distance (94), then the process forms a dot at the location in the output image (96). The dot is placed according to the dot size and shape parameters set for the optical code at the target spatial resolution of the output image. If the location of the current maximum does not satisfy the minimum spacing requirement (94), then the method proceeds to the next maximum among the remaining elements in the high density optical code (98) and a dot is not formed at the location of the current maximum. The placement process continues placing dots in this manner until the target spatial density is met.
より暗い周辺要素の中央により明るい「穴」を形成するプロセスは、最大値が光学コードの最も明るい要素値に対応するという点を除き、同様の方式で進む。穴は、出力画像位置に画素値を、その場所にインクが適用されないか、又は近隣の場所にあるより暗いインクに対するより明るいインクが適用されるように設定することによって形成される。いくつかの変異形において、ドット及び逆のもの(穴)の両方は、最小間隔要件を満足する離間した場所に形成される。これは、光学コードのより多くの信号が出力画像内に保持されるため、信号担持能力及び信号堅牢性を増大するという利点を有する。The process of creating lighter "holes" in the middle of darker surrounding elements proceeds in a similar manner, except that the maximum value corresponds to the lightest element value of the optical code. Holes are created by setting pixel values at output image locations such that either no ink is applied to that location, or lighter ink is applied relative to the darker ink in nearby locations. In some variants, both dots and inverses (holes) are created at spaced locations that meet minimum spacing requirements. This has the advantage of increasing signal carrying capacity and signal robustness, since more of the signal of the optical code is retained in the output image.
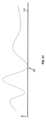
図15~図22は、このプロセスを、1次元で高密度光学コードを表す波形100によりグラフで例証する。離散的なデジタル形式において、高密度光学コード信号は、目標空間解像度でサンプリングされる、画素の場所の二次元アレイのためのレベル(例えば、8ビット値の場合は0~255)に量子化される。波形100は、最小値102、104、及び最大値106、108、110を有する。シグナリングスキームに応じて、最小から最大への値は、最も暗いものから最も明るいものに及ぶか、又はその逆である。例証の目的のため、最小から最大への値が、最も暗いものから最も明るいものに及ぶ例を説明する。Figures 15-22 graphically illustrate this process with a
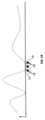
図16は、出力画像内に光学要素を形成するプロセスの開始を描写する。述べられるように、図14の方法は、優先度の順に要素を形成し、優先度は、振幅で伝達される。波形100に向かって動く線112は、振幅の順で光学コードの要素を訪問する手法を描写し、最小値から始まり上方に進む。図16は、光学コードの波形をその元の空間構成で示すが、その離散的な振幅値は、好ましくは、振幅によってソートされ、その結果として、本方法は、ソートされたリストをステップスルーすることによって効率的に前進する。Figure 16 depicts the beginning of the process of forming optical elements in the output image. As noted, the method of Figure 14 forms elements in order of priority, with priority being conveyed in amplitude.
図17において、プロセスは、最も暗い要素を見出す(102)。図18に示されるように、光学コード要素は、この場所に形成され(102)、リング114内に描写される最小間隔は、本方法が出力画像内に光学コードのさらなる要素を形成するときに実施される。最小距離は、ドット要素102の外縁と光学コード信号から形成される最も近い近隣ドット要素との間の最小距離である。In FIG. 17, the process finds the darkest element (102). As shown in FIG. 18, an optical code element is formed at this location (102), and the minimum spacing depicted in
図19は、次に高い優先度を有し、最小間隔制約(リング120、122によって例証される)も満足する、光学コード内の場所における2つの追加要素(116、118)の配置を描写する。本方法が進むと、これは、図20に示されるような場所124における別の極小値の場所にある出力画像内のドットを訪問し、形成する。この例は、本方法がどのようにして信号ピーク周辺の出力画像内の光学コード信号要素の要素の配置を優先順位付けするかを例証するが、それは、これらのピークが光学コードの堅牢性及び信頼性において最も重要である信号構成要素を伝達するためである。この点をさらに描写するため、図21は、最小値102(図15)の周辺の別のドットである次に高い優先度にある別のドット126の形成を示す。本プロセスは、出力画像内の光学コード要素を形成することからのドット密度が、所望のドット密度に達するときに完結する。図22は、一次元でのドットの配置を示すが、本プロセスは、二次元出力画像タイルでのドットの配置に適用する。19 depicts the placement of two additional elements (116, 118) at a location in the optical code that has the next highest priority and also satisfies the minimum spacing constraint (exemplified by
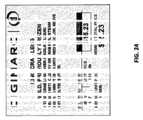
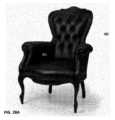
多くの用途にとって、マッピングされた光学コード要素を含む出力画像は、ホスト画像と統合され、次いでこれが基材に印刷されるか、又は別の方法でマークされる。図23~図24は、この出力画像がラベルテンプレートから生成されるラベルデザインと統合される例を例証した。ラベルデザインは、上部のブランド識別子及びロゴなどのプログラム可能な要素、並びに製品情報を提供するテキストを含む。ラベルデザインはまた、重さ及び価格など、スケール内に動的に生成された情報を含む。For many applications, the output image containing the mapped optical code elements is merged with a host image, which is then printed or otherwise marked on a substrate. Figures 23-24 illustrate an example where this output image is merged with a label design generated from a label template. The label design includes programmable elements such as a brand identifier and logo at the top, as well as text providing product information. The label design also includes dynamically generated information within the scale, such as weight and price.
光学コードの出力画像(例えば、目標空間密度におけるその「スパースな」形式)を、ラベル又は包装デザイン画像などのホスト画像と統合するためのいくつかの戦略が存在する。各々において、目標空間解像度にある光学コードのタイルは、ホスト画像全体にわたって連続ブロック内に複製され、次いでホスト画像と統合される。統合のための1つの方法は、光学コード画像をホスト画像と重ねることである。例えば、ドット要素は、ホスト画像内に置かれる。ホスト及び光学コードタイルの両方が2値であるため、ホスト又は光学コードのいずれかがドットを有する場合、プリンタはドットを印刷する。別の方法は、重要なテキストコンテンツ(価格及び重さなど)の文字の境界からの侵入禁止距離を順守しながら、光学コードの要素がホスト画像内に形成されるというインテリジェントオーバーレイを行うことである。より詳細には、ドット要素は、それが重要なホスト画像文字又は図形(従来のバーコード線など)の外側境界から予め定められた侵入禁止距離内にあるところを除いて、光学コードのすべての場所に置かれる。(重要なテキスト及び他の図形の周辺のそのような侵入禁止保護帯域は、先に参照される、公開第20170024840号に詳述されている。)There are several strategies for integrating the output image of the optical code (e.g., its "sparse" form at a target spatial density) with a host image, such as a label or packaging design image. In each, tiles of the optical code at the target spatial resolution are replicated in contiguous blocks across the host image and then integrated with the host image. One method for integration is to overlay the optical code image with the host image. For example, dot elements are placed in the host image. Since both the host and the optical code tiles are binary, if either the host or the optical code has a dot, the printer prints a dot. Another method is to do an intelligent overlay where elements of the optical code are formed in the host image while respecting no-go distances from the boundaries of characters of significant text content (such as price and weight). More specifically, dot elements are placed everywhere in the optical code except where it is within a predefined no-go distance from the outer boundaries of significant host image characters or figures (such as conventional barcode lines). (Such no-trespass guard bands around important text and other graphics are described in detail in Publication No. 20170024840, referenced above.)
さらに別の手法は、光学コードが、重要でないホスト画像情報よりも上に優先順位が付けられるように、光学コード要素の場所にあるホスト画像を変調することである。光学コードは、例えば、光学コード信号の出力画像に対応するドット又は穴でホスト画像を変調することによって形成される。ドットは、光学コードの暗い要素を符号化するために置かれ、穴は、光学コードの明るい要素を符号化するために形成される。Yet another approach is to modulate the host image in place of the optical code elements so that the optical code is prioritized above less important host image information. The optical code is formed, for example, by modulating the host image with dots or holes that correspond to the output image of the optical code signal. Dots are placed to encode the dark elements of the optical code and holes are formed to encode the light elements of the optical code.
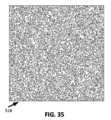
図23は、光学コードの出力画像がタイル化され、次いで統合されているラベルの例を例証する。これは、感熱印刷されたラベルの描写であり、列の一部がゼロに設定されており、これは印刷ラベルをもたらした感熱プリンタの印刷要素の故障に対応する。熱印刷要素が故障すると、それはもはや、その印刷要素を通過するラベルストックの列に沿ってラベルをマークしなくなる。本発明のテストは、所望の空間密度のために光学コードを最適化するための本発明の方法が、印刷要素の故障に起因する情報の損失に対する改善された堅牢性を達成することを明らかにする。Figure 23 illustrates an example of a label where the output image of the optical code is tiled and then merged. This is a depiction of a thermally printed label where some of the columns are set to zero, which corresponds to the failure of a printing element in the thermal printer that resulted in the printed label. When a thermal printing element fails, it no longer marks a label along the column of label stock that passes through it. Testing of the present invention reveals that the method of the present invention for optimizing an optical code for a desired spatial density achieves improved robustness to loss of information due to printing element failure.
図24は、要素のさらにより太い列がゼロに設定されている(ドット要素が印刷されないことを意味する)、光学コードと統合されるラベルデザインの例を例証する。ここでも、この場合、本発明の方法は、画像劣化にもかかわらずペイロードがきちんと符号化されることを可能にする、改善された堅牢性を提供する。Figure 24 illustrates an example of a label design integrated with an optical code in which even thicker columns of elements are set to zero (meaning that the dot element is not printed). Again, in this case, the method of the present invention provides improved robustness, allowing the payload to be properly encoded despite image degradation.
図25は、光学コードのタイルがテキストと統合されているさらに別の例である。本発明者らは、様々なフォントサイズで示されるようなテキストと統合された光学コードをテストし、様々なフォントサイズにわたって増大された堅牢性を見出した。フォントサイズ及びテキスト密度は、光学コードの異なる空間密度で光学コードのパラメータを最適化するために使用されるテスト画像内に含まれ得るさらに追加の特徴である。Figure 25 is yet another example where tiles of an optical code are integrated with text. The inventors have tested the optical code integrated with text as shown at various font sizes and found increased robustness across various font sizes. Font size and text density are further features that may be included in the test images used to optimize the parameters of the optical code at different spatial densities of the optical code.
光学コード信号構成要素の優先順序付けPrioritization of optical code signal components
元の状態の高密度光学コードのホスト画像のアートワークへの変換は、光学コードのデータ信号の損失を結果として生じる。これは、この変換が、高密度データ信号タイルの部分が、よりスパースな空間密度(タイルあたりより低いドット密度)に変換されるときに、それを除去する、又は歪ませることが理由で起こる。加えて、出力画像が挿入されるホスト画像のテキスト、図形、及び他の画像コンテンツが、光学コードを妨害し得る。図形要素のスパース性が増大すると、データ信号要素は除去又は変更され、これが堅牢性を低減する。これは、出力の所与のタイル領域内のデータチャネルの容量を低減する。The conversion of a high density optical code in its original state to the artwork of a host image results in a loss of the data signal of the optical code. This occurs because the conversion removes or distorts portions of the high density data signal tiles as they are converted to a sparser spatial density (lower dot density per tile). In addition, text, graphics, and other image content of the host image into which the output image is inserted may interfere with the optical code. As the sparsity of the graphics elements increases, data signal elements are removed or altered, which reduces robustness. This reduces the capacity of the data channels within a given tile region of the output.
データ信号をアートワーク内に組み込むことは、アートワークのデータチャネル内の信号構成要素の優先順位付けにも影響を及ぼす。これは、アートワークが信号構成要素を別様に妨害し得ることが理由で起こる。加えて、信頼性の高い検出を達成するために参照信号(例えば、同期信号)及びペイロード信号のために設けられる信号容量の量は、アートワークデザインにより変化する。したがって、信号構成要素の比率は、アートワークのために適合されなければならない。The incorporation of data signals into the artwork also affects the prioritization of signal components within the artwork's data channels. This occurs because the artwork may interfere with signal components differently. In addition, the amount of signal capacity provided for reference signals (e.g., synchronization signals) and payload signals to achieve reliable detection varies with the artwork design. Thus, the ratio of signal components must be adapted for the artwork.
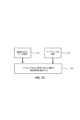
ここでは、堅牢性の損失に対抗するように信号構成要素を優先順位付けするための戦略について論じる。図26は、データ信号を最適に担持するアートワークを生成することに使用する前にデータ信号の要素を重み付けする方法を例証する図である。光学コード信号ジェネレータは、信号構成要素を生成する。これらは、ペイロードビットのサブセットを担持する構成要素(130)、及び参照信号(例えば、同期信号)を提供する構成要素(132)を含む。ブロック134において、光学コード信号ジェネレータは、構成要素を、それらの優先度に従って重み付けする。この優先度は、次いで、データ信号要素のうちのどれが保持されるかを制御するために、アートワーク生成において使用される。Here, we discuss strategies for prioritizing signal components to counteract loss of robustness. FIG. 26 is a diagram illustrating a method for weighting elements of a data signal before using it to generate artwork that optimally carries the data signal. An optical code signal generator generates signal components. These include components (130) that carry a subset of payload bits and components (132) that provide reference signals (e.g., synchronization signals). In block 134, the optical code signal generator weights the components according to their priority. This priority is then used in the artwork generation to control which of the data signal elements are retained.
光学コード信号のタイルを担持するようにホスト画像を適合するための1つの手法において、ホスト画像に光学コード信号を挿入するためのプロセスは、候補アートワークデザインのためのペイロード構成要素及び参照構成要素に対する異なる重み付け、並びに挿入戦略を用いて実行される。これにより、データ信号を担持するアートワークのいくつかの変異形を得る。各変異形のさらなる並べ替えは、次いで、画像シフト、回転角度、減少及び拡大する空間スケール、雑音追加、ぼやけ、並びに印刷要素故障のシミュレーションに従って、アートワークを歪ませることによって生成される。同期のための参照信号との相関及びメッセージ信号との相関の両方に基づいた堅牢性測度は、各アートワーク変異形について計算され、記憶される。加えて、光学コードリーダは、各変異形に対して実行されて、それがペイロードをきちんと復号するかどうかを決定する。次いで、構成要素重み付け及び堅牢性メトリックしきい値が、ペイロード復号の成功をもたらす構成要素の配分比率を分析することによって導出される。この配分は、どの比率及び堅牢性メトリック値が信頼性の高い検出をもたらすために必要とされるかを例証する。これらの比率及び堅牢性メトリックは、次いで、候補アートワークデザイン、及び自動データ符号化プログラムにおける信号符号化方法のために使用される。In one approach for adapting a host image to carry tiles of an optical code signal, a process for inserting an optical code signal into a host image is performed with different weightings and insertion strategies for payload and reference components for candidate artwork designs. This results in several variants of the artwork carrying data signals. Further permutations of each variant are then generated by distorting the artwork according to image shifts, rotation angles, decreasing and increasing spatial scales, noise addition, blurring, and simulation of print element failures. A robustness measure based on both correlation with a reference signal for synchronization and correlation with a message signal is calculated and stored for each artwork variant. In addition, an optical code reader is run on each variant to determine whether it successfully decodes the payload. Component weightings and robustness metric thresholds are then derived by analyzing the distribution ratios of components that result in successful payload decoding. This distribution illustrates what ratios and robustness metric values are required to result in reliable detection. These ratios and robustness metrics are then used for the candidate artwork designs and the signal encoding methods in the automatic data encoding program.
別の手法は、スパースなアートワーク内のデータ信号を最適化する。スパースなアートワークに対応するため、データ信号もまたスパースであり、スパースなアートワークと一致するように構造化される。スパースなデータ信号は、2値(0、1)、3値(-1、0、1)、又は他の粗い量子化であり得る。スパースな信号は、典型的には、低密度、即ち、50%未満のインク、又は50%未満の空間である。そのような信号は、50%で最大堅牢性を有するため、いかなる最適なスパースなアルゴリズムも、インク/空間密度が50%の方へ向かうにつれて堅牢性が増大するはずである。Another approach optimizes the data signal in sparse artwork. To accommodate sparse artwork, the data signal is also sparse and structured to match the sparse artwork. The sparse data signal can be binary (0,1), ternary (-1,0,1), or other coarse quantization. Sparse signals are typically low density, i.e., less than 50% ink or less than 50% space. Such signals have maximum robustness at 50%, so any optimal sparse algorithm should be increasingly robust as the ink/space density moves towards 50%.
スパースな信号は、2値又は3値信号を作成するためにしきい値を使用することによって堅牢性を維持する。これらの2値又は3値信号は、検出フィルタが、所望の信号位置で最大値を返すことを確実にする。アートワーク内のスパースな場所間で、検出フィルタは、画像捕捉によってもたらされるランダム雑音(具体的には、スキャナ又はカメラ雑音)に起因する最大の負の出力と正の出力との間のガウス分布を出力する。ガウス幅は、画像捕捉処理に含まれるぼやけの量などの因子に依存する。Sparse signals maintain robustness by using thresholds to create binary or ternary signals that ensure the detection filter returns maxima at the desired signal locations. Between sparse locations in the artwork, the detection filter outputs a Gaussian distribution between the maximum negative and positive outputs due to random noise introduced by the image capture (specifically scanner or camera noise). The Gaussian width depends on factors such as the amount of blurring included in the image capture process.
スパースな信号の最適化の間、少量のフィルタされた雑音が、画像捕捉デバイスの雑音に起因して検出フィルタが非ゼロ値を所かまわず作成するということを考慮して追加される。スパースな信号の最適化パラメータは、ペイロード信号に対する参照信号の重み付け、要素配置規則(例えば、最小要素間隔)、及びしきい値を含む。2値信号の場合は単一のしきい値が存在する。それは、低インク密度<50%では負のしきい値、高インク密度>50%では正のしきい値である。3値信号の場合は二重の正及び負のしきい値が存在する。堅牢性目標は、高密度信号とスパースな信号とで同じである。具体的には、それは、目標とするワークフロー環境における検出堅牢性であり、これは、符号化されたアートワークに対する歪によりモデル化される。During sparse signal optimization, a small amount of filtered noise is added to account for the fact that the detection filter creates non-zero values everywhere due to noise in the image capture device. Optimization parameters for sparse signals include weighting of the reference signal relative to the payload signal, element placement rules (e.g., minimum element spacing), and thresholds. For binary signals, there is a single threshold: a negative threshold for low ink density <50% and a positive threshold for high ink density >50%. For ternary signals, there are double positive and negative thresholds. The robustness goal is the same for dense and sparse signals. Specifically, it is detection robustness in the target workflow environment, which is modeled by distortions to the encoded artwork.
データ信号マッピングData signal mapping
図27は、データ信号要素をホスト画像アートワーク内の場所にマッピングする方法を例証する図である。この実施形態において、先に論じた信号生成からの最適化されたデータ信号構成要素136は、ホスト画像アートワークの場所138にマッピングされる。処理モジュール140において、図形要素は、アートワークの場所において、生成され、及び/又は適合される。図形要素は、インクなどのマーキングを除去すること、又はある場所に追加することによって形成される。同様に、前から存在するアートワークは、コードを運搬する輝度又はクロミナンス変化をもたらすために、その場所にマッピングされるタイル内の光学コード信号に従ってマーキングを修正、追加、又は除去することによって適合される。Figure 27 is a diagram illustrating a method for mapping data signal elements to locations in the host image artwork. In this embodiment, optimized
図6の方法を適用すると、ペイロードは、2進数列にフォーマッティングされ、これが、符号化され、タイルの場所にマッピングされる。例証のため、ビットセルのN×Mアレイの実装形態を説明する。パラメータN及びMは、整数であり、タイルは、ビットセルのN×Mアレイからなる。タイルのサイズは、構成可能であり、単位面積あたりのペイロード容量、堅牢性、及び可視性などの用途要件に依存する。ペイロード容量は、単位面積あたりのビットセルの増加に伴って単位面積あたりに増加する。この追加の容量は、複数のビットセル内でペイロードを冗長的に符号化することによって堅牢性を改善するために使用され得る。可視性は、HVSがより高い空間周波数では変化に対して感受性が低いため、より高い空間解像度(ビットセルのより高い空間密度)では減少する傾向がある。ビットセルアレイサイズの例は、64×64セル、128×128セル、256×256セル、及び512×512セルを含む。これらの各々は正方形であり、2の累乗の寸法を有するが、タイルは、そのように制限される必要はない。ビットセルは、タイル内の空間的位置に対応する。特に、空間的位置は、75~600DPIなどの構成可能な空間解像度にある画素サンプルに対応する。ペイロードは、ホスト画像アートワークの連続タイル内で繰り返される。ペイロードのインスタンスは、各タイル内で符号化され、タイルあたりのビットセルの数及び空間解像度に依存するサイズを有するアートワークのブロックを占有する。タイルは、いくつかの連続タイル内で冗長的に符号化されて、検出器がタイルにわたるペイロードの信号推定値を蓄積すると、さらなる堅牢性を提供する。加えて、ペイロード全体は、サブタイル領域内で冗長的に符号化される構成にあるタイルの一部分から抽出され得る。Applying the method of FIG. 6, the payload is formatted into a binary string, which is encoded and mapped to tile locations. For illustration purposes, an implementation of an N×M array of bit cells is described. The parameters N and M are integers, and a tile consists of an N×M array of bit cells. The size of the tile is configurable and depends on the application requirements, such as payload capacity per unit area, robustness, and visibility. Payload capacity increases per unit area with an increase in bit cells per unit area. This additional capacity can be used to improve robustness by redundantly encoding the payload in multiple bit cells. Visibility tends to decrease with higher spatial resolution (higher spatial density of bit cells) because the HVS is less sensitive to changes at higher spatial frequencies. Examples of bit cell array sizes include 64×64 cells, 128×128 cells, 256×256 cells, and 512×512 cells. Each of these is square and has dimensions that are a power of two, but tiles need not be so limited. The bit cells correspond to spatial locations within the tile. In particular, the spatial locations correspond to pixel samples at a configurable spatial resolution, such as 75-600 DPI. The payload is repeated within successive tiles of the host image artwork. An instance of the payload is encoded within each tile, occupying a block of the artwork with a size that depends on the number of bit cells per tile and the spatial resolution. The tiles are redundantly encoded within several successive tiles to provide further robustness as the detector accumulates signal estimates of the payload across the tiles. Additionally, the entire payload can be extracted from a portion of the tile in a configuration that is redundantly encoded within the subtile region.
いくつかの例は、タイルのこれらのパラメータを例証するのに役立つ。タイル内のビットセルの空間解像度は、インチあたりのセル(CPI)に関して表現され得る。この表記は、典型的にはインチあたりのドット(DPI)に関して表現される画像内の画素にビットセルを空間的に関連させる簡便な方法を提供する。例えば、75CPIのビットセル解像度とする。タイルが、300DPIの画素解像度を有する画像へと符号化されるとき、各ビットセルは、300DPI画像内の画素の4×4アレイに対応する。別の例として、150CPIにおける各ビットセルは、300DPI画像内の2×2画素の領域、及び600DPI画像内の4×4画素の領域に対応する。ここで、N×Mビットセルに関してタイルサイズを検討し、ビットセルのサイズを設定する場合、ビットセル寸法にタイルの水平次元及び垂直次元あたりのビットセル数を掛けることによってタイルサイズを表現することができる。以下は、異なるCPIについてのインチでのタイルサイズ、及び1つの次元におけるビットセルの数Nの例の表である。この場合、タイルは、N×Nビットセルの正方形アレイである。
これらの例は、タイルサイズが、タイルあたりのビットセル及びビットセルの空間解像度により変化することを例証する。開発者は、データ容量、堅牢性、及び可視性に関して、用途の必要性に基づいてタイルのパラメータを選択し得るため、これらは制限することは意図されない。These examples illustrate that tile size varies with bit cells per tile and the spatial resolution of the bit cells. These are not intended to be limiting, as developers may select tile parameters based on application needs with respect to data capacity, robustness, and visibility.
符号化されたペイロードをタイル内のビットセルの場所にマッピングするためのマッピング関数についていくつかの代替策が存在する。1つの手法においては、上の最適化プロセスからの優先順位付けされた信号構成要素は、タイル内の場所にマッピングされる。別では、それらは、上に組み込まれる米国特許第9,747,656号に説明されるように差分符号化されたビットセルのビットセルパターンにマッピングされる。後者の場合、タイルサイズは、差分符号化されたビットセルのパターン内の各々の符号化されたビットの差分符号化に適応させるために増大され得、ビットセルは、目標解像度(例えば、300DPI)での埋め込み場所に対応する。There are several alternatives for the mapping function to map the encoded payload to bit cell locations within the tile. In one approach, the prioritized signal components from the optimization process above are mapped to locations within the tile. In another, they are mapped to a bit cell pattern of differentially encoded bit cells as described in the above-incorporated U.S. Pat. No. 9,747,656. In the latter case, the tile size may be increased to accommodate the differential encoding of each encoded bit within the pattern of differentially encoded bit cells, where the bit cells correspond to the embedding locations at the target resolution (e.g., 300 DPI).
明示的な同期信号構成要素の場合、マッピング関数は、同期信号の離散的デジタル画像をホスト画像ブロックにマッピングする。例えば、同期信号が、疑似ランダム位相を有するフーリエ大きさピーク又は正弦波のセットを含む場合、同期信号は、タイルと同一の広がりを持つブロックサイズで空間領域内に生成される。この信号構成要素は、上に説明される最適化プロセスにおけるペイロード構成要素に対する優先度に従って重み付けされる。For explicit synchronization signal components, the mapping function maps a discrete digital image of the synchronization signal to the host image blocks. For example, if the synchronization signal includes a set of Fourier magnitude peaks or sine waves with pseudorandom phase, the synchronization signal is generated in the spatial domain with a block size coextensive with the tile. The signal components are weighted according to their priority relative to the payload components in the optimization process described above.
グレースケール像を近似することにおける光学コード信号タイルの使用Use of optically coded signal tiles in approximating grayscale images
良く知られているように、グレースケールの新聞写真は、白色背景に黒色ドットを使用して、又はその逆で、2色形式で表され得る。これは、多くの場合、ハーフトーニングと呼ばれる。そのため、グレースケール写真もまた、スパースなマークでレンダリングされ得る。As is well known, a grayscale newspaper photograph can be represented in two-color form using black dots on a white background, or vice versa. This is often called halftoning. So a grayscale photograph can also be rendered with sparse marks.
この章は、本発明者らの米国特許第6,760,464号において先に詳述される研究を踏まえる。この特許は、デジタル透かしの形態にある光学コード信号が、デジタル透かし信号をハーフトーン画面として使用することによってハーフトーン画像に埋め込まれ得るということを教示する。1つの特定の実施形態において、透かしブロックは、ミッドグレー平均値(即ち、8ビットシステム内では128)を有する高密度透かしブロックに異なるしきい値を適用することによって、異なる暗さレベルで作成される。ホスト画像内の各画素において、グレーレベルは、しきい値に対応し、このしきい値が今度は、その場所における高密度透かし信号に適用されて、その場所にドットを置くか否かを決定する。This section builds on the work detailed above in our U.S. Patent No. 6,760,464. This patent teaches that an optical code signal in the form of a digital watermark can be embedded in a halftone image by using the digital watermark signal as a halftone screen. In one particular embodiment, watermark blocks are created at different darkness levels by applying different thresholds to a high density watermark block having a mid-gray average value (i.e., 128 in an 8-bit system). At each pixel in the host image, the gray level corresponds to a threshold value that is in turn applied to the high density watermark signal at that location to determine whether or not to place a dot at that location.
本技術の1つの実施形態において、異なるドット密度(インクカバレッジ)の様々な光学コードブロックは、事前に計算されて、ルックアップテーブルに記憶される。ホスト画像内の各画素において、対応するブロックは、ルックアップテーブルからアクセスされ、ブロック内の画素の場所によりインデックスされる画素は、出力画像にコピーされる。この様式では、所望のグレースケールレベルにある光学コード信号からの選択された画素は、ホスト画像グレースケール値を表すために使用される。In one embodiment of the present technique, various optical code blocks of different dot densities (ink coverage) are pre-computed and stored in a look-up table. For each pixel in the host image, the corresponding block is accessed from the look-up table, and the pixel, indexed by the pixel's location within the block, is copied to the output image. In this manner, selected pixels from the optical code signal that are at the desired grayscale level are used to represent the host image grayscale value.
図28Aは、椅子の例示的なグレースケール画像を示す。(特許図面複製の制限に起因して、これは実際にはグレースケール画像ではないが、効果は同様である。)図28Bは、スパースなブロックから本方法によってレンダリングされる椅子の脚を示す拡大された抜粋を示す。元画像内の各グレースケール画素は、光学コードブロックのタイル化アレイ内の位置と関連付けられる。ドットは、その画素(グレースケール)レベルに対応するドット密度を有する、ルックアップテーブル内の光学コードマーク内のその位置を調べることによって、出力フレームに書き込まれるか、又は書き込まれない。Figure 28A shows an example grayscale image of a chair. (Due to limitations in patent drawing reproduction, this is not actually a grayscale image, but the effect is similar.) Figure 28B shows a zoomed-in excerpt showing the legs of a chair rendered by the method from sparse blocks. Each grayscale pixel in the source image is associated with a location in a tiled array of optical code blocks. A dot is written or not written to the output frame by looking up its location in the optical code mark in a lookup table that has a dot density corresponding to that pixel (grayscale) level.
図29は、グレースケールレベルと2値パターンマーキングとの対応を示す(マーク又はマークなし)。0~127の間のグレースケールレベルは、黒色背景上の白色ドットによって形成される(0%~50%の範囲のドットカバレッジ)。128~255の間のグレースケールレベルは、白色背景上の黒色ドットによって形成される(50%~0%の範囲のドットカバレッジ)。1~254の254個のグレースケール値の各々について異なる2値パターンが存在し得る。又は、複数のグレースケール値が、単一のスパースなパターンにマッピングされ得る。例えば、0~15のグレースケール値は、最も暗い2値パターン(例えば、97%の平均インクカバレッジを有する)にマッピングし得、値16~31は、次に最も暗い2値パターン(例えば、91%の平均インクカバレッジを有する)にマッピングし得る、というように、最も明るい2値パターン(例えば、3%の平均インクカバレッジを有する)にマッピングし得る240~255の値まで続く。Figure 29 shows the correspondence between grayscale levels and binary pattern markings (marked or unmarked). Grayscale levels between 0 and 127 are formed by white dots on a black background (dot coverage ranging from 0% to 50%). Grayscale levels between 128 and 255 are formed by black dots on a white background (dot coverage ranging from 50% to 0%). There may be a different binary pattern for each of the 254 grayscale values from 1 to 254. Or, multiple grayscale values may be mapped to a single sparse pattern. For example, grayscale values from 0 to 15 may map to the darkest binary pattern (e.g., having an average ink coverage of 97%), values from 16 to 31 may map to the next darkest binary pattern (e.g., having an average ink coverage of 91%), and so on up to values from 240 to 255, which may map to the lightest binary pattern (e.g., having an average ink coverage of 3%).
図28Aに戻ると、非常に暗い階調において、及び非常に明るい階調においては、それほど光学コード信号が存在しないということを認識されたい。したがって、カメラが、参照番号481周辺の暗い領域だけを含む画像を捕捉するためにズームインされる場合、光学コードの復号は困難又は不可能であり得る。参照番号482周辺の明るい領域も同様である。しかしながら、カメラが他の領域を含む区域を捕捉する場合、ペイロードは、容易に回復され得る。Returning to FIG. 28A, it should be appreciated that in very dark and very light tones there is not much optical code signal. Thus, if the camera is zoomed in to capture an image that includes only the dark region around
この方法による複製の忠実性は、部分的に、光学コードドットの要素サイズに依存する。図30Aは、各ドットが単一の画素である、2値形式に変換された、グレースケールのライオン写真の抜粋を示す。図30Bは、同じ抜粋を示すが、各ドットが画素の4×4セルである。(前者は、時に「隆起サイズ1」と呼ばれ、後者は、時に「隆起サイズ4」と呼ばれる。)審美的には、最小隆起サイズが所望され得るが、それは、ブロックを物理的に最小の空間広がりに詰める。そのようなものとして、それは、カメラが、信号検出/復号のために印刷対象物の比較的近くに置かれることを必要とする。多くの場合、印刷される物体との相互作用の人的要因、例えば、スマートフォンは、より大きい読み取り距離が使用されるべきであることを示し、隆起サイズ2及び3の共通使用をもたらす。Fidelity of reproduction by this method depends in part on the element size of the optical code dots. Figure 30A shows an excerpt of a grayscale lion photograph converted to binary format, where each dot is a single pixel. Figure 30B shows the same excerpt, but where each dot is a 4x4 cell of pixels. (The former is sometimes called "bump size 1" and the latter is sometimes called "bump size 4.") Aesthetically, the smallest bump size may be desired, but it physically packs the blocks into the smallest spatial extent. As such, it requires that the camera be placed relatively close to the printed object for signal detection/decoding. Often, the human factor of interaction with the printed object, e.g., a smartphone, dictates that a larger reading distance should be used, resulting in the common use of
グレースケール像を近似することにおける光学コードの使用に関するさらなる詳細More details on the use of optical codes in approximating grayscale images
さらなる実施形態において、参照信号及びメッセージ信号は、図10~22に関連して上に論じられるように、所望の重み付けで結合されて、高密度グレースケール信号を生じる。N個の異なるレベルの印刷密度が規定され得る。例えば、Nは、19であってもよく、5%、10%、15%、…95%のインクカバレッジに対応する。5%印刷密度は、画素の5%がマークを有するまで、侵入禁止距離制約の影響下で、最低値画素を選択することによって達成される。10%、15%などについても同様である。In a further embodiment, the reference signal and the message signal are combined with the desired weighting to produce a high density greyscale signal, as discussed above in connection with Figures 10-22. N different levels of print density may be defined. For example, N may be 19, corresponding to 5%, 10%, 15%, ... 95% ink coverage. 5% print density is achieved by selecting the lowest value pixel, subject to the no-go distance constraint, until 5% of the pixels have a mark. Similarly for 10%, 15%, etc.
95%カバレッジは、画素の5%が白色でマークされるまで、侵入禁止距離制約の影響下で、黒色背景上にマークするための最高値画素(最も白い)を選択することによって達成される。90%、85%などについても同様である。95% coverage is achieved by selecting the highest value pixel (whitest) to mark on a black background, subject to the no-go distance constraint, until 5% of the pixels are marked white. Similarly for 90%, 85%, etc.
特定の実施形態において、異なる印刷密度は、異なる侵入禁止距離を設定することによって達成される。5%印刷密度では、侵入禁止距離D1が維持される。10%密度では、侵入禁止距離D2が維持され、D2≦D1である。15%密度では、侵入禁止距離D3が維持され、D3≦D2である、などである。In certain embodiments, different print densities are achieved by setting different no-go distances. At 5% print density, no-go distance D1 is maintained. At 10% density, no-go distance D2 is maintained, where D2≦D1. At 15% density, no-go distance D3 is maintained, where D3≦D2, etc.
印刷密度スペクトルの反対側ではすべてが逆数であり、白色マークが黒色背景上に形成される。95%印刷密度では、侵入禁止距離D19が維持される。90%印刷密度では、侵入禁止距離D18が維持され、D18≦D19である。このように続く。At the other end of the print density spectrum, everything is reciprocal, with white marks formed on a black background. At 95% print density, the no-go distance D19 is maintained. At 90% print density, the no-go distance D18 is maintained, with D18 <= D19. And so on.
すべてではないがいくつかの実施形態において、D1=D19、D2=D18などである。In some but not all embodiments, D1 = D19, D2 = D18, etc.
そのような構成を実装するため、高密度グレースケール信号内の画素値は、値によってソートされ、それらのそれぞれの場所と関連付けられる。5%印刷密度領域は、侵入禁止距離を値D1に設定することによって達成され得る。高密度信号内の最低値のグレースケール画素は、暗いマークとして、出力フレーム内の対応する位置にコピーされる。高密度信号内の次に最も低い値の画素は、それが前の画素から少なくともD1画素離れているかどうかを決定するために調べられる。そうである場合、それは、暗いマークとして、出力フレーム内の対応する位置にコピーされ、そうでない場合、それはスキップされる。高密度信号内の次に最も低い値の画素は、次に、それが以前にコピーされた画素から少なくともD1画素離れているかどうかを決定するために調べられる。そうである場合、それは、暗いマークとして、出力フレーム内の対応する位置にコピーされ、そうでない場合、それはスキップされる。このプロセスは、出力フレーム内の画素の場所の5%がマークされるまで続く。To implement such a configuration, pixel values in the high density grayscale signal are sorted by value and associated with their respective locations. A 5% print density region may be achieved by setting the no-go distance to a value D1. The lowest valued grayscale pixel in the high density signal is copied to a corresponding location in the output frame as a dark mark. The next lowest valued pixel in the high density signal is examined to determine if it is at least D1 pixels away from the previous pixel. If so, it is copied to a corresponding location in the output frame as a dark mark, otherwise it is skipped. The next lowest valued pixel in the high density signal is then examined to determine if it is at least D1 pixels away from the previously copied pixel. If so, it is copied to a corresponding location in the output frame as a dark mark, otherwise it is skipped. This process continues until 5% of the pixel locations in the output frame are marked.
10%印刷密度領域は、侵入禁止距離をD2画素に設定することによって達成される。10%インクカバレッジでマークされる印刷密度領域を生成するために、同様のプロセスが続く。15%印刷密度領域は、侵入禁止距離をD3画素に設定し、プロセスを繰り返すことによって、同様に達成され得る。A 10% print density area is achieved by setting the no-go distance to D2 pixels. A similar process is followed to produce a print density area marked with 10% ink coverage. A 15% print density area can similarly be achieved by setting the no-go distance to D3 pixels and repeating the process.
侵入禁止距離制約は、50%印刷密度、及び近くの値では困難になる。50%密度は、等しい数の暗いマーク及び白色マークを必要とし、いくつかは、斜めであっても、隣接しなければならない。最もスパースな50%パターンは、チェッカー盤、又はその逆である。The no-go distance constraint becomes difficult for 50% print density and nearby values. 50% density requires an equal number of dark and white marks, some of which must be adjacent, even diagonally. The sparsest 50% pattern is a checkerboard, or vice versa.
ミッドグレー値をスパースに変換することにおいて、デザイナは異なる道筋をとり得る。1つは、単純に従来のディザパターン(例えば、均一な50%チェッカー盤)を採用して、そのような領域内の情報を符号化しないことである。もう1つは、隣接部にかまわずに、高密度信号ブロック内の場所の最も暗い50%に暗いマークを置くことである。これは、斑点があるという効果を生じるが、強い符号化信号を提供する。他の構成では、2つの方法が組み合わせて使用され得、いくつかの領域は、規則的な見た目の外観のために選択されるディザパターンを使用し、他の領域は、空間的均一性にかまわずに、高密度信号の最も暗い50%に基づいてマークされる。In converting mid-gray values to sparse, the designer can take different routes. One is to simply employ a conventional dither pattern (e.g., a uniform 50% checkerboard) and not encode any information in such regions. Another is to place a dark mark in the darkest 50% of the locations in the dense signal block, without regard to its neighbors. This creates a speckled effect, but provides a strong encoded signal. In other configurations, the two methods can be used in combination, with some regions using a dither pattern selected for a regular looking appearance, and other regions marked based on the darkest 50% of the dense signal, without regard to spatial uniformity.
前者の場合、印刷密度の関数としての信号強度は、M字形状の曲線を有し、1~3%及び97~99%の印刷密度では信号強度は小さく、50%では全くなく、これら2つの値の間がピークになっている。後者の場合、信号強度は、単一ローブ状であり、50%で最大、並びに0%及び100%で0に傾く。In the former case, the signal strength as a function of print density has an M-shaped curve, with small signal strength at print densities of 1-3% and 97-99%, none at 50%, and peaks between these two values. In the latter case, the signal strength is single-lobed, with a maximum at 50% and trending to zero at 0% and 100%.
侵入禁止領域は、一般的には、ある程度円形と考えられるが、それらはそうである必要はない。Keep-out areas are generally thought of as somewhat circular, but they need not be.
楕円形の侵入禁止領域が用いられる場合、より細かい制御粒度が達成され得る。そのような楕円形状は、円形侵入禁止領域のものの2倍の制御粒度を提供する。(いくつかの実施形態において、長軸対短軸の比率は固定され、他の場合では、それは楕円形の面積が変わると変化する。)Finer granularity of control can be achieved when an elliptical keep-out region is used. Such an elliptical shape provides twice the granularity of control that a circular keep-out region. (In some embodiments, the ratio of the major axis to the minor axis is fixed; in others, it varies as the area of the ellipse changes.)
依然としてさらなる制御粒度を達成するために、マーキングから特定の数の近くの画素を除外するように調整されるパターンが用いられ得る。マーキング密度はこの章では印刷密度として言及されるが、それらは、エンボス加工、エッチング、及び彫刻のような他のマーキング技術を用いて適用されるマーキング要素の密度を包含することを理解されたい。これらのマーキング技術は、表面トポロジを変調すること、表面材料を追加若しくは除去すること、又は基材表面を彫刻することによって、「より暗い」又は「より明るい」マーキングを適用する。To achieve even greater granularity of control, patterns can be used that are adjusted to exclude a certain number of nearby pixels from the marking. Although marking densities are referred to in this chapter as print densities, it should be understood that they encompass the density of marking elements applied using other marking techniques such as embossing, etching, and engraving. These marking techniques apply "darker" or "lighter" markings by modulating the surface topology, adding or removing surface material, or engraving the substrate surface.
捕捉画像からペイロードを読み取ることReading the payload from the captured image
図31は、物体から捕捉される画像信号から光学コードを復号するための方法を例証するフロー図である。Figure 31 is a flow diagram illustrating a method for decoding an optical code from an image signal captured from an object.
画像捕捉プロセス(例えば、図31のスキャン200)において、画像は、符号化されたペイロード信号が元画像内で符号化されたビットセル解像度(例えば、300DPI、100DPIなど)に好ましくは近い解像度で捕捉される。画像アップサンプリング又はダウンサンプリング動作は、デジタルカメラ又はスキャナによって供給される画像を、さらなる復号のために目標解像度に変換するために実施され得る。符号化されたデータ信号の1つ又は複数のブロックの少なくとも部分は、スキャン内で捕捉される。In an image capture process (e.g., scan 200 of FIG. 31), an image is captured at a resolution preferably close to the bit cell resolution (e.g., 300 DPI, 100 DPI, etc.) at which the encoded payload signal was encoded in the original image. Image upsampling or downsampling operations may be performed to convert the image provided by a digital camera or scanner to a target resolution for further decoding. At least a portion of one or more blocks of the encoded data signal are captured in the scan.
復号方法の初期処理において、符号化されたペイロードを含む可能性が最も高い画像コンテンツを有するフレーム及びフレーム内のブロックを選択することが有利である。ブロックサイズは、望ましくは、符号化されたペイロードの完全なタイルの実質的にすべて、及び好ましくは近隣タイルの集合体に及ぶのに十分な大きさであるように選択される。しかしながら、カメラ又はスキャナからの距離が変化し得ることから、符号化されたペイロード信号の空間スケールは、符号化時のそのスケールから変化する可能性が高い。この空間スケール歪は、同期プロセスにおいてさらに対処される。In the initial processing of the decoding method, it is advantageous to select frames and blocks within frames whose image content is most likely to contain the encoded payload. The block size is desirably selected to be large enough to span substantially all of a complete tile of the encoded payload, and preferably a collection of neighboring tiles. However, because the distance from the camera or scanner may change, the spatial scale of the encoded payload signal is likely to change from its scale at the time of encoding. This spatial scale distortion is further addressed in the synchronization process.
復号プロセスの第1のステージは、入ってくる画像信号をフィルタリングして、それを、符号化されたペイロード信号の検出及び同期のために準備する(202)。復号プロセスは、画像をブロックへとさらに分割し、さらなる復号動作のためのブロックを選択する。第1のフィルタリングステージは、入力色画像信号(例えば、RGB値)を、補助信号が適切な色重みを適用することによって符号化された色チャネル(複数可)に変換する。例えば、色チャネル符号化及び復号に関する詳細については、特許公開第20100150434号を参照されたい。入力画像はまた、660nm周辺のスペクトル帯の中心周辺に波長を有する典型的な赤色LEDなど、周囲照明又は人工照明の存在下での単色センサによる捕捉に対応する単一のチャネル画像(画素あたり1つの画素値)であってもよい。The first stage of the decoding process filters the incoming image signal to prepare it for detection and synchronization of the encoded payload signal (202). The decoding process further divides the image into blocks and selects blocks for further decoding operations. The first filtering stage converts the input color image signal (e.g., RGB values) into the color channel(s) in which the auxiliary signal is encoded by applying appropriate color weights. For example, see JP 20100150434 A for details regarding color channel encoding and decoding. The input image may also be a single channel image (one pixel value per pixel) corresponding to capture by a monochromatic sensor in the presence of ambient or artificial illumination, such as a typical red LED with a wavelength centered around the spectral band around 660 nm.
第2のフィルタリング動作は、データ信号をホスト画像から隔離する。プレフィルタリングは、用いられる同期のタイプを含むデータペイロード信号符号化フォーマットのために適合される。例えば、明示的な同期信号が使用される場合、プレフィルタリングは、同期プロセスのために明示的な同期信号を隔離するように適用される。The second filtering operation isolates the data signal from the host image. The pre-filtering is adapted for the data payload signal encoding format, including the type of synchronization used. For example, if an explicit synchronization signal is used, pre-filtering is applied to isolate the explicit synchronization signal for the synchronization process.
述べられるように、いくつかの実施形態において、同期信号は、フーリエ領域内のピークの集合である。フーリエ領域への変換の前に、画像ブロックは、プレフィルタリングされる。例えば、上で組み込まれる米国特許第6,614,914号に詳述されるラプラシアンプレフィルタリングを参照されたい。窓関数がブロックに適用され、その後にFFTを用いたフーリエ領域への変換が続く。別のフィルタリング動作が、フーリエ領域内で実施される。例えば、参照により組み込まれる、米国特許第6,988,202号及び同第6,614,914号、並びに米国公開第20120078989号に詳述されるプレフィルタリング選択肢を参照されたい。As mentioned, in some embodiments, the synchronization signal is a collection of peaks in the Fourier domain. Prior to transformation to the Fourier domain, the image block is pre-filtered. See, for example, the Laplacian pre-filtering detailed in U.S. Patent No. 6,614,914, incorporated above. A window function is applied to the block, followed by transformation to the Fourier domain using an FFT. Another filtering operation is performed in the Fourier domain. See, for example, the pre-filtering options detailed in U.S. Patent Nos. 6,988,202 and 6,614,914, and U.S. Publication No. 20120078989, incorporated by reference.
入力像は、典型的には、先に述べられるように、予測「8軸」フィルタでフィルタリングされる。このフィルタは、基底のホスト画像(典型的には、比較的高い局所相関を示す)を抑制し、それによりコード信号構成要素を伝達する雑音信号を強調するように作用する。The input image is typically filtered with a predictive "8-axis" filter, as described above. This filter acts to suppress the underlying host image (which typically exhibits relatively high local correlation), thereby emphasizing the noise signals that carry the code signal components.
次に、同期プロセス(204)が、フィルタリングされたブロックにおいて実行されて、符号化された信号タイルの回転、空間スケール、及び平行移動を回復する。このプロセスは、フーリエ領域内のピークからなる同期信号の回転及びスケールを回復するために、特許第6,614,914号に詳述されるようなログポーラ(log polar)法、又は先に詳述されるような最小二乗手法を用い得る。平行移動を回復するためには、第6,614,914号の位相相関法が使用されるか、又は第20120078989号の位相推定法及び位相偏移法が使用される。代替的な方法は、例えば、米国特許第第9,747,656号に詳述されるように、暗黙的な同期信号に対して同期を実施する。A synchronization process (204) is then performed on the filtered blocks to recover the rotation, spatial scale, and translation of the encoded signal tiles. This process may use a log polar method as detailed in Patent No. 6,614,914, or a least squares approach as detailed above, to recover the rotation and scale of the synchronization signal, which consists of peaks in the Fourier domain. To recover the translation, the phase correlation method of Patent No. 6,614,914 is used, or the phase estimation and phase shift methods of Patent No. 20120078989 are used. Alternative methods perform synchronization on an implicit synchronization signal, for example, as detailed in U.S. Patent No. 9,747,656.
次に、デコーダは、タイル内のビットセル位置をステップスルーして、各場所からビット推定値を抽出する(206)。このプロセスは、各場所について、回転、スケール、及び平行移動パラメータを適用して、各ビットセル位置からビット推定値を抽出する(206)。粒子において、このプロセスがタイル内の各ビットセル位置を訪問する際、このプロセスは、それを、同期において導出されるアファイン変換パラメータに基づいて受信画像内の場所に変換し、次いで各場所周辺でサンプリングする。このプロセスを行うのは、ビットセル位置及びその近隣部が検出フィルタ(例えば、8軸又は十字)に入力をフィードして、埋め込み場所におけるサンプルを近隣部と比較するためである。各比較動作の出力(例えば、1、-1)は、合計されて、ビットセル位置の推定値を提供する。ビットセル位置における各ビット推定値は、変調されたキャリア信号の要素に対応する。The decoder then steps through the bit cell locations in the tile to extract bit estimates from each location (206). For each location, the process applies rotation, scale, and translation parameters to extract bit estimates from each bit cell location (206). As the process visits each bit cell location in the tile in a particle, it transforms it to a location in the received image based on the affine transformation parameters derived in synchronization, and then samples around each location. This process occurs because the bit cell location and its neighborhood feed inputs into a detection filter (e.g., 8-axis or cross) to compare the samples at the embedding location with the neighborhood. The outputs of each comparison operation (e.g., 1, -1) are summed to provide an estimate for the bit cell location. Each bit estimate at a bit cell location corresponds to an element of the modulated carrier signal.
信号デコーダは、各々の誤り訂正符号化されたビットの値を、そのビットのキャリア信号のビットセル位置からビット推定値を蓄積することによって推定する(208)。例えば、上のエンコーダ実施形態において、誤り訂正符号化されたビットは、16又は32個の要素を有する対応するキャリア信号にわたって変調される(例えば、2値対蹠信号で乗算されるか、又は2値対蹠信号とXORをとられる)。ビット値は、これらの要素の対応するビットセル位置から抽出される推定値から復調される。この復調動作は、推定値にキャリア信号符号を掛け、結果を追加する。この復調は、各々の誤り訂正符号化されたビットについてソフト推定値を提供する。The signal decoder estimates the value of each error-correction coded bit by accumulating bit estimates from the bit cell position of the carrier signal for that bit (208). For example, in the above encoder embodiment, the error-correction coded bits are modulated (e.g., multiplied or XORed with a binary antipodal signal) across a corresponding carrier signal having 16 or 32 elements. The bit values are demodulated from estimates extracted from the corresponding bit cell positions of these elements. This demodulation operation multiplies the estimates by the carrier signal code and adds the results. This demodulation provides a soft estimate for each error-correction coded bit.
これらのソフト推定値は、ペイロード信号を生成するために誤り訂正デコーダに入力される(210)。畳み込み符号化されたペイロードでは、ビタビ(Viterbi)デコーダを使用して、チェックサム又はCRCを含むペイロード信号を生成する。誤り訂正の他の形態では、互換性のあるデコーダが、ペイロードを再構築するために適用される。例としては、ブロックコード、BCH、リードソロモン、ターボ(Turbo)コードが挙げられる。These soft estimates are input to an error correction decoder (210) to generate the payload signal. For convolutionally coded payloads, a Viterbi decoder is used to generate the payload signal including a checksum or CRC. For other forms of error correction, compatible decoders are applied to reconstruct the payload. Examples include block codes, BCH, Reed-Solomon, and Turbo codes.
次に、ペイロードは、チェックサムを計算し、復号されたチェックサムビットと比較することによって検証される(212)。チェックサムは、当然ながら、エンコーダ内のものに一致する。上の例の場合、リーダは、ペイロードの一部分についてCRCを計算し、それをペイロード内のCRC部分と比較する。The payload is then verified (212) by calculating a checksum and comparing it to the decoded checksum bits. The checksum will, of course, match the one in the encoder. In the above example, the reader calculates a CRC on a portion of the payload and compares it to the CRC portion in the payload.
このステージで、ペイロードは、これより他の要求プロセス、例えば、後続処理においてそのコンテンツを使用するアプリケーションプログラム又はソフトウェアルーチンへと渡される。At this stage, the payload is then passed to another requesting process, such as an application program or software routine that uses the content in further processing.
符号化されたペイロードが正弦波の位相内で伝達される実施形態において、デコーダは、正弦波のサブセットなどの参照信号構成要素に対して、同様の第1のステージ同期を実行する。正弦波のこのサブセットは、空間周波数領域内でピークを形成する。同期後、デコーダは、ペイロードを担持する各参照信号における符号化されたペイロード要素の推定値を抽出する。位相シフトは、米国公開第20120078989号の位相推定及び偏移法を使用して、非変調状態に対して直接測定される。デコーダは、空間周波数領域内の正弦波成分の幾何変換座標を適用する。次いでデコーダは、画像内のこの成分の位相を、点広がり関数から導出される重みに基づいて近隣の整数座標における近隣の複合構成要素を重み付けすることによって推定する。この位相の推定値は、次いで、予測される位相(例えば、3値又は2値符号化スキームにおいて1、0、若しくは-1、又は1若しくは0を表す位相)と比較される。この成分において抽出されるビット値は、推定位相に対応するものである。このプロセスは、ペイロード信号を担持する各正弦波成分について繰り返す。結果として生じるシンボルのシーケンスは、次いで、誤り訂正符号化され、処理は、上に説明されるように誤り検出へと進む。In an embodiment where the encoded payload is conveyed in the phase of a sinusoid, the decoder performs a similar first stage synchronization on a reference signal component, such as a subset of the sinusoid. This subset of the sinusoid forms a peak in the spatial frequency domain. After synchronization, the decoder extracts an estimate of the encoded payload element in each reference signal carrying a payload. The phase shift is measured directly relative to the unmodulated state using the phase estimation and shift method of US Publication No. 20120078989. The decoder applies a geometric transformation coordinate of the sinusoid component in the spatial frequency domain. The decoder then estimates the phase of this component in the image by weighting nearby composite components at nearby integer coordinates based on weights derived from the point spread function. This estimate of phase is then compared to the expected phase (e.g., a phase representing 1, 0, or -1, or 1 or 0 in a ternary or binary encoding scheme). The bit value extracted in this component is the one that corresponds to the estimated phase. This process is repeated for each sinusoid component carrying a payload signal. The resulting sequence of symbols is then error-correction coded, and the process proceeds to error detection as described above.
参照信号ドット選択によるメッセージシグナリングMessage signaling by selecting reference signal dots
下に説明されるシグナリング構成は、(所与の信頼性での)情報転送のためのシャノン限界に、先行技術構成よりも近くに接近するという点で有利である。特定の実施形態において、1028個の暗いマークのみが、128×128の信号ブロック内で用いられる。マークはすべて、参照信号を表すが、それらの選択は、メッセージ信号を表す。The signaling configuration described below is advantageous in that it approaches the Shannon limit for information transfer (at a given reliability) more closely than prior art configurations. In a particular embodiment, only 1028 dark marks are used within a 128x128 signal block. All of the marks represent reference signals, but a selection of them represent message signals.
本方法は、図7の信号74が抜粋されるものなどの参照信号ブロックで開始する。参照信号ブロック(例えば、128×128要素ブロック)内の各場所において、参照信号は、例えば、0(黒)~255(白)の範囲の対応する信号値を有する。要素(例えば、16,384個の要素)は、2048個の最も暗い要素を含むランク付けリストを生成するために、値によってソートされる。リスト内の各エントリは、順序位置(0、1、2…)、並びにブロック内の要素の位置を列及び行によって指定する{X、Y}データと関連付けられる。表2は、そのようなリストの抜粋を示す。
例えば64ビットのペイロードは、畳み込み符号化、及び任意選択的に、反復によって処理されて、長さが1024ビットであるメッセージを得る。メッセージ内の各ビットは、ランク付けリスト内の参照信号要素の連続した対と関連付けられる。ビットが偶数値化される場合(即ち、0)、対からの偶数の要素が、暗くされる出力信号ブロック内の場所を決定する。ビットが奇数値化される場合(即ち、1)、対からの奇数の要素が、暗くされる出力ブロック内の場所を決定する。したがって、2048個の要素のリストからの1024個の要素が、1024メッセージビットのビット値に基づいて選択され、暗くされる出力信号ブロック内の1024個の場所を規定する。For example, a 64-bit payload is processed by convolutional encoding, and optionally iteration, to obtain a message that is 1024 bits in length. Each bit in the message is associated with a consecutive pair of reference signal elements in the ranked list. If the bit is even-valued (i.e., 0), the even element from the pair determines the location in the output signal block that is darkened. If the bit is odd-valued (i.e., 1), the odd element from the pair determines the location in the output block that is darkened. Thus, 1024 elements from a list of 2048 elements are selected based on the bit values of the 1024 message bits to define the 1024 locations in the output signal block that are darkened.
例証のため、10110001…で始まるメッセージを検討する。そのような場合、表3で識別される出力信号ブロック内の要素は暗くされる。
出力信号ブロック内の1024個のドットの各々は、元の参照信号ブロック内の最も暗い値のうちの1つに対応する。各々のそのようなドットはまた、1024メッセージビットの対応するビットを表す。Each of the 1024 dots in the output signal block corresponds to one of the darkest values in the original reference signal block. Each such dot also represents a corresponding bit of the 1024 message bits.
そのようなスパースなパターンを描写する捕捉画像を復号することにおいて、画像のアファイン変換が、他の場所で説明されるように、まず、参照信号を参照して決定される。次いで、画像は、典型的には、パターンをその元の提示に回復するために逆に歪ませられる。(より正確には、受信画像は、公開第20170193628号に詳述されるように、決定されたアファイン変換から規定される座標系に従ってリサンプリングされる。)In decoding a captured image depicting such a sparse pattern, an affine transformation of the image is first determined with reference to a reference signal, as described elsewhere. The image is then typically inversely warped to restore the pattern to its original representation. (More precisely, the received image is resampled according to a coordinate system defined from the determined affine transformation, as detailed in Publication No. 20170193628.)
メッセージを解釈するために、検出器は、表2からのデータの独自のコピーを使用する。(この表は、特定の参照信号を用いるすべてのマークについて一貫しており、検出器コード内の取るに足りないメモリを占有する。)検出器は、逆に歪められた像を調べて、表内の最初の2つエントリ(即ち、ランク0及び1)によって指定される2つの場所における画素値を決定する。理想的には、一方が暗く、一方が明るい。暗い方は、第1のメッセージビットの値を示す。次いで、検出器は、像を調べて、表内の第3及び第4のエントリ(即ち、ランク2及び3)における画素値を決定する。ここでも、理想的には、一方が暗く、他方が明るい。暗い方は、第2のメッセージビットの値を示す、と続く。To interpret the message, the detector uses its own copy of the data from Table 2. (This table is consistent for all marks that use a particular reference signal and occupies negligible memory in the detector code.) The detector looks at the inversely warped image to determine pixel values at the two locations specified by the first two entries in the table (i.e., ranks 0 and 1). Ideally, one would be dark and one light. The darker one indicates the value of the first message bit. The detector then looks at the image to determine pixel values at the third and fourth entries in the table (i.e., ranks 2 and 3). Again, ideally, one would be dark and the other light. The darker one indicates the value of the second message bit, and so on.
実践では、検出器によって、メッセージの各々の潜在的なビットを検討することにおいて、調べられる2つの場所は、値が遠く離れている場合があるか(ビット決定における信頼度を示す)、又は値が互いに近い場合がある(より低い信頼度を示す)。各メッセージビット決定と関連付けられた信頼度を定量化するために、表内の対の奇数及び偶数の番号が付けられたエントリによって示される場所における画素の値に基づいて、スコアが計算される。1つの好適なスコアは、以下の通りである。In practice, in considering each potential bit of a message by a detector, the two locations examined may be far apart in value (indicating confidence in the bit decision) or may be close to each other in value (indicating less confidence). To quantify the confidence associated with each message bit decision, a score is calculated based on the values of the pixels at the locations indicated by the pair of odd- and even-numbered entries in the table. One suitable score is:
スコア=Log2(奇数位置における画素の値/偶数位置における画素の値) Score =Log2 (value of pixel at odd position/value of pixel at even position)
上の例では、奇数位置{72、32}における画素の値が30であり、偶数位置{18、22}における画素の値が240である場合、スコアは、マイナス3であり、メッセージの第1のビットが値「1」を有することを示す。(いかなる負の値もビット値が「1」であることを示す。)In the above example, if the pixel at odd position {72, 32} has a value of 30 and the pixel at even position {18, 22} has a value of 240, the score is minus 3, indicating that the first bit of the message has a value of "1". (Any negative value indicates a bit value of "1".)
次のビットを検討すると、検出器は、奇数位置{26、82}における画素の値が130であること、偶数位置{1、33}における画素の値が101であることを見出し得る。この場合、スコアは0.364である。正のスコアは、対応するビット値が「0」であることを示す。しかしながら、スコアの絶対的な大きさは低い(例えば、第1のビットスコアの絶対値:3に対して)。これは、この決定におけるより低い信頼度を示す。Considering the next bit, the detector may find that the pixel at odd position {26, 82} has a value of 130, and the pixel at even position {1, 33} has a value of 101. In this case, the score is 0.364. A positive score indicates that the corresponding bit value is "0". However, the absolute magnitude of the score is low (e.g., for the absolute value of the first bit score: 3). This indicates a lower confidence in this decision.
この手順(逆に歪められた像内の2048個すべての候補場所を検討した後)によって獲得されるメッセージビットのストリングは、各々についての信頼度スコアと一緒に、ビタビ、リードソロモン、又はターボデコーダなどのソフトデコーダに適用される。これらの生ビット決定及び信頼度スコアから、デコーダは、元の64ビットペイロードを返す。The string of message bits obtained by this procedure (after considering all 2048 candidate locations in the inversely warped image), together with a confidence score for each, is applied to a soft decoder such as a Viterbi, Reed-Solomon, or Turbo decoder. From these raw bit decisions and the confidence scores, the decoder returns the original 64-bit payload.
たった今説明した構成は、ソート順での隣接性に基づいて、参照信号内の極値点をペアリングする。詳述した構成は、各ペイロードビット表現のための1つおきの場所が同様の参照信号強度のものであることから、好ましい。しかし、これは必須ではない。ペアリングは、任意の方式で、例えば、しきい値を下回る値を有する要素のサブセット内でランダムに、行われ得る。The configuration just described pairs extreme points in the reference signal based on their proximity in the sort order. The detailed configuration is preferred because every other location for each payload bit representation is of similar reference signal strength. However, this is not required. The pairing can be done in any manner, for example randomly within the subset of elements that have values below a threshold.
たった今詳述した復号手順は、本明細書内で詳述されるメッセージ信号の他のスパースな符号化と共に使用されるものとは異なる(メッセージ符号化手順が異なるため)ということを理解されたい。いくつかの実施形態において、デコーダは、メッセージ信号がどのように表されるかの初期決定を行い、またそれは、対応する復号方法を適用する。It should be understood that the decoding procedure just detailed is different from that used with other sparse encodings of the message signal detailed herein (because the message encoding procedure is different). In some embodiments, the decoder makes an initial determination of how the message signal is represented, and it applies the corresponding decoding method.
1つのそのような実施形態において、異なる符号化は、参照信号内のいくつかの空間周波数ピークの存在又は不在によってシグナリングされる。述べられるように、この信号は、典型的には、数十のピークを含む。もういくつか(例えば、1~10)が、この章で詳述される符号化手順が使用されていること、及び対応する復号方法が同様に使用されるべきであることを、準拠した検出器に示すフラグとして機能するために、追加(又は削除)され得る。即ち、そのような検出器は、これらのフラグ空間周波数が参照信号内に存在するか(又は不在か)を決定するために参照信号を調べ、そのような決定の出力に対応する復号方法を適用する。そのような周波数の存在又は不在は、メッセージ信号へのデコーダの同期を可能にするという参照信号の目的を妨害しないが、これは、その同期プロセスが参照信号の様々な歪に対して堅牢であるためである。In one such embodiment, the different encodings are signaled by the presence or absence of several spatial frequency peaks in the reference signal. As mentioned, this signal typically contains several tens of peaks. A few more (e.g., 1-10) can be added (or removed) to act as flags indicating to a compliant detector that the encoding procedure detailed in this chapter has been used and that the corresponding decoding method should be used as well. That is, such a detector examines the reference signal to determine whether these flag spatial frequencies are present (or absent) in the reference signal and applies the corresponding decoding method to the output of such a decision. The presence or absence of such frequencies does not interfere with the purpose of the reference signal to enable synchronization of the decoder to the message signal, since the synchronization process is robust to various distortions of the reference signal.
(たった今説明した構成は、追加の(又は削除された)空間周波数構成要素の対応するセットによって、多くの異なる符号化技術の使用の間にシグナリングするために使用され得る。検出器は、どの符号化技術が使用されているかを参照信号内で検出される空間周波数構成要素から検知し、対応する復号アルゴリズムを適用する。)(The configuration just described can be used to signal between the use of many different encoding techniques, with a corresponding set of added (or removed) spatial frequency components. The detector detects which encoding technique is being used from the spatial frequency components detected in the reference signal and applies the corresponding decoding algorithm.)
別の実施形態において、デコーダは、上に詳述した復号方法を適用することによって始まる(参照信号の使用によって決定されるような、捕捉像内のアファイン歪の補償後)。デコーダが、表2のランク付けリスト内の最初のいくつかの対の何らかのしきい値数Kの両方の場所において暗いマークが見出される(又は、マークがない)と結論付ける場合、デコーダは、この章に説明される復号手法をやめて、代わりに、参照により組み込まれる文書を含め、本明細書内の他の場所に詳述される復号手法を適用する。In another embodiment, the decoder begins by applying the decoding method detailed above (after compensation for affine distortions in the captured image as determined by the use of a reference signal). If the decoder concludes that dark marks (or no marks) are found in both locations for some threshold number K of the first few pairs in the ranked list of Table 2, the decoder abandons the decoding method described in this section and instead applies the decoding method detailed elsewhere in this specification, including in documents incorporated by reference.
再考すると、この特定の実施形態において、メッセージは、各々がストリング内のそれぞれの位置に第1の値又は第2の値(例えば、0又は1)を有する複数のビットからなる。M(例えば、2048)個の2D参照信号要素のリストは、各々が、リスト内に順序位置を有し、各々が、2D参照信号内の場所と関連付けられるように、値によってランク付けされる。したがって、このリストは、N=0、1、2、…(M/2)-1について2N、2N+1の順序位置を有する、要素の複数の対を規定する。要素の各対は、偶数順序位置を有する要素及び奇数順序位置を有する要素を含む。メッセージ信号内の各位置は、ランク付けリスト内の一対の要素と関連付けられる。マークは、メッセージ信号内の関連付けられた位置が第1の値(例えば、0)を有するとき、出力信号ブロック内において、一対のうちの偶数要素の場所に対応する場所に提供される。同様に、マークは、メッセージ信号内の関連付けられた位置が第2の値(例えば、1)を有するとき、出力信号ブロック内において、一対のうちの奇数要素の場所に対応する場所に提供される。Reviewing again, in this particular embodiment, the message consists of a number of bits, each having a first or second value (e.g., 0 or 1) at a respective position in the string. A list of M (e.g., 2048) 2D reference signal elements is ranked by value such that each has an ordinal position in the list, and each is associated with a location in the 2D reference signal. The list thus defines a number of pairs of elements having 2N, 2N+1 ordinal positions, for N=0, 1, 2, ... (M/2)-1. Each pair of elements includes an element having an even ordinal position and an element having an odd ordinal position. Each position in the message signal is associated with a pair of elements in the ranked list. A mark is provided in the output signal block at a location corresponding to the location of the even element of the pair when the associated position in the message signal has a first value (e.g., 0). Similarly, a mark is provided in the output signal block at a location corresponding to the location of the odd element of the pair when the associated position in the message signal has a second value (e.g., 1).
代替の実施形態において、参照信号値及び場所のランク付けリストからのデータは、記憶されない。むしろ、それは、必要に応じてオンザフライで計算される。そのような場合、連続参照信号の実数値のサンプルは、整数値(表2で使用されるような)によって引き起こされ得るあいまいさを回避するため、ランク順序を決定するように2D信号ブロック内の各点において計算され得る。In an alternative embodiment, the data from the ranked list of reference signal values and locations is not stored. Rather, it is calculated on the fly as needed. In such a case, real-valued samples of the continuous reference signal may be calculated at each point within the 2D signal block to determine the rank order to avoid ambiguities that may be caused by integer values (as used in Table 2).
いくつかの実施形態において、参照信号の極値は、2つの極値が互いからしきい値距離よりも近くならないように距離制約(侵入禁止領域)を実施するためにフィルタリングされる。In some embodiments, the extrema of the reference signal are filtered to enforce a distance constraint (no-go zone) such that no two extrema are closer than a threshold distance from each other.
本方法の関連実施形態は、空間領域参照信号を得て、その構成要素画素を値によってソートして、各々が場所を有する(例えば、128×128要素アレイ内)、ランク付けリスト内の最も暗いN個の要素(例えば、1600個の要素)を識別する。これらの場所の一部(例えば、400個の場所)は、参照信号が強力に表現されることを確実にするために、出力ブロック内のドットで常にマークされる。残りの場所は、そのような場所に割り当てられるペイロードシグネチャビット(チップ)の値に従って、出力ブロック内のドットでマークされるか、又はマークされない。数Nをより大きく、又はより小さく設定することによって、より多く、又はより少ないドットを有するスパースなマークが生成される。比較的より暗い背景における明るいドット(穴)のマーキングの場合、実施者は、同様の手法を使用するが、最も明るいN個の要素のソーティングを用いる。A related embodiment of the method takes a spatial domain reference signal and sorts its component pixels by value to identify the N darkest elements (e.g., 1600 elements) in a ranked list, each having a location (e.g., in a 128x128 element array). A portion of these locations (e.g., 400 locations) are always marked with a dot in the output block to ensure that the reference signal is strongly represented. The remaining locations are either marked with a dot in the output block or not, according to the value of the payload signature bits (chips) assigned to such locations. By setting the number N larger or smaller, sparse marks with more or fewer dots are produced. For marking of bright dots (holes) on a relatively darker background, implementers use a similar approach, but with sorting of the N brightest elements.
動作環境 Operating environment
本文書における方法は、モジュールで構成されているソフトウェア命令又はデジタル回路において実施される。これらのモジュールは、光学コードオプティマイザ、ジェネレータ、インサータ、及びデコーダを含む。本明細書に明記される実施形態の任意の特定の議論にもかかわらず、用語「モジュール」は、本明細書に説明される方法、プロセス、関数、又は動作のうちのいずれかを実施するように構成されるソフトウェア命令、ファームウェア、又は回路を指す。ソフトウェアは、非一時的なコンピュータ可読記憶媒体に記録されるソフトウェアパッケージ、コード、命令、命令セット若しくはデータとして具現化され得る。例えば、関連データと併せて、MATLAB、C、C++、Visual Basic、Java(登録商標)、Python、Tcl、Perl、Scheme、Rubyなどで書かれる、詳細な機能を実施するためのソフトウェア命令は、本明細書に提供される説明から過度の実験なしに技術者によって書かれ得る。ファームウェアは、メモリデバイスにハードコードされる(例えば、不揮発性である)コード、命令、又は命令セット若しくはデータとして具現化され得る。本明細書で使用される場合、用語「回路」は、例えば、単一で、又は任意の組み合わせで、ハードワイヤード回路、1つ若しくは複数の個々の命令処理コアを備えるコンピュータプロセッサなどのプログラマブル回路、状態機械回路、又はプログラマブル回路によって実行される命令を記憶するファームウェアを含み得る。The methods in this document are implemented in software instructions or digital circuits that are configured in modules. These modules include an optical code optimizer, a generator, an inserter, and a decoder. Notwithstanding any particular discussion of the embodiments set forth herein, the term "module" refers to software instructions, firmware, or circuits configured to perform any of the methods, processes, functions, or operations described herein. Software may be embodied as a software package, code, instructions, instruction sets, or data recorded on a non-transitory computer-readable storage medium. For example, software instructions to perform detailed functions written in MATLAB, C, C++, Visual Basic, Java, Python, Tcl, Perl, Scheme, Ruby, etc., together with associated data, may be written by an engineer without undue experimentation from the description provided herein. Firmware may be embodied as code, instructions, or instruction sets or data that are hard-coded (e.g., non-volatile) into a memory device. As used herein, the term "circuitry" may include, for example, alone or in any combination, hardwired circuitry, programmable circuitry such as a computer processor with one or more individual instruction processing cores, state machine circuitry, or firmware that stores instructions executed by a programmable circuit.
実装形態は、追加的又は代替的に、構成要素動作のうちの一部又はすべてを実施するようにカスタムデザインされて製造されている特殊目的電子回路を、特定用途向け集積回路(ASIC)として用いることができる。そのような実装形態を実現するために、関連モジュール(複数可)(例えば、ホスト画像コンテンツ内の光学コードの符号化及び復号)は、MATLAB(マスワークス(Mathworks,Inc.)より)などのソフトウェアを使用して、汎用コンピュータを使用してまず実施される。HDLコーダ(これもマスワークスから入手可能)などのツールが次に用いられて、MATLABモデルをVHDL(IEEE規格)又はVerilogに変換する。次いで、VHDL出力が、シノプシス(Synopsis)によるデザインコンパイラ(Design Compiler)、メンターグラフィックス(Mentor Graphics)によるHDLデザイナ(HDL Designer)、又はケイデンズデザインシステムズ(Cadence Design Systems)によるエンカウンタRTLコンパイラ(Encounter RTL Compiler)などのハードウェア合成プログラムに適用される。ハードウェア合成プログラムは、ハードウェア形態で技術を実現する電子論理ゲートの特定のアレイを、そのような目的に専念する特殊用途機械として、指定する出力データを提供する。この出力データは、次いで、それを使用してカスタマイズされたシリコン部品を生産する半導体製造請負業者に提供される。(好適な請負業者は、TSMC、グローバルファウンドリーズ(Global Foundries)、及びオンセミコンダクター(ON Semiconductors)を含む。)Implementations may additionally or alternatively use special purpose electronic circuitry that is custom designed and manufactured to perform some or all of the component operations as an application specific integrated circuit (ASIC). To achieve such an implementation, the relevant module(s) (e.g., encoding and decoding of optical codes in the host image content) are first implemented using a general purpose computer using software such as MATLAB (from Mathworks, Inc.). Tools such as HDL Coder (also available from Mathworks) are then used to convert the MATLAB model to VHDL (an IEEE standard) or Verilog. The VHDL output is then applied to a hardware synthesis program such as Design Compiler by Synopsis, HDL Designer by Mentor Graphics, or Encounter RTL Compiler by Cadence Design Systems. The hardware synthesis program provides output data that specifies a particular array of electronic logic gates that implements the technology in hardware form, as a special purpose machine dedicated to such purpose. This output data is then provided to a semiconductor fabrication contractor who uses it to produce customized silicon parts. (Suitable contractors include TSMC, Global Foundries, and ON Semiconductors.)
HDLコーダはまた、フィールドプログラマブルゲートアレイ実装形態を作り出すために使用され得る。FPGAは、ASICを試作するために、又は電子デバイスに統合されるFPGAチップ内での実装として、使用され得る。HDL coders can also be used to create field programmable gate array implementations. FPGAs can be used to prototype ASICs or as implementations within FPGA chips that are integrated into electronic devices.
例証の目的のため、図32は、上記光学コードジェネレータ、インサータ、オプティマイザ、及びデコーダの構成要素が実装され得る電子デバイスの図である。これは、実施形態が他のデバイスアーキテクチャ又は電子回路において実施され得るため、限定することは意図されない。例えば、電子デバイスは、光学コードを生成、最適化、挿入、及び復号するためのプログラム命令が記憶され、本文書に説明される方法を行うために実行されるコンピュータを表す。電子デバイスはまた、感熱ラベルプリンタ、ラベルプリンタ、及びバーコードスキャナを有する計器のような特殊用途コンピュータシステムを表す。電子デバイスはまた、仮想及び拡張現実アイウェア及びヘッドセットなどの、頭に装着する装置を表す。より汎用なコンピュータ及びモバイルデバイス(例えば、スマートフォン及びタブレット)のように、これらのデバイスはまた、これらの方法及びそれらを実行するためのプロセッサのファームウェア実装形態を記憶するためのメモリを含む。それらはまた、光学コードオプティマイザ、ジェネレータ、インサータ、及び/又はデコーダの上で参照したFPGA又はASIC実装形態を含み得る。For illustrative purposes, FIG. 32 is a diagram of an electronic device in which the optical code generator, inserter, optimizer, and decoder components may be implemented. This is not intended to be limiting, as embodiments may be implemented in other device architectures or electronic circuits. For example, the electronic device represents a computer in which program instructions for generating, optimizing, inserting, and decoding optical codes are stored and executed to perform the methods described in this document. The electronic device also represents special-purpose computer systems such as thermal label printers, label printers, and meters with barcode scanners. The electronic device also represents head-worn devices such as virtual and augmented reality eyewear and headsets. Like more general-purpose computers and mobile devices (e.g., smartphones and tablets), these devices also include memory for storing firmware implementations of these methods and processors for executing them. They may also include the above-referenced FPGA or ASIC implementations of the optical code optimizer, generator, inserter, and/or decoder.
図32を参照すると、電子デバイスのためのシステムは、多くのデバイス、モジュールなど(それらの各々は、一般的に「構成要素」と称され得る)が通信可能に結合されるバス300を含む。バス300は、ダイレクトメモリアクセス(DMA)バス及びプログラム入力/出力(PIO)バスの機能を組み合わせ得る。言い換えると、バス300は、DMA転送並びに直接CPU読み出し及び書き込み命令の両方を促進し得る。1つの実施形態において、バス300は、アドバンスドマイクロコントローラバスアーキテクチャ(AMBA:Advanced Microcontroller Bus Architecture)準拠データバスのうちの1つである。図32は、すべての構成要素がバス300に通信可能に結合される実施形態を例証するが、構成要素の1つ又は複数のサブセットが、任意の好適又は有益な様式で別個のバスに通信可能に結合され得ること、及び任意の構成要素が、任意の好適又は有益な様式で2つ以上のバスに通信可能に結合され得ることを理解されたい。例証されないが、電子デバイスは、任意選択的に、1つ又は複数のバスコントローラ(例えば、DMAコントローラ、I2Cバスコントローラ、又は同様のもの若しくはそれらの任意の組み合わせ)を含み得、それを通じてデータが構成要素のうちのいくつかのものの間でルーティングされ得る。Referring to FIG. 32, a system for an electronic device includes a
電子デバイスは、CPU302も含む。CPU302は、当該技術分野において知られているマイクロプロセッサ、モバイルアプリケーションプロセッサなどであってもよい(例えば、アーム(ARM Limited)からの縮小命令セットコンピュータ(RISC)、Krait CPU製品群、インテル株式会社(Intel Corporation)から入手可能な、Pentium(登録商標)、Xeon、Itanium、Celeron、Atom、Core iシリーズ製品群内のものを含むX86ベースのマイクロプロセッサなど)。CPU302は、電子デバイスのオペレーティングシステムを実行し、アプリケーションプログラムを実行し、及び任意選択的に、電子デバイスの様々な機能を管理する。CPU302は、オペレーティングシステム(例えば、「高レベル」オペレーティングシステム、「リアルタイム」オペレーティングシステム、モバイルオペレーティングシステム、又は同様のもの若しくはそれらの任意の組み合わせ)又は電子デバイス上で実行する他のデバイスファームウェアを保持し得るリードオンリメモリ(ROM)(図示せず)を含み得るか、又はそれに結合され得る。The electronic device also includes a
電子デバイスはまた、バス300に電気的に結合される揮発性メモリ304を含み得る。揮発性メモリ304は、例えば、任意のタイプのランダムアクセスメモリ(RAM)を含み得る。示されないが、電子デバイスは、揮発性メモリ304への、及びそこからのデータの流れを制御するメモリコントローラをさらに含み得る。The electronic device may also include
電子デバイスはまた、バスに接続されるストレージメモリ306を含み得る。ストレージメモリ306は、典型的には、ROM、EPROM及びEEPROM、NOR若しくはNANDフラッシュメモリ、又は同様のもの若しくはそれらの任意の組み合わせなどの1つ又は複数の不揮発性半導体メモリデバイスを含み、また、例えば、磁気又は光学ディスクなどのあらゆる種類の電子記憶デバイスも含み得る。本発明の実施形態において、ストレージメモリ306は、ソフトウェアの1つ又は複数のアイテムを記憶するために使用される。ソフトウェアは、システムソフトウェア、アプリケーションソフトウェア、ミドルウェア(例えば、リアルタイムシステムのためのデータ配信サービス(DDS)、MERなど)、1つ若しくは複数のコンピュータファイル(例えば、1つ又は複数のデータファイル、構成ファイル、ライブラリファイル、アーカイブファイルなど)、1つ若しくは複数のソフトウェア構成要素、又は同様のもの、又はそれらの任意のスタック若しくは他の組み合わせを含み得る。The electronic device may also include a
システムソフトウェアの例は、オペレーティングシステム(例えば、1つ若しくは複数の高レベルオペレーティングシステム、リアルタイムオペレーティングシステム、モバイルオペレーティングシステム、又は同様のもの若しくはそれらの任意の組み合わせ)、1つ又は複数のカーネル、1つ又は複数のデバイスドライバ、ファームウェア、1つ又は複数のユーティリティプログラム(例えば、電子デバイスの1つ又は複数の構成要素を分析すること、構成すること、最適化すること、管理することなどを助ける)、及び同様のものを含む。Examples of system software include an operating system (e.g., one or more high-level operating systems, real-time operating systems, mobile operating systems, or the like or any combination thereof), one or more kernels, one or more device drivers, firmware, one or more utility programs (e.g., that help analyze, configure, optimize, manage, etc., one or more components of the electronic device), and the like.
バス300には、ユーザインターフェースモジュール308も接続される。ユーザインターフェースモジュール308は、電子デバイスのユーザ制御を促進するように構成される。したがって、ユーザインターフェースモジュール308は、1つ又は複数のユーザ入力デバイス310に通信可能に結合され得る。ユーザ入力デバイス310は、例えば、ボタン、ノブ、タッチスクリーン、トラックボール、マウス、マイクロホン(例えば、エレクトレットマイクロホン、MEMSマイクロホン、又は同様のもの若しくはそれらの任意の組み合わせ)、IR若しくは超音波発生スタイラス、超音波発生器(例えば、ユーザジェスチャを検出するためなど)、1つ若しくは複数の構造化光発生器(例えば、構造化IR光を投影してユーザジェスチャを検出するためなど)、1つ若しくは複数の超音波トランスデューサ、又は同様のもの若しくはそれらの任意の組み合わせを含み得る。Also connected to the
ユーザインターフェースモジュール308はまた、電子デバイスのユーザ制御の効果、又は電子デバイスによって実施されている動作若しくは電子デバイスによって他の方式でサポートされる機能に関連した任意の他の情報をユーザに示すように構成され得る。したがって、ユーザインターフェースモジュール308はまた、1つ又は複数のユーザ出力デバイス312に通信可能に結合され得る。ユーザ出力デバイス312は、例えば、ディスプレイ(例えば、液晶ディスプレイ(LCD)、発光ダイオード(LED)ディスプレイ、アクティブマトリックス有機発光ダイオード(AMOLED)ディスプレイ、電子インクディスプレイなど)、プリンタ、ラウドスピーカ、又は同様のもの若しくはそれらの任意の組み合わせを含み得る。The
一般的に、ユーザ入力デバイス310及びユーザ出力デバイス312は、電子デバイスの必須部分であるが、代替の実施形態において、任意のユーザ入力デバイス310(例えば、マイクロホンなど)又はユーザ出力デバイス312(例えば、スピーカ、ディスプレイ、又はプリンタ)は、電子デバイスに通信可能に結合される(例えば、通信モジュール314を介して)物理的に別個のデバイスであってもよい。プリンタは、2D及び3Dプリンタ(感熱、凹版、インクジェット、オフセット、フレキソ、レーザ、グラビアなど)などの、デジタルデータを担持する画像を物体に適用するための異なるデバイス、並びにエッチング、彫刻、エンボス加工、又はレーザマーキングのための設備を包含する。Typically, the
ユーザインターフェースモジュール308は、個々の構成要素として例証されるが、ユーザインターフェースモジュール308(又はその部分)は、電子デバイスの1つ又は複数の他の構成要素(例えば、CPU302、センサインターフェースモジュール330など)に機能的に統合され得るということを理解されたい。Although the
バス300には、画像信号プロセッサ316及びグラフィック処理ユニット(GPU)318も接続される。画像信号プロセッサ(ISP)316は、1つ若しくは複数のカメラ320によって、又は任意の他の画像センサによって捕捉される像(静止フレーム像、ビデオ像、又は同様のもの若しくはそれらの任意の組み合わせ)を処理し、以て画像データを生成するように構成される。ISP316によって典型的には実施される一般的機能は、ベイヤー変換、デモザイク処理、雑音低減、画像の鮮鋭化、又は同様のもの若しくはそれらの任意の組み合わせを含み得る。GPU318は、ISP316によって生成される画像データを処理し、以て処理済み画像データを生成するように構成され得る。GPU318によって実施される一般的機能は、画像データを圧縮すること(例えば、JPEG形式、MPEG形式、又は同様のもの若しくはそれらの任意の組み合わせに)、照明効果を生み出すこと、3Dグラフィックをレンダリングすること、テクスチャマッピングをすること、幾何学変換(例えば、回転、平行移動など)を計算して異なる座標系などにすること、及びバス300を介して圧縮ビデオデータを電子デバイスの他の構成要素(例えば、揮発性メモリ304)に送信することを含む。ISP316によって生成される画像データ、又はGPU318によって生成される処理済み画像データは、ユーザインターフェースモジュール308によってアクセスされ得、ここでその画像データは、ディスプレイ、プリンタ、又はスピーカなどのユーザ出力デバイス312に送信され得る1つ又は複数の好適な信号へと変換される。Also connected to the
通信モジュール314は、1つ若しくは複数の有線リンク(例えば、イーサネット(登録商標)、USB、ファイヤワイヤなどによる)又は1つ若しくは複数のワイヤレスリンク(例えば、ブルートゥース(Bluetooth)(登録商標)、ブルートゥースローエナジー(Bluetooth Low Energy)、WiFi、WiMAX、GSM(登録商標)、CDMA、EDGE、セルラ3G若しくはLTE、Li-Fi(例えば、IR若しくは可視光通信のための)、音波若しくは超音波通信など、任意の規格、又は別途所望の若しくは好適なワイヤレスプロトコル若しくは技術に従って構成される)、又は同様のもの若しくはそれらの任意の組み合わせを介して、データを送信又は受信する(例えば、ネットワーク内で)ことを促進する回路、アンテナ、センサ、及び任意の他の好適な又は所望の技術を含む。1つの実施形態において、通信モジュール314は、1つ若しくは複数のマイクロプロセッサ、デジタル信号プロセッサ若しくは他のマイクロコントローラ、プログラマブル論理デバイス、又は同様のもの若しくはそれらの組み合わせを含み得る。任意選択的に、通信モジュール314は、キャッシュ若しくは他のローカルメモリデバイス(例えば、揮発性メモリ、不揮発性メモリ、又はそれらの組み合わせ)、DMAチャネル、1つ若しくは複数の入力バッファ、1つ若しくは複数の出力バッファ、又は同様のもの若しくはそれらの組み合わせを含む。いくつかの実施形態において、通信モジュール314は、ベースバンドプロセッサ(例えば、信号処理を実施し、電子デバイスのためのリアルタイム無線伝送動作を実施する)を含む。The
バス300には、1つ又は複数のセンサ333に通信可能に結合されるセンサインターフェースモジュール330も接続される。センサ333は、例えば、商品の重さを計るためのはかりを含む(小売又は食品製造環境において商品及び印刷ラベルの重さを計るために使用されるはかりなど)。図32では別々に例証されるが、任意のカメラ320が、センサ333と考えられ得る。一般的に、センサ333は、何らかの種類の刺激(例えば、光、音、水分、重力場、磁場、電場など)の存在下で、印加された刺激の変化、又は同様のもの若しくはその任意の組み合わせに応答して、1つ又は複数の信号(典型的には、電気信号)を生成する。1つの実施形態において、センサインターフェースモジュール330に結合されるすべてのセンサ333は、電子デバイスの必須部分であるが、代替の実施形態において、センサのうちの1つ又は複数は、(例えば、通信モジュール314を介して)電子デバイスに通信可能に結合される物理的に別個のデバイスであってもよい。任意のセンサ333がユーザ入力を検知するように機能することができる限り、そのようなセンサ333はまた、ユーザ入力デバイス310と考えられ得る。Also connected to the
センサインターフェースモジュール330は、1つ又は複数のセンサ333の動作(例えば、サンプリングレート、サンプリング範囲など)を有効にする、無効にする、又は別途制御するように構成される(例えば、揮発性メモリ304又はストレージメモリ306、ROMなどにおいて内部又は外部に記憶される命令に従って、CPU302、ユーザインターフェースモジュール308などの1つ又は複数の構成要素によって発行されるコマンドに従って)。1つの実施形態において、センサインターフェースモジュール330は、センサ333のうちの1つ又は複数によって生成される信号を、符号化すること、復号すること、サンプリングすること、フィルタリングすること、又は別途処理することができる。1つの例において、センサインターフェースモジュール330は、複数のセンサ333によって生成される信号を統合し、任意選択的に、統合された信号(複数可)を処理することができる。信号は、センサインターフェースモジュール330から電子デバイスの前述の構成要素のうちの1つ又は複数に(例えば、バス300を介して)ルーティングされ得る。しかしながら、別の実施形態において、センサ333によって生成される任意の信号は、処理される前に(例えば、CPU302に)ルーティングされ得る。The
一般的に、センサインターフェースモジュール330は、1つ若しくは複数のマイクロプロセッサ、デジタル信号プロセッサ若しくは他のマイクロコントローラ、プログラマブル論理デバイス、又は同様のもの若しくはそれらの任意の組み合わせを含み得る。センサインターフェースモジュール330はまた、キャッシュ若しくは他のローカルメモリデバイス(例えば、揮発性メモリ、不揮発性メモリ、又はそれらの組み合わせ)、DMAチャネル、1つ若しくは複数の入力バッファ、1つ若しくは複数の出力バッファ、及びそれがサポートする機能(例えば、上に説明されるような)を促進する任意の他の構成要素を含み得る。In general, the
他の好適な動作環境は、参照により組み込まれた文書に詳述される。Other suitable operating environments are detailed in the documents incorporated by reference.
シグナルリッチアート変異形Signal Rich Art Mutation
本文書に説明される技術は、所望のデザイン美観を有する光学コード信号を構築するために使用され得る。本発明者らは、出力を“シグナルリッチアート”と呼ぶが、それは、出力が、光学コード信号を担持すると同時に所望の審美的効果を提供するためである。これらの手法は、一般的には、以下の方法のうちの1つに当てはまる:The techniques described in this document can be used to construct optical code signals with desired design aesthetics. We call the output "signal rich art" because it carries the optical code signal while providing the desired aesthetic effect. These techniques generally fall into one of the following categories:
方法1A:高密度光学コード信号を生成し、それをスパースな信号に変換し、次いで、スパースな信号からシグナルリッチアートを構築する。Method 1A: Generate a dense optical code signal, convert it to a sparse signal, and then construct a signal rich art from the sparse signal.
方法1B:所望の空間密度で参照及びペイロード信号構成要素を含む光学コード信号を生成し、次いで、その信号からシグナルリッチアートを構築する。光学コード信号は、所望の空間密度(高密度又はスパース)で生成され得るため、高密度光学コード信号からスパースなコード信号を生成する必要はない。Method 1B: Generate an optical code signal containing reference and payload signal components at a desired spatial density and then construct a signal rich art from that signal. Since the optical code signal can be generated at a desired spatial density (dense or sparse), it is not necessary to generate a sparse code signal from a high density optical code signal.
方法2:高密度光学コード信号を生成し、それを、図形要素をスパースな場所に置くことによって、所望の密度のスパースな信号に変換する。Method 2: Generate a high density optical code signal and convert it to a sparse signal of the desired density by placing geometric elements in sparse locations.
方法3:所望の密度にある光学コード信号を生成し、それを高強度でホストアートワークと結合し、次いで、マーク付きホストアートワークを表すために空間的位置に図形要素を置くことによって、結合された信号をシグナルリッチアートに変換する。Method 3: Generate an optical code signal at the desired density, combine it with host artwork at high intensity, and then convert the combined signal into signal-rich art by placing graphic elements in spatial locations to represent the marked host artwork.
例証のため、本発明者らは、第1の方法の例から始める。後で、本発明者らは、点描パターンを作成することと関連して方法2及び3の例を説明する。点描パターンは、円形ドットからなるものとして例証されるが、それらはまた、円以外の形状にある他の基本図形で構築され得る。For illustrative purposes, we start with an example of the first method. Later, we describe examples of
本発明者らの実装形態は、ソフトウェアプログラムで構築され、例えば、埋め込み光学コードを有するパッケージ又はラベルデザインを作成するために、画像編集ソフトウェア内で実行されるようにデザインされる。フロー図は、モジュールで構成されているソフトウェア命令において実施される例示的な実施形態を描写する。これらのモジュールの構成及び包含は、例えば、クラウドコンピューティング、デスクトップコンピュータ、複数のプロセッサ上の分散コンピューティング、及び/又はプリンタ内で実行する埋め込みファームウェアなど、特定のアプリケーション又はコンピューティング環境のための他の実施形態を作成するように構成され得る。Our implementation is constructed in a software program and designed to run within image editing software, for example, to create packaging or label designs with embedded optical codes. The flow diagram depicts an exemplary embodiment embodied in software instructions that are organized in modules. The organization and inclusion of these modules may be configured to create other embodiments for specific applications or computing environments, such as, for example, cloud computing, desktop computers, distributed computing on multiple processors, and/or embedded firmware executing within a printer.
図33は、光学コード信号からシグナルリッチアートを構築する方法のフロー図である。本方法は、光学コード信号構成要素を生成することによって始まる(502)。それを行うために、本方法は、例えば、図3~図5の方法(例えば、図3の30、32、図4の40、42、及び図5の50、52)のうちの1つを用いる。Figure 33 is a flow diagram of a method for constructing signal rich art from an optical code signal. The method begins by generating optical code signal components (502). To do so, the method may use, for example, one of the methods of Figures 3-5 (e.g., 30, 32 of Figure 3, 40, 42 of Figure 4, and 50, 52 of Figure 5).
次に、本方法は、所望の空間密度にある光学コード信号のタイルを構築する(504)。このモジュール504を実施するための1つの手法は、検出器の予測フィルタを高密度光学コードタイル内の信号値に適用し、次いでフィルタ出力内の最小値の場所のスパースな信号座標を生成して、所望の間隔及び密度を有する座標を選択することである。実施者はまた、本文書内で詳述される可変密度光学コード信号を生成するための他の手法の中から選択し得る。これらの方法は、光学コード信号のマーキング要素が優先順位付けされている空間座標を提供する。例えば、いくつかの実施形態は、光学コード信号内に最大値(例えば、最も暗い、又は最も明るい画素)が存在するマーキング要素(ドット又は穴)の空間座標を選択する。いくつかの実施形態は、“参照信号ドット選択によるメッセージシグナリング”という表題の付いた章内の例に説明されるような参照及びペイロード構成要素のマーキング要素を選択的に置く。Next, the method builds tiles of the optical code signal at the desired spatial density (504). One approach to implementing this
次に、本方法は、光学コード信号タイルの空間座標に基づいて線画を構築する(506)ためにいくつかの代替の方法のうちの1つを用いる。本発明者らは、様々な技術を用いて実験を行い、いくつかは、包装及びラベル用途に相応しい十分な堅牢性を提供するということを見出した。様々な形態のアートを受容する本方法の柔軟性が理由で、本方法は、シグナルリッチアートを提供するための一般的なフレームワークを提供する。この点を実証するため、本発明者らは、図面においていくつかの例を例証し、それらを以下で説明する。The method then uses one of several alternative methods to construct (506) a line drawing based on the spatial coordinates of the optical code signal tiles. The inventors have experimented with a variety of techniques and found that some provide sufficient robustness for packaging and labeling applications. Because of the flexibility of the method to accept various forms of art, the method provides a general framework for providing signal-rich art. To demonstrate this point, the inventors illustrate several examples in the drawings, which are described below.
シグナルリッチタイルを作成した後、本方法は、アートワークファイルにタイルを挿入すること(508)へと進む。1つの実施形態において、挿入方法は、アドビフォトショップ(登録商標)(Adobe Photoshop)又はイラストレータ(Illustrator)(商標)のためのプラグインなど、画像編集プログラムに統合される。挿入方法は、X及びY次元においてタイルを再現し、画像又は図形などのアートワーク要素の形状に適合するように信号をマスクする。タイルの再現は、X及びY方向においてそれを縁から縁まで繰り返して、タイルが適用されることになるアートワークファイル内のアートワーク領域と同一の広がりをもつマッピングされたタイルをもたらすことによって実行される。マッピングされたタイルのマスキングは、マッピングされたタイルの画素を、アートワーク要素の境界の外側では0に設定することによって実行される。計算を節約するために、境界回り込み条件を用いるのが好ましい。再現プロセス(タイル化とも称される)において、境界回り込み条件は、タイルの左縁から右縁及び上縁から下縁への回り込みを仮定して、境界におけるシグナルリッチアートを計算するために使用される。境界回り込み条件の例は、トロイダル境界回り込み条件又は周期境界条件である。境界回り込み条件を用いてシグナルリッチアートタイルを再現する手法は、それが、アートワークファイル内のより大きい領域を充填するようにタイル化することによってシームレスに繰り返される1つのシグナルリッチアートタイルの作成を可能にすることが理由で、計算を節約する。After creating the signal-rich tile, the method proceeds to inserting the tile into the artwork file (508). In one embodiment, the insertion method is integrated into an image editing program, such as a plug-in for Adobe Photoshop or Illustrator. The insertion method recreates the tile in the X and Y dimensions, masking the signal to fit the shape of the artwork element, such as an image or shape. The recreation of the tile is performed by repeating it edge-to-edge in the X and Y directions, resulting in a mapped tile that is coextensive with the artwork area in the artwork file to which the tile is to be applied. The masking of the mapped tile is performed by setting the pixels of the mapped tile to 0 outside the boundaries of the artwork element. To save on computations, a boundary wrap condition is preferably used. In the recreation process (also called tiling), the boundary wrap condition is used to calculate the signal-rich art at the boundaries, assuming wrap from the left edge to the right edge and from the top edge to the bottom edge of the tile. Examples of boundary wrap conditions are toroidal boundary wrap conditions or periodic boundary conditions. The technique of reproducing signal-rich art tiles using boundary wrap conditions saves computation because it allows the creation of one signal-rich art tile that is seamlessly repeated by tiling to fill a larger area in the artwork file.
代替案は、標的画像サイズ及び形状にあるシグナルリッチアートを作成することである。これは、アートワークのより大きい領域を充填するようにタイル化することによって高密度光学コード信号タイルを再現し、このタイル化された出力をスパースな信号に変換し、次いで、スパースな信号をシグナルリッチアートに変換することによって達成される。別の代替案は、単一の高密度タイルをスパースな信号に変換し、より大きい領域を充填するようにタイル化することによってスパースな信号を再現し、次いで、スパースな信号をシグナルリッチアートに変換することである。これらの挿入方法は、アートワーク要素の境界と同一の広がりをもつ光学コード信号の冗長符号化により恣意的な形状のアートワーク要素を強化する。An alternative is to create signal-rich art that is in the target image size and shape. This is accomplished by recreating a dense optical code signal tile by tiling it to fill a larger area of the artwork, converting this tiled output to a sparse signal, and then converting the sparse signal to signal-rich art. Another alternative is to convert a single dense tile to a sparse signal, recreating the sparse signal by tiling it to fill a larger area, and then converting the sparse signal to signal-rich art. These insertion methods enhance arbitrarily shaped artwork elements with redundant encoding of the optical code signal that is coextensive with the boundaries of the artwork element.
次に、本方法は、光学コード信号が所望の堅牢性制約を満足することを検証する(510)。このモジュールに関する詳細については、堅牢性予測プログラムについて説明する図2及び図12と関連して説明される議論及び参照文献を参照されたい。堅牢性予測プログラムは、アートワーク内の検証座標のアレイにおける信号のための検出メトリックが、特定の光学走査応用のための最小カバレッジエリアを超える空間領域にわたってしきい値を上回ることを確実にすることによって、光学コード信号が信頼できることを検証する。Next, the method verifies that the optical code signal satisfies desired robustness constraints (510). For more information regarding this module, see the discussion and references provided in conjunction with FIGS. 2 and 12, which describe the robustness prediction program. The robustness prediction program verifies that the optical code signal is reliable by ensuring that a detection metric for signals at an array of verification coordinates in the artwork exceeds a threshold over a spatial region that exceeds a minimum coverage area for the particular optical scanning application.
最後に、光学コード信号の再現されたタイルを運搬する完成したアートワークは、例えば、印刷、エンボス加工、又は代替の物体マーキング技術によって物体に適用される(512)。Finally, the completed artwork carrying the reproduced tiles of the optical code signal is applied to an object (512), for example by printing, embossing, or alternative object marking techniques.
図34は、巡回セールスマン(TSP)法を用いて光学コード信号の空間座標を接続することによって作成される光学コード信号タイル514を例証する。巡回セールスマン問題は、コンピューティングにおいて研究され、実際的応用に適合されている。この問題は、一般的に以下のように組み立てられる:都市及び都市の各対の間の距離のリストを前提として、各都市を訪問し、出発都市に戻る最も短い考えられ得るルートは何であるか?本発明者らの場合、都市は、光学コード信号(又はアートワークと結合された光学コード信号)から導出されるスパースな座標であり、解決策によって生成される経路はレンダリングされて、レンダリングされた出力内に光学コード信号を埋め込む。この手法は、図33の方法と併せて使用されるとき、堅牢な光学コード信号を保持するのに効果的であるが、それは、堅牢な光学コード信号が、光学コード信号の高い優先度の構成要素の、点、即ち、最小値を横断するためである。さらに、線分の経路が交わらない(“都市”において以外では)ということに起因して、線が交差する場合に疑似の最小値を表す線交差点を作成しない。テストのため、本発明者らは、TSPを解決するのに発見的なLin-Kernighanの実装形態である、LKHと呼ばれるTSPソフトウェアを使用した。さらなる情報については、LKHは、K.Helsgaun、An Effective Implementation of the Lin-Kernighan Traveling Salesman Heuristic.DATALOGISKE SKRIFTER(Writings on Computer Science)、No.81、1998、Roskilde Universityに説明され、http://www.akira.ruc.dk/~keld/research/LKH/で見つけることができる。34 illustrates an optical
本発明者らは、TSP法が、光学コード信号タイル内にさらなる点を追加することと併せて高速フーリエ変換(FFT)補間を使用することによって改善され得るということを観察した。要約すると、このシグナルリッチアート法は、光学コード信号内の極値(輝度最小値にある暗いマーキング)の座標にマーキングを付けるように実施されなければならない。極値の座標は、例えば、光学コード信号の画素値をソートし、線間の最小間隔を維持しながら所望の線密度が達成されるまで、光学コード信号のソートされた値の順にこれらの座標においてタイルに点を充填することによって、識別され、優先順位付けされる。これは、極値の座標における隣接するマークなし領域に対するコード信号コントラストを強調する。しかしながら、線を局所的極値の点を通って描写することだけでは、その点における光学コード信号を強力に表さないことがある。この問題を是正するために、実施形態は、スパースな光学コード信号の座標において複製点を挿入する。FFT補間は、点を通って線を描くために使用される。複製点は、FFT補間動作が点の周りの2D領域内にループを追加することを引き起こし、以てその点におけるマーキングを強調する。The inventors have observed that the TSP method can be improved by using Fast Fourier Transform (FFT) interpolation in conjunction with adding additional points in the optical code signal tiles. In summary, the signal rich art method must be implemented to mark the coordinates of extrema (dark markings at luminance minima) in the optical code signal. The coordinates of the extrema are identified and prioritized, for example, by sorting the pixel values of the optical code signal and filling the tile with points at these coordinates in the order of the sorted values of the optical code signal until the desired line density is achieved while maintaining a minimum spacing between lines. This enhances the code signal contrast against adjacent unmarked areas at the coordinates of the extrema. However, simply drawing a line through a point of a local extrema may not strongly represent the optical code signal at that point. To remedy this problem, an embodiment inserts duplicate points at the coordinates of the sparse optical code signal. FFT interpolation is used to draw a line through the points. The duplicate points cause the FFT interpolation operation to add loops in the 2D region around the point, thereby enhancing the marking at that point.
図52は、このTSP実施形態の例を示す。本発明者らの応用では、FFT補間は、スパースな点の空間画像をフーリエ領域に変換し、さらなる水増し点を追加し、次いで、結果を逆変換して空間領域へと戻す。ある場所におけるスパースな点の複製インスタンスは、図52に示されるループの効果を作成する。Figure 52 shows an example of this TSP embodiment. In our application, FFT interpolation transforms a spatial image of sparse points into the Fourier domain, adds additional padding points, and then transforms the result back into the spatial domain. Duplicating instances of sparse points in certain locations creates the effect of a loop as shown in Figure 52.
シグナルリッチアートを生成するためのTSPの別の実施形態は、以下の通りである。点のスパースな構成を前提として、1つはX軸に沿って2倍に延伸された点(又は何らかの他のデザイン選択)のため、もう1つはY軸に沿って2倍に延伸された点のために、2つのTSPが計算される。次いで、TSP経路は、点が、それらが元来あった場所で終わるように非延伸され、またTSP経路は、それらの点において交差し、以て局所的最小値を強化する。これは、FFT補間及びその変異形と組み合わされ得る。点のスパースな構成は、所望の空間密度にある光学コード信号要素の離間した座標を指す。本文書内のスパースな構成を作成するための様々な方法は、この実施形態の変異形を作成するために使用され得る。Another embodiment of a TSP for generating signal rich art is as follows: Given a sparse configuration of points, two TSPs are calculated, one for the points stretched twice along the X axis (or some other design choice) and one for the points stretched twice along the Y axis. The TSP paths are then unstretched so that the points end where they were originally, and the TSP paths intersect at those points, thus reinforcing local minima. This can be combined with FFT interpolation and its variants. The sparse configuration of points refers to the spaced coordinates of the optical code signal elements at the desired spatial density. The various methods for creating sparse configurations in this document can be used to create variants of this embodiment.
図35は、等高線プロットを使用して作成される光学コード信号タイル516を例証する。等高線プロットは、グレースケール画像を入力として得て、指定の数のレベルについて、同じグレーレベルにある画像内の座標を通る等高線を決定するプログラム方法である。このタイプの画像処理ルーチンの1つの例は、MathWorksからのMatLabにおけるimcontourである。このルーチンは、画像、及び等高線レベルの数を入力として得て、各レベルについて等高線を出力して、等高線を画像内のX座標とY座標との間の線分として指定する。この手法は、輝度最小値によって形成される信号谷部を通る線を作成することが理由で、高密度タイルからの光学コード信号を保持する。Figure 35 illustrates an optical
等高線は、高密度タイルの画素値のグローバル平均値よりも低いレベルで描かれる。この制約により、等高線によって規定されるループは、局所的最小値の周りをぴったりと回り、このループは、出力画像内に局所的なグレースケール低下を作成する。等高線のレベルが低すぎるとき、この方法は、タイル内の最も低い最小値の周りのみに等高線を有するスパースな光学コード信号を生成し、信号を回復するのに十分な情報を提供しないことがある。等高線レベルが高密度光学コード信号のグローバル平均に近すぎるとき、局所的最小値は、十分に強調されないことがある。したがって、光学コード信号を担持するアートワークの信号堅牢性及びスパース性の均衡を保つために、平均より約1標準偏差下であるレベルを選択することが望ましい。The contours are drawn at a level lower than the global average of the pixel values of the high-density tile. This constraint causes the loops defined by the contours to wrap tightly around local minima, which create local grayscale drops in the output image. When the contour levels are too low, the method produces a sparse optical code signal with contours only around the lowest minimum in the tile, which may not provide enough information to recover the signal. When the contour levels are too close to the global average of the high-density optical code signal, the local minima may not be sufficiently emphasized. Therefore, it is desirable to select a level that is about one standard deviation below the mean to balance signal robustness and sparsity of the artwork carrying the optical code signal.
さらに別の例を提供すると、図36は、スパースな点に縦線を置くことによって作成される光学コード信号タイル518を例証する。この手法は、暗い縦線をその輝度最小値にある座標を通って置くことが理由で、光学コード信号を保持する。Providing yet another example, FIG. 36 illustrates an optical
このテーマで継続して、図37は、コード信号内のスパースな座標のドロネー三角形分割から光学コード信号を構築する方法を例証するフロー図である。ソフトウェアモジュール520、522、526、及び528は、502、504、508、及び510としてモジュールについて説明されるように実施される。モジュール524は、光学コード信号の空間座標を接続する線分を、それらの座標における頂点のドロネー三角形分割を生成することによって、形成する。ドロネー三角形分割を実施するための好適なルーチンは、MathWorksからのMatLabにおけるQhull及びドロネー関数である。モジュール508について上に説明されるように、モジュール526におけるアートワーク内のシグナルリッチタイルのタイル化は、好ましくは、境界回り込み条件を使用して実行される。三角形分割の場合、これは、三角形分割が回り込みありで計算されることを意味する。これを達成するための1つの方法は、タイルの左縁から右縁及び上縁から下縁への回り込みを前提として境界におけるボロノイ領域を計算し、次いで、ボロノイグラフの双対からドロネー三角形分割を獲得することである。Continuing on this theme, FIG. 37 is a flow diagram illustrating a method for constructing an optical code signal from a Delaunay triangulation of sparse coordinates in the code signal.
光学コードのタイルを構築することにおいて、モジュール522は、所望の間隔及びドット密度を考慮して、光学コード信号構成要素の輝度最小値に位置する頂点の座標を選択する。モジュール524は、図33のモジュール506の特定の実装形態である。他のタイプの三角形分割は、最小値を接続する目的を達成するが、ドロネー三角形分割は、ボロノイ図と関連して以下に詳しく述べられるいくつかの利益を有する。ドロネー三角形分割は、平面内での点のセットの三角形分割であり、その結果として、任意の三角形の外接円の内側に点がない。それは、三角形の最小角度を最大限にし、これは細長い三角形を回避する傾向がある。In constructing the tiles of the optical code,
デザインファイル内の光学コード信号を検証した後(528)、そのファイルのアートワークは、物体(例えば、パッケージ基材、ラベルなど)に印刷又はエンボス加工される530。After verifying the optical code signal in the design file (528), the artwork from that file is printed or embossed onto an object (e.g., packaging substrate, label, etc.) 530.
図38は、図37の方法によって作成される光学コード信号タイル532を例証する。図38に描写されるように、頂点は、それらが複数の線分の集束部にあるため、出力画像の最も暗い点である。Figure 38 illustrates an optical
図34、図35、及び図38に示される4つの例は、輝度最小値に対応する信号タイル内の座標に暗いマーキングを置く技術を例証する。堅牢な光学コード信号を保持する補完的手法は、輝度最大値の周りの谷部に暗いマーキングを置くことである。本発明者らは、その例を示すことによってこれを例証し、ボロノイ図に基づいた手法から開始する。加えて、これらの手法の各々は、暗いアートワークでは逆にされ得、優先順位付けされた光学コード担持要素は、より暗い背景に対して輝度最大値(明るい画素)である。The four examples shown in Figures 34, 35, and 38 illustrate the technique of placing dark markings at coordinates within the signal tile that correspond to luminance minima. A complementary approach to preserve a robust optical code signal is to place dark markings in valleys around luminance maxima. We illustrate this by showing examples, starting with an approach based on Voronoi diagrams. In addition, each of these approaches can be reversed for dark artwork, where the prioritized optical code-bearing elements are luminance maxima (bright pixels) against a darker background.
ボロノイ図は、平面の特定のサブセット内の点までの距離に基づいて平面を領域へと区切ることである。その点のセット(シード、サイト、又はジェネレータと呼ばれる)は、事前に特定され、各シードについて、任意の他のものよりもそのシードに近いすべての点からなる対応する領域が存在する。これらの領域は、ボロノイ領域と呼ばれる。各々のそのようなボロノイ領域は、半空間の交差点から獲得され、故にそれは、凸多角形である。ボロノイ図の線分は、2つの最も近いサイトに等距離である平面内のすべての点である。ボロノイ頂点(ノード)は、3つの(又はそれ以上の)サイトに等距離の点である。A Voronoi diagram is a partitioning of a plane into regions based on distance to points in a particular subset of the plane. The set of points (called seeds, sites, or generators) is specified in advance, and for each seed there is a corresponding region consisting of all points that are closer to that seed than any other. These regions are called Voronoi regions. Each such Voronoi region is obtained from the intersection of a half-space, and hence it is a convex polygon. The segments of a Voronoi diagram are all points in the plane that are equidistant to the two nearest sites. The Voronoi vertices (nodes) are points that are equidistant to three (or more) sites.
ボロノイ図は、ベクトル量子化と呼ばれる信号処理技術に応用される。ベクトル量子化は、確率密度関数がプロトタイプベクトルの分布によってモデル化される量子化技術である。それは、多くのデータ点セット(ベクトル、画素値のような)を、それらの最も近くにあるほぼ同じ数の点を有するグループに分割する。各グループは、その重心点によって表される。データ圧縮のためのベクトル量子化の応用は、最も少ない点を有するが、最も高い信号忠実性又は品質にある信号を表すことを求める。Voronoi diagrams have application in a signal processing technique called vector quantization. Vector quantization is a quantization technique in which the probability density function is modeled by the distribution of prototype vectors. It divides a large set of data points (vectors, such as pixel values) into groups with approximately the same number of points in their nearest neighborhood. Each group is represented by its centroid point. Applications of vector quantization for data compression seek to represent a signal with the fewest points but with the highest signal fidelity or quality.
ボロノイ図は、信号の点を量子化ビンへとグループ化するための方法を提供し、各ビンは、ビンの重心によって、又はボロノイ領域の場合は、領域の重心によって表される。本発明者らの応用において、目的は、所望のレベルの視覚的品質及び信号堅牢性を達成すると同時に、最も少ない光学コード信号点を有する所望の光学密度にある光学コード信号を作成することである。ボロノイ図の本発明者らの適応は、マーキング要素間の所望の間隔を提供し、芸術的効果を有するパターンを生成すると同時に、光学コード信号を表すために必要とされる点を最小限にすることによって、この目的を達成する。The Voronoi diagram provides a method for grouping the points of a signal into quantized bins, with each bin represented by its centroid, or in the case of Voronoi regions, by the centroid of the region. In our application, the objective is to create an optical code signal at a desired optical density with the fewest optical code signal points while achieving a desired level of visual quality and signal robustness. Our adaptation of the Voronoi diagram achieves this objective by minimizing the points required to represent the optical code signal while providing the desired spacing between marking elements and producing a pattern with artistic effect.
ボロノイ図は、ドロネー三角形分割の双対グラフである。ドロネー三角形分割内の三角形の外接円の中心を接続することにより、ボロノイ図を生成する。ボロノイ図は、MathWorksからのMatLabにおけるボロノイ関数を使用して、又はQhullプログラムによって計算されるドロネー三角形分割により、実施され得る。Qhullは、各ボロノイ領域についてボロノイ頂点を出力する。A Voronoi diagram is the dual graph of a Delaunay triangulation. A Voronoi diagram is generated by connecting the centers of the circumscribing circles of the triangles in the Delaunay triangulation. A Voronoi diagram can be implemented using the Voronoi function in MatLab from MathWorks, or with the Delaunay triangulation computed by the Qhull program. Qhull outputs the Voronoi vertices for each Voronoi region.
図39は、光学コード信号の最大値から導出されるボロノイ図から光学コード信号を構築する方法を例証するフロー図である。ここでは、モジュール534、540、542、及び出力マーキング544は、図37内のそれらの対となるもの(520、526、528、及び530)と同様である。図37及び図39の方法は、モジュール536が最大値を見出し(対して、522では最小値)、モジュール538が最大値の座標からボロノイ図を形成するという点で異なる。加えて、モジュール540において、タイル化方法は、好ましくは、境界において計算されるボロノイ領域に基づいてトロイダル又は周期境界条件などの境界回り込み条件を用いる。Figure 39 is a flow diagram illustrating a method for constructing an optical code signal from a Voronoi diagram derived from the maxima of the optical code signal. Here,
図40は、図39の方法によって作成される光学コード信号タイル550を例証する。図40に描写されるように、ボロノイ図の線は、タイル550の最も暗い点である。図41~図42は、アートワーク要素の形状、具体的には、葉552及び554、に適合するようにマスクされた、光学コード信号のさらなる例を例証する。ここでは、ボロノイ図内の線分は、葉552、554内の葉脈の自然のパターンを形成する。Figure 40 illustrates an optical
図43~図44は、高密度光学コード信号タイル内の最大値の座標から生成される光学コード信号タイルのさらなる例を例証する。光学コード信号タイル556は、最大値の座標の周りに正方形をプログラム的に形成することによって生成される。同様に、図44のタイル558は、最大値の座標の周りに矩形を形成することによって生成される。FIGS. 43-44 illustrate further examples of optical code signal tiles generated from the coordinates of the maximum values in a high density optical code signal tile. Optical
図43~図44の光学コード信号タイルは、以下の動作に従って生成される:The optical code signal tiles of Figures 43-44 are generated according to the following operations:
光学コード信号タイルを、例えば、図3~図5の方法、又は同様のものを使用して、生成する。Generate the optical code signal tiles, for example, using the methods of Figures 3-5, or similar.
画素値に基づいてタイル内の最大値を識別する。Identify the maximum value in a tile based on pixel value.
正方形、円形、矩形、三角形などの形状にある図形要素を置く。Place geometric elements in shapes such as squares, circles, rectangles, triangles, etc.
最大値を識別するプロセスは、代替の方法で実施されてもよい。1つの手法において、プログラム方法は、振幅によってタイル内の画素値をソートし、最大振幅の画素から始めて、振幅の順に画素を選択し、最小間隔距離内の後続の画素を却下する。最小間隔距離は、以前に選択された最大値の侵入禁止領域内にある最大値を却下することによって評価される。この手法は、図14と関連してスパースな信号生成について本文書において説明されるものと同様である。本文書に説明されるように、この選択プロセスは、画素値を値によりビン内へグループ化すること、及び/又は、ソート前の前処理ステップとして、しきい値比較動作によって画素を除去することによって、高速化され得る。The process of identifying the maximum value may be implemented in alternative ways. In one approach, the program method sorts the pixel values in the tile by amplitude, and selects pixels in order of amplitude, starting with the pixel with the largest amplitude, rejecting subsequent pixels within a minimum spacing distance. The minimum spacing distance is evaluated by rejecting maxima that are within a no-go zone of a previously selected maximum. This approach is similar to that described herein for sparse signal generation in connection with FIG. 14. As described herein, this selection process may be sped up by grouping pixel values into bins by value and/or removing pixels with a threshold comparison operation as a pre-processing step before sorting.
図形要素の配置は、同様に様々な方法で達成され得る。1つの手法において、画像編集プログラムが、画像内の画像要素を選択し、それらを、選択された要素の場所を中心として、異なる図形要素と置き換えるために呼び出される。代替の実装形態は、各々の新規要素が、上層に置かれ、その下のすべての要素をマスクするように、順次ランダムに処理する、画像要素を図形形状(例えば、正方形、円形、矩形、三角形など)と置き換えるMatLabルーチンを実行することである。要素の配置の順は、結果を変えるが、信号堅牢性に影響を及ぼさない。The placement of the geometric elements can be accomplished in a variety of ways as well. In one approach, an image editing program is called to select image elements in the image and replace them with different geometric elements, centered around the location of the selected elements. An alternative implementation is to run a MatLab routine that replaces image elements with geometric shapes (e.g., squares, circles, rectangles, triangles, etc.), processing them in a sequential, random order, with each new element placed on top and masking all elements below it. The order of element placement changes the results, but does not affect signal robustness.
堅牢性を改善するために、プログラム実装形態は、結果をフィルタリングして、最終画像から小物体を除去しなければならない。特に、画像フィルタは、同じ領域内の複数の重複するマスク内のギャップに形成される8画素よりも小さい不規則な画像ブロブを除去する。これらの小さいブロブは、堅牢性を減少させ、視覚的品質を劣化させる。したがって、それらを除去することにより、光学コード信号の信頼性を改善し、また視覚的品質を改善する。To improve robustness, the program implementation must filter the results to remove small objects from the final image. In particular, the image filter removes irregular image blobs smaller than 8 pixels that form in gaps in multiple overlapping masks in the same region. These small blobs reduce robustness and degrade visual quality. Therefore, removing them improves the reliability of the optical code signal and also improves visual quality.
点描法、ボロノイ法、及びドロネー法Pointillism, Voronoi, and Delaunay methods
光学コード信号の信号堅牢性及び視覚的品質を最適化するテーマを継続して、本発明者らは、これより、光学コード信号を担持するアートワークを生成するための点描法へと移る。本発明者らの点描ベースの方法は、ベクトル量子化の性質、及びいくつかの実施形態においては、ボロノイ図を活用する。点描は、小ドットを使用することによって、グレースケールをシミュレートする、又はシェーディングするパターンの作成である。これらのドットは、任意の所望の色で作られ得、またそのようなものとして、任意の色のアートワーク要素を表すために使用され得る。さらに、ドットは、画像デザインファイルの1つ若しくは複数の色分解又はインクにおける輝度修正又はクロミナンス修正で光学コード信号を伝達するために使用され得る。ドットの空間密度の変動は、アートワーク内のグレースケールレベルに対応する領域における所望のグレースケール値又は強度の表現を可能にする。これらの変動が、今度は、光学コード信号タイルを伝達するためにアートワークの変調を促進する。Continuing the theme of optimizing the signal robustness and visual quality of the optical code signal, we now move to a pointillism method for generating artwork bearing the optical code signal. Our pointillism-based method exploits the properties of vector quantization and, in some embodiments, Voronoi diagrams. Pointillism is the creation of a pattern that simulates grayscale or shading by using small dots. These dots can be made in any desired color and, as such, can be used to represent artwork elements of any color. Furthermore, the dots can be used to convey the optical code signal with luminance or chrominance modifications in one or more color separations or inks of the image design file. Variations in the spatial density of the dots allow for the expression of desired grayscale values or intensities in areas that correspond to grayscale levels in the artwork. These variations, in turn, facilitate the modulation of the artwork to convey the optical code signal tiles.
図45は、データ担持アートワークを所望の密度で点描アートに変換するための点描法を例証するフロー図である。モジュール600において、この方法は、例えば、図3~図5に例証される技術及び上に説明される実施形態のいずれかを使用して、光学コード信号タイルを生成することによって始まる。Figure 45 is a flow diagram illustrating a pointillism method for converting data-bearing artwork into pointillism art at a desired density. In
次に、モジュール602は、光学コード信号タイルの修正をホストアートワーク内の対応するアートワーク要素に適用する。モジュールは、まず、タイルを、X及びY方向に冗長的に、タイルの領域に対応するアートワークの領域にマッピングする。次いでそれは、画素値(輝度又はクロミナンス)を、それらの画素にマッピングされるタイル内のビットセルにおける光学コードの値に対応するアートワークの場所において修正する。修正は、輝度又はクロミナンスに対する最大の正及び負の調整が非常に高くなり得ることを意味する高強度で適用され得るが、本方法は、依然として、十分な視覚的品質の出力画像を生成する。これの理由は、点描法が修正の視覚的影響を低減することである。
モジュール604は、点描法を実行して、602から出力された修正画像を変換する。好ましくは、モジュール604は、重み付けされた重心ボロノイ図法を用いて、修正画像を表す点描パターンにおいて点描のための場所を生成する。
次に、モジュール606は、光学コード信号の堅牢性が十分であることを検証する。この手法は、堅牢性予測と関連して以前に説明され、上で参照された堅牢性及び関連信号検出メトリックのうちの1つ又は複数を使用して実施される。
最後に、検証された画像ファイルは、光学コード信号を運搬する、物理的物体、例えば、パッケージ、ラベル、又は他の基材を作成するために、物体に印刷される、又は別の方法でマークされる(608)。Finally, the verified image file is printed or otherwise marked onto a physical object, such as a package, label, or other substrate, to create a physical object that carries the optical code signal (608).
図46は、データ担持画像を所望の密度にある点描パターンに変換するための点描法を例証するフロー図である。この方法は、点描法が光学コード信号タイルに直接適用されるという点で図45とは異なる。モジュール610、612、及び614は、図45の600、604、及び606と同様に実施され、結果は、物体に、印刷されるか、又は別の方法でマークされる(616)。処理リソースを節約するために、モジュール610からの光学コード信号の単一のタイルが、点描パターンに変換され、境界回り込み条件が、上に説明されるように(特に、ボロノイベースの方法について)、タイルの縁に点描パターンを作成するために使用される。この手法は、単一のタイルが、より大きいアートワークのために点描パターンの生成を繰り返す必要性なしに、より大きいアートワーク領域に適合するように効率的にタイル化されることを可能にする。Figure 46 is a flow diagram illustrating a pointillism method for converting a data-bearing image into a pointillism pattern at a desired density. This method differs from Figure 45 in that the pointillism method is applied directly to the optical code signal tiles.
図47は、図45の技術に基づいて点描パターンに変換された、信号運搬アートワークの例を例証する。この例では、モジュール602は、画像620内のアートワークの輝度を変調して、画像にわたって光学コード信号のタイルを埋め込む。関連手法において、モジュール602は、画像の色分解又は1つ若しくは複数のクロミナンスチャネルを変調するように構成される。モジュール602において実行されるこのプロセスは、図47の左に示される信号運搬画像620を生成する。次いで、モジュール604の点描法は、画像620を点描パターン622に変換する。点描パターン622は、詳細を示すために拡大される。画像の通常スケールは、強力に埋め込まれた光学コード信号を伴ってさえも最終画像の視覚的品質を例証するために画像624として右端に例証される。Figure 47 illustrates an example of signal-bearing artwork converted to a pointillism pattern based on the technique of Figure 45. In this example,
図48は、光学コード信号タイル630の点描パターンの例を例証する。これは、所望のドット密度を有するスパースな光学コード信号を提供するために、図46の手法を使用して生成される。Figure 48 illustrates an example of a stipple pattern of optical
図49は、光学信号を担持するアートワークの点描パターンを生成するために、重み付けされたボロノイ図を用いる方法を例証するフロー図である。このプロセスは、データ担持画像信号を生成することによって始まる。例えば、モジュール640は、図45の600、602、及び図47の620にあるように、タイルを生成し、タイルによりアートワークを変調することによって、又は、図46の610にあるように、光学コード信号タイルを生成することによって、実施される。FIG. 49 is a flow diagram illustrating a method of using a weighted Voronoi diagram to generate a pointillist pattern of artwork bearing an optical signal. The process begins by generating a data-bearing image signal. For example,
次に、本方法は、ベクトル量子化プロセスを開始して、モジュール640からの画像運搬信号出力を表すために点描の場所を決定する。この特定のプロセスは、シード点のセットから開始して重心ボロノイ図を生成することによってこれを行う。これらのシード点は、入力画像内の画素場所にランダムに位置付けられ得る。しかしながら、より良い性能のため、所望の出力により近いと思われる点を選択することが好ましい。本文書に説明されるスパースな信号の生成方法は、シード点を選択するための1つの手法を提供するが、それは、これらの方法が、所望のドット密度について光学コードの所望の堅牢性を提供する各タイル内の高優先度のコード信号構成要素の場所を選び出すことを目的としているためである。したがって、モジュール642の好ましい実装形態は、モジュール640からの入力画像の光学コード信号に対してスパースな信号の生成プロセスを実行する。他の手法は、シード点位置間の最小間隔距離によって制約される、点の等間隔アレイ、又は点の疑似ランダムに選択されたセットから開始することを含む。例えば、間隔は、ドット間の侵入禁止距離として以前に説明されるものなどの最小距離パラメータによって制約され得る。Next, the method begins a vector quantization process to determine the locations of stipples to represent the image-carrying signal output from
モジュール644は、642によって提供されるシード点の現在のセットからボロノイ図を計算する。上で述べたボロノイ図ソフトウェアは、モジュール644を実施するために使用され得る。
次に、モジュール646は、各ボロノイ領域の重心を計算する。このモジュールは、例えば、参照により本明細書に組み込まれる、A.Secord、“Weighted Voronoi Stippling”、Proc.2nd Ann.Symp.Non-Photorealistic Animation and Rendering(NPAR 2002)、ACM Press、2002、pp.27-43(“Secord”)においてSecordによって説明される重心を計算するための方法を使用して実施される。Secordでは、領域iの重心Ciは、以下のように定義される。
式中、Aは領域であり、xは位置であり、ρ(x)は密度関数である。Secordは、重心を計算する最適化された方法について説明する。重心についての上の式における積分は、恣意的なボロノイ領域上のものである。Secordの方法は、これらの積分を反復積分に変換し、領域を1行ずつ積分する。これにより、本方法が、積分の事前に計算された部分に依存することが可能なる。事前に計算された部分を除外した後の最終的な計算は、y方向における数値積分、及び領域境界のx値における式の計算を含む。これは、積分計算を、画像の密度関数、乗算、及び減算から事前に計算される値のルックアップテーブルへの探索に変換する。Secordはまた、解像度の影響を受けるボロノイ領域(ボロノイ領域内の画素が減少するにつれて重心位置の誤差は増大し、点の生成は、低解像度では重複し得る)の離散演算によって引き起こされる問題にどのように対処するかについて説明する。Secordは、Hoffが、Hoff III,K.、Culver,T.、Keyser,J.、Lin,M.、及びManocha,D.、1999、“Fast Computation of Generalized Voronoi Diagrams Using Graphics Hardware”、In Proceedings of SIGGRAPH 99、ACM Press/ACM SIGGRAPH、New York、A.Rockwood,Ed.、Computer Graphics Proceedings、Annual Conference Series、ACM、277-286において、解決策を提供していることを記している。, where A is the area, x is the location, and ρ(x) is the density function. Secord describes an optimized method for calculating the centroid. The integrals in the above formula for the centroid are over an arbitrary Voronoi region. Secord's method converts these integrals into iterative integrals, integrating the region row by row. This allows the method to rely on pre-computed parts of the integral. The final calculation after removing the pre-computed part involves a numerical integration in the y direction and the calculation of the formula at the x values of the region boundary. This converts the integral calculation into a lookup table of pre-computed values from the image's density function, multiplication, and subtraction. Secord also describes how to address the problems caused by the discrete operation of the Voronoi region, which is resolution sensitive (the error in the centroid location increases as the pixels in the Voronoi region decrease, and the generation of points may overlap at low resolution). Secord cites Hoff's work in Hoff III, K., Culver, T., and Hoff III, K., and Culver, T. , Keyser, J., Lin, M., and Manocha, D., 1999, "Fast Computation of Generalized Voronoi Diagrams Using Graphics Hardware", In Proceedings of SIGGRAPH 99, ACM Press/ACM SIGGRAPH, New York, A. Rockwood, Ed., Computer Graphics Proceedings, Annual Conference Series, ACM, pp. 277-286, provide a solution.
次に、モジュール648は、ボロノイ領域内の重心に対する各点の場所を更新する。モジュール642~648のルーチンは、点が重心に集束するまで、又は既定の限界に達するまで反復する(650)。この時点で、本方法は、プログラムを呼び出したプロセスに対する制御へ戻る(652)。反復のたびに、最後の反復からの点は、新規の反復のための開始シード点である。実施者は、限界又は集束のいずれか最初に発生する方に対して、反復の数を制限することを選択し得る。密度関数による重心計算の重み付けは、より低い密度領域よりも入力画像のより高い密度領域の近くに点を詰め込む傾向がある。光学コード信号の場合、これは、点が信号のピークの周りに集まるという有益な効果を有し、これは、信号の堅牢性に対してより高い優先度を有する。さらに、透かし画像が入力として提供される場合、本方法は、より少ない数の点描で画像のより正確な表現を作り出すため、画像のより高い視覚的品質を提供する。両方の場合において、本方法は、ベクトル量子化を提供して、入力画像のグレースケール値への適合を最適化する代表的な点描により各ボロノイ領域内の画像を表す。
その利益にもかかわらず、図49の方法は、信号担持アートを生成するデバイスの計算リソースが限られているいくつかの応用においては、好適ではない場合がある。デバイス内のタスクに割り当てられるCPU又はプロセッサの処理能力が限られているいくつかのタイプのラベルプリンタ又はパーソナルコンピュータワークステーションがこれに当てはまり得る。加えて、それは、固有の光学コード信号が、異なる光学コードでアイテムの固有インスタンスをマークするために、限られたレイテンシ(“リアルタイム”)を有する印刷又はマーキングエンジンに提供される必要があり得るシリアル化方法には好適ではない場合がある。そのような場合、リアルタイム制約は、各々のシリアル化されたインスタンスのマーキング間の時間内に、固有にマークされた画像を生成するために割り当てられる時間に関して規定される。ラベルプリンタでは、これは、各々の新規のラベルを印刷する間の時間である。市販のデジタル印刷機では、これは、パッケージデザインの新規のシリアル化されたインスタンスを生成することに割り当てられる時間である。事前に計算された固有インスタンスをバッファに入れ、それらをマーキングエンジンに供給することが可能であり、これによりレイテンシを低減する。しかしながら、この手法は、固有画像をマーキングエンジンメモリ内へ移動させるために、追加のメモリ、及びおそらくはメモリ帯域幅能力を必要とする。例えば、デジタル印刷機の場合、これは、固有画像をデジタルフロントエンドから印刷エンジンへ転送することを必然的に伴う。Despite its benefits, the method of FIG. 49 may not be suitable in some applications where the computational resources of the device generating the signal-bearing art are limited. This may be the case for some types of label printers or personal computer workstations where the CPU or processor capacity allocated to the task within the device is limited. In addition, it may not be suitable for serialization methods where unique optical code signals may need to be provided to a printing or marking engine with limited latency ("real-time") to mark unique instances of an item with different optical codes. In such cases, the real-time constraint is defined in terms of the time allocated to generate a uniquely marked image in the time between marking each serialized instance. In a label printer, this is the time between printing each new label. In a commercial digital press, this is the time allocated to generating a new serialized instance of a packaging design. It is possible to buffer pre-computed unique instances and feed them to the marking engine, thereby reducing latency. However, this approach requires additional memory, and possibly memory bandwidth capacity, to move the unique images into the marking engine memory. For example, in the case of a digital printing press, this entails transferring the native images from the digital front end to the print engine.
図50~図51は、光学コード信号を担持するアートワークを生成するための必要な計算を減少させる二部式の方法を例証する。図50のプロセスは、既定の数の量子化レベルへの明から暗のダイナミックレンジの量子化の各レベルを表す、異なるグレーレベルについての点描パターンを事前に計算する。図51のプロセスは、次いで、事前に計算された点描パターンを使用してアートワークを信号運搬アートに変換する。Figures 50-51 illustrate a two-part method that reduces the computation required to generate artwork that carries an optical code signal. The process of Figure 50 pre-calculates stipple patterns for different gray levels that represent each level of quantization of the light-to-dark dynamic range to a predefined number of quantization levels. The process of Figure 51 then converts the artwork into signal-carrying art using the pre-calculated stipple patterns.
図50は、異なるドット密度にある光学コード信号の点描パターンを生成する方法のフロー図である。モジュール660は、高密度光学コード信号タイルを、本文書内でそれらについて詳しく述べる様々な実施形態を含め、例えば、以前に説明される図3~5の技術のいずれかを使用して、生成する。Figure 50 is a flow diagram of a method for generating stipple patterns of optical code signals at different dot densities.
モジュール662は、既定の数のグレーレベルの各レベルにおいてタイルのグレーレベルバージョンを生成する。1つの手法は、各グレースケールレベルタイルのビットセルに対応する画素における輝度に対する正/負の調整を導くために、高密度光学コード信号を使用して、各レベルにおいてグレースケールレベル画像に対して調整を適用することである。
次に、モジュール664は、点描パターン法を実行して、各グレースケールレベルタイルを点描パターンに変換する。1つの手法は、図49の方法を使用することである。図49の方法は、次いで、それを呼び出したプロセスに対する処理制御へ戻る(666)。この時点で、点描パターンは、高速探索のために、計算及び記憶されている。これらのパターンは各々が、それらのそれぞれのグレースケールレベルでタイルの光学コード信号を担持する。
別の方法は、段階的なグレースケール層に対してよりシームレスな重み付けされたボロノイ点描を実施することを求める。まず、この方法は、最も高いグレースケールレベルで点描パターンを計算する。次いで、それは、以下のように、次に低いグレースケールレベルで点描パターンを生成する:ボロノイセル及び各セルの重心を計算し、次いで、より高い層内の最も近い近隣点描によって規定される領域に対応するセルの重心を計算する。これは、ボロノイセルではない。目的は、シームレスな移行を達成するために、より高い層内の点描のギャップに点描を置くことである。次いで、現在の層内の各点描を、現在の層内の重心ベクトルにはより高い重み付けを伴って、現在のボロノイセルの重心及びより高い層内の最も近い近隣セルの重心の重み付けされたベクトル合成へと移動させる。これは、滑らかに変化するグレースケール領域内での点描ドットのよりシームレスな移行をもたらし得る。しかしながら、グレースケール値がレベル間で不連続に急増するときは、縁における点描アーチファクトの可能性がある。Another method seeks to implement a more seamless weighted Voronoi stipple for graduated grayscale layers. First, the method calculates a stipple pattern at the highest grayscale level. It then generates a stipple pattern at the next lower grayscale level as follows: calculate the Voronoi cells and the centroids of each cell, then calculate the centroid of the cell that corresponds to the area defined by the nearest neighbor stipples in the higher layer, which is not a Voronoi cell. The goal is to place stipples in the gaps of stipples in the higher layer to achieve a seamless transition. Then, move each stipple in the current layer to a weighted vector composition of the centroid of the current Voronoi cell and the centroid of the nearest neighbor cell in the higher layer, with a higher weighting for the centroid vector in the current layer. This can result in a more seamless transition of stipple dots in smoothly changing grayscale regions. However, there is a possibility of stipple artifacts at the edges when the grayscale values jump discontinuously between levels.
図51は、アートワーク内の光学コード信号タイルを符号化するために以前に生成された点描パターンを適用するフロー図である。アートワークは、パッケージデザインの色チャネル内で画像又は図形要素として表される。モジュール670は、アートワークを、X及びY方向に継続的に配置されアートワークの形状に適合するようにトリミングされた、タイルの領域に対応する領域に区分する。これは、信号担持タイルをアートワーク内の場所に効果的にマッピングする。マッピングされたタイルの各セルは、アートワーク内の画素の領域に対応する。Figure 51 is a flow diagram of applying a previously generated stipple pattern to encode optical code signal tiles in artwork. The artwork is represented as images or graphic elements within the color channels of a package design.
次に、モジュール672は、マッピングされたタイルの各々のセルをステップスルーし、アートワーク内の対応する画素領域におけるグレースケールレベルを取得する。それは次いで、アートワークにマッピングされたタイルのセル位置に対応する点描パターン内のセル位置において、そのグレースケールレベルについて、事前に計算された点描パターンの対応する点描パターンを探索する。モジュール674において、本方法は、このセル位置におけるアートワークを点描パターンに置き換える。モジュール672~674は、点描パターンがアートワーク内のセルのすべてについて完了するまでこのプロセスを繰り返す。本方法は、次いで、それを呼び出したプロセスに対する処理制御へ戻る(676)。
本発明者らは、ボロノイ法、ドロネー法、及び点描法の代替の実施形態を開発した。これらのボロノイ、ドロネー、及び点描の実施形態では、本方法は、まず、点ハーフトーンを生成し(様々な方法のいずれかによって、例えば、Secord法、スパースなマーク生成など)、次いで、それらの点に基づいて、ボロノイ、ドロネー、又は点描パターンを作成する。例えば、ボロノイ領域が、これらの点の周りに形成されるか、ドロネー多角形が、これらの点を交差するように描かれるか、又は、点描が、これらの点に置かれる。点ハーフトーンは、光学コード信号タイル(例えば、結合されたペイロード及び参照信号のグレースケール画像)、又は、光学コード信号をタイル化し、次いで、光学コード信号をホスト画像内に埋め込むために、タイル化された光学コード信号に従ってホスト画像の画素値を修正することによって埋め込まれている画像から生成され得る。計算効率は、本文書に説明されるスパースな点の構成を生成するより計算的に高効率の方法の中から選択することによって改善され得る。例えば、1つの手法は、光学コードを表す画像又は光学コードを埋め込まれた画像のグレースケール値をソートし、次いで、特定の密度又は審美的効果が達成されるまで、ソート順に、所望の間隔を有する点を選択することである。この選択は、ボロノイ、ドロネー、又は点描パターンを作成するために使用される点のスパースな構成を作成する。The inventors have developed alternative embodiments of the Voronoi, Delaunay, and pointillism methods. In these Voronoi, Delaunay, and pointillism embodiments, the method first generates point halftones (by any of a variety of methods, e.g., Secord, sparse mark generation, etc.) and then creates a Voronoi, Delaunay, or pointillism pattern based on those points. For example, Voronoi regions are formed around those points, Delaunay polygons are drawn to intersect those points, or pointillism is placed on those points. The point halftones can be generated from optical code signal tiles (e.g., grayscale images of the combined payload and reference signals) or images that are embedded by tiling the optical code signal and then modifying the pixel values of the host image according to the tiled optical code signal to embed the optical code signal within the host image. Computational efficiency can be improved by selecting from among the more computationally efficient methods of generating sparse point configurations described in this document. For example, one approach is to sort the grayscale values of an image representing an optical code or an image with an embedded optical code, and then select points in the sorted order with the desired spacing until a particular density or aesthetic effect is achieved. This selection creates a sparse arrangement of points that is used to create a Voronoi, Delaunay, or pointillist pattern.
図53は、ボロノイパターンで形成される光学コードを担持する画像の例を示す。ここでは、ロゴのグレースケール画像(“d”デザイン)は、光学コード信号を含むように修正され、次いでスパースな点のハーフトーンに変換され、最後に、スパースな点に基づいてボロノイパターンへと変換される。ボロノイパターンの特徴は、所望の審美的効果を作り出すために、画像にわたって様々である(例えば、暗に対する明、及び明に対する暗、変化する線密度又は幅)ということに留意されたい。図54及び図55は、グレースケールレベルが線密度(図54)及び線幅(図55)を変化させることによって作成されるボロノイ領域のハーフトーンパターンを示す。Figure 53 shows an example of an image bearing an optical code formed with a Voronoi pattern. Here, a grayscale image of a logo (a "d" design) is modified to include the optical code signal, then converted to a sparse dot halftone, and finally converted to a Voronoi pattern based on the sparse dots. Note that the characteristics of the Voronoi pattern are varied across the image (e.g., light to dark and dark to light, varying line density or width) to create the desired aesthetic effect. Figures 54 and 55 show halftone patterns of Voronoi regions where grayscale levels are created by varying line density (Figure 54) and line width (Figure 55).
特定の実装形態を参照して本技術の原則を説明及び例証してきたが、本技術は、多くの他の異なる形態で実施され得るということを認識されたい。Although the principles of the present technology have been described and illustrated with reference to specific implementations, it should be recognized that the present technology can be embodied in many other different forms.
別途示されない限り、用語“スパース”は、本明細書で使用される場合、所望の空間密度制約を満足する離間した要素を有する信号パターンを指す。パターンは、典型的には、2値であり、例えば、パターンの画像は、マーキングあり又はなしに対応する“オン”又は“オフ”値のいずれかを有する。光学コードが空白領域に適用されるいくつかの実施形態において、それは、基材のうちの50%以下が、対比的なマーク(例えば、白色基材上のインク、又は対比的なインクで囲まれる明るい空所)をもたらすようにマークされる2色コードであるように構成される。そのような応用については、より典型的には、マークは、30%未満のそのようにマークされた基材を有し、光学コードが、人間にはあまり知覚できないこと、及びテキストとの干渉を回避することを目的としている場合には、2~15%の印刷密度が最も一般的である。光学コード信号の実施形態は、マーキング要素のそのような低密度にある必要はない。マーキング要素は、シグナルリッチアートデザイン内で光学コードを伝達するように所望の輝度又は強度変動を提供するために、変化する密度、サイズ、及び形状を伴って、タイル内に配置され得る。Unless otherwise indicated, the term "sparse" as used herein refers to a signal pattern having spaced elements that satisfy a desired spatial density constraint. The pattern is typically binary, e.g., an image of the pattern has either "on" or "off" values corresponding to the presence or absence of marking. In some embodiments where the optical code is applied to a blank area, it is configured to be a two-color code in which 50% or less of the substrate is marked to provide a contrasting mark (e.g., ink on a white substrate, or a light void surrounded by a contrasting ink). More typically for such applications, the marking has less than 30% of the substrate so marked, with a print density of 2-15% being most common where the optical code is intended to be poorly perceptible to humans and to avoid interference with text. Optical code signal embodiments need not have such a low density of marking elements. The marking elements may be arranged in tiles with varying density, size, and shape to provide the desired brightness or intensity variation to convey the optical code within a signal rich art design.
本明細書は、参照信号構成要素を、異なる空間周波数の正弦波からなると説明するが、参照信号は、代替的又は追加的に、直交パターンを含み得る。これらもまた、異なる外観のパターンを獲得するために、振幅が変化し得る。Although this specification describes the reference signal components as consisting of sine waves of different spatial frequencies, the reference signal may alternatively or additionally include orthogonal patterns. These may also be varied in amplitude to obtain different looking patterns.
詳述した技術のうちのいくつかは、白色背景に黒色ドット(又はその逆)を印刷することによってコードを形成する文脈において説明されているが、コードは別の方式で形成され得るということを認識されたい。例えば、透明ニス又は他の表面処理が、表面の反射性を、例えば、艶ありと艶消しとの間で、局所的に変化させるために施され得る。同様に、コードは、局所的に隆起した又は凹んだ特徴部などによって、3D形式で形成され得る。3D信号は、タイル内又はタイルによって変調されるアートワーク内の空間的X、Y位置のための強度値によって形成され、タイル又はアートワーク内のセル位置における強度値は、凹部の深さ及び高さ、並びに3D信号の局所的に隆起した表面に対応する。この3D信号は、次いで、エンボス加工、彫刻、又はエッチングによって基材内へ形成される。エンボス加工は、3D信号(又はその反転)から形成される表面を有するプレートを基材に押圧することによって実行される。又は、エンボス加工は、3D信号(又はその反転)でマーキングされている型を介して3D信号を適用することによって実行される。レーザ彫刻又は3D印刷は、基材、エンボス加工プレート、又は型上に3D信号を作製するために用いられ得るさらなる技術のうちの一部である。レーザアブレーションは、例えば、識別子、収穫日、消費期限、及び/又は生産国などを伝達するために果物及び野菜の皮にデータマーキングを生成するのに良く適している。(スパースなマークは、本明細書で詳述される場合、細長い要素に起因して皮を破る可能性が高い直線状の1Dバーコードよりも果物/野菜に引き起こす損傷が少ない。)Although some of the techniques detailed have been described in the context of forming a code by printing black dots on a white background (or vice versa), it should be recognized that the code can be formed in other ways. For example, a clear varnish or other surface treatment can be applied to locally vary the reflectivity of the surface, for example between glossy and matte. Similarly, the code can be formed in a 3D format, such as by locally raised or recessed features. A 3D signal is formed by intensity values for spatial X,Y positions within the tile or within the artwork modulated by the tile, and the intensity values at the cell positions within the tile or artwork correspond to the depth and height of the recesses and the locally raised surfaces of the 3D signal. This 3D signal is then formed into the substrate by embossing, engraving, or etching. The embossing is performed by pressing a plate having a surface formed from the 3D signal (or its inverse) against the substrate. Alternatively, the embossing is performed by applying the 3D signal through a mold that has been marked with the 3D signal (or its inverse). Laser engraving or 3D printing are some of the additional techniques that can be used to create 3D signals on substrates, embossing plates, or molds. Laser ablation is well suited to producing data markings on the skins of fruits and vegetables to convey, for example, identifiers, harvest dates, expiration dates, and/or country of origin. (Sparse marks, as detailed herein, cause less damage to fruits/vegetables than linear 1D barcodes, which are more likely to break the skin due to their elongated elements.)
本明細書は、白色基材上の黒色ドット又は線によって形成される光学コード要素に焦点を合わせているが、色付きマークが、白色背景上に、又は対比色(より明るい又はより暗い)の背景上に、使用され得るということを認識されたい。同様に、明るいマークが、黒色又は色付き背景上に形成され得る。いくつかの実施形態において、スパースなマーキングの色は、ラベルなど、1つのホストアートワークにわたって変化し得る。例えば、ドットは、1つの領域ではシアン、第2の領域では黒、及び第3の領域ではパントン9520 Cであってもよい。While this specification focuses on optical code elements formed by black dots or lines on a white substrate, it should be recognized that colored marks can be used on a white background or on a contrasting (lighter or darker) background. Similarly, light marks can be formed on a black or colored background. In some embodiments, the color of sparse markings can vary across a host artwork, such as a label. For example, dots can be cyan in one area, black in a second area, and Pantone 9520 C in a third area.
明るいドットが暗い背景上に形成される構成において、「明るい」画素は、本明細書内のアルゴリズム的記述において「暗い」要素に取って代わらなければならない(及び高い信号値が低い信号値に取って代わる)。In configurations where bright dots are formed on a dark background, "bright" pixels must replace "dark" elements in the algorithmic descriptions herein (and high signal values replace low signal values).
本明細書は、高密度コードからスパースなコードを生成するため、及び高密度コードを必要とすることなくスパースなコードを生成するための多くの構成について詳述してきた。ペイロード及び参照信号を含む複合コードは、最も一般的に使用されるが、構成は、ペイロード又は参照信号だけからなる光学コードに様々に適用され得る。さらには、他の場所で述べられるように、ペイロードデータは、参照信号によって(例えば、いくつかの空間周波数成分の存在又は不在によって)伝達され得る。同様に、参照情報は、ペイロード信号によって伝達され得る(例えば、ペイロードデータ内の固定ビットを使用し、以て、検出器が復号のためにペイロード信号を位置特定することができる既知の信号特徴を有する暗黙的な同期信号を形成することによって)。This specification has detailed a number of configurations for generating sparse codes from dense codes, and for generating sparse codes without the need for dense codes. Composite codes including payload and reference signals are most commonly used, but the configurations can be variously applied to optical codes consisting of only payload or reference signals. Furthermore, as described elsewhere, payload data can be conveyed by the reference signal (e.g., by the presence or absence of certain spatial frequency components). Similarly, reference information can be conveyed by the payload signal (e.g., by using fixed bits in the payload data to form an implicit synchronization signal with known signal characteristics that allow a detector to locate the payload signal for decoding).
1つの構成は、高密度コード内の極端な低値(即ち、暗い)の場所を識別するために、高密度コードにしきい値処理演算を適用することによってスパースコードを作成する。これらの場所は、次いで、スパースブロック内でマークされる。しきい値レベルは、結果として生じるスパースなマークの印刷密度を確立する。One configuration creates a sparse code by applying a thresholding operation to the dense code to identify locations of extremely low values (i.e., dark) within the dense code. These locations are then marked in sparse blocks. The threshold level establishes the printing density of the resulting sparse marks.
別の構成は、参照信号の最も暗い要素を識別し、これらをペイロード信号の暗い要素と論理AND演算子によって結び、以て、マークが形成されるべきスパースな信号ブロック内の場所を識別する。しきい値は、どの参照信号要素が検討に値するほど暗いかを確立することができ、この値は、所望の印刷密度を達成するために変化し得る。Another configuration identifies the darkest elements of the reference signal and combines them with the dark elements of the payload signal by a logical AND operator to identify locations within the sparse signal block where marks should be formed. A threshold can establish which reference signal elements are dark enough to be considered, and this value can be varied to achieve the desired print density.
さらに別の構成は、相対的により高い解像度で生成される参照信号、及び相対的により低い解像度で生成されるペイロード信号を用いる。後者の信号は、2つの値のみを有し(即ち、それは2色である)、前者の信号は、より多くの値を有する(即ち、それは、2値グレースケールなどの多階層であるか、又は浮動小数点値からなる)。ペイロード信号は、参照信号の高い方の解像度へ補間され、その過程で2色形式から多階層へ変換される。2つの信号は、高い方の解像度で結合され、しきい値処理演算が結果に適用されて、極(例えば、暗い)値の場所を識別する。ここでも、これらの場所は、スパースブロック内でマークされる。しきい値レベルは、ここでも、結果として生じるスパースなマークの印刷密度を確立する。Yet another configuration uses a reference signal generated at a relatively higher resolution and a payload signal generated at a relatively lower resolution. The latter signal has only two values (i.e., it is two colors) and the former signal has more values (i.e., it is multi-level, such as binary grayscale, or consists of floating-point values). The payload signal is interpolated to the higher resolution of the reference signal, converting it from a two-color format to multi-level in the process. The two signals are combined at the higher resolution and a thresholding operation is applied to the result to identify locations of extreme (e.g., dark) values. Again, these locations are marked within the sparse block. The threshold level again establishes the print density of the resulting sparse marks.
さらに別の構成は、ここでも、相対的により高い解像度で生成される参照信号、及び相対的により低い解像度で生成される2色ペイロード信号を用いる。マッピングは、ペイロード信号の各要素が参照信号の4つ以上の空間的に対応する要素と関連付けられるように、2つの信号の間に確立される。暗いペイロード信号の各要素の場合、参照信号内の4つ以上の空間的に対応する要素のうちの最も暗いものの場所が識別される。マークは、スパースなブロック内の対応する場所に付けられる。Yet another configuration uses a reference signal, again generated at a relatively higher resolution, and a two-color payload signal, generated at a relatively lower resolution. A mapping is established between the two signals such that each element of the payload signal is associated with four or more spatially corresponding elements of the reference signal. For each element of the dark payload signal, the location of the darkest of the four or more spatially corresponding elements in the reference signal is identified. A mark is placed at the corresponding location in the sparse block.
さらなる構成は、高密度多階層参照信号ブロックに基づく。この信号の要素は、値によってソートされて、各々が場所を有する最も暗い要素を識別する。これらの最も暗い要素はペアリングされる。1つの要素は、ペイロードのビットに従って各ペアリングから選択される。選択された暗い要素の場所に対応する、スパースブロック内の場所は、スパースな信号を形成するためにマークされる。A further configuration is based on a dense multi-layer reference signal block. The elements of this signal are sorted by value to identify the darkest elements, each with a location. These darkest elements are paired. One element is selected from each pairing according to the payload bits. The locations in the sparse block that correspond to the locations of the selected dark elements are marked to form a sparse signal.
複合コードに作用する構成は、特定の可視性又は堅牢性目標を達成するように、1:1とは異なる比率で参照信号及びペイロード信号を重み付けすることをさらに含み得る。The configuration affecting the composite code may further include weighting the reference signal and the payload signal in a ratio other than 1:1 to achieve a particular visibility or robustness goal.
これらの構成の各々は、マークの凝集を防ぐために、光学コードタイル内の候補マークに間隔制約を適用する動作をさらに含み得る。間隔制約は、円形、楕円形、又は他の(例えば、不規則な)形状である侵入禁止ゾーンの形態をとり得る。侵入禁止ゾーンは、2つ以上、又は2つ以下の対称軸を有し得る(又は有さない)。間隔制約の実施は、光学コードタイル内の各場所について1つの要素を有する関連付けられたデータ構造を用いることができる。暗いマークがタイルに追加されると、対応するデータが、間隔制約に起因して潜在的なマーキングのためにもはや利用可能でない場所を識別するデータ構造で記憶される。Each of these configurations may further include the operation of applying a spacing constraint to candidate marks within the optical code tile to prevent clumping of marks. The spacing constraint may take the form of a keep-out zone that is circular, elliptical, or other (e.g., irregular) shape. The keep-out zone may (or may not) have more than one or less than two axes of symmetry. Enforcement of the spacing constraint may use an associated data structure having one element for each location within the optical code tile. As dark marks are added to the tile, corresponding data is stored in the data structure that identifies locations that are no longer available for potential marking due to the spacing constraint.
六角格子は、2次元領域内の点の最適な詰め込みをもたらす。本発明者らは、点の間の円形侵入禁止領域を使用することが、最も近い近隣部を等距離に保ちながら効果的な詰め込みをもたらすということを見出した。これは、マーキング要素の視覚的に満足のいく構成をもたらす。A hexagonal grid provides optimal packing of points in a two-dimensional area. The inventors have found that using circular keep-out areas between points provides effective packing while keeping nearest neighbors equidistant. This results in a visually pleasing arrangement of marking elements.
シグナルリッチアート要素の局所的なグレースケール制御は、図形要素のサイズ並びに図形要素間の間隔を変化させることによって制御され得る。ドットの場合、これは、ドットサイズ及びドット間の間隔が、所望のグレースケール制御を達成するために増大又は減少され得ることを意味する。ドットは、暗に対する明、又は明に対する暗であってもよい。ドットは、円形、正方形、又は他の形状を有し得る。図29は、50%グレースケールで反転する、黒色の上の白色ドット(グレースケール範囲の暗い半分)及び白色の上の黒色ドット(グレースケール範囲の明るい半分)の組み合わせを使用することによって達成される、グレースケール値の範囲を例証する。代替的に、白色ドットの半径が、ゼロから、画像内のセルを充填する最大値へと徐々に増大されて、徐々に明るくなるセル内のグレースケールレベルを得る。又は、黒色ドットの半径が、徐々に明るくなるセル内のグレースケールレベルへと徐々に減少され得る。Local grayscale control of signal rich art elements can be controlled by varying the size of the graphic elements as well as the spacing between the graphic elements. In the case of dots, this means that the dot size and spacing between dots can be increased or decreased to achieve the desired grayscale control. The dots can be light to dark or dark to light. The dots can be circular, square, or have other shapes. Figure 29 illustrates the range of grayscale values achieved by using a combination of white dots on black (the dark half of the grayscale range) and black dots on white (the light half of the grayscale range) that invert at 50% grayscale. Alternatively, the radius of the white dots can be gradually increased from zero to a maximum value that fills a cell in the image to obtain grayscale levels in the cells that are gradually lighter. Or the radius of the black dots can be gradually decreased to grayscale levels in the cells that are gradually lighter.
線ベースのシグナルリッチアート実施形態の場合、マーキング要素サイズ及び形状を変化させる同様の効果が当てはまる。明るい背景上の暗い線が、徐々に太くされるか、又は細くされて、より暗い又はより明るいグレースケールレベルを得る。同様に、暗い線の間隔が、徐々に減少又は増大されて、より暗い又はより明るいグレースケールレベルを得る。ボロノイ領域の場合、例えば、暗い線から形成される領域は、より近くに詰め込まれ、及び/又は線が太くされて、より暗いグレースケールレベルを得る。For line-based signal rich art embodiments, similar effects of varying marking element size and shape apply. Dark lines on a light background are gradually thickened or thinned to obtain darker or lighter grayscale levels. Similarly, the spacing of the dark lines is gradually decreased or increased to obtain darker or lighter grayscale levels. For Voronoi regions, for example, areas formed from dark lines are packed closer together and/or the lines are thickened to obtain darker grayscale levels.
シグナルリッチアート法の計算効率は、光学コード信号、又は光学コード信号を埋め込まれた画像(入力画像)を生成し、入力画像のグレースケール値をソートし、次いで、シグナルリッチアート要素のハーフトーンパターンを、入力画像のグレースケール値に対応する出力画像内の場所に置くことによって改善され得る。別個の処理ステップにおいて、要素のハーフトーンパターンは、図29に示されるものに類似したいくつかの離散グレースケールレベルの各々において作成される。これらのハーフトーンパターンは、グレースケール値によりインデックスされるルックアップテーブルに記憶される。出力画像内にシグナルリッチアートを作成するため、本方法は、入力画像のグレースケール値の順にシグナルリッチアート要素を置いて、所望の空間密度及び要素間の最小間隔を有する出力画像を獲得する。ソート順に訪れた各場所において、本方法は、その場所における入力画像のグレースケール値に対応するように、事前に計算されたハーフトーンパターンからシグナルリッチアート要素を選択する。このプロセスは、入力画像を、光学コード信号が強力に表されるシグナルリッチアートに変換する。The computational efficiency of the signal rich art method can be improved by generating an optical code signal, or an image with an embedded optical code signal (the input image), sorting the grayscale values of the input image, and then placing halftone patterns of signal rich art elements at locations in the output image that correspond to the grayscale values of the input image. In a separate processing step, halftone patterns of elements are created at each of several discrete grayscale levels similar to that shown in FIG. 29. These halftone patterns are stored in a lookup table indexed by the grayscale values. To create the signal rich art in the output image, the method places the signal rich art elements in the order of the grayscale values of the input image to obtain an output image with the desired spatial density and minimum spacing between elements. At each location visited in the sorted order, the method selects a signal rich art element from the pre-computed halftone patterns to correspond to the grayscale value of the input image at that location. This process converts the input image into signal rich art in which the optical code signal is strongly represented.
この方法は、異なる形状及び線画からなるドットパターンを含む、他のタイプの基本図形から作成されるハーフトーンパターンに有効である。異なるドット形状及びサイズの例については、図56~図59を参照されたい。図56~図57は、変化するグレースケールレベルを形成する変化するサイズ(並びにドットの明るいバージョン及び暗いバージョン)の正方形ドットを示す。図58~図59は、同様の効果を円形ドットにより示す。図60~図61は、異なるグレースケールレベルでハーフトーンパターンを形成する円の間の距離の変化を伴った暗い円及び明るい円を示す。This method works for halftone patterns created from other types of primitives, including dot patterns of different shapes and line art. See Figs. 56-59 for examples of different dot shapes and sizes. Figs. 56-57 show square dots of varying sizes (as well as light and dark versions of the dots) that create varying grayscale levels. Figs. 58-59 show a similar effect with circular dots. Figs. 60-61 show dark and light circles with varying distances between the circles that create halftone patterns at different grayscale levels.
光学コードのマーキング領域内のグレースケールレベルを変化させるこれらの方法は、光学コードの堅牢性を維持しながらアートワークの所望の視覚的美観を作り出すために様々な組み合わせで使用され得る。These methods of varying the grayscale levels within the marking area of the optical code can be used in various combinations to create the desired visual aesthetic of the artwork while maintaining the robustness of the optical code.
これらの構成の各々において、参照信号は、空間周波数ピークの相対振幅を、それらがすべて等しい振幅でないように変化させることによって、非ランダムな外観を有するように調整され得る。参照信号外観のそのような変化は、スパースな信号外観に対して結果的に影響を有する。In each of these configurations, the reference signal can be adjusted to have a non-random appearance by varying the relative amplitudes of the spatial frequency peaks so that they are not all of equal amplitude. Such variations in the reference signal appearance have a consequential effect on the sparse signal appearance.
これらの構成はまた、非線形フィルタを多階層コード(例えば、元の高密度コード)に適用して、スパースブロック内に最も効果的にマークを形成することにより、印刷されないスパースな要素によって表される情報を表現する場所を識別する動作を含み得る。次いで、これらの場所は、スパースブロック内にマークを付けるための場所を選択することにおいて優先される。These configurations may also include applying a nonlinear filter to a multi-hierarchical code (e.g., the original dense code) to identify locations that most effectively form marks within the sparse blocks to represent the information represented by the non-printed sparse elements. These locations are then prioritized in selecting locations for marking within the sparse blocks.
高密度コードからスパースコードを形成するための手段は、詳述したアルゴリズムのいずれかを実施するように構成される、本明細書に(即ち、動作環境と表題の付いた議論において)詳述されるハードウェア構成のいずれかを用いることができる。The means for forming a sparse code from a dense code may use any of the hardware configurations detailed herein (i.e., in the discussion entitled Operating Environment) configured to implement any of the detailed algorithms.
本明細書は、いくつかの異なる実施形態について論じた。1つの実施形態と関連して詳述される方法、要素、及び概念は、他の実施形態と関連して詳述される方法、要素、及び概念と組み合わされ得る。一部のそのような構成が、具対的に説明されているが、一部は、並べ替え及び組み合わせの数に起因して、説明されていない。出願者は、本明細書の方法、要素、及び概念が、それらの中から、及びそれらの間に限らず、引用された先行技術から知られているものとも、組み合わされ得る、代用され得る、及び交換され得るということを同様に認識し、意図する。さらには、詳述した技術は、現在及び将来の他の技術と一緒に、有利な効果に含まれ得るということを認識されたい。そのような組み合わせの実装形態は、本開示に提供される教示から、当業者にとっては簡単である。This specification has discussed several different embodiments. Methods, elements, and concepts detailed in connection with one embodiment may be combined with methods, elements, and concepts detailed in connection with other embodiments. Some such configurations have been specifically described, while some have not been described due to the number of permutations and combinations. Applicant also recognizes and intends that the methods, elements, and concepts herein may be combined, substituted, and interchanged, not only among and among themselves, but also with those known from the cited prior art. Furthermore, it should be recognized that the detailed techniques may be included to advantageous effect with other current and future techniques. Implementing such combinations will be straightforward for one of ordinary skill in the art from the teachings provided in this disclosure.
本開示は、動作の特定の順序及び要素の特定の組み合わせについて詳述しているが、他の企図される方法は、動作を並べ変えてもよく(おそらくはいくつかを省略し、他を追加する)、他の企図される組み合わせは、いくつかの要素を省略し、他を追加してもよいなど、ということを理解されたい。一例を挙げると、1:1以外の重み付け構成でペイロード及び参照信号を結合すると説明される実施形態において、1:1の重み付けが代替的に使用され得る。Although this disclosure details a particular order of operations and a particular combination of elements, it should be understood that other contemplated methods may rearrange the operations (perhaps omitting some and adding others), other contemplated combinations may omit some elements and add others, etc. As one example, in embodiments described as combining payload and reference signals in a weighting configuration other than 1:1, 1:1 weighting may alternatively be used.
完全なシステムとして開示されるが、詳述した構成の部分組み合わせもまた、別個に企図される(例えば、完全なシステムの様々な特徴を省略する)。Although disclosed as complete systems, subcombinations of the detailed configurations are also separately contemplated (e.g., omitting various features of the complete system).
包括的な開示を提供するため、米国特許法の簡潔性の要求に応じると同時に、出願者は、本明細書内で参照される文書の各々を参照により組み込む。(そのような資料は、たとえそれらの教示の特定のものに関連して上で引用されるとしても、それらの全体が組み込まれる。)これらの参考文献は、出願者が、本明細書内で詳述される構成に組み込まれることを意図する、また現在詳述される技術及び教示が組み込まれる、技術及び教示を開示する。In order to provide a comprehensive disclosure, while complying with the requirements of conciseness under U.S. patent law, applicants incorporate by reference each of the documents referenced herein. (Such materials are incorporated in their entirety even if cited above with reference to certain of those teachings.) These references disclose techniques and teachings which applicants intend to incorporate in the configurations detailed herein and which incorporate the techniques and teachings currently detailed.
上で論じられる原則及び特徴が適用され得る様々な実施形態の観点から、詳述した実施形態は、単に例証にすぎず、本発明の範囲を制限すると取られるべきではないことは明らかである。むしろ、出願者は、すべてのそのような修正が、以下の特許請求の範囲及びそれらの等価物の趣旨及び範囲内に入り得るものとして本発明を特許請求する。In view of the various embodiments to which the principles and features discussed above may be applied, it is apparent that the detailed embodiments are merely illustrative and should not be taken as limiting the scope of the invention. Rather, applicant claims the invention as including all such modifications as may come within the spirit and scope of the following claims and their equivalents.
Claims (15)
Translated fromJapanese可変ペイロードを含む光学コード信号構成要素を生成するステップと、
2次元光学コードのタイルを構築するステップであって、前記タイルが、ある空間密度で前記タイル内の座標に位置する光学コード要素を含む、ステップと、
前記座標に基づいて線画を描くステップであって、前記 が、前記可変ペイロードを伝達する、ステップと、
複数のタイルを含む前記線画を出力画像に挿入するステップであって、前記光学コードが、前記出力画像の光学スキャンからマシン可読である、ステップと、を含み、
構築する前記ステップが、
前記可変ペイロードを第1の光学コード信号へ変換する(transform)処理であって、前記第1の光学コード信号が、幾何学的同期のための参照信号を含む画素値の2次元アレイを含み、前記タイルは、コード要素の優先度に従って前記タイル内の画素の場所を充填することを含む空間制約に従って構築される工程を有する前記変換する処理を含む、
方法。 1. A method for generating a machine readable optical code, comprising:
generating an optical code signal component having a variable payload;
constructing tiles of a two-dimensional optical code, the tiles including optical code elements located at coordinates within the tiles with a spatial density;
drawing a line based on the coordinates, the line drawing carrying the variable payload;
inserting the line drawing, which includes a plurality of tiles, into an output image, wherein the optical code is machine readable from an optical scan of the output image;
said constructing step further comprising:
a process of transforming the variable payload into a first optical code signal, the first optical code signal including a two-dimensional array of pixel values including a reference signalfor geometric synchronization, the tiles being constructed according to a spatial constraint including filling pixel locations within the tiles according to code element priorities;
Method.
可変ペイロードを含む光学コード信号構成要素を生成するステップと、
2次元光学コードのタイルを構築するステップであって、前記タイルが、ある空間密度で前記タイル内の座標に位置する光学コード要素を含む、ステップと、
前記座標に基づいて線画を描くステップであって、前記線画が、前記可変ペイロードを伝達する、ステップと、
複数のタイルを含む前記線画を出力画像に挿入するステップであって、前記光学コードが、前記出力画像の光学スキャンからマシン可読である、ステップと、を含み、
線画を描く前記ステップが、前記2次元光学コードの輝度最小値で交差する線分を描くことを含む、
方法。 1. A method for generating a machine readable optical code, comprising:
generating an optical code signal component having a variable payload;
constructing tiles of a two-dimensional optical code, the tiles including optical code elements located at coordinates within the tiles with a spatial density;
drawing a line drawing based on the coordinates, the line drawing carrying the variable payload;
inserting the line drawing, which includes a plurality of tiles, into an output image, wherein the optical code is machine readable from an optical scan of the output image;
the step of drawing lines includes drawing line segments that intersect at brightness minima of the two-dimensional optical code.
Method.
可変ペイロードを含む光学コード信号構成要素を生成するステップと、
2次元光学コードのタイルを構築するステップであって、前記タイルが、ある空間密度で前記タイル内の座標に位置する光学コード要素を含む、ステップと、
前記座標に基づいて線画を描くステップであって、前記線画が、前記可変ペイロードを伝達する、ステップと、
複数のタイルを含む前記線画を出力画像に挿入するステップであって、前記光学コードが、前記出力画像の光学スキャンからマシン可読である、ステップと、を含み、
前記線画は、複数の凸多角形を定義する線分を含み、前記凸多角形の各々は前記2次元光学コードの輝度最大値を含むボロノイ領域を形成する、
方法。 1. A method for generating a machine readable optical code, comprising:
generating an optical code signal component having a variable payload;
constructing tiles of a two-dimensional optical code, the tiles including optical code elements located at coordinates within the tiles with a spatial density;
drawing a line drawing based on the coordinates, the line drawing carrying the variable payload;
inserting the line drawing, which includes a plurality of tiles, into an output image, wherein the optical code is machine readable from an optical scan of the output image;
the line drawing includes line segments defining a plurality of convex polygons, each of the convex polygons forming a Voronoi region containing intensity maxima of the two-dimensional optical code.
Method.
可変ペイロードを含む光学コード信号構成要素を生成するステップと、
2次元光学コードのタイルを構築するステップであって、前記タイルが、ある空間密度で前記タイル内の座標に位置する光学コード要素を含む、ステップと、
前記座標に基づいて線画を描くステップであって、前記線画が、前記可変ペイロードを伝達する、ステップと、
複数のタイルを含む前記線画を出力画像に挿入するステップであって、前記光学コードが、前記出力画像の光学スキャンからマシン可読である、ステップと、を含み、
前記線画が、前記2次元光学コードの輝度最大値の空間座標を中心とする線画図形要素を含む、
方法。 1. A method for generating a machine readable optical code, comprising:
generating an optical code signal component having a variable payload;
constructing tiles of a two-dimensional optical code, the tiles including optical code elements located at coordinates within the tiles with a spatial density;
drawing a line drawing based on the coordinates, the line drawing carrying the variable payload;
inserting the line drawing, which includes a plurality of tiles, into an output image, wherein the optical code is machine readable from an optical scan of the output image;
the line drawing includes a line drawing element centered on the spatial coordinate of a luminance maximum of the two-dimensional optical code;
Method.
Applications Claiming Priority (3)
| Application Number | Priority Date | Filing Date | Title |
|---|---|---|---|
| US201862682731P | 2018-06-08 | 2018-06-08 | |
| US62/682,731 | 2018-06-08 | ||
| PCT/US2019/036126WO2019237045A1 (en) | 2018-06-08 | 2019-06-07 | Generating signal bearing art using stipple, voronoi and delaunay methods and reading same |
Publications (3)
| Publication Number | Publication Date |
|---|---|
| JP2021527347A JP2021527347A (en) | 2021-10-11 |
| JPWO2019237045A5 JPWO2019237045A5 (en) | 2022-06-14 |
| JP7472413B2true JP7472413B2 (en) | 2024-04-23 |
Family
ID=68765180
Family Applications (1)
| Application Number | Title | Priority Date | Filing Date |
|---|---|---|---|
| JP2020567888AActiveJP7472413B2 (en) | 2018-06-08 | 2019-06-07 | Generating and reading signal-bearing art using pointillism, Voronoi, and Delaunay methods |
Country Status (4)
| Country | Link |
|---|---|
| US (3) | US10748232B2 (en) |
| EP (1) | EP3815048B1 (en) |
| JP (1) | JP7472413B2 (en) |
| WO (1) | WO2019237045A1 (en) |
Families Citing this family (28)
| Publication number | Priority date | Publication date | Assignee | Title |
|---|---|---|---|---|
| US9749607B2 (en) | 2009-07-16 | 2017-08-29 | Digimarc Corporation | Coordinated illumination and image signal capture for enhanced signal detection |
| US9716807B2 (en)* | 2014-10-13 | 2017-07-25 | Digimarc Corporation | Methods for estimating watermark signal strength, an embedding process using the same, and related arrangements |
| US10872392B2 (en)* | 2017-11-07 | 2020-12-22 | Digimarc Corporation | Generating artistic designs encoded with robust, machine-readable data |
| US11062108B2 (en) | 2017-11-07 | 2021-07-13 | Digimarc Corporation | Generating and reading optical codes with variable density to adapt for visual quality and reliability |
| US20190213705A1 (en) | 2017-12-08 | 2019-07-11 | Digimarc Corporation | Artwork generated to convey digital messages, and methods/apparatuses for generating such artwork |
| US11158444B2 (en)* | 2018-02-12 | 2021-10-26 | Intel Corporation | Magnetic material having coated ferromagnetic filler particles |
| WO2019165364A1 (en)* | 2018-02-25 | 2019-08-29 | Digimarc Corporation | Generating and reading optical codes with variable density to adapt for visual quality and reliability |
| JP7472413B2 (en) | 2018-06-08 | 2024-04-23 | ディジマーク コーポレイション | Generating and reading signal-bearing art using pointillism, Voronoi, and Delaunay methods |
| CN113748007B (en) | 2019-03-13 | 2024-12-13 | 数字标记公司 | Digital labeling of recycled items |
| WO2020198660A1 (en) | 2019-03-27 | 2020-10-01 | Digimarc Corporation | Artwork generated to convey digital messages, and methods/apparatuses for generating such artwork |
| US11037038B2 (en) | 2019-03-27 | 2021-06-15 | Digimarc Corporation | Artwork generated to convey digital messages, and methods/apparatuses for generating such artwork |
| US11288764B2 (en) | 2019-07-01 | 2022-03-29 | Digimarc Corporation | Watermarking arrangements permitting vector graphics editing |
| US12406037B2 (en)* | 2019-12-18 | 2025-09-02 | Booz Allen Hamilton Inc. | System and method for digital steganography purification |
| WO2021195563A1 (en) | 2020-03-26 | 2021-09-30 | Digimarc Corporation | Arrangements for digital marking and reading of items, useful in recycling |
| WO2021253011A1 (en) | 2020-06-12 | 2021-12-16 | Digimarc Corporation | Signaling arrangements employing molded thermoplastics |
| US12205190B2 (en) | 2020-10-30 | 2025-01-21 | Digimarc Corporation | Mimicked machine-readable codes, and methods |
| US11995505B1 (en) | 2020-11-11 | 2024-05-28 | Digimarc Corporation | Encoding fabrics to convey digital messages |
| CN112818834B (en)* | 2021-01-29 | 2022-11-25 | 山东大学 | Method, device and medium for judging avoidance of emergency vehicles at intersections |
| US20220331841A1 (en) | 2021-04-16 | 2022-10-20 | Digimarc Corporation | Methods and arrangements to aid recycling |
| US11881008B2 (en)* | 2021-05-12 | 2024-01-23 | Intuitive Research And Technology Corporation | Encoding enhanced information into pixel channels |
| US12333624B1 (en) | 2021-06-04 | 2025-06-17 | Digimarc Corporation | Modulating surface topcoats to embed digital watermarking |
| CN113542767B (en)* | 2021-07-14 | 2022-06-10 | 广东工业大学 | An information hiding image processing model construction method, device, terminal and medium |
| US20250005700A1 (en) | 2021-08-19 | 2025-01-02 | Spot Vision Llc | Use of Imperfect Patterns to Encode Data on Surfaces |
| WO2023049400A1 (en) | 2021-09-25 | 2023-03-30 | Digimarc Corporation | Signaling arrangements employing molded thermoplastics |
| WO2023107155A1 (en) | 2021-12-08 | 2023-06-15 | Digimarc Corporation | Marking methods and arrangements |
| US20230394706A1 (en)* | 2022-06-06 | 2023-12-07 | Digimarc Corporation | Methods and arrangements for assessing camera system performance |
| WO2024015385A1 (en) | 2022-07-14 | 2024-01-18 | Digimarc Corporation | Methods and arrangements to utilize end-of-life data generated during recycling and waste sortation for counterfeit deterrence and other actions |
| CN116797450B (en)* | 2023-08-29 | 2023-11-10 | 中南大学 | Curve-based image stylization method |
Citations (1)
| Publication number | Priority date | Publication date | Assignee | Title |
|---|---|---|---|---|
| JP2017507518A (en) | 2013-12-19 | 2017-03-16 | ビザ インターナショナル サービス アソシエーション | Cloud-based transaction method and system |
Family Cites Families (73)
| Publication number | Priority date | Publication date | Assignee | Title |
|---|---|---|---|---|
| US6060428A (en) | 1992-12-09 | 2000-05-09 | Wallace Computer Services, Inc. | Heat-sensitive chromogenic system |
| US6345104B1 (en)* | 1994-03-17 | 2002-02-05 | Digimarc Corporation | Digital watermarks and methods for security documents |
| US5862260A (en) | 1993-11-18 | 1999-01-19 | Digimarc Corporation | Methods for surveying dissemination of proprietary empirical data |
| US6614914B1 (en) | 1995-05-08 | 2003-09-02 | Digimarc Corporation | Watermark embedder and reader |
| US5636292C1 (en) | 1995-05-08 | 2002-06-18 | Digimarc Corp | Steganography methods employing embedded calibration data |
| US5832119C1 (en) | 1993-11-18 | 2002-03-05 | Digimarc Corp | Methods for controlling systems using control signals embedded in empirical data |
| US6449377B1 (en)* | 1995-05-08 | 2002-09-10 | Digimarc Corporation | Methods and systems for watermark processing of line art images |
| US6993152B2 (en) | 1994-03-17 | 2006-01-31 | Digimarc Corporation | Hiding geo-location data through arrangement of objects |
| US20020136429A1 (en) | 1994-03-17 | 2002-09-26 | John Stach | Data hiding through arrangement of objects |
| US8144368B2 (en) | 1998-01-20 | 2012-03-27 | Digimarc Coporation | Automated methods for distinguishing copies from original printed objects |
| US6988202B1 (en) | 1995-05-08 | 2006-01-17 | Digimarc Corporation | Pre-filteriing to increase watermark signal-to-noise ratio |
| US6590996B1 (en) | 2000-02-14 | 2003-07-08 | Digimarc Corporation | Color adaptive watermarking |
| US7555139B2 (en) | 1995-05-08 | 2009-06-30 | Digimarc Corporation | Secure documents with hidden signals, and related methods and systems |
| US6408331B1 (en) | 1995-07-27 | 2002-06-18 | Digimarc Corporation | Computer linking methods using encoded graphics |
| US6009893A (en) | 1998-11-25 | 2000-01-04 | Chang; Chia-Bo | Assembling structure for balance valve of cold/hot water mixing valve |
| US8271336B2 (en) | 1999-11-22 | 2012-09-18 | Accenture Global Services Gmbh | Increased visibility during order management in a network-based supply chain environment |
| US6625297B1 (en) | 2000-02-10 | 2003-09-23 | Digimarc Corporation | Self-orienting watermarks |
| US6760464B2 (en) | 2000-10-11 | 2004-07-06 | Digimarc Corporation | Halftone watermarking and related applications |
| US6483927B2 (en) | 2000-12-18 | 2002-11-19 | Digimarc Corporation | Synchronizing readers of hidden auxiliary data in quantization-based data hiding schemes |
| US7340076B2 (en) | 2001-05-10 | 2008-03-04 | Digimarc Corporation | Digital watermarks for unmanned vehicle navigation |
| US7068809B2 (en) | 2001-08-27 | 2006-06-27 | Digimarc Corporation | Segmentation in digital watermarking |
| US7321667B2 (en) | 2002-01-18 | 2008-01-22 | Digimarc Corporation | Data hiding through arrangement of objects |
| US6987861B2 (en) | 2002-03-19 | 2006-01-17 | Digimarc Corporation | Security arrangements for printed documents |
| US7072490B2 (en) | 2002-11-22 | 2006-07-04 | Digimarc Corporation | Symmetry watermark |
| WO2005071939A1 (en)* | 2004-01-22 | 2005-08-04 | Sony Corporation | Unauthorized copy preventing device and method thereof, and program |
| US7293712B2 (en) | 2004-10-05 | 2007-11-13 | Hand Held Products, Inc. | System and method to automatically discriminate between a signature and a dataform |
| US7856116B2 (en) | 2004-11-09 | 2010-12-21 | Digimarc Corporation | Authenticating identification and security documents |
| EP1691539A1 (en) | 2005-02-15 | 2006-08-16 | European Central Bank | Two-dimensional security pattern that can be authenticated with one-dimensional signal processing |
| US7596270B2 (en) | 2005-09-23 | 2009-09-29 | Dynacomware Taiwan Inc. | Method of shuffling text in an Asian document image |
| WO2007065224A1 (en) | 2005-12-05 | 2007-06-14 | Commonwealth Scientific And Industrial Research Organisation | A method of forming a securitized image |
| WO2008092147A2 (en) | 2007-01-26 | 2008-07-31 | Information Resources, Inc. | Analytic platform |
| US20080264824A1 (en) | 2007-04-27 | 2008-10-30 | Rosa Alejandra | Array of packages having wipes |
| US8805110B2 (en) | 2008-08-19 | 2014-08-12 | Digimarc Corporation | Methods and systems for content processing |
| US9117268B2 (en) | 2008-12-17 | 2015-08-25 | Digimarc Corporation | Out of phase digital watermarking in two chrominance directions |
| US8463035B2 (en) | 2009-05-28 | 2013-06-11 | Gentex Corporation | Digital image processing for calculating a missing color value |
| WO2011013373A1 (en) | 2009-07-29 | 2011-02-03 | Canon Kabushiki Kaisha | Measuring apparatus, measuring method, and program |
| EP2296362B1 (en) | 2009-09-09 | 2012-02-15 | European Central Bank | A method for generating a security bi-level image for a banknote |
| CN105701189B (en) | 2010-01-15 | 2019-06-25 | 数字标记公司 | The related method of the art work and allocation plan are enriched with signal |
| US8262000B2 (en) | 2010-04-29 | 2012-09-11 | Sd-X Interactive | Method and system for encoding and decoding data |
| JP6092105B2 (en) | 2010-09-03 | 2017-03-08 | ディジマーク コーポレイション | Signal processing apparatus and method for estimating conversion between signals |
| US8581907B2 (en) | 2011-03-07 | 2013-11-12 | Microsoft Corporation | Set visualizations |
| US9129277B2 (en) | 2011-08-30 | 2015-09-08 | Digimarc Corporation | Methods and arrangements for identifying objects |
| KR101439855B1 (en) | 2013-01-25 | 2014-09-17 | 주식회사 하이딥 | Touch screen controller and method for controlling thereof |
| US9148675B2 (en) | 2013-06-05 | 2015-09-29 | Tveyes Inc. | System for social media tag extraction |
| US9635378B2 (en) | 2015-03-20 | 2017-04-25 | Digimarc Corporation | Sparse modulation for robust signaling and synchronization |
| US10424038B2 (en) | 2015-03-20 | 2019-09-24 | Digimarc Corporation | Signal encoding outside of guard band region surrounding text characters, including varying encoding strength |
| US9224196B2 (en) | 2014-03-12 | 2015-12-29 | ClearMark Systems, LLC | System and method for authentication |
| US9967445B2 (en) | 2014-07-23 | 2018-05-08 | Orcam Technologies Ltd. | Wearable apparatus securable to clothing |
| US9747656B2 (en) | 2015-01-22 | 2017-08-29 | Digimarc Corporation | Differential modulation for robust signaling and synchronization |
| WO2016153911A1 (en) | 2015-03-20 | 2016-09-29 | Digimarc Corporation | Sparse modulation for robust signaling and synchronization |
| WO2016153936A1 (en) | 2015-03-20 | 2016-09-29 | Digimarc Corporation | Digital watermarking and data hiding with narrow-band absorption materials |
| US9928561B2 (en) | 2015-05-29 | 2018-03-27 | Digimarc Corporation | Serialized digital watermarking for variable data printing |
| EP3311360B1 (en) | 2015-07-16 | 2023-07-19 | Digimarc Corporation | Signal processors and methods for estimating geometric transformations of images for digital data extraction |
| DE102015009981A1 (en) | 2015-07-31 | 2017-02-02 | Eberhard Karls Universität Tübingen | Method and apparatus for image synthesis |
| US9690967B1 (en) | 2015-10-29 | 2017-06-27 | Digimarc Corporation | Detecting conflicts between multiple different encoded signals within imagery |
| EP3507773A1 (en) | 2016-09-02 | 2019-07-10 | Artomatix Ltd. | Systems and methods for providing convolutional neural network based image synthesis using stable and controllable parametric models, a multiscale synthesis framework and novel network architectures |
| US10198839B2 (en) | 2016-09-22 | 2019-02-05 | Apple Inc. | Style transfer-based image content correction |
| US10147459B2 (en) | 2016-09-22 | 2018-12-04 | Apple Inc. | Artistic style transfer for videos |
| US10916001B2 (en) | 2016-11-28 | 2021-02-09 | Adobe Inc. | Facilitating sketch to painting transformations |
| CN108205813B (en)* | 2016-12-16 | 2022-06-03 | 微软技术许可有限责任公司 | Image Stylization Based on Learning Network |
| CN106709532B (en) | 2017-01-25 | 2020-03-10 | 京东方科技集团股份有限公司 | Image processing method and device |
| US10382645B2 (en) | 2017-03-10 | 2019-08-13 | Digimarc Corporation | Predicting detectability and grading prior to printing |
| US10311326B2 (en) | 2017-03-31 | 2019-06-04 | Qualcomm Incorporated | Systems and methods for improved image textures |
| US10565757B2 (en) | 2017-06-09 | 2020-02-18 | Adobe Inc. | Multimodal style-transfer network for applying style features from multi-resolution style exemplars to input images |
| US10318889B2 (en) | 2017-06-26 | 2019-06-11 | Konica Minolta Laboratory U.S.A., Inc. | Targeted data augmentation using neural style transfer |
| US11062108B2 (en) | 2017-11-07 | 2021-07-13 | Digimarc Corporation | Generating and reading optical codes with variable density to adapt for visual quality and reliability |
| US10872392B2 (en) | 2017-11-07 | 2020-12-22 | Digimarc Corporation | Generating artistic designs encoded with robust, machine-readable data |
| US20190213705A1 (en) | 2017-12-08 | 2019-07-11 | Digimarc Corporation | Artwork generated to convey digital messages, and methods/apparatuses for generating such artwork |
| WO2019113471A1 (en) | 2017-12-08 | 2019-06-13 | Digimarc Corporation | Artwork generated to convey digital messages, and methods/apparatuses for generating such artwork |
| WO2019165364A1 (en) | 2018-02-25 | 2019-08-29 | Digimarc Corporation | Generating and reading optical codes with variable density to adapt for visual quality and reliability |
| US10791343B2 (en) | 2018-03-13 | 2020-09-29 | Google Llc | Mixed noise and fine texture synthesis in lossy image compression |
| JP7472413B2 (en) | 2018-06-08 | 2024-04-23 | ディジマーク コーポレイション | Generating and reading signal-bearing art using pointillism, Voronoi, and Delaunay methods |
| US10657676B1 (en) | 2018-06-28 | 2020-05-19 | Snap Inc. | Encoding and decoding a stylized custom graphic |
- 2019
- 2019-06-07JPJP2020567888Apatent/JP7472413B2/enactiveActive
- 2019-06-07USUS16/435,164patent/US10748232B2/enactiveActive
- 2019-06-07EPEP19815064.1Apatent/EP3815048B1/enactiveActive
- 2019-06-07WOPCT/US2019/036126patent/WO2019237045A1/ennot_activeCeased
- 2020
- 2020-08-10USUS16/989,128patent/US11276133B2/enactiveActive
- 2022
- 2022-03-14USUS17/694,278patent/US11657470B2/enactiveActive
Patent Citations (1)
| Publication number | Priority date | Publication date | Assignee | Title |
|---|---|---|---|---|
| JP2017507518A (en) | 2013-12-19 | 2017-03-16 | ビザ インターナショナル サービス アソシエーション | Cloud-based transaction method and system |
Also Published As
| Publication number | Publication date |
|---|---|
| JP2021527347A (en) | 2021-10-11 |
| EP3815048A4 (en) | 2022-03-30 |
| US11657470B2 (en) | 2023-05-23 |
| US11276133B2 (en) | 2022-03-15 |
| US20220351322A1 (en) | 2022-11-03 |
| WO2019237045A1 (en) | 2019-12-12 |
| US20210049727A1 (en) | 2021-02-18 |
| US10748232B2 (en) | 2020-08-18 |
| US20190378235A1 (en) | 2019-12-12 |
| EP3815048B1 (en) | 2024-01-31 |
| EP3815048A1 (en) | 2021-05-05 |
Similar Documents
| Publication | Publication Date | Title |
|---|---|---|
| JP7472413B2 (en) | Generating and reading signal-bearing art using pointillism, Voronoi, and Delaunay methods | |
| JP7543374B2 (en) | Producing and reading optical codes with variable density to suit visual quality and reliability | |
| US12079684B2 (en) | Generating reading optical codes with variable density to adapt for visual quality and reliability | |
| US11704765B2 (en) | Artwork generated to convey digital messages, and methods/apparatuses for generating such artwork | |
| US11651469B2 (en) | Generating artistic designs encoded with robust, machine-readable data | |
| US20190171856A1 (en) | Generating and reading optical codes with variable density to adapt for visual quality and reliability | |
| US11308571B2 (en) | Sparse modulation for robust signaling and synchronization | |
| CN107615330B (en) | Sparse modulation for robust signaling and synchronization | |
| US20160275639A1 (en) | Sparse modulation for robust signaling and synchronization | |
| US12079677B2 (en) | Determining spatial distance using encoding signals | |
| US20210082080A1 (en) | Signal encoding for inks with low reflectivity | |
| WO2020055397A1 (en) | Generating artistic designs encoded with robust, machine-readable data |
Legal Events
| Date | Code | Title | Description |
|---|---|---|---|
| A521 | Request for written amendment filed | Free format text:JAPANESE INTERMEDIATE CODE: A523 Effective date:20220606 | |
| A621 | Written request for application examination | Free format text:JAPANESE INTERMEDIATE CODE: A621 Effective date:20220606 | |
| A131 | Notification of reasons for refusal | Free format text:JAPANESE INTERMEDIATE CODE: A131 Effective date:20230801 | |
| A601 | Written request for extension of time | Free format text:JAPANESE INTERMEDIATE CODE: A601 Effective date:20231101 | |
| A601 | Written request for extension of time | Free format text:JAPANESE INTERMEDIATE CODE: A601 Effective date:20231225 | |
| A521 | Request for written amendment filed | Free format text:JAPANESE INTERMEDIATE CODE: A523 Effective date:20240123 | |
| TRDD | Decision of grant or rejection written | ||
| A01 | Written decision to grant a patent or to grant a registration (utility model) | Free format text:JAPANESE INTERMEDIATE CODE: A01 Effective date:20240312 | |
| A61 | First payment of annual fees (during grant procedure) | Free format text:JAPANESE INTERMEDIATE CODE: A61 Effective date:20240314 | |
| R150 | Certificate of patent or registration of utility model | Ref document number:7472413 Country of ref document:JP Free format text:JAPANESE INTERMEDIATE CODE: R150 |