JP7388540B2 - Display device, display method and display program - Google Patents
Display device, display method and display programDownload PDFInfo
- Publication number
- JP7388540B2 JP7388540B2JP2022507050AJP2022507050AJP7388540B2JP 7388540 B2JP7388540 B2JP 7388540B2JP 2022507050 AJP2022507050 AJP 2022507050AJP 2022507050 AJP2022507050 AJP 2022507050AJP 7388540 B2JP7388540 B2JP 7388540B2
- Authority
- JP
- Japan
- Prior art keywords
- point cloud
- data
- cloud data
- display
- group data
- Prior art date
- Legal status (The legal status is an assumption and is not a legal conclusion. Google has not performed a legal analysis and makes no representation as to the accuracy of the status listed.)
- Active
Links
Images


Classifications
- G—PHYSICS
- G06—COMPUTING OR CALCULATING; COUNTING
- G06T—IMAGE DATA PROCESSING OR GENERATION, IN GENERAL
- G06T15/00—3D [Three Dimensional] image rendering
- G06T15/10—Geometric effects
- G06T15/20—Perspective computation
- G—PHYSICS
- G06—COMPUTING OR CALCULATING; COUNTING
- G06T—IMAGE DATA PROCESSING OR GENERATION, IN GENERAL
- G06T17/00—Three dimensional [3D] modelling, e.g. data description of 3D objects
- G06T17/05—Geographic models
- G—PHYSICS
- G01—MEASURING; TESTING
- G01S—RADIO DIRECTION-FINDING; RADIO NAVIGATION; DETERMINING DISTANCE OR VELOCITY BY USE OF RADIO WAVES; LOCATING OR PRESENCE-DETECTING BY USE OF THE REFLECTION OR RERADIATION OF RADIO WAVES; ANALOGOUS ARRANGEMENTS USING OTHER WAVES
- G01S7/00—Details of systems according to groups G01S13/00, G01S15/00, G01S17/00
- G01S7/48—Details of systems according to groups G01S13/00, G01S15/00, G01S17/00 of systems according to group G01S17/00
- G01S7/51—Display arrangements
- G—PHYSICS
- G06—COMPUTING OR CALCULATING; COUNTING
- G06T—IMAGE DATA PROCESSING OR GENERATION, IN GENERAL
- G06T2210/00—Indexing scheme for image generation or computer graphics
- G06T2210/56—Particle system, point based geometry or rendering
Landscapes
- Engineering & Computer Science (AREA)
- Physics & Mathematics (AREA)
- Theoretical Computer Science (AREA)
- Geometry (AREA)
- General Physics & Mathematics (AREA)
- Computer Graphics (AREA)
- Computing Systems (AREA)
- Software Systems (AREA)
- Remote Sensing (AREA)
- Computer Networks & Wireless Communication (AREA)
- Radar, Positioning & Navigation (AREA)
- Processing Or Creating Images (AREA)
- Optical Radar Systems And Details Thereof (AREA)
- Image Generation (AREA)
- Controls And Circuits For Display Device (AREA)
- Alarm Systems (AREA)
Description
Translated fromJapanese本発明は、表示装置、表示方法及び表示プログラムが格納された非一時的なコンピュータ可読媒体に関する。 The present invention relates to a display device, a display method, and a non-transitory computer-readable medium storing a display program.
光を用いて測定物までの距離と形状を測定する3次元光センサが知られている。3次元光センサは、ToF(Time of Flight)方式を用いることで、広範囲にわたって測定物の距離と形状を取得できるため、インフラ設備の点検やセキュリティ監視等に利用されている。このような監視では、3次元光センサの測定結果である3次元の点群データを表示装置に2次元表示することで監視が行われている。 Three-dimensional optical sensors are known that use light to measure the distance and shape of an object. Three-dimensional optical sensors can acquire the distance and shape of objects over a wide range by using the ToF (Time of Flight) method, and are therefore used for inspections of infrastructure equipment, security monitoring, and the like. In such monitoring, three-dimensional point cloud data, which is the measurement result of a three-dimensional optical sensor, is displayed two-dimensionally on a display device.
関連する技術として、例えば特許文献1~2が知られている。特許文献1には、3次元光センサが生成した点群データを3次元モデル上に投影し、3次元モデルを可視化することが記載されている。特許文献2には、カメラによって撮像された撮像画像を空間モデルにマッピングすることで、3次元空間における任意の仮想視点から見た画像を表示することが記載されている。 As related technologies, for example,
上記のように関連する技術では、3次元光センサが生成した点群データの3次元モデルを可視化することや、カメラ画像を任意の視点から見た画像に変換することを可能としている。しかしながら、関連する技術では、3次元光センサが測定した測定点群データを2次元表示する際に、監視対象等の対象点群データの表示方法が考慮されていないため、測定点群データと対象点群データを適切に2次元表示することが困難な場合があるという問題がある。 The related technologies described above make it possible to visualize a three-dimensional model of point cloud data generated by a three-dimensional optical sensor and to convert a camera image into an image viewed from an arbitrary viewpoint. However, in related technologies, when displaying measurement point cloud data measured by a 3D optical sensor in 2D, the display method of target point cloud data such as a monitoring target is not taken into consideration. There is a problem in that it may be difficult to properly display point cloud data in two dimensions.
本開示は、このような課題に鑑み、測定点群データと対象点群データを適切に2次元表示することが可能な表示装置、表示方法及び表示プログラムが格納された非一時的なコンピュータ可読媒体を提供することを目的とする。 In view of these issues, the present disclosure provides a display device, a display method, and a non-transitory computer-readable medium storing a display program that can appropriately display measured point cloud data and target point cloud data in two dimensions. The purpose is to provide
本開示に係る表示装置は、3次元光センサにより測定された測定点群データを含む3次元空間において、前記測定点群データを2次元表示するための視点から前記測定点群データ内の対象点群データまでの中間領域の中間点群データを検出する検出手段と、前記検出された中間点群データに基づいて、前記視点から前記対象点群データが視認可能となるように、前記測定点群データまたは前記対象点群データの表示態様を設定する設定手段と、前記設定した表示態様にしたがって、前記測定点群データ及び前記対象点群データを2次元表示する表示手段と、を備えるものである。 The display device according to the present disclosure provides a display device that includes a target point in the measurement point cloud data from a viewpoint for displaying the measurement point cloud data in two dimensions in a three-dimensional space including measurement point cloud data measured by a three-dimensional optical sensor. a detection means for detecting intermediate point cloud data in an intermediate region up to the group data; A setting means for setting a display mode of the data or the target point group data, and a display means for displaying the measurement point group data and the target point group data two-dimensionally according to the set display mode. .
本開示に係る表示方法は、3次元光センサにより測定された測定点群データを含む3次元空間において、前記測定点群データを2次元表示するための視点から前記測定点群データ内の対象点群データまでの中間領域の中間点群データを検出し、前記検出された中間点群データに基づいて、前記視点から前記対象点群データが視認可能となるように、前記測定点群データまたは前記対象点群データの表示態様を設定し、前記設定した表示態様にしたがって、前記測定点群データ及び前記対象点群データを2次元表示するものである。 The display method according to the present disclosure provides a method for displaying target points in the measurement point cloud data from a viewpoint for displaying the measurement point cloud data in two dimensions in a three-dimensional space including measurement point cloud data measured by a three-dimensional optical sensor. Intermediate point group data in an intermediate region up to the group data is detected, and based on the detected intermediate point group data, the measurement point group data or the The display mode of the target point group data is set, and the measurement point group data and the target point group data are displayed two-dimensionally according to the set display mode.
本開示に係る表示プログラムが格納された非一時的なコンピュータ可読媒体は、3次元光センサにより測定された測定点群データを含む3次元空間において、前記測定点群データを2次元表示するための視点から前記測定点群データ内の対象点群データまでの中間領域の中間点群データを検出し、前記検出された中間点群データに基づいて、前記視点から前記対象点群データが視認可能となるように、前記測定点群データまたは前記対象点群データの表示態様を設定し、前記設定した表示態様にしたがって、前記測定点群データ及び前記対象点群データを2次元表示する、処理をコンピュータに実行させるための表示プログラムが格納された非一時的なコンピュータ可読媒体である。 A non-transitory computer-readable medium in which a display program according to the present disclosure is stored is for two-dimensionally displaying measurement point cloud data in a three-dimensional space including measurement point cloud data measured by a three-dimensional optical sensor. Detecting intermediate point cloud data in an intermediate region from a viewpoint to target point cloud data in the measurement point cloud data, and determining that the target point cloud data is visible from the viewpoint based on the detected intermediate point cloud data. A computer performs a process of setting a display mode of the measurement point group data or the target point group data, and displaying the measurement point group data and the target point group data two-dimensionally according to the set display mode. A non-transitory computer-readable medium that stores a display program to be executed by a computer.
本開示によれば、測定点群データと対象点群データを適切に2次元表示することが可能な表示装置、表示方法及び表示プログラムが格納された非一時的なコンピュータ可読媒体を提供することができる。 According to the present disclosure, it is possible to provide a display device, a display method, and a non-transitory computer-readable medium storing a display program that can appropriately display measurement point cloud data and target point cloud data in two dimensions. can.
以下、図面を参照して実施の形態について説明する。各図面においては、同一の要素には同一の符号が付されており、必要に応じて重複説明は省略される。 Embodiments will be described below with reference to the drawings. In each drawing, the same elements are designated by the same reference numerals, and redundant explanation will be omitted if necessary.
(実施の形態の概要)
図1は、実施の形態に係る表示装置の概要を示している。図1に示すように、実施の形態に係る表示装置10は、検出部11、設定部12、表示部13を備えている。(Summary of embodiment)
FIG. 1 shows an overview of a display device according to an embodiment. As shown in FIG. 1, the
検出部11は、3次元光センサにより測定された測定点群データを含む3次元空間において、測定点群データを2次元表示するための視点から測定点群データ内の対象点群データまでの中間領域の中間点群データ(測定点群データでもある)を検出する。設定部12は、検出部11により検出された中間点群データに基づいて、視点から対象点群データが視認可能となるように、測定点群データまたは対象点群データの表示態様を設定する。表示部13は、設定部12が設定した表示態様にしたがって、測定点群データ及び対象点群データを2次元表示する。 In a three-dimensional space including measurement point cloud data measured by a three-dimensional optical sensor, the
このように、実施の形態では、3次元光センサにより測定された測定点群データと対象点群データとを2次元表示する際に、3次元空間における視点と対象点群データの間の中間点群データの検出に応じて、視点から対象点群データが視認可能となるように、測定点群データまたは対象点群データの表示態様を設定する。これにより、測定点群データと対象点群データを適切に2次元表示し、測定点群データを表示した状態で、ユーザがはっきりと対象点群データを把握することが可能となる。 As described above, in the embodiment, when displaying the measurement point cloud data and the target point cloud data measured by the three-dimensional optical sensor in two dimensions, the intermediate point between the viewpoint and the target point cloud data in the three-dimensional space is displayed. In response to the detection of the group data, the display mode of the measurement point group data or the target point group data is set so that the target point group data is visible from the viewpoint. Thereby, the measurement point cloud data and the target point cloud data are appropriately displayed in two dimensions, and the user can clearly grasp the target point cloud data while the measurement point cloud data is displayed.
(実施の形態1)
以下、図面を参照して実施の形態1について説明する。図2は、本実施の形態に係る監視システム1の構成例を示している。本実施の形態に係る監視システム1は、3次元光センサで取得した3次元の点群データを使って監視対象の施設を監視するシステムである。図2に示すように、本実施の形態に係る監視システム1は、表示装置100、2つの3次元光センサ200(200a及び200b)、異常解析装置300を備えている。なお、表示装置100と異常解析装置300を一つの装置としてもよい。(Embodiment 1)
3次元光センサ200は、ToF方式により監視対象(測定対象)までの距離を測定し、測定した結果に基づいて点群データ(測定点群データ)を生成する3次元センサである。点群データは、測定範囲の各測定点において、監視対象からの反射光により得られた3次元空間の位置情報及び輝度情報を有する。3次元光センサ200は、具体的には3D-LiDAR(Light Detection and Ranging)である。 The three-dimensional optical sensor 200 is a three-dimensional sensor that measures the distance to a monitoring target (measurement target) using the ToF method and generates point cloud data (measured point cloud data) based on the measured results. The point cloud data includes position information and brightness information in three-dimensional space obtained from reflected light from the monitoring target at each measurement point in the measurement range. Specifically, the three-dimensional optical sensor 200 is a 3D-LiDAR (Light Detection and Ranging).
3次元光センサ200a及び200bは、異なる測定位置に設置され、設置された測定位置から監視対象を測定し、それぞれ測定点群データPD1及びPD2を生成する。異なる位置に設置された2つの3次元光センサ200により測定することで、点群データが正確に得られない(光が届かない)領域の発生を抑え、測定精度を向上することができる。なお、2つに限らず、さらに複数の3次元光センサを備えていてもよい。 The three-dimensional
異常解析装置300は、3次元光センサ200a及び200bの測定結果である測定点群データPD1及びPD2を取得し、測定点群データPD1及びPD2(監視対象)の異常を解析する。例えば、異常解析装置300は、3次元光センサ200a及び200bから、定期的に測定点群データPD1及びPD2を取得し、測定点群データPD1及びPD2の時間的変化を解析する。異常解析装置300は、前回取得した測定点群データPD1及びPD2と今回取得した測定点群データPD1及びPD2との差分を求め、差分が所定の基準以上の場合、異常ありと判定し、差分が大きい異常箇所を特定する。異常解析装置300は、異常と判定された箇所の点群データである異常点群データAD、測定点群データPD1及びPD2を表示装置100へ出力する。 The
表示装置100は、3次元光センサ200a及び200bの測定結果及び異常解析装置300の解析結果を表示することで、監視者(ユーザ)が監視対象の異常を監視する監視装置である。表示装置100は、3次元光センサ200a及び200bの測定結果である測定点群データPD1及びPD2に基づいた、監視対象(構造物)全体の3次元データである背景点群データBD(測定点群データ)を表示画面W1に2次元表示するとともに、同じ表示画面W1に異常解析装置300の解析結果である異常点群データAD(対象点群データ)を2次元表示する。 The
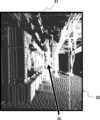
図3は、表示画面W1の表示例を示している。図3に示すように、表示装置100は、2次元の表示画面W1に3次元の異常点群データADと背景点群データBDを含めて表示する。そうすると、図3に示すように、異常点群データADが手前の点群(背景点群データBD)に隠れてしまい、奥にある異常点群データADが表示画面W1を監視する監視者から見えない(2次元表示画面に表示されない)、もしくは見え難い場合がある。このように、例えば、複数の測定点で測定した点群データをまとめて表示する際、表示方法によっては、異常点群データADが隠れる恐れがある。そこで、本実施の形態では、異常と判定された異常点群データADの3次元位置情報や重要度、背景点群データBDの3次元位置情報に基づいて、2次元表示画面上に異常点群データADが隠れて表示されることを抑止する。 FIG. 3 shows a display example of the display screen W1. As shown in FIG. 3, the
図4は、本実施の形態に係る表示装置100の構成例を示している。図4に示すように、本実施の形態に係る表示装置100は、入力部101、取得部102、記憶部103、表示部104、重要度設定部105、点群検出部106、表示設定部107を備えている。なお、各部(ブロック)の構成は一例であり、後述の方法(動作)が可能であれば、その他の各部で構成されてもよい。また、表示装置100は、例えば、サーバやパーソナルコンピュータ等のコンピュータ装置で実現されるが、1つの装置で実現してもよいし、複数の装置で実現してもよい。 FIG. 4 shows a configuration example of
入力部101は、表示装置100を操作するユーザ(監視者)から入力された情報を取得する入力インタフェースである。入力部101は、キーボードやマウス、タッチパネル等の入力装置から、ユーザの操作に応じた情報が入力される。 The
取得部102は、異常解析装置300や3次元光センサ200a及び200bとデータの入出力可能に接続されており、異常解析装置300から測定点群データPD1及びPD2と異常点群データADを取得する。なお、3次元光センサ200a及び200bから、測定点群データPD1及びPD2を取得してもよい。また、取得部102は、測定点群データPD1及びPD2に基づいて、背景点群データBDを生成する生成部でもある。なお、背景点群データBDを、異常解析装置300や他の装置から取得してもよい。背景点群データBDは、測定点群データPD1及びPD2を含む監視対象(測定対象)の測定点群データである。 The
記憶部103は、表示装置100の動作(処理)に必要なデータやプログラムを記憶する記憶部(格納部)である。記憶部103は、例えば、フラッシュメモリなどの不揮発性メモリやハードディスク装置等である。例えば、記憶部103は、取得部102が取得した点群データや表示パラメータ、3次元光センサ200a及び200bの測定条件等を記憶する。 The
表示部104は、表示装置100の各部が処理したデータ等を、表示設定部107の表示設定にしがたい表示画面W1に表示する表示部である。表示部104、例えば、液晶ディスプレイや有機ELディスプレイ等のディスプレイ装置である。表示部104は、GUI(Graphical User Interface)により、表示画面W1に異常点群データADと背景点群データBDを表示してもよい。 The
重要度設定部105は、取得部102が取得した異常点群データADの重要度を設定する。例えば、複数の異常点群データADを取得し、各異常点群データADに対し重要度を設定する。重要度は、異常点群データADの異常レベル(異常度)であり、検出された異常箇所が実際に異常である確率(異常解析装置が付与した信頼度)や、監視や表示を必要とする度合い(表示すべき優先順位)であるとも言える。なお、異常解析装置300や他の装置が重要度を設定し、設定された重要度を取得してもよい。さらに、重要度設定部(選択部)105は、異常点群データADが複数ある場合、設定した重要度に基づいて、表示する異常点群データADを選択する。例えば、重要度が最も大きい異常点群データADを選択する。重要度が閾値よりも大きい異常点群データADを選択してもよい。なお、重要度に限らず、ユーザの操作に応じて、表示する異常点群データADを選択してもよい。 The
点群検出部106は、3次元空間における背景点群データBDのフリースペースを検出する。点群検出部106は、2次元表示のための視点の位置と異常点群データADとの間の中間領域において、背景点群データBD(中間点群データ)の有無を検出する。点群検出部106は、重要度に基づいて選択された異常点群データADと視点との間の背景点群データBDを検出する。点群検出部106は、3次元空間における異常点群データADと背景点群データBDの位置関係に基づいて、2次元表示において異常点群データADが視認されるか否か(隠れるか否か)を検出するとも言える。 The point
表示設定部107は、点群検出部106の検出結果に応じて、異常点群データADまたは背景点群データBDを表示画面W1に表示するための表示設定を行う(表示設定を決定する)。表示設定とは、点群データの表示方法(見え方)を示す表示態様(表示モード)の設定であり、表示に必要な表示パラメータ等の設定を含む。表示設定部107は、異常点群データADが監視者から視認可能となるように、異常点群データADまたは背景点群データBDの表示態様を設定する。本実施の形態では、表示態様(表示モード)の一例として、異常点群データADが見やすい(視認可能な)位置に視点を設定する(視点切替モードと言う)。 The
視点切替モードでは、異常点群データADが見やすい視点とするため、異常点群データADと視点の間の中間領域に背景点群データBD(中間点群データ)が存在しないように視点の位置を設定する。また、3次元光センサの測定点(測定位置)に基づいて、視点の位置を設定し、例えば、いずれかの3次元光センサの測定点に近い位置の視点を選択する。さらに、3次元空間において背景点群データBDを回転させる回転中心点の位置を異常点群データADの位置に基づいて決定し、例えば回転中心点を異常点群データADの重心の位置とする。また、視点から見て異常点群データADを含む所定の範囲が表示領域となるように視点を設定し、例えば、異常点群データADを含む背景点群データBDの全体が表示領域となるように視点を設定する。 In the viewpoint switching mode, in order to make the abnormal point cloud data AD easy to view, the viewpoint position is changed so that the background point cloud data BD (intermediate point cloud data) does not exist in the intermediate area between the abnormal point cloud data AD and the viewpoint. Set. Furthermore, the position of the viewpoint is set based on the measurement point (measurement position) of the three-dimensional optical sensor, and, for example, a viewpoint near the measurement point of one of the three-dimensional optical sensors is selected. Furthermore, the position of the rotation center point for rotating the background point group data BD in the three-dimensional space is determined based on the position of the abnormal point group data AD, and for example, the rotation center point is set as the position of the center of gravity of the abnormal point group data AD. Also, the viewpoint is set so that a predetermined range including the abnormal point group data AD becomes the display area when viewed from the viewpoint, and for example, the entire background point group data BD including the abnormal point group data AD becomes the display area. Set the viewpoint to .
図5は、本実施の形態に係る表示装置100の基本動作を示している。この基本動作は他の実施の形態にも適用可能である。図5に示すように、まず、表示装置100は、背景点群データBDを取得する(S101)。3次元光センサ200a及び200bが監視対象を測定して測定点群データPD1及びPD2を生成すると、異常解析装置300が異常解析のために測定点群データPD1及びPD2を取得し、さらに表示装置100の取得部102が異常解析装置300から測定点群データPD1及びPD2を取得する。取得部102は、複数の測定点群データPD1及びPD2から表示画面W1に表示するための背景点群データBDを生成する。例えば、3次元光センサ200aの位置及び測定点群データPD1の位置の関係から求まる各データ(点データ)の3次元位置と、3次元光センサ200bの位置及び測定点群データPD2の位置の関係から求まる各データの3次元位置とに基づいて、監視対象の3次元データである背景点群データBDを生成する。 FIG. 5 shows the basic operation of
また、表示装置100は、異常点群データADを取得し(S102)、異常点群データADの重要度を設定するとともに、表示する異常点群データADを選択する(S103)。異常解析装置300が測定点群データPD1及びPD2を解析し異常点群データADを生成すると、表示装置100の取得部102が異常解析装置300から異常点群データADを取得する。さらに、表示装置100の重要度設定部105は、取得された異常点群データADの重要度を設定する。例えば、重要度設定部105は、複数の異常点群データADを取得すると、各異常点群データADの3次元空間における体積を求め、求めた体積に基づいて重要度を設定する。重要度設定部105は、体積が大きい異常点群データADの重要度を高くし、体積が小さい異常点群データADの重要度を低く設定する。また、異常解析装置300が解析時に異常点群データADに対し信頼度を付与し、重要度設定部105は、付与された信頼度に基づいて、異常点群データADの重要度を設定してもよい。例えば、異常の検出される期間が長い場合、付与される信頼度は大きく設定される。 The
さらに、重要度設定部105は、複数の異常点群データADが取得されている場合、設定された重要度に基づいて、表示すべき異常点群データADを選択する。例えば、重要度設定部105は、最も高い重要度の異常点群データADを選択する。 Further, if a plurality of abnormal point group data AD have been acquired, the importance
続いて、表示装置100は、2次元表示のための表示設定を決定する(S104)。背景点群データBD及び異常点群データADが取得され、表示する異常点群データADが選択されると、表示設定部107は、選択された高い重要度の異常点群データADが監視者から視認可能となるように異常点群データADまたは背景点群データBDの表示態様を決定する。 Subsequently, the
続いて、表示装置100は、決定された表示設定にしたがって表示画面W1に2次元表示を行う(S105)。表示装置100の表示部104は、決定された表示設定(表示態様)にしたがって異常点群データAD及び背景点群データBDを表示画面W1に表示する。図6は、異常点群データADの重要度にしたがって表示する表示例である。例えば、重要度=10の異常点群データADと重要度=2の異常点群データADがある場合、重要度=10の異常点群データADが見やすくなるよう表示する。図6は、表示態様を視点切替モードに設定した例であり、重要度=10の異常点群データADが見やすい視点を選択し、異常点群データAD周辺を拡大した状態で表示画面W1に表示している。 Subsequently, the
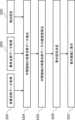
図7は、本実施の形態に係る表示装置100の具体的な動作例であり、表示態様を視点切替モードに設定する場合の動作を示している。図7に示すように、表示装置100は、図5のS101及びS102と同様、背景点群データBDを取得するとともに(S111)、異常点群データADを取得する(S112)。 FIG. 7 is a specific example of the operation of the
続いて、表示装置100は、背景点群データBDの全体を表示可能な視点の候補を抽出する(S113)。表示設定部107は、2次元表示のための視点の候補として、異常点群データADを含む背景点群データBDの全体を表示画面W1に表示可能な視点を抽出する。視点が異常点群データADに近すぎると、監視対象のどの部分に異常があるのか把握することができない。このため、背景点群データBDの全体を表示可能な視点を視点候補とする。なお、監視対象における異常箇所の位置が把握できればよいため、背景点群データBDの全てを表示可能な視点を抽出してもよいし、異常点群データADの周辺の所定の範囲を表示可能な視点を抽出してもよい。 Subsequently, the
また、表示装置100は、背景点群データBDのフリースペースを特定する(S114)。点群検出部106は、3次元空間における背景点群データBDの中でデータ(点データ)のないフリースペースを検出する。例えば、点群検出部106は、点群データに対し領域の特徴を分析する分析ツール(タグ付けツール)を使用して、フリースペースを検出する。点群データを分析ツールに入力すると、例えば、図8のように、3次元空間における点群データの各領域に分析結果が付与される。図8において、“Occupied”の領域は、物体がある領域、すなわち、点群データが得られている領域(反射光が検出された領域)である。“Free”の領域は、何も物体が無い領域(フリースペース)、すなわち、視点と点群データの間に点群データがない領域である。“Unknown”の領域は、“Occupied”と“Free”のどちらか分からない領域、すなわち、“Occupied”の裏側で点群データが得られていない(照射光が届かない)領域である。なお、分析ツールを使用せずにフリースペースを検出してもよい。例えば、3次元空間における視点の座標と異常点群データADの座標から、視点と異常点群データADの間の中間領域を特定し、特定した中間領域内の背景点群データBDを検出する。 Furthermore, the
また、表示装置100は、異常点群データADに基づいて回転中心点(焦点)を決定する(S115)。表示設定部107は、異常点群データADが見やすいように点群データを回転させるため、例えば異常点群データADの重心を回転中心点とする。なお、重心に限らず、異常点群データADに含まれる点を回転中心点としてもよい。また、複数の異常点群データADがある場合、図5と同様、重要度に基づいて回転中心とする異常点群データADを選択する。 Furthermore, the
続いて、表示装置100は、異常点群データADまでの中間領域がフリースペースとなる視点候補を抽出する(S116)。点群検出部106は、S114で特定したフリースペースの情報をもとに、3次元空間においてS113で候補とした視点から異常点群データADまでの中間領域がフリースペースか否か(中間領域に点群データがあるか否か)判定し、中間領域がフリースペースとなる視点候補を抽出する。このとき、S115で決定した回転中心点を中心として、3次元空間で異常点群データAD及び背景点群データBDを回転させて、中間領域における点群データを検出する。 Subsequently, the
続いて、表示装置100は、3次元光センサの測定位置に最も近い視点を選択する(S117)。表示設定部107は、異常点群データADまでの中間領域がフリースペースであるとして抽出された視点候補が複数ある場合、3次元光センサ200a及び200bの測定位置と視点候補の位置との距離を求め、3次元光センサ200aまたは200bの測定位置に最も近い視点を選択する。通常、監視対象を測定する場合、最も監視しやすい(見やすい)位置に3次元光センサを設置していると想定されるため、3次元光センサの位置に最も近い視点を選択する。 Subsequently, the
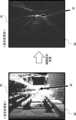
続いて、表示装置100は、選択された視点にしたがって表示画面W1に2次元表示を行う(S118)。表示部104は、S115で決定された回転中心とS117で決定された視点にしたがって異常点群データAD及び背景点群データBDを表示画面W1に表示する。図9は、視点切替モードにより、異常点群データADを中心として視点の位置を移動して表示する表示例である。図9に示すように、視点移動前は、異常点群データADと視点との間に背景点群データBDがあるため、異常点群データADを見ることができない。これに対し、視点移動後は、上記処理により視点を移動することにより、異常点群データADと視点との間に背景点群データBDがないため、異常点群データADをはっきりと視認することができる。 Subsequently, the
以上のように、本実施の形態では、異常点群データを含めて背景点群データを2次元表示する際に、異常点群データが見やすいように表示態様を設定することで、監視者が異常箇所をはっきりと把握可能とする。例えば、複数の異常箇所が検出された場合に、異常の重要度に応じて選択された異常点群データを表示することで、監視者が監視すべき異常箇所を優先的に表示することができる。また、表示態様の一例として、視点切替モードにより視点の位置を適切に設定することで、異常点群データを確実に視認可能とすることができる。 As described above, in this embodiment, when the background point cloud data including the abnormal point cloud data is displayed in two dimensions, the display mode is set so that the abnormal point cloud data is easy to see, so that the observer can Make it possible to clearly understand the location. For example, when multiple abnormal points are detected, by displaying the abnormal point cloud data selected according to the importance of the abnormality, the abnormal point that the supervisor should monitor can be displayed preferentially. . Further, as an example of the display mode, by appropriately setting the position of the viewpoint using the viewpoint switching mode, it is possible to reliably make the abnormal point group data visible.
(実施の形態2)
以下、図面を参照して実施の形態2について説明する。本実施の形態は、実施の形態1に係る表示装置100の他の具体的な動作例として、表示態様を、背景点群データまたは異常点群データの表示パラメータを、視点から異常点群データまでの点群密度に応じて設定する(点群表示調整モードと言う)。表示態様の設定以外については実施の形態1と同様である。(Embodiment 2)
本実施の形態に係る表示装置100の表示設定部107は、異常点群データADを視認可能とする表示態様の一例として、点群表示調整モードにより、背景点群データBDまたは異常点群データADの表示パラメータ、例えば透明度・サイズ・密度等を、視点から異常点群データADまでの背景点群データBDの点群密度に応じて変更する。透明度は、2次元表示における点群データの表示を透明化させる度合いであり、透明度が大きいほど背面側のデータが透けて見えるようになる。サイズは、2次元表示における点群データの各点を示す円の大きさである。密度は、2次元表示における点群データの各点を示す円の面密度である。 The
図10は、本実施の形態に係る表示装置100の具体的な動作例であり、表示態様を点群表示調整モードに設定する場合の動作を示している。図10に示すように、表示装置100は、図5のS101及びS102と同様、背景点群データBDを取得するとともに(S201)、異常点群データADを取得する(S202)。また、表示装置100は、2次元表示のための視点を設定する(S203)。視点は予め設定されていてもよいし、ユーザ(監視者)が任意に選択してもよい。 FIG. 10 is a specific example of the operation of the
続いて、表示装置100は、視点から異常点群データADまでの中間領域に含まれる背景点群データBDを抽出する(S204)。点群検出部106は、図7のS116と同様、3次元空間においてS203で設定された視点から異常点群データADまでの中間領域を特定し、特定した中間領域に背景点群データBDがあるか否か(フリースペースか否か)判定し、中間領域に含まれる背景点群データBDを抽出する。例えば、実施の形態1と同様、分析ツールにより得られるフリースペースの情報を用いてもよい。 Subsequently, the
続いて、表示装置100は、抽出された背景点群データBDの2次元表示画面に占める面密度を算出する(S205)。表示設定部107は、異常点群データADの見やすい表示パラメータを決めるため、中間領域で抽出された背景点群データBDの点群密度を求める。例えば、図11に示すように、視点と異常点群データADの間の中間領域における背景点群データBDを(仮想的な)2次元表示画面に投影し、2次元表示画面上に投影された点群の密度(面密度)を求める。なお、3次元空間における中間領域の点群データの3次元密度を求めてもよい。 Subsequently, the
続いて、表示装置100は、算出された面密度に応じて、背景点群データBDまたは異常点群データADの表示設定を決定する(S206)。表示設定部107は、点群表示調整モードにより、異常点群データADが見やすくなるように、算出された面密度に応じて、背景点群データBDまたは異常点群データADの表示パラメータを設定する。点群表示調整モードでは、背景点群データBDと異常点群データADのいずれかの表示パラメータのみの設定を変更してもよいし、両方の設定を変更してもよい。例えば、表示設定部107は、表示パラメータとして、点群データの透明度・サイズ・密度を変更する。透明度・サイズ・密度のいずれかの設定のみを変更してもよいし、任意のいくつかの設定を組み合わせて変更してもよい。また、透明度・サイズ・密度以外の表示パラメータを設定してもよい。 Subsequently, the
背景点群データBDまたは異常点群データADの透明度・サイズ・密度を変更することで、異常点群データADを目立つように表示できる。例えば、中間領域の面密度が高いほど、背景点群データBDの透明度を高くしてもよいし、また、背景点群データBDのサイズを小さくしてもよいし、さらに、背景点群データBDのデータを間引いて密度を低くしてもよい。逆に、中間領域の面密度が高いほど、異常点群データADの透明度を低くしてもよいし、また、異常点群データADのサイズを大きくしてもよいし、さらに、異常点群データADのデータを増やして密度を高くしてもよい。 By changing the transparency, size, and density of the background point group data BD or the abnormal point group data AD, the abnormal point group data AD can be displayed conspicuously. For example, the higher the areal density of the intermediate region, the higher the transparency of the background point cloud data BD, the smaller the size of the background point cloud data BD, and the higher the background point cloud data BD. The data may be thinned out to reduce the density. Conversely, the higher the areal density of the intermediate region, the lower the transparency of the abnormal point cloud data AD, the larger the size of the abnormal point cloud data AD, and the more the abnormal point cloud data The density may be increased by increasing the amount of AD data.
背景点群データBDの表示パラメータを変更する場合、中間領域の背景点群データBDや異常点群データADの周辺(近傍)の所定範囲の背景点群データBDのみの設定を変更してもよいし、背景点群データBDの全体の設定を変更してもよい。背景点群データBDまたは異常点群データADの表示パラメータの設定を徐々に変更させて表示(グラデーション表示)してもよい。異常点群データADに近づくにしたがって、背景点群データBDの表示パラメータを変更してもよい。例えば、異常点群データADに近いほど、背景点群データBDの透明度を高くしてもよいし、また、背景点群データBDのサイズを小さくしてもよいし、さらに、背景点群データBDのデータを間引いて密度を低くしてもよい。位置に応じて表示パラメータを変化させる他に、表示する時間の経過にしたがって、背景点群データBDや異常点群データADの表示パラメータを徐々に変化させてもよい。また、グラデーション表示に限らず、背景点群データBDを明滅表示してもよい。さらに、異常点群データADの重要度に基づいて、背景点群データBDまたは異常点群データADの表示パラメータの設定を変更してもよい。 When changing the display parameters of the background point cloud data BD, the settings may be changed only for the background point cloud data BD in a predetermined range around (near) the background point cloud data BD in the intermediate region or the abnormal point cloud data AD. However, the entire settings of the background point cloud data BD may be changed. The settings of the display parameters of the background point group data BD or the abnormal point group data AD may be gradually changed and displayed (gradation display). The display parameters of the background point group data BD may be changed as the abnormal point group data AD approaches. For example, the closer the background point group data AD is to the abnormal point group data AD, the higher the transparency of the background point group data BD, or the smaller the size of the background point group data BD, or The data may be thinned out to reduce the density. In addition to changing the display parameters according to the position, the display parameters of the background point group data BD and the abnormal point group data AD may be gradually changed as the display time elapses. Furthermore, the display is not limited to gradation, and the background point cloud data BD may be displayed in a blinking manner. Furthermore, the display parameter settings for the background point group data BD or the abnormal point group data AD may be changed based on the importance of the abnormal point group data AD.
続いて、表示装置100は、決定された表示設定にしたがって表示画面W1に2次元表示を行う(S207)。表示部104は、S203で設定された視点とS206で決定された表示設定にしたがって異常点群データAD及び背景点群データBDを表示画面W1に表示する。図12は、点群表示調整モードにより、背景点群データBDの密度を変更して表示する表示例である。図12に示すように、設定変更前は、異常点群データADと視点との間に背景点群データBDがあるため、異常点群データADが見ることができない。これに対し、設定変更後は、上記処理により背景点群データBDのデータを間引いて密度を低くすることにより、異常点群データADをはっきりと視認することができる。 Subsequently, the
以上のように、本実施の形態では、実施の形態1における表示態様の他の例として、点群表示調整モードにより背景点群データまたは異常点群データの透明度・サイズ・密度等の表示パラメータを適切に設定したり、背景点群データを明滅表示したりすることで、異常点群データを確実に視認可能とすることができる。 As described above, in this embodiment, as another example of the display mode in
(実施の形態3)
以下、図面を参照して実施の形態3について説明する。本実施の形態は、実施の形態1に係る表示装置100の他の具体的な動作例として、表示態様を、異常点群データを中心に異常点群データを含む背景点群データを回転して表示するよう設定する(回転表示モードと言う)。表示態様の設定以外については実施の形態1と同様である。(Embodiment 3)
Embodiment 3 will be described below with reference to the drawings. In this embodiment, as another specific operation example of the
本実施の形態に係る表示装置100の表示設定部107は、異常点群データADを視認可能とする表示態様の一例として、回転モードにより、回転表示のための回転中心や回転方向、回転速度等の回転パラメータを設定する。例えば、回転表示している状態で監視者が回転パラメータを指定できるようにしてもよいし、異常点群データADが見やすいように回転速度等を変更してもよい。 The
図13は、本実施の形態に係る表示装置100の具体的な動作例であり、表示態様を回転表示モードに設定する場合の動作(回転速度を変更する動作)を示している。図13に示すように、表示装置100は、図7のS111、S112、S114及びS115と同様、背景点群データBDを取得し(S301)、異常点群データADを取得し(S302)、フリースペースを特定し(S303)、回転中心点を決定する(S304)。 FIG. 13 is a specific example of the operation of the
続いて、表示装置100は、背景点群データBDの全体を表示可能な回転中心点からの距離を決定する(S305)。表示設定部107は、背景点群データBDを回転表示するため、背景点群データBDの全体(異常点群データADを含む所定の範囲)を表示画面W1に表示可能な回転中心点からの距離を決定する。回転中心点からの距離とは、回転表示の際の回転中心点と視点の間の距離である。 Subsequently, the
続いて、表示装置100は、図7のS116と同様、異常点群データADまでの中間領域がフリースペースとなる視点候補を抽出し(S306)、さらに、抽出した視点候補に基づいて、回転表示の各回転角における回転速度を決定する(S307)。表示設定部107は、回転表示の際に、異常点群データADを見やすく表示するため、抽出した視点候補に対応する回転角(視点から回転中心を見た時の3次元空間における点群データの角度)の回転速度が変わるように設定する。例えば、中間領域に背景点群データBDが存在しない回転角では回転速度を遅くするよう設定する。 Next, similar to S116 in FIG. 7, the
続いて、表示装置100は、決定された設定にしたがって表示画面W1に回転表示を行う(S308)。表示部104は、S304で決定された回転中心、S305で決定された距離、S307で決定された回転速度にしたがって、異常点群データAD及び背景点群データBDを表示画面W1に回転表示する。図14は、回転表示モードにより、異常点群データADを中心として回転表示する表示例である。図14に示すように、回転角A~Cのように異常点群データAD及び背景点群データBDを繰り返し回転して表示する。なお、回転方向は例えば水平方向であるが、その他の任意の方向を設定してもよい。回転角Aでは、異常点群データADと視点との間に背景点群データBDがあるため、異常点群データADを見ることができない。一方、異常点群データADを中心に背景点群データBDを回転させることで、回転角Bや回転角Cでは視点の角度が変わり、回転角Aよりも異常点群データADが見やすくなる。例えば、回転角Bは、異常点群データADと視点との間の中間に背景点群データBDがないため、異常点群データADを視認することができ、さらに、回転角Bにおいて回転速度を遅くすることで、異常点群データADをはっきりと把握することができる。 Subsequently, the
以上のように、本実施の形態では、実施の形態1における表示態様の他の例として、回転表示モードにより異常点群データを中心に背景点群データを回転表示することで、視点が変わり続けるため異常点群データを視認可能とすることができ、さらに、回転速度等の回転パラメータを適切に設定することで、異常点群データを確実に視認可能とすることができる。 As described above, in this embodiment, as another example of the display mode in
(実施の形態4)
以下、図面を参照して実施の形態4について説明する。本実施の形態は、実施の形態1~3で説明した表示態様をユーザ(監視者)により選択可能とする例である。なお、実施の形態1~3の全ての表示態様を含んでもよいし、実施の形態1~3から任意に選択された複数の表示態様を含んでもよい。(Embodiment 4)
Embodiment 4 will be described below with reference to the drawings. This embodiment is an example in which the display modes described in
図15は、本実施の形態に係る表示装置100の具体的な動作例であり、実施の形態1~3の視点切替モード、点群表示調整モード、回転表示モードを選択する動作である。図15に示すように、表示装置100は、図5のS101及びS102と同様、背景点群データBDを取得するとともに(S401)、異常点群データADを取得する(S402)。 FIG. 15 shows a specific example of the operation of the
続いて、表示装置100は、各異常点群データADに対して表示設定を決定する(S403)。表示設定部107は、複数の異常点群データADを取得した場合、それぞれの異常点群データADについて、実施の形態1~3の処理を行い、表示設定を決定する。すなわち、図7のS113~S117により視点切替モードの表示設定を決定し、図10のS204~S206により点群表示調整モードの表示設定を決定し、図13のS303~S307により回転表示モードの表示設定を決定する。 Subsequently, the
続いて、表示装置100は、表示画面W1に重要度を付随した情報を表示する(S404)。表示部104は、デフォルトの表示設定、あるいは、S403で決定されたいずれかの表示設定にしたがい異常点群データAD及び背景点群データBDを表示画面W1に表示し、さらに、吹き出し表示等により、異常点群データADの重要度等を異常点群データADに関連付けて表示する。 Subsequently, the
続いて、ユーザが操作すると(S405)、表示装置100は、ユーザの操作に応じて各異常点群データに対する表示設定を選択する(S406)。S404で表示した画面に対して、ユーザが入力操作を行うことで、ユーザが表示したい異常点群データADを選択し、さらに視点切替モード、点群表示調整モード、回転表示モードの中から表示態様を選択する。そうすると、表示設定部107は、選択された異常点群データADと表示態様にしたがい、S403で決定した表示設定から異常点群データADが見やすい表示態様の設定を選択する。 Subsequently, when the user operates (S405), the
続いて、表示装置100は、選択された表示設定にしたがって表示画面W1に2次元表示を行う(S407)。表示部104は、ユーザにより選択された異常点群データADを実施の形態1~3のいずれかの表示態様にしたがって異常点群データAD及び背景点群データBDを表示画面W1に表示する。図16は、ユーザが表示態様を選択して表示する表示例である。図16に示すように、ユーザ操作前、異常点群データADを含む背景点群データBDを表示し、その異常点群データADに識別情報(重要度でもよい)を関連付けて表示する。この例では、GUIの一例として、2つの異常点群データAD(ALERT♯1、ALERT#2)に吹き出しを表示する。ユーザがこの吹き出しにクリックなどの所定の操作を行うと、さらに、実施の形態1~3の表示態様の視点切替モード、点群表示調整モード、回転表示モードが選択可能となり、ユーザはその中から所望の表示態様を選択する。例えば、ユーザが「ALERT♯1」をクリックし、さらに視点切替モードを選択すると、実施の形態1と同様、「ALERT♯1」の異常点群データADを見やすいように視点を変更し異常点群データAD及び背景点群データBDを表示する。なお、吹き出し表示に限らず、識別情報(重要度)を関連付けた異常点群データADの一覧を、表示画面とは別欄に表示しても良い。 Subsequently, the
以上のように、本実施の形態では、実施の形態1~3における異常点群データを視認可能とする表示態様をユーザが選択可能とした。これにより、ユーザが実際に表示を確認しながら、異常点群データを見やすい表示態様を選択できるため、さらに、異常点群データの視認性を向上することができる。 As described above, in this embodiment, the user can select the display mode that makes the abnormal point cloud data visible in
なお、上述の実施形態における各構成は、ハードウェア又はソフトウェア、もしくはその両方によって構成され、1つのハードウェア又はソフトウェアから構成してもよいし、複数のハードウェア又はソフトウェアから構成してもよい。各装置及び各機能(処理)を、図17に示すような、CPU(Central Processing Unit)等のプロセッサ21及び記憶装置であるメモリ22を有するコンピュータ20により実現してもよい。例えば、メモリ22に実施形態における方法を行うためのプログラムを格納し、各機能を、メモリ22に格納されたプログラムをプロセッサ21で実行することにより実現してもよい。 Note that each configuration in the above-described embodiments is configured by hardware, software, or both, and may be configured from one piece of hardware or software, or may be configured from a plurality of pieces of hardware or software. Each device and each function (processing) may be realized by a
これらのプログラムは、様々なタイプの非一時的なコンピュータ可読媒体(non-transitory computer readable medium)を用いて格納され、コンピュータに供給することができる。非一時的なコンピュータ可読媒体は、様々なタイプの実体のある記録媒体(tangible storage medium)を含む。非一時的なコンピュータ可読媒体の例は、磁気記録媒体(例えばフレキシブルディスク、磁気テープ、ハードディスクドライブ)、光磁気記録媒体(例えば光磁気ディスク)、CD-ROM(Read Only Memory)、CD-R、CD-R/W、半導体メモリ(例えば、マスクROM、PROM(Programmable ROM)、EPROM(Erasable PROM)、フラッシュROM、RAM(random access memory))を含む。また、プログラムは、様々なタイプの一時的なコンピュータ可読媒体(transitory computer readable medium)によってコンピュータに供給されてもよい。一時的なコンピュータ可読媒体の例は、電気信号、光信号、及び電磁波を含む。一時的なコンピュータ可読媒体は、電線及び光ファイバ等の有線通信路、又は無線通信路を介して、プログラムをコンピュータに供給できる。 These programs can be stored and provided to a computer using various types of non-transitory computer readable media. Non-transitory computer-readable media includes various types of tangible storage media. Examples of non-transitory computer-readable media include magnetic recording media (e.g., flexible disks, magnetic tapes, hard disk drives), magneto-optical recording media (e.g., magneto-optical disks), CD-ROMs (Read Only Memory), CD-Rs, CD-R/W, semiconductor memory (for example, mask ROM, PROM (Programmable ROM), EPROM (Erasable PROM), flash ROM, RAM (random access memory)). The program may also be provided to the computer on various types of transitory computer readable media. Examples of transitory computer-readable media include electrical signals, optical signals, and electromagnetic waves. The temporary computer-readable medium can provide the program to the computer via wired communication channels, such as electrical wires and fiber optics, or wireless communication channels.
また、本開示は上記実施の形態に限られたものではなく、趣旨を逸脱しない範囲で適宜変更することが可能である。例えば、上記実施の形態を適宜組み合わせてもよい。実施の形態1の視点切替モードと実施の形態2の点群表示調整モードを組み合わせて、視点を異常点群データが見える位置に設定しつつ、さらに、背景点群データまたは異常点群データの表示パラメータを変更して、異常点群データが目立つように表示してもよい。実施の形態2の点群表示調整モードと実施の形態3の回転表示モードを組み合わせて、背景点群データまたは異常点群データの表示パラメータを変更して、異常点群データが目立つように表示した状態で、背景点群データ及び異常点群データを回転表示してもよい。 Furthermore, the present disclosure is not limited to the above embodiments, and can be modified as appropriate without departing from the spirit. For example, the above embodiments may be combined as appropriate. By combining the viewpoint switching mode of
以上、実施の形態を参照して本開示を説明したが、本開示は上記実施の形態に限定されるものではない。本開示の構成や詳細には、本開示のスコープ内で当業者が理解し得る様々な変更をすることができる。 Although the present disclosure has been described above with reference to the embodiments, the present disclosure is not limited to the above embodiments. Various changes can be made to the structure and details of the present disclosure that can be understood by those skilled in the art within the scope of the present disclosure.
上記の実施形態の一部又は全部は、以下の付記のようにも記載されうるが、以下には限られない。
(付記1)
3次元光センサにより測定された測定点群データを含む3次元空間において、前記測定点群データを2次元表示するための視点から前記測定点群データ内の対象点群データまでの中間領域の中間点群データを検出する検出手段と、
前記検出された中間点群データに基づいて、前記視点から前記対象点群データが視認可能となるように、前記測定点群データまたは前記対象点群データの表示態様を設定する設定手段と、
前記設定した表示態様にしたがって、前記測定点群データ及び前記対象点群データを2次元表示する表示手段と、
を備える、表示装置。
(付記2)
前記対象点群データが複数ある場合、いずれかの対象点群データを選択する選択手段をさらに備え、
前記検出手段は、前記選択された対象点群データに基づいて、前記中間点群データを検出する、
付記1に記載の表示装置。
(付記3)
前記選択手段は、前記対象点群データを表示すべき優先順位にしたがって、前記対象点群データを選択する、
付記2に記載の表示装置。
(付記4)
前記対象点群データは、前記測定点群データの異常部分のデータであり、
前記選択手段は、前記対象点群データの異常レベルにしたがって、前記対象点群データを選択する、
付記2に記載の表示装置。
(付記5)
前記対象点群データの異常レベルは、3次元空間における前記対象点群データの体積に基づいている、
付記4に記載の表示装置。
(付記6)
前記対象点群データは、異常解析装置が前記測定点群データの異常を解析した結果を示すデータであり、
前記選択手段は、前記異常解析装置が付与した解析結果の信頼度にしたがって、前記対象点群データを選択する、
付記2に記載の表示装置。
(付記7)
前記選択手段は、入力されるユーザ操作に応じて、前記対象点群データを選択する、
付記2に記載の表示装置。
(付記8)
前記設定手段は、前記表示態様として、前記中間領域に前記中間点群データが存在しないように、前記視点の位置を設定する、
付記1乃至7のいずれかに記載の表示装置。
(付記9)
前記設定手段は、前記3次元光センサの測定位置に基づいて、前記視点の位置を設定する、
付記8に記載の表示装置。
(付記10)
前記設定手段は、3次元空間において前記測定点群データを回転させる回転中心点の位置を前記対象点群データの位置とし、前記視点の位置を設定する、
付記8または9に記載の表示装置。
(付記11)
前記設定手段は、前記視点から見て前記対象点群データを含む所定の範囲を表示領域に設定する、
付記8乃至10のいずれかに記載の表示装置。
(付記12)
前記設定手段は、前記測定点群データの全体を含む範囲を前記表示領域に設定する、
付記11に記載の表示装置。
(付記13)
前記設定手段は、前記表示態様として、前記測定点群データまたは前記対象点群データの表示パラメータを設定する、
付記1乃至7のいずれかに記載の表示装置。
(付記14)
前記設定手段は、前記検出された中間点群データの密度に応じて、前記測定点群データまたは前記対象点群データの表示パラメータを設定する、
付記13に記載の表示装置。
(付記15)
前記表示パラメータは、前記測定点群データまたは前記対象点群データの透明度、サイズ、または密度を含む、
付記13または14に記載の表示装置。
(付記16)
前記設定手段は、前記対象点群データの近傍における前記測定点群データの表示パラメータを設定する、
付記13乃至15のいずれかに記載の表示装置。
(付記17)
前記設定手段は、前記対象点群データに近づくにしたがって前記測定点群データの表示パラメータを変化させる、
付記13乃至15のいずれかに記載の表示装置。
(付記18)
前記設定手段は、表示する時間の経過にしたがって、前記測定点群データまたは前記対象点群データの表示パラメータを変化させる、
付記13乃至15のいずれかに記載の表示装置。
(付記19)
前記設定手段は、前記表示態様として、前記測定点群データを明滅表示するよう設定する、
付記1乃至7のいずれか一項に記載の表示装置。
(付記20)
前記設定手段は、前記表示態様として、前記対象点群データの位置を中心として前記測定点群データ及び前記対象点群データを回転表示するよう設定する、
付記1乃至7のいずれか一項に記載の表示装置。
(付記21)
前記設定手段は、前記回転表示において、前記中間領域に前記中間点群データが存在しない回転角の場合、回転速度を遅くするよう設定する、
付記20に記載の表示装置。
(付記22)
前記設定手段は、入力されるユーザ操作に応じて、前記表示態様を設定する、
付記1乃至21のいずれか一項に記載の表示装置。
(付記23)
3次元光センサにより測定された測定点群データを含む3次元空間において、前記測定点群データを2次元表示するための視点から前記測定点群データ内の対象点群データまでの中間領域の中間点群データを検出し、
前記検出された中間点群データに基づいて、前記視点から前記対象点群データが視認可能となるように、前記測定点群データまたは前記対象点群データの表示態様を設定し、
前記設定した表示態様にしたがって、前記測定点群データ及び前記対象点群データを2次元表示する、
表示方法。
(付記24)
前記対象点群データが複数ある場合、いずれかの対象点群データを選択し、
前記検出では、前記選択された対象点群データに基づいて、前記中間点群データを検出する、
付記23に記載の表示方法。
(付記25)
3次元光センサにより測定された測定点群データを含む3次元空間において、前記測定点群データを2次元表示するための視点から前記測定点群データ内の対象点群データまでの中間領域の中間点群データを検出し、
前記検出された中間点群データに基づいて、前記視点から前記対象点群データが視認可能となるように、前記測定点群データまたは前記対象点群データの表示態様を設定し、
前記設定した表示態様にしたがって、前記測定点群データ及び前記対象点群データを2次元表示する、
処理をコンピュータに実行させるための表示プログラム。
(付記26)
前記対象点群データが複数ある場合、いずれかの対象点群データを選択し、
前記検出では、前記選択された対象点群データに基づいて、前記中間点群データを検出する、
付記25に記載の表示プログラム。Part or all of the above embodiments may be described as in the following additional notes, but are not limited to the following.
(Additional note 1)
In a three-dimensional space including measurement point cloud data measured by a three-dimensional optical sensor, an intermediate region between a viewpoint for two-dimensionally displaying the measurement point cloud data and target point cloud data in the measurement point cloud data. detection means for detecting point cloud data;
Setting means for setting a display mode of the measurement point group data or the target point group data so that the target point group data is visible from the viewpoint based on the detected intermediate point group data;
Display means for two-dimensionally displaying the measurement point group data and the target point group data according to the set display mode;
A display device comprising:
(Additional note 2)
If there is a plurality of target point cloud data, further comprising a selection means for selecting one of the target point cloud data,
The detection means detects the intermediate point group data based on the selected target point group data.
The display device according to
(Additional note 3)
The selection means selects the target point cloud data according to a priority order in which the target point cloud data should be displayed.
The display device according to
(Additional note 4)
The target point group data is data of an abnormal part of the measured point group data,
The selection means selects the target point cloud data according to an abnormality level of the target point cloud data.
The display device according to
(Appendix 5)
The abnormality level of the target point group data is based on the volume of the target point group data in three-dimensional space.
The display device according to appendix 4.
(Appendix 6)
The target point cloud data is data indicating a result of an abnormality analysis of the measured point cloud data by an abnormality analysis device,
The selection means selects the target point cloud data according to the reliability of the analysis result given by the abnormality analysis device.
The display device according to
(Appendix 7)
The selection means selects the target point cloud data according to an input user operation.
The display device according to
(Appendix 8)
The setting means sets the position of the viewpoint so that the intermediate point group data does not exist in the intermediate area as the display mode.
The display device according to any one of
(Appendix 9)
The setting means sets the position of the viewpoint based on the measurement position of the three-dimensional optical sensor.
The display device according to appendix 8.
(Appendix 10)
The setting means sets the position of the rotation center point for rotating the measurement point group data in a three-dimensional space as the position of the target point group data, and sets the position of the viewpoint.
The display device according to appendix 8 or 9.
(Appendix 11)
The setting means sets a predetermined range including the target point cloud data as a display area when viewed from the viewpoint.
The display device according to any one of Supplementary Notes 8 to 10.
(Appendix 12)
The setting means sets a range including the entire measurement point group data in the display area.
The display device according to
(Appendix 13)
The setting means sets display parameters of the measurement point group data or the target point group data as the display mode;
The display device according to any one of
(Appendix 14)
The setting means sets display parameters of the measurement point group data or the target point group data according to the density of the detected intermediate point group data.
The display device according to
(Appendix 15)
The display parameters include transparency, size, or density of the measurement point cloud data or the target point cloud data,
The display device according to
(Appendix 16)
The setting means sets display parameters of the measurement point group data in the vicinity of the target point group data,
The display device according to any one of
(Appendix 17)
The setting means changes display parameters of the measurement point group data as it approaches the target point group data.
The display device according to any one of
(Appendix 18)
The setting means changes display parameters of the measurement point group data or the target point group data as display time elapses;
The display device according to any one of
(Appendix 19)
The setting means sets the measurement point group data to be displayed in a blinking manner as the display mode.
The display device according to any one of
(Additional note 20)
The setting means sets the display mode to rotate and display the measurement point group data and the target point group data around the position of the target point group data.
The display device according to any one of
(Additional note 21)
The setting means sets the rotation speed to be slow in the rotation display when the rotation angle is such that the intermediate point group data does not exist in the intermediate area.
The display device according to
(Additional note 22)
The setting means sets the display mode according to an input user operation,
The display device according to any one of
(Additional note 23)
In a three-dimensional space including measurement point cloud data measured by a three-dimensional optical sensor, an intermediate region between a viewpoint for two-dimensionally displaying the measurement point cloud data and target point cloud data in the measurement point cloud data. Detect point cloud data,
Based on the detected intermediate point group data, setting a display mode of the measurement point group data or the target point group data so that the target point group data is visible from the viewpoint;
displaying the measurement point group data and the target point group data in two dimensions according to the set display mode;
Display method.
(Additional note 24)
If there is multiple target point cloud data, select one of the target point cloud data,
In the detection, the intermediate point cloud data is detected based on the selected target point cloud data.
Display method described in Appendix 23.
(Additional note 25)
In a three-dimensional space including measurement point cloud data measured by a three-dimensional optical sensor, an intermediate region between a viewpoint for two-dimensionally displaying the measurement point cloud data and target point cloud data in the measurement point cloud data. Detect point cloud data,
Based on the detected intermediate point group data, setting a display mode of the measurement point group data or the target point group data so that the target point group data is visible from the viewpoint;
displaying the measurement point group data and the target point group data in two dimensions according to the set display mode;
A display program that allows a computer to perform processing.
(Additional note 26)
If there is multiple target point cloud data, select one of the target point cloud data,
In the detection, the intermediate point cloud data is detected based on the selected target point cloud data.
The display program described in Appendix 25.
1 監視システム
10 表示装置
11 検出部
12 設定部
13 表示部
20 コンピュータ
21 プロセッサ
22 メモリ
100 表示装置
101 入力部
102 取得部
103 記憶部
104 表示部
105 重要度設定部
106 点群検出部
107 表示設定部
200、200a、200b 3次元光センサ
300 異常解析装置
AD 異常点群データ
BD 背景点群データ
PD1、PD2 測定点群データ
W1 表示画面1 Monitoring
Claims (10)
Translated fromJapanese前記検出された中間点群データに基づいて、前記視点から前記対象点群データが視認可能となるように、前記測定点群データまたは前記対象点群データの表示態様を設定する設定手段と、
前記設定した表示態様にしたがって、前記測定点群データ及び前記対象点群データを2次元表示する表示手段と、
を備える、表示装置。In a three-dimensional space including measurement point cloud data measured by a three-dimensional optical sensor, an intermediate region between a viewpoint for two-dimensionally displaying the measurement point cloud data and target point cloud data in the measurement point cloud data. detection means for detecting point cloud data;
Setting means for setting a display mode of the measurement point group data or the target point group data so that the target point group data is visible from the viewpoint based on the detected intermediate point group data;
Display means for two-dimensionally displaying the measurement point group data and the target point group data according to the set display mode;
A display device comprising:
前記検出手段は、前記選択された対象点群データに基づいて、前記中間点群データを検出する、
請求項1に記載の表示装置。If there is a plurality of target point cloud data, further comprising a selection means for selecting one of the target point cloud data,
The detection means detects the intermediate point group data based on the selected target point group data.
The display device according to claim 1.
請求項2に記載の表示装置。The selection means selects the target point cloud data according to a priority order in which the target point cloud data should be displayed.
The display device according to claim 2.
前記選択手段は、前記対象点群データの異常レベルにしたがって、前記対象点群データを選択する、
請求項2に記載の表示装置。The target point group data is data of an abnormal part of the measured point group data,
The selection means selects the target point cloud data according to an abnormality level of the target point cloud data.
The display device according to claim 2.
請求項4に記載の表示装置。The abnormality level of the target point group data is based on the volume of the target point group data in the three-dimensional space.
The display device according to claim 4.
前記選択手段は、前記異常解析装置が付与した解析結果の信頼度にしたがって、前記対象点群データを選択する、
請求項2に記載の表示装置。The target point cloud data is data indicating a result of an abnormality analysis of the measured point cloud data by an abnormality analysis device,
The selection means selects the target point cloud data according to the reliability of the analysis result given by the abnormality analysis device.
The display device according to claim 2.
請求項2に記載の表示装置。The selection means selects the target point cloud data according to an input user operation.
The display device according to claim 2.
請求項1乃至7のいずれか一項に記載の表示装置。The setting means sets the position of the viewpoint so that the intermediate point group data does not exist in the intermediate area as the display mode.
A display device according to any one of claims 1 to 7.
前記検出された中間点群データに基づいて、前記視点から前記対象点群データが視認可能となるように、前記測定点群データまたは前記対象点群データの表示態様を設定し、
前記設定した表示態様にしたがって、前記測定点群データ及び前記対象点群データを2次元表示する、
表示方法。In a three-dimensional space including measurement point cloud data measured by a three-dimensional optical sensor, an intermediate region between a viewpoint for two-dimensionally displaying the measurement point cloud data and target point cloud data in the measurement point cloud data. Detect point cloud data,
Based on the detected intermediate point group data, setting a display mode of the measurement point group data or the target point group data so that the target point group data is visible from the viewpoint;
displaying the measurement point group data and the target point group data in two dimensions according to the set display mode;
Display method.
前記検出された中間点群データに基づいて、前記視点から前記対象点群データが視認可能となるように、前記測定点群データまたは前記対象点群データの表示態様を設定し、
前記設定した表示態様にしたがって、前記測定点群データ及び前記対象点群データを2次元表示する、
処理をコンピュータに実行させるための表示プログラム。In a three-dimensional space including measurement point cloud data measured by a three-dimensional optical sensor, an intermediate region between a viewpoint for two-dimensionally displaying the measurement point cloud data and target point cloud data in the measurement point cloud data. Detect point cloud data,
Based on the detected intermediate point group data, setting a display mode of the measurement point group data or the target point group data so that the target point group data is visible from the viewpoint;
displaying the measurement point group data and the target point group data in two dimensions according to the set display mode;
A displayprogram that allows a computer to perform processing.
Applications Claiming Priority (1)
| Application Number | Priority Date | Filing Date | Title |
|---|---|---|---|
| PCT/JP2020/010334WO2021181525A1 (en) | 2020-03-10 | 2020-03-10 | Display device, display method, and non-transitory computer-readable medium having program stored therein |
Publications (3)
| Publication Number | Publication Date |
|---|---|
| JPWO2021181525A1 JPWO2021181525A1 (en) | 2021-09-16 |
| JPWO2021181525A5 JPWO2021181525A5 (en) | 2022-11-01 |
| JP7388540B2true JP7388540B2 (en) | 2023-11-29 |
Family
ID=77671273
Family Applications (1)
| Application Number | Title | Priority Date | Filing Date |
|---|---|---|---|
| JP2022507050AActiveJP7388540B2 (en) | 2020-03-10 | 2020-03-10 | Display device, display method and display program |
Country Status (3)
| Country | Link |
|---|---|
| US (1) | US12175593B2 (en) |
| JP (1) | JP7388540B2 (en) |
| WO (1) | WO2021181525A1 (en) |
Families Citing this family (2)
| Publication number | Priority date | Publication date | Assignee | Title |
|---|---|---|---|---|
| WO2023219155A1 (en)* | 2022-05-12 | 2023-11-16 | ソニーセミコンダクタソリューションズ株式会社 | Information processing apparatus, data structure, and program |
| JP2025083017A (en)* | 2023-11-20 | 2025-05-30 | 日本電気株式会社 | Inspection support system, inspection support device, inspection support method, and program |
Citations (4)
| Publication number | Priority date | Publication date | Assignee | Title |
|---|---|---|---|---|
| JP2008009895A (en) | 2006-06-30 | 2008-01-17 | Toyota Infotechnology Center Co Ltd | Image generating apparatus and image generating method |
| US20110072397A1 (en) | 2009-09-22 | 2011-03-24 | Scott Baker | Image Data and Annotation Processing System |
| JP2019053721A (en) | 2017-07-12 | 2019-04-04 | ゼネラル・エレクトリック・カンパニイ | Graphic overlay for measuring dimensions of features using video inspection device |
| JP2019145072A (en) | 2018-02-23 | 2019-08-29 | 株式会社Lixil | Supporting device |
Family Cites Families (4)
| Publication number | Priority date | Publication date | Assignee | Title |
|---|---|---|---|---|
| AU2003277240A1 (en) | 2002-10-15 | 2004-06-07 | University Of Southern California | Augmented virtual environments |
| JP2005268847A (en) | 2004-03-16 | 2005-09-29 | Olympus Corp | Image generating apparatus, image generating method, and image generating program |
| US9013469B2 (en) | 2011-03-04 | 2015-04-21 | General Electric Company | Method and device for displaying a three-dimensional view of the surface of a viewed object |
| US10882185B2 (en)* | 2017-02-07 | 2021-01-05 | Veo Robotics, Inc. | Dynamically determining workspace safe zones with speed and separation monitoring |
- 2020
- 2020-03-10JPJP2022507050Apatent/JP7388540B2/enactiveActive
- 2020-03-10USUS17/801,325patent/US12175593B2/enactiveActive
- 2020-03-10WOPCT/JP2020/010334patent/WO2021181525A1/ennot_activeCeased
Patent Citations (4)
| Publication number | Priority date | Publication date | Assignee | Title |
|---|---|---|---|---|
| JP2008009895A (en) | 2006-06-30 | 2008-01-17 | Toyota Infotechnology Center Co Ltd | Image generating apparatus and image generating method |
| US20110072397A1 (en) | 2009-09-22 | 2011-03-24 | Scott Baker | Image Data and Annotation Processing System |
| JP2019053721A (en) | 2017-07-12 | 2019-04-04 | ゼネラル・エレクトリック・カンパニイ | Graphic overlay for measuring dimensions of features using video inspection device |
| JP2019145072A (en) | 2018-02-23 | 2019-08-29 | 株式会社Lixil | Supporting device |
Also Published As
| Publication number | Publication date |
|---|---|
| US12175593B2 (en) | 2024-12-24 |
| JPWO2021181525A1 (en) | 2021-09-16 |
| US20230080011A1 (en) | 2023-03-16 |
| WO2021181525A1 (en) | 2021-09-16 |
Similar Documents
| Publication | Publication Date | Title |
|---|---|---|
| US10088344B2 (en) | Underlying wall structure finder and infrared camera | |
| EP3039655B1 (en) | System and method for determining the extent of a plane in an augmented reality environment | |
| JP7388540B2 (en) | Display device, display method and display program | |
| CN106463032A (en) | Intrusion detection with directional sensing | |
| JP7286881B2 (en) | Scanner for distinguishing objects detected behind opaque surfaces | |
| JP7188798B2 (en) | Coordinate calculation device, coordinate calculation method, and program | |
| US10186005B2 (en) | Facility utilization measurement apparatus, facility utilization measurement system, and facility utilization measurement method | |
| US20170109932A1 (en) | Content projection apparatus, content projection method, and computer readable storage medium | |
| US10565786B1 (en) | Sensor placement interface | |
| JP2016220145A (en) | Image analysis apparatus, image analysis method, and program | |
| JP6475025B2 (en) | Shape error determination device, determination result image generation device, and shape error determination method | |
| TWI671543B (en) | Heavy rain forecasting method, heavy rain forecasting device, system suitable for rain forecasting device, and rain forecasting program | |
| US11630208B2 (en) | Measurement system, measurement method, and measurement program | |
| Martín et al. | Deterioration of depth measurements due to interference of multiple RGB-D sensors | |
| EP3598175B1 (en) | Object detection system | |
| JP2020017102A (en) | Fire monitoring apparatus and fire monitoring system | |
| EP3407086A1 (en) | Mobile object measurement system and method of determining number of people in measurement area | |
| JP2019168224A (en) | Gas detection system | |
| JP6932971B2 (en) | Motion tracking methods, motion tracking programs, and motion tracking systems | |
| US10331276B2 (en) | Projected interactive display surface interactivity determination | |
| JP7537502B2 (en) | Monitoring system, method, and program | |
| EP3210055A1 (en) | Underlying wall structure finder and infrared camera | |
| JP7372611B1 (en) | Structure observation device, model construction method, and model construction program | |
| JP2020128908A (en) | Gas leak position specification system and gas leak position specification program | |
| US20220364909A1 (en) | Optical fiber sensing system and monitoring method |
Legal Events
| Date | Code | Title | Description |
|---|---|---|---|
| A521 | Request for written amendment filed | Free format text:JAPANESE INTERMEDIATE CODE: A523 Effective date:20220812 | |
| A621 | Written request for application examination | Free format text:JAPANESE INTERMEDIATE CODE: A621 Effective date:20220812 | |
| TRDD | Decision of grant or rejection written | ||
| A01 | Written decision to grant a patent or to grant a registration (utility model) | Free format text:JAPANESE INTERMEDIATE CODE: A01 Effective date:20231017 | |
| A61 | First payment of annual fees (during grant procedure) | Free format text:JAPANESE INTERMEDIATE CODE: A61 Effective date:20231030 | |
| R151 | Written notification of patent or utility model registration | Ref document number:7388540 Country of ref document:JP Free format text:JAPANESE INTERMEDIATE CODE: R151 |